
Pressure-Induced Neutral to Ionic Phase Transition in TTF-Fluoranil, DimethylTTF-Fluoranil and DimethylTTF-Chloranil: A Comparative THz Raman Study

Abstract
:1. Introduction
2. Materials and Methods
2.1. Crystal Growth
2.2. Spectroscopic Measurements
2.3. Single-Crystal X-ray Diffraction
3. Results
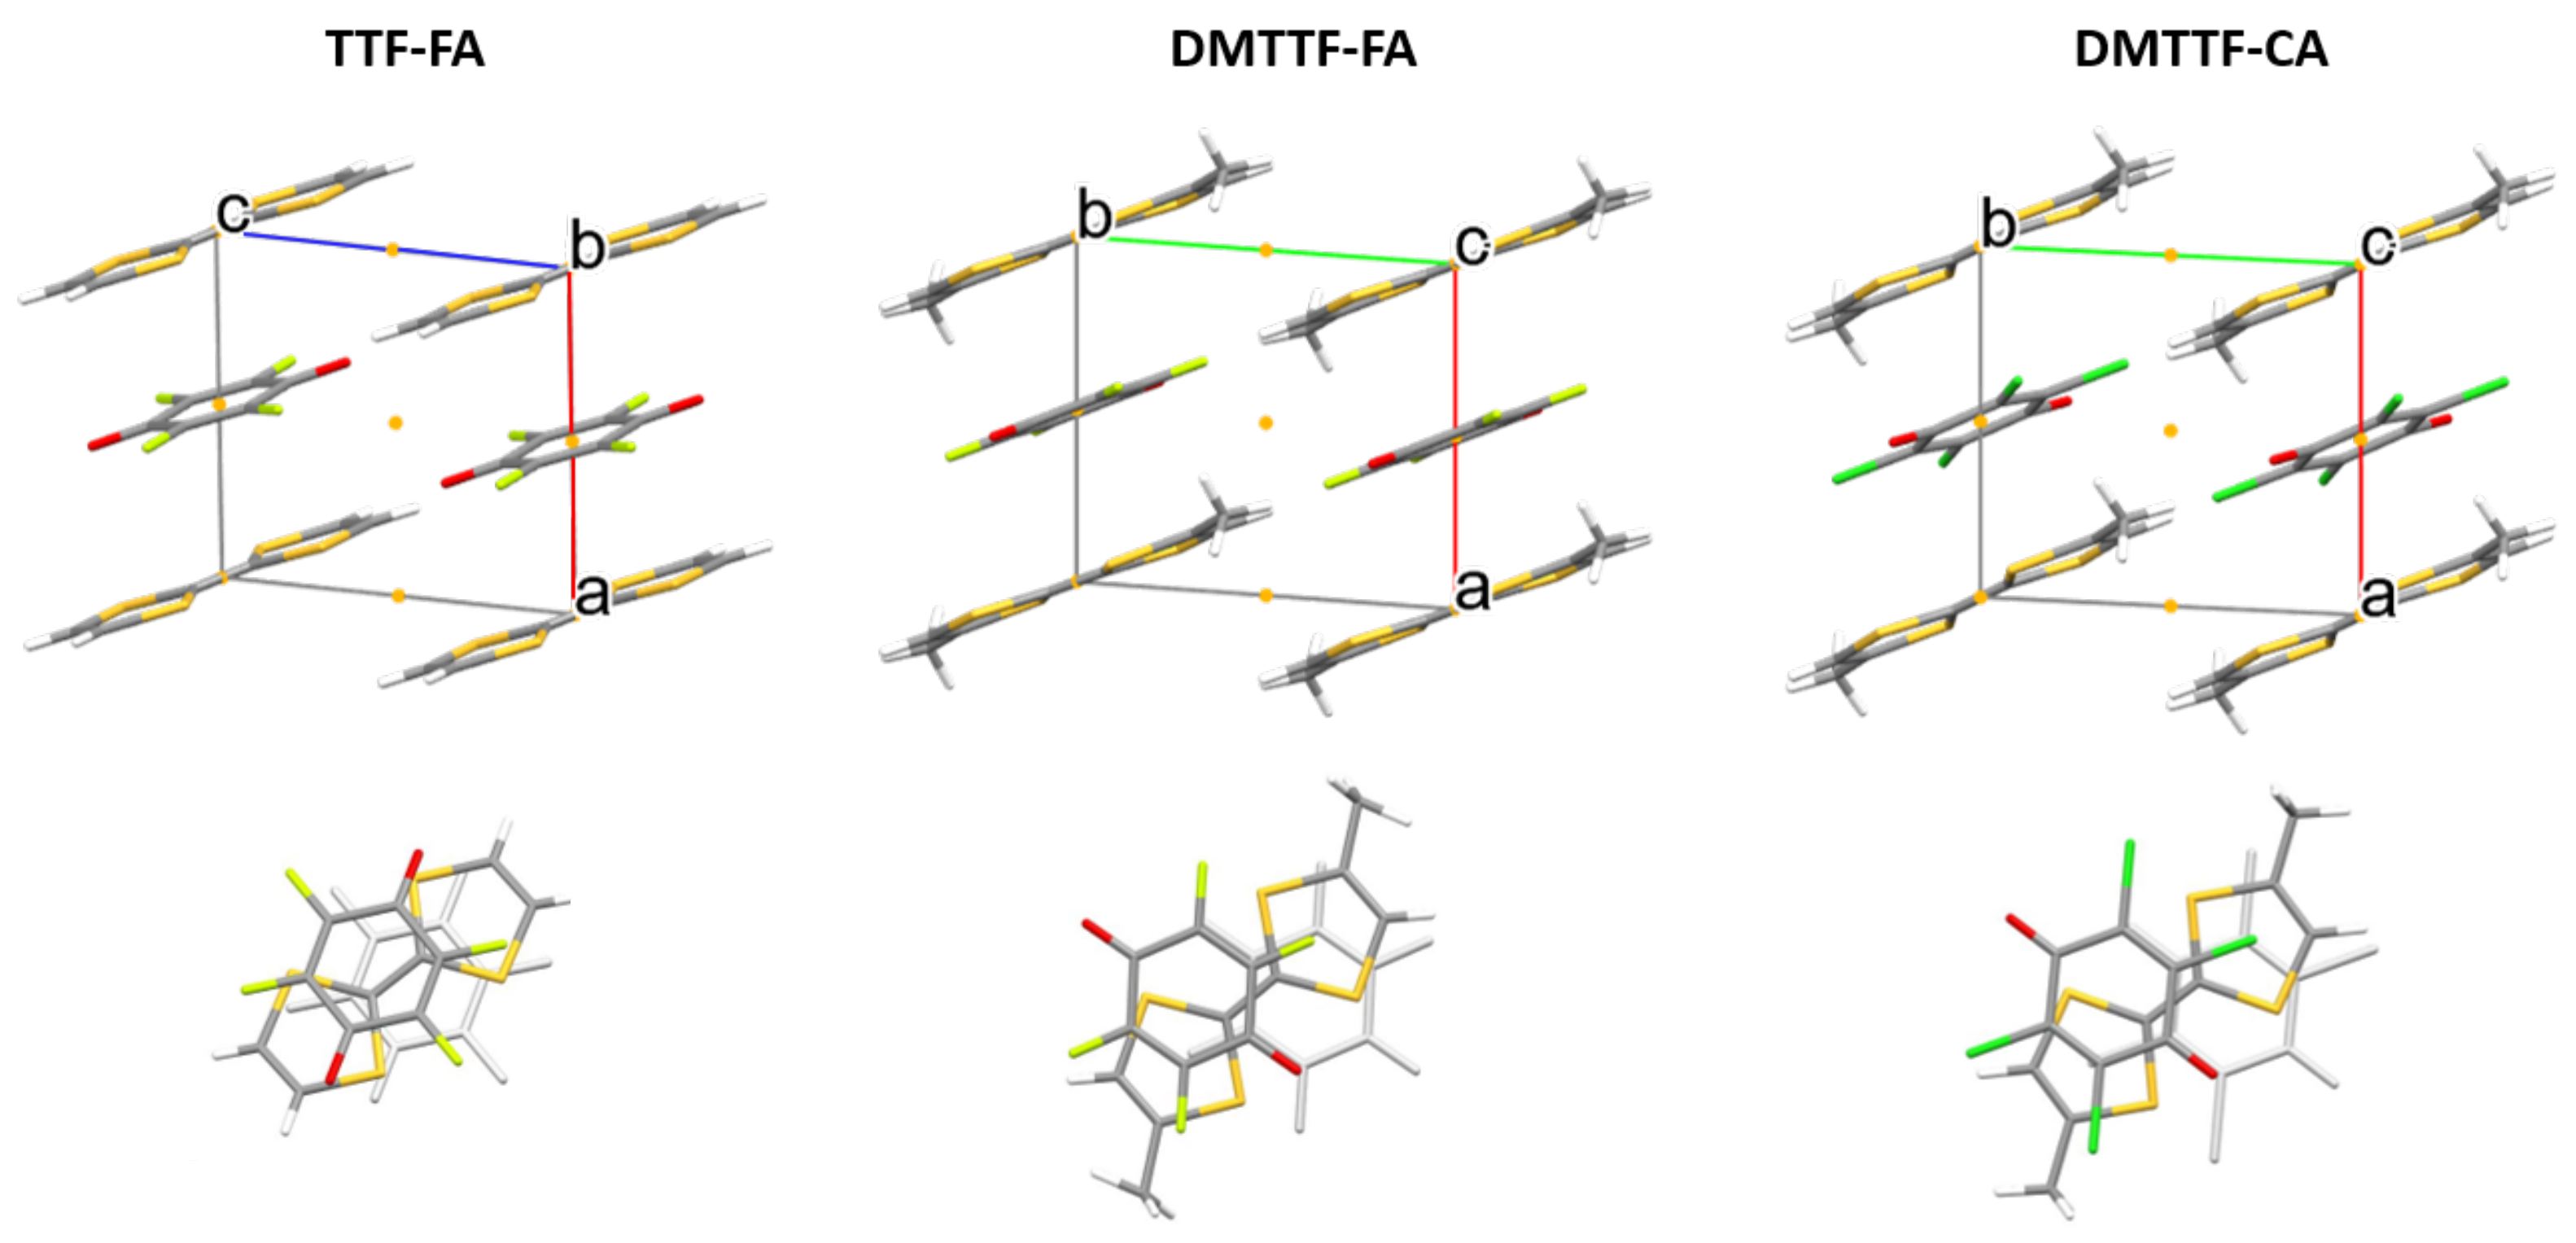
3.1. Structure Comparison
3.2. Pressure-Induced Transition
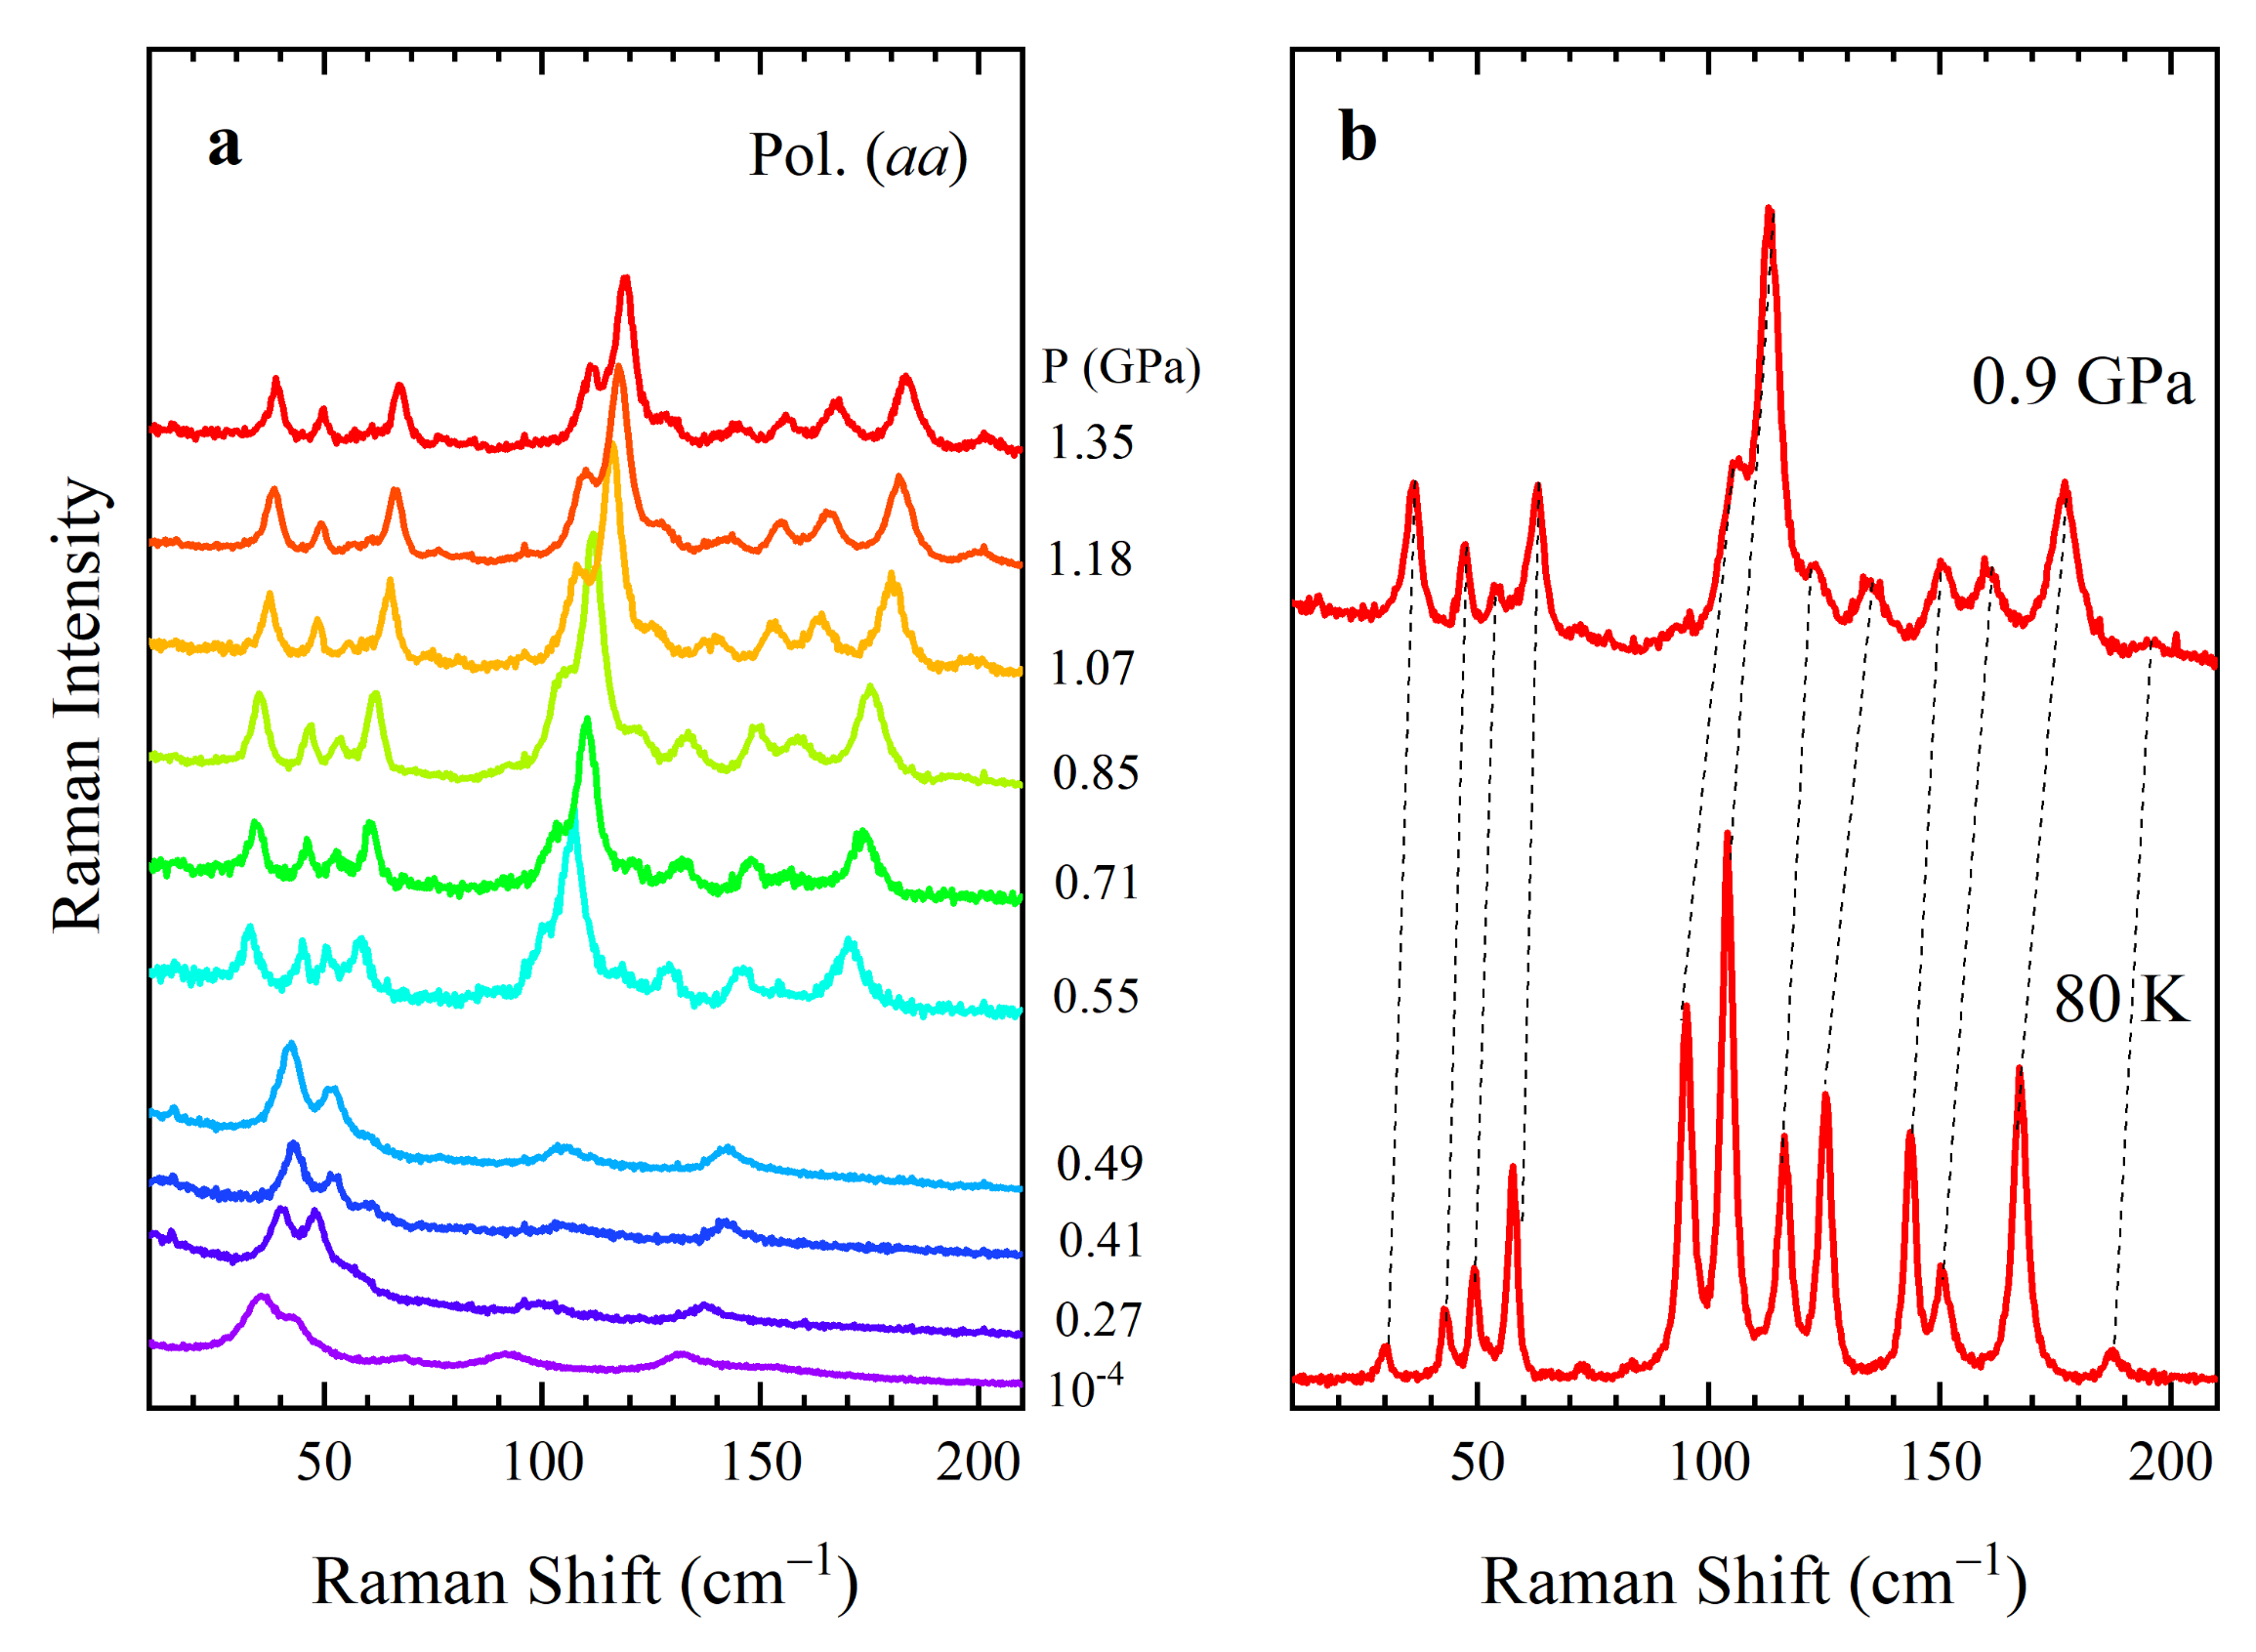
3.2.1. TTF-FA
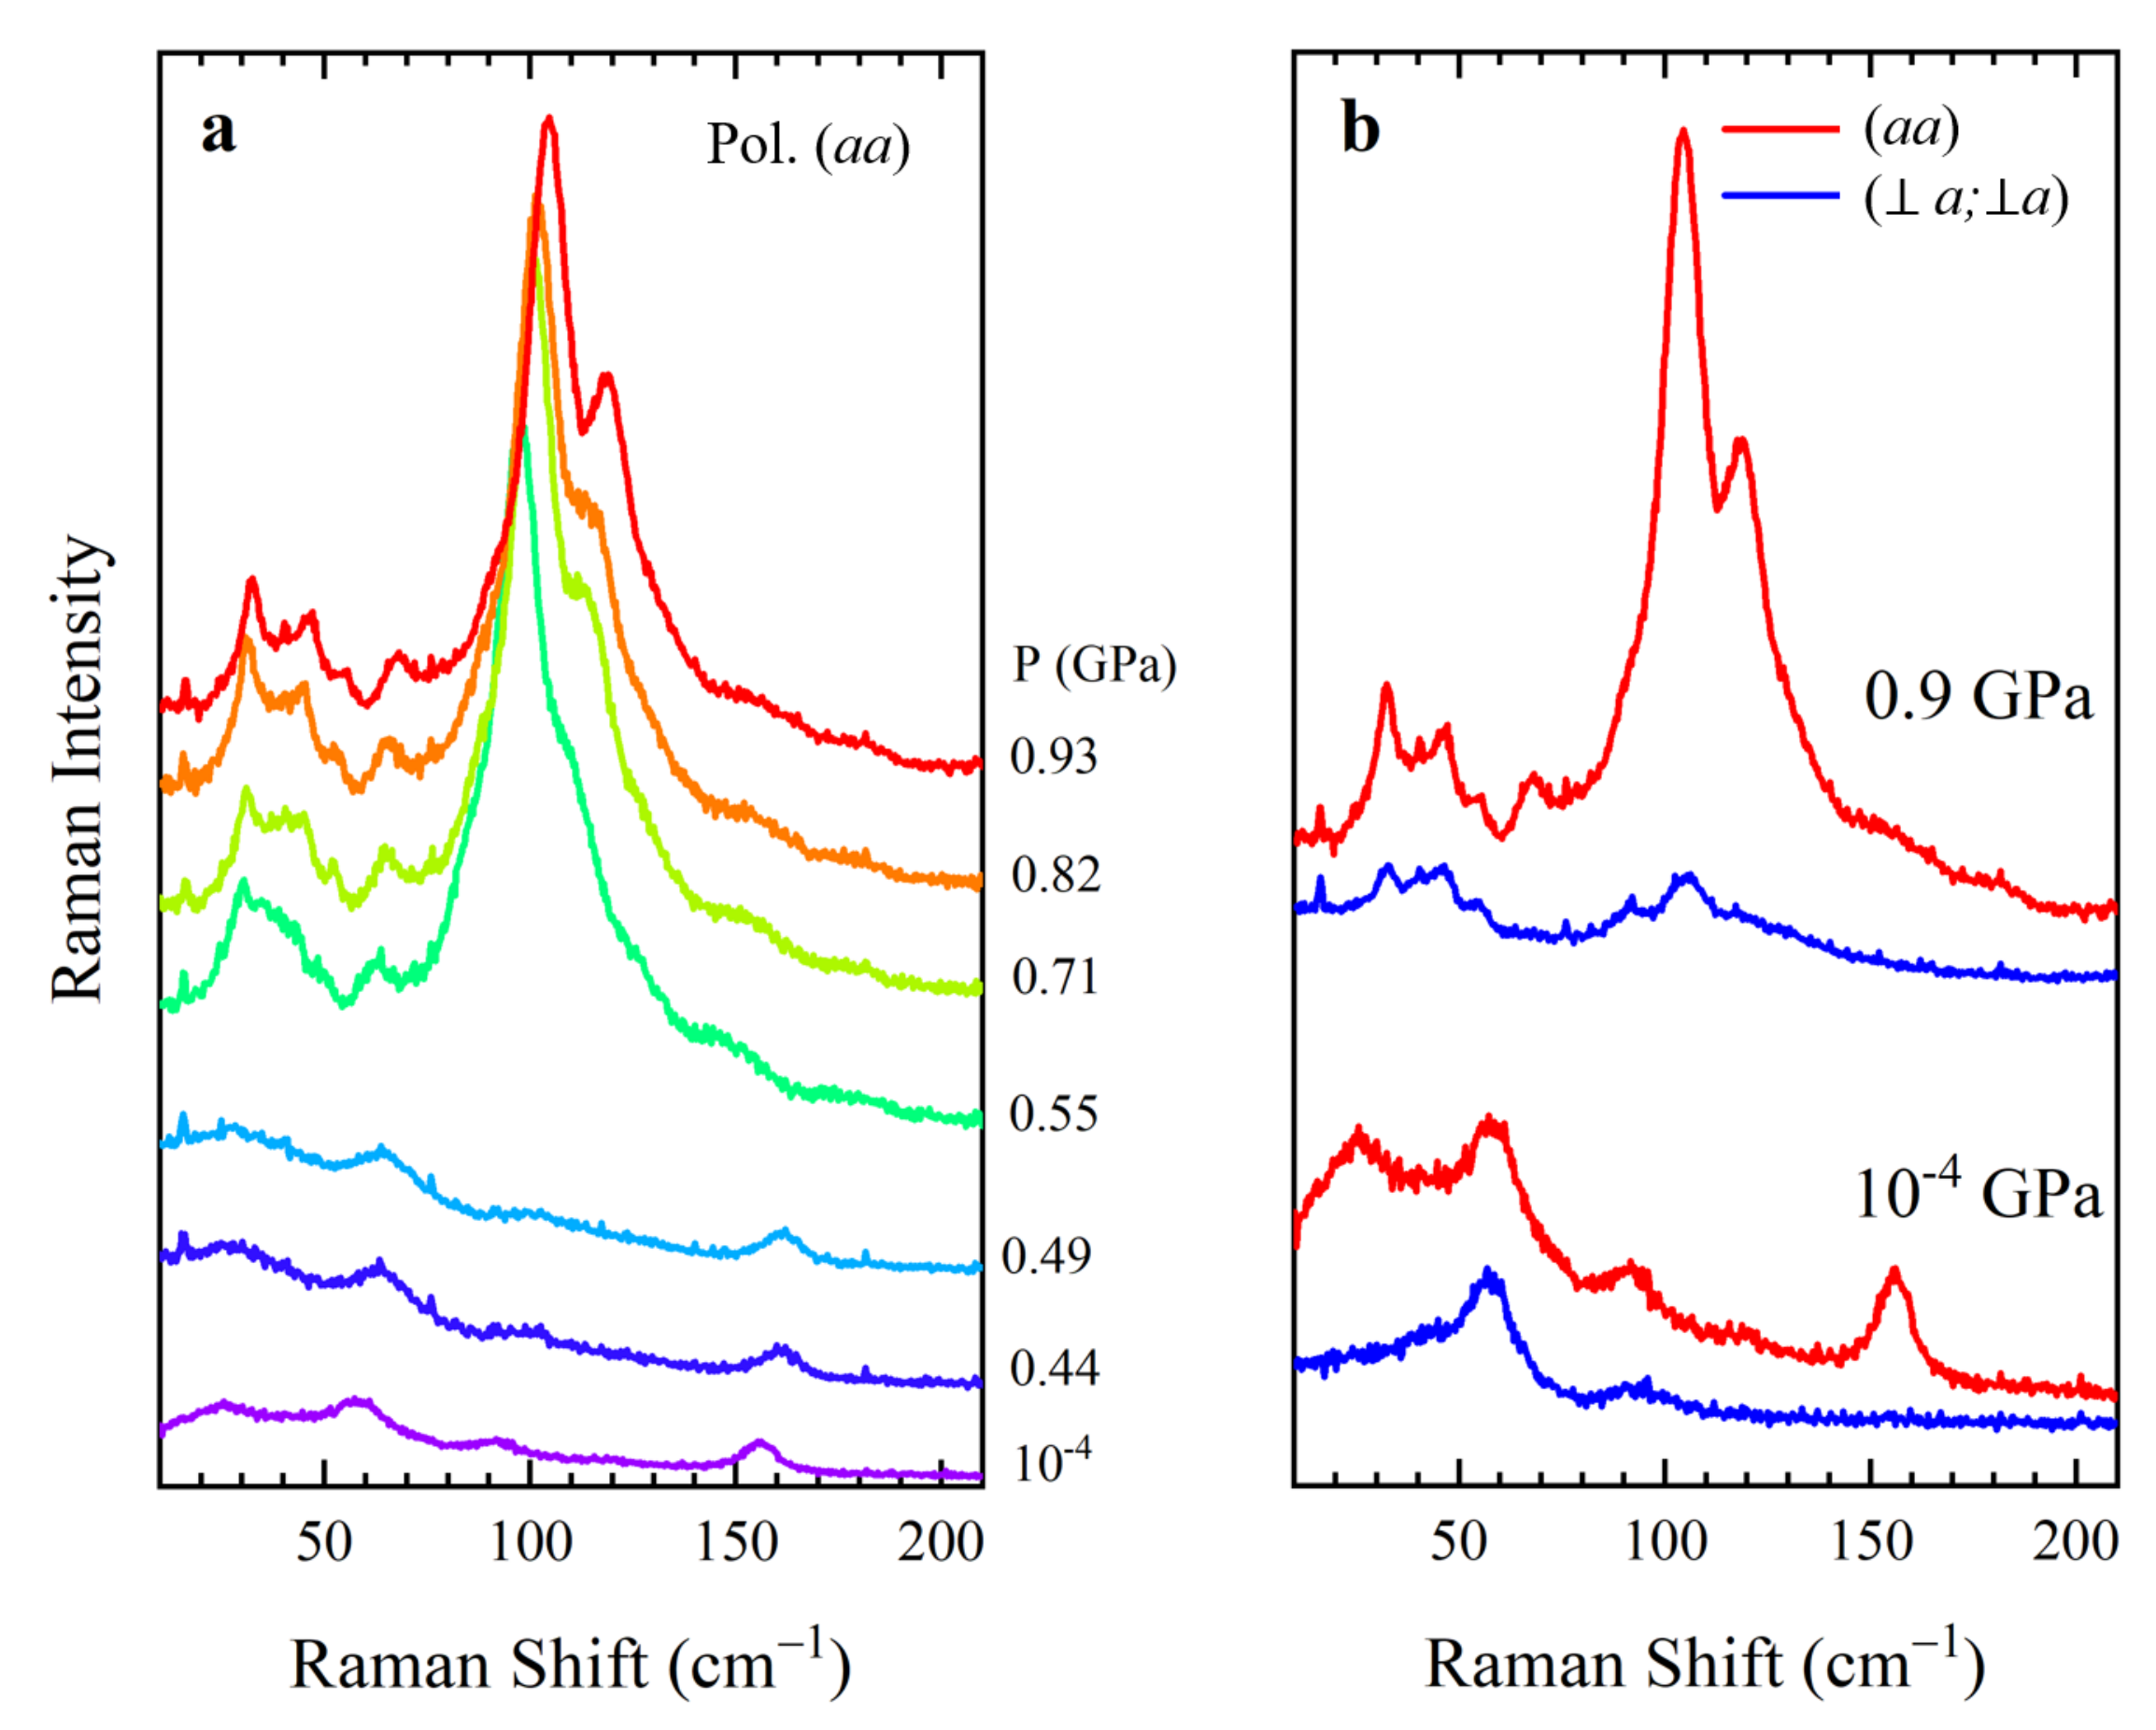
3.2.2. DMTTF-FA
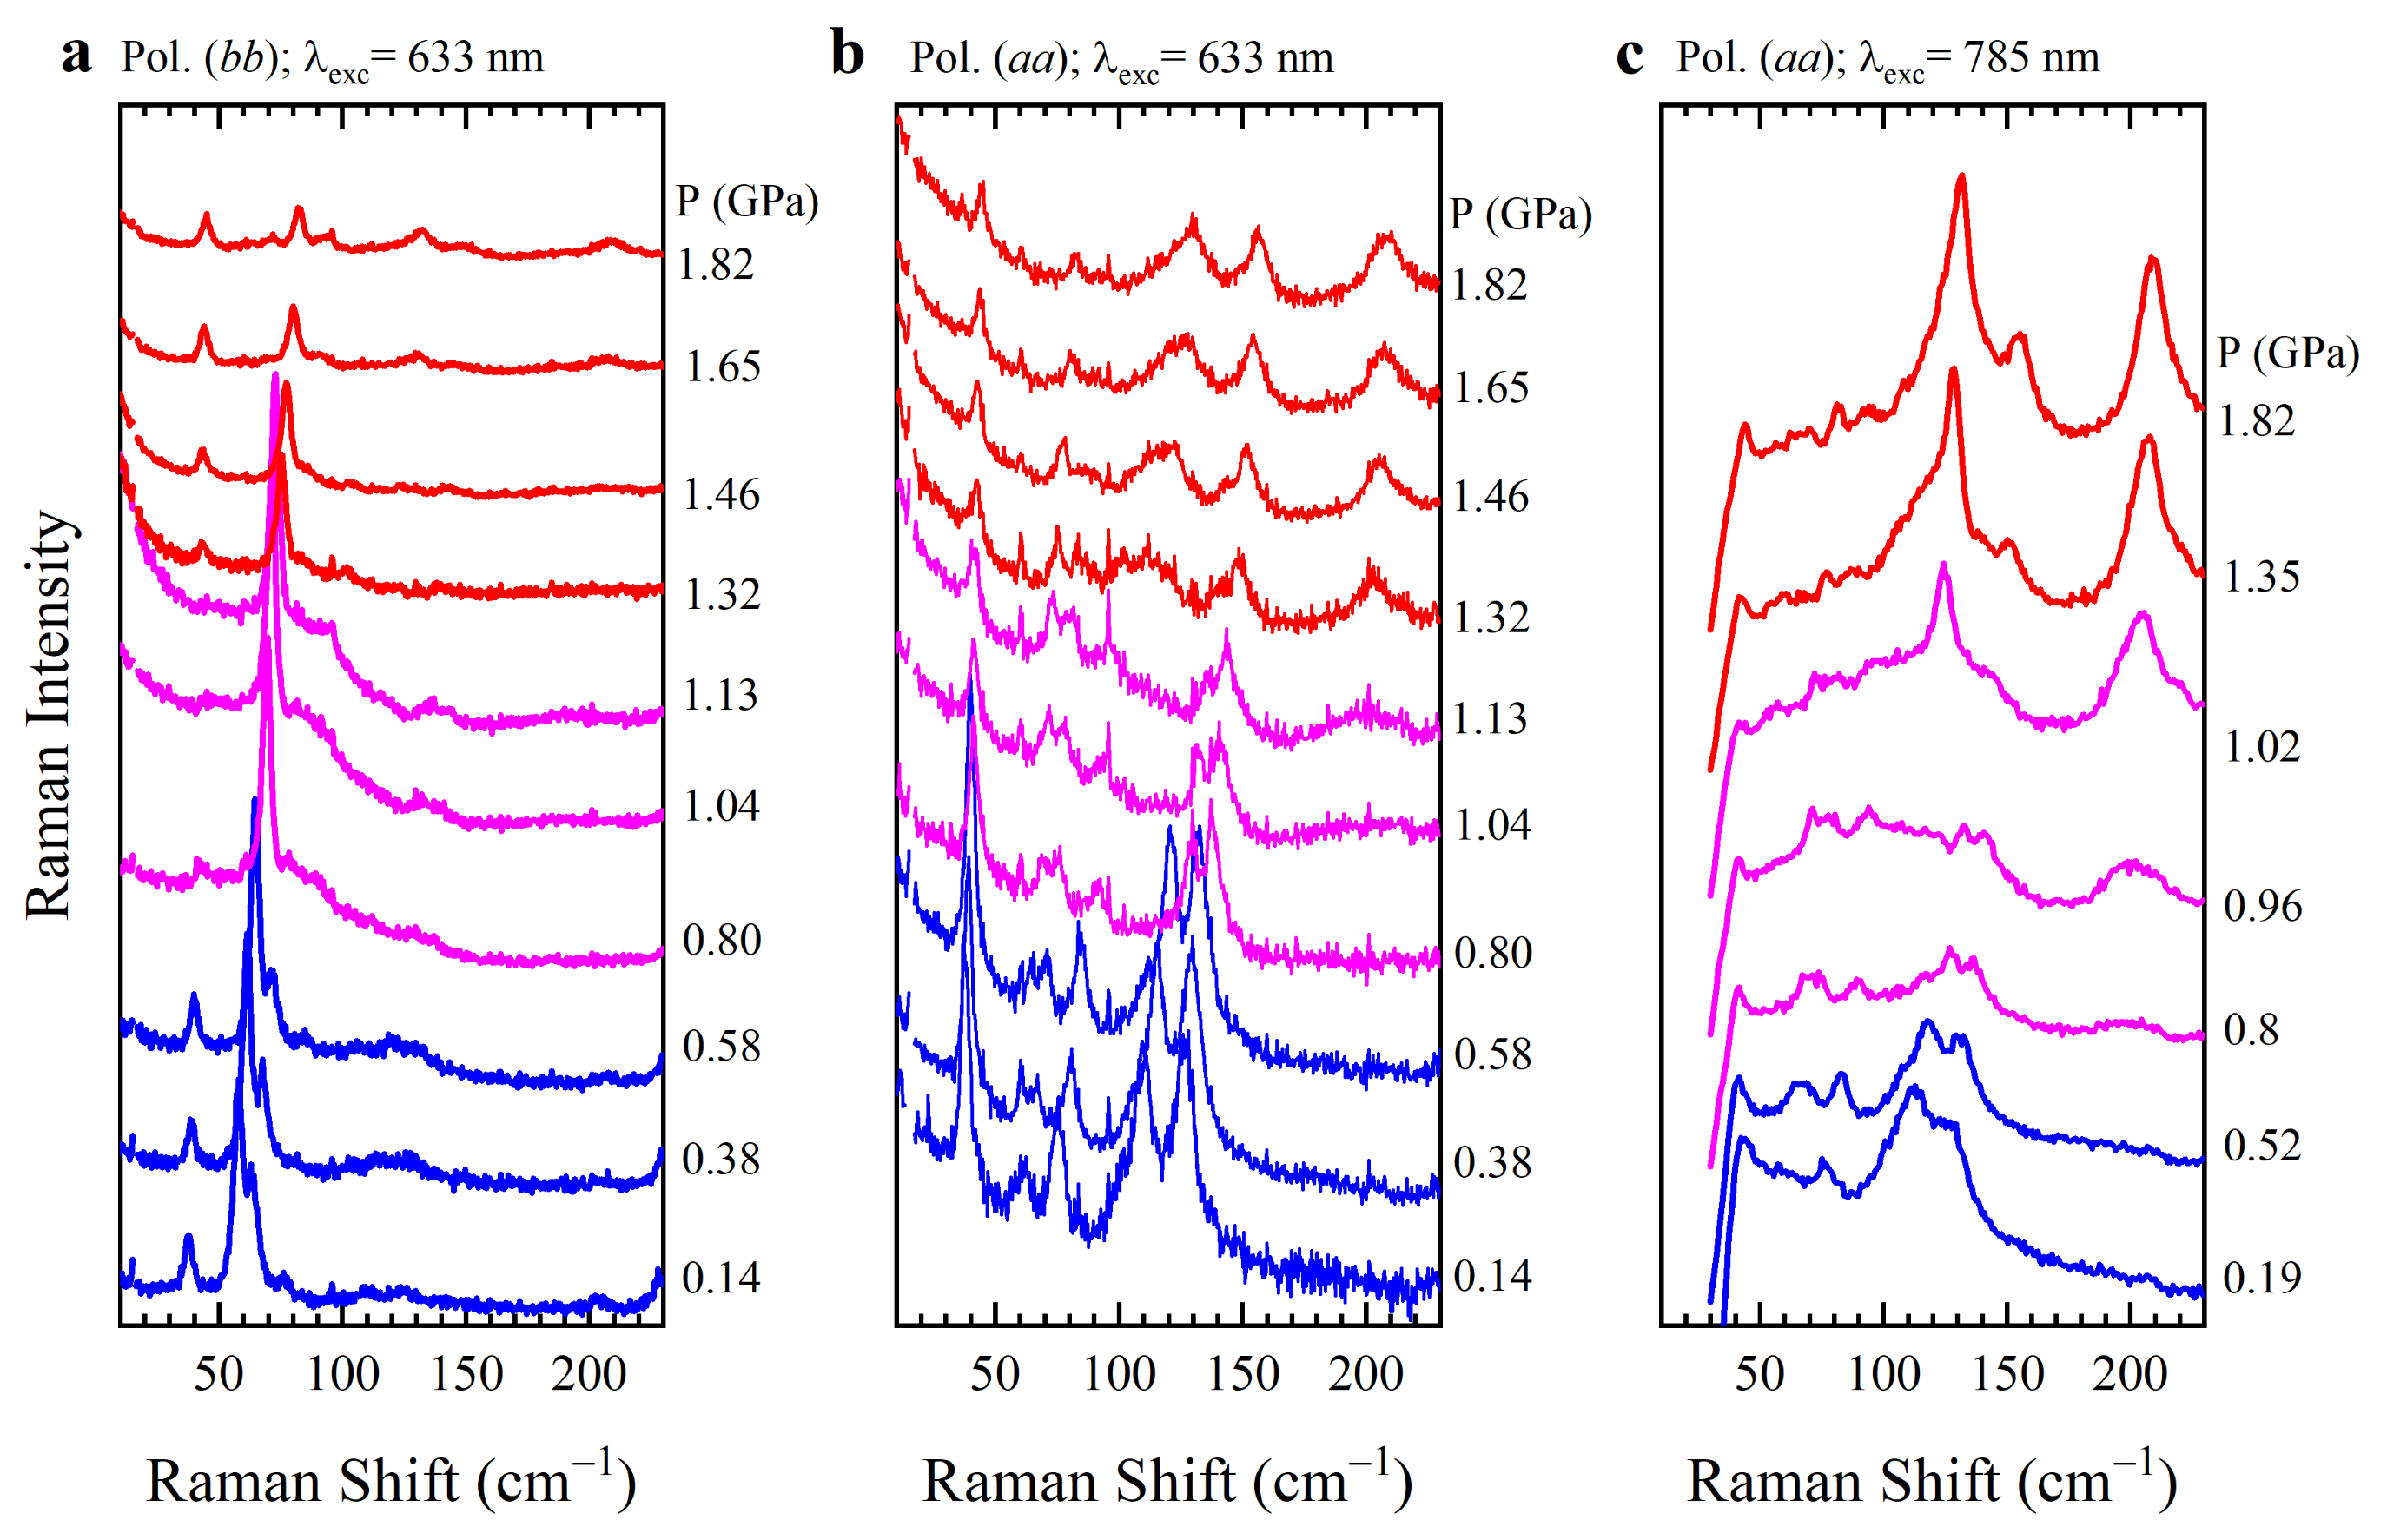
3.2.3. DMTTF-CA
4. Discussion and Conclusions
Supplementary Materials
Author Contributions
Funding
Acknowledgments
Conflicts of Interest
Sample Availability
Abbreviations
| CT | Charge Transfer. |
| NIT | Neutral to Ionic phase Transition. |
References
- Soos, Z.G. Theory of π-molecular charge-transfer crystals. Annu. Rev. Phys. Chem. 1974, 25, 121–153. [Google Scholar] [CrossRef]
- Torrance, J.B.; Vazquez, J.E.; Mayerle, J.J.; Lee, V.Y. Discovery of a Neutral-to-Ionic Phase Transition in Organic Materials. Phys. Rev. Lett. 1981, 46, 253–257. [Google Scholar] [CrossRef]
- Torrance, J.; Girlando, A.; Mayerle, J.; Crowley, J.; Lee, V.; Batail, P.; LaPlaca, S. Anomalous nature of neutral-to-ionic phase transition in tetrathiafulvalene-chloranil. Phys. Rev. Lett. 1981, 47, 1747–1750. [Google Scholar] [CrossRef]
- Masino, M.; Castagnetti, N.; Girlando, A. Phenomenology of the Neutral-Ionic Valence Instability in Mixed Stack Charge-Transfer Crystals. Crystals 2017, 7, 108. [Google Scholar] [CrossRef]
- Painelli, A.; Girlando, A. Zero-temperature phase diagram of mixed-stack charge-transfer crystals. Phys. Rev. B 1988, 37, 5748–5760. [Google Scholar] [CrossRef]
- Girlando, A.; Painelli, A. Regular-dimerized stack and neutral-ionic interfaces in mixed-stack organic charge-transfer crystals. Phys. Rev. B 1986, 34, 2131–2139. [Google Scholar] [CrossRef]
- Girlando, A.; Painelli, A. Regular-dimerized stack vs neutral-ionic instability in mixed stack CT crystals. Physica B + C 1986, 143, 559–561. [Google Scholar] [CrossRef]
- Ferrari, E.; Mezzadri, F.; Masino, M. Temperature-induced neutral-to-ionic phase transition of the charge-transfer crystal tetrathiafulvalene-fluoranil. Phys. Rev. B 2022, 105, 054106. [Google Scholar] [CrossRef]
- Collet, E.; Buron-Le Cointe, M.; Lemée-Cailleau, M.; Cailleau, H.; Toupet, L.; Meven, M.; Mattauch, S.; Heger, G.; Karl, N. Structural evidence of ferrielectric neutral-ionic layered ordering in 2, 6-dimethyltetrathiafulvalene-p-chloranil. Phys. Rev. B 2001, 63, 054105. [Google Scholar] [CrossRef]
- Ranzieri, P.; Masino, M.; Girlando, A.; Lemée-Cailleau, M.H. Temperature-induced valence and structural instability in DMTTF-CA: Single-crystal Raman and infrared measurements. Phys. Rev. B 2007, 76, 134115. [Google Scholar] [CrossRef]
- Mao, H.; Xu, J.A.; Bell, P. Calibration of the ruby pressure gauge to 800 kbar under quasi-hydrostatic conditions. J. Geophys. Res. Solid Earth 1986, 91, 4673–4676. [Google Scholar] [CrossRef]
- Bruker. APEX III; Bruker AXS Inc.: Madison, WI, USA, 2019. [Google Scholar]
- Sheldrick, G.M. Crystal structure refinement with SHELXL. Acta Crystallogr. Sect. C 2015, 71, 3–8. [Google Scholar] [CrossRef] [PubMed]
- Mayerle, J.J.; Torrance, J.B.; Crowley, J.I. Mixed-stack complexes of tetrathiafulvalene. The structures of the charge-transfer complexes of TTF with chloranil and fluoranil. Acta Crystallogr. Sect. B 1979, 35, 2988–2995. [Google Scholar] [CrossRef]
- Delchiaro, F.; Girlando, A.; Painelli, A.; Bandyopadhyay, A.; Pati, S.K.; D’Avino, G. Towards first-principles prediction of valence instabilities in mixed stack charge-transfer crystals. Phys. Rev. B 2017, 95, 155125. [Google Scholar] [CrossRef]
- Aoki, S.; Nakayama, T.; Miura, A. Temperature-induced neutral-ionic transition in dimethyltetrathiafulvalene-p-chloranil. Phys. Rev. B 1993, 48, 626. [Google Scholar] [CrossRef]
- Aoki, S.; Nakayama, T.; Miura, A. Neutral-ionic transition in dimethyl-TTF-chloranil. Synth. Met. 1995, 70, 1243–1244. [Google Scholar] [CrossRef]
- Horiuchi, S.; Okimoto, Y.; Kumai, R.; Tokura, Y. Ferroelectric Valence Transition and Phase Diagram of a Series of Charge-Transfer Complexes of 4,4’-Dimethyltetrathiafulvalene and Tetrahalo-p-benzoquinones. J. Am. Chem. Soc. 2001, 123, 665–670. [Google Scholar] [CrossRef]
- Sunami, K.; Iwase, F.; Miyagawa, K.; Horiuchi, S.; Kobayashi, K.; Kumai, R.; Kanoda, K. Variation in the nature of the neutral-ionic transition in DMTTF-QCl 4 under pressure probed by NQR and NMR. Phys. Rev. B 2019, 99, 125133. [Google Scholar] [CrossRef]
- D’Avino, G.; Masino, M.; Girlando, A.; Painelli, A. Correlated electrons in soft lattices: Raman scattering evidence of the nonequilibrium dielectric divergence at the neutral-ionic phase transition. Phys. Rev. B 2011, 83, 161105. [Google Scholar] [CrossRef]
- Girlando, A.; Marzola, F.; Pecile, C.; Torrance, J.B. Vibrational spectroscopy of mixed stack organic semiconductors: Neutral and ionic phases of tetrathiafulvalene-chloranil (TTF-CA) charge transfer complex. J. Chem. Phys. 1983, 79, 1075–1085. [Google Scholar] [CrossRef]
- Kaźmierczak, M.; Patyk-Kaźmierczak, E.; Katrusiak, A. Compression and Thermal Expansion in Organic and Metal–Organic Crystals: The Pressure–Temperature Correspondence Rule. Cryst. Growth Des. 2021, 21, 2196–2204. [Google Scholar] [CrossRef]
- Girlando, A.; Pecile, C. Vibrational spectra of fluoranil. (2, 3, 5, 6-Tetrafluorop- benzoquinone). J. Chem. Soc. Faraday Trans. 1975, 71, 689–698. [Google Scholar] [CrossRef]
- Bozio, R.; Zanon, I.; Girlando, A.; Pecile, C. Vibrational spectroscopy of molecular constituents of one-dimensional organic conductors. Tetrathiofulvalene (TTF), TTF+, and (TTF+)2 dimer. J. Chem. Phys. 1979, 71, 2282–2293. [Google Scholar] [CrossRef]


| TTF-FA | DMTTF-FA | DMTTF-CA | |
|---|---|---|---|
| Space group | |||
| a (Å) Å | 7.054 1 | 6.9278 1 | 7.1903 1 |
| b (Å) | 7.304 | 7.6275 | 7.6250 |
| c (Å) | 7.359 | 7.6919 | 8.4799 |
| (deg) | 106.15 | 97.581 | 96.162 |
| (deg) | 93.101 | 97.447 | 103.779 |
| (deg) | 102.419 | 93.074 | 91.137 |
| V () | 353.037 | 398.467 | 448.434 |
| Z | 1 | 1 | 1 |
| /Å | 3.365 | 3.234 | 3.345 |
| t (eV) 2 | 0.32 | 0.32 | 0.21 |
Disclaimer/Publisher’s Note: The statements, opinions and data contained in all publications are solely those of the individual author(s) and contributor(s) and not of MDPI and/or the editor(s). MDPI and/or the editor(s) disclaim responsibility for any injury to people or property resulting from any ideas, methods, instructions or products referred to in the content. |
© 2023 by the authors. Licensee MDPI, Basel, Switzerland. This article is an open access article distributed under the terms and conditions of the Creative Commons Attribution (CC BY) license (https://creativecommons.org/licenses/by/4.0/).
Share and Cite
Ferrari, E.; Mezzadri, F.; Masino, M. Pressure-Induced Neutral to Ionic Phase Transition in TTF-Fluoranil, DimethylTTF-Fluoranil and DimethylTTF-Chloranil: A Comparative THz Raman Study. Crystals 2023, 13, 1428. https://doi.org/10.3390/cryst13101428
Ferrari E, Mezzadri F, Masino M. Pressure-Induced Neutral to Ionic Phase Transition in TTF-Fluoranil, DimethylTTF-Fluoranil and DimethylTTF-Chloranil: A Comparative THz Raman Study. Crystals. 2023; 13(10):1428. https://doi.org/10.3390/cryst13101428
Chicago/Turabian StyleFerrari, Elena, Francesco Mezzadri, and Matteo Masino. 2023. "Pressure-Induced Neutral to Ionic Phase Transition in TTF-Fluoranil, DimethylTTF-Fluoranil and DimethylTTF-Chloranil: A Comparative THz Raman Study" Crystals 13, no. 10: 1428. https://doi.org/10.3390/cryst13101428