
Vibrational Properties of the Potassium Titanyl Phosphate Crystal Family
 , , , , , and
Abstract
:1. Introduction
2. Methods
2.1. Computational Method
2.2. Raman Spectroscopy
3. Results and Discussion
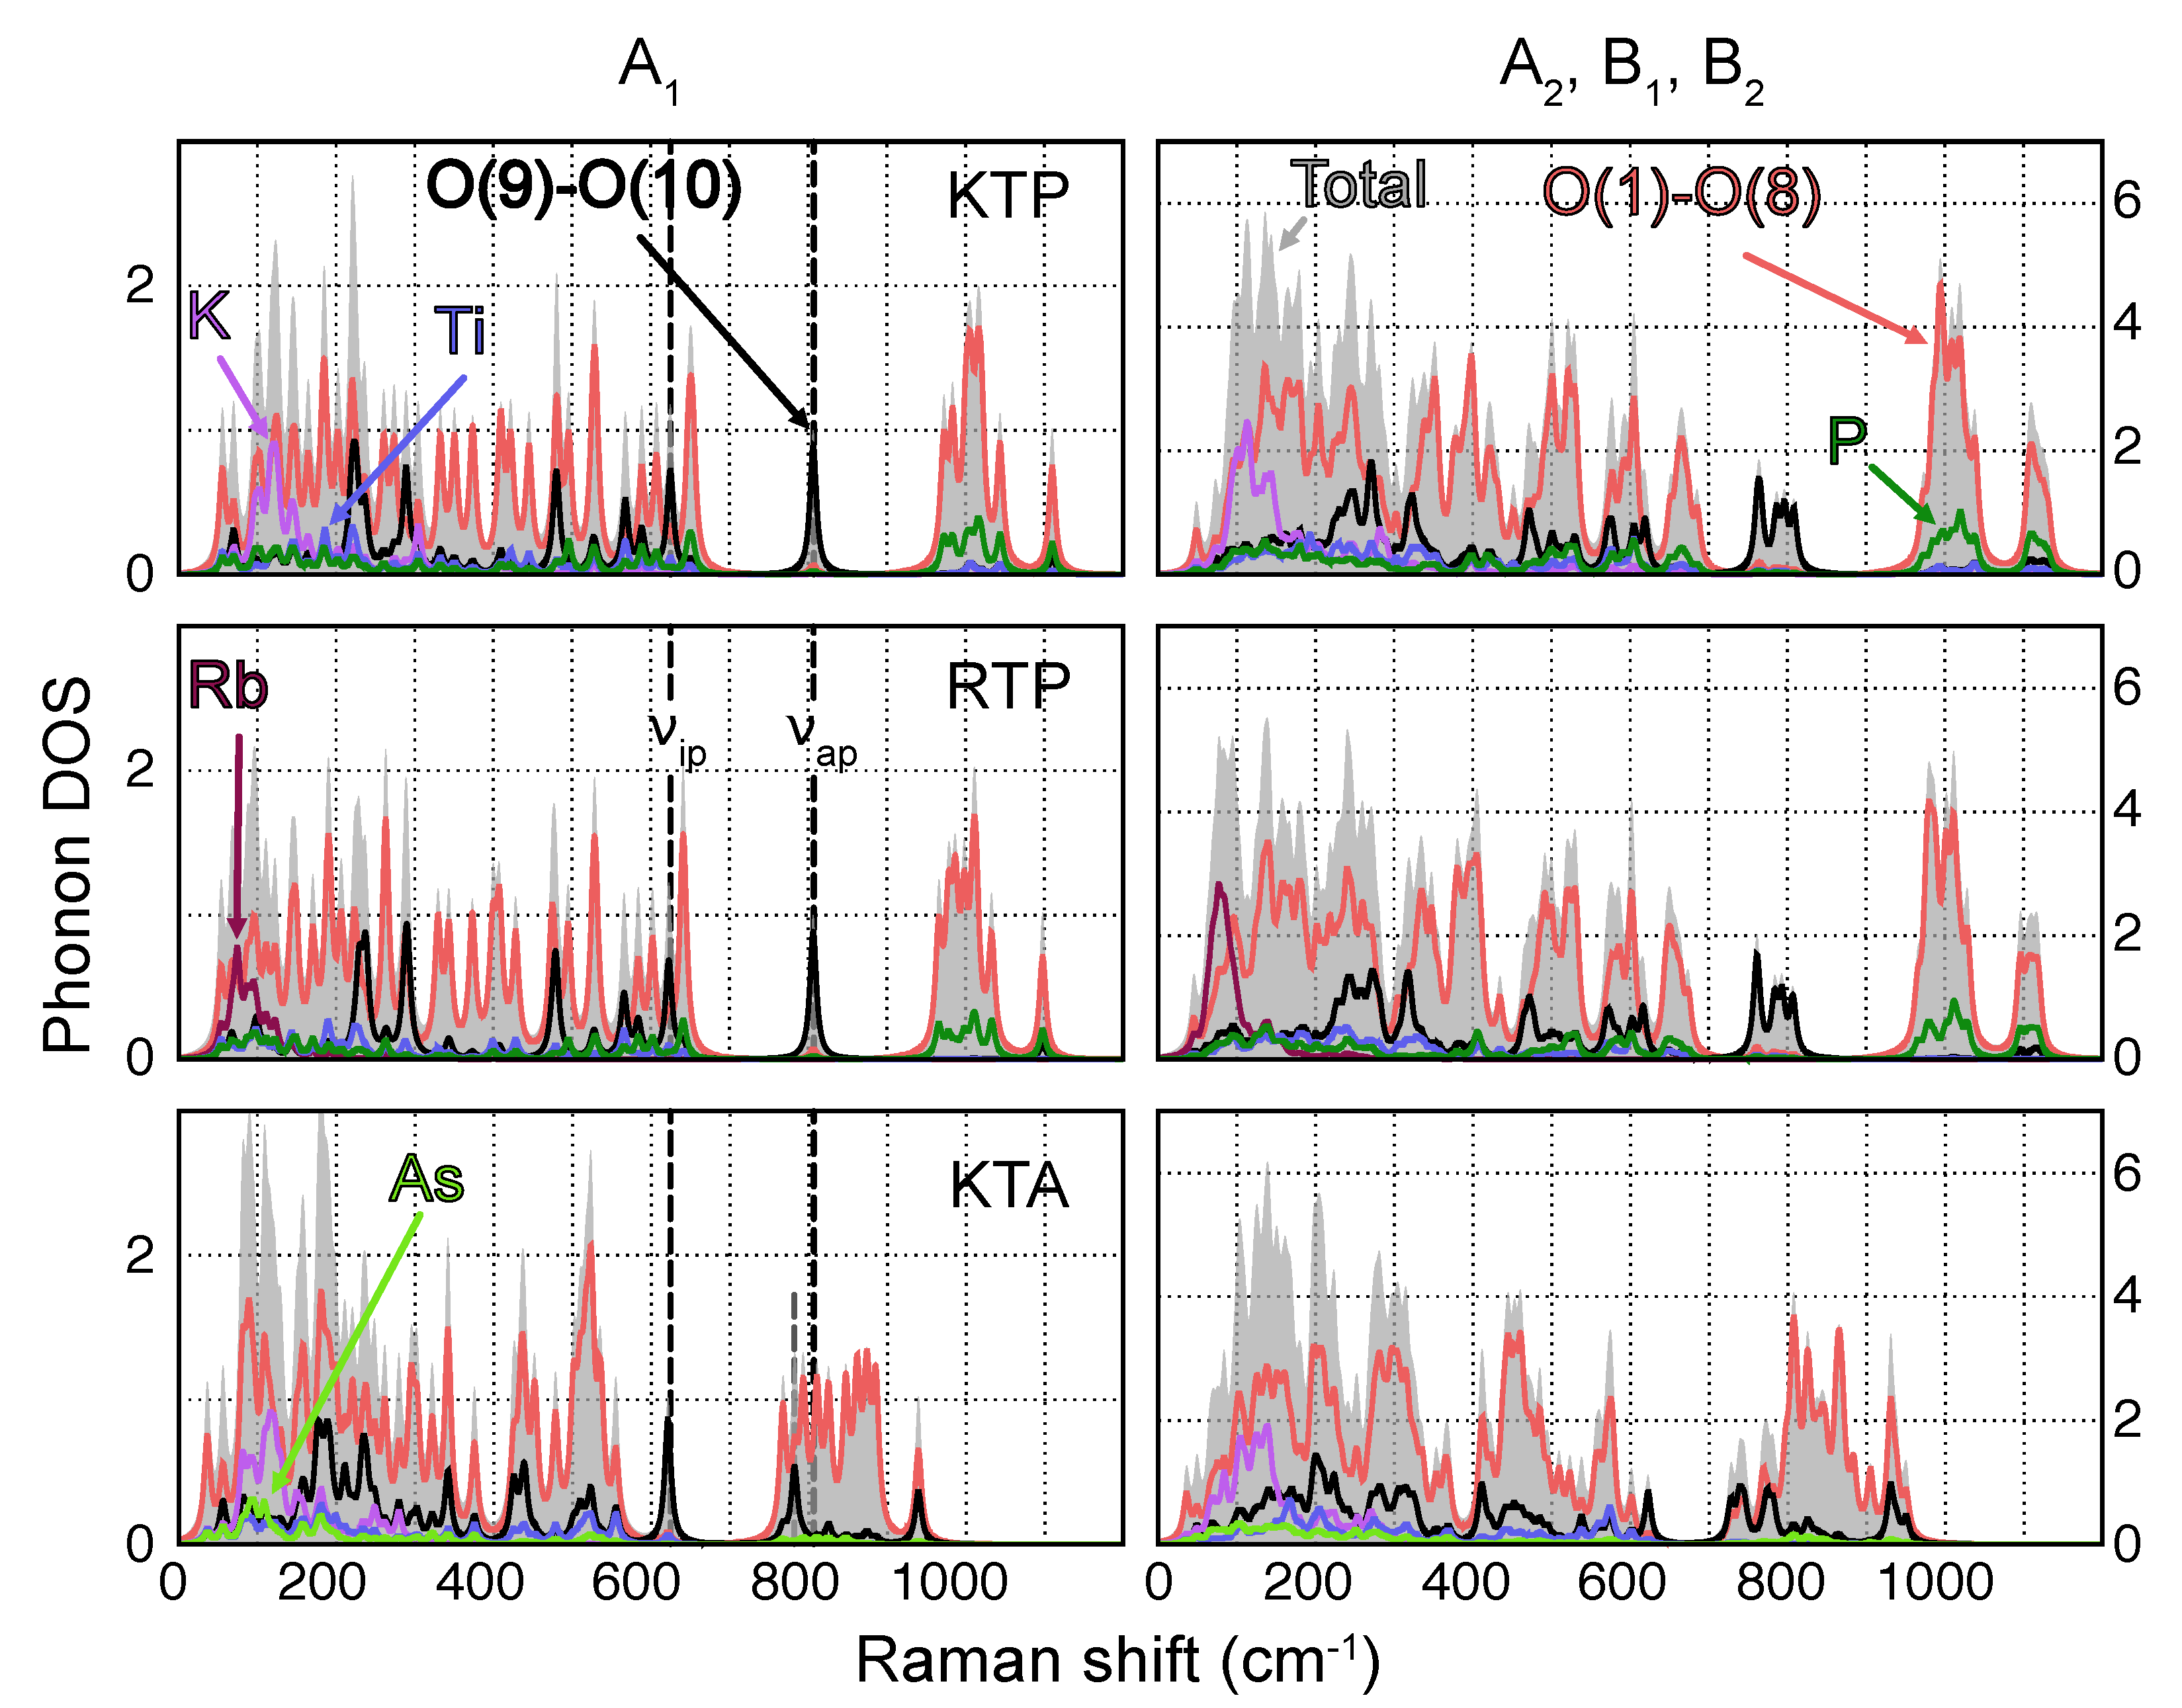
3.1. Phonon Modes
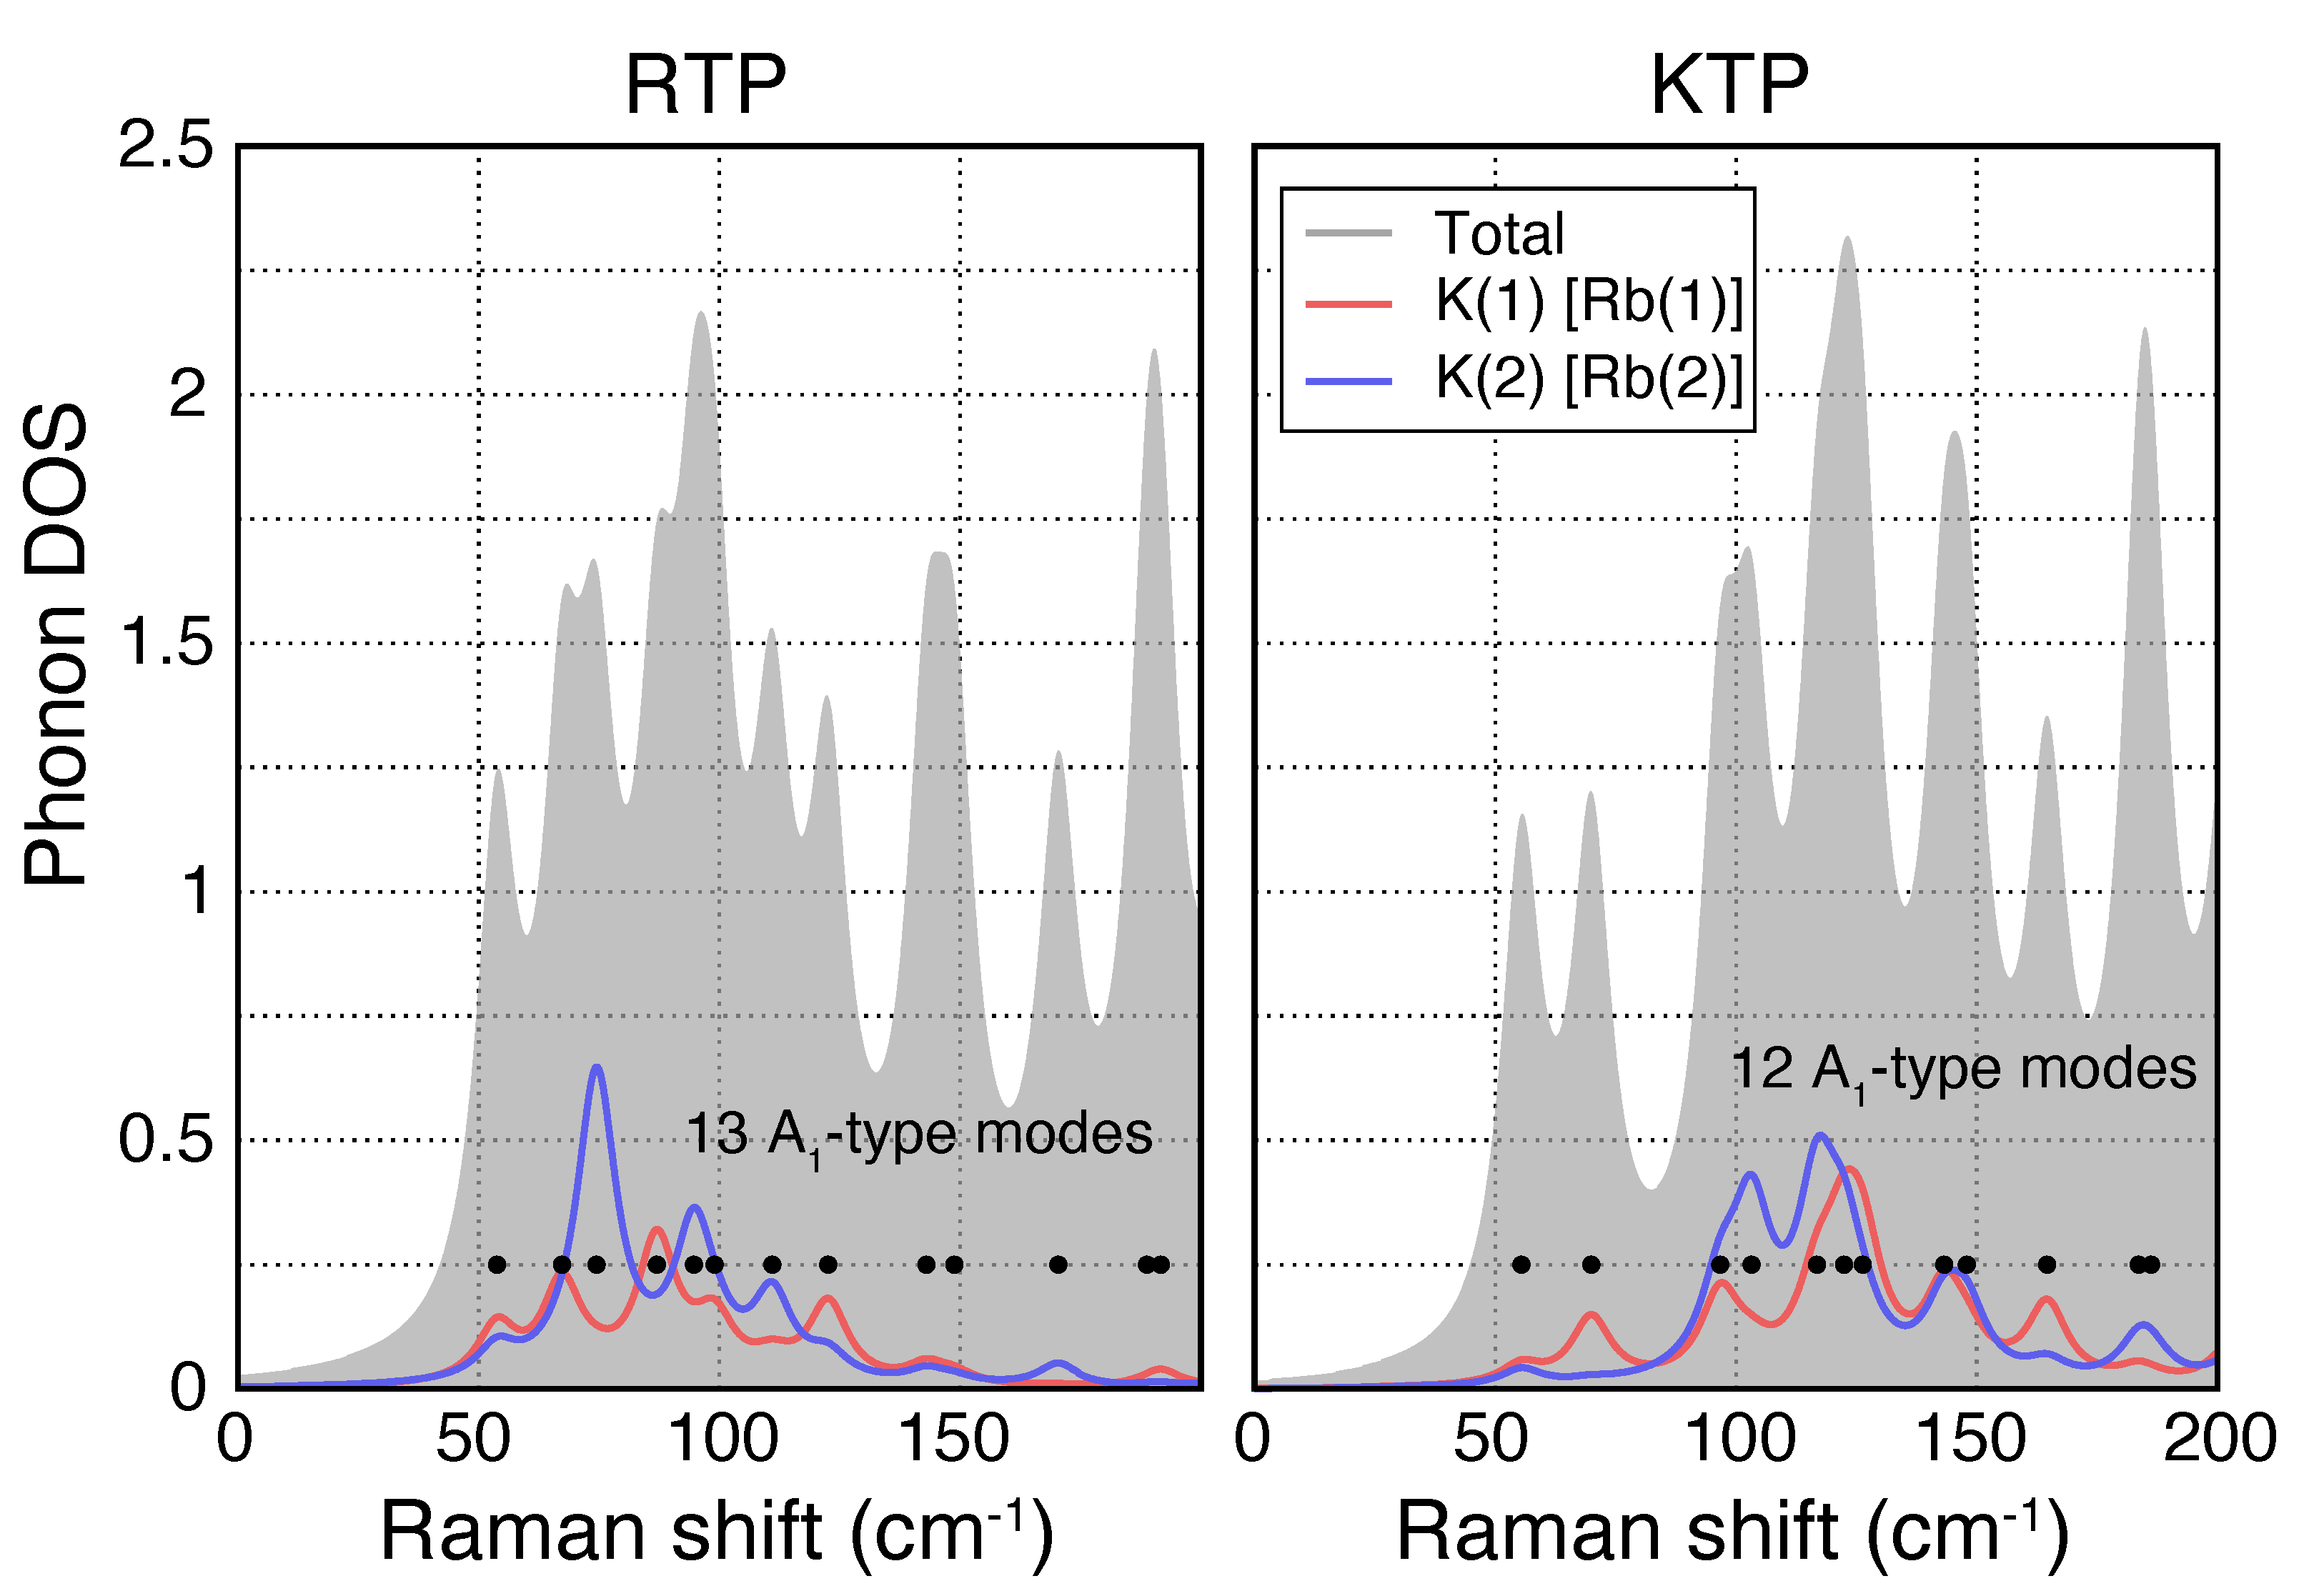
- Vibrations featuring displacements of the heavy alkali atoms K [Rb] with respect to the surrounding PO (AsO) and TiO polyhedra are found predominantly in the low wavenumber regime (<300 cm);
- Owing to their relatively large force constants due to higher bond strength and overall lower masses, P−O-type vibrations are localized essentially at wavenumbers upwards of 950 cm;
- Since As has a much higher mass compared to P, As−O-type vibrations posses much lower force constants and are thus localized at frequencies close to the K and Rb regime;
- Vibrations involving Ti are found in a broad wavenumber range below around 650 cm.
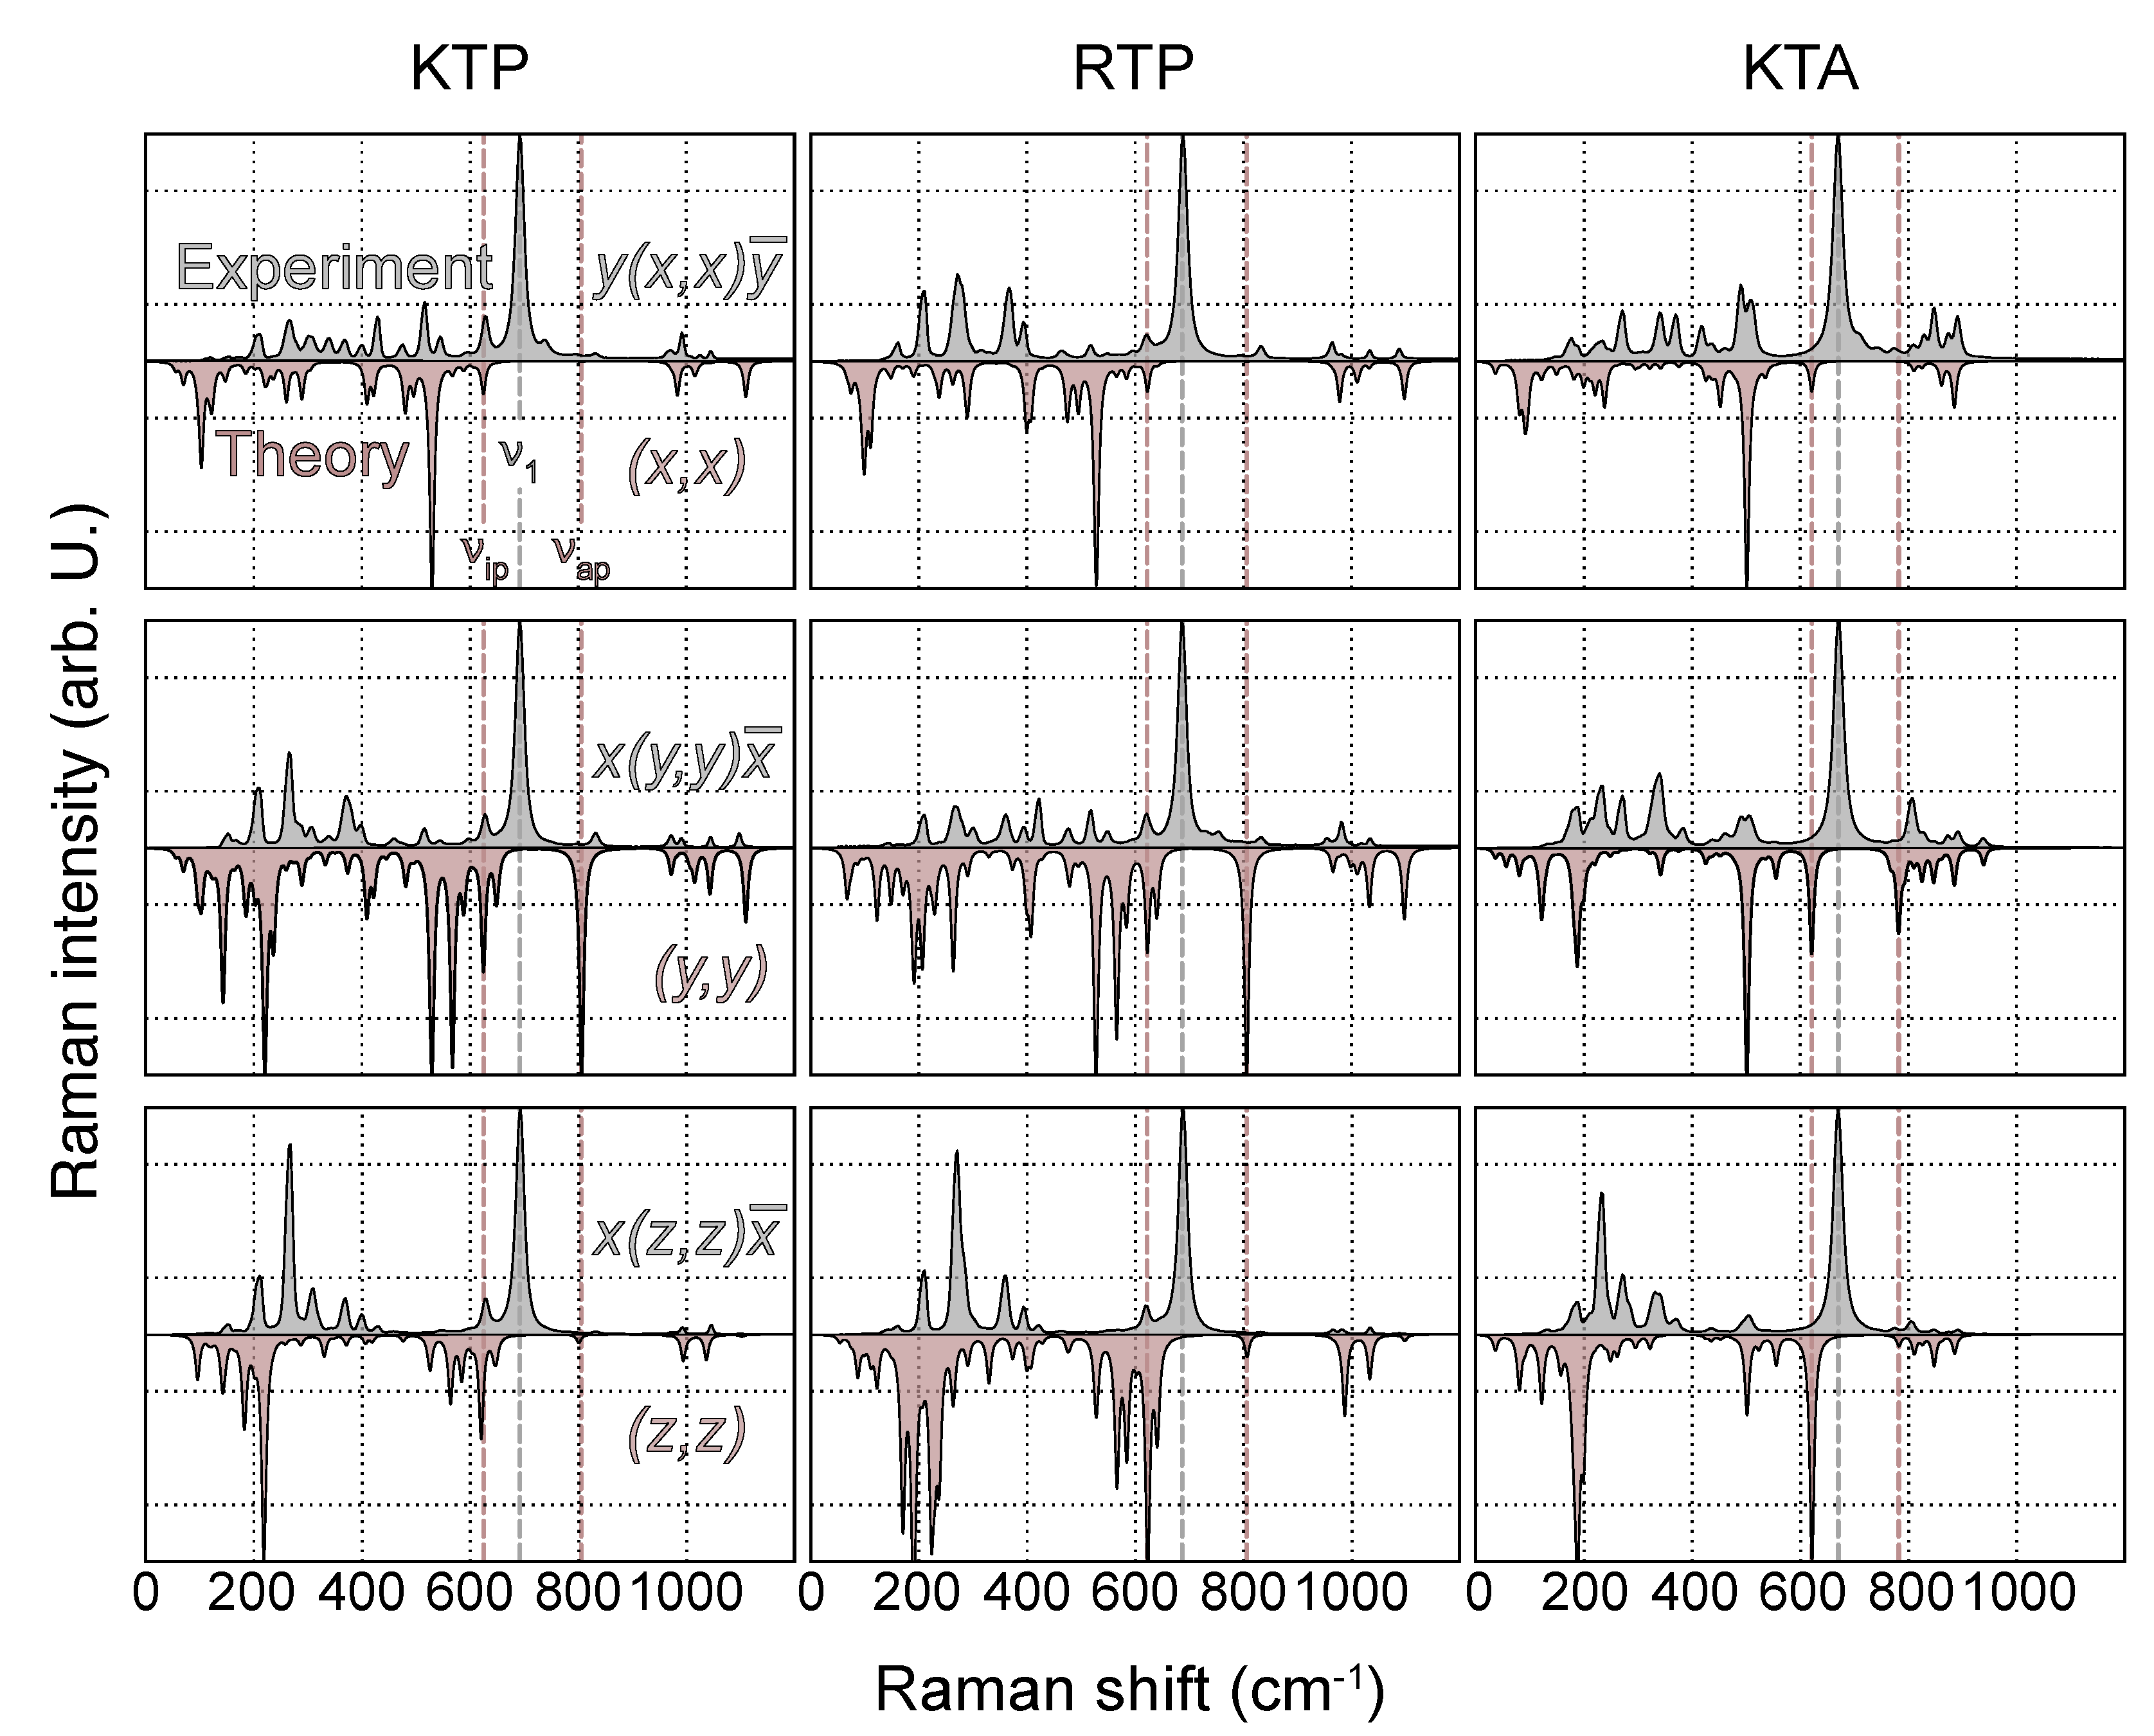
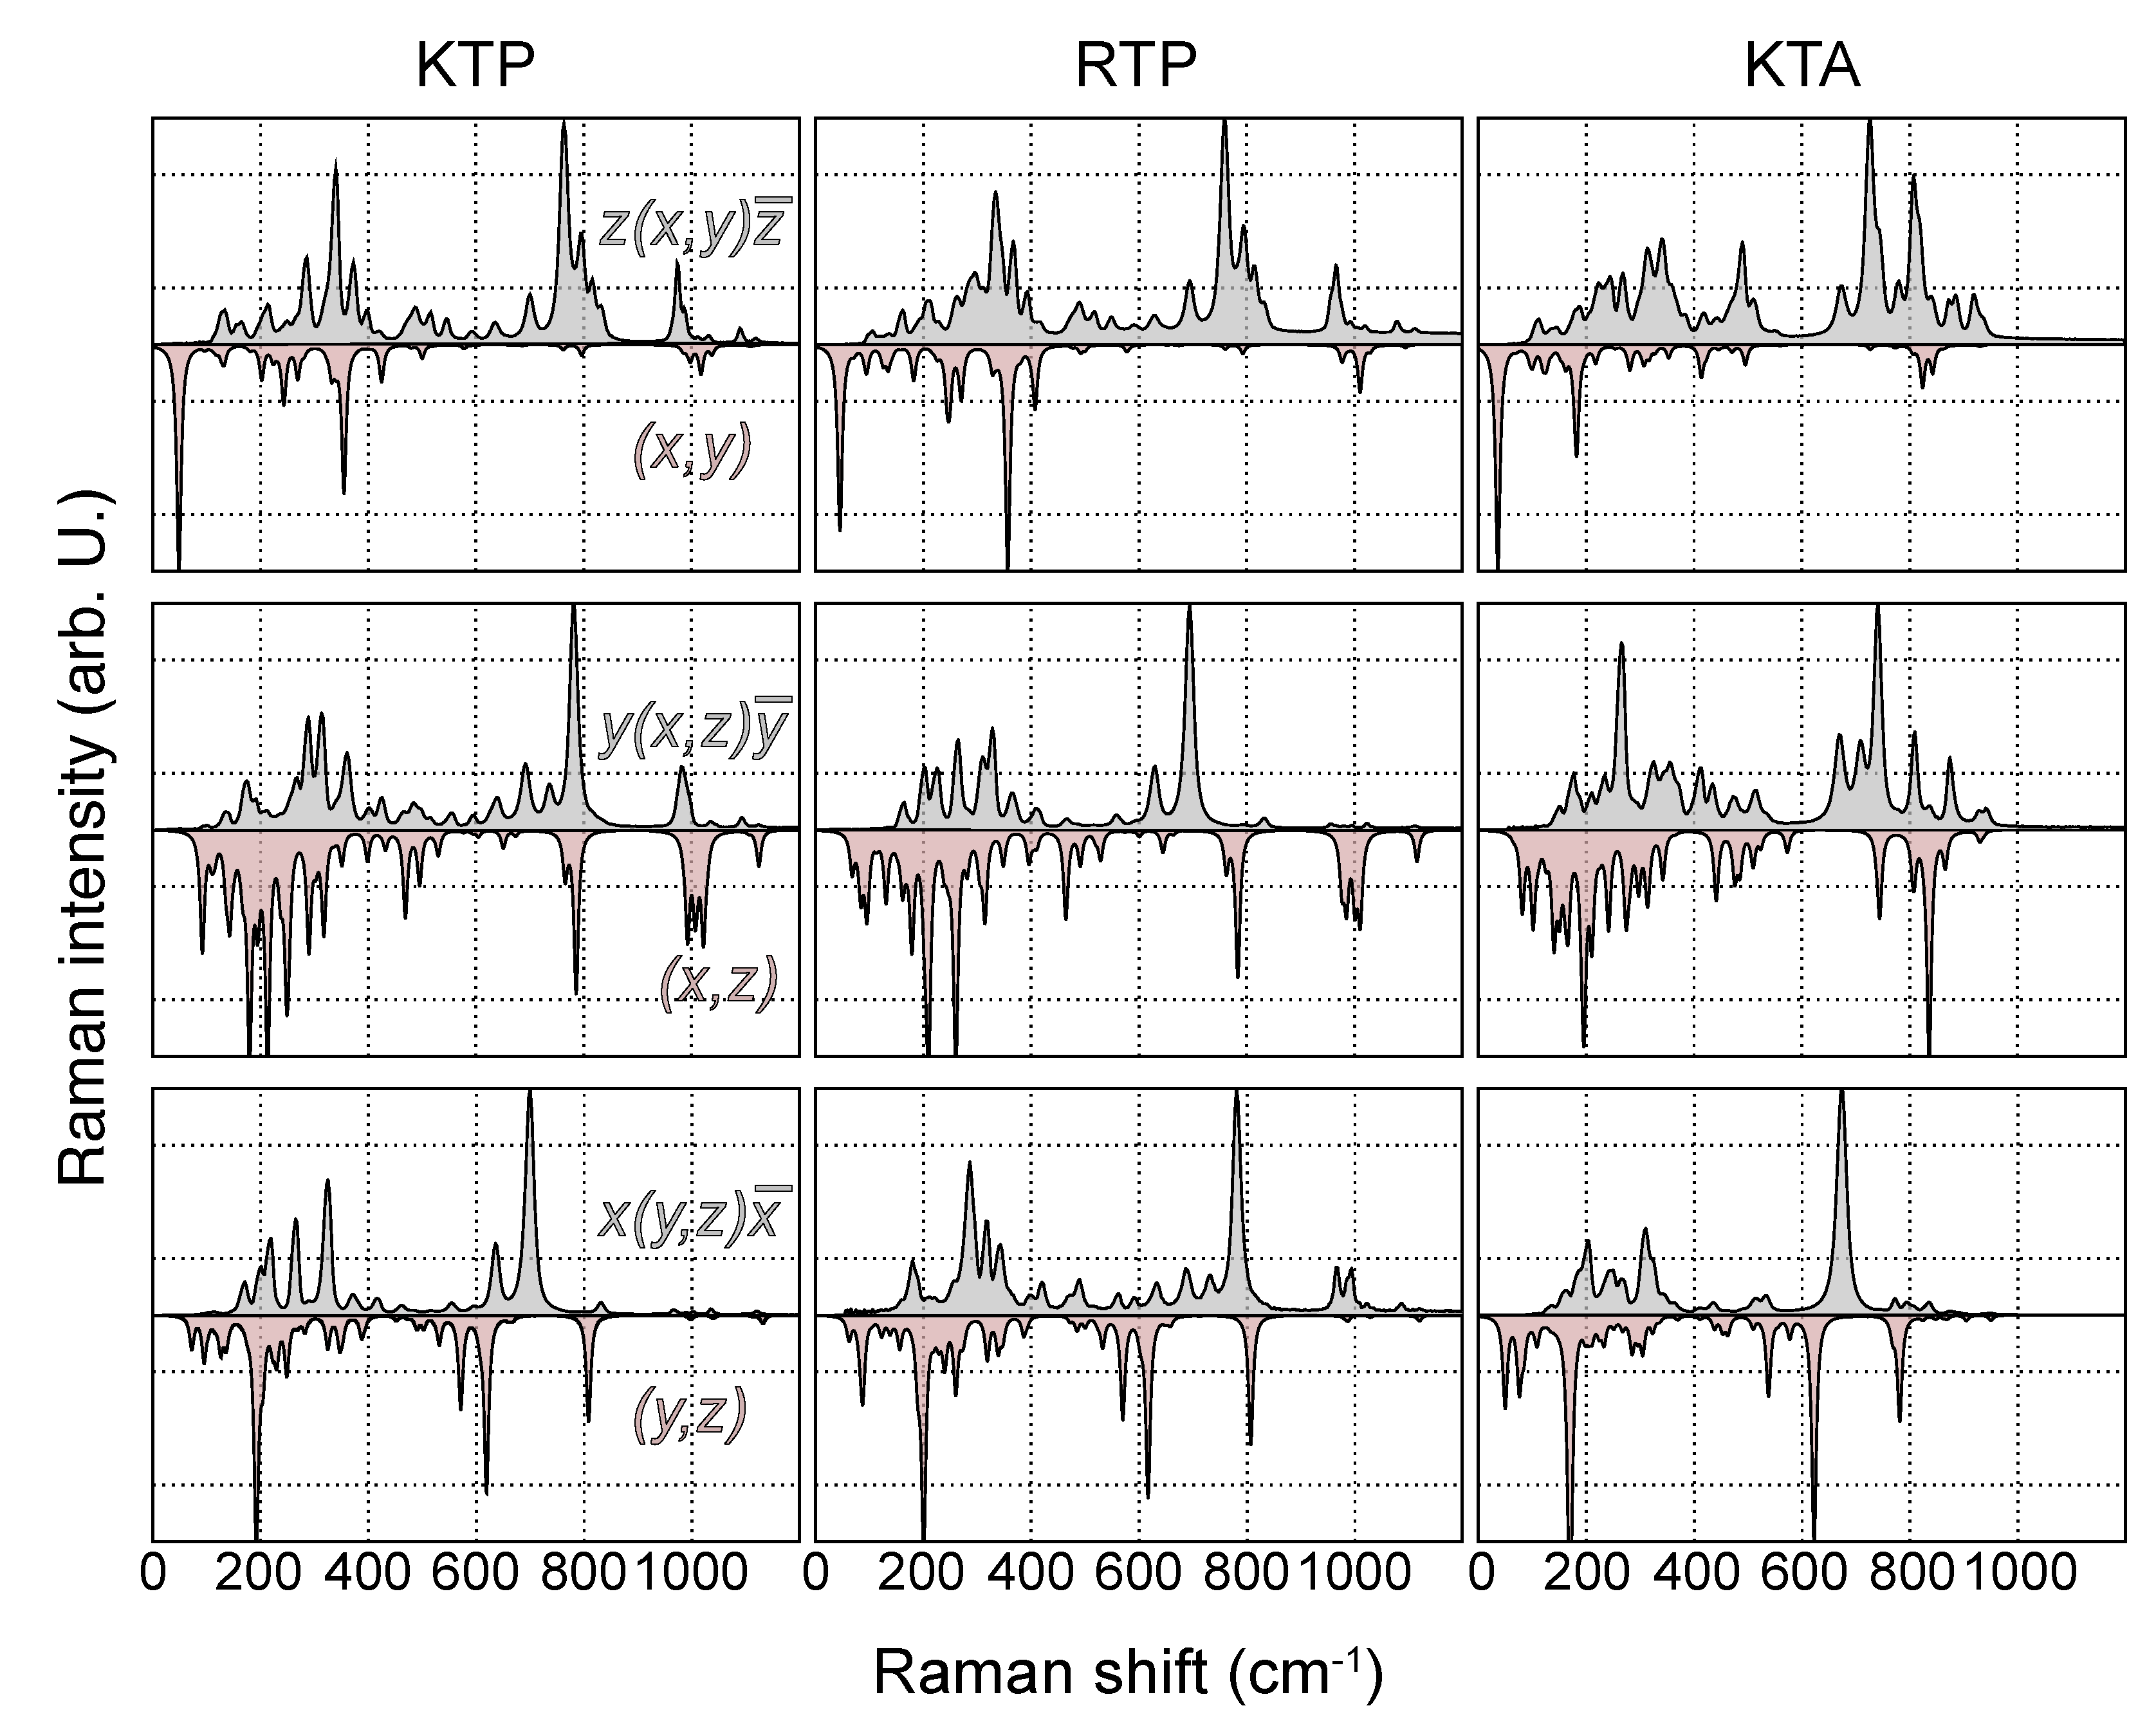
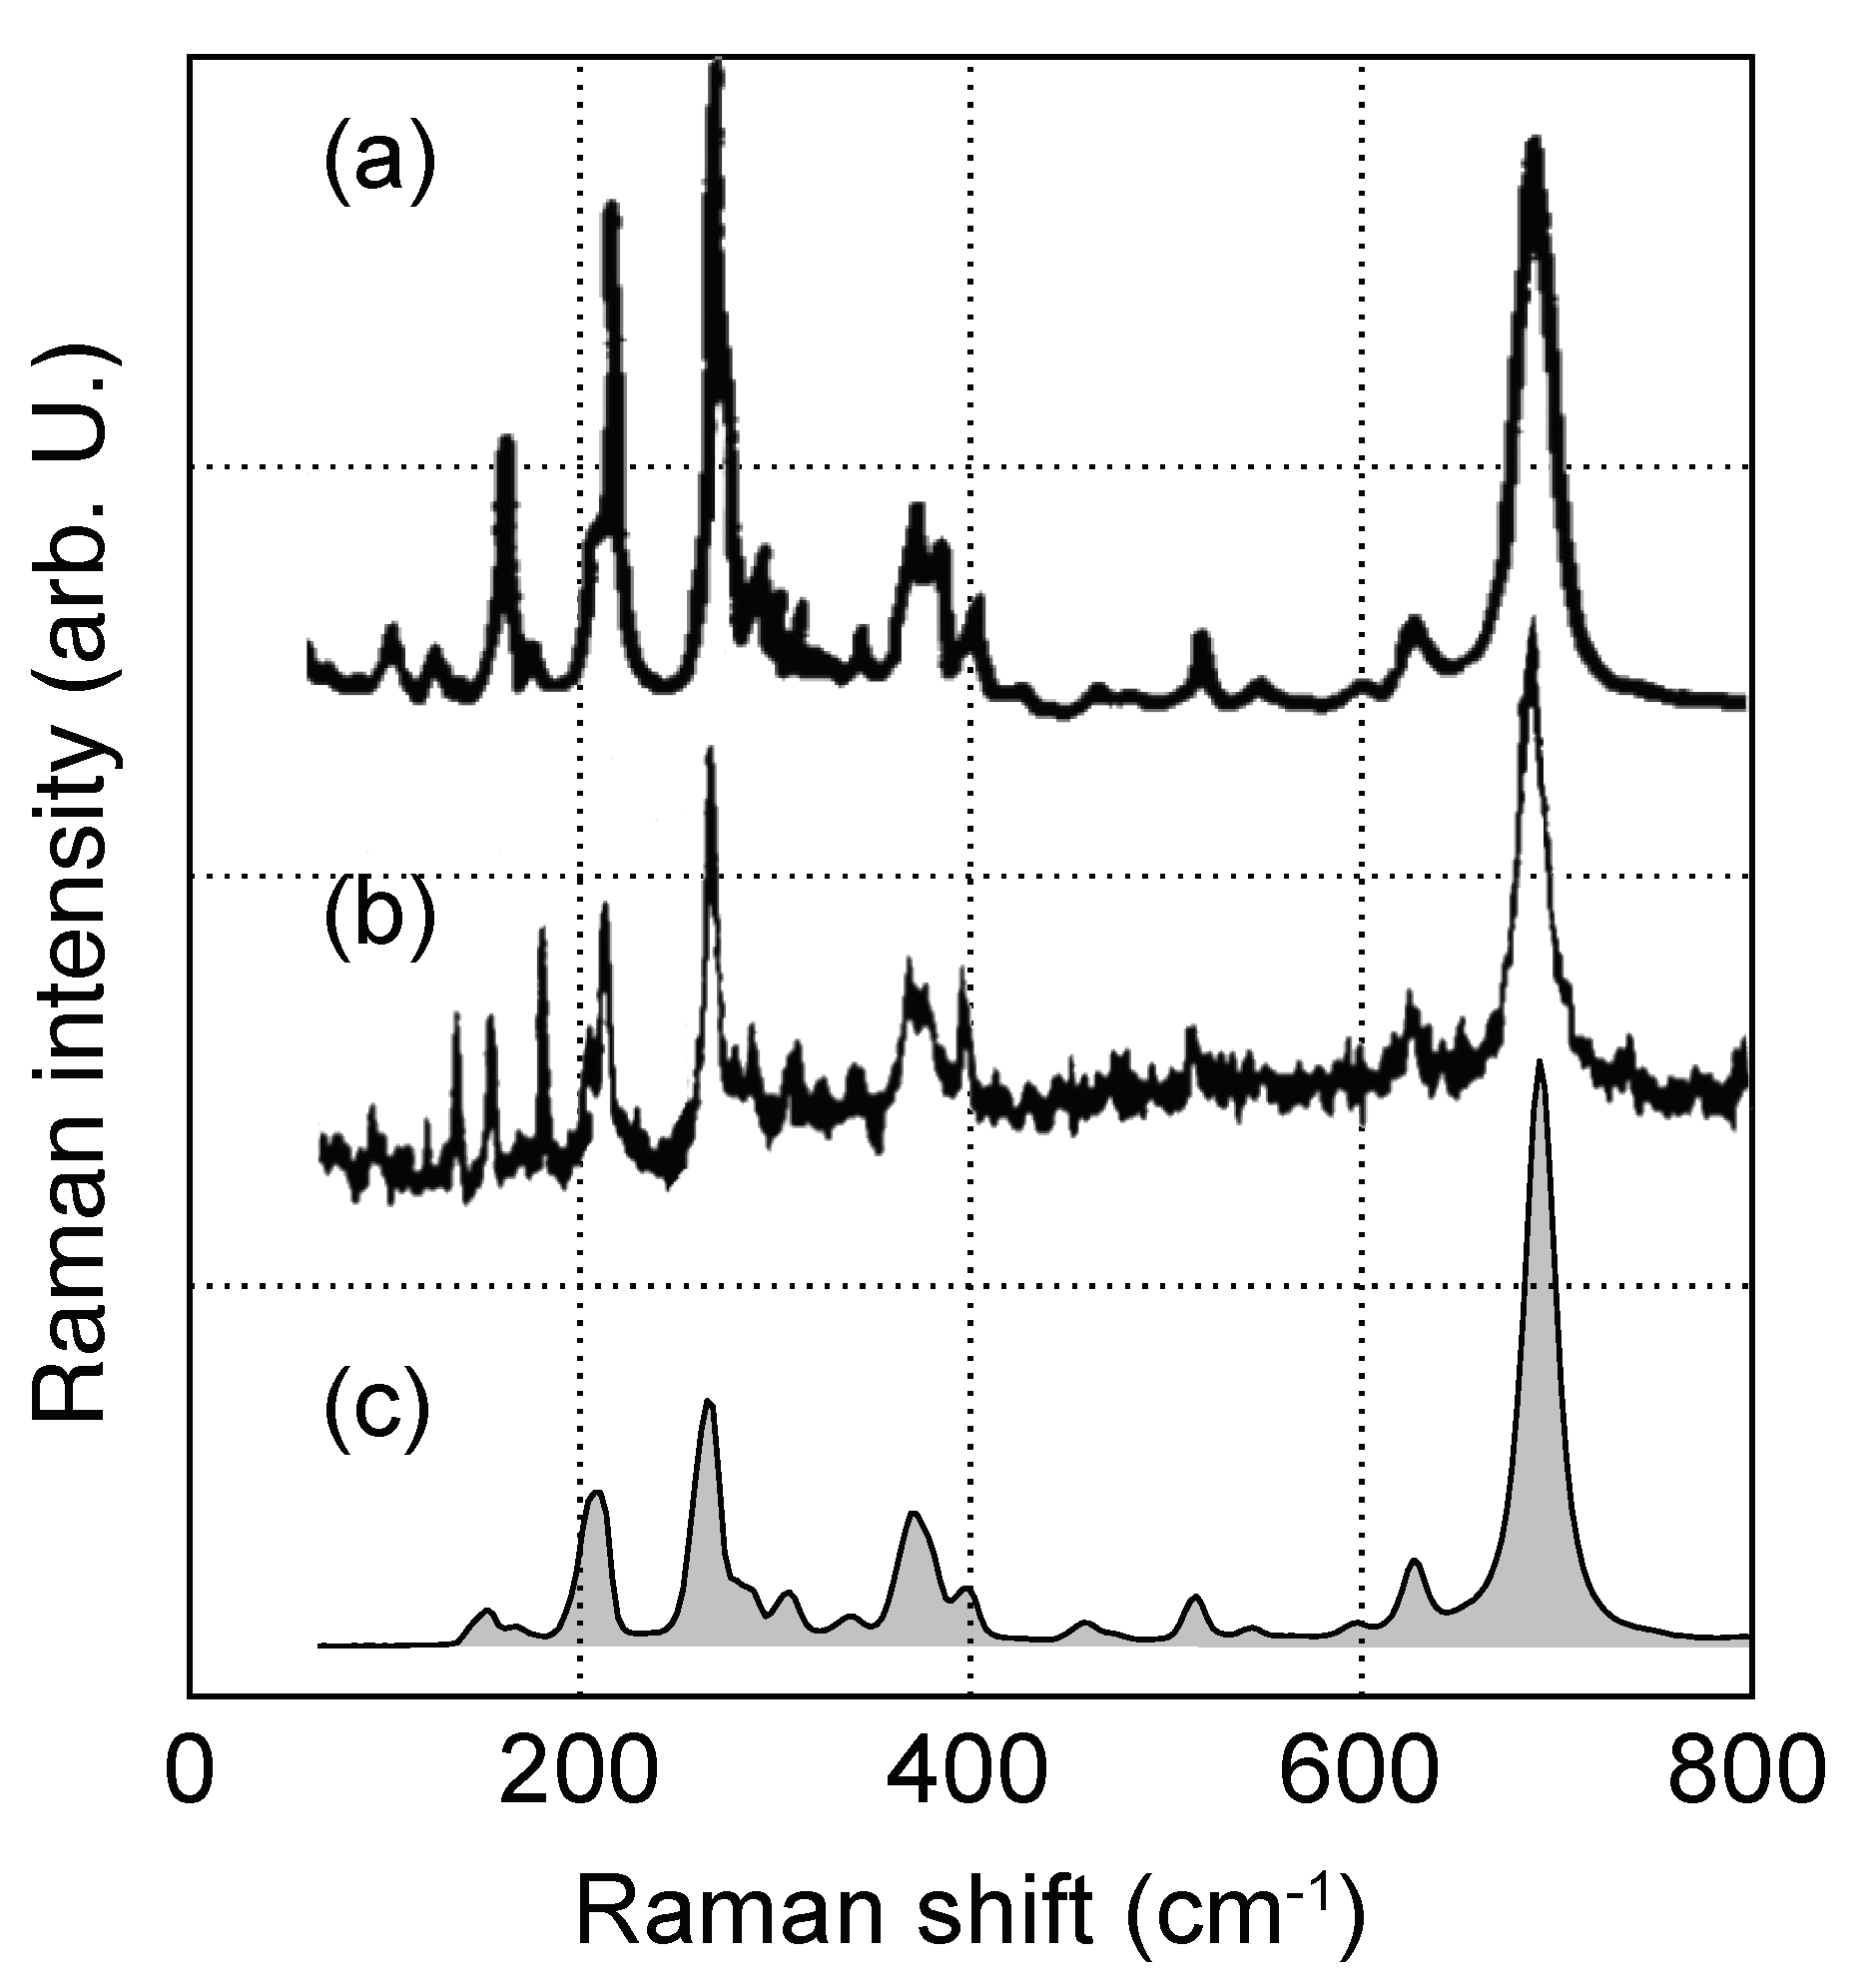
3.2. Raman Spectra
4. Summary and Conclusions
Author Contributions
Funding
Data Availability Statement
Conflicts of Interest
References
- Bierlein, J.D.; Vanherzeele, H. Potassium titanyl phosphate: Properties and new applications. J. Opt. Soc. Am. B 1989, 6, 622. [Google Scholar] [CrossRef]
- Sorokina, N.I.; Voronkova, V.I. Structure and properties of crystals in the potassium titanyl phosphate family: A review. Crystallogr. Rep. 2007, 52, 80–93. [Google Scholar] [CrossRef]
- Padberg, L.; Santandrea, M.; Rüsing, M.; Brockmeier, J.; Mackwitz, P.; Berth, G.; Zrenner, A.; Eigner, C.; Silberhorn, C. Characterisation of width-dependent diffusion dynamics in rubidium-exchanged KTP waveguides. Opt. Express 2020, 28, 24353. [Google Scholar] [CrossRef]
- Kores, C.C.; Canalias, C.; Laurell, F. Quasi-phase matching waveguides on lithium niobate and KTP for nonlinear frequency conversion: A comparison. APL Photonics 2021, 6, 091102. [Google Scholar] [CrossRef]
- Hagerman, M.E.; Poeppelmeier, K.R. Review of the Structure and Processing-Defect-Property Relationships of Potassium Titanyl Phosphate: A Strategy for Novel Thin-Film Photonic Devices. Chem. Mater. 1995, 7, 602–621. [Google Scholar] [CrossRef]
- Padberg, L.; Quiring, V.; Bocchini, A.; Santandrea, M.; Gerstmann, U.; Schmidt, W.G.; Silberhorn, C.; Eigner, C. DC Ionic Conductivity in KTP and Its Isomorphs: Properties, Methods for Suppression, and Its Connection to Gray Tracking. Crystals 2022, 12, 1359. [Google Scholar] [CrossRef]
- Harder, G.; Ansari, V.; Brecht, B.; Dirmeier, T.; Marquardt, C.; Silberhorn, C. An optimized photon pair source for quantum circuits. Opt. Express 2013, 21, 13975. [Google Scholar] [CrossRef]
- Bierlein, J.D.; Ferretti, A.; Brixner, L.H.; Hsu, W.Y. Fabrication and characterization of optical waveguides in KTiOPO4. Appl. Phys. Lett. 1987, 50, 1216–1218. [Google Scholar] [CrossRef]
- Risk, W.P. Fabrication and characterization of planar ion-exchanged KTiOPO4 waveguides for frequency doubling. Appl. Phys. Lett. 1991, 58, 19–21. [Google Scholar] [CrossRef]
- Atuchin, V.V.; Bobkov, I.N.; Ziling, C.C.; Plotnikov, A.E.; Semenenko, V.N.; Terpugov, N.V. Optical properties of Cs:KTiOPO4 and Rb:KTiOPO4 waveguide layers. Guid. Wave Opt. 1993, 1932, 152–172. [Google Scholar] [CrossRef]
- Atuchin, V.V.; Plotnikov, A.E.; Ziling, C.C.; Isaenko, L.I.; Tjurikov, V.I. Cs:KTiOAsO4 optical ion-exchanged waveguides. In Proceedings of the Second International Conference on Optical Information Processing, St. Petersburg, Russia, 17–21 June 1996; Volume 2969, pp. 261–264. [Google Scholar] [CrossRef]
- Savatinova, I.; Savova, I.; Liarokapis, E.; Ziling, C.C.; Atuchin, V.V.; Armenise, M.N.; Passaro, V.M.N. A comparative analysis of Rb:KTP and Cs:KTP optical waveguides. J. Phys. D Appl. Phys. 1998, 31, 1667–1672. [Google Scholar] [CrossRef]
- Laurell, F.; Calmano, T.; Müller, S.; Zeil, P.; Canalias, C.; Huber, G. Laser-written waveguides in KTP for broadband Type II second harmonic generation. Opt. Express 2012, 20, 22308. [Google Scholar] [CrossRef] [PubMed]
- Yin, J.J.; Lu, F.; Ming, X.B.; Qin, Z.H.; Ma, Y.J. Theoretical modeling and experiment of refractive index change in He+ ion-implanted KTP waveguide. Appl. Opt. 2012, 51, 2400. [Google Scholar] [CrossRef] [PubMed]
- Eigner, C.; Santandrea, M.; Padberg, L.; Volk, M.F.; Rüter, C.E.; Herrmann, H.; Kip, D.; Silberhorn, C. Periodically poled ridge waveguides in KTP for second harmonic generation in the UV regime. Opt. Express 2018, 26, 28827. [Google Scholar] [CrossRef]
- Allgaier, M.; Ansari, V.; Sansoni, L.; Eigner, C.; Quiring, V.; Ricken, R.; Harder, G.; Brecht, B.; Silberhorn, C. Highly efficient frequency conversion with bandwidth compression of quantum light. Nat. Commun. 2017, 8, 14288. [Google Scholar] [CrossRef]
- Canalias, C.; Pasiskevicius, V.; Laurell, F. Periodic Poling of KTiOPO4: From Micrometer to Sub-Micrometer Domain Gratings. Ferroelectrics 2006, 340, 27–47. [Google Scholar] [CrossRef]
- Canalias, C.; Pasiskevicius, V.; Clemens, R.; Laurell, F. Submicron periodically poled flux-grown KTiOPO4. Appl. Phys. Lett. 2003, 82, 4233–4235. [Google Scholar] [CrossRef]
- Mutter, P.; Zukauskas, A.; Canalias, C. Domain dynamics in coercive-field engineered sub-µm periodically poled Rb-doped KTiOPO4. Opt. Mater. Express 2022, 12, 4332. [Google Scholar] [CrossRef]
- Canalias, C.; Pasiskevicius, V. Mirrorless optical parametric oscillator. Nat. Photonics 2007, 1, 459–462. [Google Scholar] [CrossRef]
- Cai, W.H.; Wei, B.; Wang, S.; Jin, R.B. Counter-propagating spectrally uncorrelated biphotons at 1550 nm generated from periodically poled MTiOXO4 (M = K, Rb, Cs; X = P, As). J. Opt. Soc. Am. B 2020, 37, 3048. [Google Scholar] [CrossRef]
- Luo, K.H.; Ansari, V.; Massaro, M.; Santandrea, M.; Eigner, C.; Ricken, R.; Herrmann, H.; Silberhorn, C. Counter-propagating photon pair generation in a nonlinear waveguide. Opt. Express 2020, 28, 3215. [Google Scholar] [CrossRef] [PubMed]
- Wittborn, J.; Canalias, C.; Rao, K.V.; Clemens, R.; Karlsson, H.; Laurell, F. Nanoscale imaging of domains and domain walls in periodically poled ferroelectrics using atomic force microscopy. Appl. Phys. Lett. 2002, 80, 1622–1624. [Google Scholar] [CrossRef]
- Lindgren, G.; Canalias, C. Conductive atomic force microscopy studies of charged domain walls in KTiOPO4. AIP Adv. 2018, 8, 085214. [Google Scholar] [CrossRef]
- Reitzig, S.; Rüsing, M.; Zhao, J.; Kirbus, B.; Mookherjea, S.; Eng, L.M. “Seeing Is Believing”—In-Depth Analysis by Co-Imaging of Periodically-Poled X-Cut Lithium Niobate Thin Films. Crystals 2021, 11, 288. [Google Scholar] [CrossRef]
- Spychala, K.J.; Mackwitz, P.; Rüsing, M.; Widhalm, A.; Berth, G.; Silberhorn, C.; Zrenner, A. Nonlinear focal mapping of ferroelectric domain walls in LiNbO3: Analysis of the SHG microscopy contrast mechanism. J. Appl. Phys. 2020, 128, 234102. [Google Scholar] [CrossRef]
- Bozhevolnyi, S.I.; Hvam, J.M.J.M.; Pedersen, K.; Laurell, F.; Karlsson, H.H.; Skettrup, T.; Belmonte, M. Second-harmonic imaging of ferroelectric domain walls. Appl. Phys. Lett. 1998, 73, 1814–1816. [Google Scholar] [CrossRef]
- Brockmeier, J.; Mackwitz, P.W.M.; Rüsing, M.; Eigner, C.; Padberg, L.; Santandrea, M.; Silberhorn, C.; Zrenner, A.; Berth, G. Non-Invasive Visualization of Ferroelectric Domain Structures on the Non-Polar y-Surface of KTiOPO4 via Raman Imaging. Crystals 2021, 11, 1086. [Google Scholar] [CrossRef]
- Rüsing, M.; Sanna, S.; Neufeld, S.; Berth, G.; Schmidt, W.G.; Zrenner, A.; Yu, H.; Wang, Y.; Zhang, H. Vibrational properties of LiNb1−xTaxO3 mixed crystals. Phys. Rev. B 2016, 93, 184305. [Google Scholar] [CrossRef]
- Rüsing, M. In Depth Raman Analysis of the Ferroelectrics KTiOPO4 and LiNbO3-Role of Domain Boundaries and Defects. Ph.D. Thesis, University Paderborn, Paderborn, Germany, 2018. [Google Scholar] [CrossRef]
- Rüsing, M.; Eigner, C.; Mackwitz, P.; Berth, G.; Silberhorn, C.; Zrenner, A. Identification of ferroelectric domain structure sensitive phonon modes in potassium titanyl phosphate: A fundamental study. J. Appl. Phys. 2016, 119, 044103. [Google Scholar] [CrossRef]
- Kugel, G.E.; Bréhat, F.; Wyncket, B.; Fontana, M.D.; Marnier, G.; Carabatos-Nedelec, C.; Mangin, J.; BBréhat, F.; Wyncket, B.; Fontana, M.D.; et al. The vibrational spectrum of a KTiOPO4 single crystal studied by Raman and infrared reflectivity spectroscopy. J. Phys. C Solid State Phys. 1988, 21, 5565–5583. [Google Scholar] [CrossRef]
- Watson, G.H. Polarized Raman spectra of ktioaso4 and isomorphic nonlinear-optical crystals. J. Raman Spectrosc. 1991, 22, 705–713. [Google Scholar] [CrossRef]
- Bushiri, M.; Mahadevan Pillai, V.; Ratheesh, R.; Nayar, V. Raman spectra of KTP crystal in an in situ electric field. J. Phys. Chem. Solids 1999, 60, 1983–1988. [Google Scholar] [CrossRef]
- Sanna, S.; Neufeld, S.; Rüsing, M.; Berth, G.; Zrenner, A.; Schmidt, W.G. Raman scattering efficiency in LiTaO3 and LiNbO3 crystals. Phys. Rev. B 2015, 91, 224302. [Google Scholar] [CrossRef]
- Liebhaber, M.; Halbig, B.; Bass, U.; Geurts, J.; Neufeld, S.; Sanna, S.; Schmidt, W.G.; Speiser, E.; Räthel, J.; Chandola, S.; et al. Vibration eigenmodes of the Au-5×2/Si(111) surface studied by Raman spectroscopy and first-principles calculations. Phys. Rev. B 2016, 94, 235304. [Google Scholar] [CrossRef]
- Giannozzi, P.; Baroni, S.; Bonini, N.; Calandra, M.; Car, R.; Cavazzoni, C.; Ceresoli, D.; Chiarotti, G.L.; Cococcioni, M.; Dabo, I.; et al. QUANTUM ESPRESSO: A modular and open-source software project for quantum simulations of materials. J. Phys. Condens. Matter 2009, 21, 395502. [Google Scholar] [CrossRef]
- Perdew, J.P.; Zunger, A. Self-interaction correction to density-functional approximations for many-electron systems. Phys. Rev. B 1981, 23, 5048–5079. [Google Scholar] [CrossRef]
- Roth, M. Stoichiometry and Domain Structure of KTP-Type Nonlinear Optical Crystals. In Springer Handbook of Crystal Growth; Springer: Berlin/Heidelberg, Germany, 2010; pp. 691–723. [Google Scholar] [CrossRef]
- Lazzeri, M.; Mauri, F. High-order density-matrix perturbation theory. Phys. Rev. B 2003, 68, 161101. [Google Scholar] [CrossRef]
- Lazzeri, M.; Mauri, F. First-Principles Calculation of Vibrational Raman Spectra in Large Systems: Signature of Small Rings in Crystalline SiO. Phys. Rev. Lett. 2003, 90, 036401. [Google Scholar] [CrossRef]
- Berth, G.; Hahn, W.; Wiedemeier, V.; Zrenner, A.; Sanna, S.; Schmidt, W.G. Imaging of the Ferroelectric Domain Structures by Confocal Raman Spectroscopy. Ferroelectrics 2011, 420, 44–48. [Google Scholar] [CrossRef]
- Shen, Z.X.; Wang, X.B.; Li, H.P.; Tang, S.H.; Zhou, F. Pressure-Induced Phase Transitions of KTiOAsO4 by Raman Spectroscopy. Rev. High Pressure Sci. Technol. 1998, 7, 748–750. [Google Scholar] [CrossRef]
- Guo, A.R.; Tu, C.S.; Tao, R.; Katiyar, R.S.; Guo, R.; Bhalla, A.S. Raman scattering in CsTiOAsO4, single crystal. Ferroelectr. Lett. Sect. 1996, 21, 71–77. [Google Scholar] [CrossRef]
- Furusawa, S.; Hayasi, H.; Ishibashi, Y.; Miyamoto, A.; Sasaki, T. Raman Scattering Study of KTiOPO4 (KTP) Single Crystal. J. Phys. Soc. Jpn. 1991, 60, 2470–2474. [Google Scholar] [CrossRef]
- Pugachev, A.M.; Surovtsev, N.V.; Voronkova, V.I.; Semenenko, V.N.; Yanovskii, V.K.; Atuchin, V.V. Comparative study of TlTiOPO4 and KTiOPO4 crystals by Raman spectroscopy. J. Ceram. Process. Res. 2003, 4, 101–103. [Google Scholar]
- Kresse, G.; Furthmüller, J. Efficient iterative schemes for ab initio total-energy calculations using a plane-wave basis set. Phys. Rev. B 1996, 54, 11169–11186. [Google Scholar] [CrossRef] [PubMed]
- Tu, C.S.; Guo, A.R.; Tao, R.; Katiyar, R.S.; Guo, R.; Bhalla, A.S. Temperature dependent Raman scattering in KTiOPO4 and KTiOAsO4 single crystals. J. Appl. Phys. 1996, 79, 3235. [Google Scholar] [CrossRef]
- Voronko, Y.; Dyakov, V.A.; Kudryavtsev, A.; Osiko, V.; Sobol, A.; Sorokin, E. Raman scattering study of phase transformations in KTP. Sov. Phys. Solid State 1989, 31, 1736. [Google Scholar]


| Scattering | Observable | Relative Intensity | Relative Intensity |
|---|---|---|---|
| Geometry | Phonon Branch | (Experimental) | (Calculated) |
| -TO | 4.2 | 8.1 | |
| -LO | 1.8 | - | |
| -TO | 11.2 | 12.7 | |
| -LO | 9.0 | - | |
| -TO | 26.3 | 31.9 | |
| -TO | 26.3 | 31.9 | |
| -TO | 1.0 | 1.0 | |
| -TO | 1.9 | 2.2 | |
| -TO | 10.2 | 9.3 |
Disclaimer/Publisher’s Note: The statements, opinions and data contained in all publications are solely those of the individual author(s) and contributor(s) and not of MDPI and/or the editor(s). MDPI and/or the editor(s) disclaim responsibility for any injury to people or property resulting from any ideas, methods, instructions or products referred to in the content. |
© 2023 by the authors. Licensee MDPI, Basel, Switzerland. This article is an open access article distributed under the terms and conditions of the Creative Commons Attribution (CC BY) license (https://creativecommons.org/licenses/by/4.0/).
Share and Cite
Neufeld, S.; Gerstmann, U.; Padberg, L.; Eigner, C.; Berth, G.; Silberhorn, C.; Eng, L.M.; Schmidt, W.G.; Ruesing, M. Vibrational Properties of the Potassium Titanyl Phosphate Crystal Family. Crystals 2023, 13, 1423. https://doi.org/10.3390/cryst13101423
Neufeld S, Gerstmann U, Padberg L, Eigner C, Berth G, Silberhorn C, Eng LM, Schmidt WG, Ruesing M. Vibrational Properties of the Potassium Titanyl Phosphate Crystal Family. Crystals. 2023; 13(10):1423. https://doi.org/10.3390/cryst13101423
Chicago/Turabian StyleNeufeld, Sergej, Uwe Gerstmann, Laura Padberg, Christof Eigner, Gerhard Berth, Christine Silberhorn, Lukas M. Eng, Wolf Gero Schmidt, and Michael Ruesing. 2023. "Vibrational Properties of the Potassium Titanyl Phosphate Crystal Family" Crystals 13, no. 10: 1423. https://doi.org/10.3390/cryst13101423