Article

Flux Growth and Raman Spectroscopy Study of Cu2CrBO5 Crystals

1
Kirensky Institute of Physics, Federal Research Center KSC SB RAS, 660036 Krasnoyarsk, Russia
2
Institute of Engineering Physics and Radioelectronic, Siberian Federal University, 660041 Krasnoyarsk, Russia
3
Department of Physics, Siberian State University of Science and Technologies, 660037 Krasnoyarsk, Russia
4
Department of Physics, Far Eastern State Transport University, 680021 Khabarovsk, Russia
5
Federal Research Center “Krasnoyarsk Science Center of the Siberian Branch of the Russian Academy of Sciences”, 660036 Krasnoyarsk, Russia
*
Author to whom correspondence should be addressed.
Crystals 2023, 13(10), 1415; https://doi.org/10.3390/cryst13101415
Submission received: 26 August 2023 / Revised: 12 September 2023 / Accepted: 19 September 2023 / Published: 23 September 2023
(This article belongs to the Special Issue Raman Spectroscopy of Crystalline Materials and Nanostructures)

Abstract

:
Multicomponent flux systems based on both Li2WO4-B2O3-Li2O-CuO-Cr2O3 and Bi2O3-MoO3-B2O3-Na2O-CuO-Cr2O3 were studied in order to grow Cu2CrBO5 crystals. The conditions for Cu2CrBO5 crystallization were investigated by varyingthe component ratios, and the peculiarities of their interaction were characterized by studying the formation sequence of high-temperature crystallizing phases. Special attention was paid to the problem of Cr2O3 solubility. Phase boundaries between CuCrO2, Cu2CrO4, and Cu2CrBO5 were considered. The crystal structure of the obtained samples was studied viasingle crystal and powder X-ray diffraction. The chemical composition of the grown crystals was examined using the EDX technique. Anactual ratio of Cu:Cr = 1.89:1.11 was found for Cu2CrBO5 grown from the lithium-tungstate system, which showed a small deviation from 2:1, implying the presence of a part of bivalent Cr2+ in the samples. Anomalies in the thermal dependence of magnetization were analyzed and compared with the previously obtained data for Cu2CrBO5. The anomaly at TC ≈ 42 K and the antiferromagnetic phase transition at TN ≈ 119 K were considered. Polarized Raman spectra of Cu2CrBO5 were obtained for the first time, and a comparative analysis of the obtained data with other monoclinic and orthorhombic ludwigites is presented. Along with the polarized room temperature spectra, the thermal evolution of Raman modes near the antiferromagnetic phase transition temperature TN ≈ 119 K is provided. The influence of the magnetic phase transition on the Raman spectra of Cu2CrBO5 is discussed.

1. Introduction

Cu2CrBO5 is a new compound in the ludwigite family. It was obtained and studied as a polycrystal sample for the first time several years ago [1]. This ludwigite is the first and the only one known to demonstrateamagnetoelectric effect, since data on similar studies of other ludwigites are absent. The presence of magnetoelectric polarization in Cu2CrBO5 is related to the copper subsystem. It is necessary to note that Cu2CrBO5 possesses structural cationic ordering. This is not typical for almost all heterometallic ludwigites due to the presence of four nonequivalent cation positions in the unit cell (Figure 1) [2,3,4,5]. The temperature of magnetic ordering in the copper-chromium ludwigite is quite high for the representatives of this family, with TN = 120K [1]. Moreover, the thermal dependence of the magnetic properties of Cu2CrBO5 behaves non-monotonically in the low-temperature phase. It possesses additional peculiarities such as the M(T) curve inflection and the temperature range in which the spin-flop transition occurs [6]. The magnetic structure of Cu2CrBO5 was studied usingpowder neutron diffraction [1]. An incommensurate antiferromagnetic phase was found below TN, which was characterized by geometrical frustrations of the exchange interaction.
For a detailed study of the unusual properties of the Cu2CrBO5 ludwigite, especially that of the magnetoelectric effect, it is necessary to conduct orientational experiments on single crystal samples. In this paper, we expand the research in this direction using the flux growth technique. This is the most widelyused method for obtaining single crystal samples of the oxyborates with a ludwigite structure due to the presence of growth anisotropy. Natural faceting of single crystals and the possibility of using different solvent types for individual synthesis of different compounds are undoubtedly some merits of this technique [7].
The research stepsinclude the selection of the initial solvent, establishment of the Cu2CrBO5 single crystal phase, study of the competition between high-temperature crystallizing phases in the system and theiroptimization. In this paper, we study the possibility of growing a copper-chromium ludwigite viathe flux method using two solvents, Li2WO4-B2O3 and Bi2O3-MoO3-B2O3-Na2O.
Despite the presence of growth anisotropy, copper ludwigite crystals achieve significant dimensions in comparison with other ludwigites, as was shown on the example of Cu2FeBO5 [8] and Cu2MnBO5 [9]. The size of these compounds allows one to carry out different orientational studies of the physical properties. However, Cu2CrBO5 behaves differently atthe early growth stage, which is caused by the infusibility of Cr2O3 oxide and its low solubility in many solvents [6]. The starting point for the search of a flux system appropriate for growing Cu2CrBO5isthe systems used earlier for other copper ludwigites [8,9]. Also, one of the main problems is studying the sequence of high-temperature crystallizing phases in the chosen fluxes, and the emphasis placed on the valence state transformation of chromium cations similarly to manganese-containing ludwigites.
In this research, we present the possibility of growing Cu2CrBO5 crystals viathe flux technique using two different solvents based on Li2WO4-Li2O-B2O3 and Bi2O3-MoO3-B2O3-Na2O, and through structural analysis of the obtained phases, study of the thermal and field anomalies of magnetization, and the analyses of the polarized (at room temperature, T = 295K) and thermal (in the vicinity of magnetic phase transition temperature) Raman spectra of Cu2CrBO5.

2. Materials and Methods

2.1. Flux Growth

To study the growth peculiarities, the flux method was used. Samples were grown at atmospheric pressure using a resistance furnace equipped with silicon-carbide heaters. The working temperature range was T = 750–1150 °C. For each experiment, the flux was prepared in a platinum crucible (V = 100cm3) at T = 1000–1100 °C viasequential melting of the solvent and soluble (crystal forming oxides) components. The prepared fluxes were homogenized during 3 h at the preparation temperature. Then, the sequence of high-temperature crystallizing phases was studied in the prepared fluxes. The crystal formations were estimated using visual observation and sample selection. To obtain a sample in the definite point of the phase diagram of the multicomponent flux system, the following order of the temperature change was used: after homogenization, the temperature in the furnace was rapidly lowered at a rate of 100 °C/h down to a definite temperature Tstart = (Tsat−10) °C, and then lowered slowly at a rate of 4–8 °C/day. After the growth stage wascompleted, the remainder flux was removed from the crystals via etching in a 20% aqueous solution of HNO3.

2.2. Energy Dispersive X-ray Spectroscopy (EDX)

To study the actual chemical composition of the obtained samples, energy dispersive X-ray spectroscopy (EDX) was used. The single crystal samples were fixed on an aluminum table using a double-sided carbon tape. Then, the table with the samples was placed into the working chamber of a scanning electron microscope Hitachi SU3500 (Hitachi, Japan) with a built-in energy dispersive detector Bruker XFlash6160 (Bruker, Germany). To obtain electron micrographs, an accelerating voltage of 20 kV and a cathode brightness of 60 arb. units were set, and no changes were carried out for obtaining all the subsequent images. The observation was carried out in the backscattered electron mode (BSE).

2.3. X-ray Diffraction

The powder diffraction data of the obtained samples for the Rietveld analysis were collected at room temperature with a Haoyuan DX-2700BH (Haoyuan, China) powder diffractometer (Cu-Kα radiation) and a linear detector. The step size of 2θ was 0.01°, and the counting time was 20 s/deg. Rietveld refinement was performed using TOPAS 4.2 [10]. The powders were obtained via the grinding of the crystals.
The crystal structure of the single crystal samples was investigated viathe X-ray diffraction method at room temperature using a SMART APEX II diffractometer (Mo Kα, λ=0.7106 Å) (Bruker, Germany). The structures were solved withdirect methods using the package SHELXS and refined viathe anisotropic approach for all the atoms using the SHELXL program [11]. The structure test for the presence of missing symmetry elements and possible voids was created using the program PLATON [12]. The DIAMOND program was used for plotting the crystal structure [13].

2.4. Measurements of the Magnetic Properties

Thermal and field magnetization dependences of the synthesized samples were obtained in the temperature range of 4.2–300K and in the magnetic fields up to 9T using PPMS-9 (Quantum Design). The thermal dependences of magnetization of Cu2CrBO5 were measured in the FC (sample cooling in a non-zero magnetic field) and ZFC modes (sample heating in a non-zero magnetic field after cooling in a zero magnetic field).The measurements were carried out using the polycrystal samples.

2.5. Raman Spectroscopy

Raman spectra of the obtained single crystal samples were acquired at room temperature in the spectral range of 20–1400cm−1 in the backscattering geometry, using a Horiba Jobin Yvon T64000 (Horiba, France) spectrometer equipped with a triple monochromator in a subtractive mode. The spectral resolution was 2cm−1 (this resolution was achieved using 1800 str/mm gratings and 100 μm slits) with adot density of3pixel/cm−1. The spectra were excited usingradiation from a solid-state single-mode laser Spectra-Physics Excelsior-532-300-CDRH (USA) with awavelength of 532nm and power of <1mW. Scattered radiation was collected viaa microscope based on Olympus BX-41 through the objective Olympus MPlan50x with the aperture number N.A. = 0.75. The accumulation time for one spectrum was about 15 min.
Polarized Raman spectra were obtained at room temperature. For this purpose, one crystal with the form of an elongated prism and a size of about 0.03×0.03×0.1mm3 was selected. The experiment was conducted with the parallel (HH) and cross-parallel (HV) polarization of the incident and scattered beams to study the angular dependence of intensities of the Raman spectral lines on the polarization direction of the incident and scattered radiationusingbackscattering geometry. The shift inthe incidence point of exciting radiation was smaller than 2μm in a complete 2π revolution. The angular step was 10°. This experiment is similar to the work [14], wherein it is explained in detail.
The temperature Raman experiment was controlled with a Linkam THMS600 micro-cryostage (Linkam Sci. Inst.). The sample was cooled in the range from 173K to 83K at a constant cooling rate of 3K/min. After reaching the given temperature, it was kept constant for 5 min to ensure uniform cooling of the system, and then, the Raman spectra were measured. The uncertainty of temperature stabilization during the Raman spectra acquisition was better than ±0.1K.
To quantitatively analyze the deconvoluted Raman spectra, we performed the spectral analysis with the Lorentz function,
I ( ω ) = 2 π A Γ 4 ω ω 0 2 + Γ 2
where A, ω0, ω, and Γ are the amplitude, position of the line center, wavenumber, and full width at half-maximum (FWHM), respectively. The analysis explanation is similar to the one given in [15].

3. Results

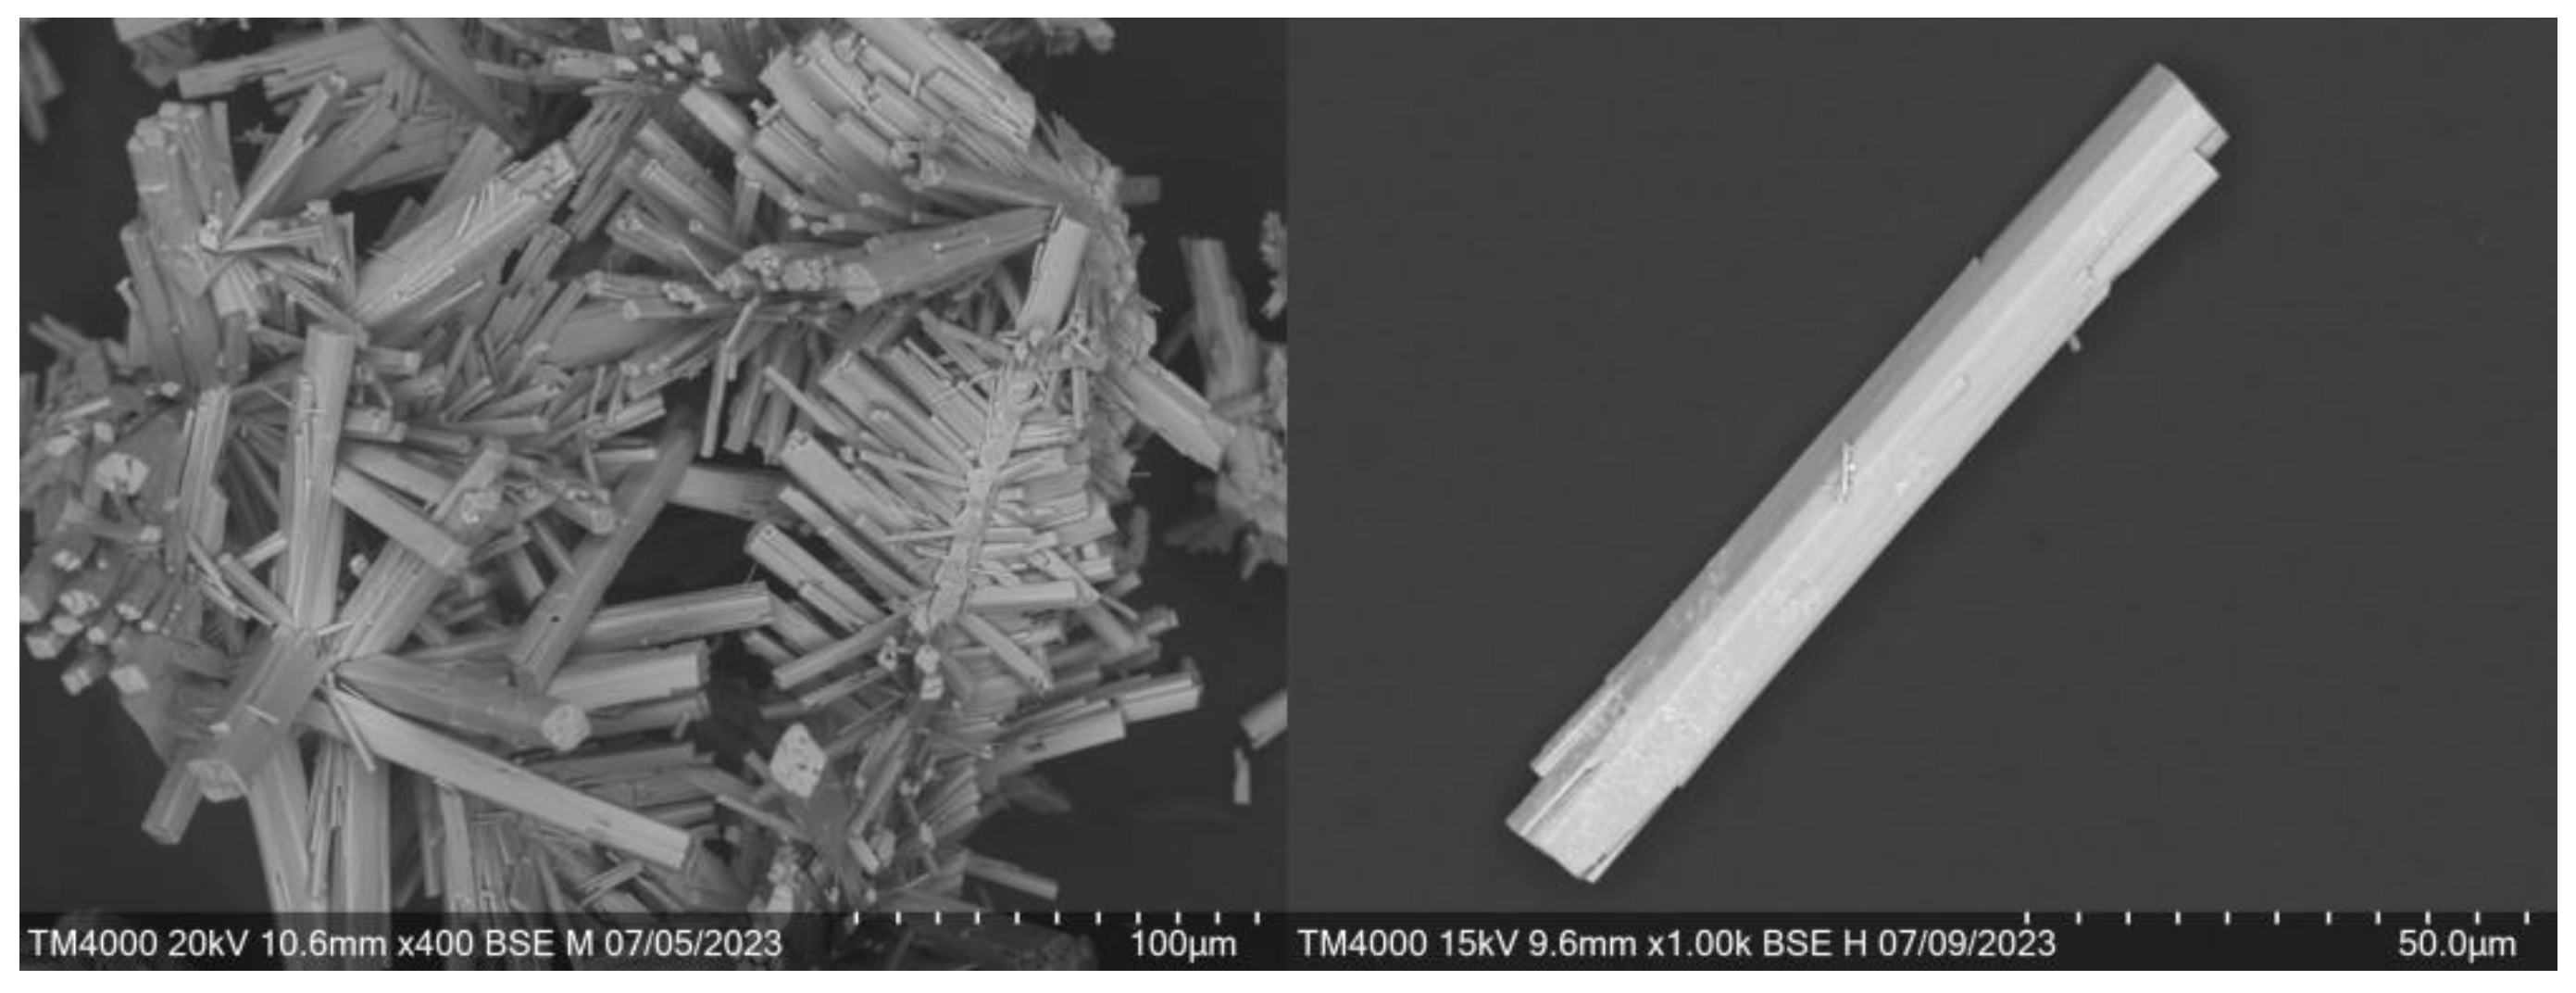
3.1. Results of the Flux Growth Study

The study of the flux growth using two types of solvents, Li2WO4-Li2O-B2O3 and Bi2O3-MoO3-B2O3-Na2O, can be divided into several stages, as described below.

3.1.1. Bi2O3-MoO3-B2O3-Na2O Based Flux

After taking into account a number of preliminary experiments, we searched for a flux system for Cu2CrBO5, which allowed us to choose the following starting system:
80 % m a s s . ( B i 2 M o 3 O 12 + 3 N a 2 O + 0.6 B 2 O 3 ) + 20 % m a s s . ( 2 C u O + 0.5 C r 2 O 3 + 0.5 B 2 O 3 )
The concentration of crystal forming oxides is n = 20%. A significant increase in the molar coefficient of sodium oxide (up to 3) in (1) is caused by the necessary formation of Na2MoO4-type bonds in the flux. For better solubility of chromium oxide, the Cr2O3powder was milled together with Bi2O3 and MoO3 powders to homogeneity, and then, B2O3 oxide was added. The obtained mixture was loaded to the crucible and homogenized at T = 1000 °C. Then, the powder of Na2CO3 and CuO was added in portions. After 3 h of homogenization at T = 1000 °C, the flux took the form ofa freely convective liquid. The probing showed the saturation temperature to beabout Tsat = 820 °C, and the high-temperature crystallizing phase was CuO, with the formation of black crystals in the form of long flattened prisms. Thus, despite low solubility, the crystallizing phase did not contain chromium, as the saturation temperature wasquite low.
The next stage of flux heating was performed at a higher temperature T = 1100 °C. At this temperature, due to the high concentration of the crystal formation oxides n, a mass crystallization of Cu+Cr3+O2 with the delafossite structure occurred. The crystals are represented with grey-green hexagonal plates [16]. There is usually a thermal limit at T = 1000 °C whenworking with copper-containing fluxes due to the decomposition of CuO at higher temperatures, accompanied by the appearance of Cu+2O and liberation of oxygen [17]. It is worth noting that in the case of Mn- and Fe-containing systems, CuO is also decomposed above T = 1000 °C, which manifests itself as sublimation of the flux upon the addition of CuO. However, no compounds with the delafossite structure were found in the experiments despite the existence of Cu+Mn3+O2 and Cu+Fe3+O2 [18].
The observed mass crystallization of chromium-containing phase at T = 1100 °C showed no dissolution of Cr2O3 at lower temperatures despite the visual control of the flux homogeneity, absence of precipitation, and sufficient convection. The increase in the temperature stimulated the dissolution process, and the formation of monovalent copper determined the high-temperature crystallizing phase of Cu+Cr3+O2.
Inthe next step, the flux system was optimized: a part of the solvent was significantly increased, copper oxide was introduced and the portion of boron oxide was increased. CuOwas introduced over the stoichiometry due to the elimination of the competing CrBO3 phase, and it correlated with the increase in B2O3, which is aimed at lowering the saturation temperature. The flux system where the Cu2CrBO5 phase was a high-temperature crystallizing phase was the following:
94.4 % m a s s . ( B i 2 O 3 + 1.39 M o O 3 + 0.5 N a 2 O + 4 B 2 O 3 + 1.1 C u O ) + 5.6 % m a s s . ( 2 C u O + 0.5 C r 2 O 3 + 0.5 B 2 O 3 )
Here, the concentration of crystal forming oxides is n = 5.6%. Crystals of Cu2CrBO5 in the form of dark (in a thin layer—green-brown ones), small and elongated prisms were obtained upon spontaneous crystallization from the flux system (2). The starting temperature was Tstart = 850 °C, and the cooling rate was dT/dt = 1 °C/day for 7 days. Thus, the occurrence of the crystal phase of Cu2CrBO5 is proven, and the possibility of obtaining this compound using fluxes based on Bi2O3-MoO3 diluted by B2O3 and Na2O is shown.

3.1.2. Li2WO4-Li2O-B2O3Based Flux

As it was shown in the previous section, the solubility of Cr2O3 plays an important role in the crystallization process of Cu2CrBO5 in the chosen flux system. This section presents the results of the crystallization study of ludwigite in the systems based on lithium-tungstate. Three independent experiments were carried out throughgradual changes in the flux composition with different ratios of the crystal formation oxides Cr2O3-CuO-B2O3: 1. stoichiometric composition of Cu2CrBO5; 2. composition corresponding to the stoichiometry of CuB2O4 metaborate without adding Cr2O3inthe initial stage; 3. composition corresponding to the stoichiometry of CrBO3 without adding CuOinthe initial stage.
The flux system with the initial composition corresponding to the stoichiometry of Cu2CrBO5 was
( 100 n ) % m a s s . ( L i 2 W O 4 + p B 2 O 3 + q L i 2 O + s C u O ) + n % m a s s . ( 2 C u O + 0.5 C r 2 O 3 + 0.5 B 2 O 3 )
where n is the concentration of the crystal formation oxides, and p and q are the molar coefficients corresponding to the contents of B2O3 and Li2O in the solvent, respectively. Inthe initial stage, the flux was taken without Li2O and CuO over the stoichiometry of ludwigite, i.e., q = 0 and s = 0. The boron oxide coefficient was p = 2. Due to the low solubility of Cr2O3,alow concentration n = 2.2–3.87% was chosen. The high-temperature crystallizing phase in this flux system was (Cu,Cr)WO4, which contained Cr2+ cations. The saturation temperature was Tsat = 860 °C. The formation mechanism of bonds of this type is similar to the one realized in the Mn-containing systems, which is due to the appearance of free WO3 in the flux.
Further, Li2O (up to q = 0.58) was added for the fixation of tungsten oxide. As a result, the color of the flux changed from dark-brown to green, which can be associated with a change in the valence state of chromium from 2+ to 3+. Probing showed the absence of crystallization down to the freezing point of the flux (~710 °C).With further increase in the concentration n in the flux, which was carried out to increase the saturation temperature, poor solubility of chromium oxide was observed: Cr2O3 powder was in the form of a suspension in the flux for a long time. To dissolve chromium oxide and to homogenize the flux, CuO was added to the solvent up to s = 0.64 over the ludwigite stoichiometry, with simultaneous mechanical mixing of the flux using a rotating platinum rodcrystalholder. In this way, the saturation temperature was increased to Tsat = 785 °C, and the desired phase of Cu2CrBO5 was obtained upon co-crystallization with CuO (due to the presence of a significant quantity of the copper oxide in the flux).
For further study of Cu2CrBO5 crystallization in the fluxes based on Li2WO4-Li2O-B2O3, the system without the initial addition of Cr2O3 (t = 0) and the one oriented to copper metaborate CuB2O4 were used:
( 100 n ) % m a s s . ( L i 2 W O 4 + r L i 2 O ) + n % m a s s . ( C u O + B 2 O 3 + t C r 2 O 3 )
The initial concentration of n = 50% was chosen due to the high solubility of copper and boron oxides in system (4), r = 0. The preparation and homogenization of this flux were performed at a temperature to T = 1000 °C, unlike other systems whereinthe top limit temperature was T = 1100 °C. The saturation temperature of the flux was Tsat ≈ 900 °C. The high-temperature crystallizing phase was that of CuB2O4, as expected. Then, Li2O was added (up to r = 0.5) for the fixation of WO3 to avoid the competing phase of (Cu,Cr)WO4 after the addition of chromium oxide. Due to the addition of a small amount of Cr2O3, up to t = 0.002, a change occurred in the high-temperature crystallizing phase ofCuO. Further, the phase of Cu3B2O6 with the kotoite structure was obtained at t = 0.003, and the desired phase of Cu2CrBO5 was achieved at t = 0.004.
At the next stage, the system with a high concentration of Cr2O3 was studied. This system was oriented to the initial stoichiometry of CrBO3:
( 100 n ) % m a s s . ( L i 2 W O 4 + p B 2 O 3 + q L i 2 O + s C u O ) + n % m a s s . ( C r 2 O 3 + B 2 O 3 + x C u O )
In the initial system, (5), CuO was absent (s = x = 0). The concentration was n = 5%, the molar coefficients of the boron and lithium oxides were p = 2 and q = 1, respectively. As expected, the high-temperature crystallizing phase was represented by the phase of small green hexagonal plates corresponding to CrBO3. The flux was a viscous one and possessed poor convection at the homogenization temperature T = 1100 °C, which was caused by the significant portion of the boron oxide. Further, CuO was added to the Cu2CrBO5 stoichiometry (x = 4). Simultaneously, a portion of copper was introduced to the solvent up to s = 0.69. Here, the saturation temperature was about Tsat ≈ 760 °C. Below this temperature, crystallization of the phase of small Cu2CrBO5 crystals was observed, which is in agreement with the powder X-ray diffraction data. Thus, the desired ludwigite phase can be obtained in this system via the addition of copper to the solvent over the stoichiometry.
It worth noting that the flux possessed a number of features associated with the low solubility of chromium oxide. To improve the solubility of Cr2O3, the portion of B2O3 in the solvent was increased, which allowed one to avoid precipitation and flux homogenization. However, the viscosity also significantly increased, and the mass crystallization of small crystals was observed in the static mode. To study the behavior of chromium oxide in this system and its influence on the saturation temperature, Cr2O3 was added along with Li2O (the initial powders of Cr2O3 and Li2CO3 were milled together and added to the flux in small portions for better solubility). The concentration was n = 8.45%, with no presence of aprecipitate. The additives changed the high-temperature crystallizing phase to CuO. Then, the concentration was increased again to n = 16%. There was still no precipitate in the crucible, and no crystallization occurred at T = 770 °C. The top temperature operating limit was T = 1100 °C.
Further, the homogenization temperature was increased to T = 1150 °C. As a result, a dense layer of CuCrO2 crystals formed during a short period of time (about 1 h) on the walls of the crucible. This is in agreement with the result obtained usingthe system based on Bi2O3-MoO3. Thus, the oversaturated flux was obtained with the addition of Cr2O3, which did not increase Tsat before the increase in the temperature. Then, the increase in the portion of the boron oxide to p = 3.35 made it possible to dissolve the delafossite crystals (CuCrO2) and to decrease the saturation temperature down to Tsat ≈ 970 °C. Under these conditions, the high-temperature crystallizing phase was CuCr2O4, containing bivalent copper, which was localized at the bottom of the crucible. The transition to the ludwigite phase was achieved by increasing the B2O3 coefficient up to p = 6. Co-crystallization of the ludwigite Cu2CrBO5 (small black elongated prisms growing from small centers) and spinel CuCr2O4 (small black octahedral crystals) was observed. The localization the ludwigite phase was at the top of the flux, with the larger boron oxide concentration. The localization of the spinel phase was observed at the bottom of the crucible. SEM image of as-grown crystals of Cu2CrBO5 is presented in Figure 2.

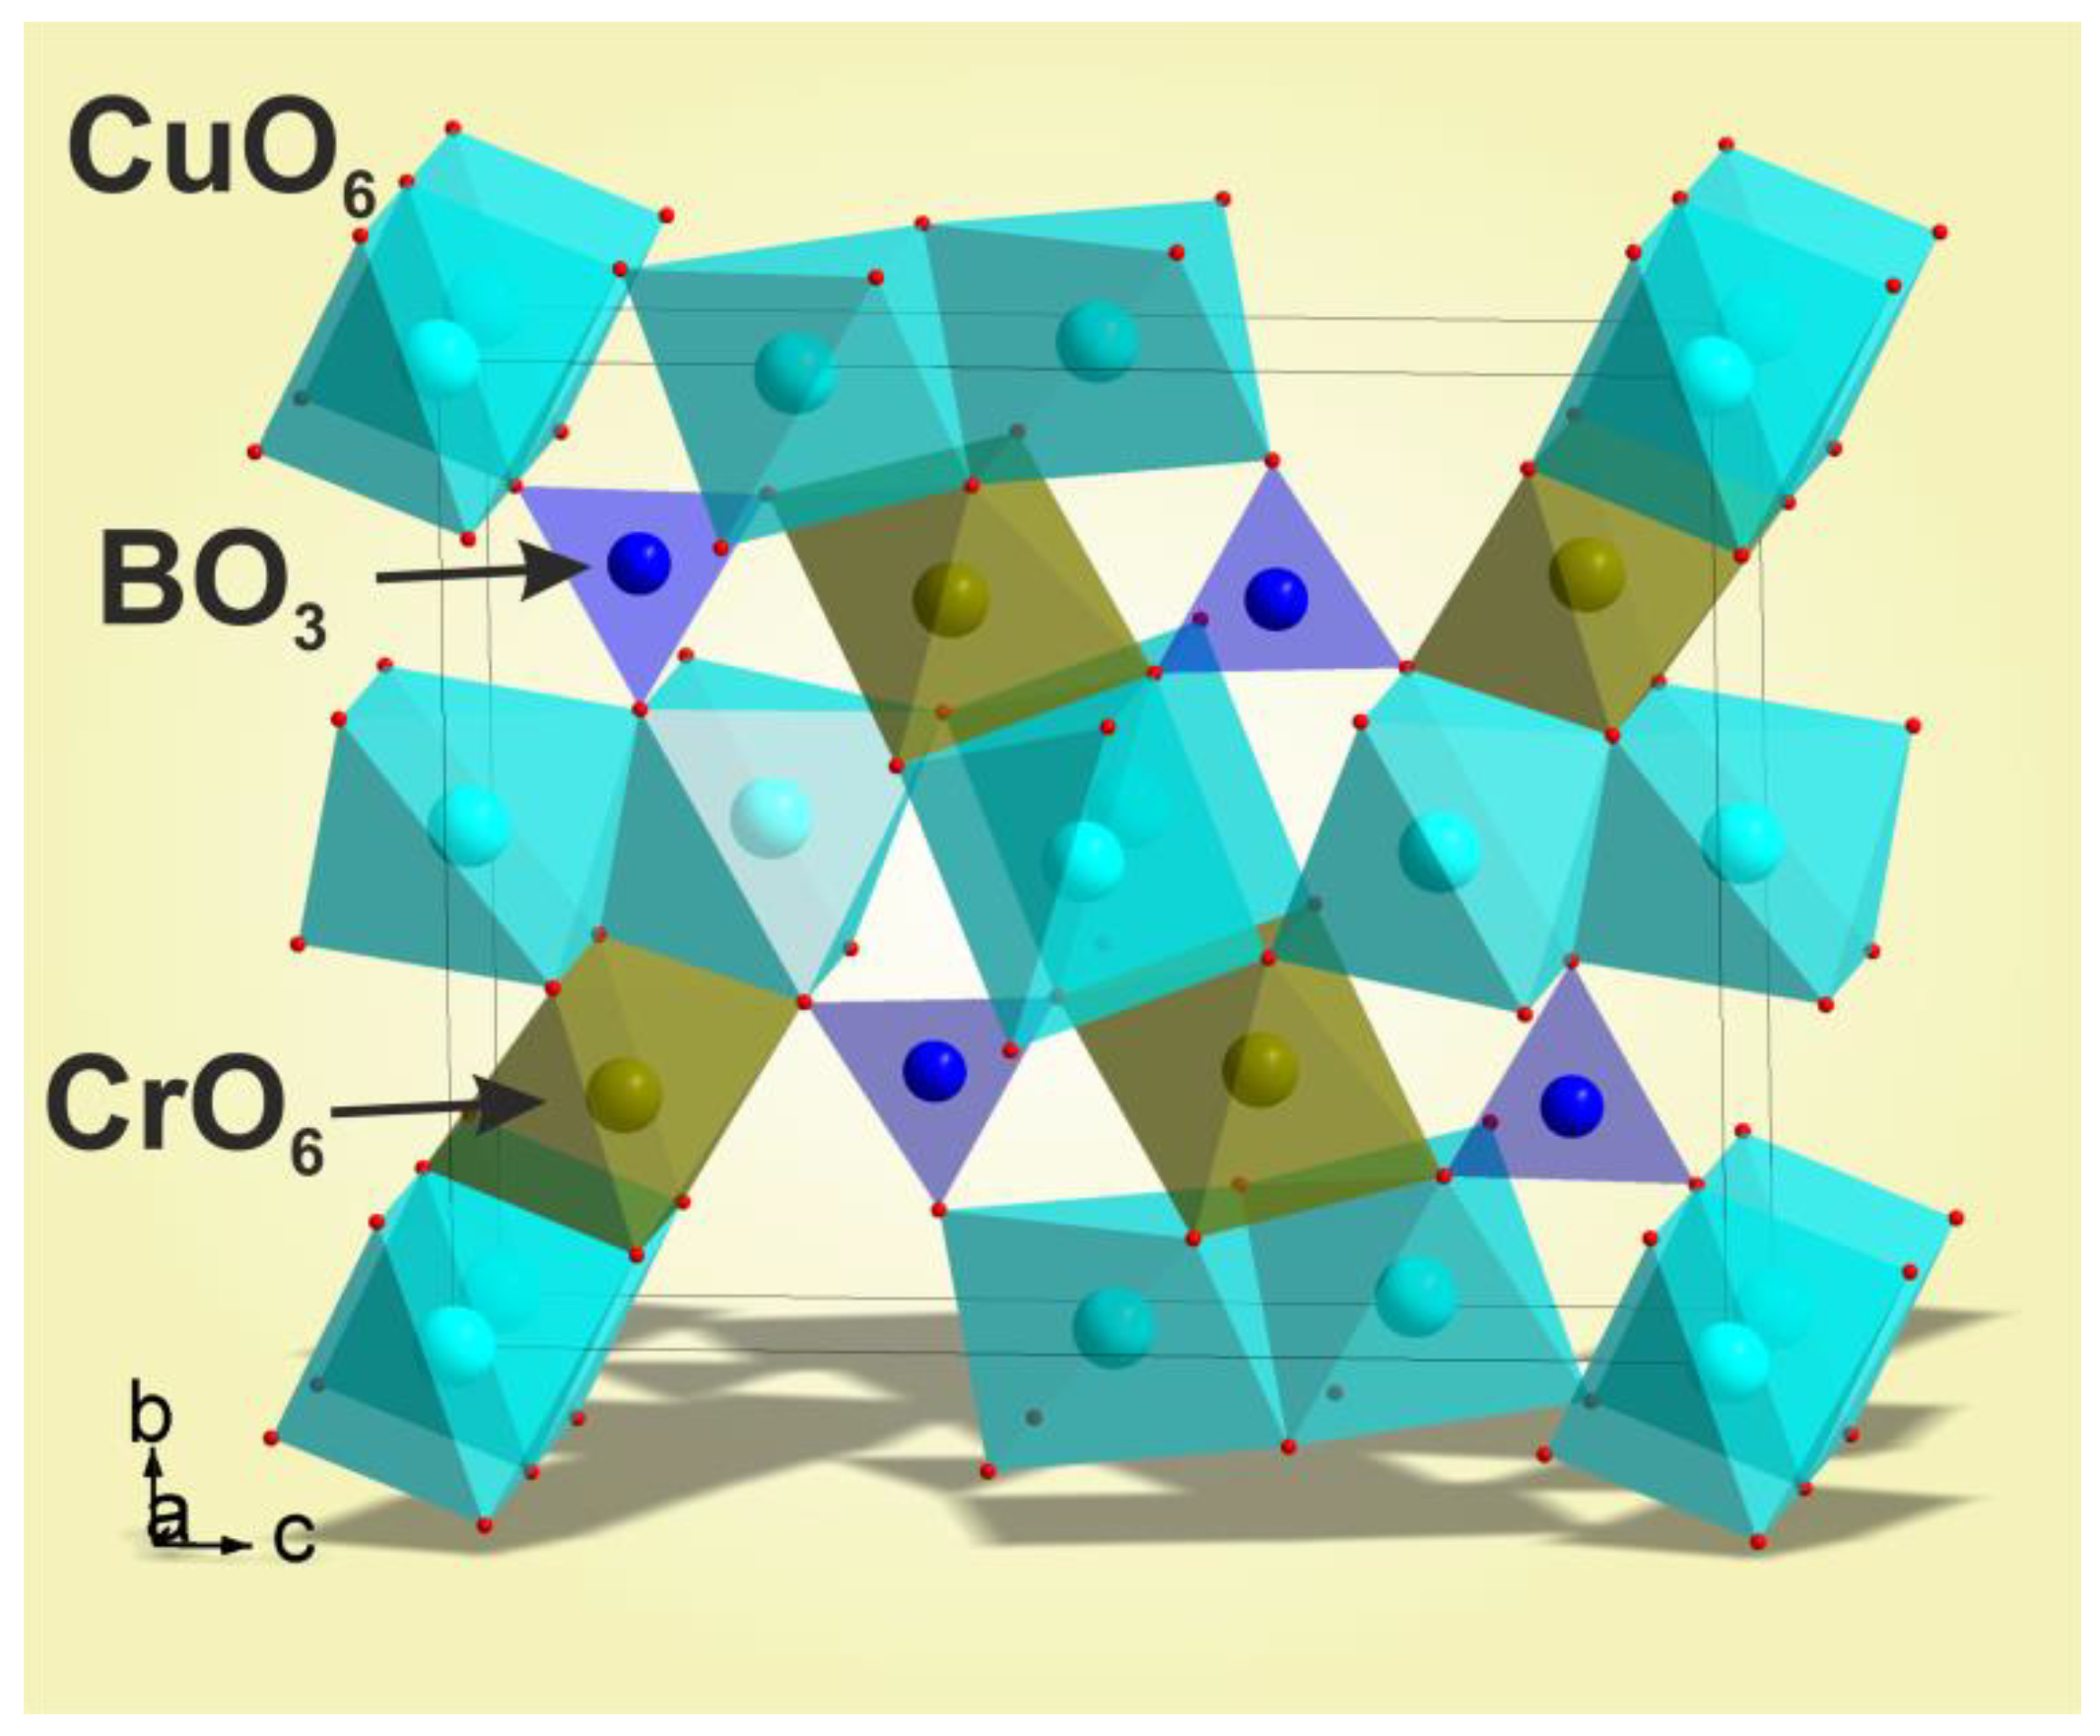
3.2. Structural Properties

As mentioned above, the phase composition of all the selected samples was controlled using X-ray diffraction. Here, the comparative results for the several obtained samples of ludwigites Cu2CrBO5 and tungstates (Cu,Cr)WO4 are presented to consider the changes in the valence states of chromium cations, and to analyze the partition coefficient of Cr2O3 in the studied flux systems. The structural parameters of the tungstates are presented in Table 1, and the structural parameters of the Cu2CrBO5 ludwigite samples are presented in Table 2 along with the data provided in [1].

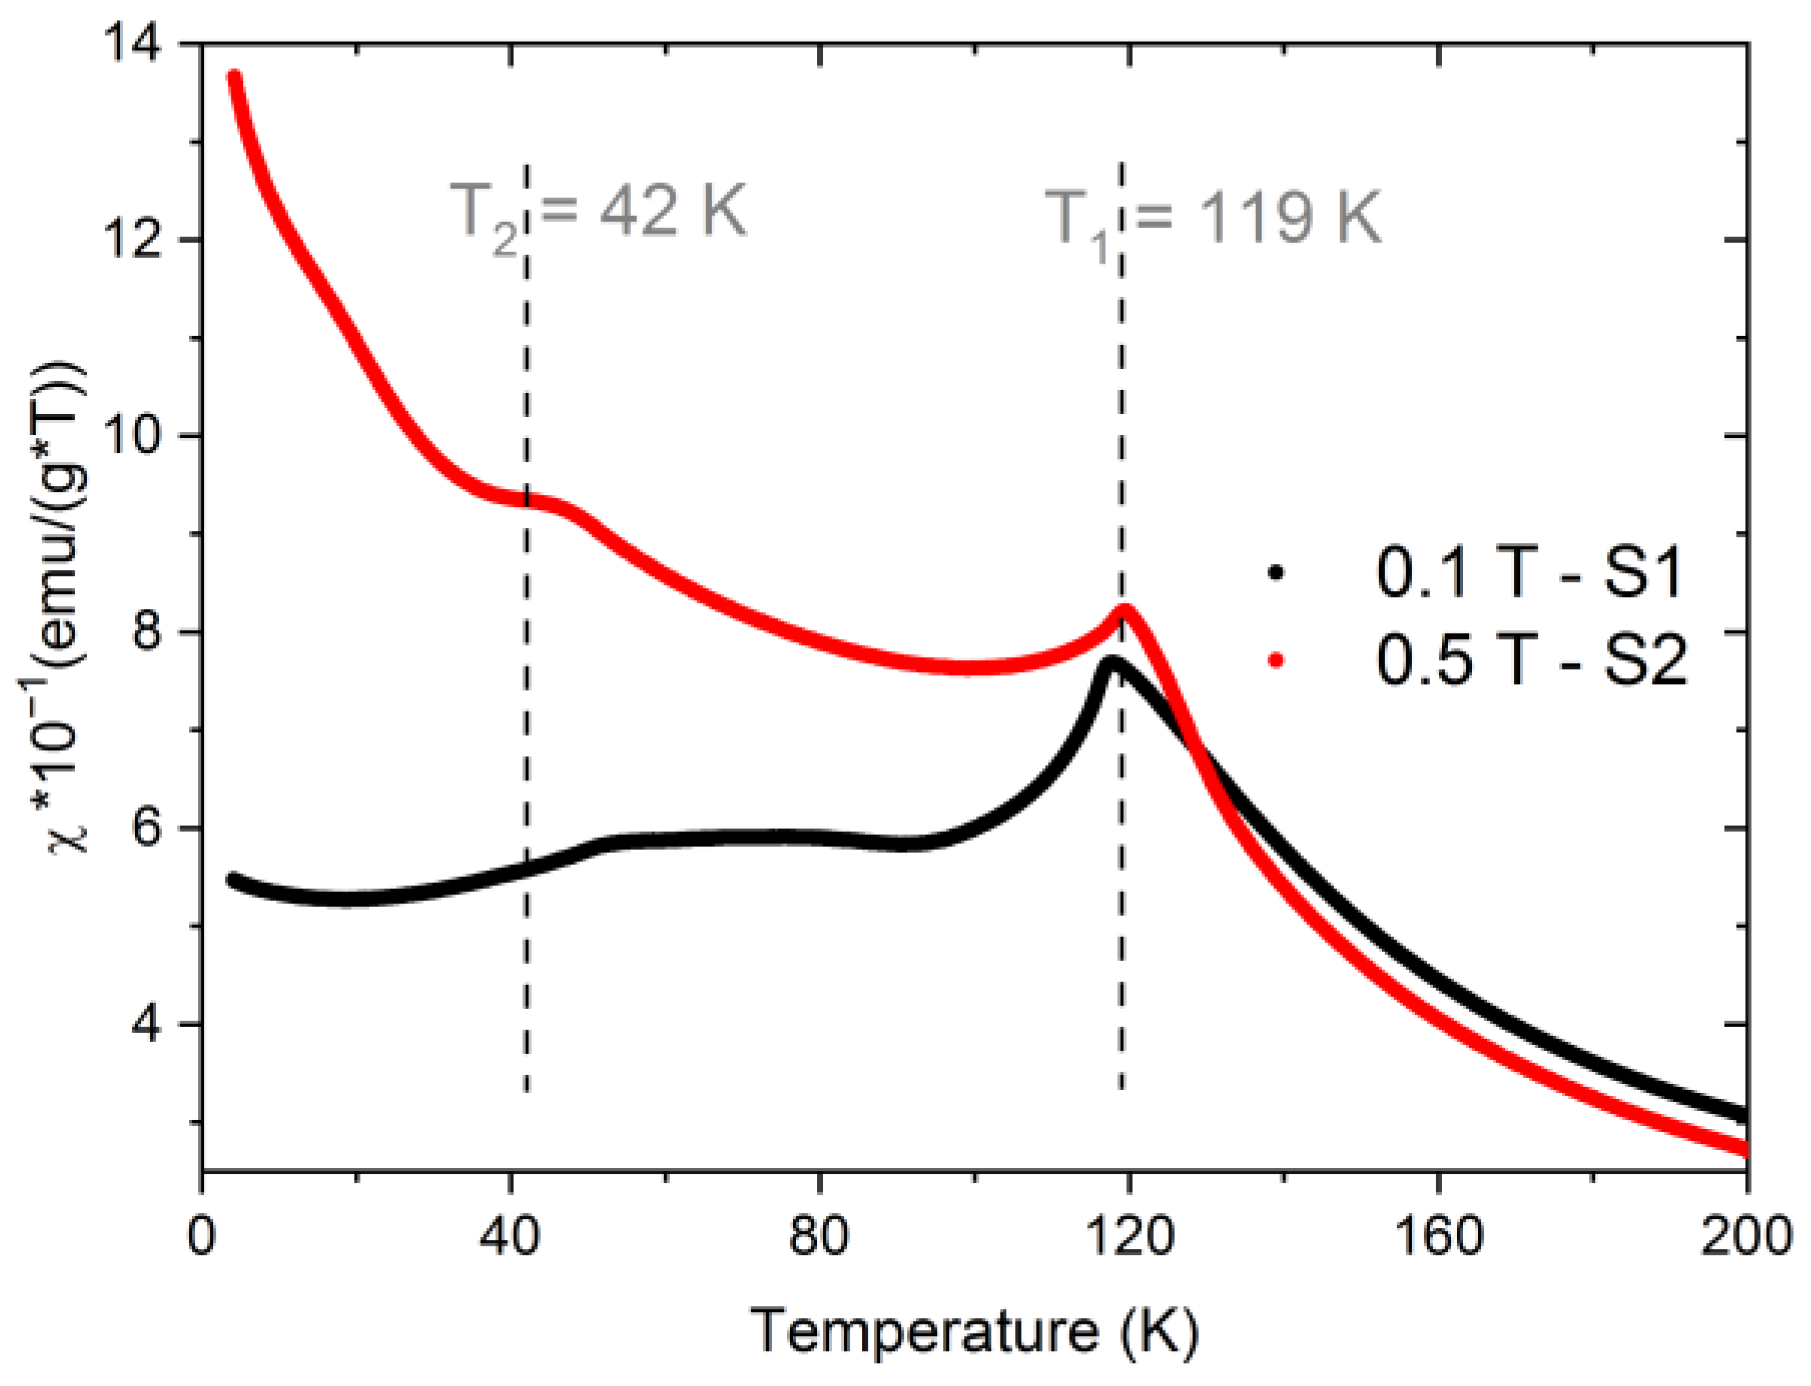
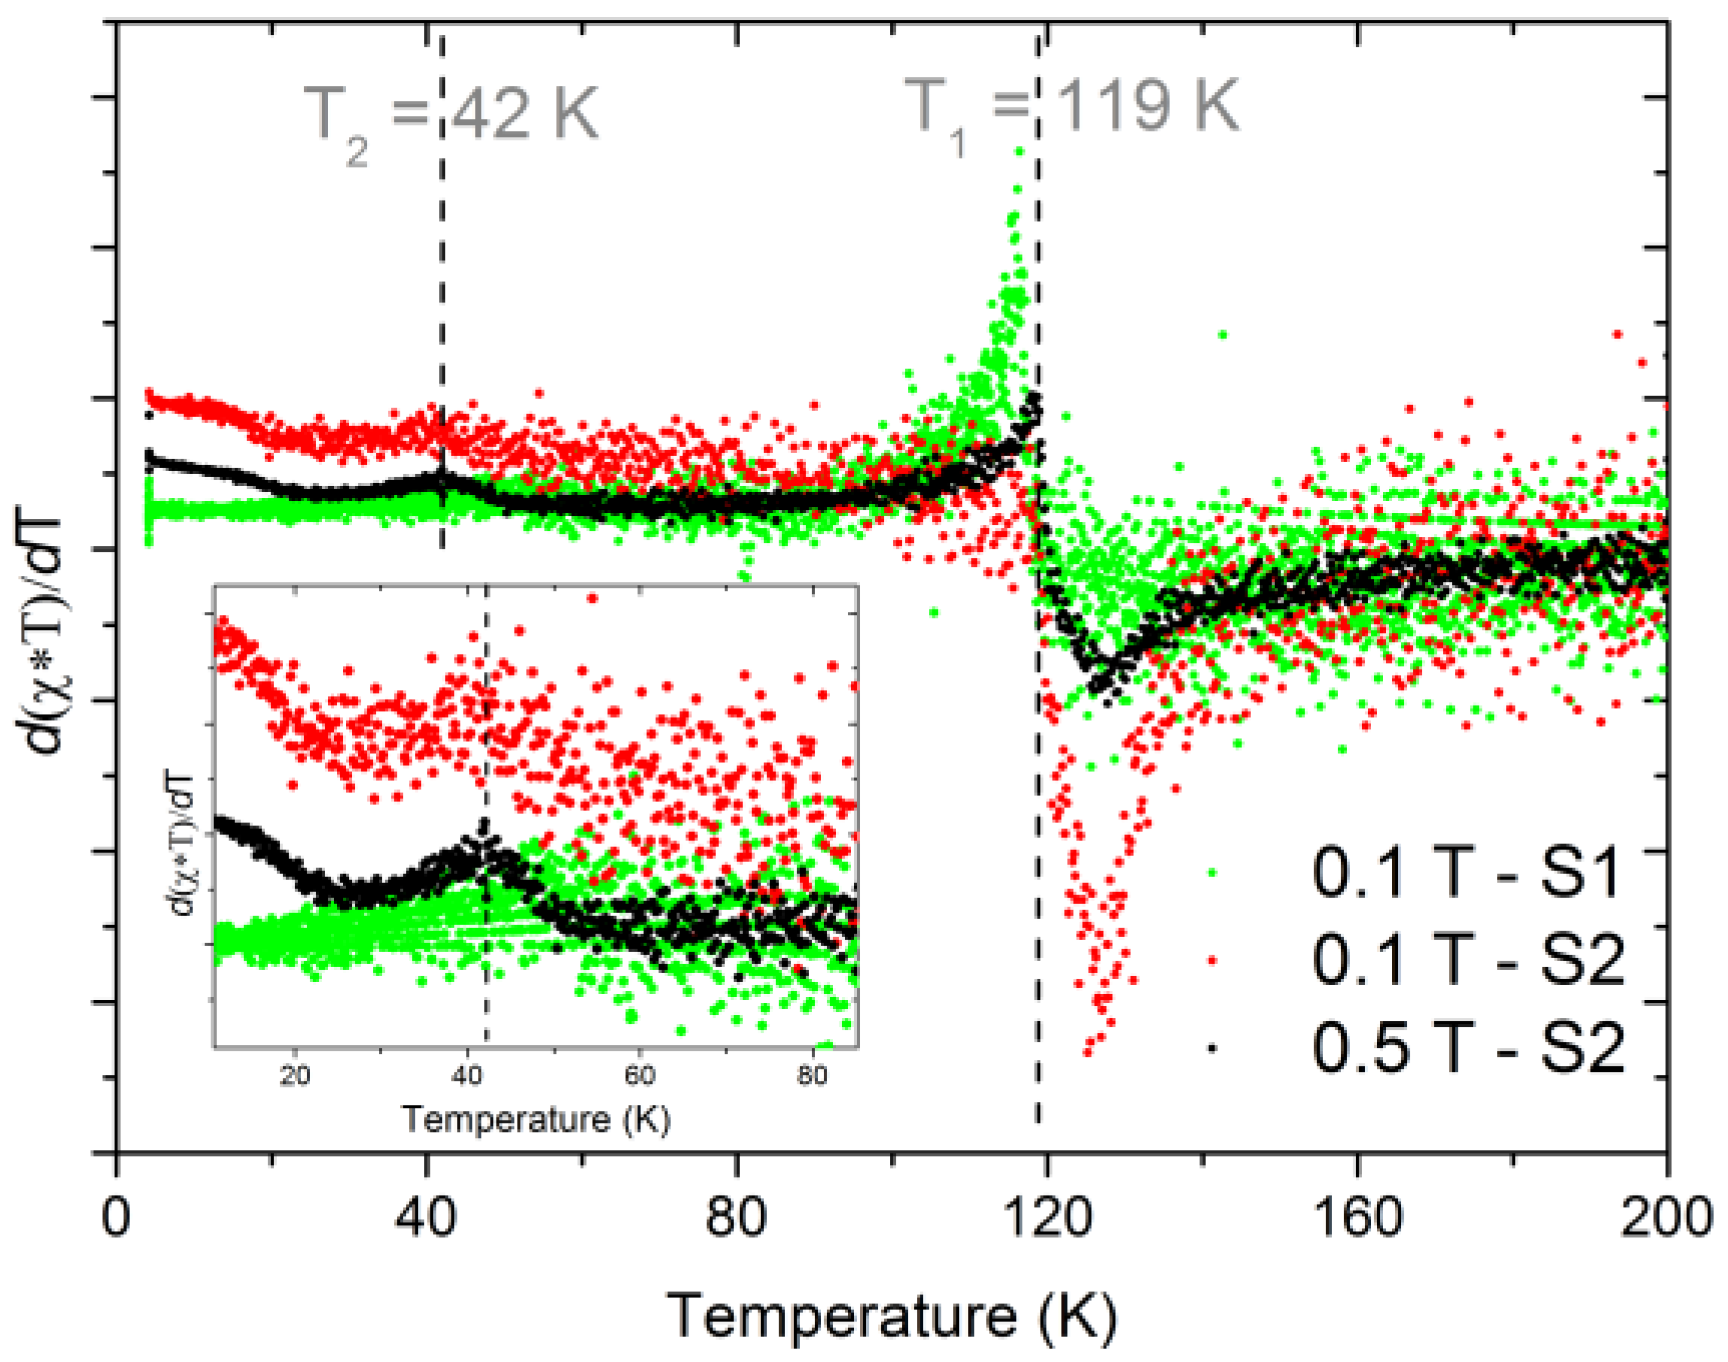
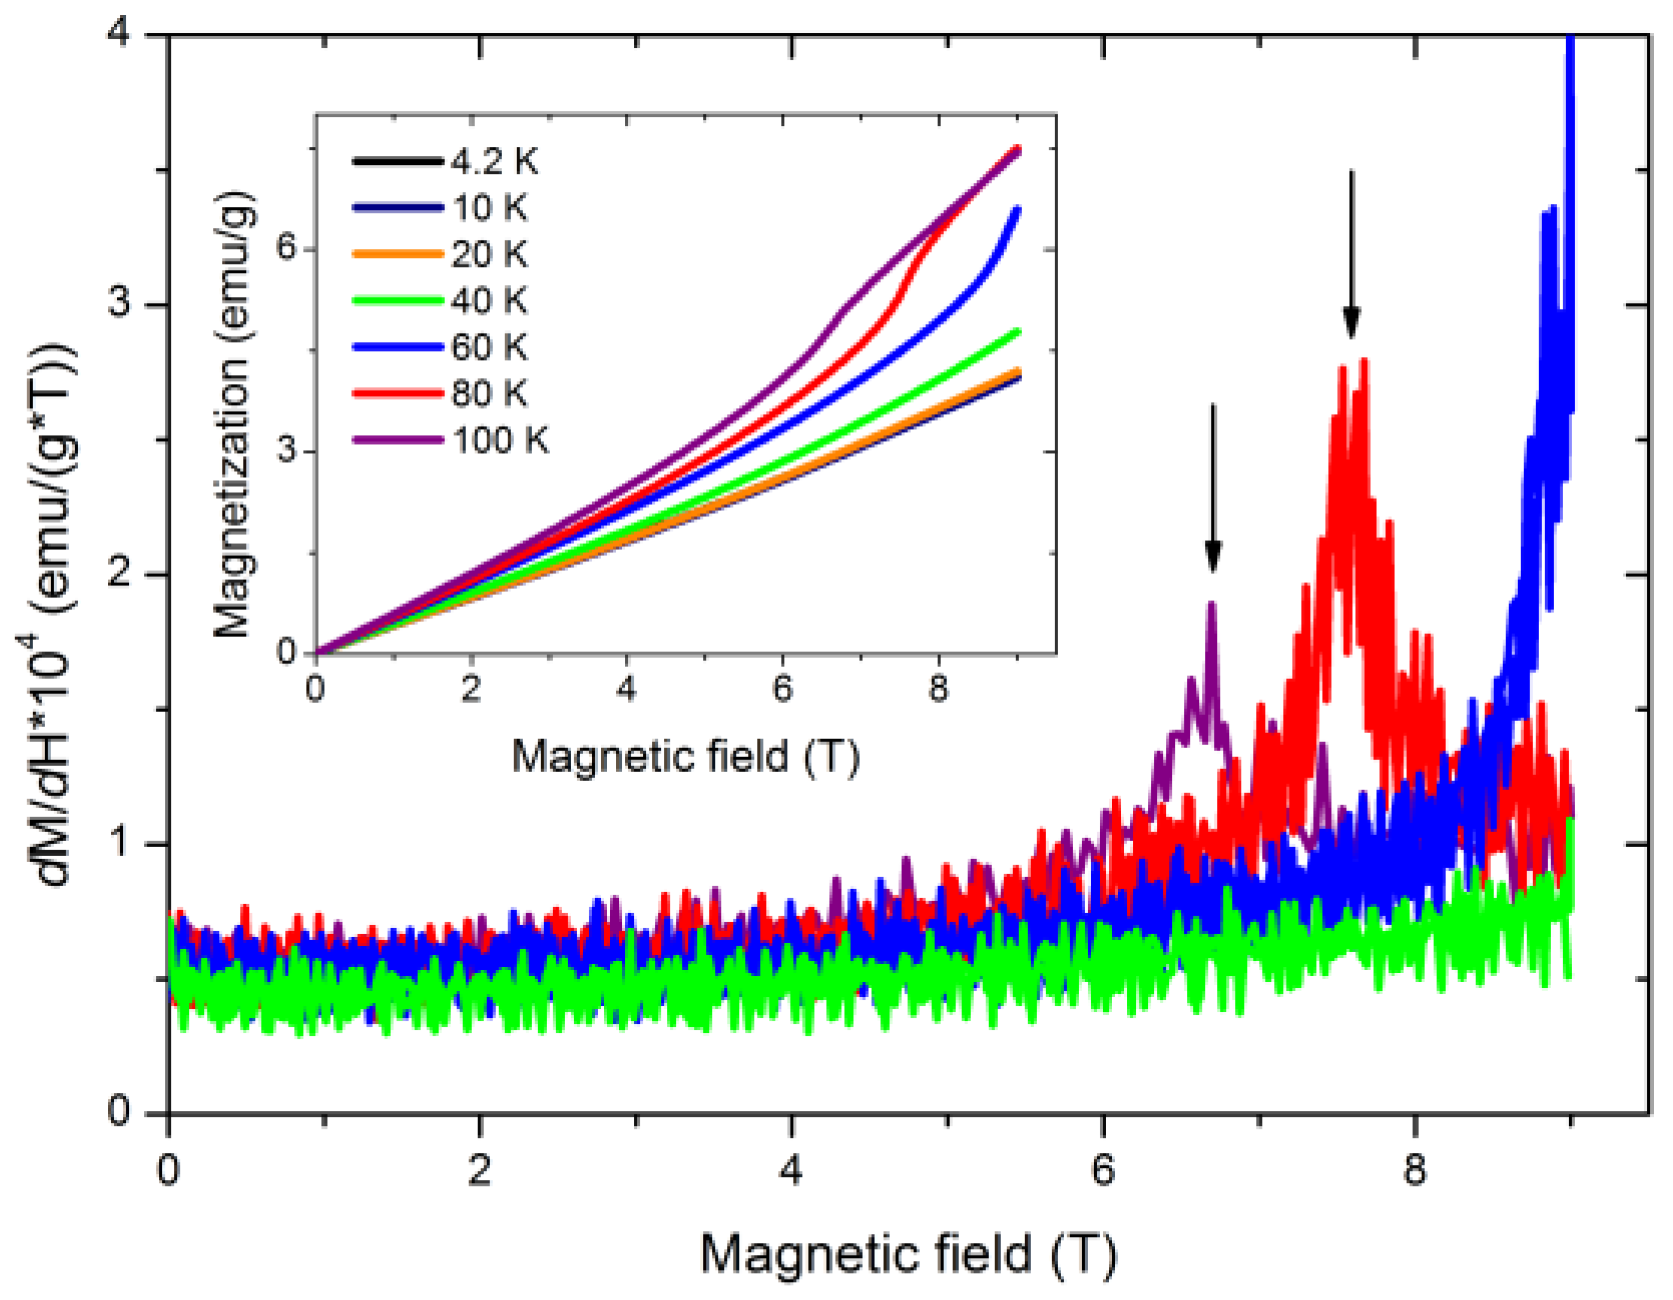
3.3. Magnetic Properties

In this paper, the thermal and field dependences of magnetization (M) of two Cu2CrBO5 samples obtained from systems (2),S1, and (5),S2, were studied. The magnetic properties of the sample obtained from the bismuth-molybdenum system (2) were partially presented earlier in [6]. The thermal dependences of the magnetic susceptibility (χ) of the studied samples are presented in Figure 3. For S1, the curves were obtained at H = 0.1T, and for S2, they were obtained at H = 0.5T (H—magnetic field). As it was mentioned in the section describing the growth study, Cu2CrBO5 was obtained with the admixture of CuCr2O4 spinel phase from system (5). For measuring the magnetic properties, the ludwigite crystals were selected from the sample. However, due to the small crystal size, a part of the spinel crystals was introduced to the investigated sample S2, which influenced the magnetization curves. The main purpose of presenting these results is todemonstrate the magnetic behavior of the thermal inflection point of M(T) for Cu2CrBO5 within the range T = 40–50K. No influence of the spinel admixture is observed in this range due to the thermal magnetization dependence anomalies of CuCr2O4 at T = 120K and in the range T = 5–15K; there is monotonic behavior of magnetization in the range of T = 20–100K [21]. In Figure 3, the red curve corresponds to sample S2 and H = 0.5T. In the thermal range of 40–50K, quite a distinct inflection point can be observed, which is poorly visible under the field of a lower value. Along with the thermal dependences, the field dependences of magnetization were studied.

3.4. Raman Spectroscopy Study

Raman spectra of the Cu2CrBO5 crystal (sample S1) were studied at room temperature and in the vicinity of the magnetic phase transition. The experiment was carried out in two stages: 1. study of the polarized Raman spectra at room temperature; 2. study of the temperature evolution of the unpolarized Raman spectra in the vicinity of the antiferromagnetic phase transition.

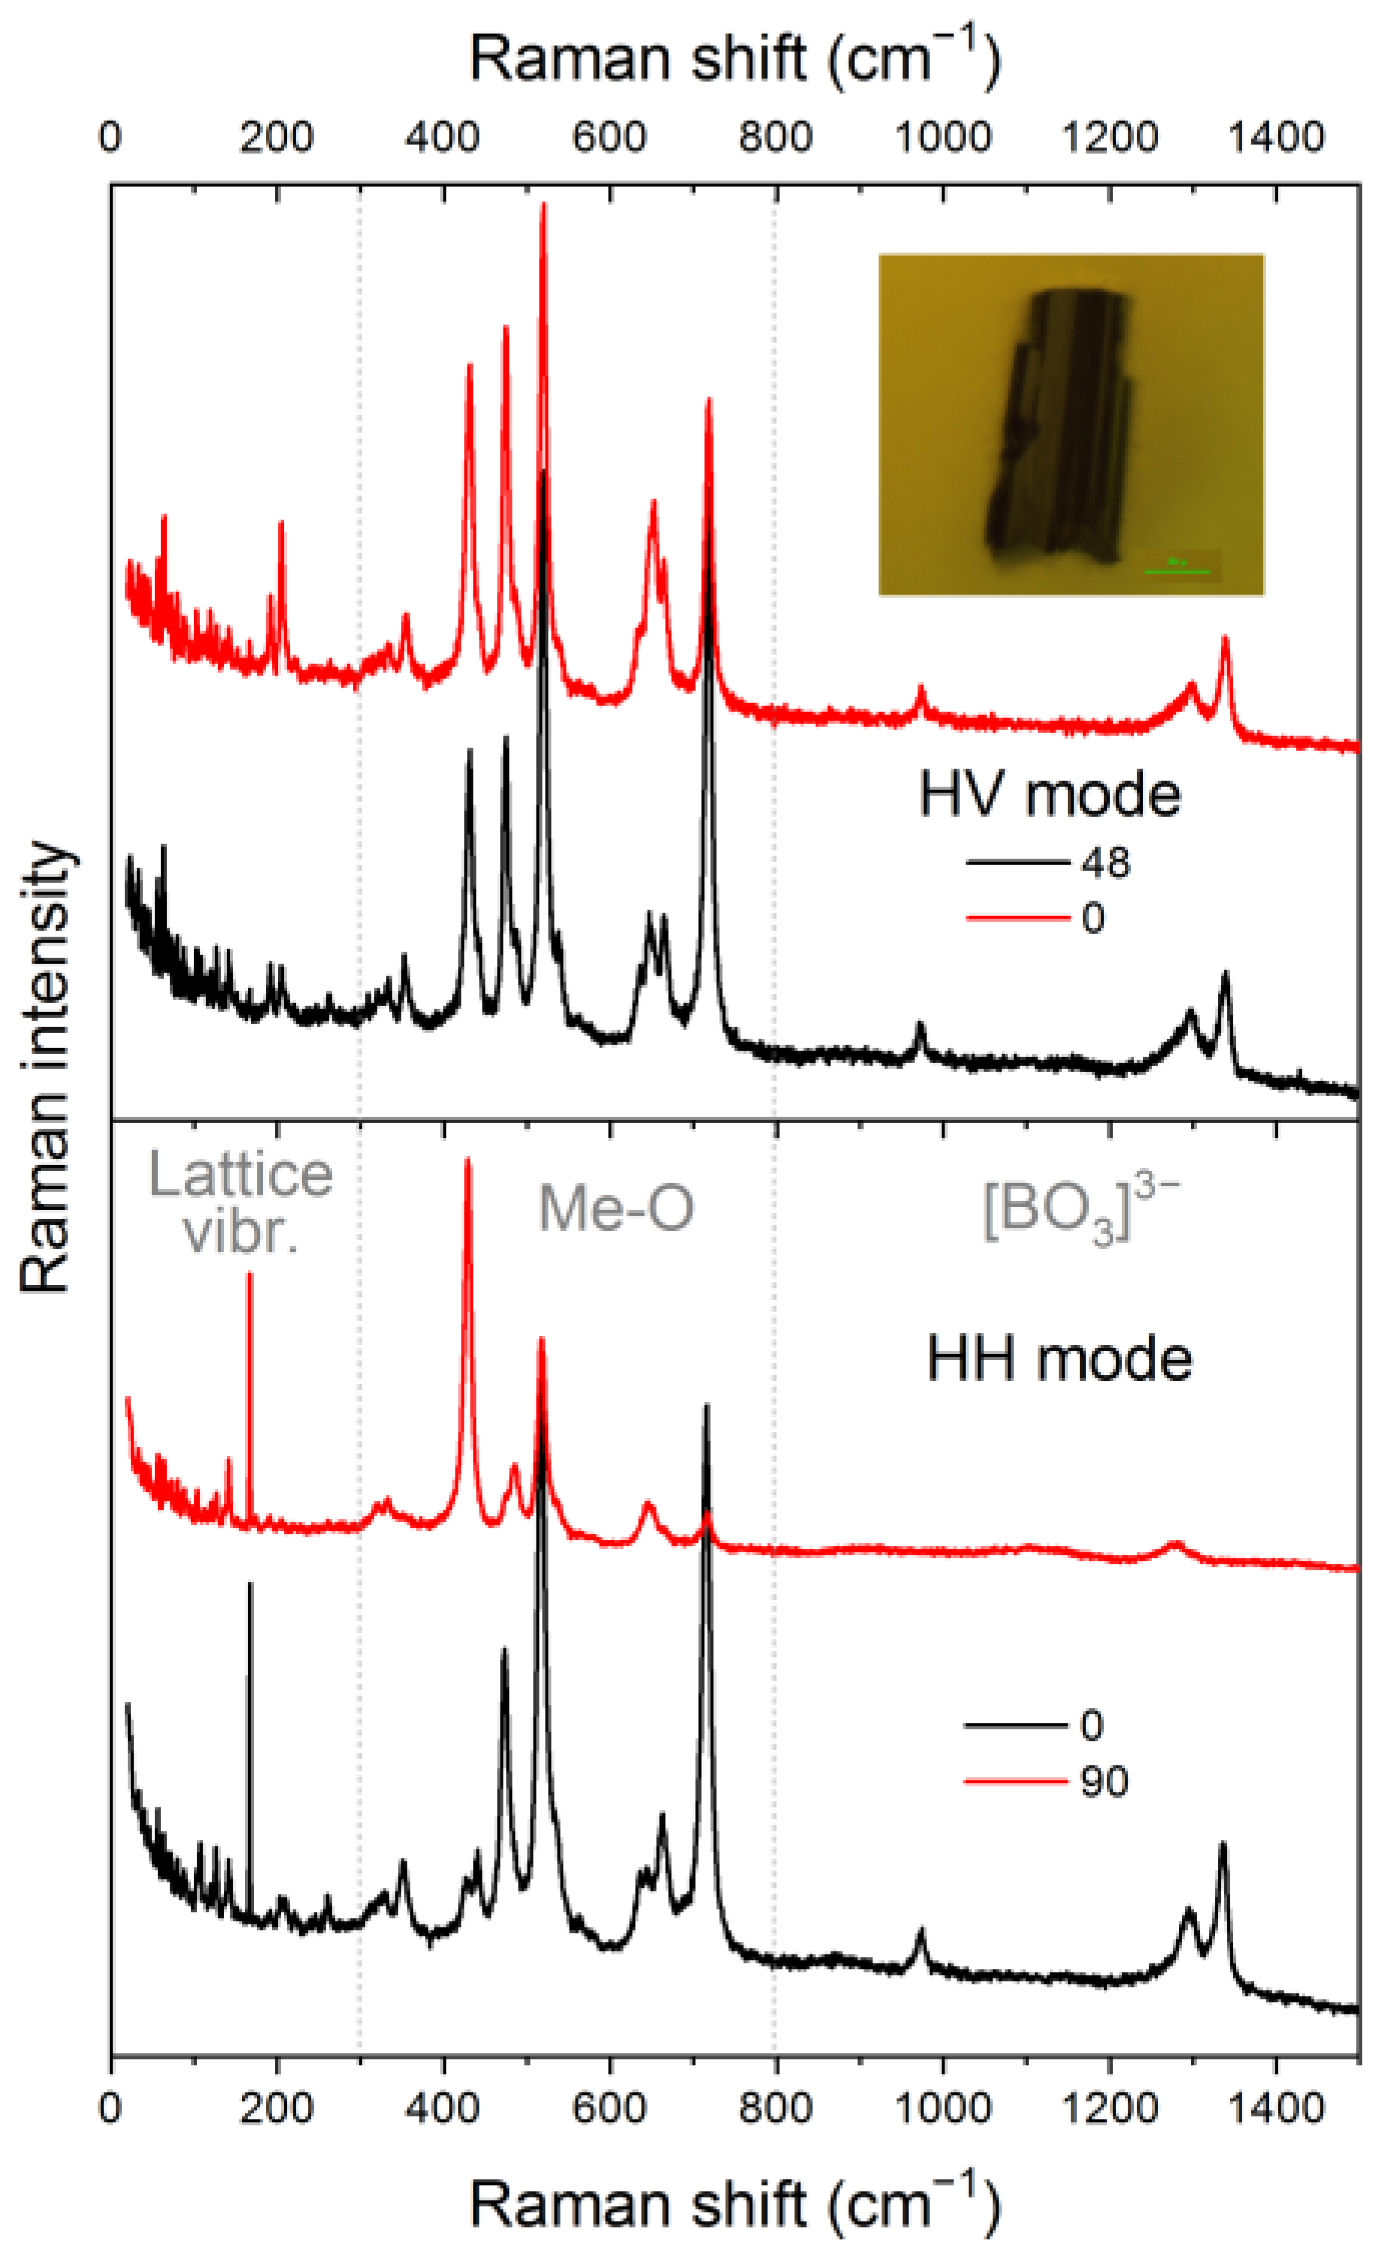
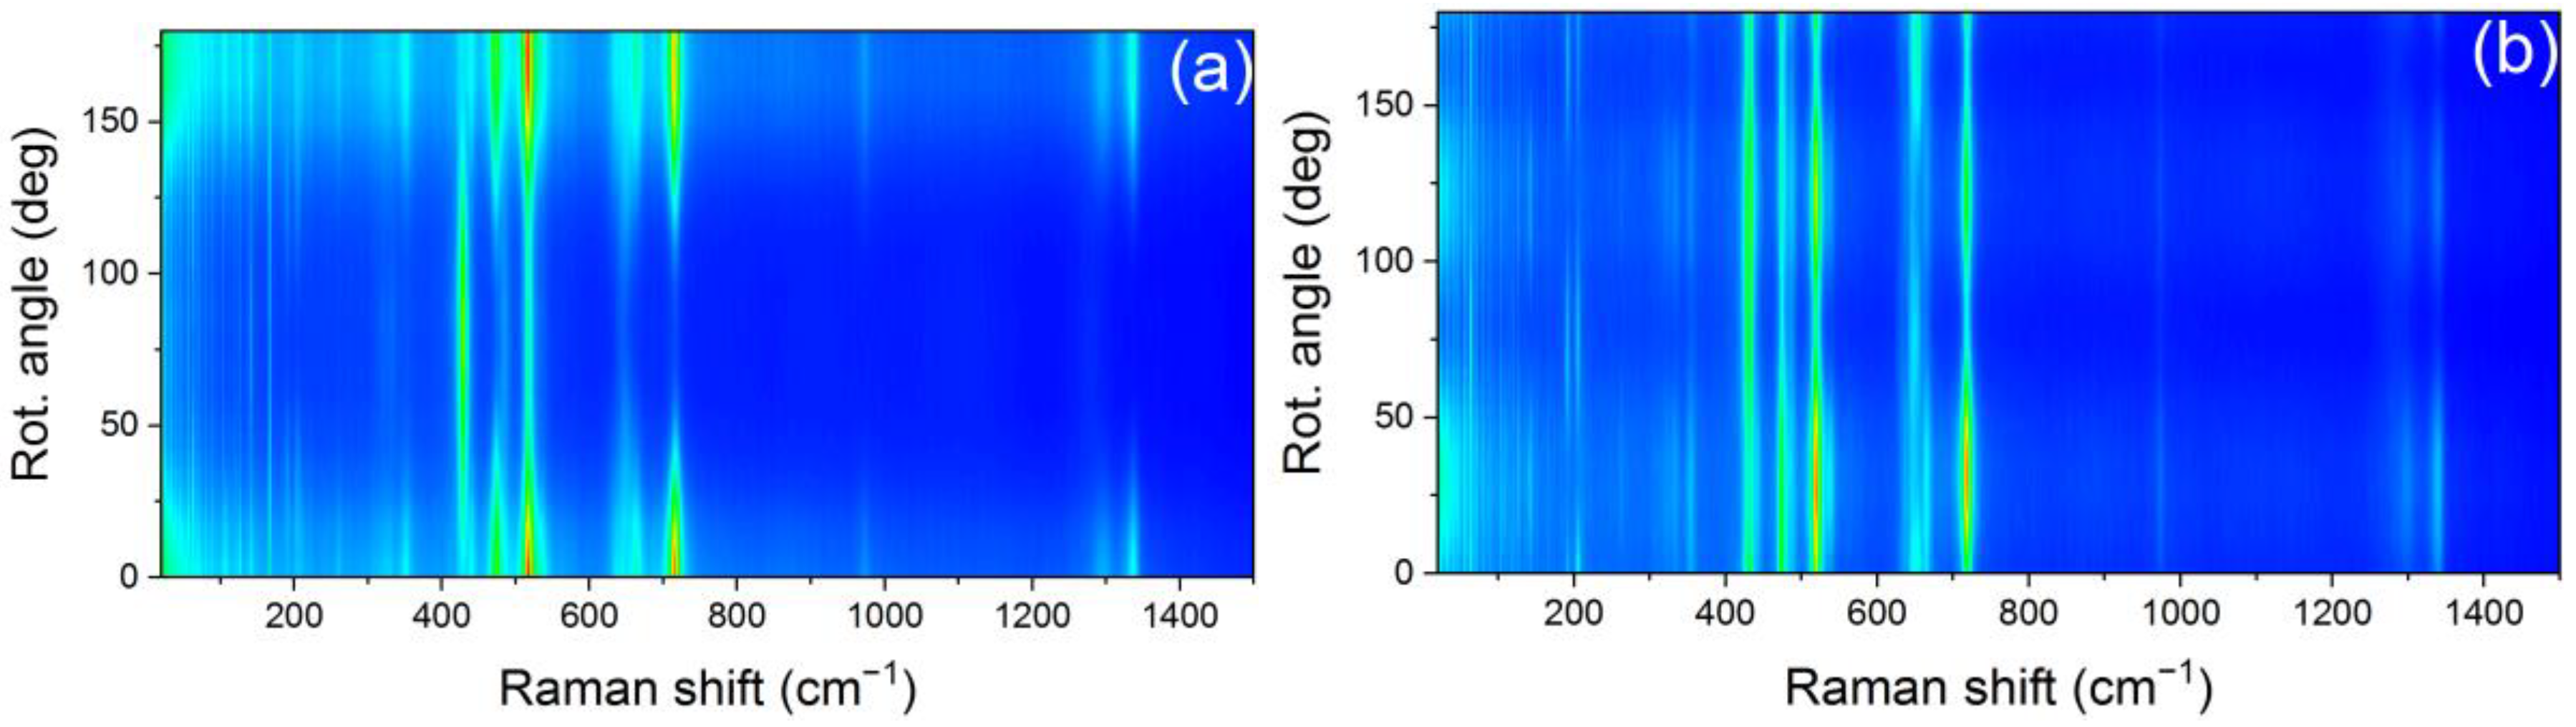
3.4.1. Polarized Room Temperature Raman Spectra of Cu2CrBO5

The single comparative spectra taken at the intensity maximum positions in the HH and HV modes and Raman intensity maps of Cu2CrBO5, depending on the rotation angle of the studied sample in the spectral range of 20–1500 cm−1, are presented in Figure 4 and Figure 5, respectively. The obtained spectra can conditionally be divided into three ranges: 0–300 cm−1 corresponding to the lattice vibrations, 300–750 cm−1 corresponding to the Me-O octahedra vibrations, and 900–1400 cm−1 corresponding to the [BO3]3− group vibrations. The Raman spectra of Cu2CrBO5 are in agreement with the dataobtained earlier for other ludwigites in terms of the range division and spectral structure. Apart from this, there is an interesting disagreement in terms of both monoclinic ludwigites with different distortion types [6,17] and orthorhombic ones [22,23]. The change in the sample color (dark brown) with respect to the manganese ludwigites (black) studied earlier led to a greater intensity of the spectra.
The main peculiarities of the Cu2CrBO5 spectra can be seen in the obtained intensity maps (Figure 5). The intensity distribution, depending on the crystal rotation angle, shows the behavior close to orthorhombic ludwigites. Almost all lines of the Me-O range change their intensity with the 180° phase in the HH mode (parallel orientation of the polarizer and analyzer) and 90° phase in the HV mode (cross-parallel orientation of the polarizer and analyzer). An exception is the vibration with the frequency 428 cm−1, which is in the counter-phase with other lines in the HH mode. The same peculiarities are demonstrated by the group of lines at 180–220 cm−1 in the range of lattice vibrations in the HV mode.

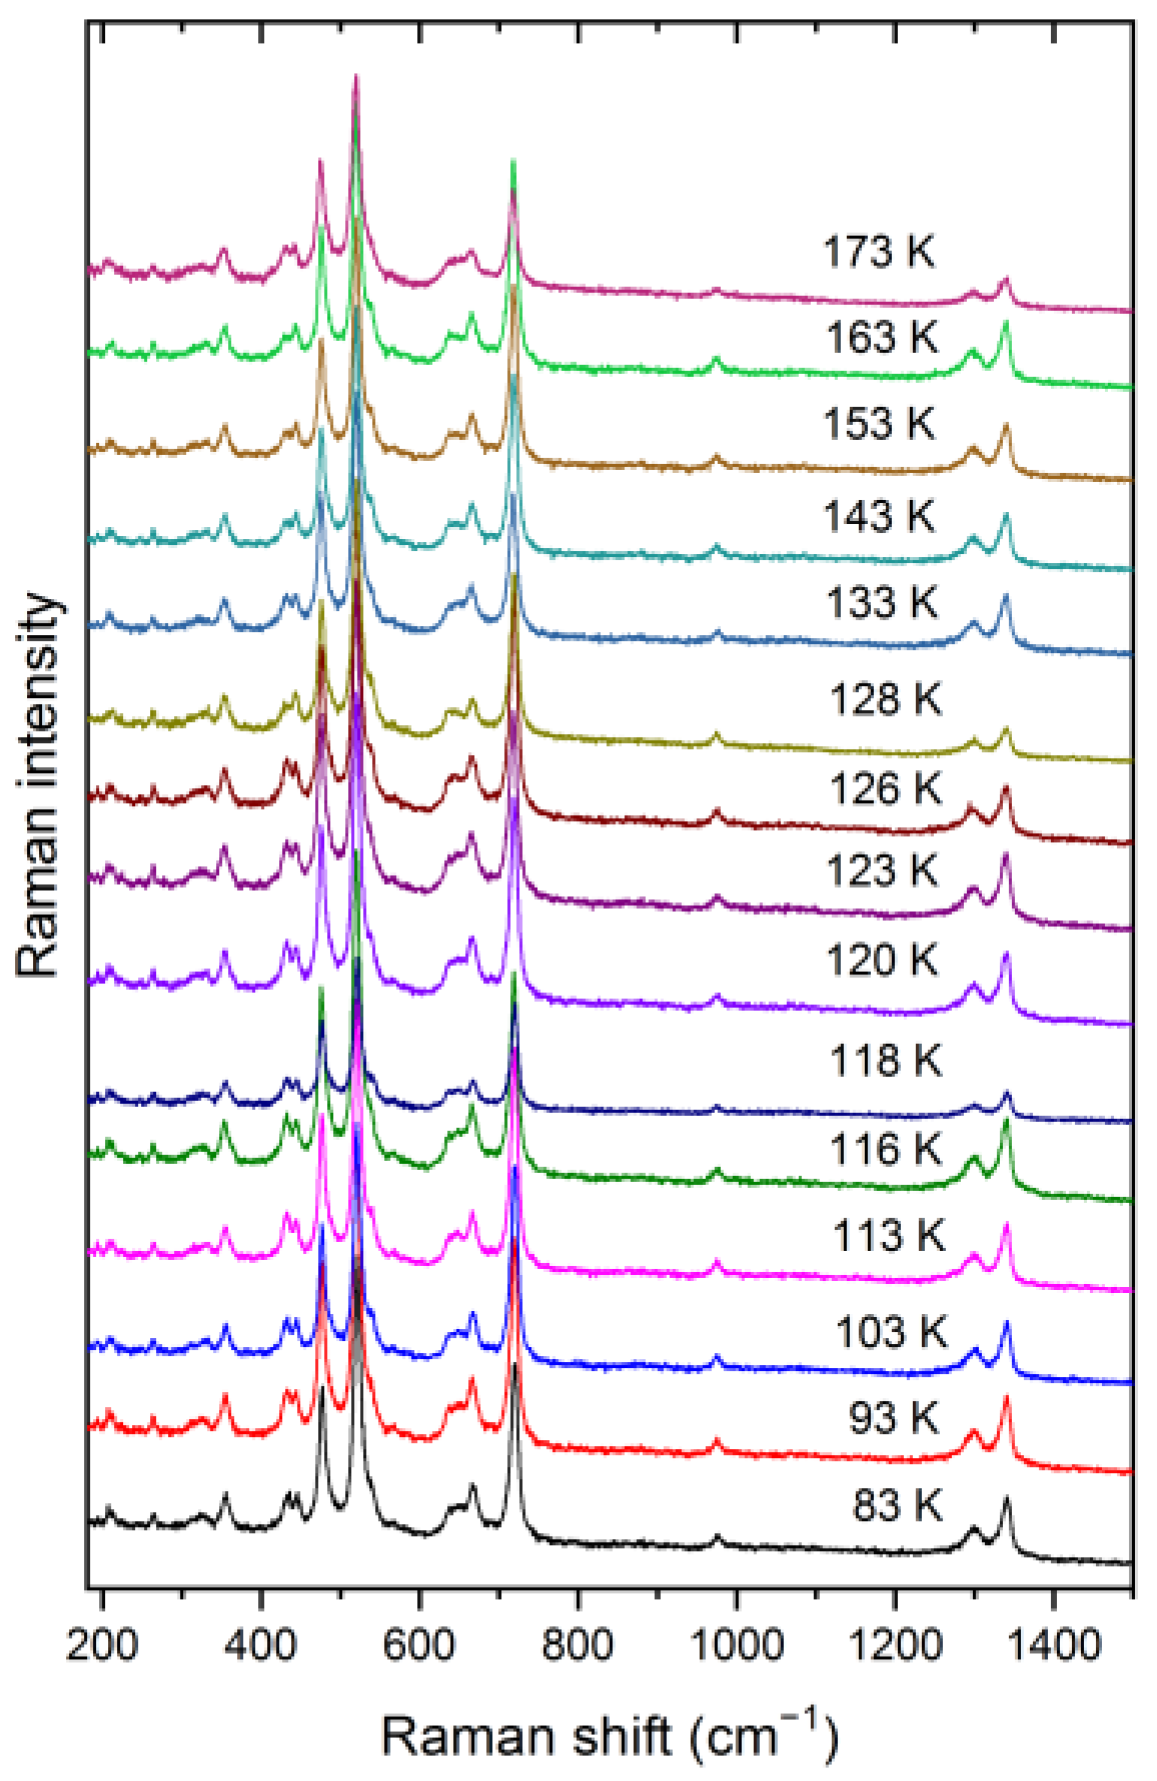
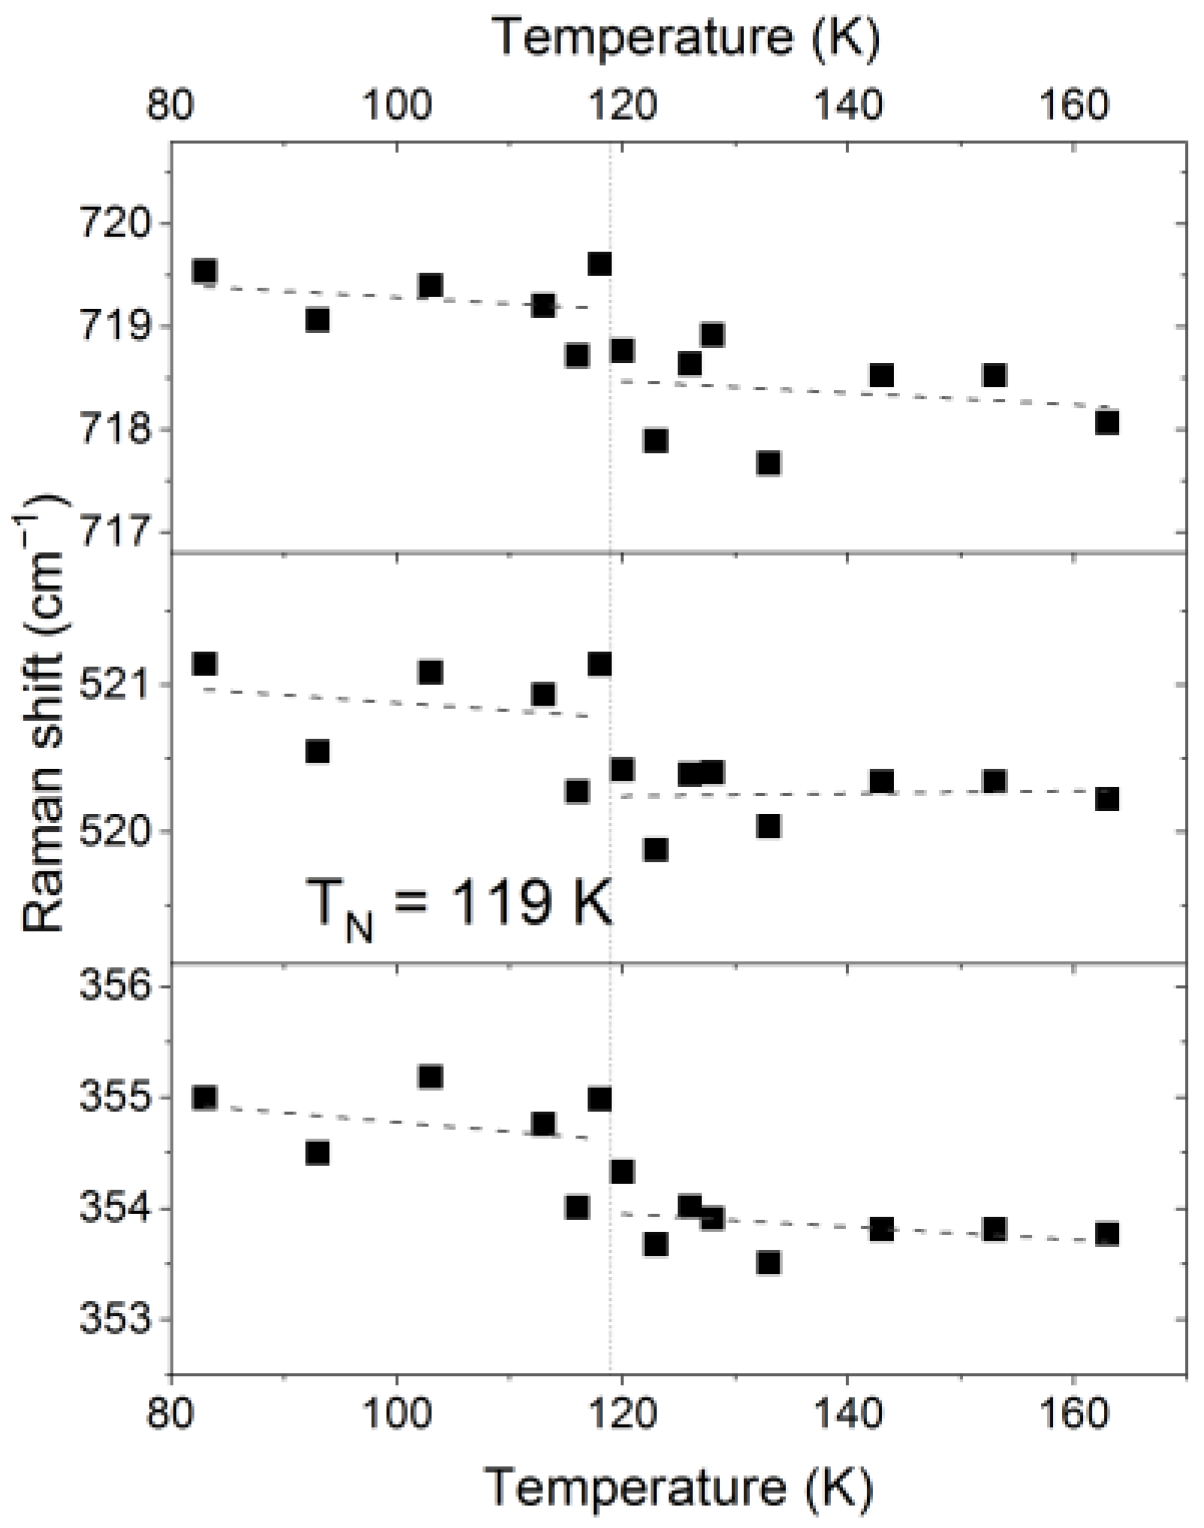
3.4.2. Thermal Evolution of the Raman Spectra of Cu2CrBO5

Raman spectra of Cu2CrBO5 were measured with the temperature change in the vicinity of the antiferromagnetic phase transition (TN = 119 K). The obtained thermal evolution is presented in Figure 6.
Visual comparison of the obtained spectra did not reveal any meaningful changes at the magnetic phase transition. However, small shifts inthe spectral lines in the Me-O vibrational range were observed, as expected in the absence of an external magnetic field. This corresponds to small changes inthe bonds in the cation octahedra, as a result of magnetic ordering. In Figure 7, the thermal dependences of the central position of 354 cm−1, 520 cm−1 and 718 cm−1 are presented. Ashift inthese lines (about 1 cm−1) was detected, while in the range of the [BO3]3− group vibrations, no shift was detected.

4. Discussion

The study of the possibility of obtaining Cu2CrBO5 crystals usingthe flux technique consists of several stages as the crystallization research in the systems is based on two types of solvents, Li2WO4-Li2O-B2O3 and Bi2O3-MoO3-B2O3-Na2O. The phase composition of the obtained samples was controlled using powder and single crystal X-ray diffraction, and the chemical composition of some samples was investigated viathe EDX technique.
Four flux systems were studied, one based on Bi2O3-MoO3-B2O3-Na2O and three based on Li2WO4-Li2O-B2O3 with different starting points. The ludwigite phase (Cu2CrBO5) was obtained in each system. However, a “pure” ludwigite phase was obtained in two of them: (2) and (4). Co-crystallization with the phases CuO and CuCr2O4was obtained in systems (3) and (5), respectively. Thus, for further study of the crystallization processes aimed at growing a Cu2CrBO5sample of sufficient size, systems (2) and (4) was used. Thus, both flux systems, based on Li2WO4-Li2O-B2O3 and on Bi2O3-MoO3-B2O3-Na2O, are appropriate for obtaining the crystallization of the Cu2CrBO5 ludwigite phase. Hence, after taking into account the study of three systems with different component ratios, it can be concluded that there is a wide area of the ludwigite phase on the phase diagram of the Li2WO4-Li2O-B2O3-based multicomponent flux system. The main restricting factor for obtaining the sufficient dimensions of the Cu2CrBO5 single crystals is the solubility of chromium oxide. This problem needs additional study.
During the research, the possibility of the formation of copper-chromium compounds with other valence composition was established. Delafossite Cu+CrO2 and tungstate (Cu, Cr)2+WO4 were obtained as secondary phases. This possibility arises owing to the growth technique applied, in particular, due to the presence of the solvent.
The phase (Cu, Cr)WO4 was obtained as an intermediate one in the system based on lithium tungstate. This compound contains bivalent cations of transition metals including Cr2+. As in the case of the manganese systems, in the Bi-Mo-O fluxes [8], no crystallization of the phase with trivalent cations is observed in the absence of free alkaline metal oxides (Na2O and Li2O) due to the formation of MnMoO4 or (Cu, Cr)WO4-like phases. In this experiment, two samples of tungstates from system (3) with concentrations n1 = 2.2% and n2 = 3.87% were obtained. The space groups and lattice parameters of these compounds are given in Table 1. For comparison, the analogous data for pure CuWO4 [19] and CrWO4 [20] are also presented in Table 1.
As one can see from Table 1, pure tungstates are characterized by the space group different from the mixed ones. Copper tungstate is triclinic, while that of chromium is monoclinic. Apparently, the combination of two cations Cu2+ and Cr2+ leads to the tungstate structure with the space group P2/c. The lattice parameters of the second mixed sample increase relative to analogous data for the first one. This correlates with an increase in the chromium content, which is in agreement with the ratio of the cationic radii R(Cu2+) = 0.75Å and R(Cr2+) = 0.80Å. Thus, despite the same nominal Cu/Cr ratio in the flux, chromium contentin the crystal increases upon sequential sampling. This demonstrates a significant difference between the partition coefficients of CuO and Cr2O3 and thepoor solubility of chromium.
In this research, Cu2CrBO5 was obtained using several flux systems. In some cases, co-crystallization with the phases CuO and CuCr2O4 was observed. Table 2 presents the structure parameters of two samples of Cu2CrBO5 obtained from systems (2) and (4), corresponding to the bismuth-molybdenum and lithium-tungstate flux systems. Table 2 shows the data of the other sample obtained viaa solid state reaction [1].
As mentioned earlier [6], the lattice parameters of Cu2CrBO5 obtained usingthe flux technique are different from the sample obtained viathe solid state reaction. In particular, the differences are clearly seen in the monoclinic angle. Significant differences were also revealed upon the analysis of the bond lengths of metal–oxygen octahedra [6]. The lattice parameters of samples (2) and (4) obtained viathe flux technique correlate quite well witheach other. Some small differences can be caused due to thedifferent X-ray experimental techniques used: the structural data for sample (2) were obtained withpowder X-ray diffraction, while the data for sample (4) were obtained using single crystal X-ray diffraction.
The actual composition of sample (2) is Cu1.89Cr1.11BO5, as found withthe EDX analysis. A possible cause of the structural data discrepancy is the different cation composition, in particular, the presence of Cr2+ in the compounds grown from the fluxes.
The ludwigite Cu2CrBO5 has a number of peculiarities in the thermal and field behavior of magnetization. Below the temperature of the antiferromagnetic phase transition (TN ≈ 120K), there is a non-monotonic thermal dependence of magnetization, that is, a sharp peak in the vicinity of the phase transition temperature, then the “plateau” and the inflection point in the temperature range of T = 40–50K (Figure 3, [1,6]), which can also be seen in the thermal dependence of the dielectric constant [1].
To study this anomaly at T = 40–50K, the dependences ∂(χ·T)/∂T(T), corresponding to the thermal behavior of specific heat for antiferromagnets, were analyzed (Figure 8) [24]. The analogous dependence of S2 obtained at H = 0.1T is also presented in Figure 8. The most significant anomalies, as was expected, were observed in the vicinity of the antiferromagnetic phase transition at TN = 119 K. The green curve, corresponding to sample S1, demonstrates the maximum of the antiferromagnetic phase transition. Two other curves, corresponding to sample S2 with the spinel admixture, demonstrate the sharp minimum corresponding to the ferromagnetic type of the phase transition (the magnetic ordering temperature of spinel is TC = 120K) together with the maximum of the antiferromagnetic transition. At T2 = 42K, the black curve (S2, 0.5T) demonstrates the second distinct positive maximum of a lower value. Thus, this anomaly can have the antiferromagnetic origin related to the reordering of some subsystem.
It is mentioned in [1] that the ludwigite Cu2CrBO5 demonstrates metamagnetic transition. The field dependences of magnetization demonstrate reversible inflections in the temperature range T = 60–100K, corresponding to the spin-flop transition. The distinct peaks of the thermal dependences of ∂M/∂H at 100K and 80K are observed in Figure 9. The range of the magnetic field up to 9T was not enough to fully register the peak of the curve at 60K. The type of the field dependences M(H) changes at 40K: magnetization decreases and there is a linear law of the dependence. Below 20 K, the temperature dependence is absent (Figure 9). However, at T = 40K the spin-flop transition can still occur, but at much higher magnetic fields.
The Raman spectrum of Cu2CrBO5 consists of rather narrow separate lines in the vibration range of the metal–oxygen octahedra. This confirms a high degree of the structural cationic order in this compound. It is greater than in the Cu2MnBO5 ludwigite, which can easily be distinguished among the previously studied ludwigites in terms of Raman spectroscopy [17].
The dependence of the intensity of Raman lines on the rotation angle of Cu2CrBO5 (Figure 5) can be compared with other copper ludwigites. In analyzing other copper-containing ludwigites which are also monoclinic, phase shifts were detected in broad spectral ranges in the area of the Me-O octahedra and lattice vibrations [17]. The phase shift was different from 45° and 90° in the HV and HH modes, respectively. The shift angle of the maxima of the low-frequency region in the Cu2GaBO5-like phase was about 70° and 120° for HV and HH, respectively, and in the Cu2MnBO5-like phase it was 50° for the HH mode. For the solid solutions of the Cu2GaBO5-Cu2MnBO5 phase boundary, the lines in the spectral range of 670–700cm−1 demonstrate another shift, which is 60° for the HH mode. This implies a change in the angles of the Me-O bonds in the octahedra, i.e., the octahedra turn due to the monoclinic distortions in the Cu2GaBO5-Cu2MnBO5 phases. Another situation occurs in Cu2CrBO5, namely the angular behavior of the intensity is close to orthorhombic ludwigites, which can indicate the minimal distortions of the structure in this compound.

5. Conclusions

Ludwigites are a complex compound family demonstrating multidirectional and diverse properties and high sensitivity to the composition, with a difficult process of preparing single crystal samples. Cu2CrBO5studied in this paperis representative of the family, in which the magnetoelectric effect and a number of magnetic features were detected for the first time. This paper presents the results ofastudy on the possibility of crystallization of this compound in flux systems using two different solvents based on Li2WO4-Li2O-B2O3 and Bi2O3-MoO3-B2O3-Na2O. The phase diagrams of these multicomponent systems were studied. The possibility and area of occurrence of the ludwigite phase were determined. The most perspective components ratios for growing samples of sufficient dimensions and without secondary phases were also determined. Toanalyzethe growth process, the solubility of Cr2O3 in the fluxes of different composition and changes in the valence state of copper and chromium were studied, depending on the working temperature range and flux content. The phase and chemical composition of the obtained samples were controlled using X-ray diffraction and the EDX technique.
The magnetic properties of the obtained Cu2CrBO5 samples were analyzed. In addition to the antiferromagnetic phase transition at TN = 119K, the anomaly at T = 42K was studied. The antiferromagnetic nature of the studied anomaly was shown, which can be related to the process of reordering a part of the magnetic subsystems. The spin-flop transition found in the field dependences of magnetization was also analyzed.
Polarized Raman spectra of Cu2CrBO5 were obtained for the first time. The angular intensity distribution was shown to be close to the pattern typical for orthorhombic ludwigites. The metal–oxygen octahedra had a small distortion degree, unlike other monoclinic ludwigites. Raman spectra of Cu2CrBO5 in the vicinity of the antiferromagnetic phase transition were also obtained and analyzed for the first time. Small shifts inthe lines were found, which can be associated with the magnetic ordering in the crystal.
Future research will be focused on the growth of Cu2CrBO5 single crystals with sufficientsize for the orientational study of magnetic and magnetoelectric properties. As it was shown in this paper, the main limiting factor hampering the possibility of producing larger crystals is the solubility of Cr2O3. To overcome this limitation, it is planned to start the production process with system (4) which allows for the stable single phase crystallization of Cu2CrBO5. Attention will be paid to increase the flux convection via an attempt to increase the saturation temperature, and to study the influence of mechanical mixing on the growth process.

Author Contributions

Conceptualization, E.M., E.E. and A.K.; methodology, E.M.; software, A.K.; validation, E.M. and A.K.; investigation, E.M., E.E., M.M., A.K. and D.K.; resources, E.M., E.E., M.M., A.K. and D.K.; data curation, E.M.; writing—original draft preparation, E.M.; writing—review and editing, E.M., E.E., M.M. and A.K. All authors have read and agreed to the published version of the manuscript.

Funding

The study was supported by a grant from the Russian Science Foundation and the Krasnoyarsk Regional Science Foundation No. 22-12-20019; https://rscf.ru/project/22-12-20019/.

Data Availability Statement

No new data were created or analyzed in this study. Data sharing is not applicable to this article.

Acknowledgments

The Raman, X-ray, magnetic measurements and EDX data were obtained using the analytical equipment of the Krasnoyarsk Regional Center of Research Equipment of the Federal Research Center “Krasnoyarsk Science Center SB RAS”.

Conflicts of Interest

The authors declare no conflict of interest.

References

  1. Damay, F.; Sottmann, J.; Fauth, F.; Suard, E.; Magnan, A.; Martin, C. High temperature spin-driven multiferroicity in ludwigite chromocuprate. Appl. Phys. Lett. 2021, 118, 192903. [Google Scholar] [CrossRef]
  2. Sofronova, S.; Bezmaternykh, L.; Eremin, E.; Chernyshov, A.; Bovina, A. Crystal Growth, Magnetic Properties and Analysis of Possible Magnetic Ordering of Ni5Sn(BO5)2 with Ludwigite Structure. Phys. Status Solidi B 2018, 255, 1800281. [Google Scholar] [CrossRef]
  3. Damay, F.; Sottmann, J.; Lainé, F.; Chaix, L.; Poienar, M.; Beran, P.; Elkaim, E.; Fauth, F.; Nataf, L.; Guesdon, A.; et al. Magnetic phase diagram for Fe3−xMnxBO5. Phys. Rev. B 2020, 101, 094418. [Google Scholar] [CrossRef]
  4. Heringer, M.A.V.; Freitas, D.C.; Mariano, D.L.; Baggio-Saitovitch, E.; Continentino, M.A.; Sanchez, D.R. Structural and magnetic properties of the Ni5Ti(O2BO3)2 ludwigite. Phys. Rev. Mater. 2019, 3, 094402. [Google Scholar] [CrossRef]
  5. Sofronova, S.; Nazarenko, I. Ludwigites: From natural mineral to modern solid solutions. Cryst. Res. Technol. 2017, 52, 1600338. [Google Scholar] [CrossRef]
  6. Moshkina, E.M.; Belskaya, N.A.; Molokeev, M.S.; Bovina, A.F.; Shabanova, K.A.; Kokh, D.; Seretkin Yu, V.; Velikanov, D.A.; Eremin, E.V.; Krylov, A.S.; et al. Growth Conditions and the Structural and Magnetic Properties of Cu2MBO5 (M = Cr, Fe, Mn) Oxyborates with a Ludwigite Structure. JETP 2023, 176, 17–25. [Google Scholar] [CrossRef]
  7. Moshkina, E.M.; Eremina, R.M.; Gavrilova, T.P.; Gilmutdinov, I.F.; Kiiamov, A.G. Flux Crystal Growth of Cu2GaBO5 and Cu2AlBO5 Ludwigites. J. Cryst. Growth 2020, 545, 125723. [Google Scholar] [CrossRef]
  8. Petrakovskii, G.A.; Bezmaternykh, L.N.; Velikanov, D.A.; Vorotynov, A.M.; Bayukov, O.A.; Schneider, M. Magnetic Properties of Single Crystals of Ludwigites Cu2MBO5 (M = Fe3+, Ga3+). Phys. Solid State 2009, 51, 2077–2083. [Google Scholar] [CrossRef]
  9. Moshkina, E.; Seryotkin, Y.; Bovina, A.; Molokeev, M.; Eremin, E.; Belskaya, N.; Bezmaternykh, L. Crystal formation of Cu-Mn-containing oxides and oxyborates in bismuth-boron fluxes diluted by MoO3 and Na2CO3. J. Cryst. Growth 2018, 503, 1–8. [Google Scholar] [CrossRef]
  10. Bruker AXS TOPAS V4: General Profile and Structure Analysis Software for Powder Diffraction Data; User’s Manual; Bruker AXS: Karlsruhe, Germany, 2008.
  11. Sheldrick, G.M. Crystal structure refinement with SHELXL. ActaCryst. A 2008, 64, 112–122. [Google Scholar]
  12. PLATON—A Multipurpose Crystallographic Tool; Utrecht University: Utrecht, The Netherlands, 2008.
  13. Brandenburg, K.; Berndt, M. DIAMOND—Visual Crystal Structure Information System; Crystal Impact: Bonn, Germany, 2004. [Google Scholar]
  14. Krylov, A.; Krylova, S.; Gudim, I.; Kitaev, Y.; Golovkina, E.; Zhang, H.; Vtyurin, A. Pressure–Temperature Phase Diagram of Multiferroic TbFe2.46Ga0.54(BO3)4. Magnetochemistry 2022, 8, 59. [Google Scholar] [CrossRef]
  15. Aleksandrov, K.S.; Voronov, V.N.; Vtyurin, A.N.; Krylov, A.S.; Molokeev, M.S.; Pavlovskii, M.S.; Goryainov, S.V.; Likhacheva, A.Y.; Ancharov, A.I. Pressure-induced phase transition in the cubic ScF3 crystal. Phys. Solid State 2009, 51, 810–816. [Google Scholar] [CrossRef]
  16. Poienar, M.; Hardy, V.; Kundys, B.; Singh, K.; Maignan, A.; Damay, F.; Martin, C. Revisiting the properties of delafossite CuCrO2: A single crystal study. J. Solid State Chem. 2012, 185, 56–61. [Google Scholar] [CrossRef]
  17. Moshkina, E.; Krylov, A.; Kokh, D.; Shabanova, K.; Molokeev, M.; Bovina, A.; Plyaskin, M.; Rostovtsev, N.; Bezmaternykh, L. Multicomponent Flux Growth and Composition Control of Cu2MnBO5:Ga Ludwigite. CrystEngComm 2022, 24, 3565. [Google Scholar] [CrossRef]
  18. Frandsen Benjamin, A.; Bozin Emil, S.; Eleni, A.; Fernández Martínez, A.; Feygenson, M.; Page, K.; Lappas, A. Nanoscale degeneracy lifting in a geometrically frustrated antiferromagnet. Phys. Rev. B 2020, 101, 024423. [Google Scholar] [CrossRef]
  19. Klein, S.; Weitzel, H. PERNOD—Ein ProgrammzurVerfeinerung von KristallstrukturparameternausNeutronenbeugungspulverdiagrammen. J. Appl. Cryst. 1975, 8, 54–59. [Google Scholar] [CrossRef]
  20. National Bureau of Standards; Monograph 25; U.S. Department of Commerce: Washington, DC, USA, 1984; Section 20; p. 20.
  21. Thiago, T.G.; Buzinaro, M.A.; Moreno, N.O. Magnetization Study in CuCr2O4 Spinel Oxide. J. Supercond. Nov. Magn. 2013, 26, 2557–2559. [Google Scholar] [CrossRef]
  22. Moshkina, E.; Bovina, A.; Molokeev, M.; Krylov, A.; Shabanov, A.; Chernyshov, A.; Sofronova, S. Study of flux crystal growth peculiarities, structure and Raman spectra of double (Mn,Ni)3BO5 and triple (Mn,Ni,Cu)3BO5 oxyborates with ludwigite structure. CrystEngComm 2021, 23, 5624. [Google Scholar] [CrossRef]
  23. Leite, C.A.F.; Guimarães, R.B.; Fernandes, J.C.; Continentino, M.A.; Paschoal, C.W.A.; Ayala, A.P.; Guedes, I. Temperature-dependent Raman scattering study of Fe3O2BO3 ludwigite. J. Raman Spectrosc. 2001, 33, 1–5. [Google Scholar] [CrossRef]
  24. Bragg, E.E.; Seehra, M.S. Magnetic Susceptibility of MnF, near T and Fisher’s Relation. Phys. Rev. B 1973, 7, 4197–4202. [Google Scholar] [CrossRef]
Figure 1. Structure of Cu2CrBO5. Cu—cyan; Cr—dark-yellow; B—blue; O—red.
Crystals 13 01415 g001
Figure 2. SEM image of Cu2CrBO5 obtained from the flux system (5).
Crystals 13 01415 g002
Figure 3. Thermal dependences of the magnetic susceptibility (χ) of two samples Cu2CrBO5, obtained from system (2), S1, and system (5), S2. Black—S1, H = 0.1T; red—S2, H = 0.5T. T1—the temperature of antiferromagnetic phase transition; T2—the temperature of the inflection point in the ordered phase.
Crystals 13 01415 g003
Figure 4. Raman spectra of Cu2CrBO5 obtained at room temperature in the HV (top figure) HH (bottom figure) modes. The experimental sample is shown in the inset.
Crystals 13 01415 g004
Figure 5. Raman intensity maps of Cu2CrBO5 obtained upon the parallel HH (a) and cross-parallel HV (b) polarization of the incident and scattered beams.
Crystals 13 01415 g005
Figure 6. Raman spectra of Cu2CrBO5 taken at different temperatures in the vicinity of the antiferromagnetic phase transition.
Crystals 13 01415 g006
Figure 7. Thermal dependence of the central positions of the Raman lines within the spectral range of the Me-O vibrations.
Crystals 13 01415 g007
Figure 8. Thermal dependences of ∂(χ·T)/ ∂T (χ—magnetic susceptibility) of two samples Cu2CrBO5, obtained from system (2), S1, and system (5), S2. Green—S1, H = 0.1T; black—S2, H = 0.5T; red—S2, H = 0.1T.
Crystals 13 01415 g008
Figure 9. Thermal dependences of ∂M/∂H of Cu2CrBO5, obtained from system (2), S1. The inset shows the magnetic field dependences of magnetization of S1. Black—T = 4.2K, dark blue—T = 10K, orange—T = 20K, green—T = 40K, blue—T = 60K, red—T = 80K, purple—T = 100K.
Crystals 13 01415 g009
Table 1. Structural data for (Cu,Cr)WO4 in comparison with pure CuWO4 [19] and CrWO4 [20].
CompoundCuWO4(Cu, Cr)WO4 (1)(Cu, Cr)WO4 (2)CrWO4
Space group, ZP-1, 2P2/c, 2P2/c, 2C2/m, 4
a, Å4.696404.6207 (2)4.7983 (5)9.2708
b, Å5.828705.6865 (2)5.708 (6)5.8282
c, Å4.873604.8963 (2)4.9747 (5)4.6446
α, ⁰91.630909090
β, ⁰92.44090.4950 (10)91.12 (1)91.926
γ, ⁰82.790909090
V, Å3 128.648 (9)136.22 (15)
Table 2. Structural data for Cu2CrBO5. Cu2CrBO5 (2)—the sample obtained from the bismuth-molybdenum system (2); Cu2CrBO5 (4)—the sample obtained from the lithium-tungstate system (4).
CompoundCu2CrBO5 (2)Cu2CrBO5 (4) [6]Cu2CrBO5 [1]
Space group, ZP21/c, 4P21/c, 4P21/c, 4
a, Å3.0606 (2)3.05250 (16)3.05487 (2)
b, Å11.9982 (8)11.98701 (61)12.18070 (8)
c, Å9.4481 (6)9.42955 (52)9.41432 (7)
β, ⁰95.5490 (10)95.3665 (15)94.5602 (4)
V, Å3345.32 (4)343.518 (32)
Disclaimer/Publisher’s Note: The statements, opinions and data contained in all publications are solely those of the individual author(s) and contributor(s) and not of MDPI and/or the editor(s). MDPI and/or the editor(s) disclaim responsibility for any injury to people or property resulting from any ideas, methods, instructions or products referred to in the content.

