1. Introduction
Metallic glasses (MGs) are highly non-conventional metallic alloys that possess an overall disordered (glassy) atomic structure, without any crystal grains or crystal-related defects. The unique structure endows MGs with a host of properties far surpassing those of their crystalline counterparts (conventional alloys), such as exceptionally high strength, hardness, wear- and corrosion-resistance, near-net-shape castability and thermoplastic processability [
1,
2,
3,
4,
5,
6,
7,
8,
9,
10,
11,
12,
13,
14,
15,
16]. One of the recent developments in this field is the creation of nano-sized MGs in the form of nanowires or nanorods [
17,
18,
19,
20]. This brings about possibilities to utilize the advantageous properties of MGs in nanoscale electromechanical or biomedical devices.
MGs are metastable materials and always possess a tendency to crystallize. In order to retain their glassy structure and associated properties, crystallization needs to be avoided during manufacturing process (or, heat-involving applications) of nano-sized MGs, particularly at elevated temperatures as employed in nanomoulding/nanoimprinting. Therefore, understanding how crystallization takes place in nano-sized MGs is of practical importance as well as fundamental scientific interest. From a different perspective, nano-sized MGs could be used as a precursor for producing nano-sized alloys with a poly- or single-crystalline structure, which also requires a good understanding of crystallization of nano-sized MGs.
One seemingly reasonable conjecture has been that the free surface of a nano-sized MG acts as the heterogeneous nucleation site for crystal formation, based on the well-known fact that the surface atoms are in a higher energy state than the interior atoms. However, if a crystal nucleus does form at the MG surface, the crystal atoms exposed on the surface will also possess higher energy than the atoms in the crystal interior, and hence it is not immediately clear why energetics should favor the crystal nucleation on the surface of a nano-sized MG. Recently, it has been proposed [
21] that, instead of heterogeneous nucleation on the free surface, crystal nucleation may occur in a homogeneous fashion within a near-surface layer (~1 nm from the free surface) due to the faster dynamics therein—compared with the further inside of the nano-sized MG.
In situ heating experiments on a TEM (transmission electron microscope) [
22] have been used to study crystallization of MG nanorods and have revealed clear effects of the sample size (diameter) on the apparent onset of crystallization. However, due to the 2D-projection nature of the TEM technique (as well as most other experimental techniques), it is not possible to determine the exact positions of the observed crystallites with respect to the 3D surface in the experiments (the information on the free surface above or below the central projected cross-sectional plane is overlapped with the information in the interior of the sample). Furthermore, the still limited spatial and time resolutions on most existing characterization instruments do not allow the capture of the full process of nucleation (i.e., subcritical-to-supercritical transition of a nucleus) or even early stage of crystal growth. As a result, the fundamental questions of where exactly nucleation takes place in a nano-sized MG and why, and how a supercritical nucleus grows three-dimensionally after nucleation, remain to be answered.
In this work, we use molecular dynamics (MD) simulations to investigate the crystal nucleation and growth in nano-sized MG samples. MD simulations, combined with posterior structural and potential energy analysis and atomistic visualization, provide access to great atomic-level details that are much needed to better understand crystallization of nano-sized MGs. The simulation results directly help address the aforementioned key questions regarding crystallization in nano-sized MGs.
3. Results and Discussion
Figure 1 shows the spatial distribution of the BCC (blue colored) and the BCC shell (gray colored) atoms in the 25 nm diameter MG nanorod at different temperatures during the simulated heating process. Note that the matrix (supercooled liquid) atoms are intentionally omitted in the figure. It is evident from
Figure 1 that the sample is undergoing crystallization. Both the top view (orthogonal projection, upper row in
Figure 1) and the side view (perspective projection, lower row in
Figure 1) clearly show that although BCC clusters are forming throughout the 3D material, nucleation, i.e., successful transition from a subcritical to supercritical nucleus, is virtually all occurring on the free surface. The subcritical nuclei (BCC clusters) dynamically form and re-dissolve into the supercooled liquid matrix, both in the interior and on the free surface. The supercritical nuclei formed on the free surface grow in three directions: inward/radial, lateral or longitudinal, at approximately equal rates, leading to a nearly semispherical shape of crystal grains (
Figure 1d,e,i,j).
To give more details,
Figure 2 provides a close-up view of the crystal grain marked as “X” in
Figure 1a,f. During the nucleation process and early growth stage (as represented by
Figure 2a,b), the grain exposes a single {1 1 0} plane on the free surface. It is well-known that {1 1 0} planes are the most close-packed in a BCC crystal structure, and when exposed on the surface, provide the lowest crystal surface energy. The {1 1 0} planes are indeed found to be used as the crystal surface by all the supercritical nuclei, including Grain
X and others. As shown in
Figure 2b, the newly formed supercritical nucleus of Grain
X on the free surface is essentially a stack of a few {1 1 0} planes, with a shape more like a platelet than a semisphere. This indicates an initial faster growth in the lateral and longitudinal directions than the inward/radial direction. As it enters the later growth stage (
Figure 2c), however, a single {1 1 0} plane can no longer serve as the crystal surface due to the curvature of the sample surface, and steps of {1 1 0} planes emerge on the crystal surface. Since steps represent a higher energy state than a perfect single {1 1 0} plane, this slows down the growth of the crystal grain on the surface, and the inward/radial growth catches up, driving the overall shape of the grain towards a near-semisphere.
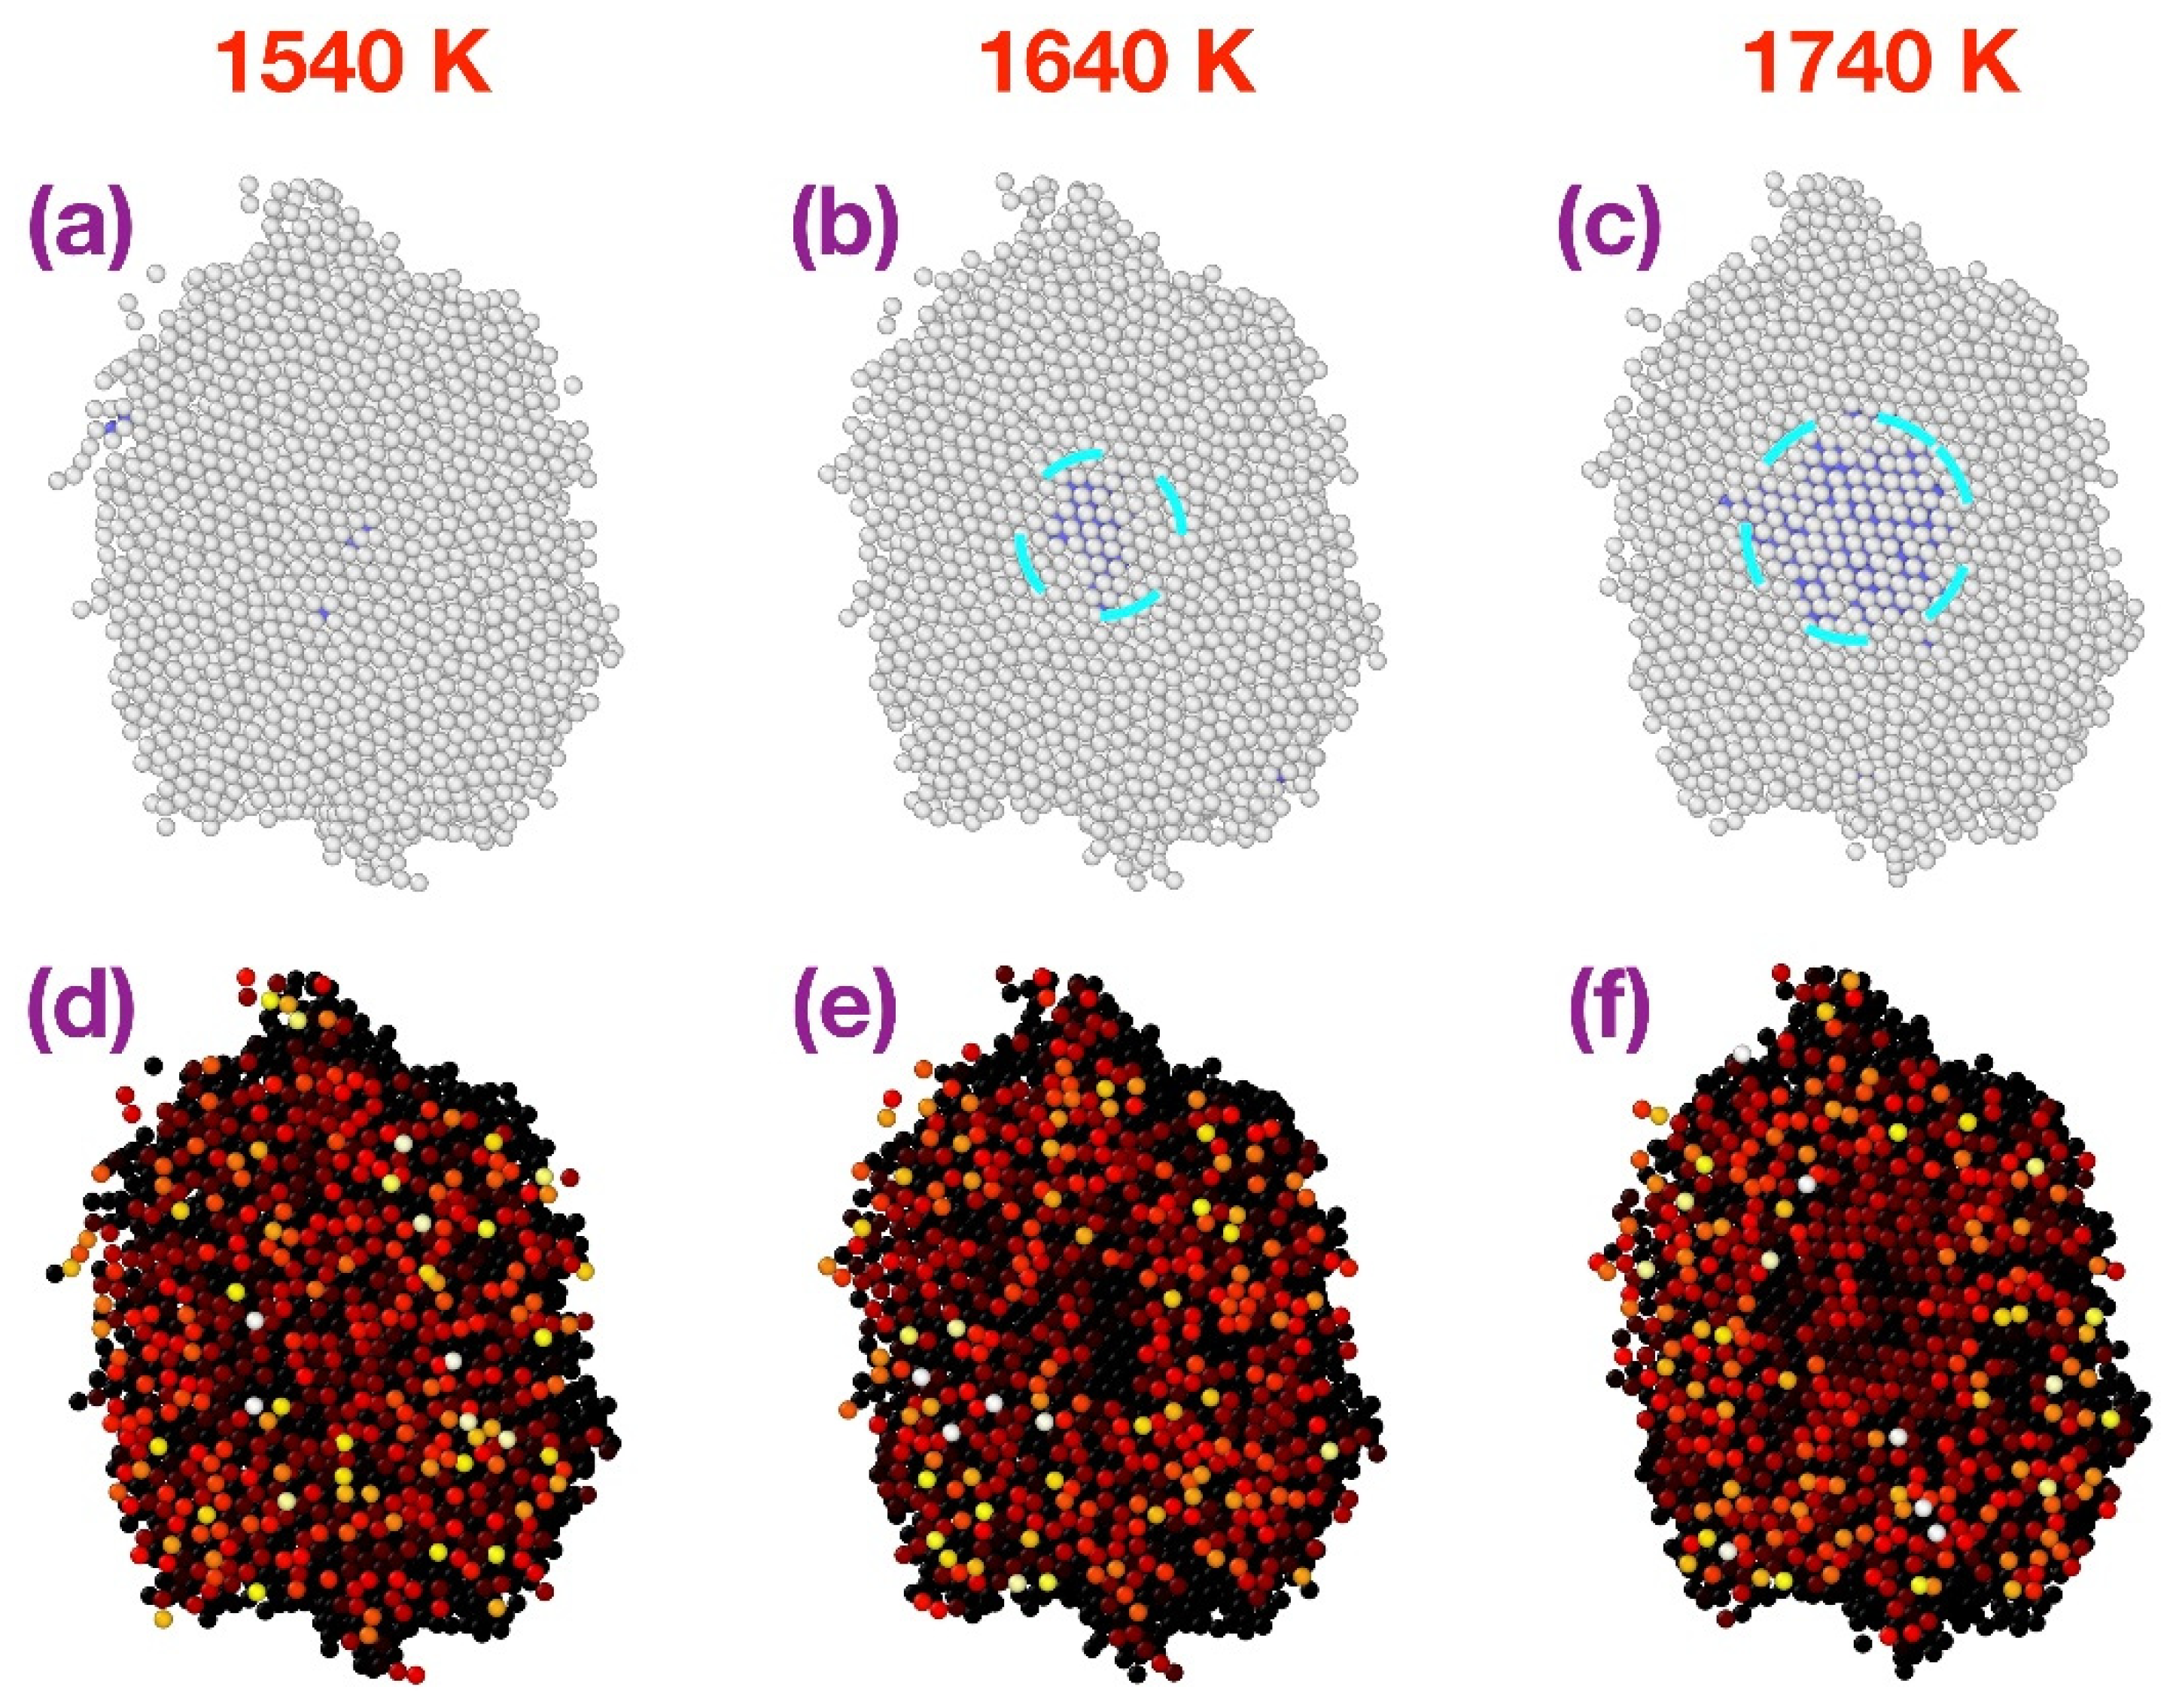
To understand why nucleation predominantly occurs on the surface, we perform potential energy analysis for atoms within a 3D volume surrounding the Grain
X. This includes BCC atoms, BCC shell atoms and matrix (supercooled liquid) atoms.
Figure 3a–c present the front view (from outside the surface) of these atoms at 1540, 1640 and 1740 K, respectively, using the same color scheme (blue: BCC; gray: non-BCC) as in
Figure 1 and
Figure 2 to indicate the structural environment of each atom. It can be seen that the Grain
X (marked with the dashed circle) is nucleated around 1640 K and is growing at 1740 K.
Figure 3d–f show the corresponding potential energy (E
p) distribution among the atoms, represented by a “hot” color scheme (black-red-yellow-white, in the order of increasing E
p). By comparing
Figure 3e with
Figure 3d and referring to the corresponding structural change in
Figure 3a,b, one can notice that the BCC-shell atoms exposed on the surface due to nucleation of the Grain
X create a darker, lower energy zone in the middle of the (supercooled) liquid surface. This lower energy zone on the surface expands as the grain grows, as shown by
Figure 3b,c,e,f.
To be more quantitative, we further divide the atoms in
Figure 3 into five categories: 1. BCC atoms, 2. BCC shell atoms on the surface, 3. BCC shell atoms in the sample interior, 4. liquid atoms on the surface, and 5. liquid atoms in the sample interior. We then calculate the average potential energy (
) for each category at 1740 K (where there are an adequate number of atoms in each category). The resulting
value is: −7.80, −6.77, −7.69, −6.54, −7.68 eV/atom, for the five categories named above, respectively. The BCC atoms possess the lowest
among the five, as expected from their crystalline environment. These atoms correspond to the shaded zone, “Crystal (
X)”, in
Figure 4—the traditional sketch used to explain heterogeneous nucleation. The
of the liquid interior atoms (corresponding to the “Liquid (
L)” zone in
Figure 4) is higher than that of the BCC atoms by 0.12 eV/atom. The BCC shell atoms on the surface, corresponding to the zone shared by
X and
S in
Figure 4, possess an energy higher than the BCC atoms by 1.03 eV/atom. The BCC shell atoms in the sample interior, corresponding to the zone shared by
X and
L in
Figure 4, possess an energy higher than the BCC atoms by 0.11 eV/atom, but lower than the BCC shell atoms on the surface by 0.92 eV/atom. If considering this fact only, one might anticipate that a BCC nucleus would prefer to build its shell entirely in the sample interior. However, it is important to notice that the
of the BCC shell atoms in the sample interior is only 0.01 eV/atom lower than that of the liquid interior atoms, while the
of the BCC shell atoms on the surface is 0.23 eV/atom lower than that of the liquid surface atoms (
L-S shared zone in
Figure 4). This means that the BCC shell in the sample interior is more vulnerable to the attack (i.e., redissolution) by the liquid interior than the BCC shell on the surface is to the attack by the liquid surface atoms. This explains why nucleation predominantly takes place on the nanorod surface.
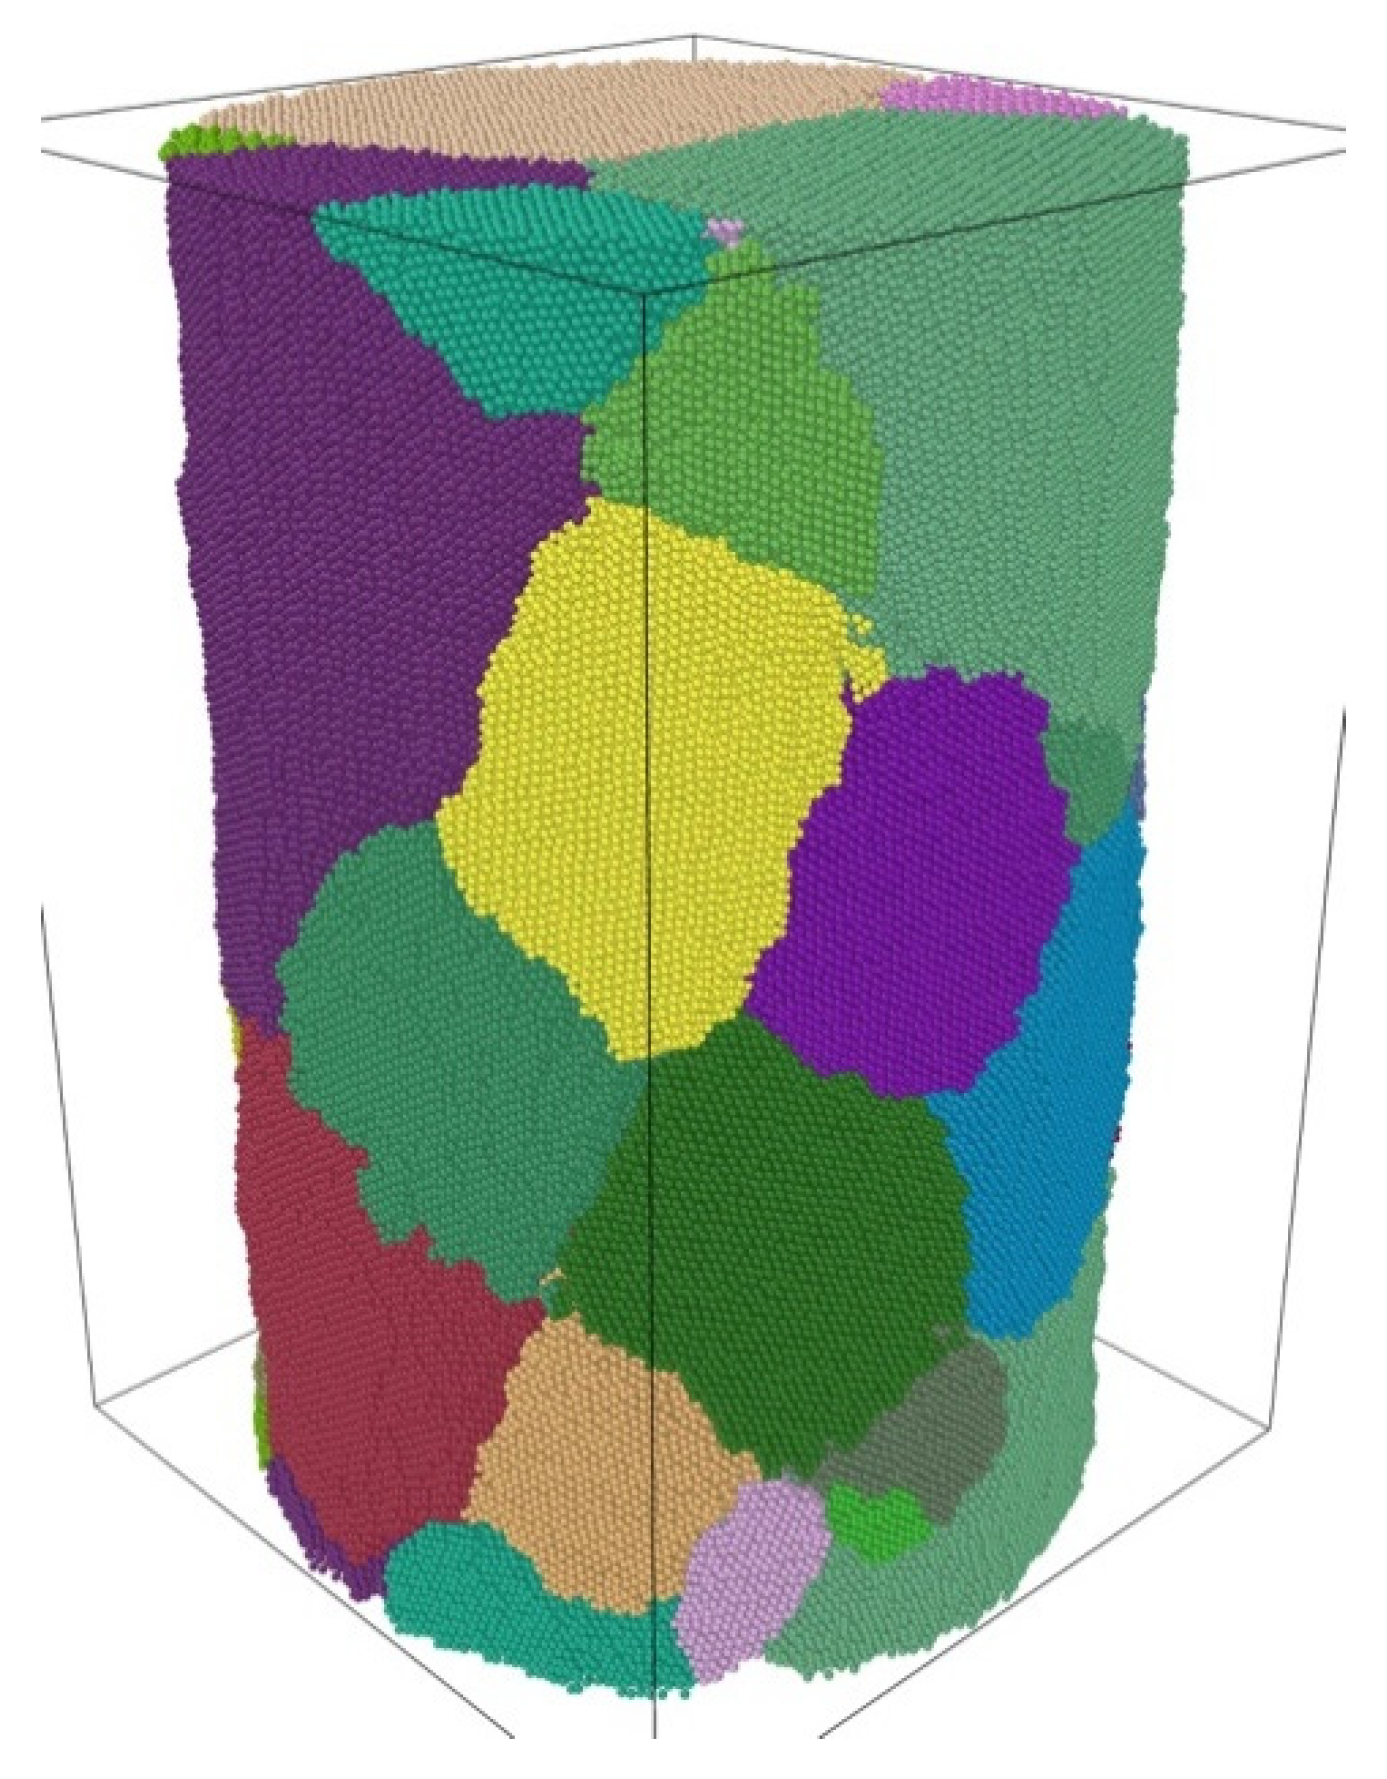
As the early nucleated grains grow in three dimensions, more supercritical nuclei are forming on the nanorod surface. The transformation of the surface of the 25 nm diameter nanorod from the (supercooled) liquid surface to the crystal surface is completed by 2160 K. Shortly after that, all the interior liquid atoms are transformed to either BCC or BCC shell atoms by 2220 K due to continued grain growth. The resulting polycrystalline structure is presented in
Figure 5 where colors are used to indicate the different orientations of the grains. The grains are mostly close to semispherical (or, equiaxed but halved along the radial direction).
The main features of nucleation and growth described above for the 25 nm diameter nanorod are largely applicable to the 20, 15 and 10 nm diameter nanorods. In particular, the nucleation in all these samples predominantly takes place on the free surface.
Figure 6 presents the top and the side views of all BCC clusters (subcritical or supercritical) in the 10 nm diameter nanorod at different temperatures, which again shows the heterogeneous nucleation on the surface and the three-dimensional growth at the early stage.
However, some new features of crystal growth appear with decreasing nanorod diameter. Grain
Y, which is marked in
Figure 6e, initially grows three dimensionally but later fragments into three smaller grains with a reduced dimension (width) in the lateral direction, as can be seen from
Figure 6h. The subsequent growth of these fragments leads to the three longitudinally extending grains at the front and middle of
Figure 7 which appear to have been growing preferentially in the longitudinal direction. The fragmentation of the Grain
Y has two reasons: (a). the cylindrical surface with the small diameter exerts bending strain on the original single {1 1 0} surface plane of the supercritical nucleus, and (b). formation and joining of affiliated BCC clusters at the frontline of growth with somewhat different orientations (see
Figure 6g). Fragmentation, however, does not occur to all the grains.
Another new feature of growth is demonstrated by the Grain
Z which is marked in
Figure 6e. This grain manages to fill the entire cross section (by ~2020 K) before being interrupted laterally by other grains, and the subsequent growth of this grain becomes solely longitudinal. This produces a single-crystal segment along the length of the nanorod, as can be seen at the bottom of
Figure 7 (another segment, colored green near the top, is also a single crystal grain). Two factors, both related to the small diameter of the nanorod, are considered to have contributed to this behavior. The first one is the shorter dimension over which a supercritical nucleus needs to grow in the radial direction in order to fill the cross section. The second one is the smaller number of supercritical nuclei (grains) being formed on the surface due to the reduced surface area, which can be seen from
Figure 8 where the number of supercritical nuclei (grains) is plotted as a function of time (and temperature) for the four different nanorod diameters studied. While the 25 nm and 20 nm diameter nanorods produce similar numbers of supercritical nuclei, the 15 nm and 10 nm nm diameter nanorods clearly show the decreasing number of supercritical nuclei as the nanorod diameter goes down. The smaller number of supercritical nuclei provides Grain
Z with more time to grow and fill the cross section without interruption. The reduced nucleation probability/frequency due to reduced surface area in very small diameter nanorods has previously been inferred in an experimental work [
22] although it is not possible to precisely determine the number of supercritical nuclei in experiments because of limitations of experimental techniques as discussed in Introduction.
Finally, we point out that the above reported results should be largely valid over a range of nanorod diameters. In the meantime, it can also be inferred that, when the nanorod diameter increases beyond a certain value (possibly a few hundred nanometers), homogeneous nucleation of crystals from the interior of the supercooled liquid may start to take a role before the supercritical nuclei formed on the free surface could transform the entire sample to a crystalline structure. MD simulation of the crystallization of the bigger diameter nanorods, however, would be much more computationally expensive.


