1. Introduction
In recent years, frequent food safety incidents have become one of the most serious public health concerns. The spread of diseases caused by bacterial and microbial contamination results in significant economic losses and public health safety risks [
1,
2]. In the household sanitary equipment market, there is an increasing demand for products with antibacterial properties; thus, the development of stainless steel tableware with antibacterial properties has begun [
3,
4]. By adding antibacterial elements such as copper (Cu) into the stainless steel smelting process, the manufactured stainless steel can obtain good antibacterial properties after a proper heat treatment process [
5,
6]. Yang et al. observed that copper-bearing stainless steel released Cu ions with a bactericidal function, which could effectively reduce human infections caused by bacteria and microorganisms as well as the microbial corrosion of stainless steel [
7,
8,
9].
As a new type of structural and functional integrated material, it is expected that, with an improvement in the antibacterial properties, the corrosion resistance of copper-bearing stainless steel will not decrease. However, the effect of Cu alloying on the behavior of corrosion is still controversial. Oguizie et al. suggested that Cu had a negative effect on the corrosion resistance of austenitic stainless steel in a 0.1 M sulfuric acid solution [
10]. Zhang et al. reported that, after a solution-aging treatment, 304Cu stainless steel had a Cu-rich phase and the defect density of the passive film increased in 0.5 M sulfuric acid [
11]. Ujiro et al. reported that Cu was deposited on the surface of austenitic steels and corrosion resistance was improved through the suppression of active dissolution in chloride media [
12]. Tomio et al. reported that copper sulfide formed in an H
2S-Cl
− environment and it enhanced the formation of the chromium oxide film, which improved the pitting corrosion resistance of austenitic steels [
13].
304 stainless steel has become the most widely used austenitic stainless steel due to its good corrosion resistance as well as it being easy to process and cost-effective [
14,
15,
16]. 304Cu as an antibacterial stainless steel is a potential candidate that meets the requirements of daily applications. The direct solution of copper-bearing stainless steel without an aging treatment has higher economic benefits in production. However, it also affects the corrosion resistance of stainless steel. Therefore, the corrosion behavior of solution-treated Cu-bearing austenitic stainless steels in aggressive solutions still demands a better understanding.
In this study, salt spray tests, FeCl3 immersion tests and an X-ray photoelectron spectroscopy analysis were carried out to investigate the pitting behavior of copper-bearing 304 stainless steel in different corrosive solutions. The differences in the pit depth, pit width and corrosion behavior of 304 and 304Cu were discussed. The work aimed to reveal the influence of Cu on the corrosion resistance of 304.
2. Materials and Methods
2.1. Materials
304 and 304Cu stainless steels (provided by Guang Qing Metal Technology Limited) were used in this research. The chemical compositions (provided by the supplier) are shown in
Table 1. These two steels were heated to 1250 °C, then rolled into a 3.5 mm thick strip. The steel strip was subjected to solution treatments at 1100 °C for 10 min and then cold rolled to 0.6 mm. The strip was then subjected to solution treatments at 1000~1050 °C for 5~10 min, followed by hydrofluoric acid and hydrogen peroxide washing. The thickness of the experimental sheets was 0.6 mm.
2.2. Experimental Methods
2.2.1. Salt Spray Test
The salt spray test referred to ISO 9227-2017 [
17]. All specimens were ground by SiC abrasive paper to a 1200 grit finish and ultrasonically cleaned with absolute ethanol. The specimens were then placed into the salt spray test chamber (HUAIAN ZHONGYA 750B. No.8 Kaiming Road, Qingjiangpu District, Huaian City, Jiangsu Province). The specimens faced upwards at an angle of 20°. The solution used was 5 wt.% NaCl (Sinopharm Chemical Reagent Co., Ltd. No.385 Longhua East Road, Huangpu District, Shanghai) and the temperature was set at 35 ± 2 °C. Continuous spraying experiments were carried out for 168 and 480 h. There were 5 samples under each test condition. The samples were labelled as S1, S2, S3, S4 and S5, accordingly. A ZEISS Sigma 300 scanning electron microscope (SEM) equipped with an energy dispersive spectrometer (EDS) was used to observe the morphologies of the pits and measure the element distributions. The depth and width of the pits were measured by an optical microscope (ZESSI Smartzoom 5. No.60 Meiyue Road, Waigaoqiao Free Trade Zone, Pudong New Area, Shanghai). The widths of the pits were measured in two directions and the average value was recorded. Pits smaller than 5 μm in width were not included in this study. Only the maximum depth of each pit was recorded.
2.2.2. FeCl3 Immersion Test
The FeCl
3 immersion test referred to ASTM G48-11 [
18]. Specimens were ground with SiC abrasive paper to a 1200 grit finish. The specimens were hung on wires and immersed in 500 mL of 6 wt.% FeCl
3 for 72 h at room temperature (22 ± 1 °C). After the experiment, the samples were ultrasonically cleaned with absolute ethanol and weighed to calculate the corrosion rates. There were 5 samples under this test condition. The samples were labelled as S1, S2, S3, S4 and S5, accordingly. SEM and EDS were used to observe the morphology of the pits and understand the element distributions. The solution was analyzed by an inductively coupled plasma atomic emission spectrometer (ICP-MS) to measure the Cu ion content.
2.2.3. X-ray Photoelectron Spectroscopy Analysis
X-ray photoelectron spectroscopy was used to analyze the valence change of Cu in 304Cu after exposure to 5 wt.% NaCl and immersion in 6 wt.% FeCl3. The XPS measurements were performed using a Thermo Fisher Scientific K-Alpha system. The vacuum degree of the analysis chamber was 5 × l0−10 Pa and the X-ray resource was Al Kα (1486.68 eV; 15 kV). The filament current was 10 mA and the signal accumulation was carried out for 5–10 cycles. The passing energy was 50 eV and the step size was 0.05 eV.
3. Results
3.1. Salt Spray Test
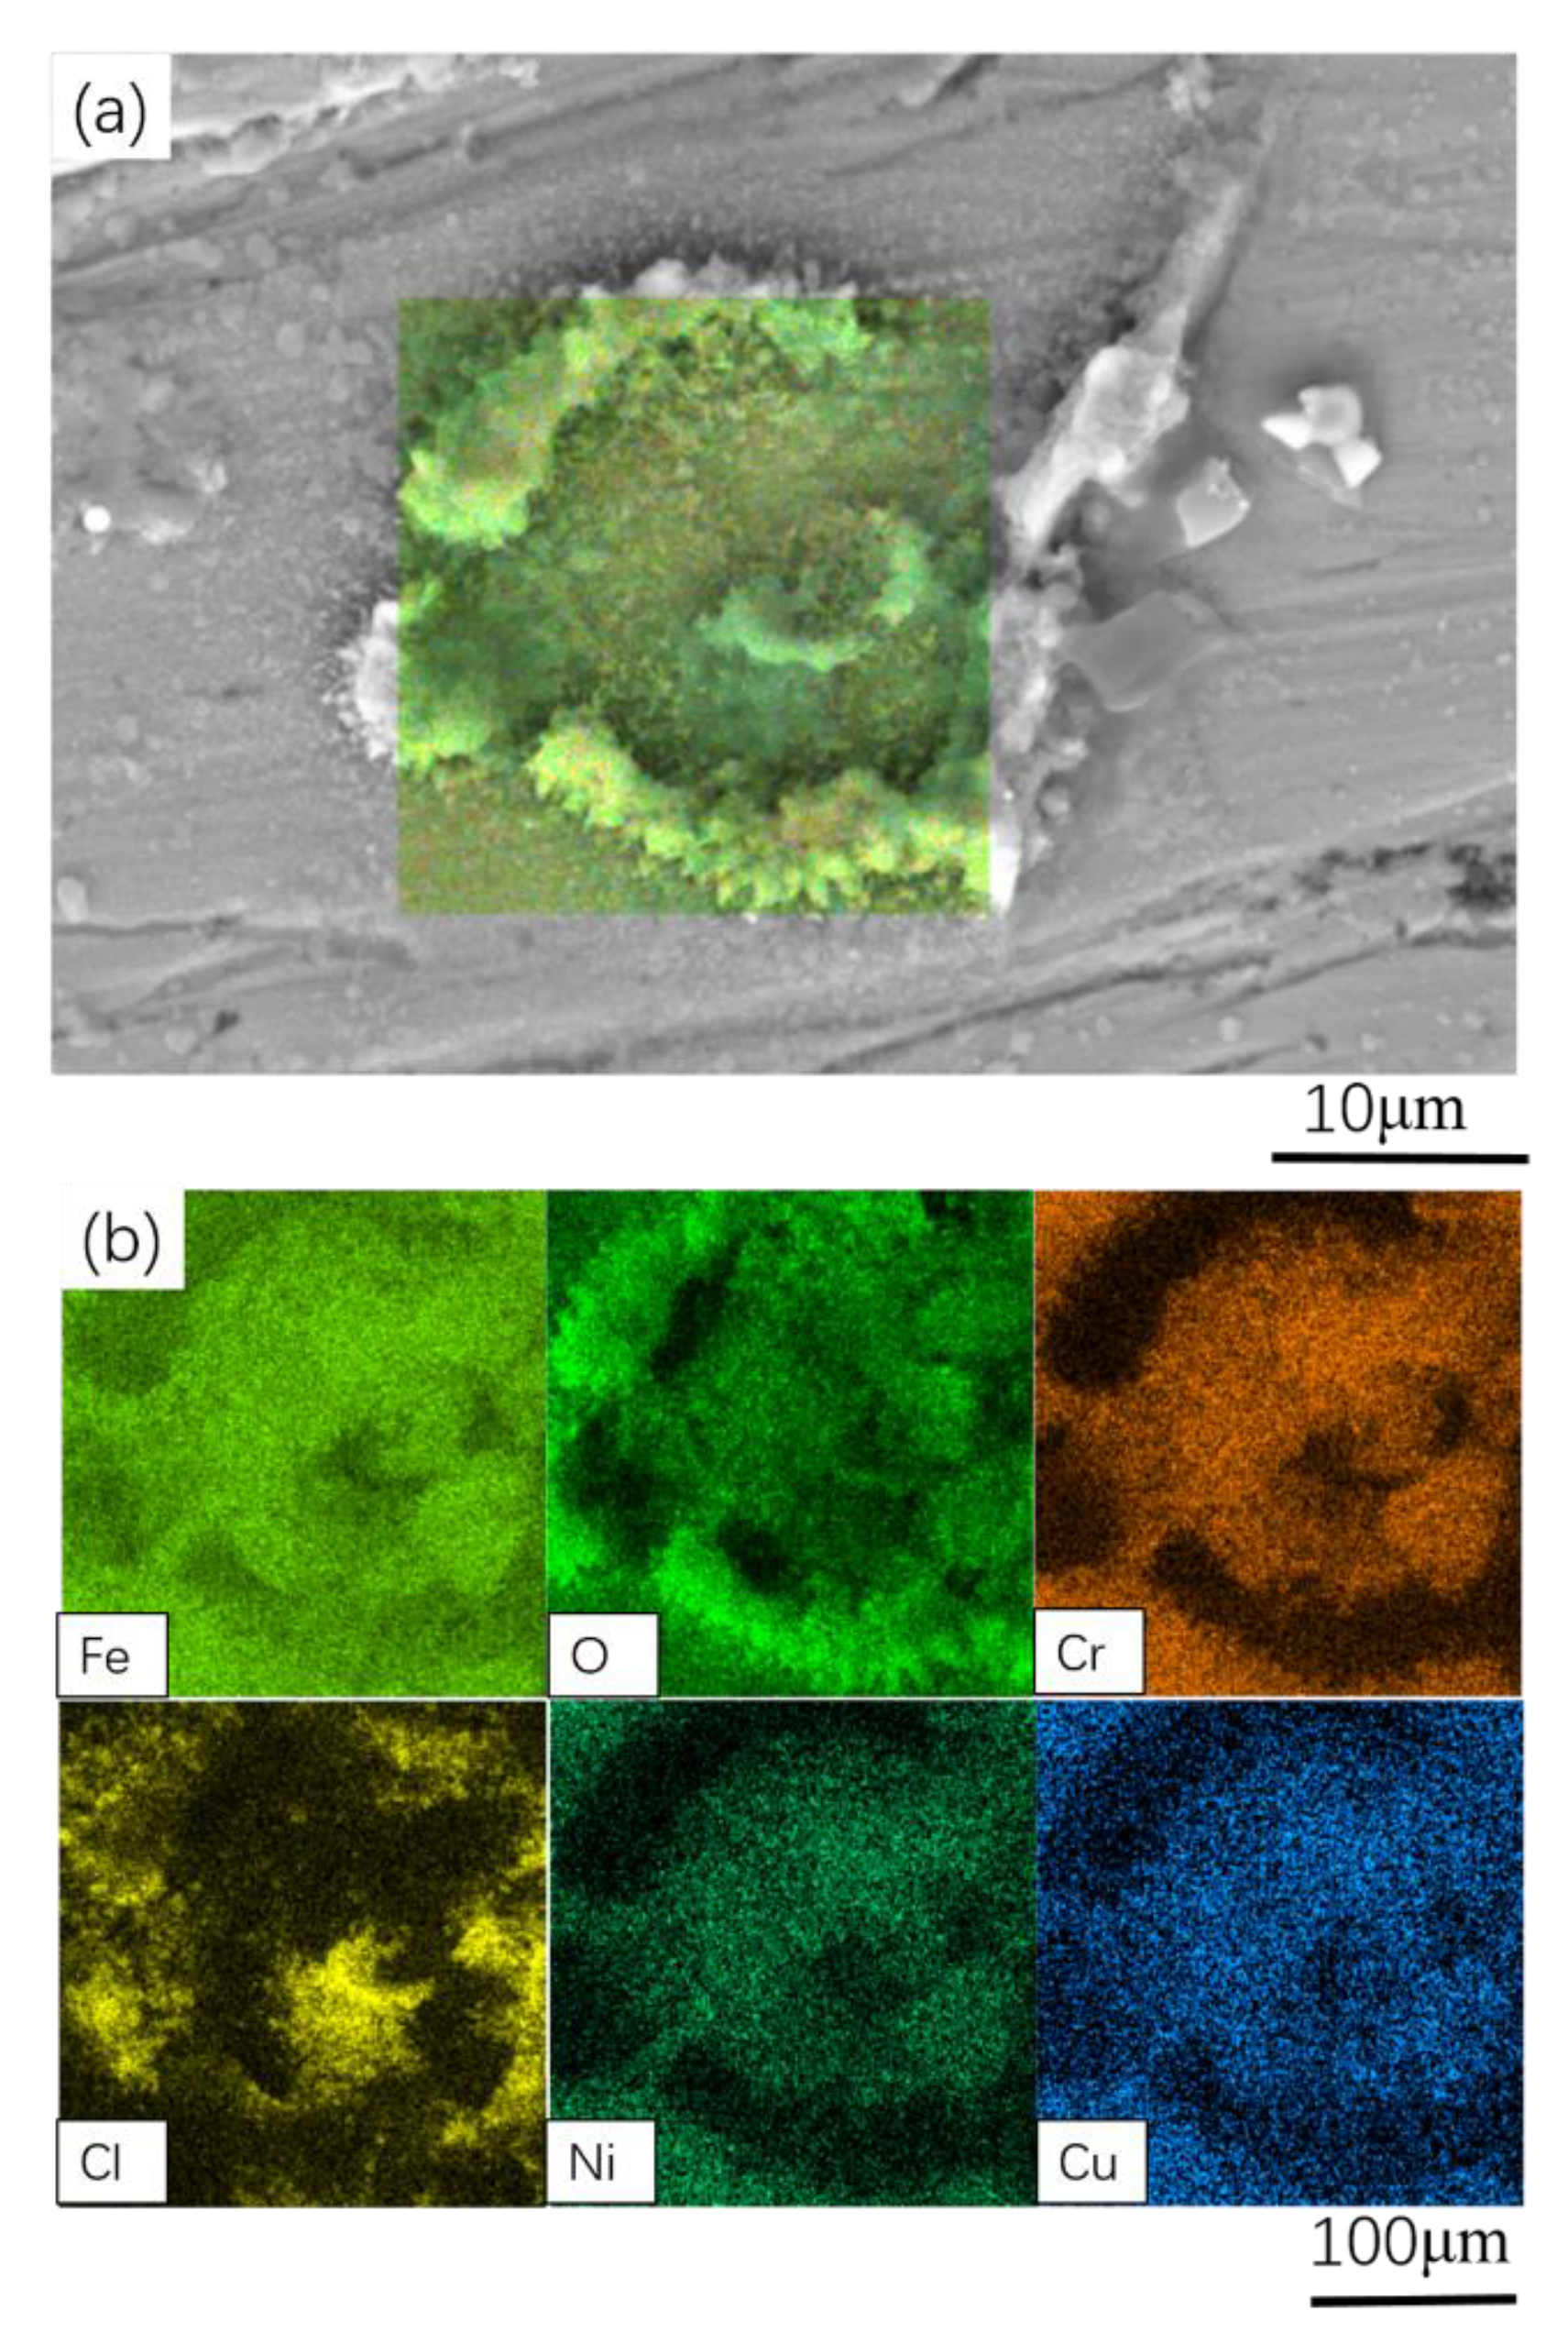
In a chloride environment, stainless steel is susceptible to pitting corrosion. In the salt spray test, there was no obvious difference in the pitting morphology between 304Cu and 304. The typical morphology of the pits on 304Cu after a 480 h salt spray test is shown in
Figure 1. The pit was shallow and grinding marks were observed on the surface. The width of the pit was about 20 μm. The EDS results in
Figure 1 showed that there were iron oxides and chloride complexes in the corrosion products, but there was no Cr and Ni. No obvious Cu was found in the corrosion products. Cu was evenly distributed on the surface. With an increase in the test time, there was no obvious difference in the pitting corrosion morphology and the addition of Cu had no obvious effect on the pitting morphology.
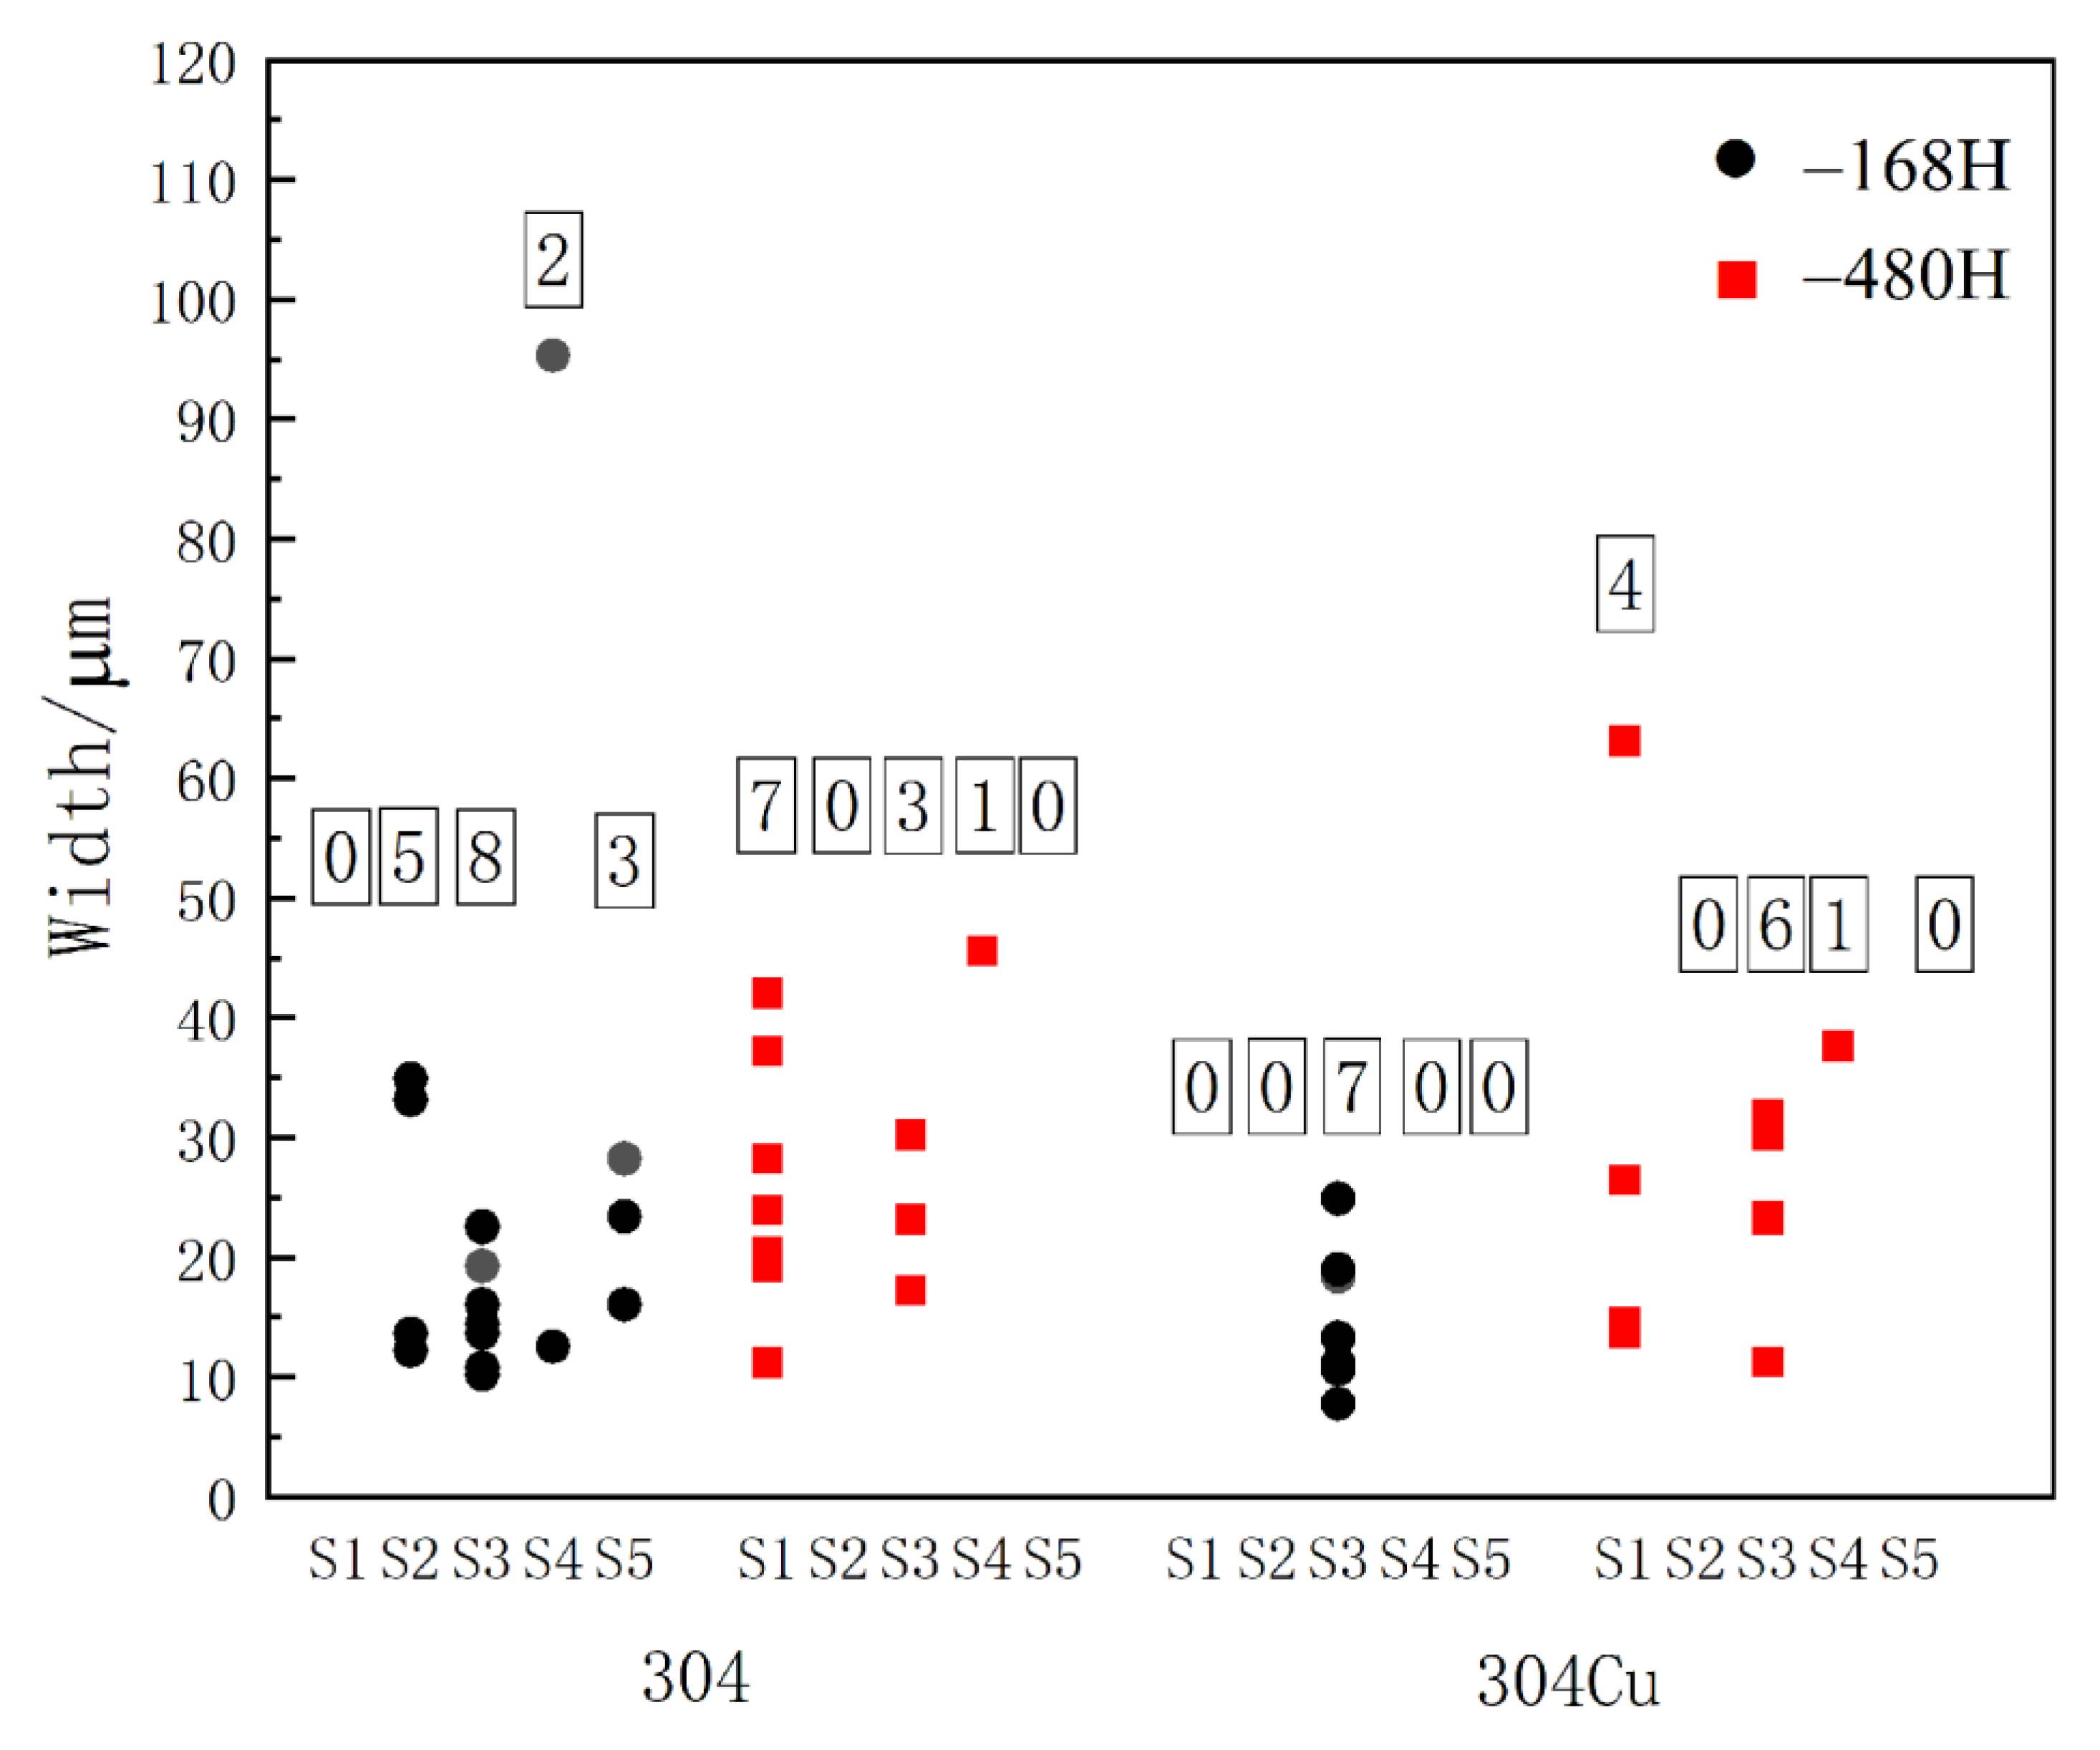
Figure 2 shows the numbers and widths of the pits on 304 and 304Cu after exposure for 168 h and 480 h. The numbers in the black boxes represent the numbers of pits per sample. Each pit is indicated by a dot in the figure.
Table 2 shows the values of the numbers and widths on 304 and 304Cu. The pits formed from the salt spray tests were relatively shallow; all were within 3 μm. In the 168 h experiment, there were more pits in 304 than 304Cu. There was a large pit in the S4 sample of 304, the size of which was more than 90 μm. Pits were only found in S3 of 304Cu. In the 480 h experiment, pits were found in 3 samples in 304 and 304Cu. The pits were usually smaller than 50 μm in width. However, there were large pits in the S1 sample of 304Cu, the size of which were more than 60 μm.
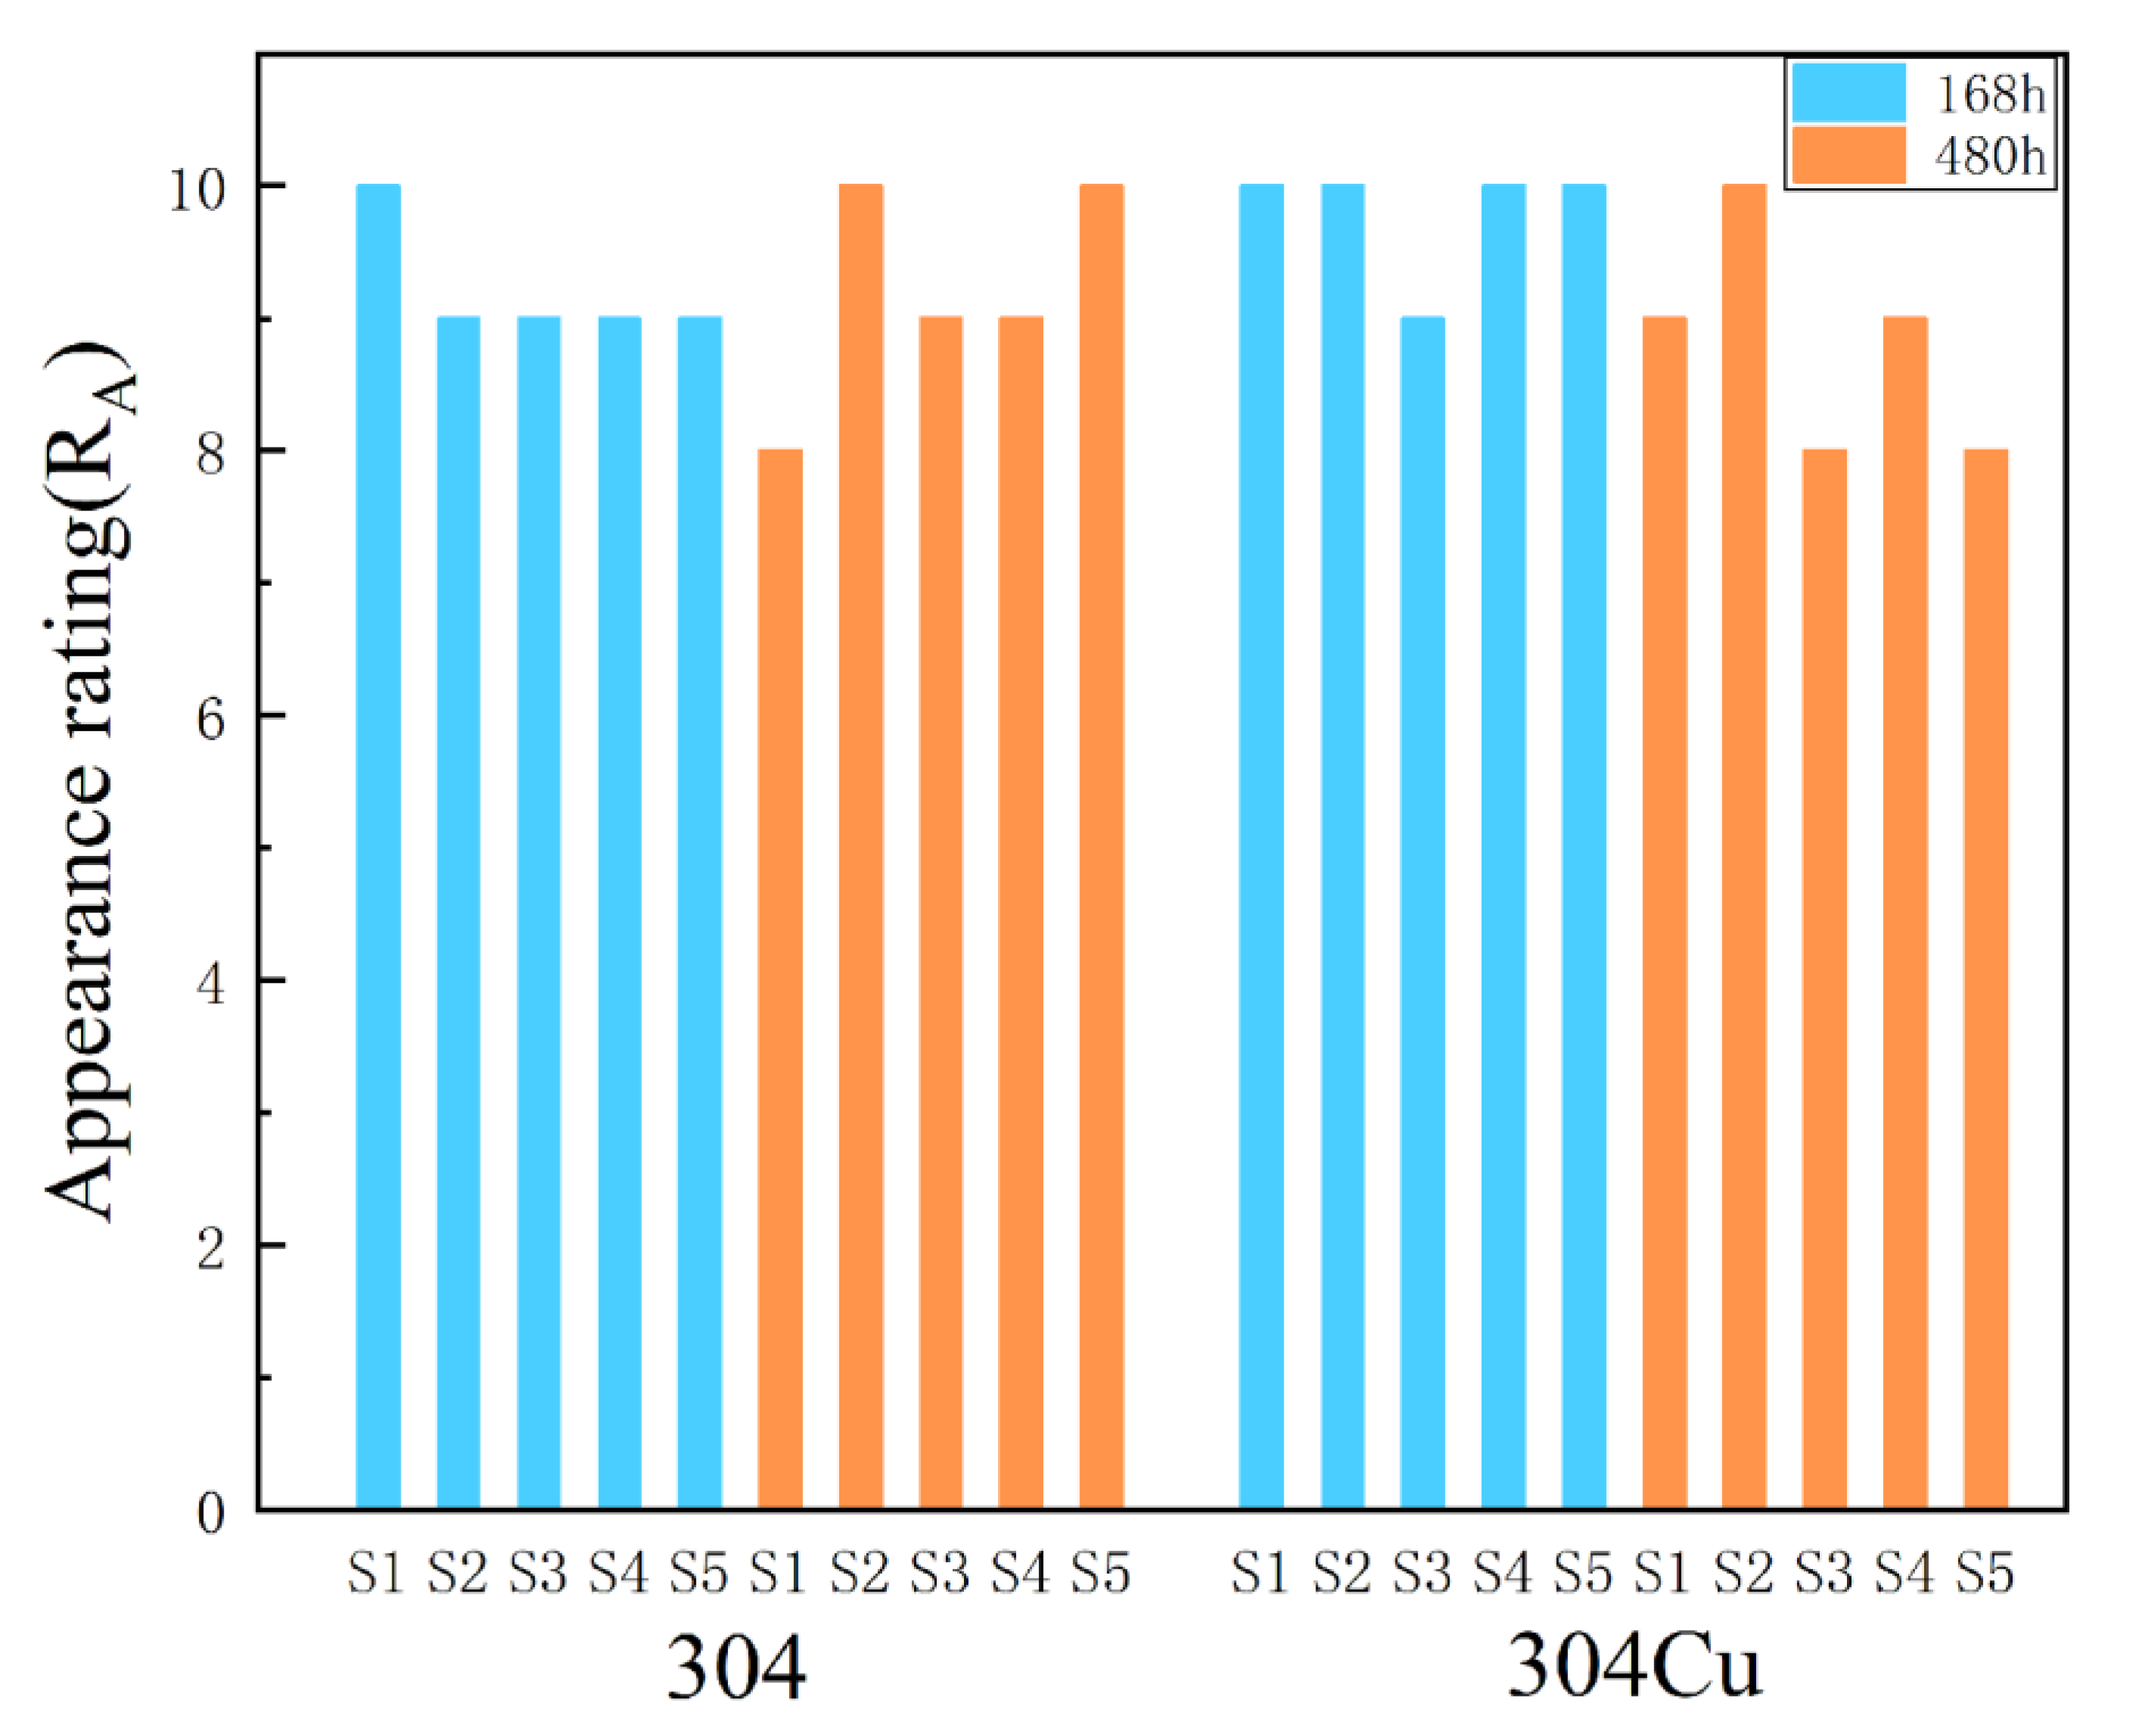
Figure 3 is the appearance ratings of the samples based on the defect area with reference to ISO 10289-2006 [
19]. The corroded area at the edge was not taken into account to exclude any edge effect. After 168 h of salt spray tests, pits were only observed on one sample of 304Cu; 304 had pits, except for one sample with an appearance grade of 10. In the 480 h salt spray test, when comparing 304 and 304Cu, the appearance grade of 304Cu was lower, i.e., the corrosion resistance of 304Cu was worse. Comparing the results of the 168 h and 480 h tests, the area of surface defects of 304Cu increased with an increase in the exposure time; the appearance grade of 304 did not significantly change with an increase in the test time. The corrosion resistance of 304Cu was better in the 168 h experiment. However, with the increase in the experimental time, the corrosion resistance of 304Cu significantly decreased.
3.2. FeCl3 Immersion Test
The NaCl environment of the salt spray tests was relatively mild. The 6 wt.% FeCl
3 solution was of a higher chloride ion concentration and a high oxidizing power; thus, the environment was much more aggressive.
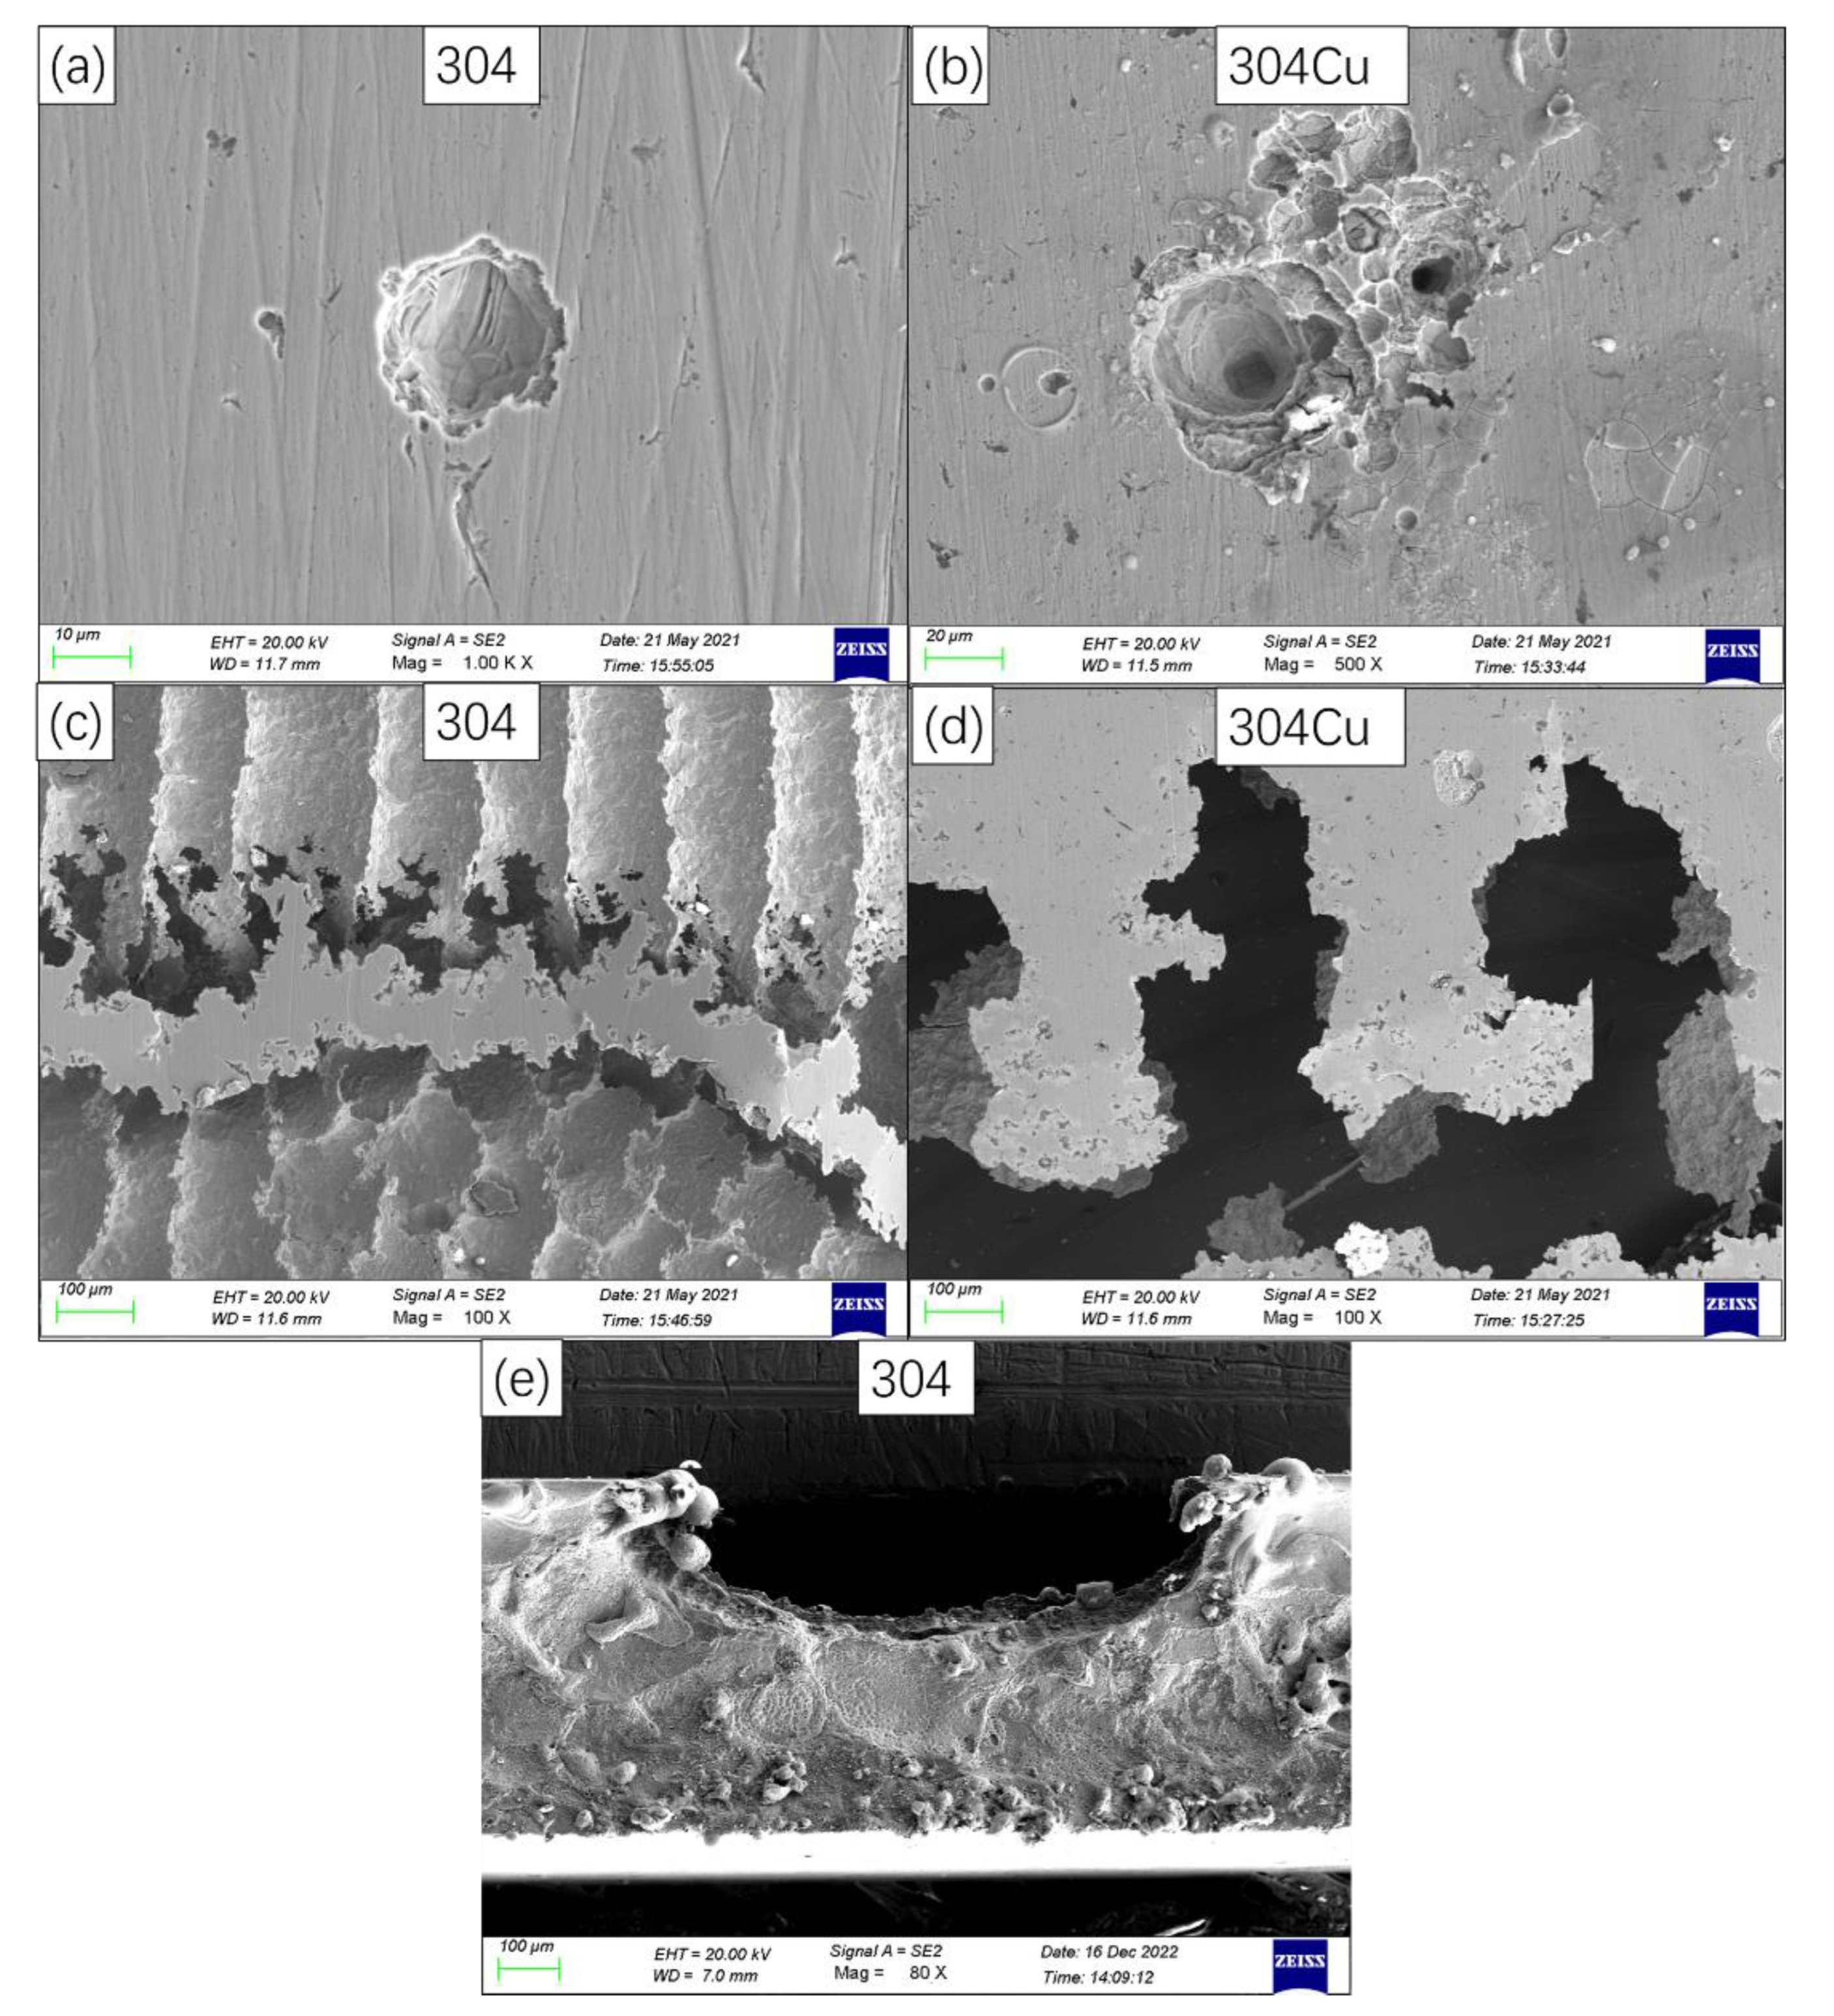
Figure 4 illustrates two typical morphologies of samples after immersion in FeCl
3 with non-penetrating and penetrating pits.
Figure 4a,b show examples of non-penetrating pits in 304 and 304Cu. The non-penetrating pit of 304 had ridges in its wall. The pit of 304Cu had a similar morphology with corrosion products around it.
Figure 4c is an example of penetrating pits in 304; most of the pit had a stripped morphology, but the end part of the strip was penetrating.
Figure 4d illustrates the fishbone morphology of the penetrating pits in 304Cu. Compared with 304, the penetrating area in 304Cu was much larger as the main and side part of the pit were both penetrating.
Figure 4e shows a typical cross-section of the 304 penetrating pits, which shows a semi-circular pit.
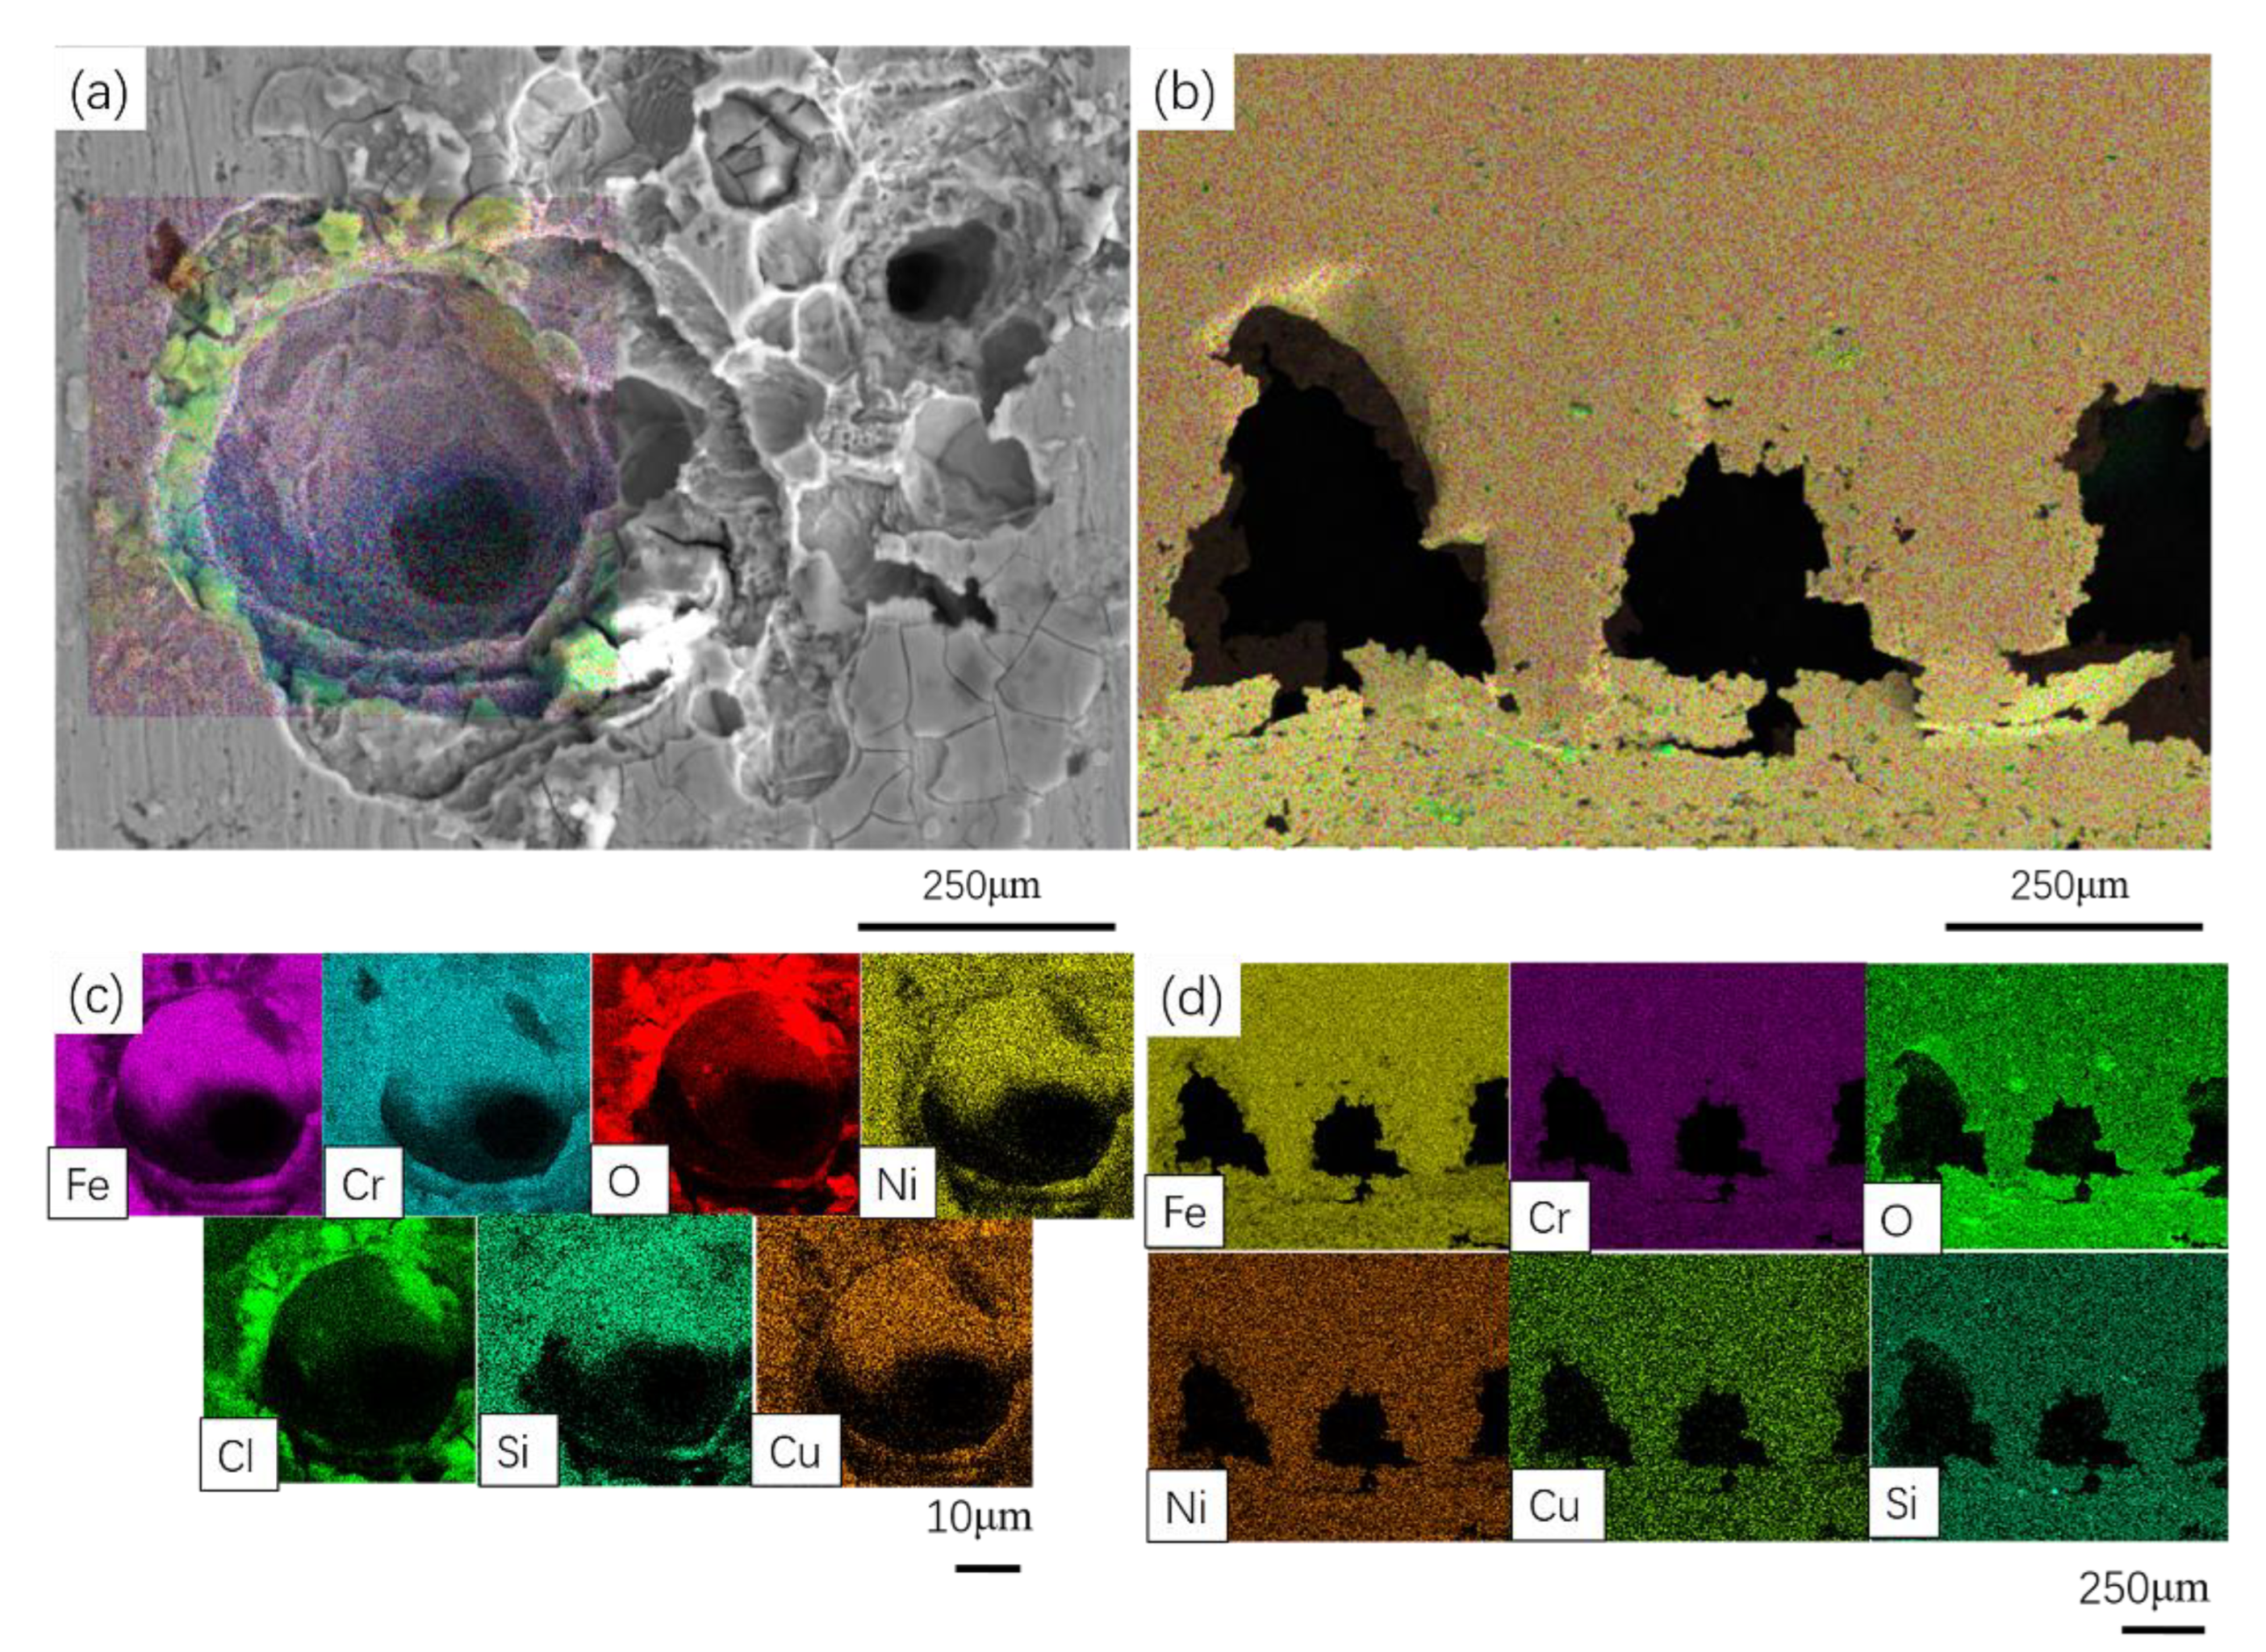
Figure 5 shows the results of the Cu element distribution of the pits observed on 304Cu after immersion in FeCl
3 solutions. In the non-penetrating pits (
Figure 5a,c), there were oxides and chloride complexes of iron, chromium, nickel, silicon and copper in the corrosion products. In the penetrating pit (
Figure 5b,d), Cu was evenly distributed on the steel matrix. There were oxides and a small amount of Si in the local area around the pit.
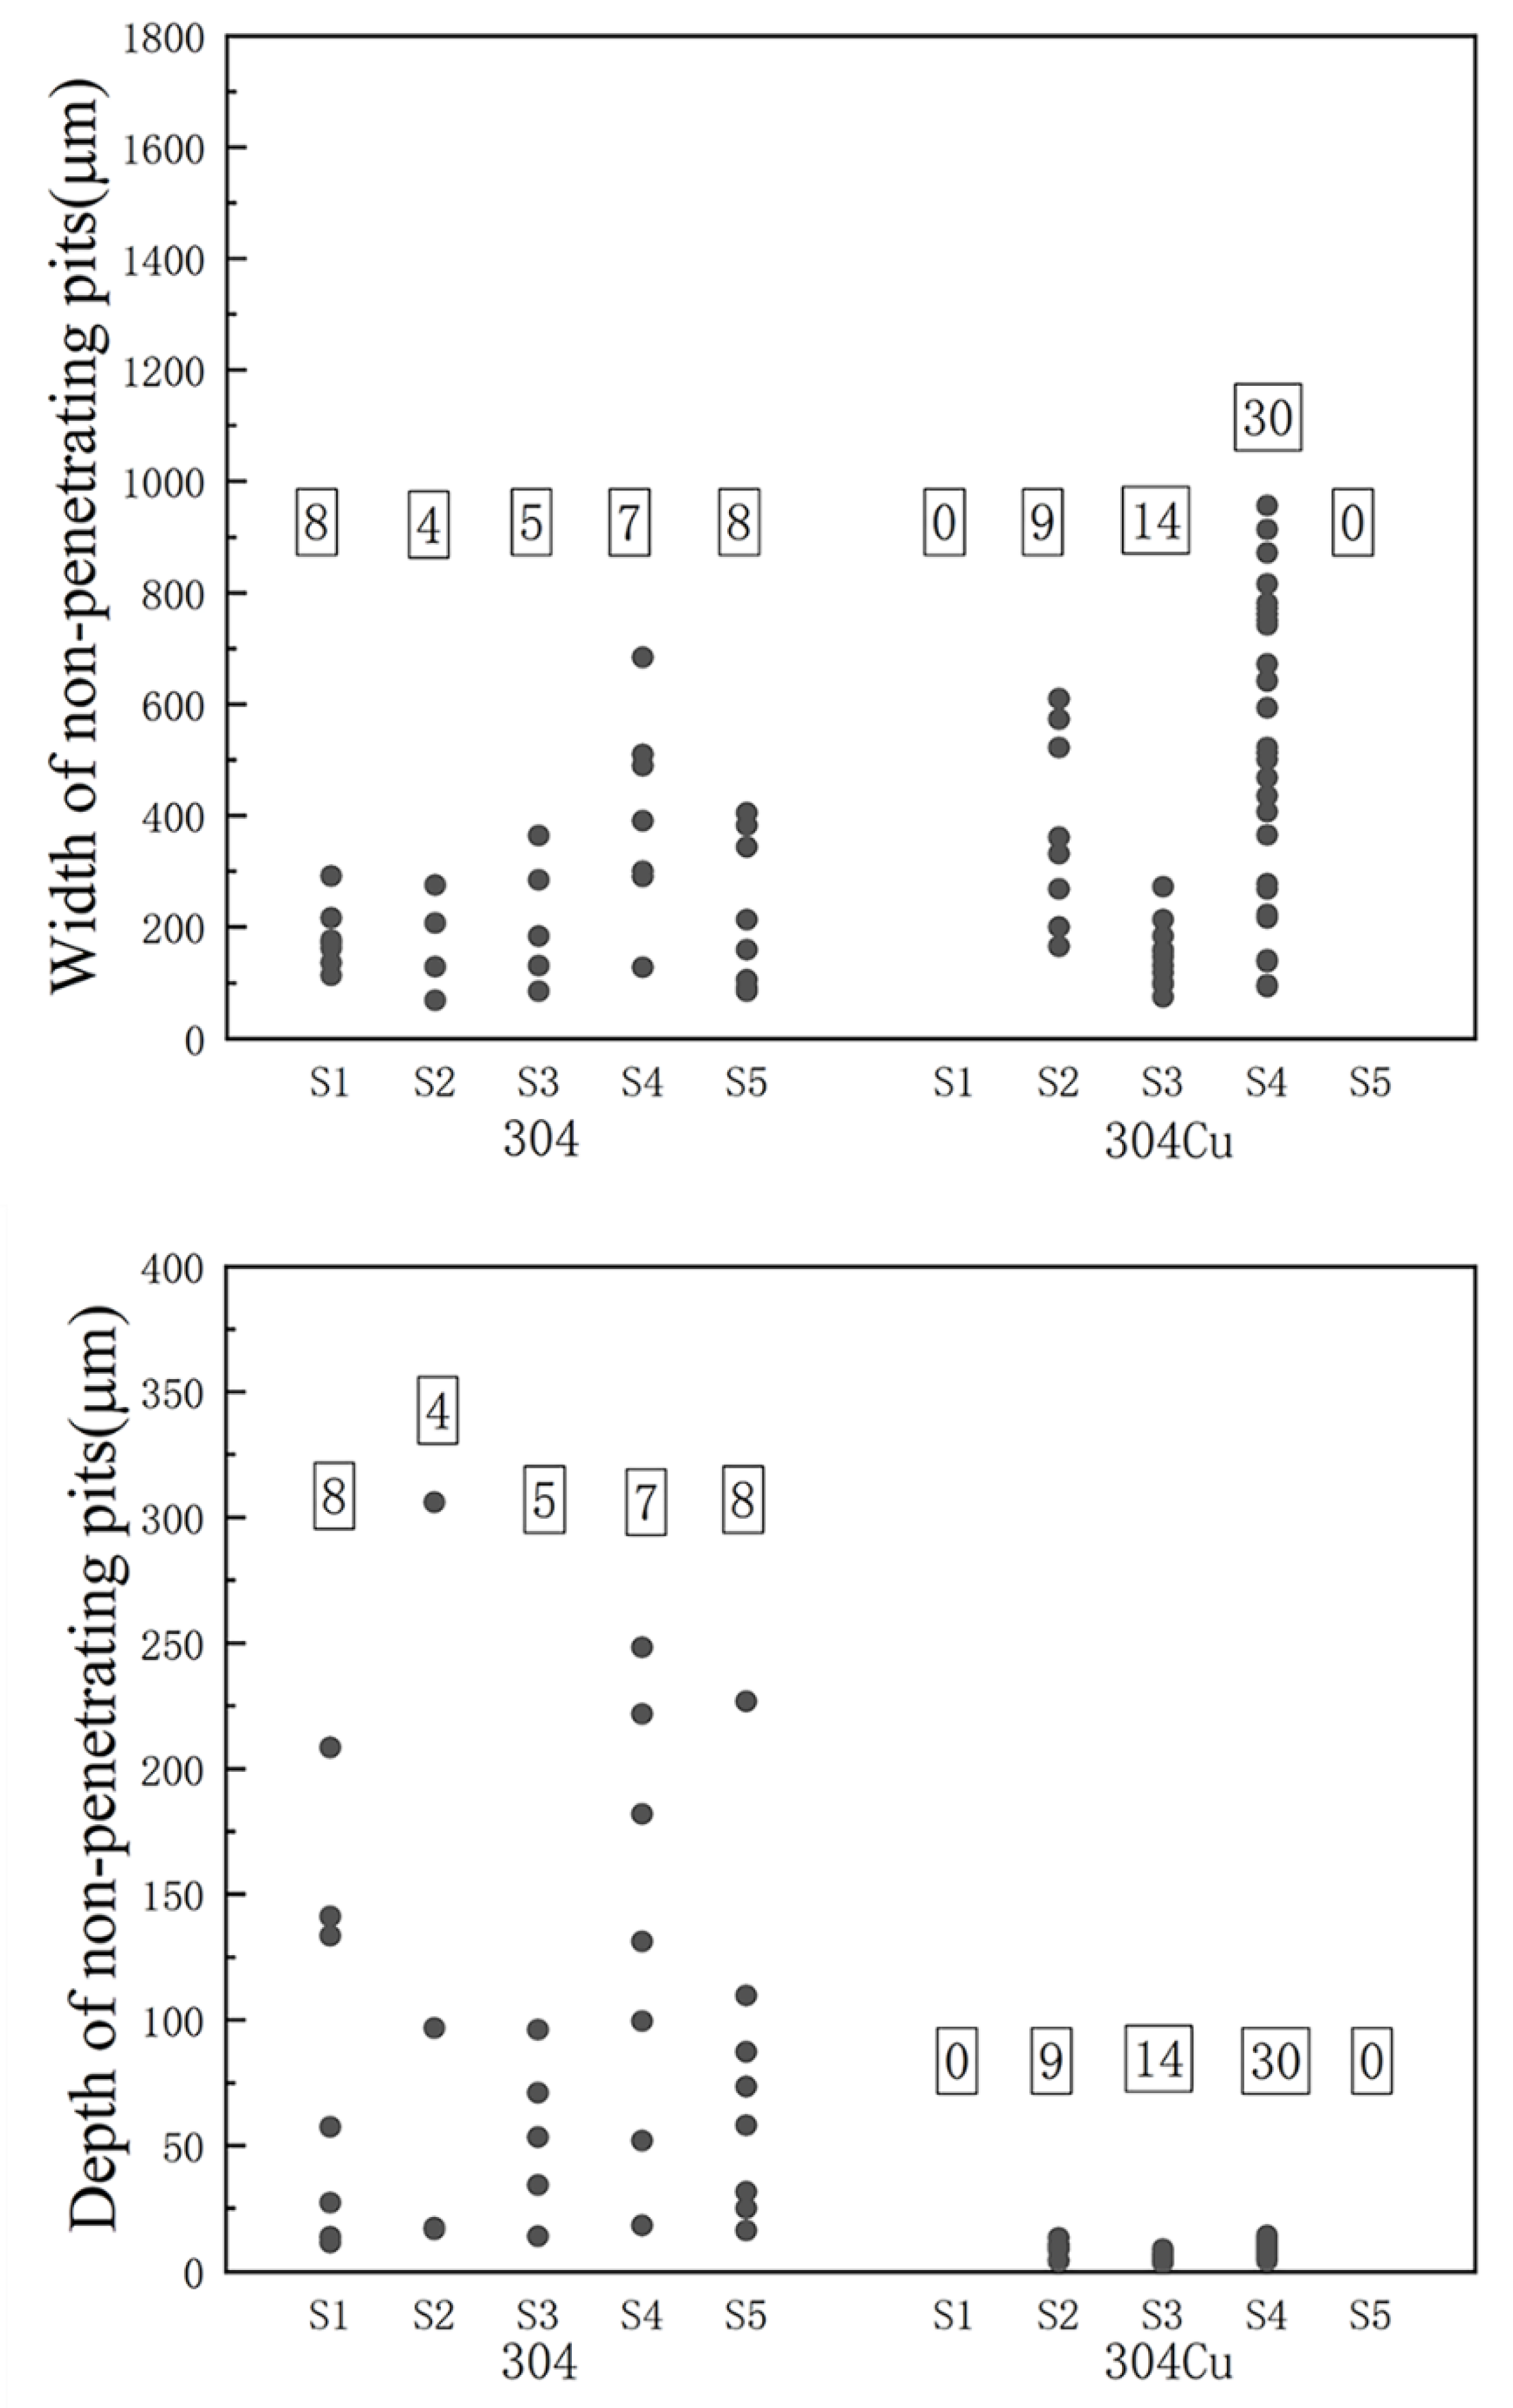
Figure 6 shows the widths and depths of the non-penetrating pits after immersion tests in FeCl
3 solutions. The width of the 304 non-penetrating pits ranged from 60 μm to 700 μm. Generally, once there were non-penetrating pits, the number of pits on the 304Cu samples were greater. There were more pits over 300 μm on 304Cu and a large number of pits with a width over 600 μm were found in S4. The width of the 304Cu non-penetrating pits ranged from 70 μm to 1000 μm. Most of the pits on the surface of 304 were deep pits over 25 μm; the depths of the pits on the surface of 304Cu were all below 25 μm. This indicated that the pits were easier to initiate and propagate on 304Cu in 6 wt.% FeCl
3 once pitting occurred, but the pits on 304Cu did not grow in depth as much as 304. Non-penetrating pits were not noted in S1 and S5 of 304Cu because the pit depth was too shallow to be recorded.
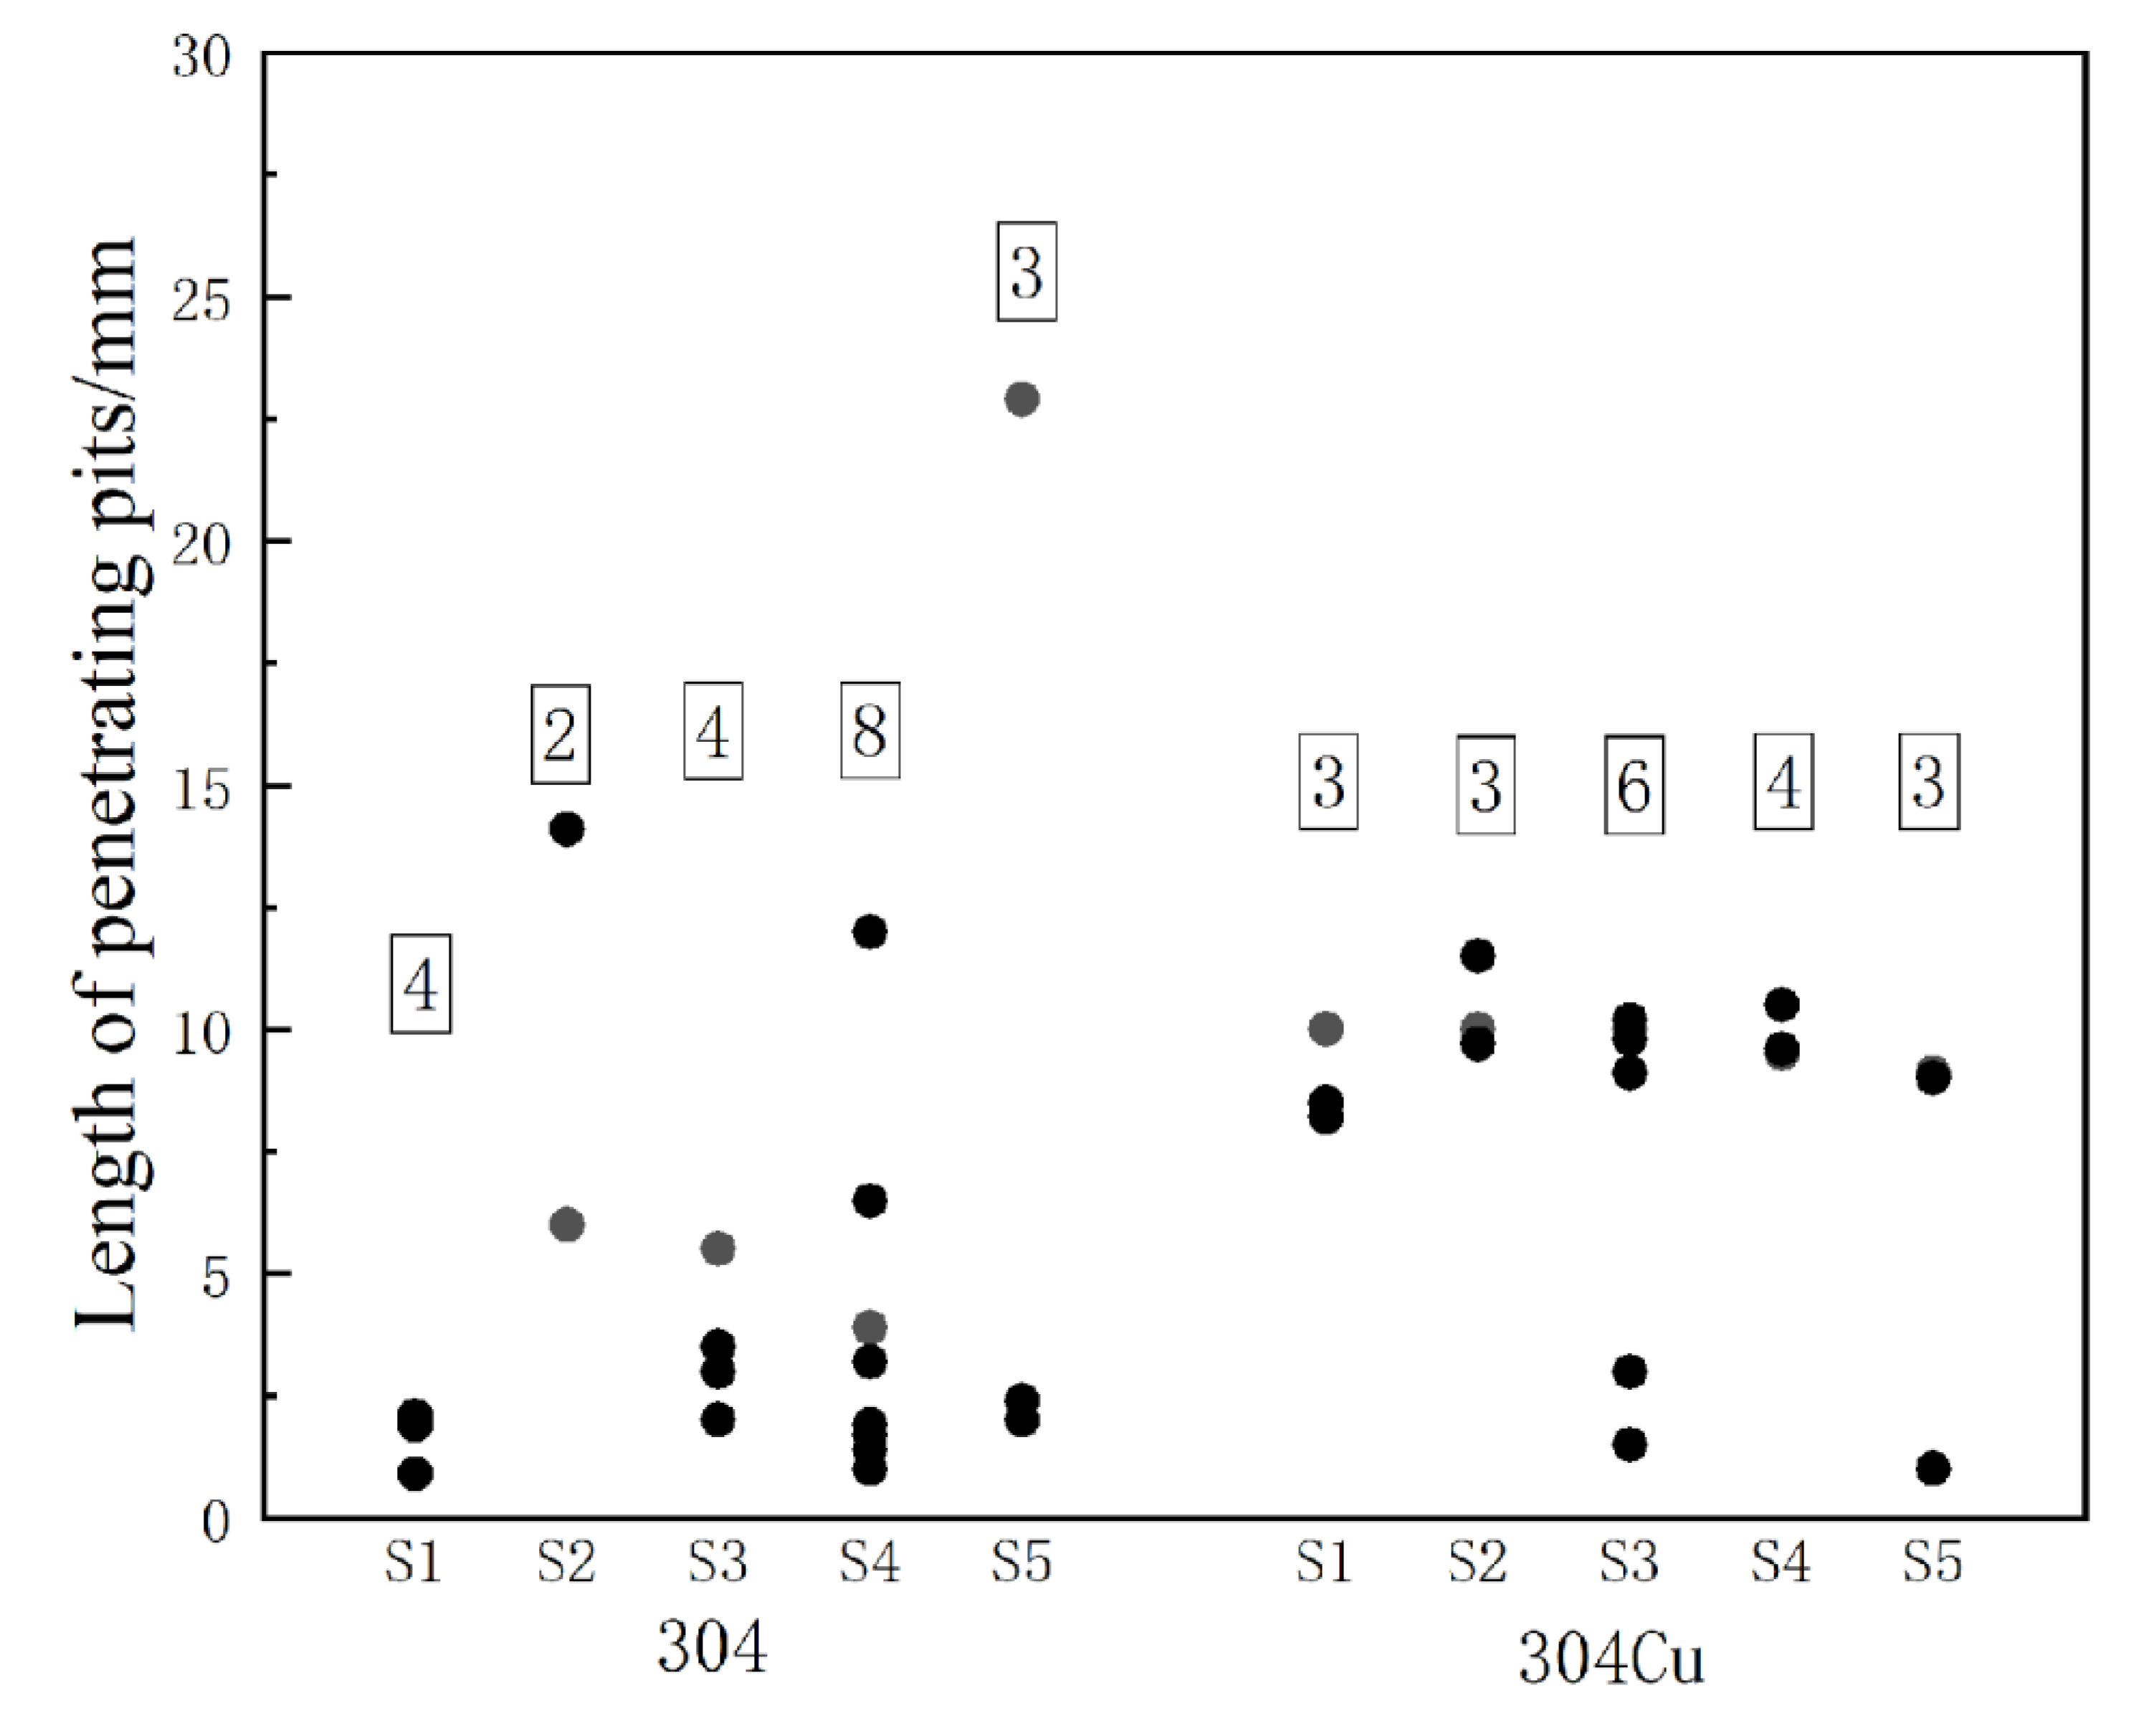
Figure 7 shows the lengths of the penetrating pits. The pit developed along the rolling direction. The length of the 304 penetrating pits ranged from 0.9 mm to 22.9 mm. The length of the 304Cu penetrating pits was from 1 to 11.5 mm. Between 2 and 8 penetrating pits were observed on each tested 304 and 304Cu sample. The penetrating pits found in the 304Cu samples were usually longer, which indicated that the penetrating pits were easier to initiate and grow on 304Cu.
The samples after pitting corrosion for 72 h were weighed to calculate the corrosion rates (g/(m
2·h)) of stainless steel, as given in Equation (1):
In the equation, Wf is the initial mass of the sample in grams (g); Wb is the mass of the sample after the experiment in grams (g); S is the total area of the sample in square meters (m²); and t is the experiment time in hours (h).
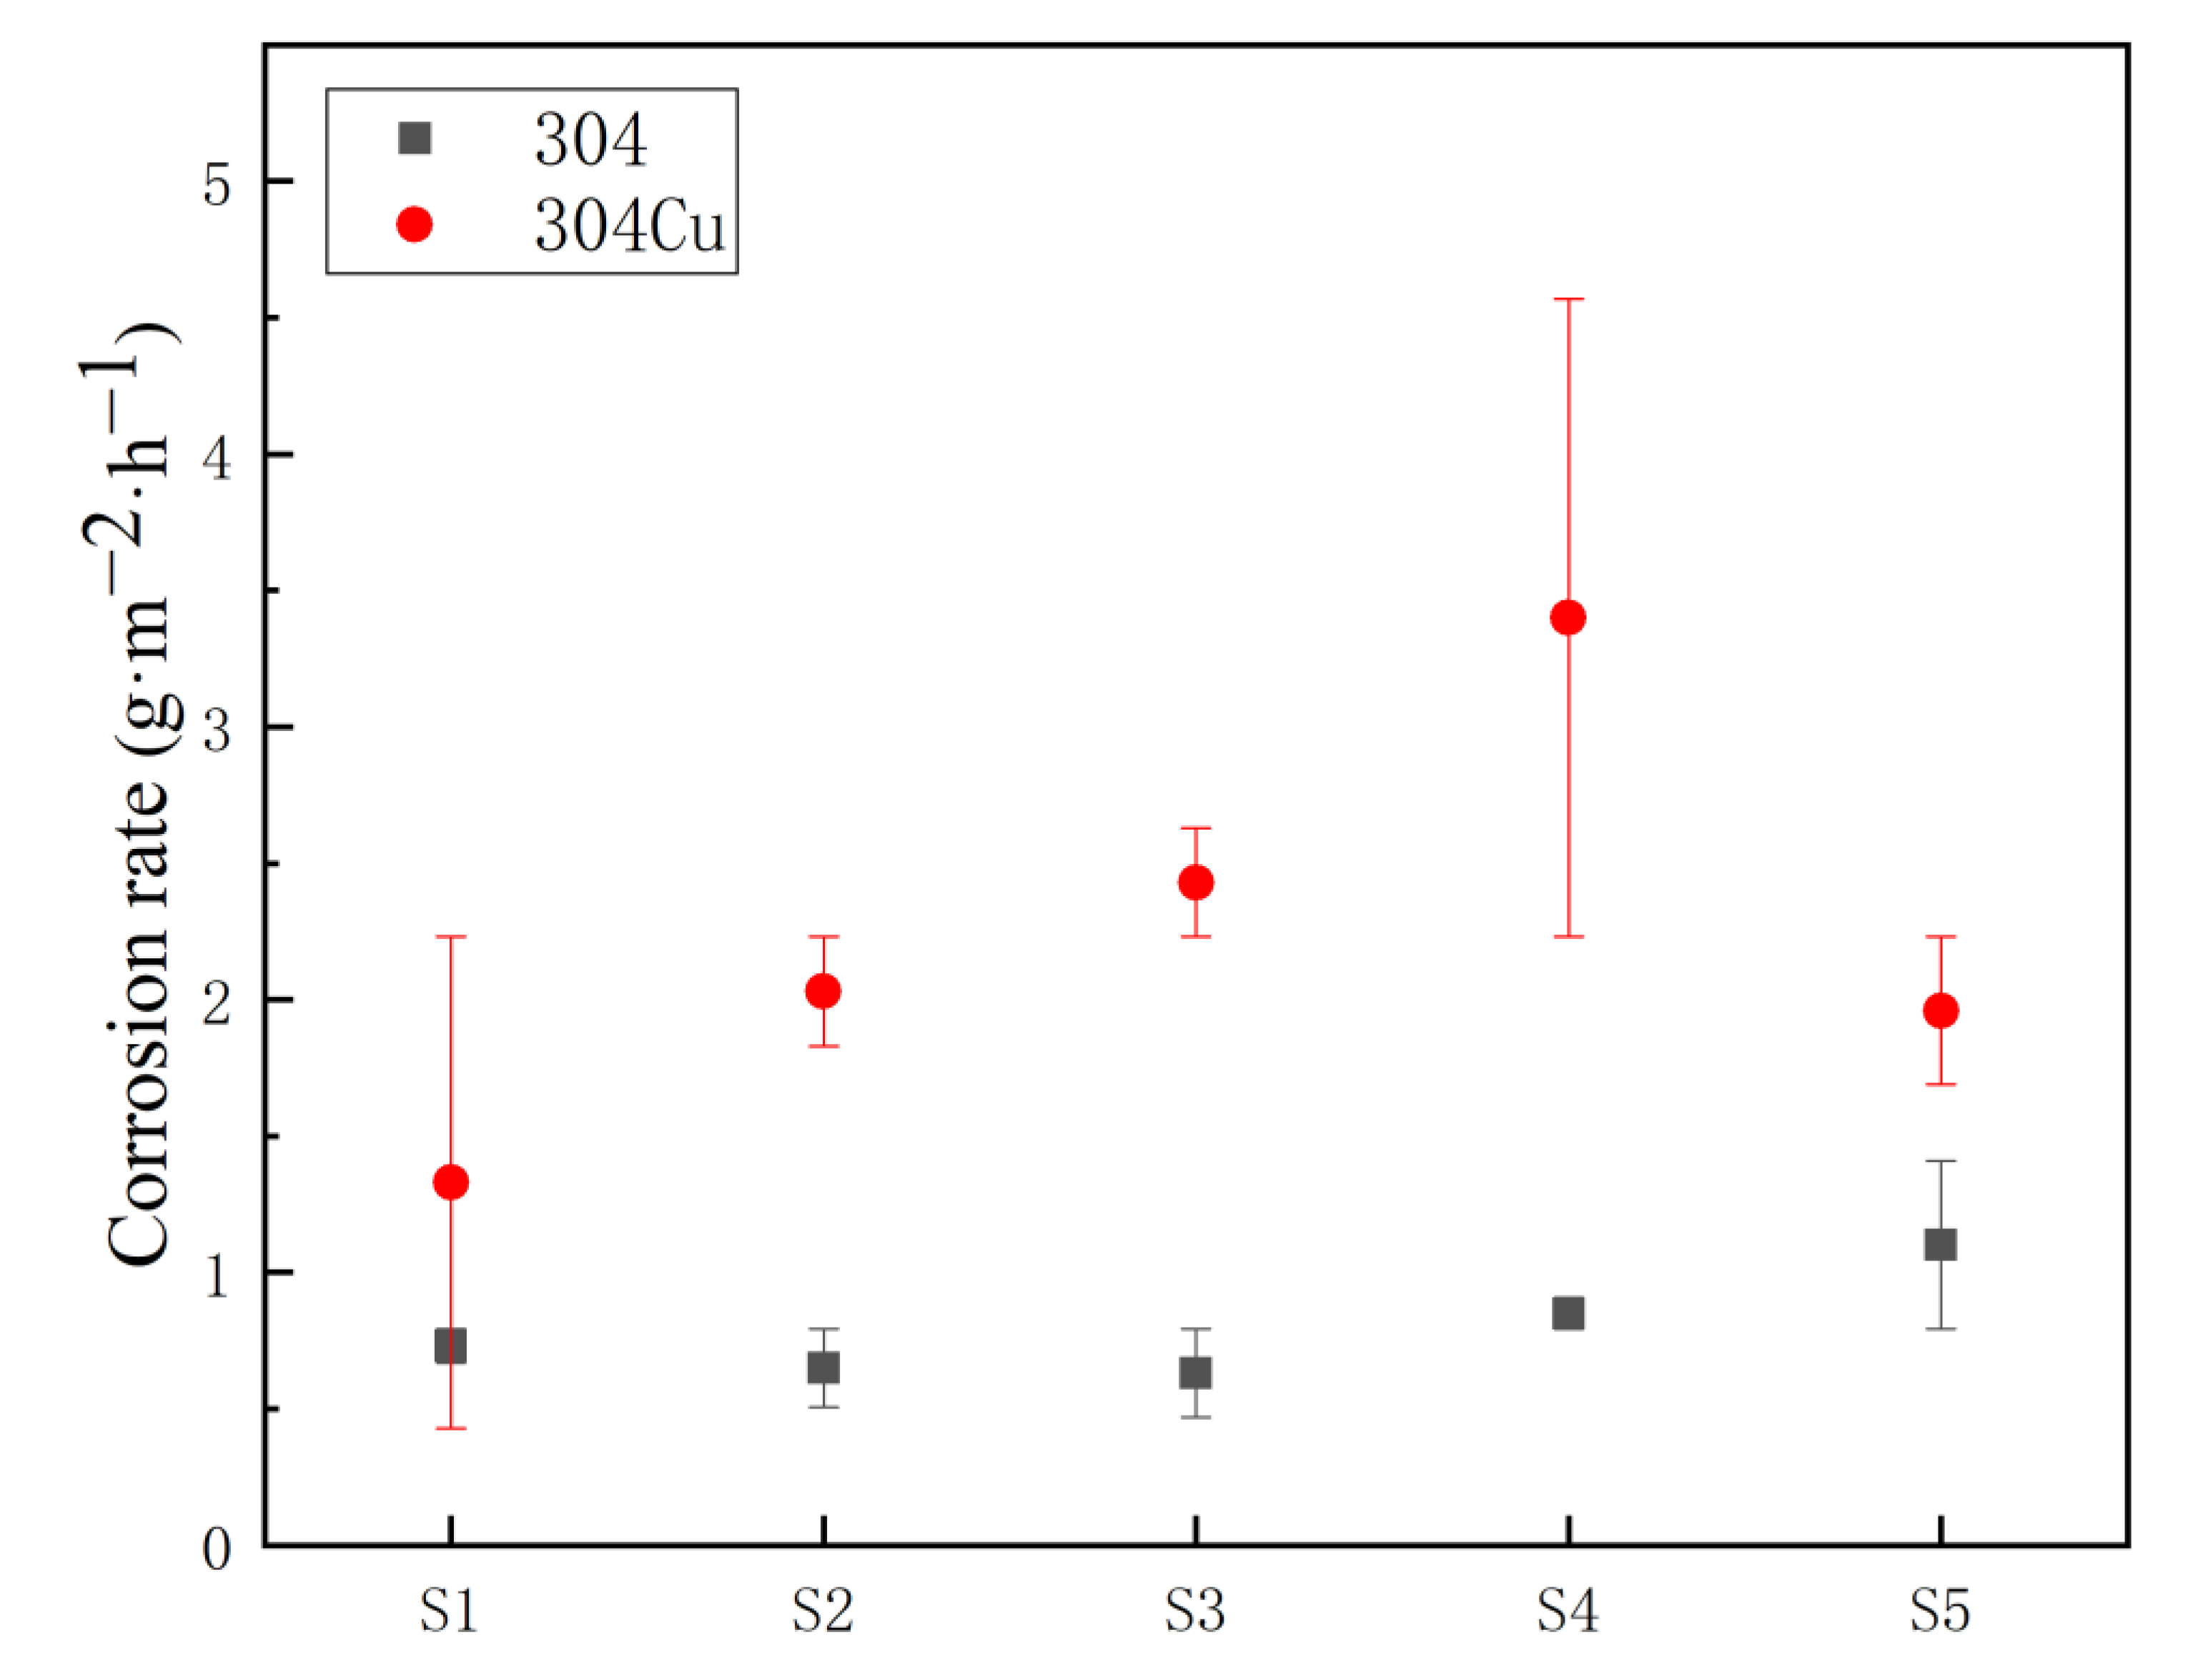
The corrosion rates are shown in
Figure 8. The average pitting corrosion rate of 304Cu was higher, indicating that the addition of Cu reduced the corrosion resistance of 304 stainless steel. The Cu ion concentration in the solutions of S4 and S5 was further measured by ICP-MS after the immersion tests. The corrosion rates were consequently calculated, assuming a uniform dissolution of the material according to its composition as listed in
Table 1.
Table 3 lists the corrosion rates from the weight-loss measurements and ICP-MS. The results revealed that the corrosion rates under different measurement methods were consistent with each other.
3.3. XPS Measurements on the 304 Surface
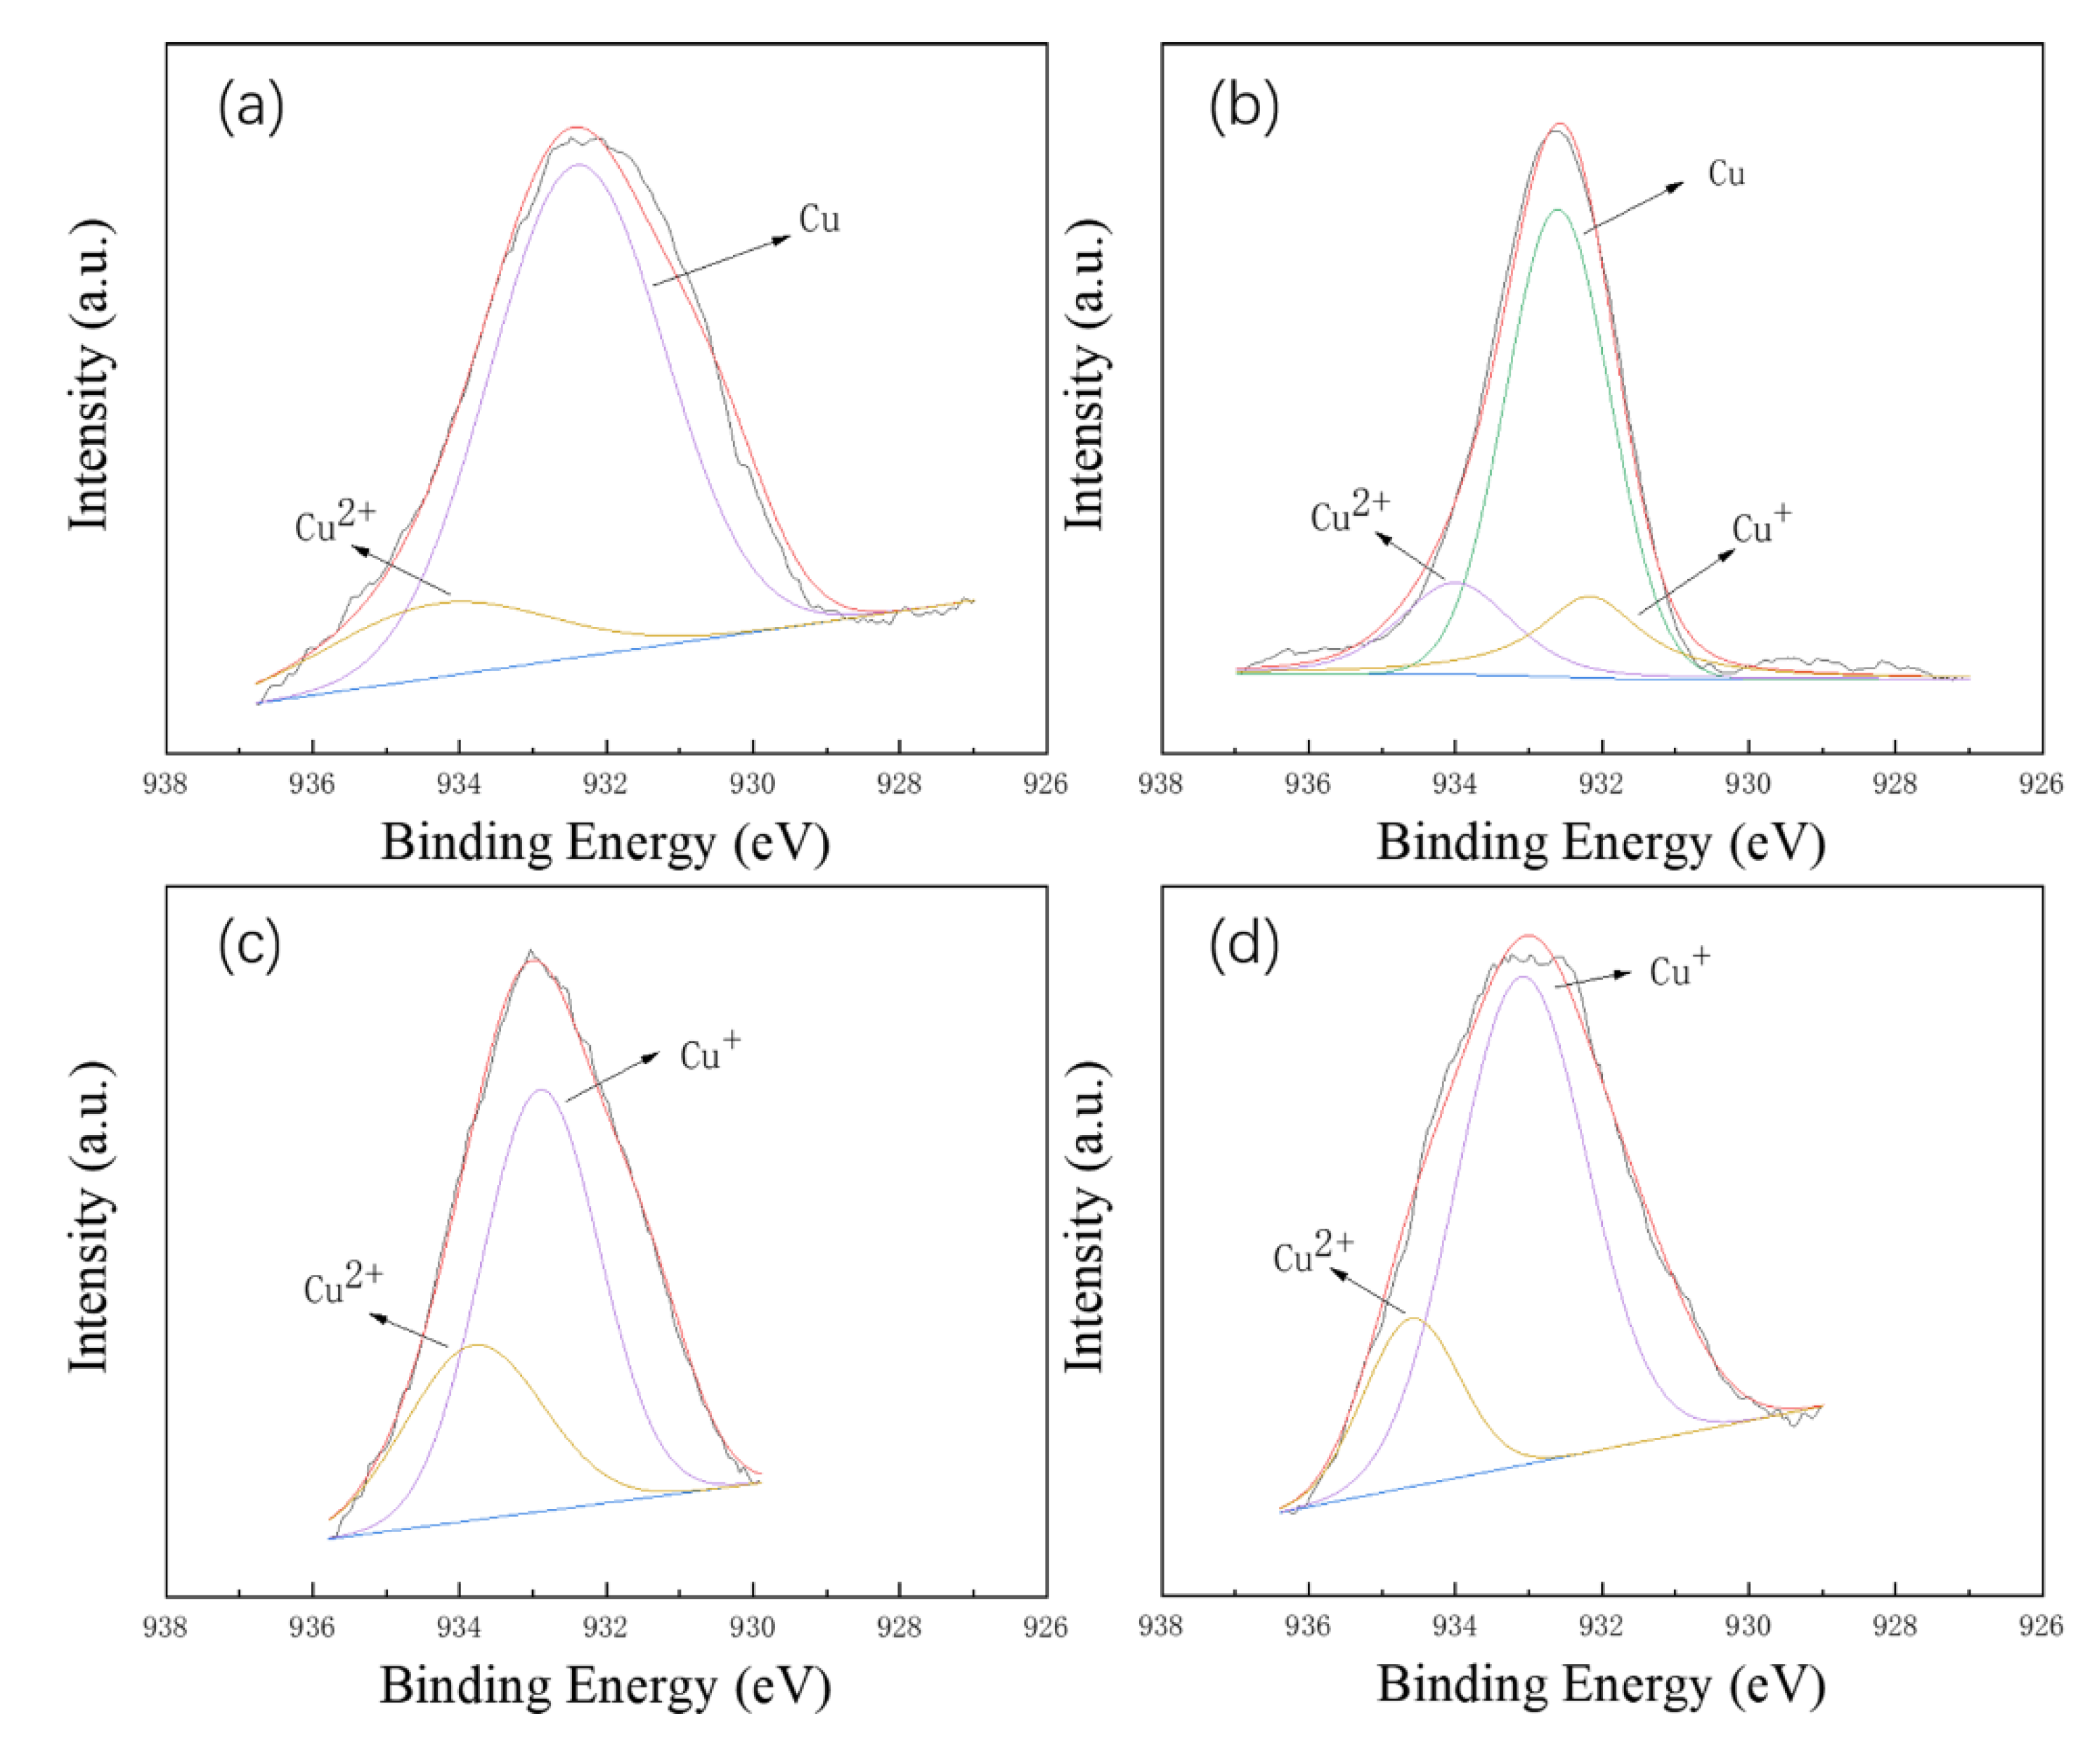
Figure 9 shows the XPS spectra of Cu before and after the corrosion tests of 304Cu. The binding energies of the metal Cu, Cu
+ and Cu
2+ were very similar [
7,
20]. The peaks of the metal Cu were expected to appear at binding energies ranging from 932.2 to 933.1 eV; the binding energies of Cu
2O were very close to it [
21,
22,
23]. The binding energy of CuO generally appeared around 934 eV [
24,
25].
Figure 9a is the XPS result of the as-received 304Cu. Metallic Cu was the main existing form and CuO also existed.
Figure 9b illustrates that CuCl appeared in the pits after exposure in 5 wt.% NaCl for 168 h. The existing form of Cu changed when the exposure time increased.
Figure 9c shows that Cu
+ and Cu
2+ were the main existing forms in the corrosion products after the 480 h salt spray test. Similar results were found in the FeCl
3 immersion tests.
Figure 9d shows that the existing forms of copper in the corrosion products were mainly CuCl
2 and CuCl after immersion in the 6 wt.% FeCl
3 solution for 72 h.
4. General Discussions on the Localized Corrosion of 304Cu
The tests showed that the effect of Cu on the corrosion resistance of 304 depended on the exposure conditions. In the 5 wt.% NaCl solution, the influence of Cu varied with the exposure time. After 168 h of salt spray tests, the appearance rating of 304Cu was higher, i.e., Cu improved the corrosion resistance. Sourisseau et al. also reported that the deposition of copper formed a barrier that would inhibit dissolution in chloride media [
26]. However, the beneficial effect of metallic Cu diminished with an increase in the exposure time. Cu may have had a protective effect at first. However, with the increase in the exposure time in the salt spray tests, and thus an increase in the deposited salts, more Cl
− led to harmful effects. Ujiro et al. observed that Cl
− decreased the stability of deposited Cu in a NaCl solution [
12]. There was no obvious effect of Cu on the morphology of the pits. The pits observed in the salt spray tests were generally too shallow to measure the depth. In the environment of a low concentration of chloride ions, the anion adsorbed on the metal surface was not aggressive enough to cause obvious damage. The pits found in the salt spray tests were small and shallow. This observation was different from the immersion tests.
Comparatively larger and deeper pits were observed on 304 and 304Cu when the samples were immersed in 6 wt.% FeCl
3. In the case of ferric chloride solutions, the addition of Cu is harmful to the corrosion resistance of austenitic steels, as suggested by the results that the pitting corrosion rates of 304Cu were higher. The EDS analysis indicated that the corrosion products deposited around the pits of 304Cu were copper, chloride and oxygen-rich compounds. Pardo et al. observed similar results in the corrosion products of the outer region of pits of AISI 316 stainless steel in chloride solutions [
27]. Cu
+ was found around the corrosion products according to the XPS results, which further proved the possible presence of CuCl. The existing form of Cu changed when the exposure time increased. Cu
+ and Cu
2+ were the main existing forms in the corrosion products after the 480 h salt spray tests and the FeCl
3 immersion tests. The deposition of Cu-containing species on a locally corroded surface has been recognized for austenitic stainless steels, as previously reported. Cu on the surface of the steels suppresses the anodic dissolution of the steels. However, the stability of stainless steel decreases when copper dissolves as CuCl
2− or CuCl
32− in acidic chloride media [
12,
28]. This seems to explain that the influence of Cu on the corrosion resistance of stainless steel was positive in the low chloride solution and negative in the FeCl
3 solution. The deposited metallic Cu inhibited dissolution at first. With the increase in Cl
−, Cu dissolved and hindered repassivation; thus, the corrosion resistance decreased.
It is worth discussing that two types of pits with penetrating and non-penetrating morphologies were found in the immersion tests. The addition of Cu led to the formation of more non-penetrating pits and longer penetrating pits. The appearance of the non-penetrating pits was a typical dish-shaped morphology [
29]. The penetrating pits had a stripped morphology in 304 and a fishbone morphology in 304Cu. Mohammed-Ali et al. studied the role of delta ferrite in influencing the pit morphology during the atmospheric corrosion of 304L stainless steel [
30]. They reported that for 304L stainless steels exposed to 0.4 M MgCl
2, the ferrite that existed along the rolling direction preferentially dissolved, forming a stripped morphology. This observation was very similar to the morphology of the penetrating pits in the present study.
Copper-bearing stainless steel is widely used as a new type of structural and functional integrated material. The salt spray and immersion tests in the present work showed that the beneficial effects of copper-containing stainless steel on improving corrosion resistance greatly depended on the operating conditions. The 5 wt.% NaCl solution was in accordance with the service environment of copper-containing stainless steel. We observed that the corrosion resistance of 304Cu was better after a short exposure time in 5 wt.% NaCl. However, the application of 304Cu in an aggressive environment such as 6 wt.% FeCl3 is not recommended.
5. Conclusions
In this paper, the corrosion resistance of copper-containing 304 stainless steel was compared with 304. The effect of the Cu addition on the corrosion resistance of 304 stainless steel was studied through neutral salt spray tests and FeCl3 pitting corrosion tests and the following conclusions were drawn:
(1) In the 168 h salt spray test, Cu slightly improved the corrosion resistance of stainless steel. With an increase in the exposure time to 480 h, the surface defects of 304Cu significantly increased. The corrosion products contained O and Cl.
(2) In the FeCl3 pitting corrosion experiment, two types of pits, penetrating and non-penetrating, were both observed in the stainless steel. The penetrating pits had a stripped morphology in 304 and a fishbone morphology in 304Cu. 304Cu had a higher corrosion rate and Cu reduced the corrosion resistance of the stainless steel.
(3) Cu and CuO were the main existing forms in the as-received 304Cu, which showed protective effects. Cu+ was the main existing form after a long exposure time in the salt spray tests of 5 wt.% NaCl and immersion in 6 wt.% FeCl3. It appeared that the dissolution of copper led to harmful effects in these environments.
Author Contributions
Writing—original draft, K.W.; Conceptualization, Supervision, Writing—review & editing, L.G.; Experiment, Validation, T.L.; Experiment, A.H.; Software, Y.Z.; Supervising, analyzing forming index, W.W.; Project administration, Resources, J.P. All authors have read and agreed to the published version of the manuscript.
Funding
This work was supported by Shanghai Sailing Program (No. 21YF1412800).
Institutional Review Board Statement
This study did not require ethical approval.
Informed Consent Statement
This study did not involve humans.
Data Availability Statement
Data is unavailable due to privacy.
Acknowledgments
We thank Guang Qing Metal Technology Limited for providing materials and helping with the work.
Conflicts of Interest
We have no conflict of interest to disclose. All authors have approved the manuscript and agree with its submission to Crystals.
References
- Boqvist, S.; Söderqvist, K.; Vågsholm, I. Food safety challenges and One Health within Europe. Acta Vet. Scand. 2018, 60, 1. [Google Scholar] [CrossRef] [PubMed] [Green Version]
- Zhang, E.L.; Zhao, X.T.; Hu, J.L.; Wang, R.X.; Fu, S.; Qin, G.W. Antibacterial metals and alloys for potential biomedical implants. Bioact. Mater. 2021, 6, 2569–2612. [Google Scholar] [CrossRef] [PubMed]
- Zhang, X.R.; Liu, X.F.; Yang, C.G.; Xi, T.; Zhao, J.L.; Liu, L.C.; Yang, K. New strategy to delay food spoilage: Application of new food contact material with antibacterial function. J. Mater. Sci. Technol. 2021, 70, 59–66. [Google Scholar] [CrossRef]
- Zhang, X.Y.; Huang, X.B.; Jiang, L.; Ma, Y.; Fan, A.L.; Tang, B. Antibacterial Property of Cu Modified Stainless Steel by Plasma Surface Alloying. J. Iron Steel Res. Int. 2012, 19, 75–79. [Google Scholar] [CrossRef]
- Wang, S.; Yang, C.G.; Xu, D.K.; Shen, M.G.; Nan, L.; Yang, K. Effect of heat treatment on antibacterial performance of 3cr13mocu martensitic stainless steel. Acta Metall. Sin. 2014, 50, 1453–1460. [Google Scholar]
- Xi, T.; Shahzad, M.B.; Xu, D.K.; Sun, Z.Q.; Zhao, J.L.; Yang, C.G.; Qi, M.; Yang, K. Effect of copper addition on mechanical properties, and antibacterial property of 316L stainless steel corrosion resistance. Mater. Sci. Eng. C Mater. Biol. Appl. 2017, 71, 1079–1085. [Google Scholar] [CrossRef]
- Zhang, S.; Yang, C.; Ren, G.; Ren, L. Study on behaviour and mechanism of Cu2+ ion release from Cu bearing antibacterial stainless steel. Mater. Technol. 2015, 30, B126–B132. [Google Scholar] [CrossRef]
- Xi, T.; Shahzad, M.B.; Xu, D.K.; Zhao, J.L.; Yang, C.G.; Qi, M.; Yang, K. Copper precipitation behavior and mechanical properties of Cu-bearing 316L austenitic stainless steel: A comprehensive cross-correlation study. Mater. Sci. Eng. A Struct. Mater. Prop. Microstruct. Process. 2016, 675, 243–252. [Google Scholar] [CrossRef]
- Ren, L.; Yang, K.; Guo, L.; Chai, H.W. Preliminary study of anti-infective function of a copper-bearing stainless steel. Mater. Sci. Eng. C Mater. Biol. Appl. 2012, 32, 1204–1209. [Google Scholar] [CrossRef]
- Oguzie, E.E.; Li, J.B.; Liu, Y.Q.; Chen, D.M.; Li, Y.; Yang, K.; Wang, F.H. The effect of Cu addition on the electrochemical corrosion and passivation behavior of stainless steels. Electrochim. Acta 2010, 55, 5028–5035. [Google Scholar] [CrossRef]
- Zhang, X.R.; Zhao, J.L.; Xi, T.; Shahzad, M.B.; Yang, C.G.; Yang, K. Dissolution and repair of passive film on Cu-bearing 304L stainless steels immersed in H2SO4 solution. J. Mater. Sci. Technol. 2018, 34, 2149–2159. [Google Scholar] [CrossRef]
- Ujiro, T.; Satoh, S.; Staehle, R.W.; Smyrl, W.H. Effect of alloying Cu on the corrosion resistance of stainless steels in chloride media. Corros. Sci. 2001, 43, 2185–2200. [Google Scholar] [CrossRef]
- Tomio, A.; Sagara, M.; Doi, T.; Amaya, H.; Otsuka, N.; Kudo, T. Role of alloyed copper on corrosion resistance of austenitic stainless steel in H2S-Cl- environment. Corros. Sci. 2014, 81, 144–151. [Google Scholar] [CrossRef]
- Jia, S.G.; Tan, Q.H.; Ye, J.Y.; Zhu, Z.W.; Jiang, Z.G. Experiments on dynamic mechanical properties of austenitic stainless steel S30408 and S31608. J. Constr. Steel Res. 2021, 179, 106556. [Google Scholar] [CrossRef]
- Gardner, L. Stability and design of stainless steel structures—Review and outlook. Thin-Walled Struct. 2019, 141, 208–216. [Google Scholar] [CrossRef]
- Nygren, K.E.; Nagao, A.; Wang, S.; Sofronis, P.; Robertson, I.M. Influence of internal hydrogen content on the evolved microstructure beneath fatigue striations in 316L austenitic stainless steel. Acta Mater. 2021, 213, 116957. [Google Scholar] [CrossRef]
- ISO 9227; Corrosion Tests in Artificial Atmospheres—Salt Spray Test. International Organization for Standardization: Geneva, Switzerland, 2017.
- ASTM G48-11; Standard Test Methods for Pitting and Crevice Corrosion Resistance of Stainless Steels and Related Alloys by Use of Ferric Chloride Solution. ASTM International: West Conshohocken, PA, USA, 2015.
- ISO 10289; Methods for Corrosion Testing of Metallic and Other Inorganic Coatings on Metallic Substrates—Rating of Test Specimens and Manufactured Articles Subjected to Corrosion Tests. International Organization for Standardization: Geneva, Switzerland, 2006.
- Ren, L.; Chong, J.; Loya, A.; Kang, Q.; Stair, J.L.; Nan, L.; Ren, G. Determination of Cu2+ ions release rate from antimicrobial copper bearing stainless steel by joint analysis using ICP-OES and XPS. Mater. Technol. 2015, 30, B86–B89. [Google Scholar] [CrossRef]
- Marcus, P.; Hinnen, C. XPS study of the early stages of deposition of Ni, Cu and Pt on HOPG. Surf. Sci. 1997, 392, 134–142. [Google Scholar] [CrossRef]
- Ghodselahi, T.; Vesaghi, M.A.; Shafiekhani, A.; Baghizadeh, A.; Lameii, M. XPS study of the Cu@Cu2O core-shell nanoparticles. Appl. Surf. Sci. 2008, 255, 2730–2734. [Google Scholar] [CrossRef]
- Colin, S.; Beche, E.; Berjoan, R.; Jolibois, H.; Chambaudet, A. An XPS and AES study of the free corrosion of Cu-, Ni- and Zn-based alloys in synthetic sweat. Corros. Sci. 1999, 41, 1051–1065. [Google Scholar] [CrossRef]
- Pardo, A.; Merino, M.C.; Carboneras, M.; Viejo, F.; Arrabal, R.; Munoz, J. Influence of Cu and Sn content in the corrosion of AISI 304 and 316 stainless steels in H2SO4. Corros. Sci. 2006, 48, 1075–1092. [Google Scholar] [CrossRef]
- Zhao, H.Y.; Sun, Y.P.; Yin, L.; Yuan, Z.; Lan, Y.L.; Xu, D.K.; Yang, C.G.; Yang, K. Improved corrosion resistance and biofilm inhibition ability of copper-bearing 304 stainless steel against oral microaerobic Streptococcus mutans. J. Mater. Sci. Technol. 2021, 66, 112–120. [Google Scholar] [CrossRef]
- Sourisseau, T.; Chauveau, E.; Baroux, B. Mechanism of copper action on pitting phenomena observed on stainless steels in chloride media. Corros. Sci. 2005, 47, 1097–1117. [Google Scholar] [CrossRef]
- Pardo, A.; Merino, M.C.; Carboneras, M.; Coy, A.E.; Arrabal, R. Pitting corrosion behaviour of austenitic stainless steels with Cu and Sn additions. Corros. Sci. 2007, 49, 510–525. [Google Scholar] [CrossRef]
- Aoyama, T.; Ogawa, H.; Kato, C.; Ueno, F. Decrease in Pitting Corrosion Resistance of Extra-High-Purity Type 316 Stainless-Steel by Cu2+ in NaCl. Metals 2021, 11, 511. [Google Scholar] [CrossRef]
- Guo, L.Y.; Street, S.R.; Mohammed-Ali, H.B.; Ghahari, M.; Mi, N.; Glanvill, S.; Du Plessis, A.; Reinhard, C.; Rayment, T.; Davenport, A.J. The effect of relative humidity change on atmospheric pitting corrosion of stainless steel 304L. Corros. Sci. 2019, 150, 110–120. [Google Scholar] [CrossRef] [Green Version]
- Mohammed-Ali, H.B.; Street, S.R.; Attallah, M.M.; Davenport, A.J. Effect of Microstructure on the Morphology of Atmospheric Corrosion Pits in Type 304L Stainless Steel. Corrosion 2018, 74, 1373–1384. [Google Scholar] [CrossRef]
| Disclaimer/Publisher’s Note: The statements, opinions and data contained in all publications are solely those of the individual author(s) and contributor(s) and not of MDPI and/or the editor(s). MDPI and/or the editor(s) disclaim responsibility for any injury to people or property resulting from any ideas, methods, instructions or products referred to in the content. |
© 2022 by the authors. Licensee MDPI, Basel, Switzerland. This article is an open access article distributed under the terms and conditions of the Creative Commons Attribution (CC BY) license (https://creativecommons.org/licenses/by/4.0/).


