Article

Determination of Crystal Growth Rates in Multi-Component Solutions

by
Christoph Helfenritter
and
Matthias Kind
*
Institute for Thermal Process Engineering, Karlsruhe Institute of Technology (KIT), Kaiserstraße 12, 76131 Karlsruhe, Germany
*
Author to whom correspondence should be addressed.
Crystals 2022, 12(11), 1568; https://doi.org/10.3390/cryst12111568
Submission received: 16 October 2022 / Revised: 30 October 2022 / Accepted: 31 October 2022 / Published: 3 November 2022
(This article belongs to the Special Issue Aggregation, Nucleation and Crystallization)

Abstract

:
Many solid forming processes involve crystallization from multi-component solutions. In order to predict final phase assemblages, multi-component phase transfer kinetics must be known. It is not sufficient to have the kinetics of only one crystallizing component in the presence of other entities; the kinetics of concurrent crystallizing components are of interest as well. However, methods for their determination are currently lacking. We propose a new method comprising desupersaturation measurements of a 150 µm film of supersaturated solution in contact with a planar crystalline substrate. We show that concentration measurement at a single point in the film is sufficient to retrieve the phase transfer kinetics. For this, we use a confocal micro-Raman spectroscope, which is able to distinguish between different components and has a high spatial resolution. We chose crystallization of N a 2 S O 4 and N a 2 C O 3 decahydrate from aqueous solution as our model system because of its well-known phase equilibrium. In binary experiments, we demonstrate the mode of operation and its ability to reproduce known kinetics from the literature. In ternary experiments, we successfully distinguish two courses of crystallization, the first of which is a preferential crystallization of one component and the second a simultaneous crystallization of both crystallizing components. In both cases, the parameters for simple power law kinetics are determined. If sodium carbonate decahydrate crystallizes while sodium sulfate remains in solution, the mean mass transfer coefficient is revealed to be k g , C O 3 = 6 × 10 7 m s 1 , which is about an order of magnitude lower compared to binary crystallization. If sodium carbonate decahydrate crystallizes concurrently with sodium sulfate decahydrate, the crystallization kinetics are similar to binary cases. The other component tends to be significantly slower compared to its binary crystallization.

1. Introduction

In technical processes as well as in product design, multiple components are used deliberately or occur unintentionally. Such processes can include solid layer-forming processes such as granulation or coating [1,2,3,4,5,6]. These have in common that liquid films are applied, which in many cases comprise multiple components [7,8,9]. Often, a certain material distribution of the layer is desired, e.g., homogeneous or stratified. In other processes, formation of multi-component layers results from unintended fouling on surfaces [10,11]. In addition to classical crystallization, alloy formation is related due to its simultaneous multi-component solidification [12]. In order to predict or inhibit such processes, it is necessary to know the crystallization kinetics of all involved components under multi-component crystallizing conditions. However, the literature lacks methods for such determination. It is well known that third components (additives), even in small amounts, may have a great impact on crystal growth [13,14,15,16,17,18]. This can be even worse in the above-mentioned processes as third components are present at rather high concentrations. Components may even crystallize simultaneously, which results in interdependencies between their crystal growth rates [19,20].
In order to determine crystal growth kinetics in general, two principle methods can be consulted: (i) observation of the change of crystal size, and (ii) supersaturation depletion [21]. Regarding the first method, it is rather difficult to obtain multi-component kinetics from crystal size observations. The change in size has to be traced back to a certain material at any time. This is only possible if the crystal morphologies are distinguishable from each other and if all crystallizing components solidify separately.
Regarding the second method, it is possible to determine the crystallization fluxes from desupersaturation measurements under well-mixed conditions using mass balances, and thereby find the crystal growth rates [22,23]. The drawbacks of this method include that that nucleation has to be neglected or clearly separated from the growth process and that particles should not compete for the same material, which is likely if the distance is too small [24]. Otherwise, the concentration changes cannot be attributed to the crystal growth of each particle alone. Additionally, the surface of the growing crystals must be well known through the entire growth process. In this way, it is possible to relate the simultaneous phase change of multiple components onto one surface.
Supersaturation depletion of single components can be observed easily by measurement, e.g., of refractive indices or density, ultrasonic techniques, or spectroscopic methods such as Raman or ATR-FTIR [22,25,26,27,28,29,30]. In addition, influences of additives on crystal growth kinetics have been frequently investigated [31,32,33,34,35,36]. However, these studies investigated only a single solidifying component, with components, e.g., impurities or second components, remaining dissolved.
Our solution to the problem of multi-component crystal growth kinetics is to perform desupersaturation measurements in a thin film on ill-defined crystalline surfaces of an initially supersaturated multi-component solution. On one side, this supersaturated film is in contact with a crystalline substrate which is the locus of crystallization. On its other side, the film is covered (no-flux condition). In another publication, we showed via Fickian diffusion modeling that such measurements can provide the opportunity to derive crystallization kinetics from thin liquid films of about 150 µm. By applying the diffusion–reaction theory, we showed that a constant mass transfer coefficient k g can be retrieved from concentration depletion measurements at a single point. For the model calculations, the generic N a 2 S O 4 , N a 2 C O 3 , and H 2 O material system was used, and the properties and parameters were chosen with respect to the system [37].
To study multi-component crystallization kinetics experimentally, we combine a Raman spectroscope with a confocal microscopy arrangement to achieve spatial resolution and multi-component analytics [38,39]. It is possible to detect several components simultaneously and measure their kinetics during co-crystallization. This approach allows us to examine relatively small volumes [40], e.g., very thin films of 150 µm. With the presented generic measurement method, it is possible both to detect concentration changes of individual components and to investigate interdependencies between simultaneously crystallizing materials. A mathematical examination routine based on mass balances allows the determination of empirical growth data, which to a certain degree can be interpreted physically with diffusion–reaction theory.
Therefore, we aim to determine crystal growth kinetics by evaluating the mass transfer rates n ˙ i to the growing crystalline substrate at varying supersaturation degrees of the film. Because crystal growth kinetics may be limited by diffusion or integration [21], we propose a two-step approach. First, dissolution experiments are carried out to determine mass transfer kinetics under diffusion-limited conditions. For this, we assume that dissolution is diffusion-limited only. Second, growth experiments are carried out. With the diffusion limit from the first step, integration of limited growth kinetics can be deduced from these growth experiments. The driving force of dissolution along with crystallization is the difference in chemical potential Δ μ i or the difference between the activity at the actual a i and at the equilibrium state a i * . Because activity is difficult to measure, we assume ideality and set the equal activity concentrations as a i = c i . Weight-based measures are obtained in the experiments, and the concentration is accordingly transformed into weight fractions using the molar mass M ˜ i and solution density ρ solution , as follows:
w i = c i · M ˜ i ρ solution
It is possible to describe the kinetics of mass transfer using the power law function (Equation (2)) [21]:
n ˙ i = k g , i · ρ ˜ solution g · ( w i w i , ph ) g
The mass flux of component i is described by the mass transfer coefficient k g , i , the molar density ρ ˜ solution , the difference in mass fraction between a point in the solution and a point in the vicinity of the crystal ( w i w i , ph ) , and an exponent g.
For both dissolution and growth experiments, we assume that the mass transfer rate can be determined by measuring the transient evolution of concentration at a single point in the film, i.e., w i , 0 . An example of this is depicted by the dotted ellipse in Figure 1.
The growth velocity v of a crystal is directed in the direction opposite the mass transfer n ˙ i , c r y s t . A concentration gradient occurs that diminishes with progression in time. The concentration profiles depicted in full lines correspond to the diffusion limitation of growth, while the dashed lines represent the integration limitation of growth. The initial state is shown with a dotted line, whereas the final state is depicted with a dashed dotted line. The indicated weight fractions are the solid interface fraction w i , p h , which is assumed to be at equilibrium, and the virtual integration boundary weight fraction w i , I .

2. Materials and Method

Confocal micro-Raman spectroscopy is a unique tool for measuring the concentration of chemical entities in transparent media at high spatial resolutions. In order to analyze a sample at a specific position, an objective and a confocal pinhole are added to a regular Raman spectrometer. Only the light from the focal point of the objective is able to pass through the pinhole. This allows for spatial resolution. These characteristics allow quantitative measurements at a distinct position in a liquid film.

2.1. Materials

Our experiments were conducted with the model system N a 2 S O 4 - N a 2 C O 3 - H 2 O . As depicted in Figure 2, the phase behavior of this system is well known and well studied. In the investigated temperature range (17–23.5 °C), only the respective decahydrates are thermodynamically stable. However, the results are transferable to any other eutectic systems with two possible solid phases. At higher temperatures (>30 °C), other solid entities such as anhydrates, lower grade hydrates, or solid solutions occur [41].
As can be seen from the ternary diagram, any solution on a solubility line supersaturates upon cooling. Experiments were conducted with binary and ternary mixtures consisting of either one or two electrolytes (sodium sulfate and sodium carbonate) and deionized water. All salts were purchased from Carl Roth GmbH and Co. KG. Sodium sulfate anhydrate (≥99%, p.a., ACS) and sodium carbonate anhydrate (≥99%) were primarily utilized for solution preparation. Sodium sulfate decahydrate (≥99%, p.a., ACS) and sodium carbonate decahydrate (≥99.5%, Ph.Eur) along with their respective anhydrates were used to prepare substrates.
The applied substrates were tablets consisting of either sodium carbonate decahydrate or sodium sulfate decahydrate. Therefore, a 50:50 wt-% mixture of powderous decahydrate and anhydrate of the respective salts was mixed with a mortar and pestle. This blend exhibited the best tablet stability and particle adhesion properties. The salt particles were ground to obtain a fine and rather uniform size ( d 50 , 0 5 μ m ). This powder was then poured into a substrate carrier with a diameter of 5 cm and a depth of 2 mm. To obtain a planar surface, it was pre-pressed with a material testing machine (Zwick ProLine 10 kN) for 60 s at 0.8 MN m 2 . In order to transform the applied anhydrates into decahydrate state, one gram of saturated solution was applied onto the pre-pressed tablet. In addition, this procedure reduces the pore volume inside the pressed substrate and increases the adhesive force between its particles. After solution application, the pressing procedure was repeated for 300 s. Subsequently, saturated solution was applied again until a liquid film was observable at the surface. The overlaying liquid was absorbed carefully with a paper towel and dried at ambient conditions (room temperature <25 °C) to build up a planar crystalline tablet in decahydrate state.

2.2. Method

The super- or undersaturated film was placed in a temperature-controlled stainless steel body onto a microscopic glass (compare Figure 3). A thermostat (Lauda RC6) was used to ensure a constant temperature throughout the experiment. Because of the input of laser energy and phase transition enthalpies, we considered the possibility that solution temperature might not follow the isothermal onset temperature. This possibility can be neglected, however, as the small mass of the solution (maximum 1 g) is drastically lower than the mass of the steel body, meaning that any temperature differences are quickly dissipated. In addition, the input laser power of 85 mW was rather low, and the expected phase transfer fluxes were small. This was proven by temperature measurements with a Pt100 resistance thermometer during certain experiments and by the results of our dissolution experiments. The measured steady-state concentrations agree with the solubility data at the experimental temperature (compare Figures 5 and 9). Hence, any temperature increase caused by the laser can be neglected.
A distancing ring (thickness of 150 µm) was used to define the height of the liquid film. An opening from the bottom to the middle of the cell provided optical access for the Raman microscope. It was covered with the microscopic glass (thickness 0.145 ± 0.015 mm ) (Zitt-Thoma GmbH). The substrate carrier was mounted at the top of the cell. Prior to the experiment, the carrier was elevated. The general idea of the set-up was based on the work of Müller et al. [39]. Applied solutions were supersaturated or undersaturated with respect to the experimental temperature. Initial solution composition was adjusted either by weighing or the soil body method. The exact compositions were determined prior to the experiments through Raman spectroscopy for at least five minutes. To start the dissolution or desupersaturation process, the carrier was carefully moved downwards. In this way, the substrate was brought into contact with the solution. All experiments were conducted isothermally. The diagrams discussed later only display the composition after initial contact between the substrate and solution.
The inverse confocal Raman microscope used for this study consisted of a laser (wavelength of 514 nm, laser power of 85 mW), an optical arrangement consisting of mirrors and a notch-filter, a microscopic objective (Zeiss EC “Plan-Neofluar” 100×/1.3 Oil), and a CCD-detector; for details, see Scharfer et al. [40]. The laser beam was focused into the film through the objective. The focal point was set at 5 µm above the microscopic glass. Conversely, the point was located 145 µm from the substrate. The focal point had an illuminated volume with a diameter of 10 µm. Immersion oil (Zeiss, Immersol 518 N) was used to bring the objective into contact with the microscopic glass. The laser exposure time was 5 s. A more detailed description of this arrangement is provided in other publications [39,40,43,44].
In general, the Raman scattering is a function of the input laser energy (wavelength and power), Raman activity of the illuminated species, exposure time, Raman shift, and other properties of the spectrograph. The Raman intensity ratio I i I water of a component i and a reference component, e.g., water, results in a linear relationship with the mass load X i [39,40] (compare Equation (3)).
I i I water = K i · X i
The factor K i is constant for a material system at a given temperature. In Figure 4, the Raman spectrum of the prevailing material system under investigation ( N a 2 S O 4 - N a 2 C O 3 - H 2 O with w N a 2 S O 4 = 0.090 and w N a 2 C O 3 = 0.120 ) is depicted.
The characteristic peaks of each component do not overlap, which makes it possible to evaluate the composition of the solution. The individual vibration modes are not stated here; instead, we refer to other publications on material specific Raman vibration modes [45,46,47].
In order to transform the measured concentrations from Raman spectroscopy to growth kinetics, we applied a mathematical data evaluation method based on mass balances, which is explained in detail below. The change in solution mass is connected with the measured mass fraction changes at position s = 0 (compare Figure 1). We begin with the mass balance of the liquid film,
d M L d t = Σ M ˙ i
The change in mass of the solution M L depends on the mass transfer fluxes M ˙ i of the crystallizing components i from the liquid (L) to the solid (S) phase. The component balances are as follows:
d M i L d t = M L · d w i d t + w i · d M L d t = M ˙ i
with M i L and w i being the mass of component i in the liquid phase and the mass fraction of component i, respectively. We assume that w i · d M L d t < < M L · d w i d t . Further, we assume that the change in solution composition at position s = 0 represents the change in total solution composition due to small gradients. The introduced mass fraction is related to the crystallizing component. In case of a crystallizing solvate, w i , solvate represents the mass fraction of the dissolved solvate with respect to the total mass. Because this fraction is normally not measured, the correlation to the mostly known ansolvate mass fraction, w i , ansolvate , is
w i , solvate = w i , ansolvate · M ˜ solvate M ˜ ansolvate
with the molar masses of the solvate M ˜ solvate and the ansolvate M ˜ ansolvate . The mass flux of component i is related to the crystal growth kinetic stated in Equation (2), which leads to Equation (7):
M i ˙ = A · M ˜ i · n ˙ i
By solving these equations and using the least squares method, it is possible to reproduce the course of the measured mass fraction evolutions, thereby obtaining the kinetic parameters k g , i and g solely by measuring their concentrations at position s = 0 .

3. Results

In order to investigate the binary and ternary crystallization kinetics, desupersaturation measurements were conducted. Prior to that, dissolution measurements were performed to obtain the diffusive mass transfer coefficients of all systems. By comparing the mass transfer coefficients from desupersaturation and dissolution, it was possible to identify process limiting steps. Theoretically, it would be possible to determine mass transfer coefficients for the integration/reaction step at the crystal surface as well by exploiting the diffusion–reaction theory. However, because of high deviations and additional assumptions, we refrain from providing these in this publication. The calibration data of the material system are provided in the supporting information.

3.1. Binary Experiments

To show the applicability of the method, experiments with binary solutions were conducted. Prior to analyzing desupersaturation courses, dissolution measurements were performed in order to investigate the diffusive mass transfer coefficient.

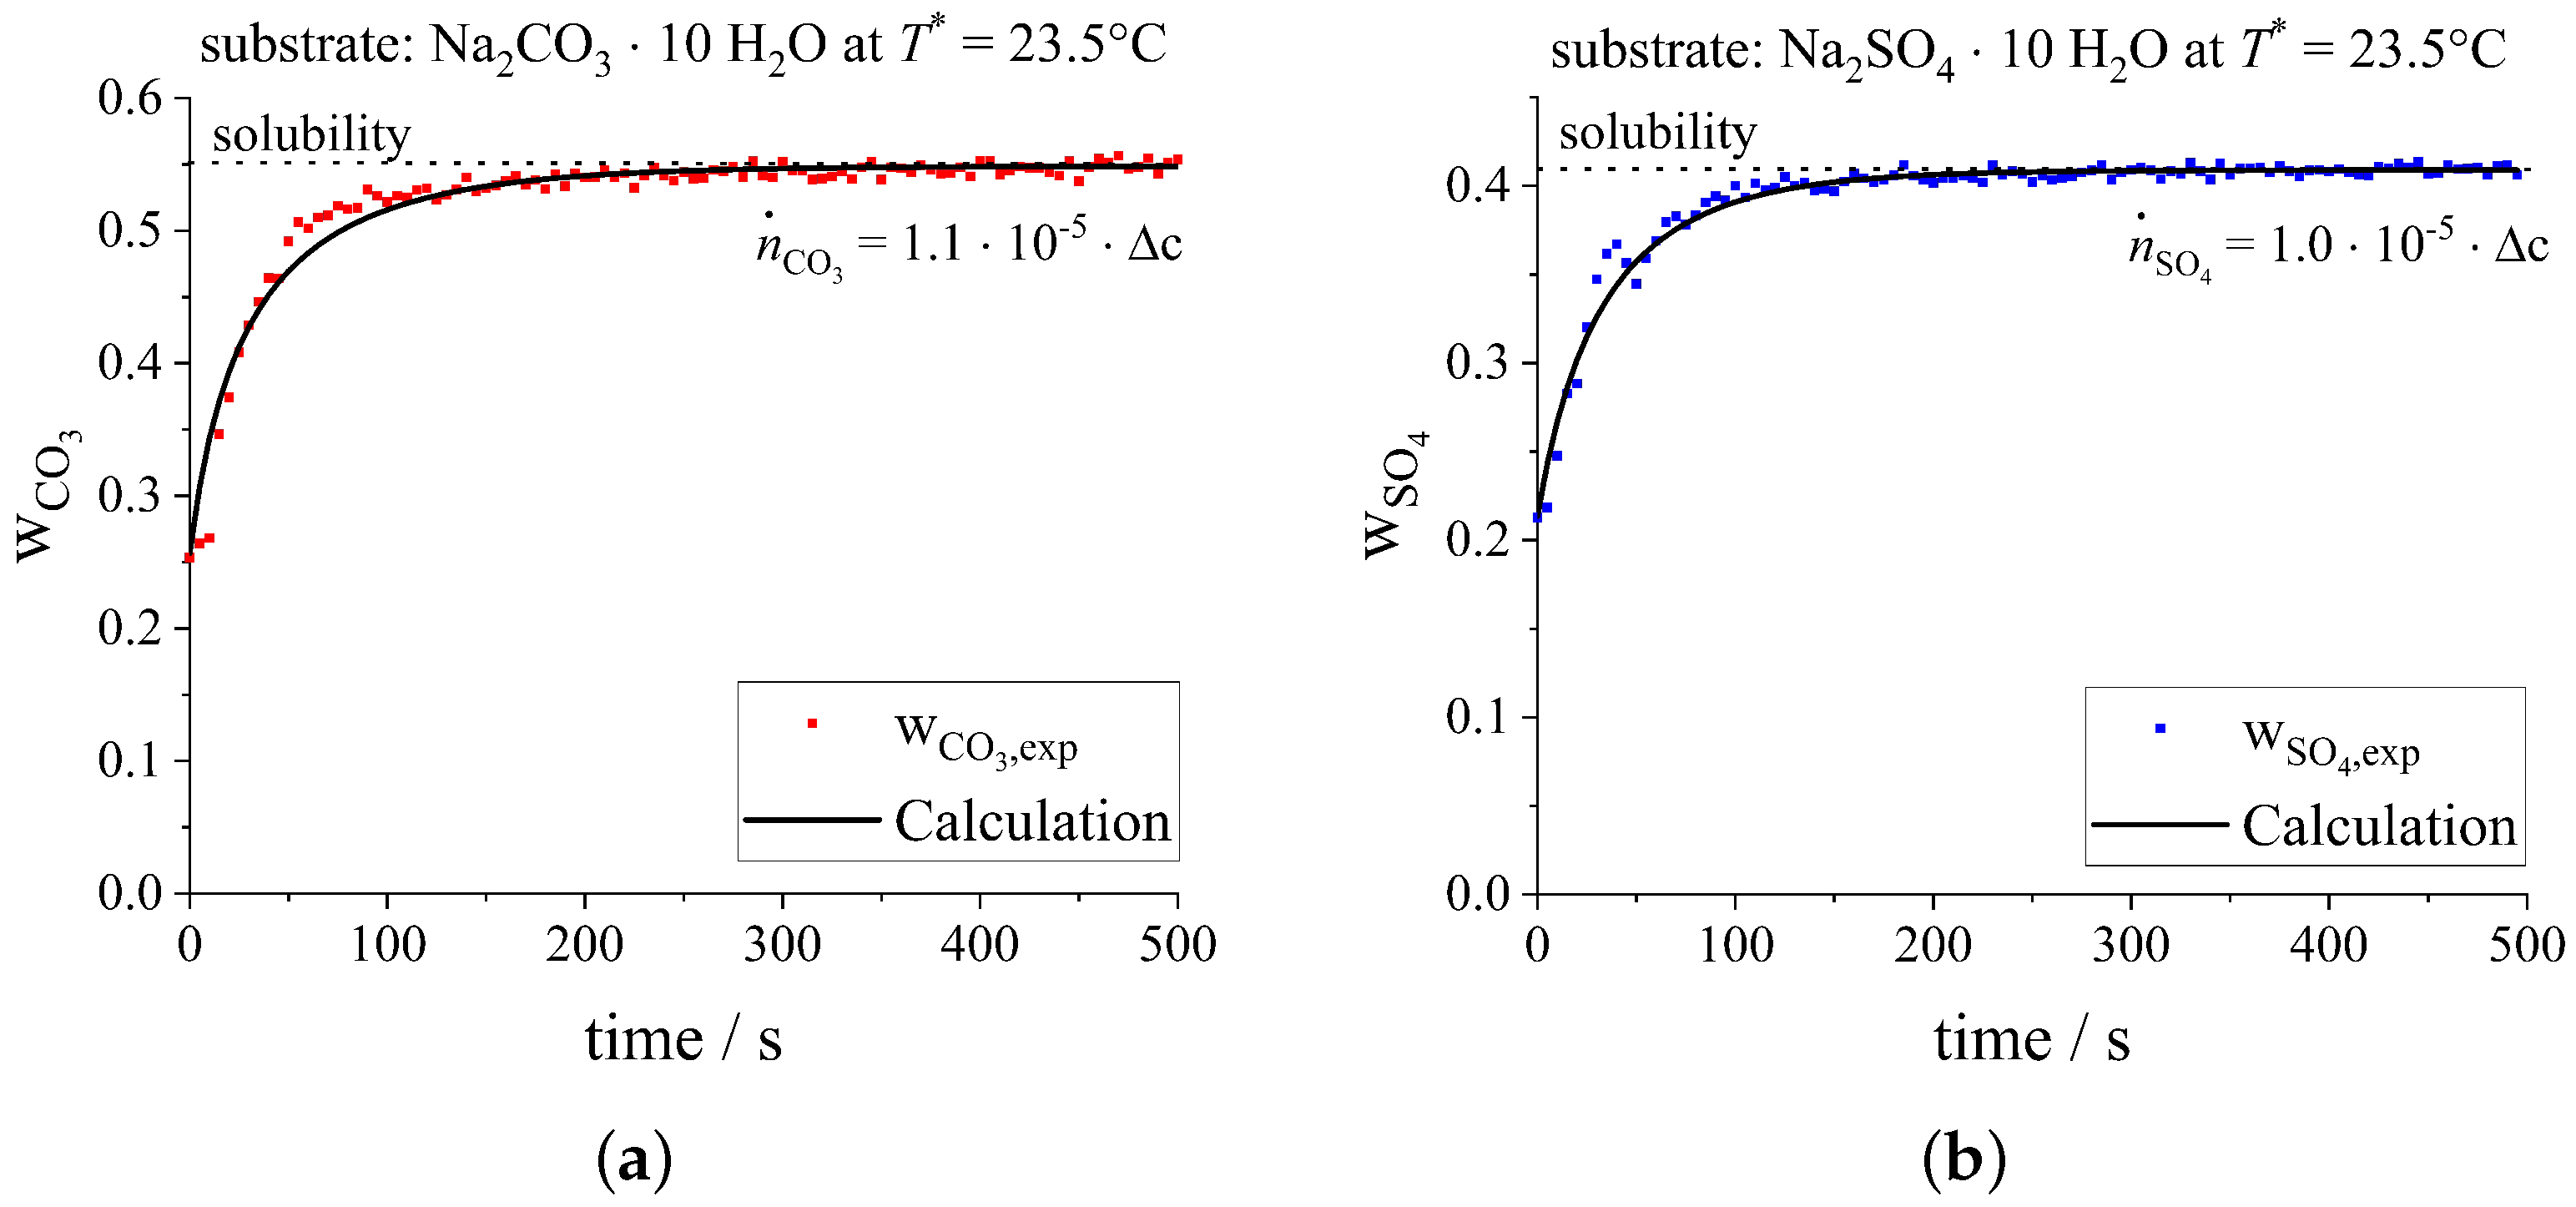
3.1.1. Binary Dissolution

In Figure 5, the dissolution of both materials at 23.5 °C is displayed. Mass fractions of the respective decahydrates w C O 3 and w S O 4 in solution are plotted over time. Here, we relate the mass fractions to fictitious occurring decahydrates in solution, as these were the crystallizing entities under the prevailing conditions, thereby reducing the set of equations for evaluation.
By inserting Equation (2) in Equation (7) and using it to solve the mass balances (4) and (5), it is possible to fit the experimental courses empirically. The final equation of the transient change in mass fraction of component i is revealed by Equation (8):
d w i d t = d M i L / M L d t = A · M ˜ i · k g , i · ρ ˜ solution g M L · w i w i g
In order to calculate the solution of the transient change in mass fraction of component i, it is necessary to solve the other component balances and the overall mass balance to identify the overall mass in solution M L . The exponent g can be interpreted as a process order. If the process is linearly dependent on supersaturation, it is equal to one. This behavior is assumed for dissolution processes. Crystallization processes, on the other hand, can be nonlinear. In Figure 5 and all upcoming figures in this work, these courses are depicted with black solid lines. The solution density is approximated as a constant for each experiment and calculated with PhreeqC and its database frezchem at initial conditions [42]. Due to the very slight changes in composition, this approximation was considered justified.
In the case of dissolution measurements, k g , i = k d , i and g = 1.0 were applied. A diffusion mass transfer coefficient of k d , i was adapted in order to minimized the least square deviance between the measured data and the fit. Examples of the resulting mass fraction courses for each electrolyte are shown in Figure 5 as solid lines. Because the kinetics could be temperature-dependent, a variety of different experimental temperatures was evaluated. Because the phase diagram of the material system changes at temperatures over 30 °C, the possible equilibration temperatures are limited. Four equilibrium temperatures in the range from 17 to 23.5 °C were investigated with solutions saturated at 20 °C and 25 °C, respectively. The mean kinetic parameters at different equilibrium temperatures are listed in Table 1 and Table 2.
As can be seen from the tables, the mass transfer coefficients for diffusion control of both material systems are temperature-independent and similar within the investigated range. Therefore, a mean mass transfer coefficient of k d , i = ( 9 ± 3 ) × 10 6 m s−1 was determined for both components. Additional experimental data from our dissolution experiments can be reviewed in the supporting information (compare Figures S1 and S2 to S6 and S8, and Table S1 to Table S2).

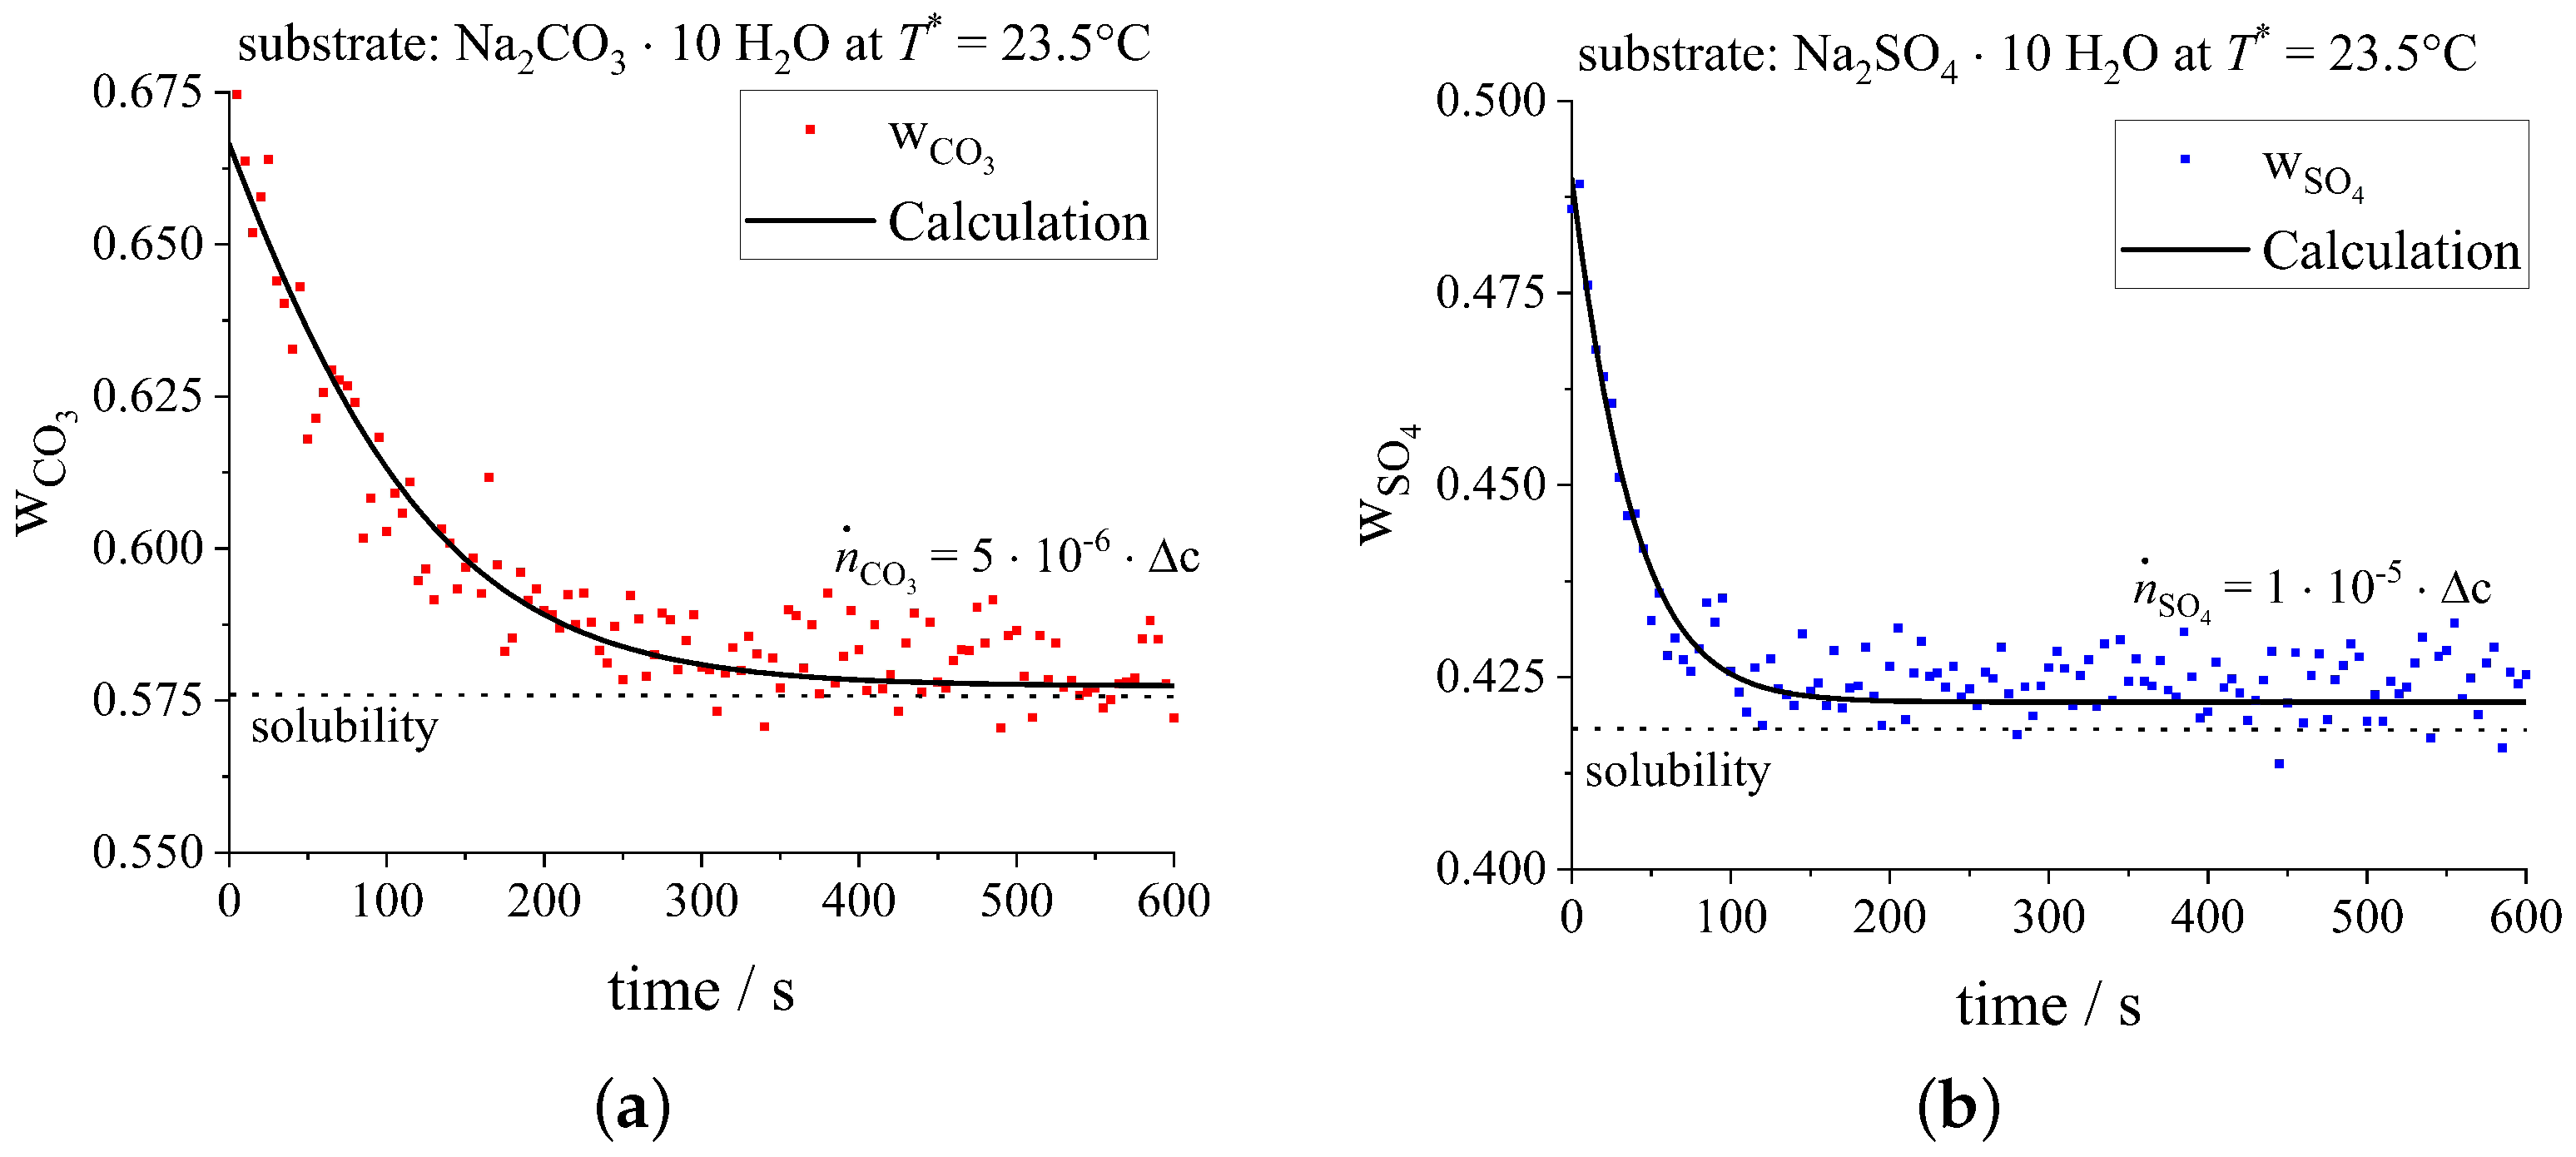
3.1.2. Binary Crystallization

In order to determine the crystal growth kinetics, desupersaturation results were analyzed in the same way. Initial supersaturation was limited to a maximum of 3 K. At higher supersaturations, spontaneous nucleation in the film could not be prevented. Analogous to the dissolution evaluation, the results were fitted with the empirical power law function (compare Equation (2)) and evaluated following the diffusion–reaction theory. Examples of desupersaturation courses at 23.5 °C can be seen in Figure 6.
Again, the mass fractions of both decahydrates w C O 3 and w S O 4 are plotted over time. To compare the results with data from the literature, mass transfer rates M i ˙ determined with Equation (7) were translated into growth rates v by dividing the mass transfer rate by the surface area A and solid density ρ S :
v = M i ˙ · 1 A · ρ S
There are many publications on the crystal growth kinetics of this system, of which we refer to a few below. Rosenblatt et al. [48] investigated the growth of a single sodium sulfate decahydrate particle which was overflown by a supersaturated solution in a temperature range of 25.7 to 27.4 °C. Additionally, they investigated the growth process in the same cell with a solution velocity of zero. These results are used for comparison with the data obtained in our work. Vavouraki and Koutsoukos [49] determined the growth kinetics of sodium sulfate decahydrate from seeded suspension experiments at 18 and 20 °C. Their data at 18 °C are considered for comparison as well. In Figure 7, selected growth rates of sodium sulfate decahydrate in this work and from the named publications are depicted as a function of Δ c = ( c c * ) . Our obtained weight-based measures were transformed to volume-based concentrations using Equation (1) for comparison with the data from the literature.
The growth rates in the present work (black squares) were taken from several experiments with different equilibrium temperatures and at different times for the desupersaturation process. The comparable experimental set-up of Rosenblatt et al. (gray circles) led to similar growth rates as a function of Δ c compared to our work. The higher growth rates in the experiments of Vavouraki and Koutsoukos (black triangles) can be explained by the different experimental conditions in a stirred vessel. Nevertheless, the growth rates are of a similar order of magnitude as those in our experiments. Hence, we were able to determine reasonable growth and mass transfer rates which can be evaluated with kinetic equations. We refrain from comparing our mass transfer coefficients k g , i and crystallization orders g with the data from the literature, as the experimental setups and dimensions are quite different.
The resulting kinetic coefficients k g , i and orders of crystal growth g are listed in Table 1 and Table 2.
The maximum initial supersaturation σ m a x , i = w i , init w i * w i * of the desupersaturation experiments at different temperatures defines the validity limit of the kinetic data k g , i and g. The maximum initial supersaturation of sodium sulfate decahydrate is σ m a x , S O 4 = 0.2 , and that of sodium sulfate decahydrate is σ m a x , C O 3 = 0.15 . From the desupersaturation measurements, we obtained kinetic data for the supersaturation range of σ m a x , i > σ i > 0 . Thus, these kinetic data are valid at lower supersaturations than σ m a x , i as well.
Both components mostly followed a crystallization order g of one. With regard to the diffusion–reaction theory, this means that the process might be diffusion-limited. In order to decide whether this is true or whether the integration process might be of first order and time decisive for the process, crystallization and diffusion mass transfer coefficients were compared. For simplicity and practicability, a mean coefficient of k g , S O 4 = ( 9 ± 5 ) × 10 6 m s 1 over the investigated temperature range was used for sodium sulfate decahydrate. This is reasonable, as it can be seen in Figure 7 that the growth rate depends linearly on the concentration difference Δ c . No deviations from this trend are observable, even when analyzing different equilibrium temperatures. Furthermore, the results of Rosenblatt et al. at higher temperatures than in the present work (>25 °C) were of a similar order. Because k d , S O 4 and k g , S O 4 are equal, the mass transfer coefficient for the integration into the crystal lattice k r , S O 4 has to be many orders greater. Thus, diffusion limitation for sodium sulfate is obvious. Other than sodium sulfate decahydrate, sodium carbonate decahydrate appeared to have a higher crystallization order of 1.2 and 1.4 at 18.5 and 17 °C, respectively. This indicates that the process was limited by integration to a certain extend. The high variance in kinetic values shown in Table 2 can be explained by the variation in the investigated orders g, which varied between 1.0–2.0 in our seven experiments. Hence, the unit of k g , C O 3 changed, and the order of magnitude along with it. It should be noted that the order g of the process must be considered for comparison of the mass transfer coefficients k g , i . Nevertheless, the averaged kinetics were determined to reproduce the experimental data. The mass transfer coefficients and orders of crystallization were averaged independently of the equilibrium temperature at which they were determined.
In Figure 8, the desupersaturation courses from Figure 6 are reproduced along with the mean growth kinetic coefficients, which were averaged from all conducted experiments. To highlight a range of accuracy, dashed lines are inserted to represent the measurement uncertainty of the respective species, namely, sodium sulfate and sodium carbonate. Uncertainties determined by our calibration experiments are provided in the supporting information. Further experimental data approximated with a mean fit can be found in the supporting information as well; compare Figures S11 and S18. In addition to desupersaturation data, additional binary dissolution experiments are displayed along with with the averaged dissolution kinetics. As can be seen from the diagrams, the approximations are in good agreement with the experimental data, thereby legitimating the averaging process.

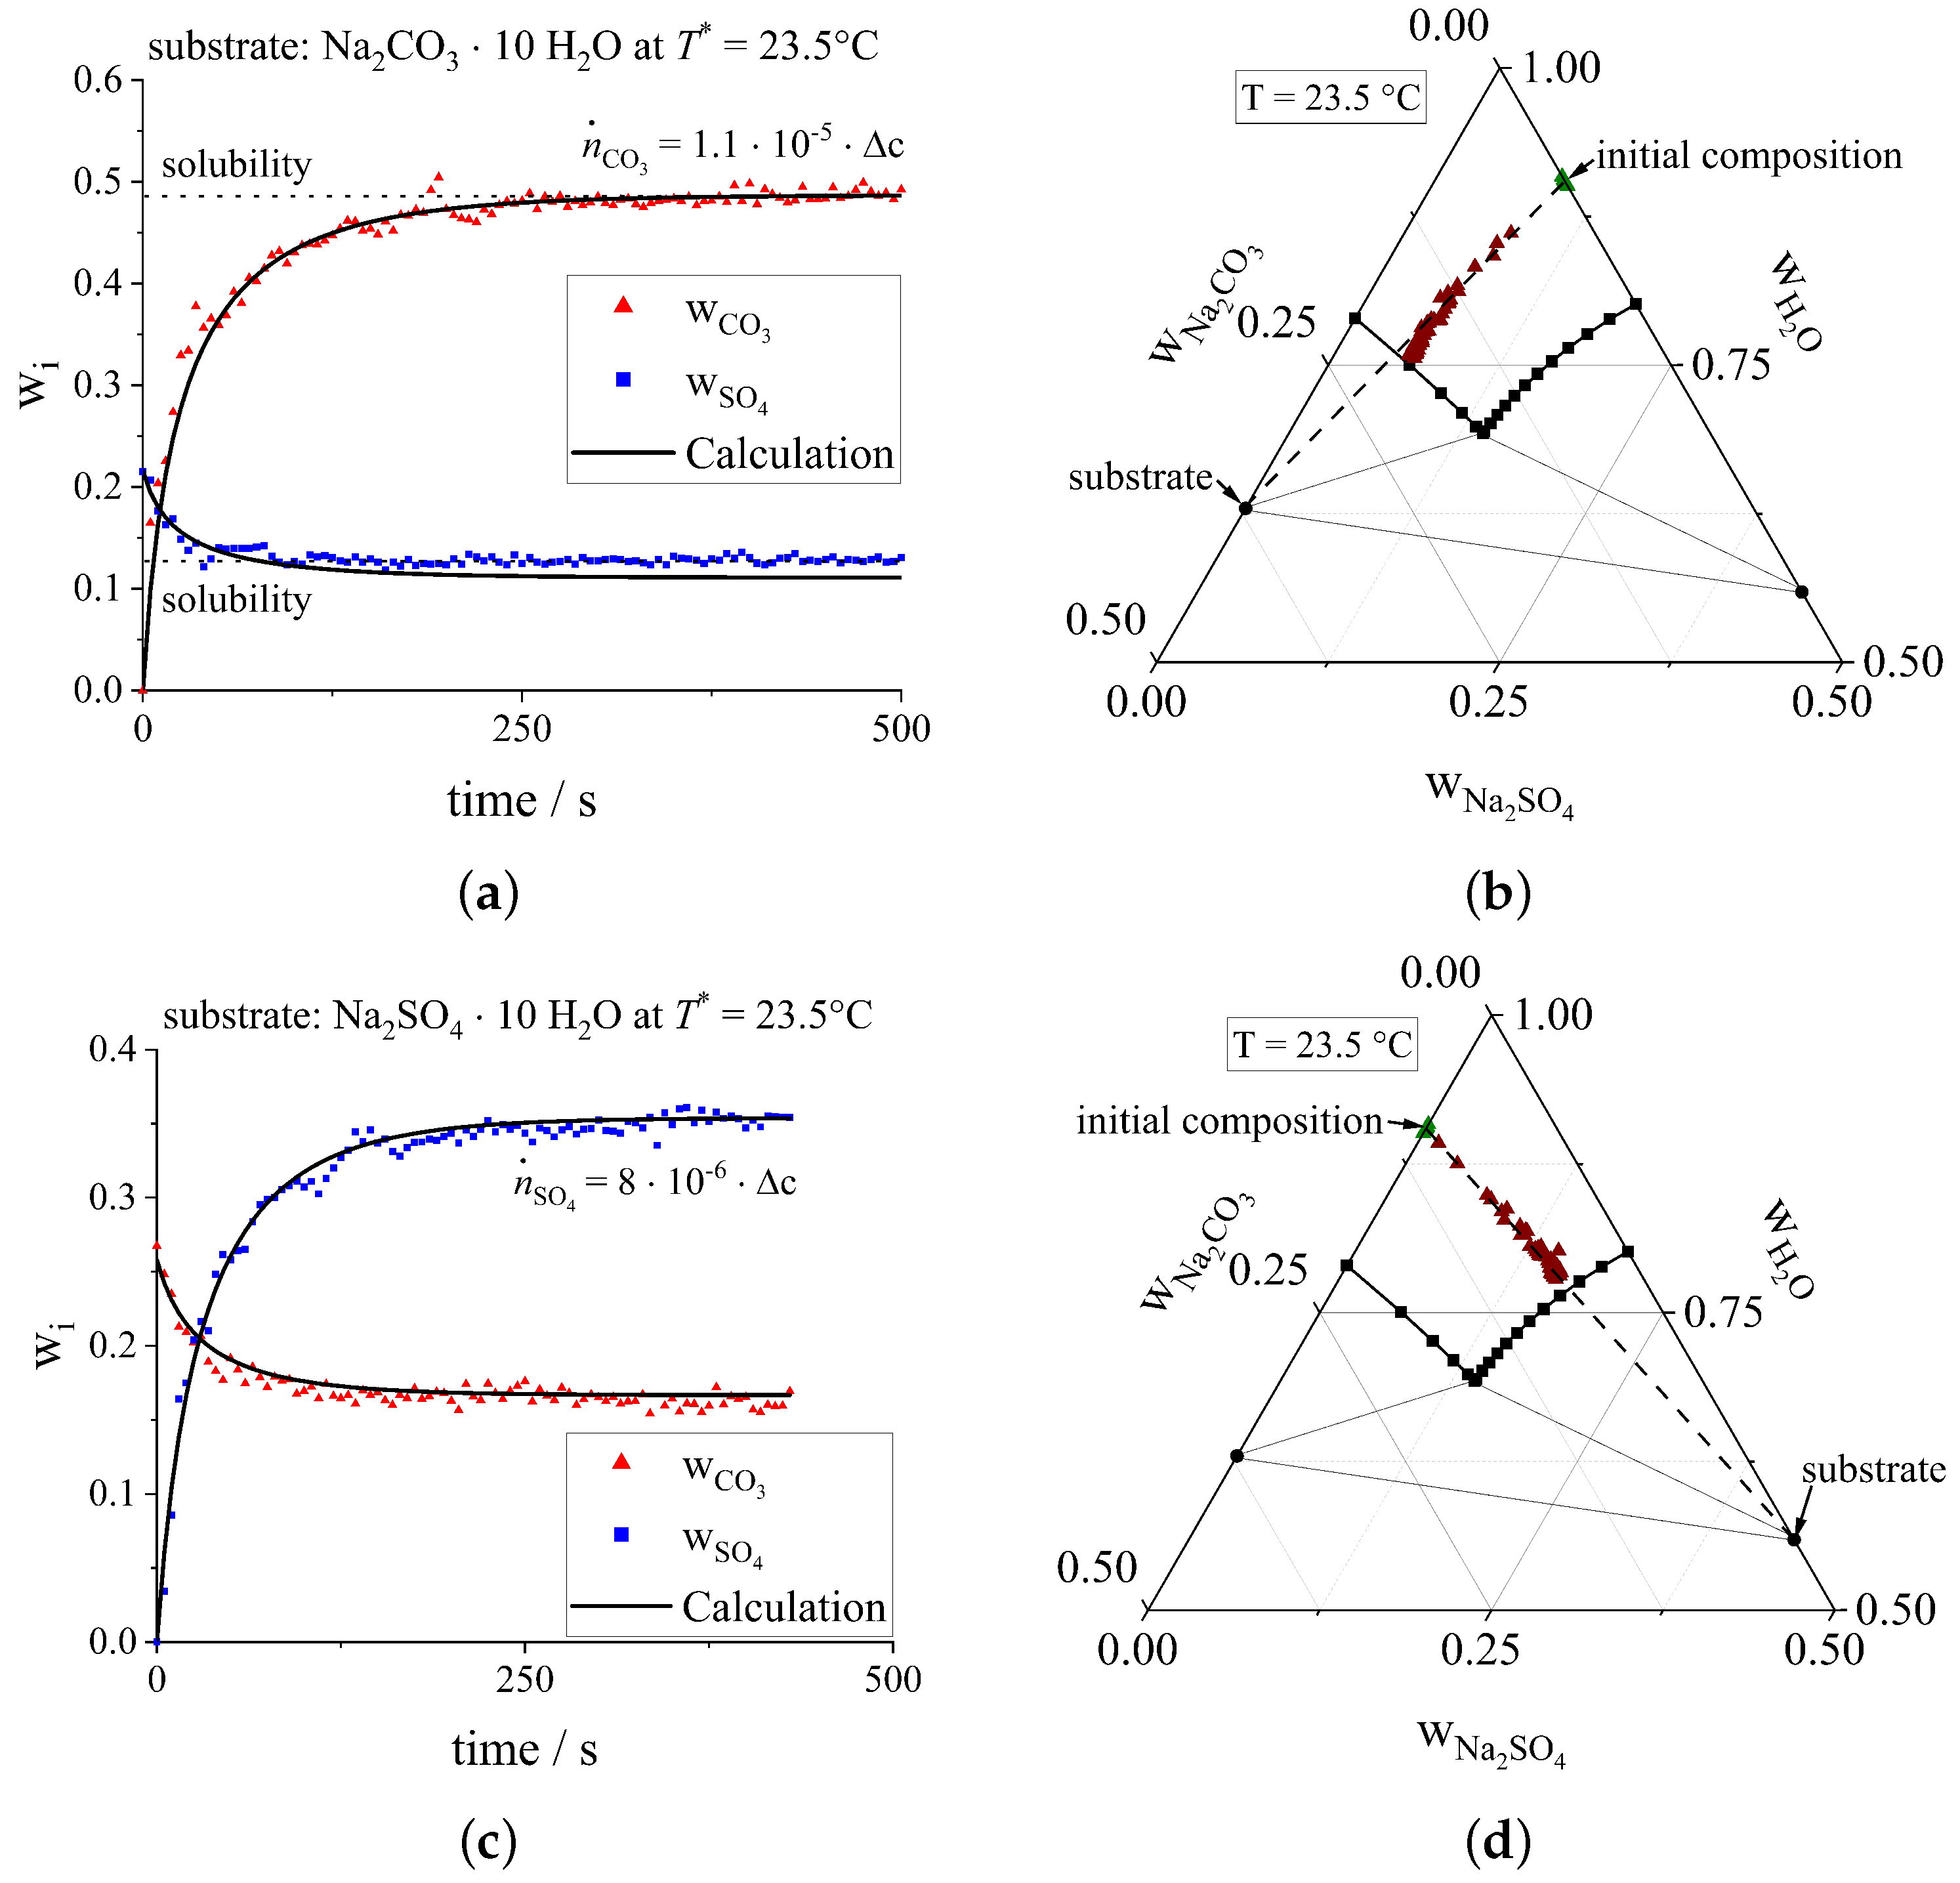
3.2. Ternary Experiments

Ternary experiments were evaluated in the same way as the binary experiments. First, dissolution measurements were performed in order to obtain diffusion mass transfer coefficients. Afterwards, desupersaturation measurements were conducted. The initial solutions were prepared in such a way that they were supersaturated with respect to both salts. Hence, the solution in thermodynamic equilibrium should always be eutectic. All mass fractions were related again to the decahydrates of their respective electrolytes. Again, the black solid lines represent the empirically modeled courses, which were determined with Equation (8) for both components, and the overall mass balance (Equation (4)). The order of process g was assumed to be unity for dissolution processes. It was assumed that crystallization processes could be nonlinear.

Ternary Dissolution

The initial solutions had no content of the substrate material and a non-neglectable amount of the foreign component. Exemplary results for both components are displayed in Figure 9.
In Diagrams (a) and (b), the dissolution of a sodium carbonate decahydrate substrate is shown. Diagram (a) displays the transient changes in mass fraction of sodium sulfate decahydrate and sodium carbonate decahydrate in solution. Diagram (b) depicts the transferred compositions in a triangle diagram at 23.5 °C. The green triangles represent the initial composition, whereas the measured solution compositions during dissolution are represented by brown triangles. The dashed line connects the initial composition with the point of substrate composition. Similarly, Diagrams (c) and (d) show the dissolution process of sodium sulfate decahydrate. The calculated concentration evolutions (black lines) in Diagrams (a) and (c) were determined by adaption of the respective mass transfer coefficients and setting g = 1 .
In the presence of the other salt, the kinetics did not change significantly compared to the binary results. Again, the coefficients k d , i were similar in the investigated temperature range (17–23.5 °C) and did not depend on the initial solution composition, which is why averaged values over the whole temperature range are presented. The mass transfer coefficient of sodium carbonate was slightly higher than in the binary setup, resulting in k d , C O 3 = ( 10 ± 4 ) × 10 6 m s 1 . For sodium sulfate, a slightly lower value of k d , S O 4 = ( 6 ± 2 ) × 10 6 m s 1 was determined.
Diagrams (b) and (d) clearly show that both dissolution processes follow the expected path (dashed line). Due to the dissolution of the labeled substrate material into a solution with the initial concentration marked in green, all measurement points should lie on the dashed lines. This is true for both processes. Thus, the anhydrous salt and the bound water are released into the solution. Furthermore, the steady-state concentration reaches the calculated solubility line at 23.5 °C, confirming the argument that the temperature can be assumed to be independent of the laser energy and phase transition enthalpy. Additional experimental data from our dissolution experiments can be reviewed in the supporting information (compare Figures S3 and S5 to S9 and S10 and Table S7).

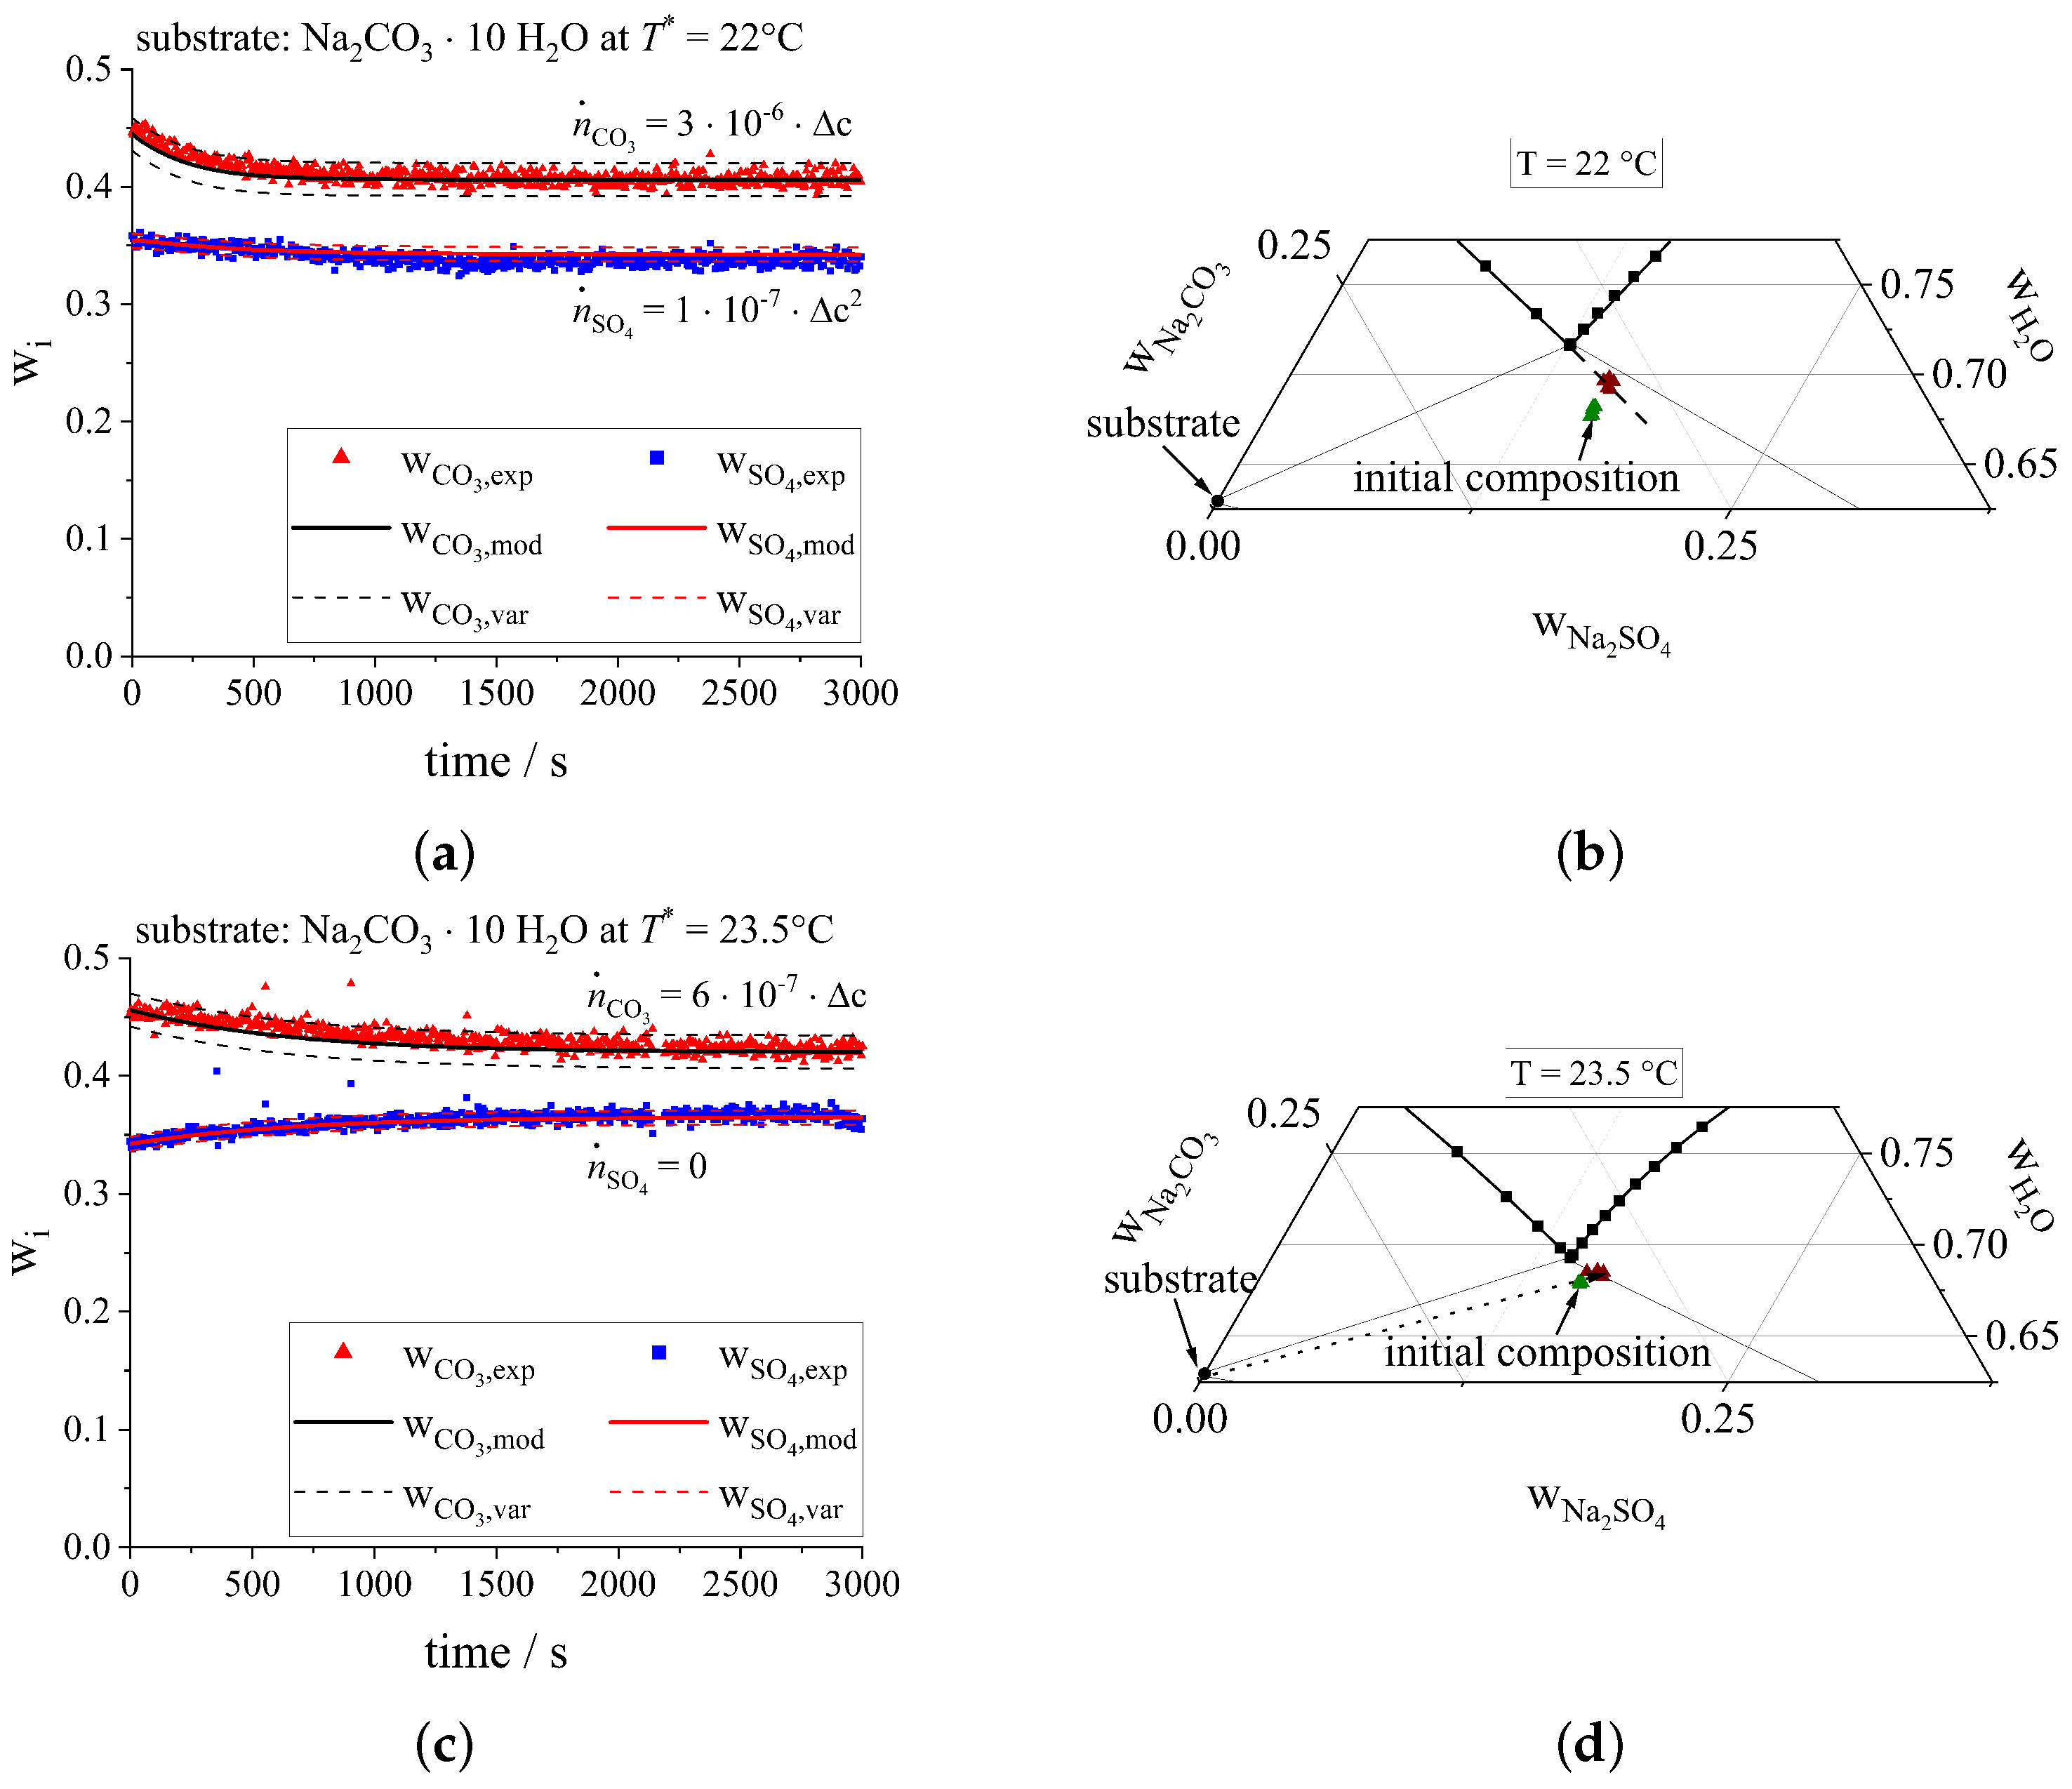
3.3. Ternary Crystallization
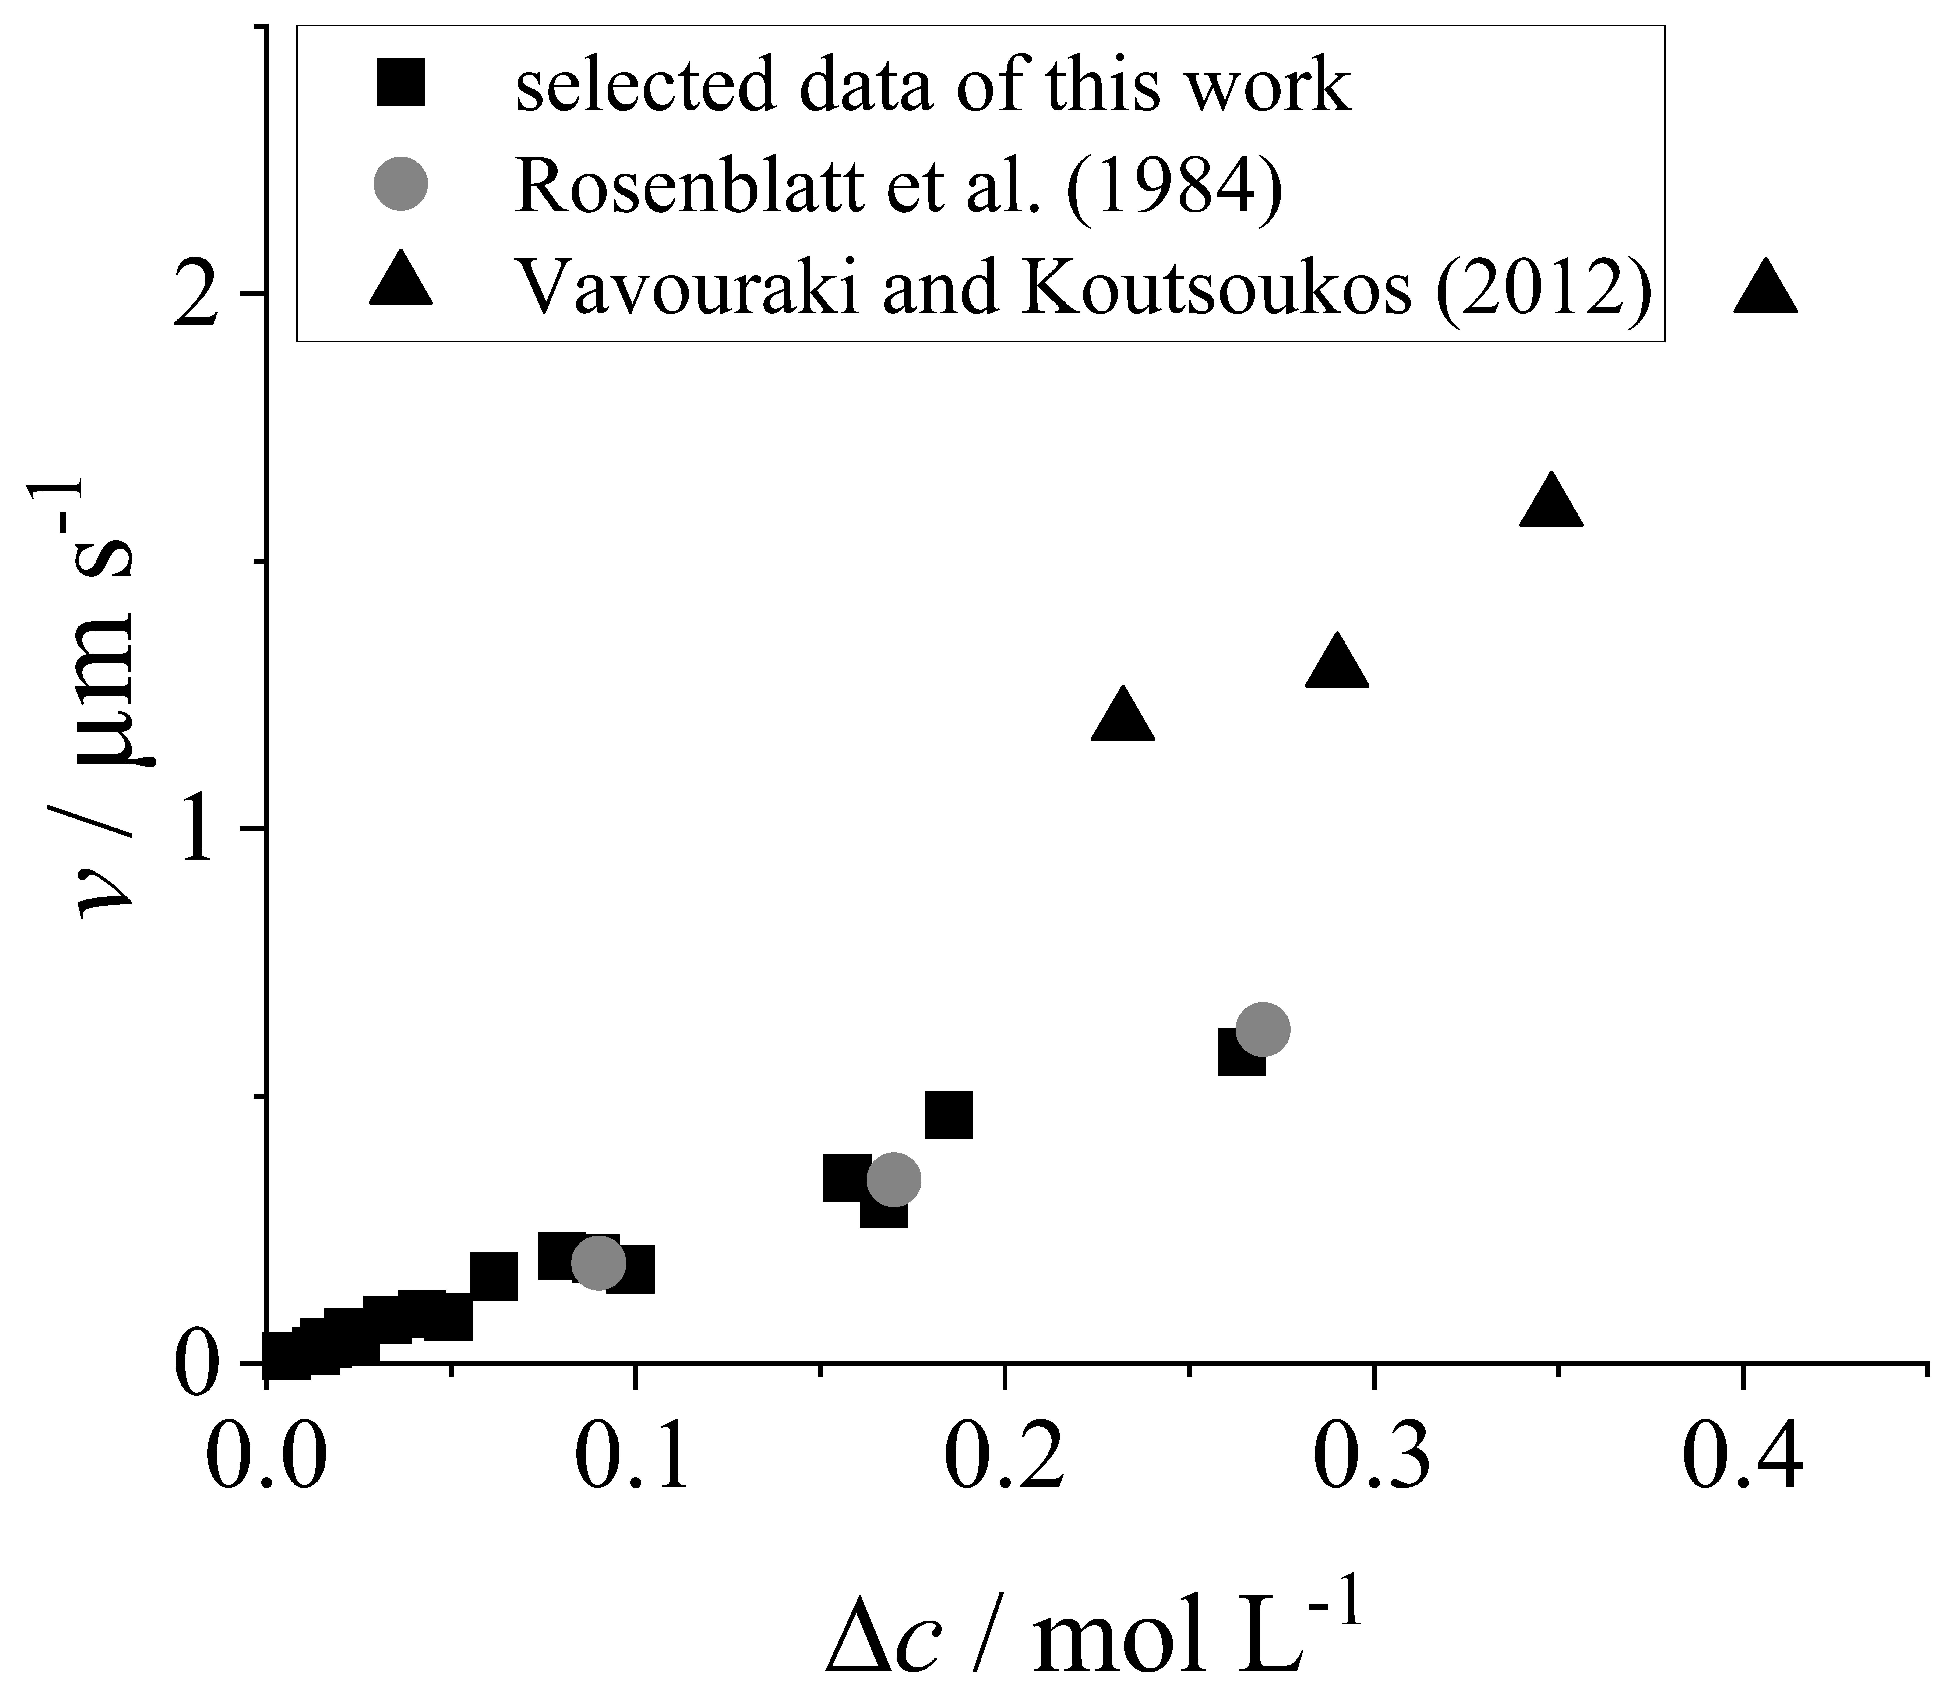
In this section, we only show the results of our experiments with sodium carbonate decahydrate substrates; the results from experiments on sodium sulfate decahydrate substrates showed similar behavior, and can be reviewed in the supporting information (compare Figures S22–S26). Ternary desupersaturation measurements produced two distinctive cases. The first case is displayed in Figure 10a,b, and represents simultaneous growth of both components, as both mass fractions in the solution decreased. The second is shown in Figure 10c,d, and represents a separation process with one component remaining in solution.
The two cases presented in Figure 10 show that growth along with simultaneous material separation is possible even with the same substrate materials. Again, the kinetic variables k g , i and g result from the regression analysis. All experimentally determined coefficients from several experiments were averaged in order to find one kinetics that fits all simultaneous growth experiments. Therefore, the determined kinetic parameters are valid over the temperature range 17–23.5 °C and up to ideal initial supersaturations of σ m a x , i = w i , init w i * w i * = 0.3 . In Diagrams (a,c) in Figure 10, the mean kinetics and an accuracy range of the Raman measurement deviation are shown together with the experimental data. Diagrams (b,d) only show the initial and steady-state concentrations. We refrained from showing the points in between because of the low changes in concentration. In Diagram (a), desupersaturation of both components on a sodium carbonate decahydrate substrate are observable. The diagram displays an average example of this type of experiment. The resulting crystallization order of sodium carbonate decahydrate was g = 1.0 ± 0.1 . The mass transfer coefficient resulted in k g , C O 3 = ( 3 ± 3 ) × 10 6 m s 1 . Sodium sulfate decahydrate solidified at an order of g = 2.0 ± 0.1 . The average mass transfer coefficient was k g , S O 4 = ( 1 ± 1 ) × 10 7 m 4 mol 1 s 1 . Both mass transfer coefficients show strong deviation. This was especially the case due to the behavior of the foreign component, which was not equal in every experiment. As it needed to build nuclei on the substrate, the kinetics varied. Nonetheless, the approximations agreed well with the measured data. The calculated courses and their underlying kinetics showed that carbonate followed a slower kinetics at low supersaturations compared to the binary setup.
On the contrary, sodium sulfate acted differently compared to the binary experiments. This is reasonable, as it was not able to grow on its own substrate and had to build nuclei on the sodium carbonate decahydrate substrate. The kinetics followed a higher order, and the mass transfer occurred over a complete experimental time of more than 3000 s. Because nucleation processes were not considered in the evaluation, the kinetics displayed an effective or “pseudo”-crystal growth rate. Hence, the neglected formation of nuclei can be interpreted as an integration control. We interpret the pronounced nonlinearity of growth kinetics (g > 2) we observed to be due not to growth behavior but rather to nucleation, which is of pronounced nonlinearity as well. It can be imagined that this process could be divided into successive steps with kinetics of different orders. This was not within the scope of this study; however, it could offer possibilities for future investigations. Additional experimental data and approximations are provided in the supporting information (compare Figures S19–S26 and Tables S3–S7).
The process points at the beginning and end of the experiment in Diagram (b) show interesting behavior. Even though both components crystallized and reduced their concentration, the solution did not attain a eutectic composition. Rather, the solution equilibrated in a state that lies on the extension of the solubility line of sodium carbonate decahydrate. Hence, the solution was in equilibrium with sodium carbonate decahydrate and not with sodium sulfate decahydrate.
Phenomenologically, the newly built surface of the experiment in Figure 10a exhibits a layered or “self-coated” surface. Sodium carbonate equilibrated after 500 s, while sodium sulfate continued to grow. Hence, the top layer was made up of the foreign component alone.
Table 3 summarizes the averaged kinetic data over the entire temperature range of 17–23.5 °C. In addition to the aforementioned concurrent crystallization data, the mass transfer coefficients from ternary dissolution experiments k d , i are provided, as are the kinetic data for the crystallization of only the substrate material N a 2 C O 3 · 10 H 2 O .
Diagram (c) in Figure 10 shows a phase separation process on a sodium carbonate substrate. This behavior could be observed in only a few experiments. This was especially the case when initial supersaturation was low. This is reasonable, as foreign components need to build nuclei first. The required supersaturation was not reached, which is why only the substrate component crystallized. In these cases, the kinetic coefficient decreased to k g , C O 3 = ( 6 ± 2 ) × 10 7 m s 1 , while the order of crystallization remained at one. Comparing the mass transfer coefficient of the crystallization process with that from the dissolution experiments leads to the conclusion that the process is mostly integration-limited. Similar results were observed in a few experiments with sodium sulfate decahydrate substrates. In the supporting information, diagrams are displayed showing the data together with the averaged fits (compare Figures S19–S26).
Diagram (d) clearly displays that only the sodium carbonate decahydrate crystallized. The brown triangles representing the steady-state composition lie on the elongation of the connecting line of the substrate and the initial composition. The final solution state is in equilibrium with sodium carbonate decahydrate and not with sodium sulfate decahydrate.
Crystallization of solely sodium carbonate was hindered by the reverse anions when these remained in solution. The phenomenological explanation of this case is as follows. Because of the exclusive incorporation of one component onto the solid surface, the other component is enriched, hindering the substrate material from crystallizing. When supersaturation is increased further, the foreign component is able to crystallize and build a more or less singular component layer. This was observed in a few cases on sodium sulfate substrates, as displayed in Figure 11.
The diagram shows that, compared to binary experiments, similar kinetics of the substrate component result in higher supersaturation of the foreign component. By reaching a certain supersaturation, this component can builb nuclei and crystallize on the surface. The final solution composition was eutectic at 23.5 °C; hence, the solution was in equilibrium with both decahydrates (compare Diagram (b)).

4. Discussion

Confocal micro-Raman spectroscopy in combination with desupersaturation measurements from thin films showed the ability to determine empirical crystallization kinetics from binary and ternary solutions. In binary experiments, similar growth rates were obtained for sodium sulfate decahydrate compared to data from the literature. Growth of sodium sulfate decahydrate from a thin film of 150 µm was investigated and found to be diffusion-limited, with a mean mass transfer coefficient of k g , S O 4 = ( 9 ± 5 ) × 10 6 m s 1 . In addition, sodium carbonate decahydrate was evaluated in terms of its crystal growth limitations from thin aqueous solution films. Our analysis indicated diffusion as well as integration limitation, along with a mass transfer coefficient varying in the range of 3 × 10 6 m s 1 < k g , C O 3 < 14 × 10 6 m s 1 . Our physical interpretations were made using the diffusion–reaction theory.
Two different cases occurred in our ternary experiments. First, simultaneous crystallization was observed. In these cases, the crystal growth kinetics of both components could be evaluated. The pseudo-crystal growth kinetics of the foreign component resulted in orders greater than one. We call this “pseudo” because nucleation was not considered in the evaluation, and was instead integrated in the growth kinetics. In future studies, it could be possible to examine the courses using separate kinetics for alternate mechanisms, rather than using the overall kinetics. From the desupersaturation courses, especially on sodium carbonate substrates, it was obvious that the substrate components crystallized faster than the foreign component. Sodium carbonate decahydrate showed similar kinetics compared to binary experiments, with k g , C O 3 = 3 × 10 6 m s 1 and a reaction order of g = 1 . Conversely, sodium sulfate decahydrate had a reaction order of g = 2 and a mass transfer coefficient of k g , S O 4 = 1 × 10 7 m s 1 . This resulted in a few cases of self-coated surfaces with the foreign component on top.
On the other hand, in a few experiments integration on the substrate was limited to a single component. This preferential crystallization is comparable with a separation step, and produced a pure layer on the substrate with the level of he foreign component in the solution being increased. In addition, the growth process was strongly decelerated through the presence of counter-ions, which resulted in a decrease of the mass transfer coefficient of about an order of magnitude (to k g , C O 3 = 6 × 10 7 m s 1 ) for sodium carbonate decahydrate.
No investigated empirical kinetic parameters were dependent on temperature or concentration. Averaged kinetics were used in order to provide a pragmatic approach that can be used as a general description of the simultaneous crystallization of the N a 2 S O 4 - N a 2 C O 3 - H 2 O material system.
In future research, the kinetics resulting from this study can be used for modeling and prediction of multi-component crystal growth, calculation of desupersaturation courses, and projection of surface compositions.

Supplementary Materials

The following are available at https://www.mdpi.com/article/10.3390/cryst12111568/s1. The PDF-file SI_calibration.pdf provides Raman calibration data. The listed zip files contain all dissolution and desupersaturation data, together with their average fits. In addition to the already presented data on experiments with sodium carbonate decahydrate substrates, results of desupersaturation measurements from solutions in contact with sodium sulfate decahydrate are provided. All displayed experiments were part of the kinetic evaluation. Tables of the kinetic coefficients are provided as well; the average kinetic coefficients were built from this data. The following files are available free of charge: “SI_calibration.pdf”: Raman calibration data; “data_desupersaturation_average.zip”: all binary and ternary desupersaturation data, including experimental results and applied average fit; “data_dissolution_average.zip”: all binary and ternary dissolution data, including experimental results and applied average fit; “data_kinetic_parameters.zip”: lists of all kinetic coefficients from which average values were formed.

Author Contributions

Conceptualization, C.H. and M.K.; methodology, C.H.; formal analysis, C.H.; investigation, C.H.; resources, M.K.; data curation, C.H.; software, C.H.; validation, C.H.; writing—original draft preparation, C.H.; writing—review and editing, M.K.; visualization, C.H.; supervision, M.K.; project administration, C.H.; funding acquisition, M.K. All authors have read and agreed to the published version of the manuscript.

Funding

This research received no external funding.

Data Availability Statement

Not applicable.

Acknowledgments

The authors kindly thank Natalie Ritter for her valuable help in conducting experiments.

Conflicts of Interest

The authors declare no conflict of interest.

References

  1. Guignon, B.; Duquenoy, A.; Dumoulin, E.D. Fluid bed encapsulation of particles: Principles and practice. Dry. Technol. 2002, 20, 419–447. [Google Scholar] [CrossRef]
  2. Degrève, J.; Baeyens, J.; van de Velden, M.; de Laet, S. Spray-agglomeration of NPK-fertilizer in a rotating drum granulator. Powder Technol. 2006, 163, 188–195. [Google Scholar] [CrossRef]
  3. Suresh, P.; Sreedhar, I.; Vaidhiswaran, R.; Venugopal, A. A comprehensive review on process and engineering aspects of pharmaceutical wet granulation. Chem. Eng. J. 2017, 328, 785–815. [Google Scholar] [CrossRef]
  4. Römbach, E.; Ulrich, J. Self-controlled coating process for drugs. Cryst. Growth Des. 2007, 7, 1618–1622. [Google Scholar] [CrossRef]
  5. Shin, G.S.; Choi, W.G.; Na, S.; Ryu, S.O.; Moon, T. Rapid crystallization in ambient air for planar heterojunction perovskite solar cells. Electron. Mater. Lett. 2017, 13, 72–76. [Google Scholar] [CrossRef]
  6. Yu, W.Z.; Zhang, Y.; Liu, X.; Xiang, Y.; Li, Z.; Wu, S. Synergistic antibacterial activity of multi components in lysozyme/chitosan/ silver/hydroxyapatite hybrid coating. Mater. Des. 2018, 139, 351–362. [Google Scholar] [CrossRef]
  7. Schönhoff, M. Self-assembled polyelectrolyte multilayers. Curr. Opin. Colloid Interface Sci. 2003, 8, 86–95. [Google Scholar] [CrossRef]
  8. Nijdam, J.; Trouillet, V.; Kachel, S.; Scharfer, P.; Schabel, W.; Kind, M. Coat formation of surface-active proteins on aqueous surfaces during drying. Colloids Surfaces B Biointerfaces 2014, 123, 53–60. [Google Scholar] [CrossRef]
  9. Seo, K.S.; Han, H.K. Multilayer-coated tablet of clopidogrel and rosuvastatin: Preparation and in vitro/in vivo characterization. Pharmaceutics 2019, 11, 313. [Google Scholar] [CrossRef] [Green Version]
  10. Song, K.S.; Lim, J.; Yun, S.; Kim, D.; Kim, Y. Composite fouling characteristics of CaCO3 and CaSO4 in plate heat exchangers at various operating and geometric conditions. Int. J. Heat Mass Transf. 2019, 136, 555–562. [Google Scholar] [CrossRef]
  11. Lv, Y.; Lu, K.; Ren, Y. Composite crystallization fouling characteristics of normal solubility salt in double-pipe heat exchanger. Int. J. Heat Mass Transf. 2020, 156, 119883. [Google Scholar] [CrossRef]
  12. Nestler, B.; Garcke, H.; Stinner, B. Multicomponent alloy solidification: Phase-field modeling and simulations. Phys. Rev. E 2005, 71, 041609. [Google Scholar] [CrossRef] [PubMed] [Green Version]
  13. Yuan, J.J.; Stepanski, M.; Ulrich, J. Fremdstoffeinflüsse auf Kristallwachstumsgeschwindigkeiten bei der Kristallisation aus Lösungen. Chem. Ing. Tech. 1990, 62, 645–646. [Google Scholar] [CrossRef]
  14. Rauls, M.; Bartosch, K.; Kind, M.; Lacmann, R.; Mersmann, A. The influence of impurities on crystallization kinetics—A case study on ammonium sulfate. J. Cryst. Growth 2000, 213, 116–128. [Google Scholar] [CrossRef]
  15. Vergara, A.; Paduano, L.; Vitagliano, V.; Sartorio, R. Multicomponent diffusion in solutions where crystals grow. Mater. Chem. Phys. 2000, 66, 126–131. [Google Scholar] [CrossRef]
  16. Kubota, N. Effect of impurities on the growth kinetics of crystals. Cryst. Res. Technol. J. Exp. Ind. Crystallogr. 2001, 36, 749–769. [Google Scholar] [CrossRef]
  17. Louhi-Kultanen, M.; Kallas, J.; Partanen, J.; Sha, Z.; Oinas, P.; Palosaari, S. The influence of multicomponent diffusion on crystal growth in electrolyte solutions. Chem. Eng. Sci. 2001, 56, 3505–3515. [Google Scholar]
  18. Astilleros, J.M.; Pina, C.M.; Fernández-Díaz, L.; Putnis, A. Nanoscale growth of solids crystallising from multicomponent aqueous solutions. Surf. Sci. 2003, 545, L767–L773. [Google Scholar]
  19. Zago, G.P.; Penha, F.M.; Seckler, M.M. Product characteristics in simultaneous crystallization of NaCl and CaSO4 from aqueous solution with seeding. Desalination 2020, 474, 114180. [Google Scholar] [CrossRef]
  20. Penha, F.M.; Andrade, F.R.D.; Lanzotti, A.S.; Moreira Junior, P.F.; Zago, G.P.; Seckler, M.M. In Situ Observation of Epitaxial Growth during Evaporative Simultaneous Crystallization from Aqueous Electrolytes in Droplets. Crystals 2021, 11, 1122. [Google Scholar]
  21. Garside, J.; Mersmann, A.; Nývlt, J. Measurement of Crystal Growth and Nucleation Rates; IChemE: Rugby, UK, 2002. [Google Scholar]
  22. Cornel, J.; Mazzotti, M. Estimating crystal growth rates using in situ ATR-FTIR and Raman spectroscopy in a calibration-free manner. Ind. Eng. Chem. Res. 2009, 48, 10740–10745. [Google Scholar] [CrossRef]
  23. Qu, H.; Alatalo, H.; Hatakka, H.; Kohonen, J.; Louhi-Kultanen, M.; Reinikainen, S.P.; Kallas, J. Raman and ATR FTIR spectroscopy in reactive crystallization: Simultaneous monitoring of solute concentration and polymorphic state of the crystals. J. Cryst. Growth 2009, 311, 3466–3475. [Google Scholar] [CrossRef]
  24. Nanev, C.N.; Tonchev, V.D.; Hodzhaoglu, F.V. Protocol for growing insulin crystals of uniform size. J. Cryst. Growth 2013, 375, 10–15. [Google Scholar] [CrossRef]
  25. Eder, C.; Choscz, C.; Müller, V.; Briesen, H. Jamin-interferometer-setup for the determination of concentration and temperature dependent face-specific crystal growth rates from a single experiment. J. Cryst. Growth 2015, 426, 255–264. [Google Scholar] [CrossRef]
  26. Glade, H.; Ilyaskarov, A.M.; Ulrich, J. Determination of Crystal Growth Kinetics Using Ultrasonic Technique. Chem. Eng. Technol. 2004, 27, 736–740. [Google Scholar] [CrossRef]
  27. Egan, T.; Rodriguez-Pascual, M.; Lewis, A. In Situ Growth Measurements of Sodium Sulfate during Cooling Crystallization. Chem. Eng. Technol. 2014, 37, 1283–1290. [Google Scholar] [CrossRef]
  28. Garside, J.; Gibilaro, L.G.; Tavare, N.S. Evaluation of crystal growth kinetics from a desupersaturation curve using initial derivatives. Chem. Eng. Sci. 1982, 37, 1625–1628. [Google Scholar] [CrossRef]
  29. Montes-Hernandez, G.; Renard, F. Time-resolved in situ raman spectroscopy of the nucleation and growth of siderite, magnesite, and calcite and their precursors. Cryst. Growth Des. 2016, 16, 7218–7230. [Google Scholar] [CrossRef]
  30. Qu, H.; Kohonen, J.; Louhi-Kultanen, M.; Reinikainen, S.P.; Kallas, J. Spectroscopic Monitoring of Carbamazepine Crystallization and Phase Transformation in Ethanol–Water Solution. Ind. Eng. Chem. Res. 2008, 47, 6991–6998. [Google Scholar] [CrossRef]
  31. Offermann, H.; von Brachel, G.; Al-Sabbagh, A.; Farelo, F. Crystallization kinetics of NaCl in multicomponent solutions. Cryst. Res. Technol. 1995, 30, 651–658. [Google Scholar]
  32. Gurato, G.; Goatin, C.; Petrone, A.; Talamini, G.; Fenza, S.; Zannetti, R. Effect of impurities on the Na2SO4 crystallization. J. Cryst. Growth 1984, 66, 621–631. [Google Scholar] [CrossRef]
  33. Vavouraki, A.I.; Koutsoukos, P.G. The inhibition of crystal growth of mirabilite in aqueous solutions in the presence of phosphonates. J. Cryst. Growth 2016, 436, 92–98. [Google Scholar] [CrossRef]
  34. Su, N.; Wang, Y.; Xiao, Y.; Lu, H.; Lou, Y.; Huang, J.; He, M.; Li, Y.; Hao, H. Mechanism of influence of organic impurity on crystallization of sodium sulfate. Ind. Eng. Chem. Res. 2018, 57, 1705–1713. [Google Scholar] [CrossRef]
  35. Shi, B.; Rousseau, R.W. Crystal Properties and Nucleation Kinetics from Aqueous Solutions of Na2CO3 and Na2SO4. Ind. Eng. Chem. Res. 2001, 40, 1541–1547. [Google Scholar] [CrossRef]
  36. Shi, B.; Frederick, W.J.; Rousseau, R.W. Nucleation, growth, and composition of crystals obtained from solutions of Na2CO3 and Na2SO4. Ind. Eng. Chem. Res. 2003, 42, 6343–6347. [Google Scholar] [CrossRef]
  37. Helfenritter, C.; Kind, M. Multi-Component Diffusion in the Vicinity of a Growing Crystal. Crystals 2022, 12, 872. [Google Scholar] [CrossRef]
  38. Linnow, K.; Steiger, M.; Lemster, C.; de Clercq, H.; Jovanović, M. In situ Raman observation of the crystallization in NaNO3–Na2SO4–H2O solution droplets. Environ. Earth Sci. 2013, 69, 1609–1620. [Google Scholar] [CrossRef]
  39. Müller, M.; Kind, M.; Cairncross, R.; Schabel, W. Diffusion in multi-component polymeric systems: Diffusion of non-volatile species in thin films. Eur. Phys. J. Spec. Top. 2009, 166, 103–106. [Google Scholar] [CrossRef]
  40. Scharfer, P.; Schabel, W.; Kind, M. Mass transport measurements in membranes by means of in situ Raman spectroscopy—First results of methanol and water profiles in fuel cell membranes. J. Membr. Sci. 2007, 303, 37–42. [Google Scholar] [CrossRef]
  41. Caspari, W.A. CCCXXIV.—The system sodium carbonate–sodium sulphate–water. J. Chem. Soc. Trans. 1924, 125, 2381–2387. [Google Scholar] [CrossRef]
  42. Marion, G.M.; Mironenko, M.V.; Roberts, M.W. FREZCHEM: A geochemical model for cold aqueous solutions. Comput. Geosci. 2010, 36, 10–15. [Google Scholar] [CrossRef]
  43. Ludwig, I.; Schabel, W.; Kind, M.; Castaing, J.C.; Ferlin, P. Drying and film formation of industrial waterborne latices. AIChE J. 2007, 53, 549–560. [Google Scholar] [CrossRef]
  44. Nijdam, J.; Kachel, S.; Scharfer, P.; Schabel, W.; Kind, M. Effect of Diffusion on Component Segregation During Drying of Aqueous Solutions Containing Protein and Sugar. Dry. Technol. 2015, 33, 288–300. [Google Scholar] [CrossRef]
  45. Ben Mabrouk, K.; Kauffmann, T.H.; Aroui, H.; Fontana, M.D. Raman study of cation effect on sulfate vibration modes in solid state and in aqueous solutions. J. Raman Spectrosc. 2013, 44, 1603–1608. [Google Scholar] [CrossRef]
  46. Carey, D.M.; Korenowski, G.M. Measurement of the Raman spectrum of liquid water. J. Chem. Phys. 1998, 108, 2669–2675. [Google Scholar] [CrossRef]
  47. Rudolph, W.W.; Irmer, G.; Königsberger, E. Speciation studies in aqueous HCO 3 CO 3 2 solutions. A combined Raman spectroscopic and thermodynamic study. Dalton Trans. 2008, 900–908. [Google Scholar] [CrossRef]
  48. Rosenblatt, D.; Marks, S.B.; Pigford, R.L. Kinetics of phase transitions in the system sodium sulfate-water. Ind. Eng. Chem. Fundam. 1984, 23, 143–147. [Google Scholar] [CrossRef]
  49. Vavouraki, A.I.; Koutsoukos, P.G. Kinetics of crystal growth of mirabilite in aqueous supersaturated solutions. J. Cryst. Growth 2012, 338, 189–194. [Google Scholar] [CrossRef]
Figure 1. Schematic depiction of the mass fraction of component i crystallizing onto a substrate.
Crystals 12 01568 g001
Figure 2. Ternary phase diagram of the N a 2 S O 4 - N a 2 C O 3 - H 2 O system with solubility lines at 15, 20, and 25 °C. All solubility points from the literature were taken from Caspari [41]. The green squares were calculated with the frezchem database using PhreeqC [42].
Crystals 12 01568 g002
Figure 3. Experimental setup for dissolution and desupersaturation measurements comprising a crystallization environment and a Raman spectroscope. The inverse confocal Raman setup is adapted from Müller et al. [39], and can be reviewed in their publication.
Crystals 12 01568 g003
Figure 4. Raman spectrum of a ternary aqueous solution of N a 2 S O 4 and N a 2 C O 3 ( w N a 2 S O 4 = 0.090 and w N a 2 C O 3 = 0.120 ). Note: only water and both anions are Raman active.
Crystals 12 01568 g004
Figure 5. Diagram (a) displays the increase in C O 3 -loading of the solution for the dissolution of sodium carbonate decahydrate. Diagram (b) displays the increase in S O 4 -loading of the solution for the dissolution of sodium sulfate decahydrate. The given equations were used to calculate the solid lines.
Crystals 12 01568 g005
Figure 6. Diagram (a) displays the desupersaturation course of sodium carbonate decahydrate. In (b), the crystallization of sodium sulfate decahydrate is illustrated. The given equations were used to calculate the solid lines.
Crystals 12 01568 g006
Figure 7. Growth rates v of sodium sulfate decahydrate as a function of Δ c = ( c c * ) . Comparison of data from the present work (black squares) with data from the literature: Rosenblatt et al. [48] (gray circles) and Vavouraki and Koutsoukos [49] (black triangles).
Crystals 12 01568 g007
Figure 8. Desupersaturation courses from Figure 6 of the two binary material systems calculated with mean growth kinetics. Diagram (a) displays the course of sodium carbonate decahydrate, while (b) illustrates the crystallization of sodium sulfate decahydrate. The given equations were used to calculate the black solid lines. The black dashed lines represent the accuracy range, taken as the measurement uncertainty of a Raman measurement for sodium carbonate and sodium sulfate, respectively. Further diagrams of mean desupersaturation courses and calibration data are provided in the supporting information (compare Figures S11 and S18).
Crystals 12 01568 g008
Figure 9. Diagrams (a,b) display the course of sodium carbonate decahydrate dissolution. In (c,d), the dissolution course of sodium sulfate decahydrate is illustrated. The given equations were used to calculate the solid lines. Initial concentrations (green triangles), substrate material (black circles), solubility (black squares/lines), and measured concentrations (brown triangles) are provided in the triangle diagrams on the right.
Crystals 12 01568 g009
Figure 10. In Diagram (a), a desupersaturation course of a simultaneous crystallizing ternary material system is shown. In (c), the course of a phase separation process is presented. The given equations represent the average kinetics of all conducted experiments. Dashed lines represent the accuracy range, which was taken as the measurement uncertainty of a Raman measurement for both components. Further diagrams and calibration data are provided in the supporting information (compare Figures S19–S21). Diagrams (b,d) represent the starting (green triangles) and end points (brown triangles) of both processes.
Crystals 12 01568 g010
Figure 11. The substrate material (sodium sulfate decahydrate) desupersaturates at the beginning of the experiment. The foreign component increases in level and desupersaturates after reaching a maximum. The given equations were used to calculate the solid lines (a). In Diagram (b) the initial state (green triangle) and the final composition (brown triangle) are displayed in a ternary plot.
Crystals 12 01568 g011
Table 1. List of estimated binary kinetic coefficients k g , i and crystallization orders g of sodium sulfate decahydrate at different equilibrium temperatures.
From DissolutionFrom Desupersaturation
T /°C k d , i / m s 1 k g , i / mol 1 g m 3 · g 2 s 1 g /-
17 ( 8 ± 1 ) × 10 6 ( 9 ± 4 ) × 10 6 1.0
18.5 ( 3 ± 2 ) × 10 6 1.0
22 ( 14 ± 7 ) × 10 6 1.0
23.5 ( 9 ± 2 ) × 10 6 ( 10 ± 2 ) × 10 6 1.0
Table 2. List of binary kinetic coefficients k g , i and crystallization orders g of sodium carbonate decahydrate at different equilibrium temperatures.
From DissolutionFrom Desupersaturation
T /°C k d , i / m s 1 k g , i / mol 1 g m 3 · g 2 s 1 g /-
17 ( 9 ± 2 ) × 10 6 ( 1 ± 1 ) × 10 6 1.4 ± 0.3
18.5 ( 5 ± 3 ) × 10 6 1.2 ± 0.3
22 ( 13 ± 8 ) × 10 6 1.0 ± 0.1
23.5 ( 10 ± 2 ) × 10 6 ( 5 ± 2 ) × 10 6 1.0 ± 0.1
Table 3. List of ternary kinetic coefficients k g , i and crystallization orders g averaged over the temperature range of 17–23.5 °C on a sodium carbonate decahydrate substrate. The kinetics for both concurrent crystallization (Figure 10a) and material separation (Figure 10c) are shown. Mass transfer coefficients k d , i were estimated from dissolution measurements.
From DissolutionFrom Desupersaturation
k d , i / m s 1 k g , i / mol 1 g m 3 · g 2 s 1 g /-
substrate component N a 2 C O 3 · 10 H 2 O for σ N a 2 C O 3 < 0.3
concurrent ( 10 ± 4 ) × 10 6 3 × 10 6 1
separation 6 × 10 7 1
foreign component N a 2 S O 4 · 10 H 2 O for σ N a 2 S O 4 < 0.3
concurrent ( 6 ± 2 ) × 10 6 1 × 10 7 2
Publisher’s Note: MDPI stays neutral with regard to jurisdictional claims in published maps and institutional affiliations.

