
A New Correction Theory and Verification on the Reducing Rate Distribution for Seamless Tube Stretch-Reducing Process
Abstract
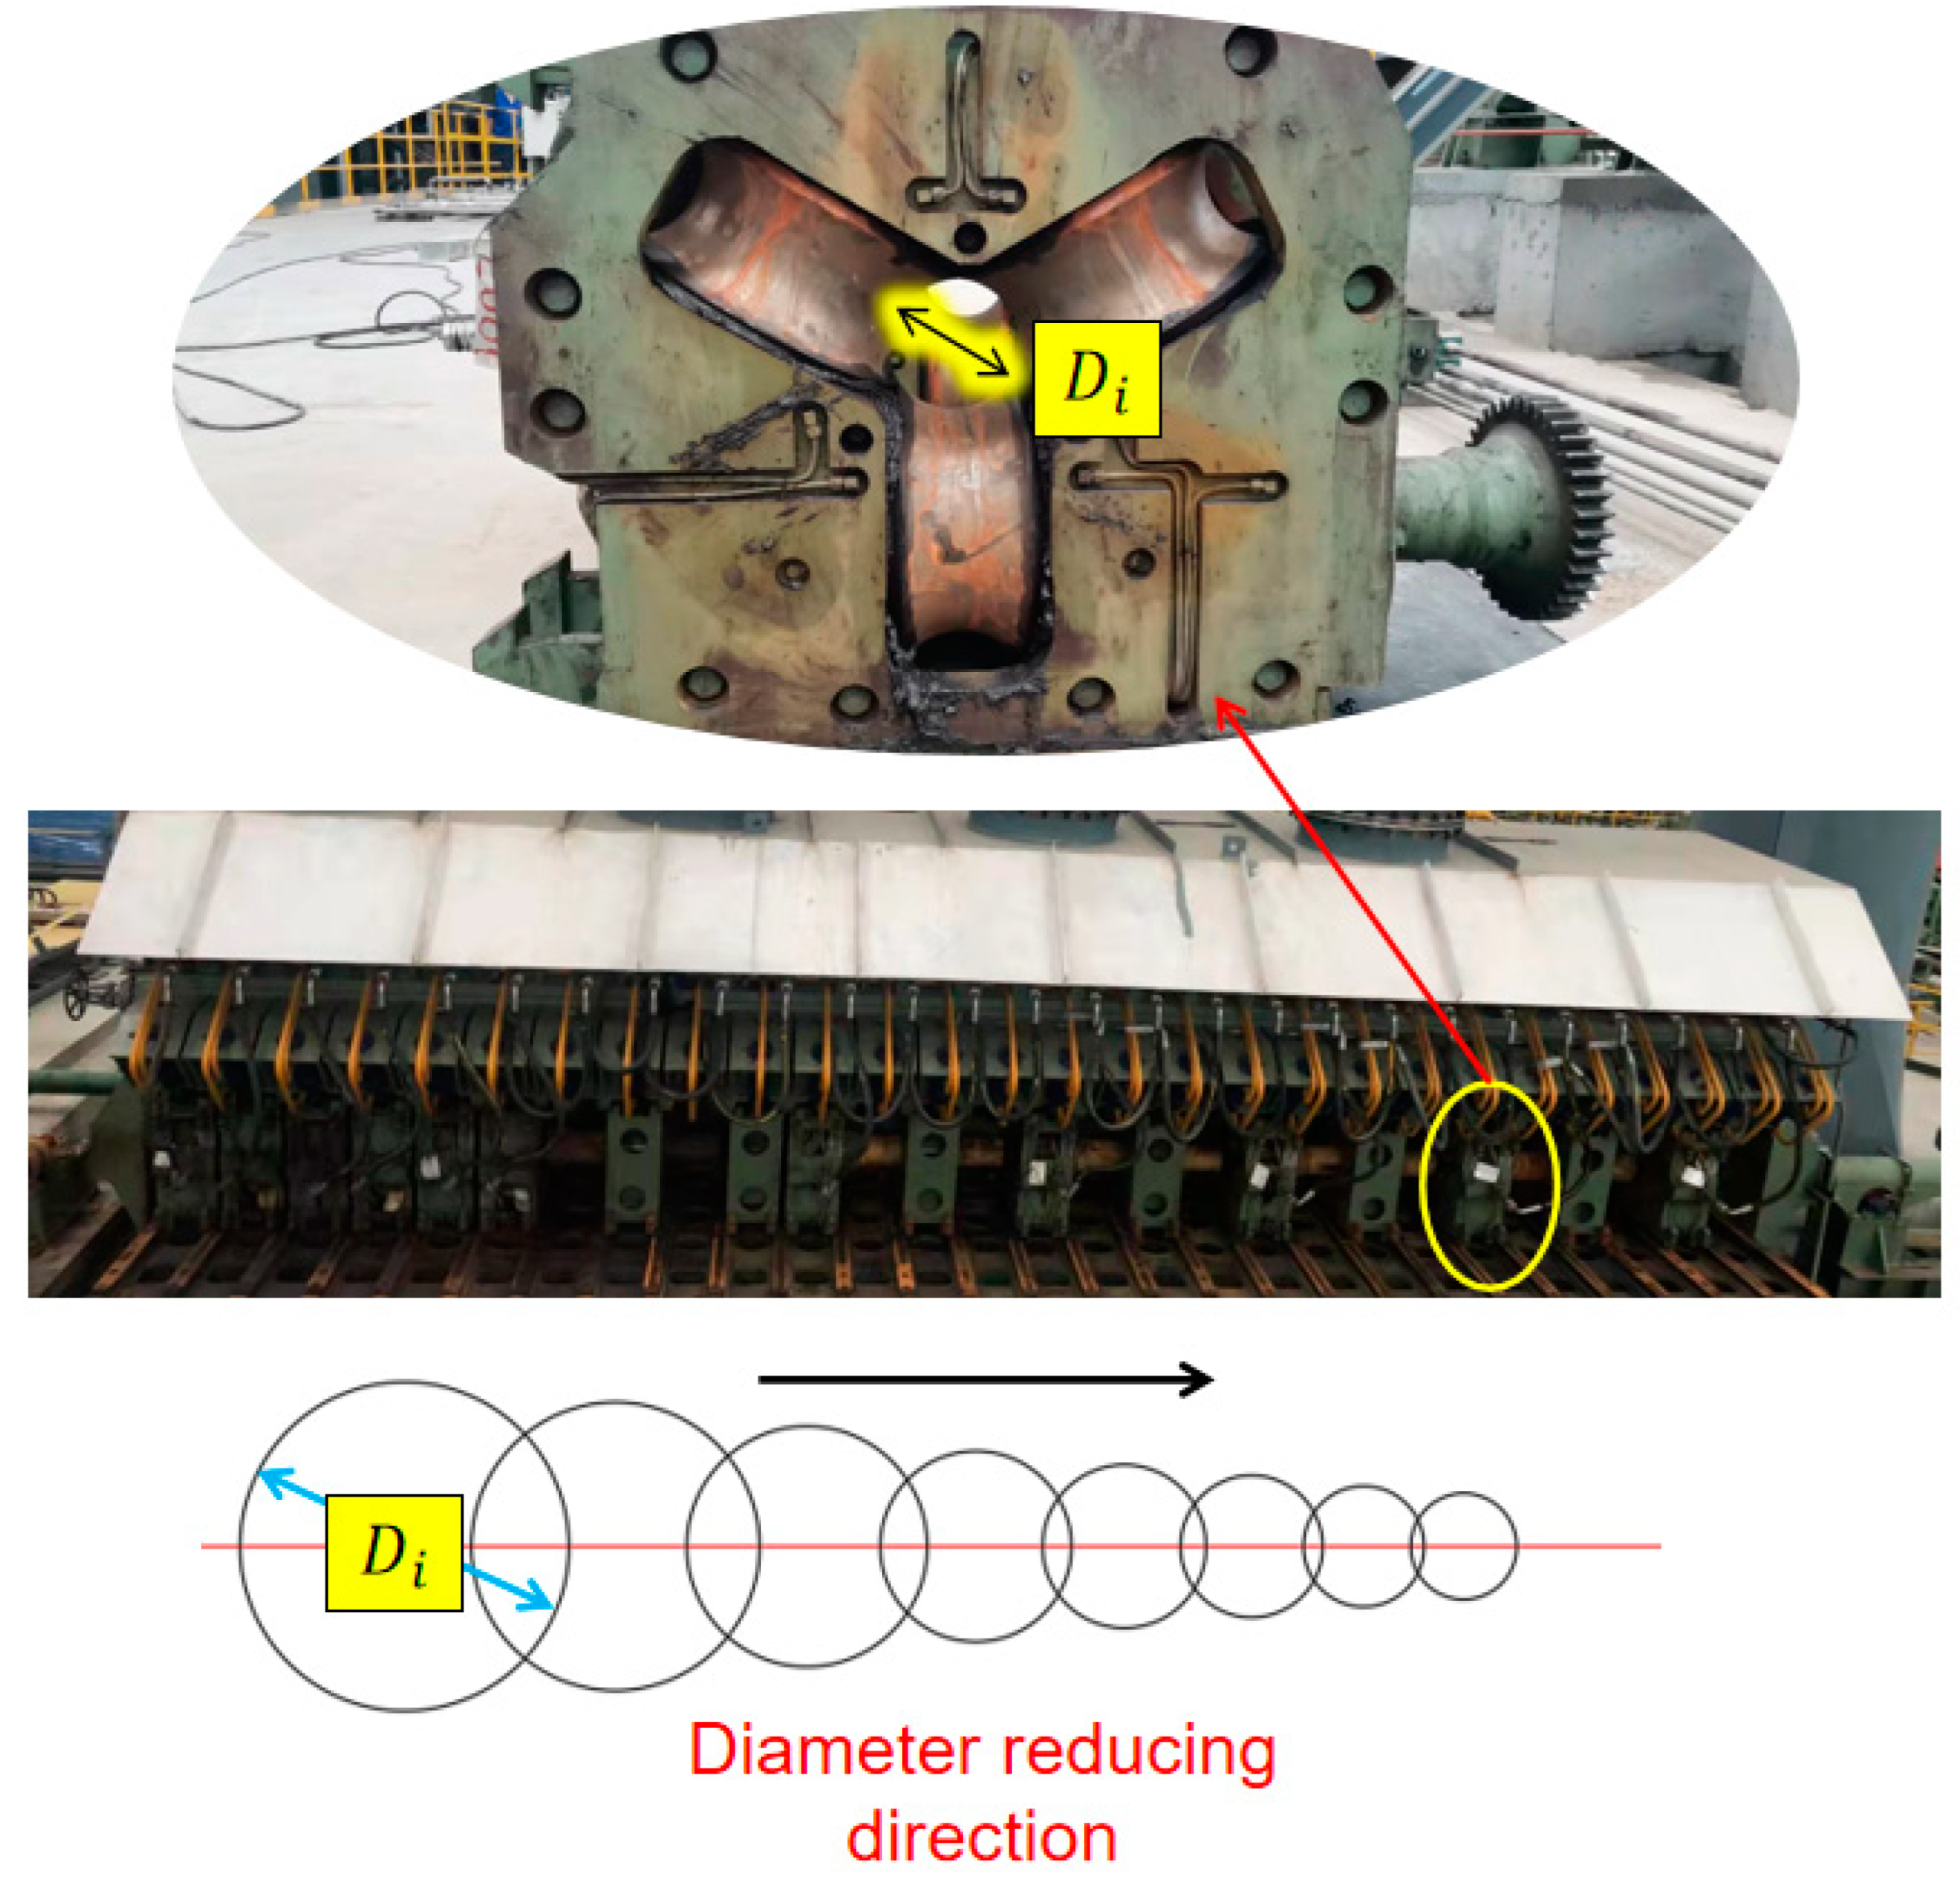
:1. Introduction
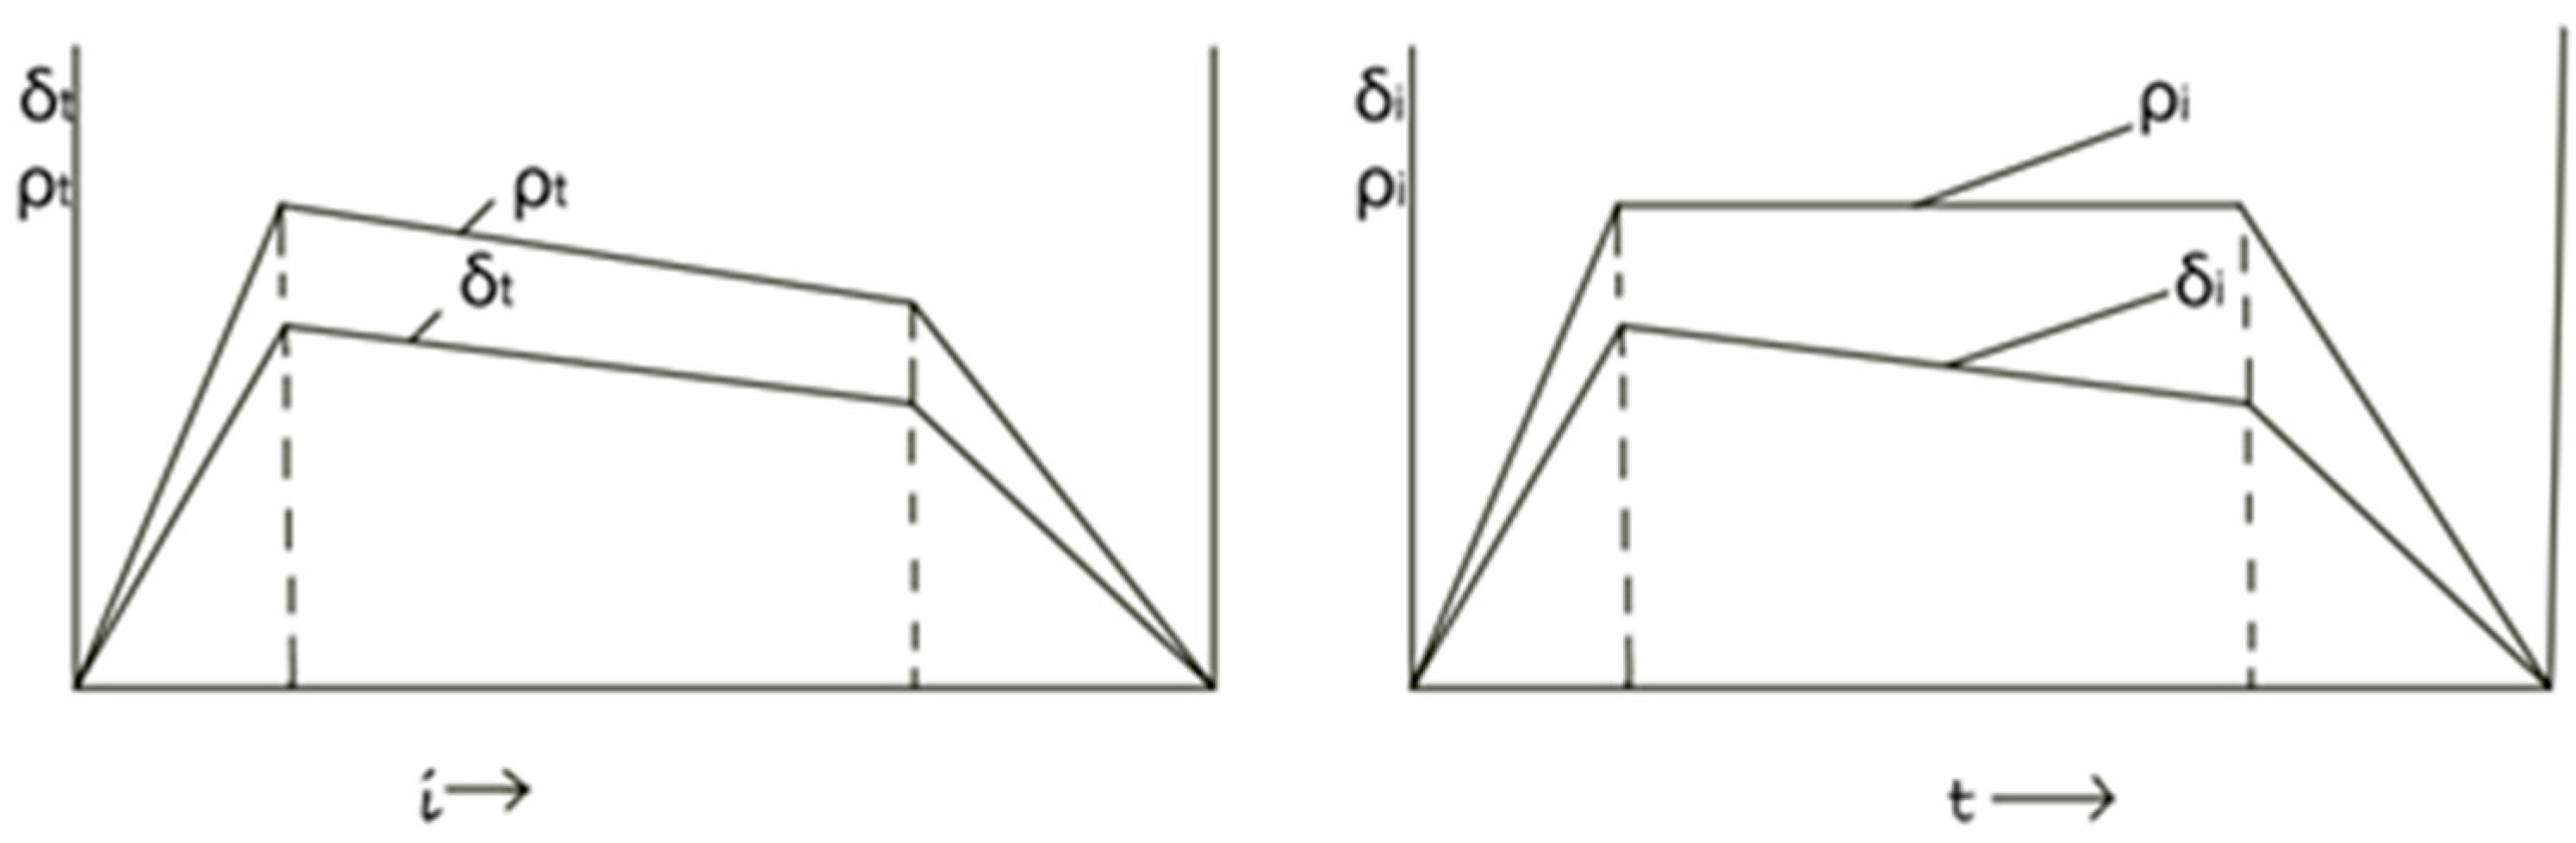
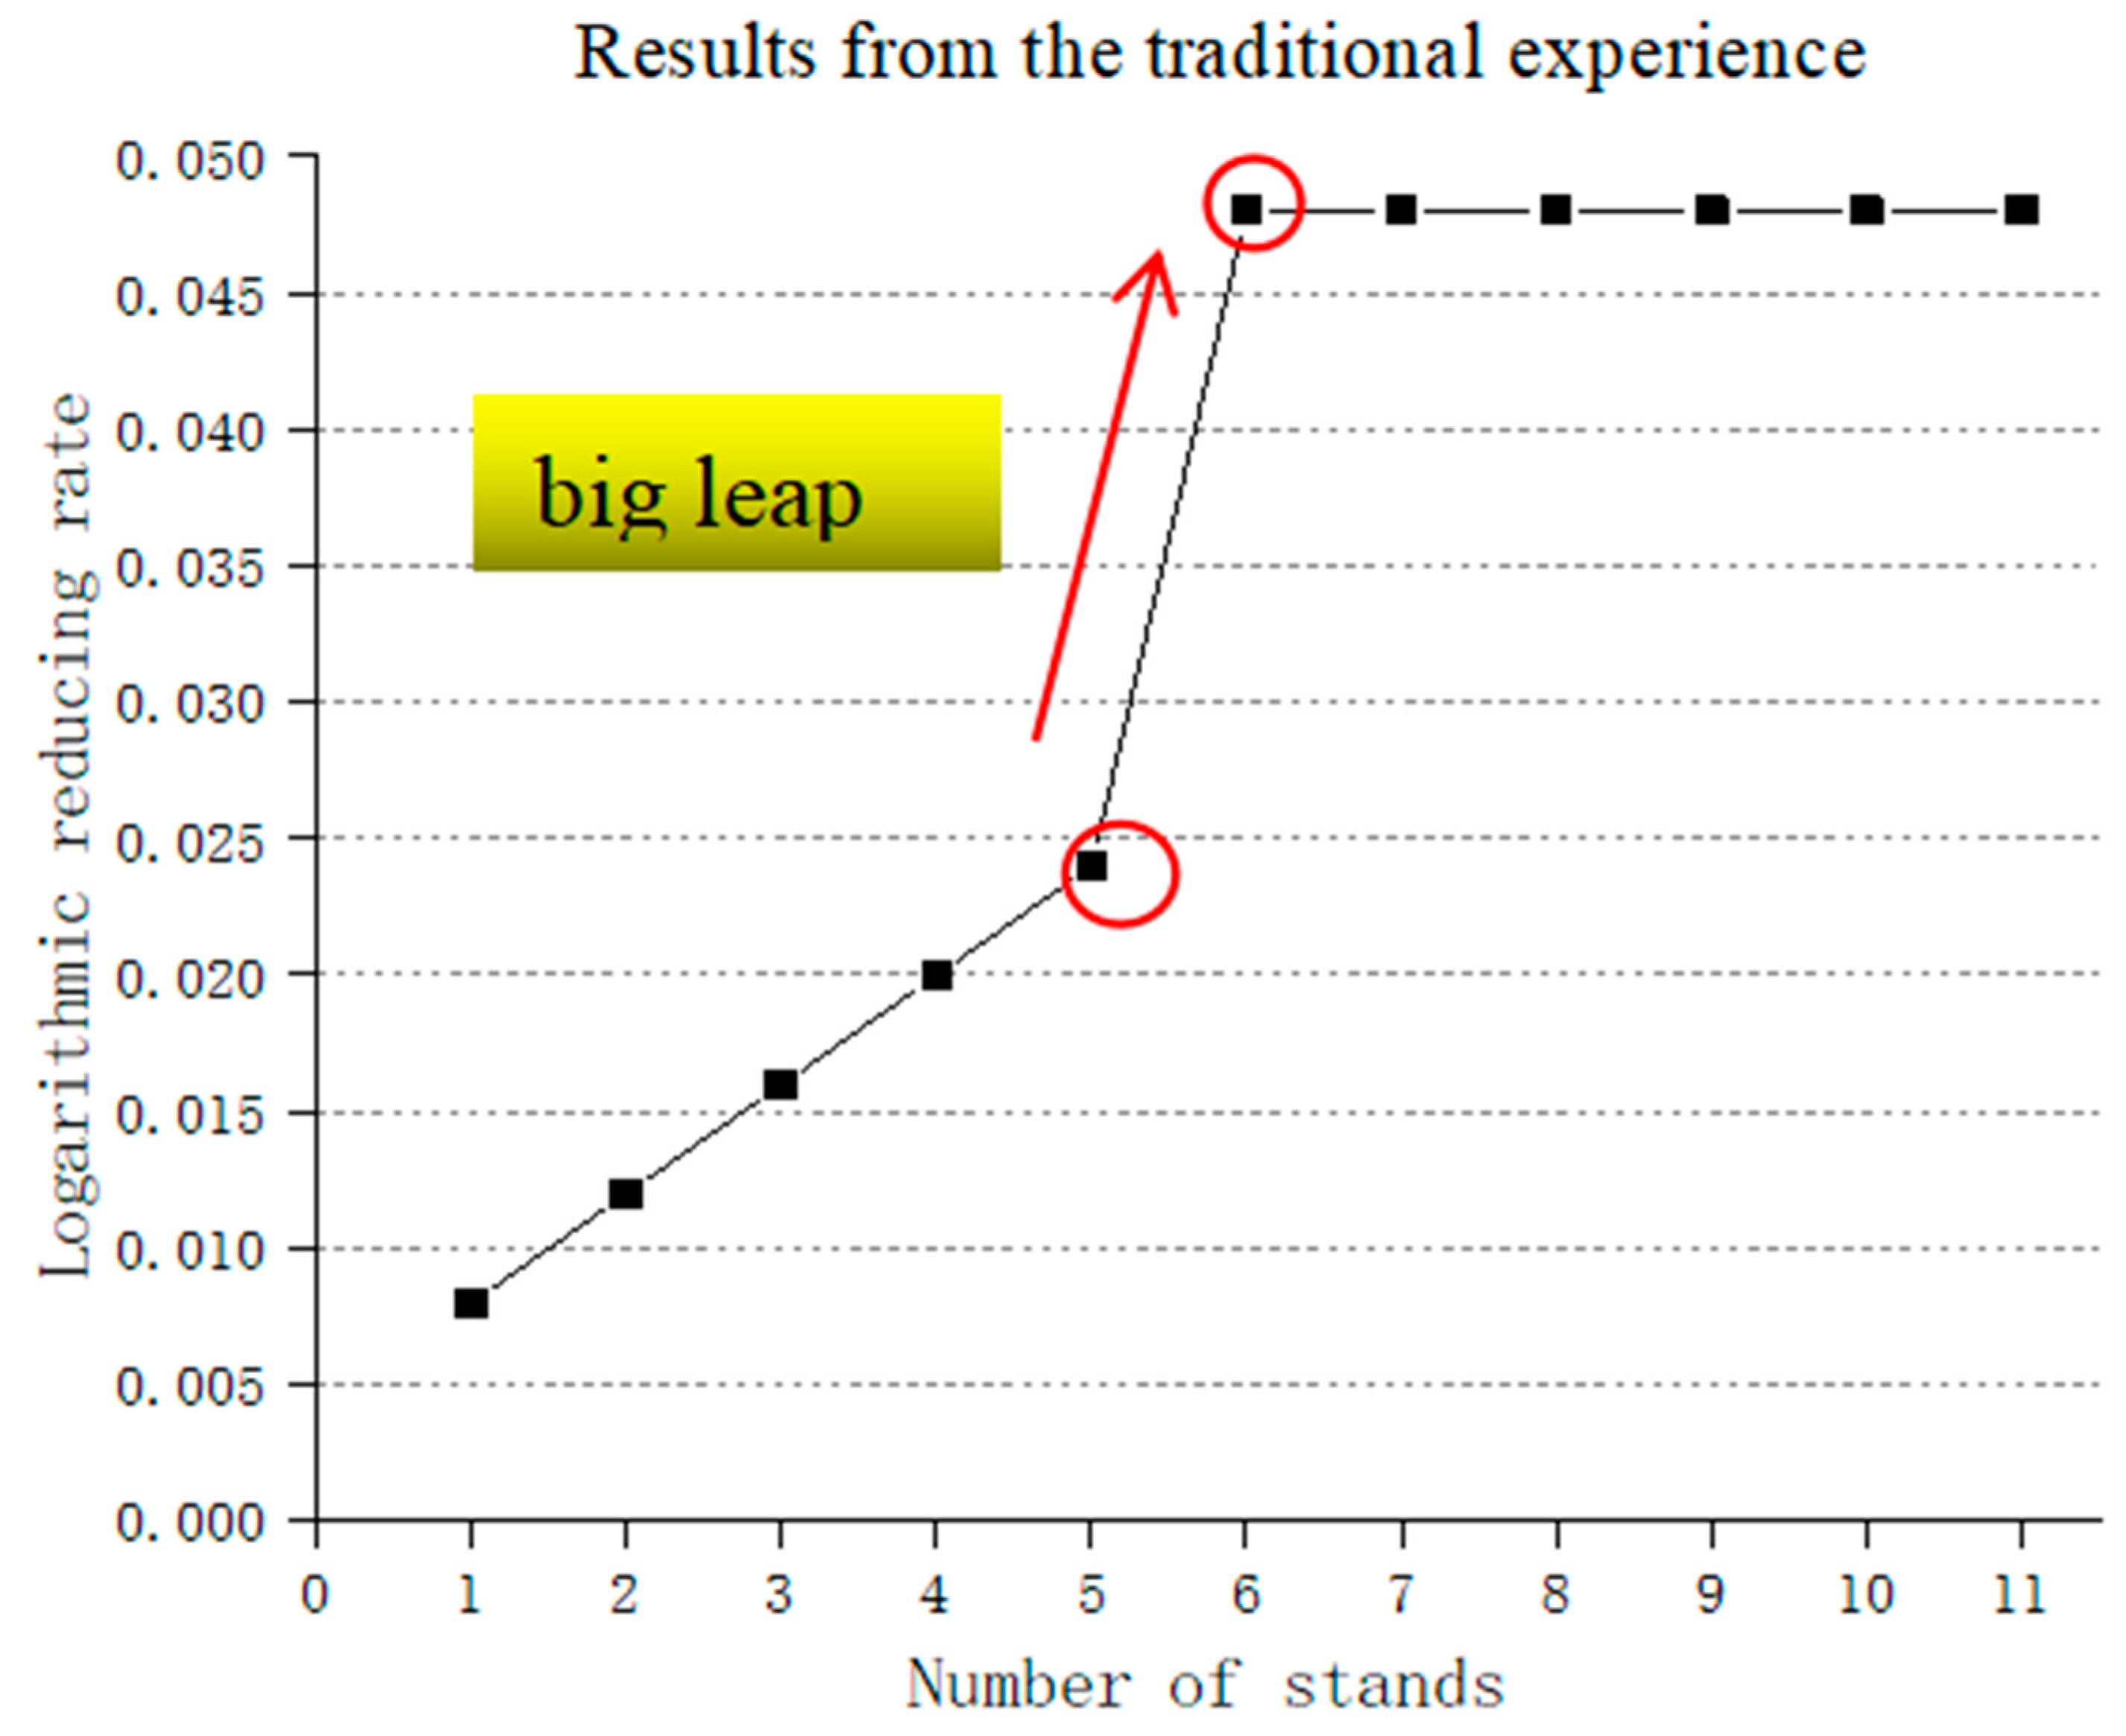
2. Conventional Reducing Rate Distribution Theory
3. “Three-Point and Two-Section Converged” Correction Approach
3.1. Basic Method
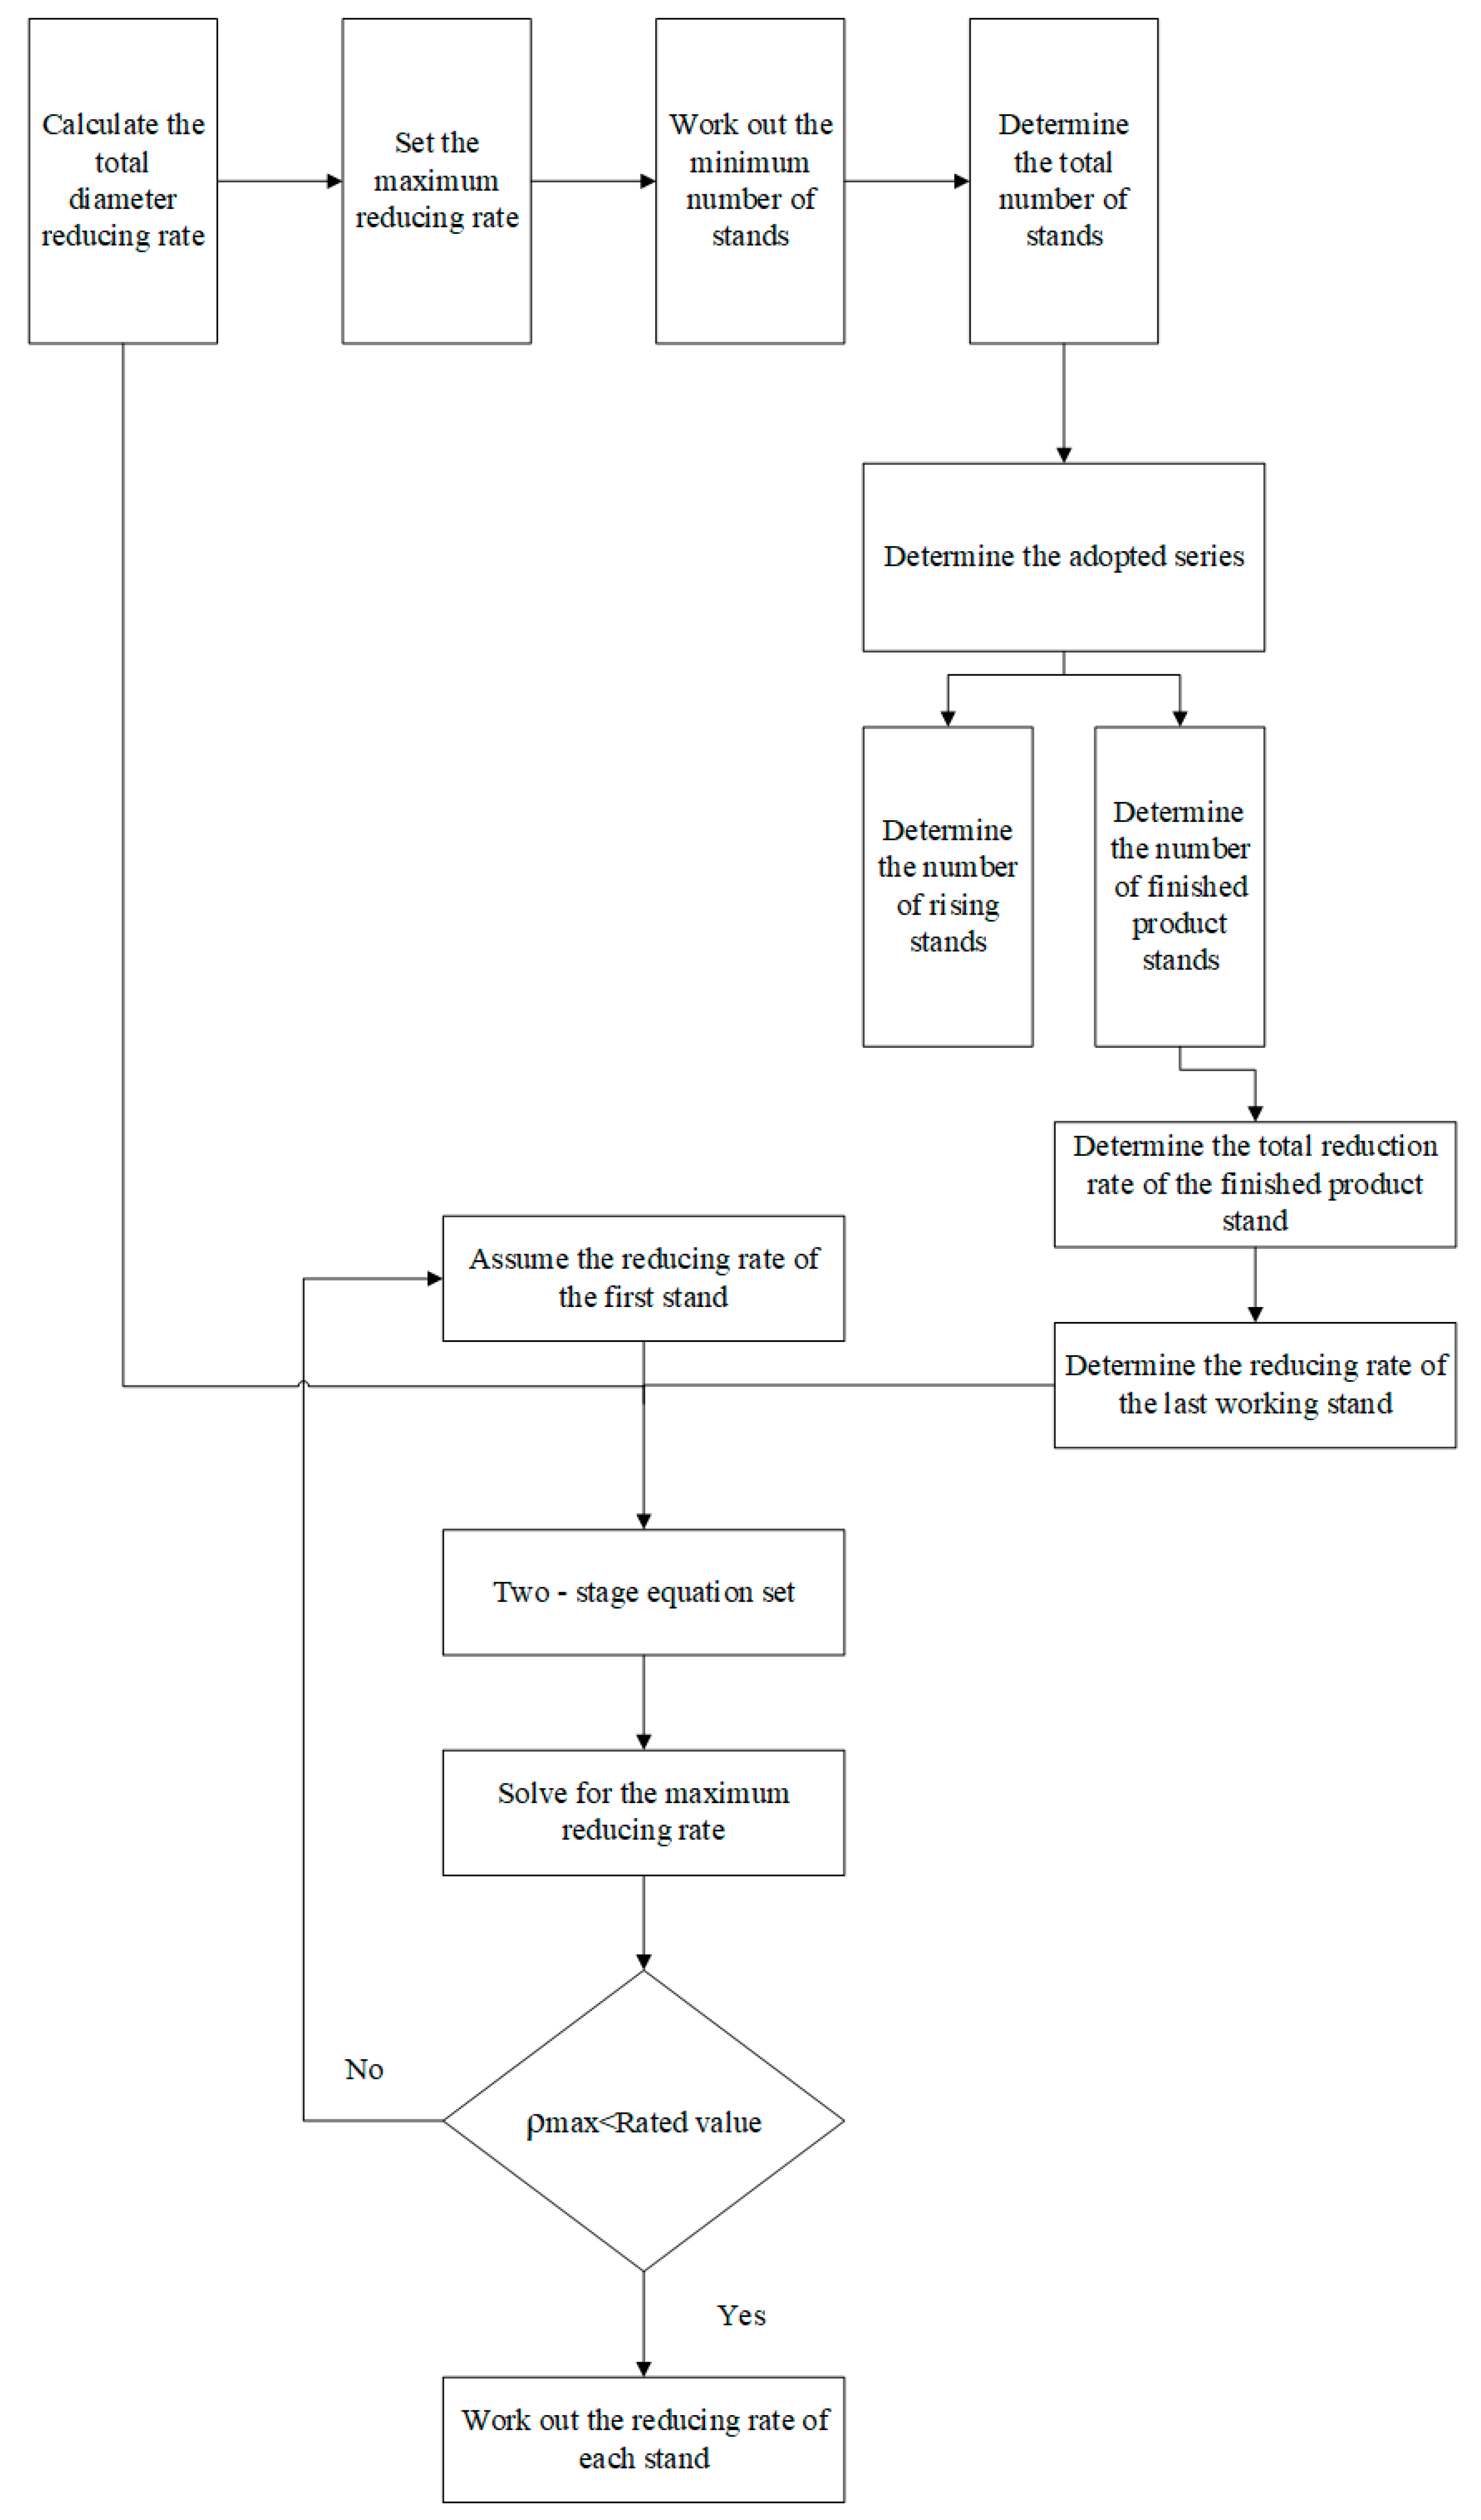
3.2. Solution Based on the Three-Point and Two-Section Converged Approach
3.3. Example Calculation
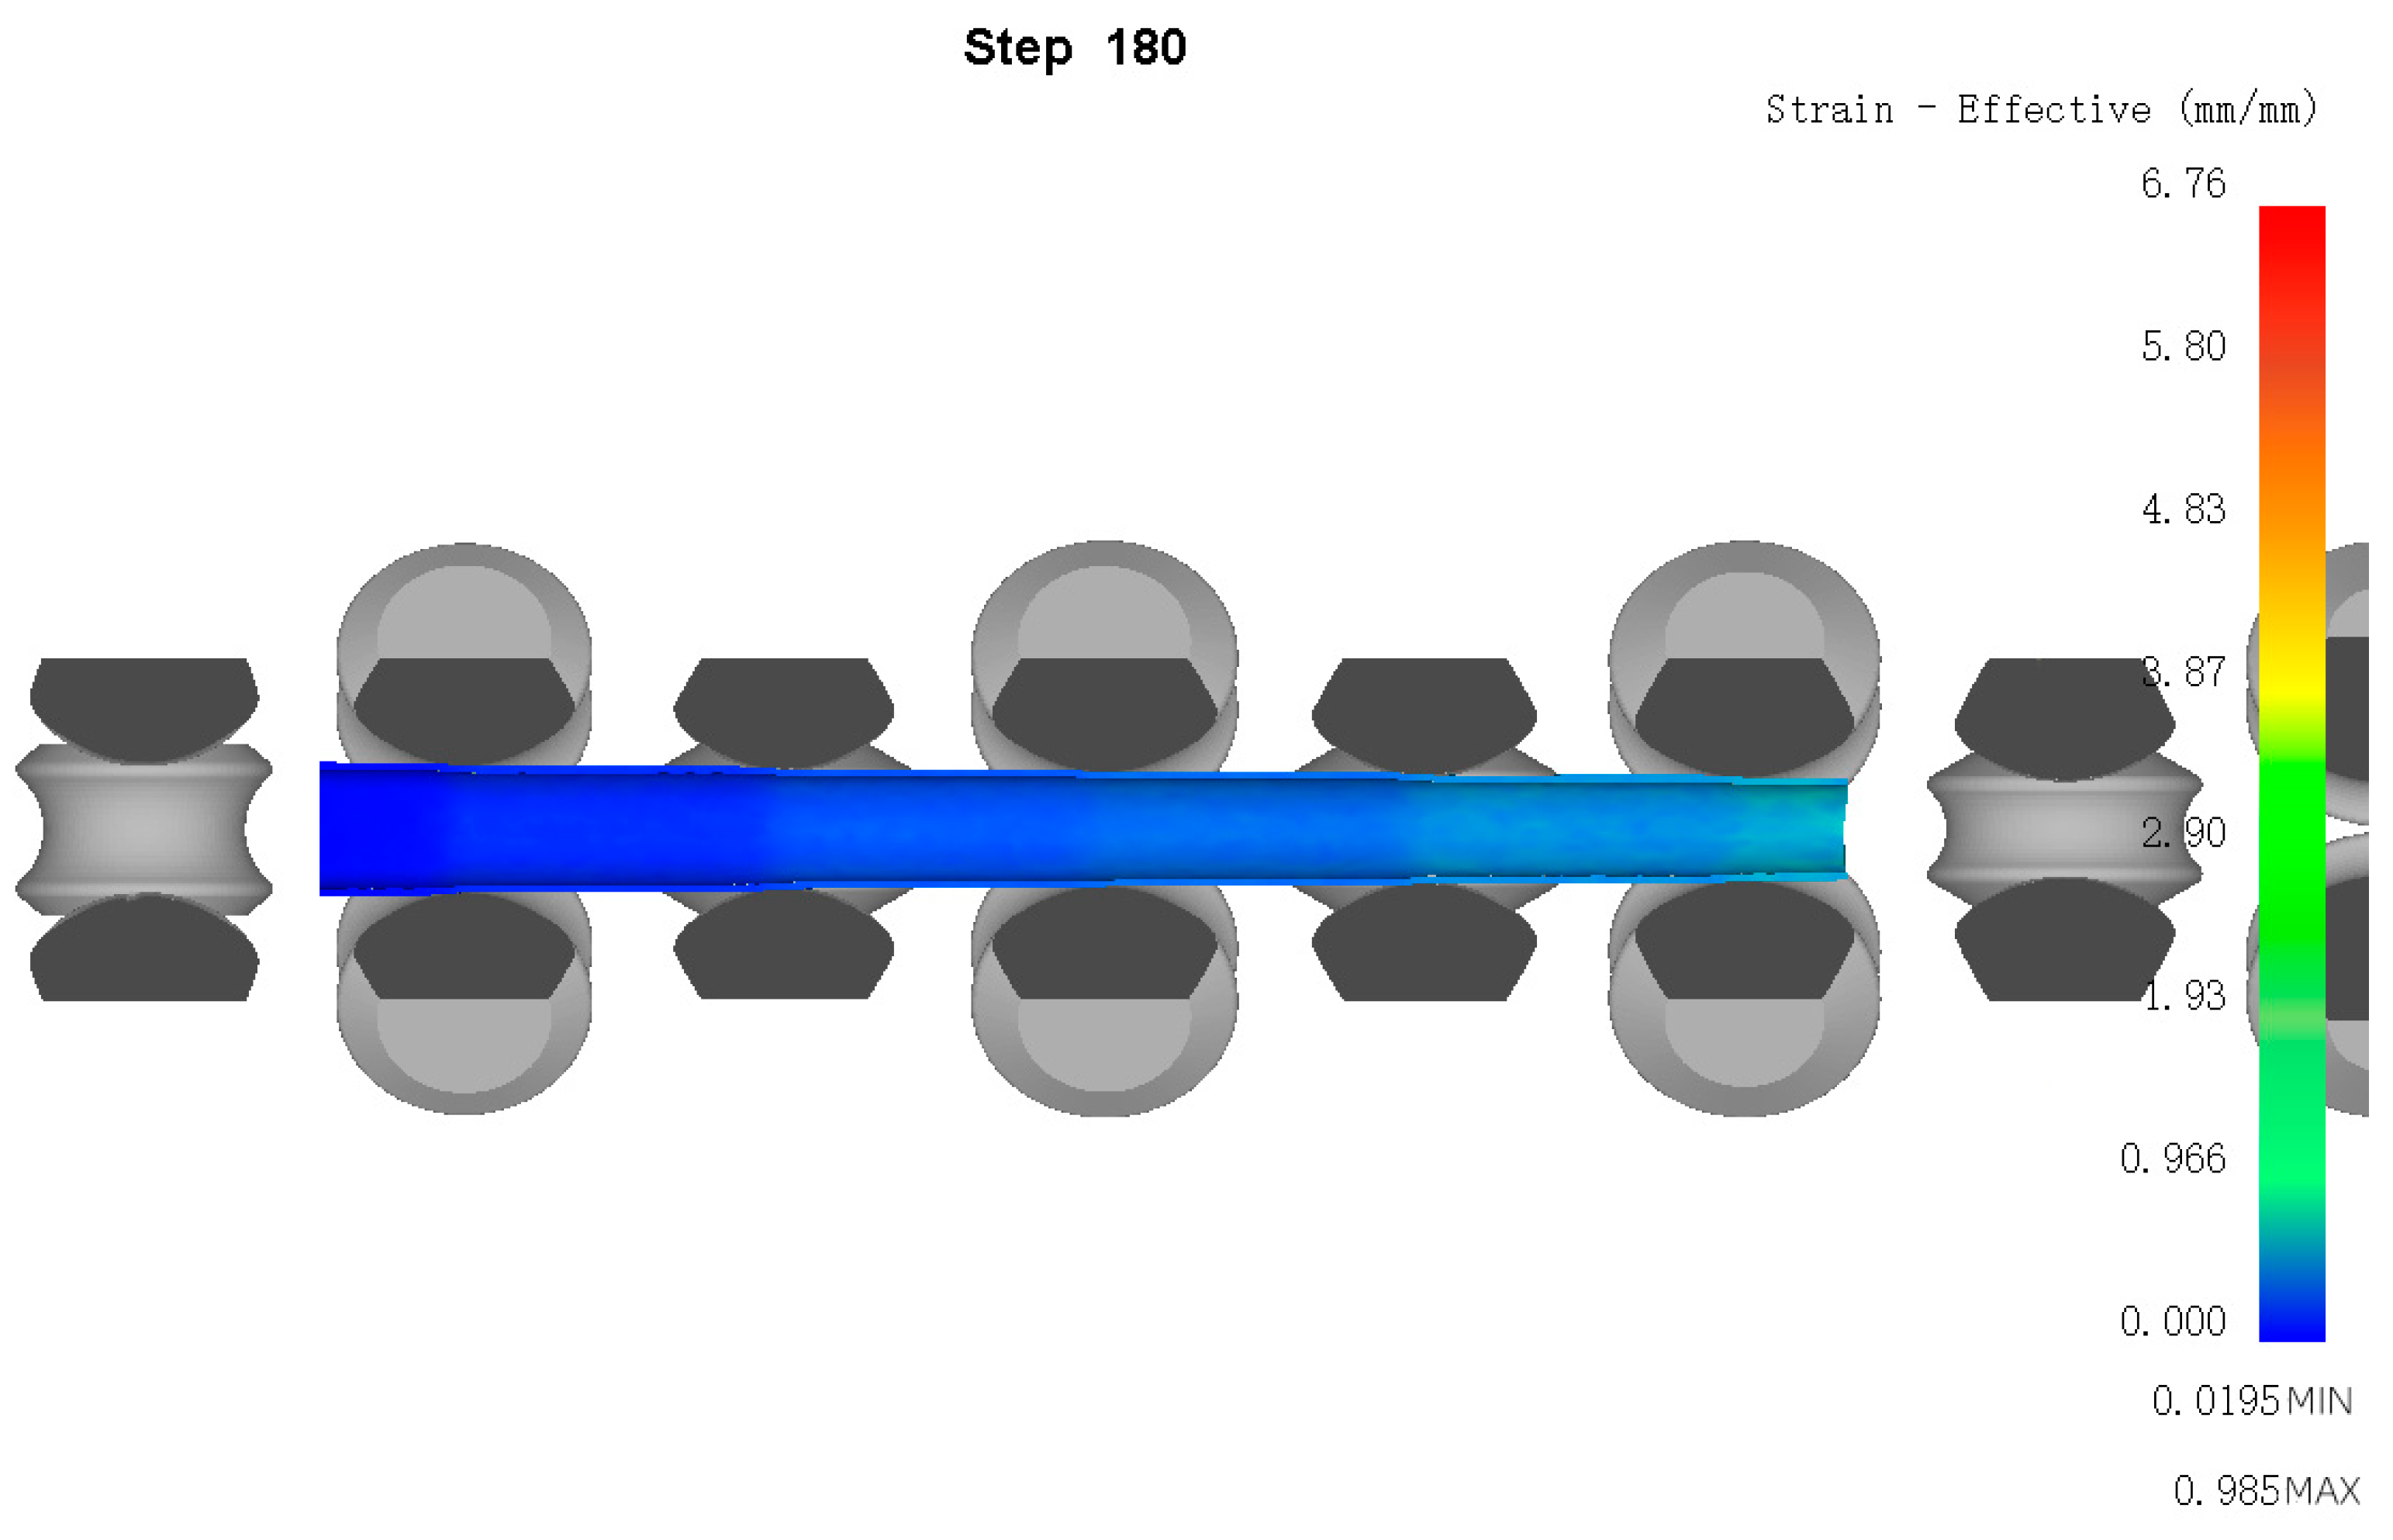
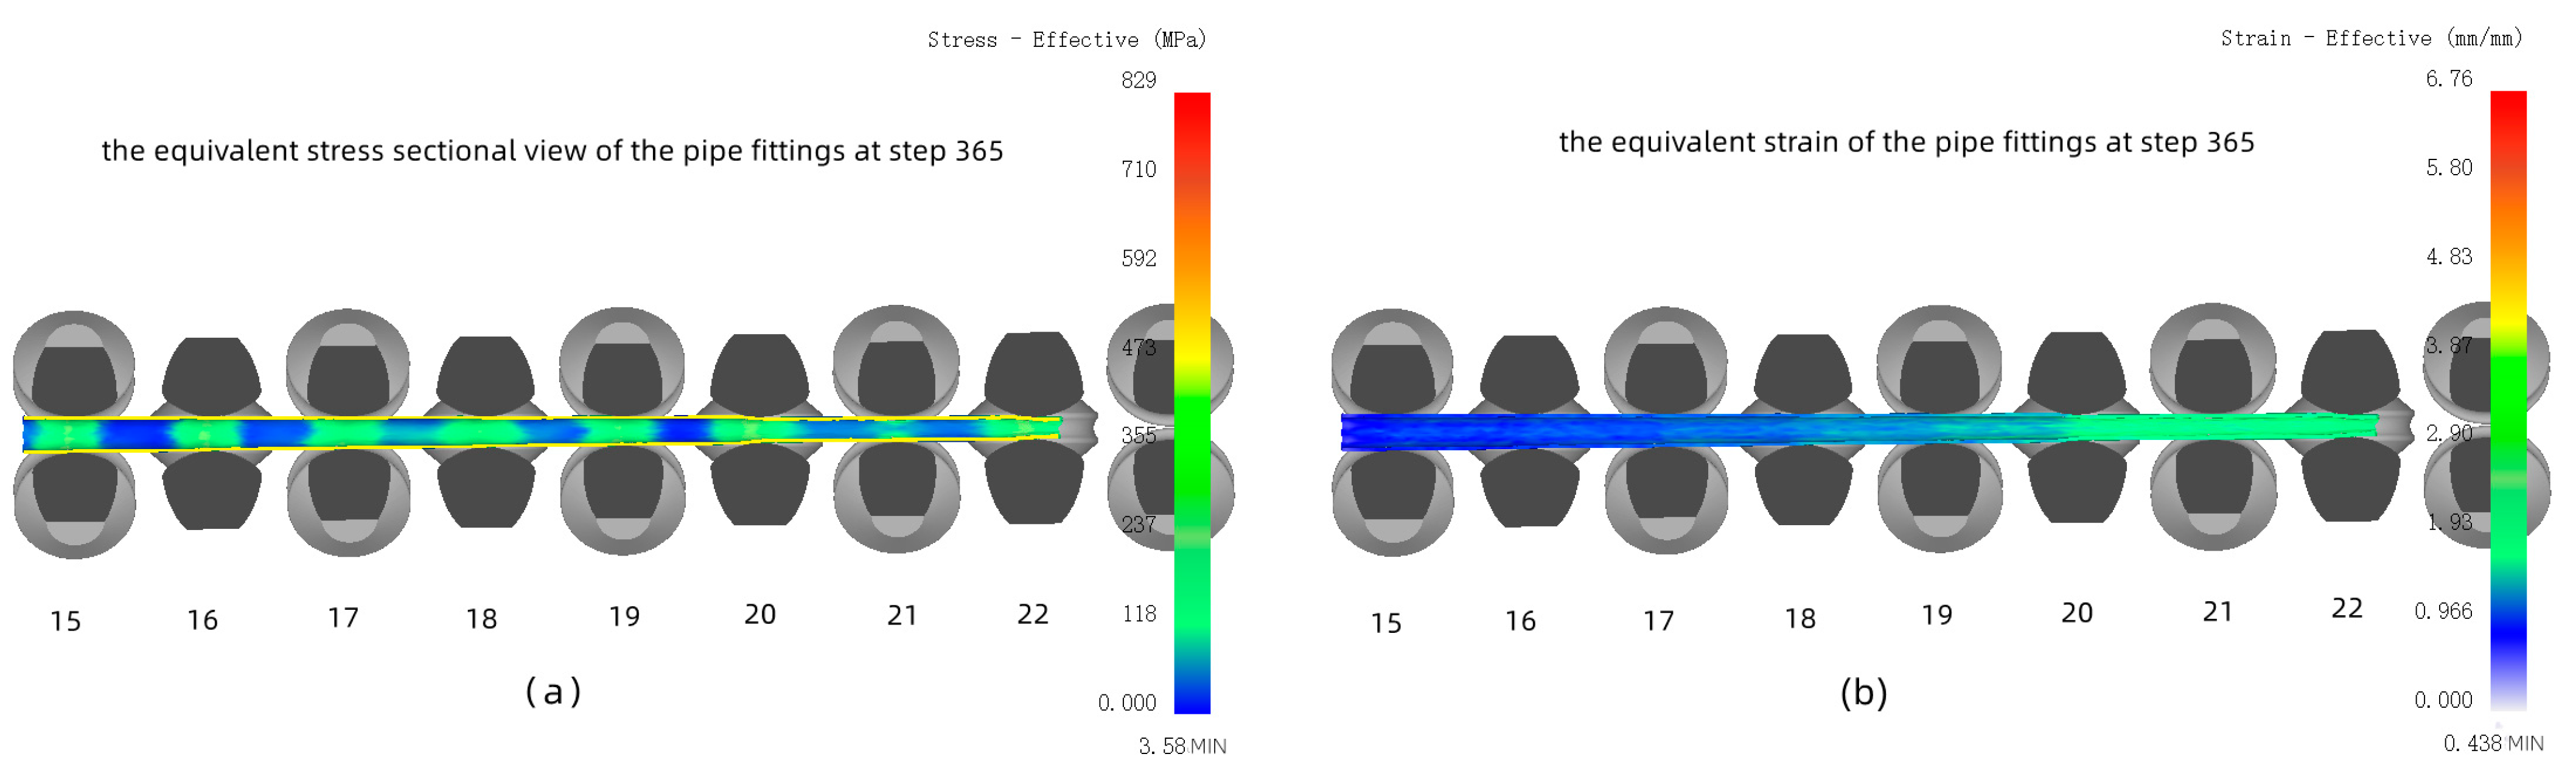
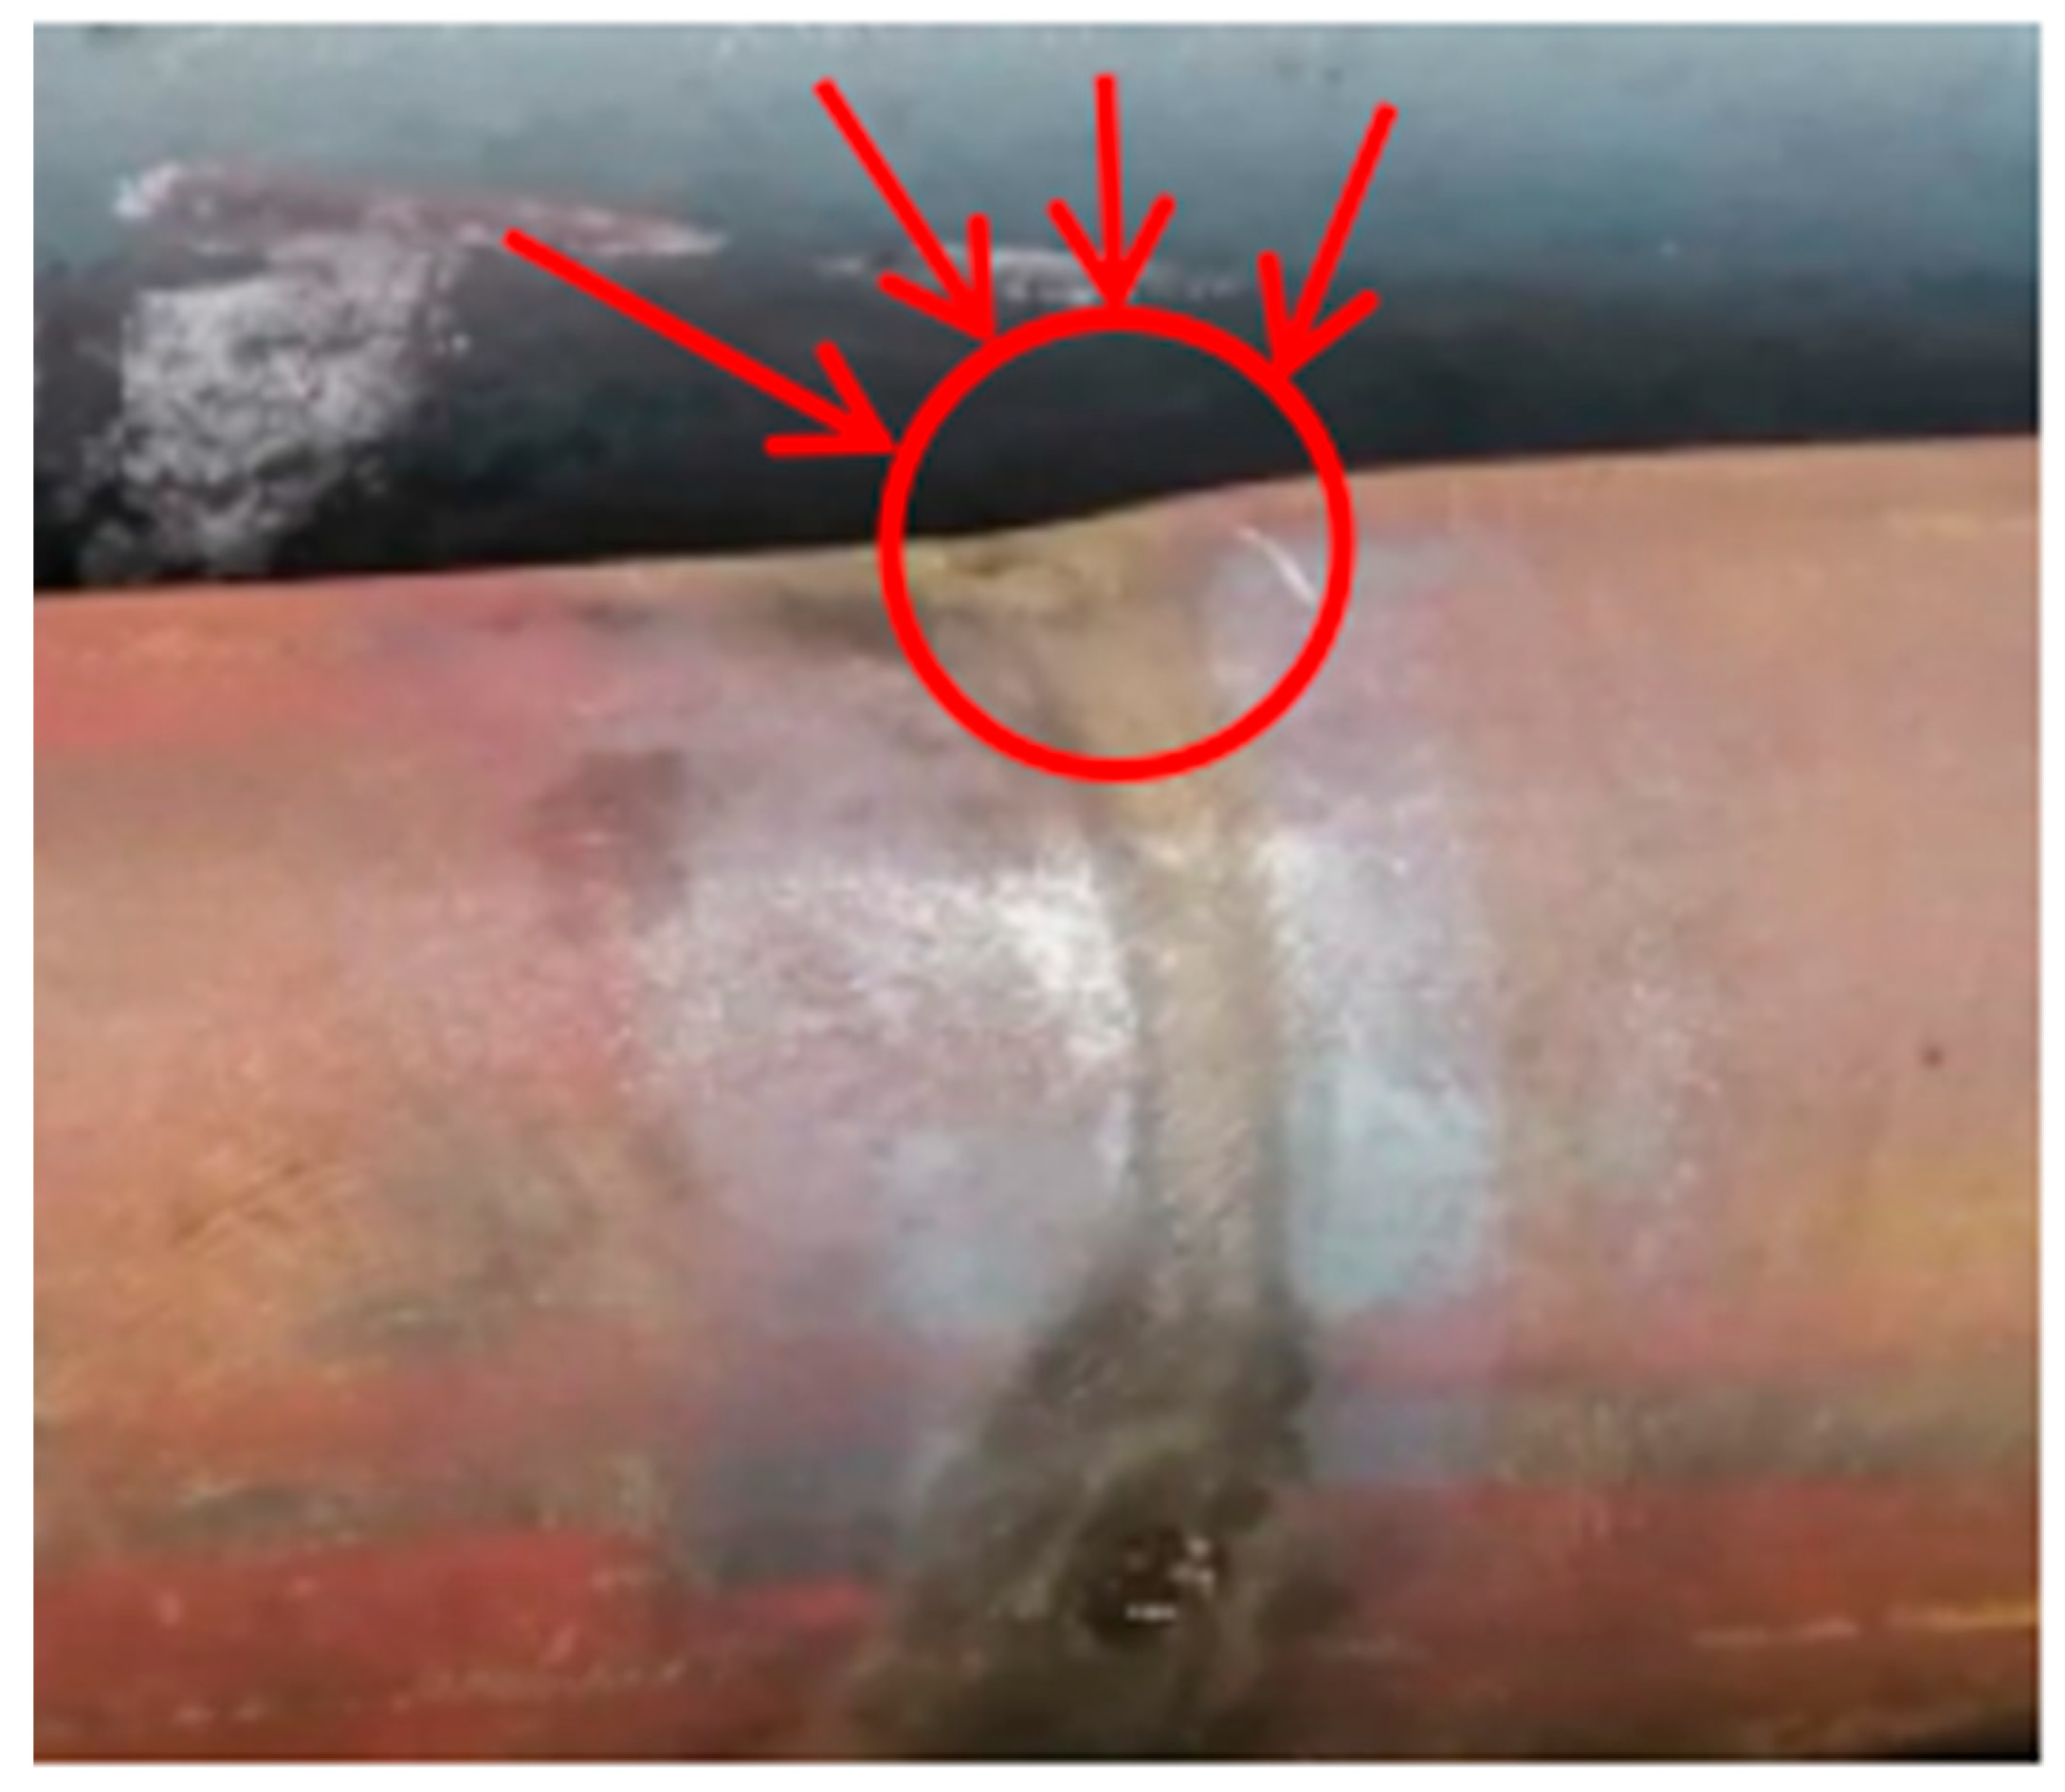
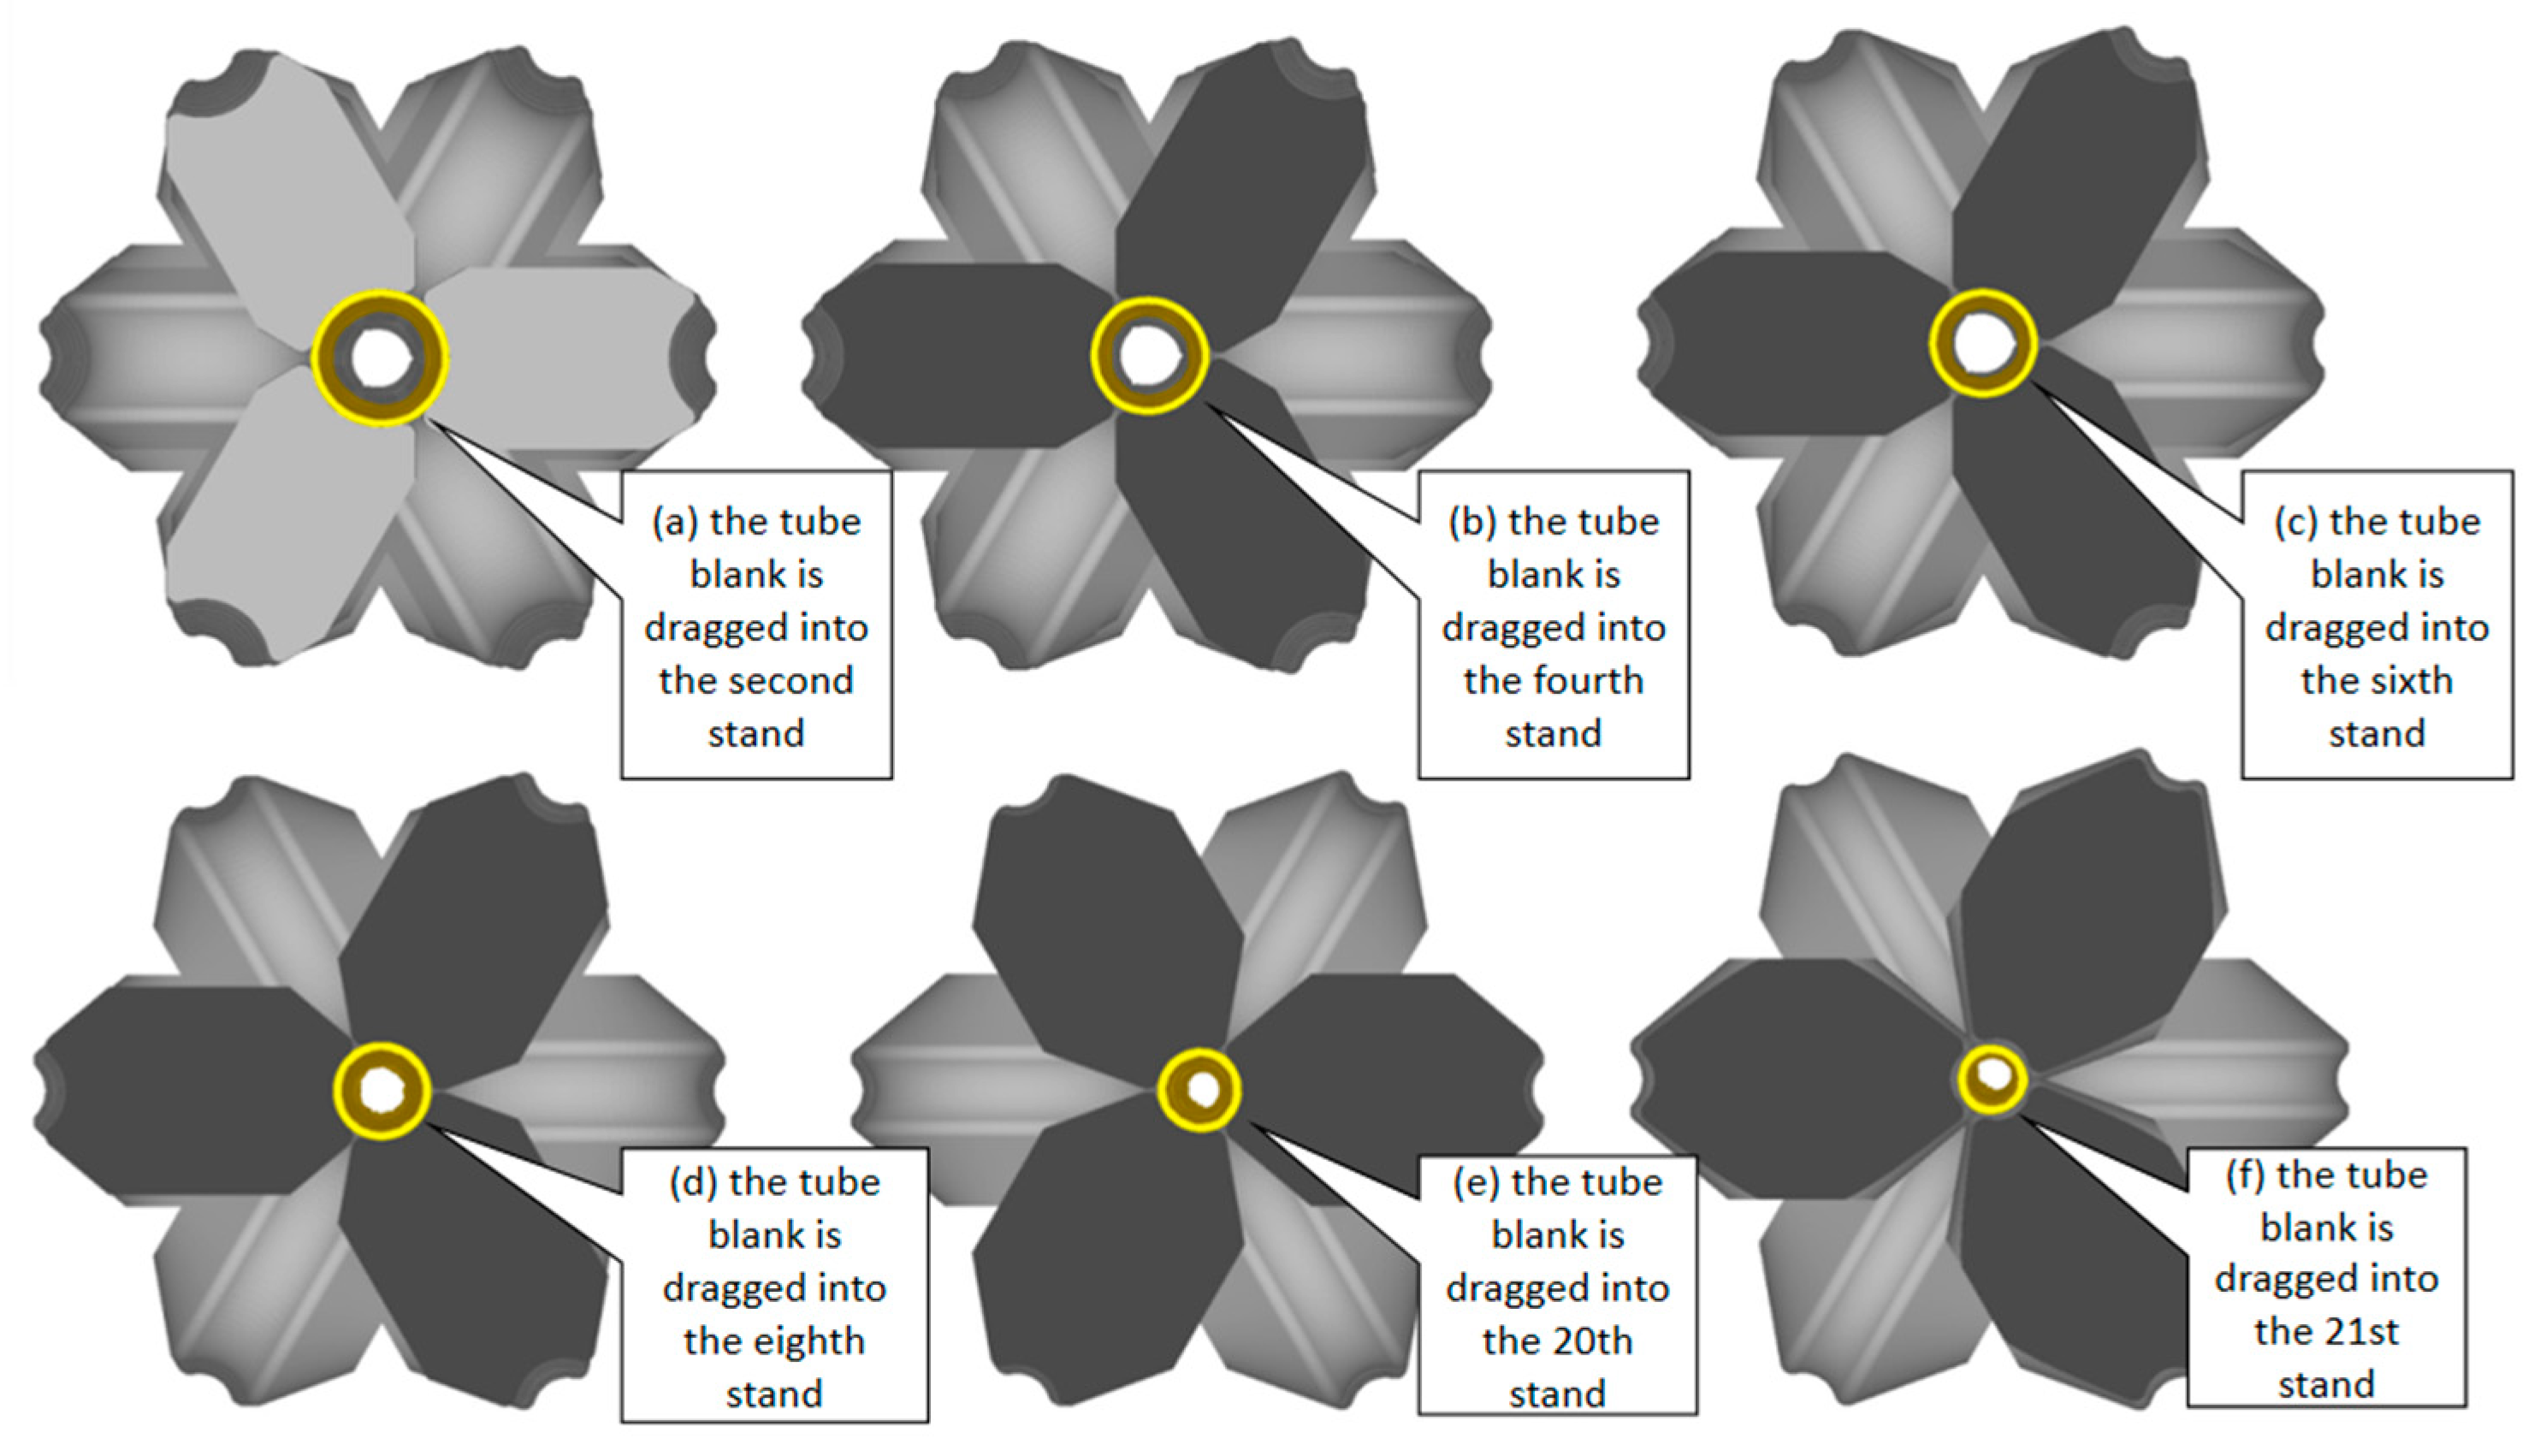
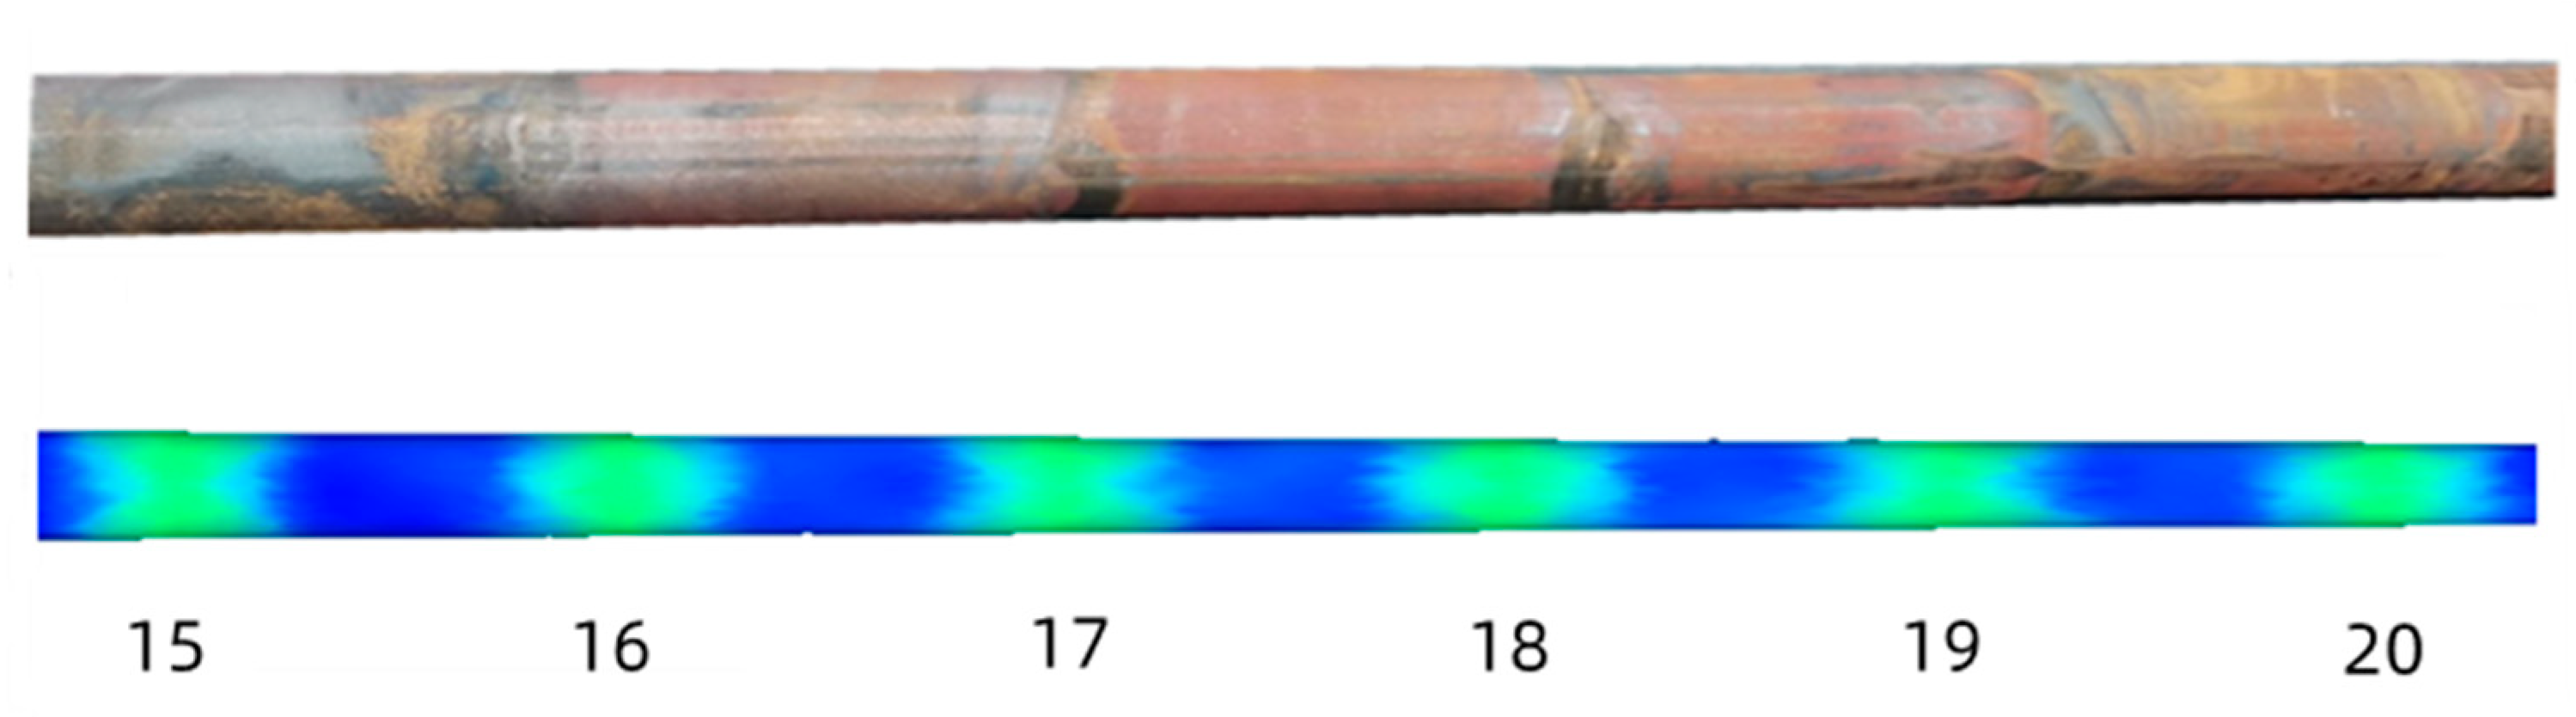
4. Verification of the Finite Element Simulation and Experiment
5. Conclusions
Author Contributions
Funding
Informed Consent Statement
Data Availability Statement
Conflicts of Interest
References
- Li, Q.; Gao, X.H. Steel Production; Metallurgical Industry Press: Beijing, China, 2016; pp. 99–102. [Google Scholar]
- Wang, T.P.; Qi, K.M. Plastic Working of Metals-Rolling Theory and Technology; Metallurgical Industry Press: Beijing, China, 2013; pp. 386–390. [Google Scholar]
- Sun, B.Y.; Zhang, F.P. Stretch Reducing Technology; National Defense Industry Press: Beijing, China, 2012; pp. 30–38. [Google Scholar]
- Huo, X.D.; Zhao, C.J.; Bai, L.; Xiong, J.; Zhou, Y. Study on the effect of tension coefficient on wall thickness parameters of steel tension reduction tubes. Hot Work. Technol. 2016, 11, 120–124. [Google Scholar]
- Li, J.S.; Lv, Q.G. Theoretical calculation and analysis of tension coefficient of seamless steel pipe tension reduction. Steel Pipe 2015, 44, 40–43. [Google Scholar]
- Chen, J.L.; Bai, L.; Wang, J. Study on the effect of single frame reduction rate on circumferential wall thickness of seamless steel pipe. Steel Pipe 2015, 44, 33–37. [Google Scholar]
- Li, G.Z. Modern Steel Pipe Rolling and Tool Design Principle; Metallurgical Industry Press: Beijing, China, 2006; pp. 279–286. [Google Scholar]
- Sun, C.L. Using power function to establish the general equation of reduction rate distribution of tension reduction machine working unit. Bao-Steel Technol. 1999, 04, 54–60. [Google Scholar]
- Ding, W.; Sun, Q.; Liang, H.Q.; Ding, H.J.; Zhao, J.; Wan, B.B. Hole design of tension reduction machine with power function reduction rate. Steel Pipe 2013, 42, 28–32. [Google Scholar]
- Shen, L.F.; Zhang, F.P.; Wang, Q.; Zhu, W.S.; Wang, J.J.; Liu, G.L. Determination of diameter and wall thickness in steel pipe tension reduction process. Mech. Eng. Autom. 2017, 1, 17–19. [Google Scholar]
- Zhang, F.P.; Sun, B.Y.; Du, X.Z. Research on the design method of tension reduction machine roll hole pattern. Mod. Manuf. Eng. 2006, 10, 110–113. [Google Scholar]
- Zhang, F.P.; Sun, B.Y.; Wang, J.M. Research on Energy Method in the Stretch-Reducing Process of Steel Tube; National Defense Industry Press: Beijing, China, 2008; pp. 39–43. [Google Scholar]
- Wang, N. Oval pass design of a stretch reducing mill. Steel Pipe 1990, 19, 26–30. [Google Scholar]
- Sun, B.Y.; Yuan, S.J. Computer simulation system of stretch reducing mill. Heavy Mach. 2000, 20, 457–462. [Google Scholar] [CrossRef]
- Sun, B.Y.; Zhang, F.P.; Xue, Z.M.; Li, G.Z.; Du, X.Z. Tension reduction machine hole design system. J. Taiyuan Heavy Mach. Coll. 2002, 23, 245–250. [Google Scholar]
- Xu, Z.Q.; Du, F.S.; Wang, M.T. The simulation study of the linear mark generating process in the stretch reducing. J. Mater. Processing Technol. 2007, 187, 373–377. [Google Scholar] [CrossRef]
- Li, J.H.; Yu, H. Numerical simulation of seamless tube’s stretch reducing process. Mater. Sci. Forum 2012, 704, 155–159. [Google Scholar] [CrossRef]
- Ma, J.J.; Lv, L.H.; Yuan, Q. Simulation and analysis of metal deformation behavior during three-roll micro-tensioning reduction. J. Wuhan Univ. Sci. Technol. 2006, 29, 237–242. [Google Scholar]


| NUMBER OF STANDS | 1 | 2 | 3 | 4 | 5 | 6 | 7 | 8 | 9 | 10 |
| LOGARITHMIC REDUCTION RATE | 0.02 | 0.0287 | 0.0375 | 0.0462 | 0.0549 | 0.0636 | 0.062 | 0.0603 | 0.0586 | 0.0569 |
| AVERAGE DIAMETER (MM) | 115.7 | 112.4 | 108.3 | 103.4 | 97.85 | 91.82 | 86.3 | 81.3 | 76.63 | 72.39 |
| REDUCTION (MM) | 2.337 | 3.275 | 4.132 | 4.886 | 5.523 | 6.033 | 5.515 | 5.05 | 4.623 | 4.238 |
| NUMBER OF STANDS | 11 | 12 | 13 | 14 | 15 | 16 | 17 | 18 | 19 | 20 |
| LOGARITHMIC REDUCTION RATE | 0.0552 | 0.053 | 0.0518 | 0.0502 | 0.0485 | 0.0468 | 0.0451 | 0.0434 | 0.0417 | 0.0401 |
| AVERAGE DIAMETER (MM) | 68.5 | 64.93 | 61.651 | 58.635 | 55.860 | 53.306 | 50.955 | 48.790 | 46.796 | 44.958 |
| REDUCTION (MM) | 3.888 | 3.570 | 3.2806 | 3.0162 | 2.7746 | 2.5536 | 2.351 | 2.1653 | 1.9945 | 1.837 |
| NUMBER OF STANDS | 21 | 22 | 23 | 24 | 25 | 26 | 27 | 28 | ||
| LOGARITHMIC REDUCTION RATE | 0.0384 | 0.0367 | 0.035 | 0.0262 | 0.0175 | 0.0117 | 0.0030 | 0 | ||
| AVERAGE DIAMETER (MM) | 43.266 | 41.71 | 40.27 | 39.231 | 38.5511 | 38.103 | 37.989 | 37.989 | ||
| REDUCTION (MM) | 1.6923 | 1.558 | 1.434 | 1.041 | 0.6806 | 0.4484 | 0.1141 | 0 |
Publisher’s Note: MDPI stays neutral with regard to jurisdictional claims in published maps and institutional affiliations. |
© 2022 by the authors. Licensee MDPI, Basel, Switzerland. This article is an open access article distributed under the terms and conditions of the Creative Commons Attribution (CC BY) license (https://creativecommons.org/licenses/by/4.0/).
Share and Cite
Hu, J.; Yang, S.; Huang, Y.; Wang, X.; Chen, J. A New Correction Theory and Verification on the Reducing Rate Distribution for Seamless Tube Stretch-Reducing Process. Crystals 2022, 12, 1296. https://doi.org/10.3390/cryst12091296
Hu J, Yang S, Huang Y, Wang X, Chen J. A New Correction Theory and Verification on the Reducing Rate Distribution for Seamless Tube Stretch-Reducing Process. Crystals. 2022; 12(9):1296. https://doi.org/10.3390/cryst12091296
Chicago/Turabian StyleHu, Jianhua, Sheng Yang, Yulong Huang, Xiaohua Wang, and Jianxun Chen. 2022. "A New Correction Theory and Verification on the Reducing Rate Distribution for Seamless Tube Stretch-Reducing Process" Crystals 12, no. 9: 1296. https://doi.org/10.3390/cryst12091296