Article

A First-Principles Study of F and Cl Doping in LiNi0.83Co0.08Mn0.08O2 Cathode Materials

1
School of Energy Science and Engineering, Central South University, Changsha 410083, China
2
Hunan Shuoke Thermal Engineering Intelligent Equipment Co., Ltd., Changsha 410083, China
*
Authors to whom correspondence should be addressed.
Crystals 2022, 12(9), 1297; https://doi.org/10.3390/cryst12091297
Submission received: 10 August 2022 / Revised: 8 September 2022 / Accepted: 10 September 2022 / Published: 14 September 2022

Abstract

:
Ion doping can modify the cell structure, which is one of the effective methods to improve electrochemical performance. However, there is a lack of research on F- and Cl-doped LiNi0.8Co0.1Mn0.1O2. In this paper, the effects of F and Cl doping on the electrochemical properties and cell structure of LiNi0.83Co0.08Mn0.08O2 during the process of lithium removal were studied by a first-principles calculation based on density functional theory. The results show that F doping reduces the change in cell parameters and improves the stability of cell structure. On the contrary, Cl doping reduces the stability of the cell structure. F doping increased the delithiation potential from 3.64 V to 3.76 V, and the delithiation potential was relatively stable in the process of delithiation. Cl doping decreased the delithiation potential from 3.64 V to 3.26 V, and the voltage stability became worse. F doping can effectively reduce the occurrence of Li–Ni mixed arrangement phenomena. Meanwhile, Cl doping can inhibit the formation of oxygen vacancies, and the further degradation of the materials. F doping broadens the Li+ diffusion channel away from the doping site and improves the diffusion rate of Li+ in this layer. In the vicinity of F-doped sites, the electrostatic field in the process of Li+ diffusion is enhanced and the diffusion of Li+ is reduced. Cl doping increases the diffusion barrier of Li+ and slows down the diffusion rate of Li+.

1. Introduction

In recent decades, there has been an increasing interest in research on energy storage technology, and with the widespread use of batteries in power tools, new energy vehicles and electronic products, more and more scholars have been conducting in-depth research and development on them. Among them, scholars found that replacing graphite cathode with lithium metal can significantly improve the energy density of battery, and among various forms of electrolyte (Liquid Electrolytes, Gel Polymer Electrolytes, Solid Polymer Electrolytes, Solid Inorganic Electrolytes, Hybrid Electrolytes), solid electrolyte can effectively improve the safety performance of lithium battery [1]. On this basis, lithium-ion cathode materials have also been developed rapidly. The lithium-ion battery (LIB) with layered material LiMO2 (where M = transition metal (TM), such as Ni, Mn, Co, etc.) as the cathode has been widely used in electric vehicles (EVs), hybrid electric vehicles (HEVs) and plugin hybrid electric vehicles (PHEVs) [2]. The ternary layered material Li (Ni, Co, Mn) O2 combines the characteristics of the high specific capacity of LiNiO2, high cycle performance of LiCoO2, high safety and low cost of LiMnO2 with the synergistic effect of Ni–Co–Mn. It has become one of the most promising cathode materials for lithium-ion batteries.
The theoretical specific capacity of ternary materials is varied, with the change in Ni content, which is about 280 mA·h·g−1; however, the actual discharge-specific capacity is 160~200 mA·h·g−1. The discharge capacity of ternary materials with different components is different in the voltage range of 2.7~4.2 (relative to Li+/Li). As the Ni content increases, the discharge-specific capacity increases, but the thermal stability and cycle performance decreases [3]. In order to improve the electrochemical performance of materials, scholars have carried out a lot of experimental and computational studies. The experimental research mainly includes two methods: ion doping and surface coating. Ion doping mainly includes cation doping (Al, Mg, Ti, Zr etc.) [4,5,6,7] and anion doping (F, Cl etc.) [8,9]. In the meantime, the first-principles calculations have proven to be a very effective method in predicting material properties and improving experimental schemes [10,11]. Liu [12] and Sgroi MF et al. [13] used first-principles calculations to study the doping of other classes of lithium-ion battery cathode materials, and both achieved good results. In the study of the doping of cathode materials for lithium-ion batteries, Luo et al. [14] calculated the properties of LiMnxCoyNi1−x−yO2 materials via first-principles calculation. The results show that the volume of crystal cell increases with the increase in nickel content, and the capacitance also increases. The increase in nickel content is conducive to the stability of material voltage and the diffusion of lithium ion, while the existence of manganese ion will hinder the diffusion of lithium ion, which reveals the general trend of synergistic effect of Ni, Co and Mn ions. Dixit et al. [15] studied the influence of aluminum doping in NCM523 on electrochemical related properties. The results show that Al doping results in the stabilization of partially lithiated states of NCM-523, while high-concentration doping may slow down the diffusion rate of Li. Min et al. [16] studied the preventive effects of Al and Mg doping on the degradation in LiNi0.8Co0.1Mn0.1O2 cathode materials. Although the cation doping research has made great progress, little is known about the effect of anion doping on the properties of ternary layered materials. Some experimental studies have shown that fluoride can stabilize the metastable structure of layered or spinel materials, and fluorine ions can effectively improve the rate performance and cycle performance, but decrease the initial specific capacity [9,17,18]. The influence of anion doping on the electrochemical performance of LiNi0.8Co0.1Mn0.1O2(NCM811) material is worthy of further study.
The effect of F and Cl doping on the electrochemical performance of NCM811 cathode material was studied by first-principles calculation. A reasonable explanation for the change in electrochemical performance of F-doped structure is given, and the electrochemical performance of Cl-doped structure is predicted. The reversible voltage, lattice parameters, typical defects and lithium diffusion barrier are calculated.

2. Calculation Parameters and Structural Model

2.1. Calculation Parameter Setting

In this work calculations were performed within the density functional theory (DFT) framework embedded in the VASP code (Hafner Group of the University of Vienna, Vienna, Austria). The exchange correlation potential is treated by a PBE functional based on a generalized gradient reduction (GGA) [19]. Considering the calculation cost and accuracy, the cutoff energy is set to 500 eV, and the energy and atomic force standards of the system are set to 5 × 10⁻⁶ eV and 0.05 eV/Å. Using the Monkhorst–Pack method to generate a (4 × 4 × 1) k-grid, the Brillouin zone is integrated. In order to describe the strong interaction between 3D electrons of transition metals, Liechtenstein et al. [20] proposed the method of adding Hubbard parameter in GGA (GGA + U). After a linear response calculation and comparison with empirical values, in this calculation, U values of Ni, CO and Mn were set to 6.5, 4.9 and 4.5 eV [19] respectively. In addition, the CI-NEB [21] method was used to study lithium-ion migration kinetics. In this method, we insert three intermediate states between reactants and products by linear interpolation to search the minimum energy reaction path and activation energy.

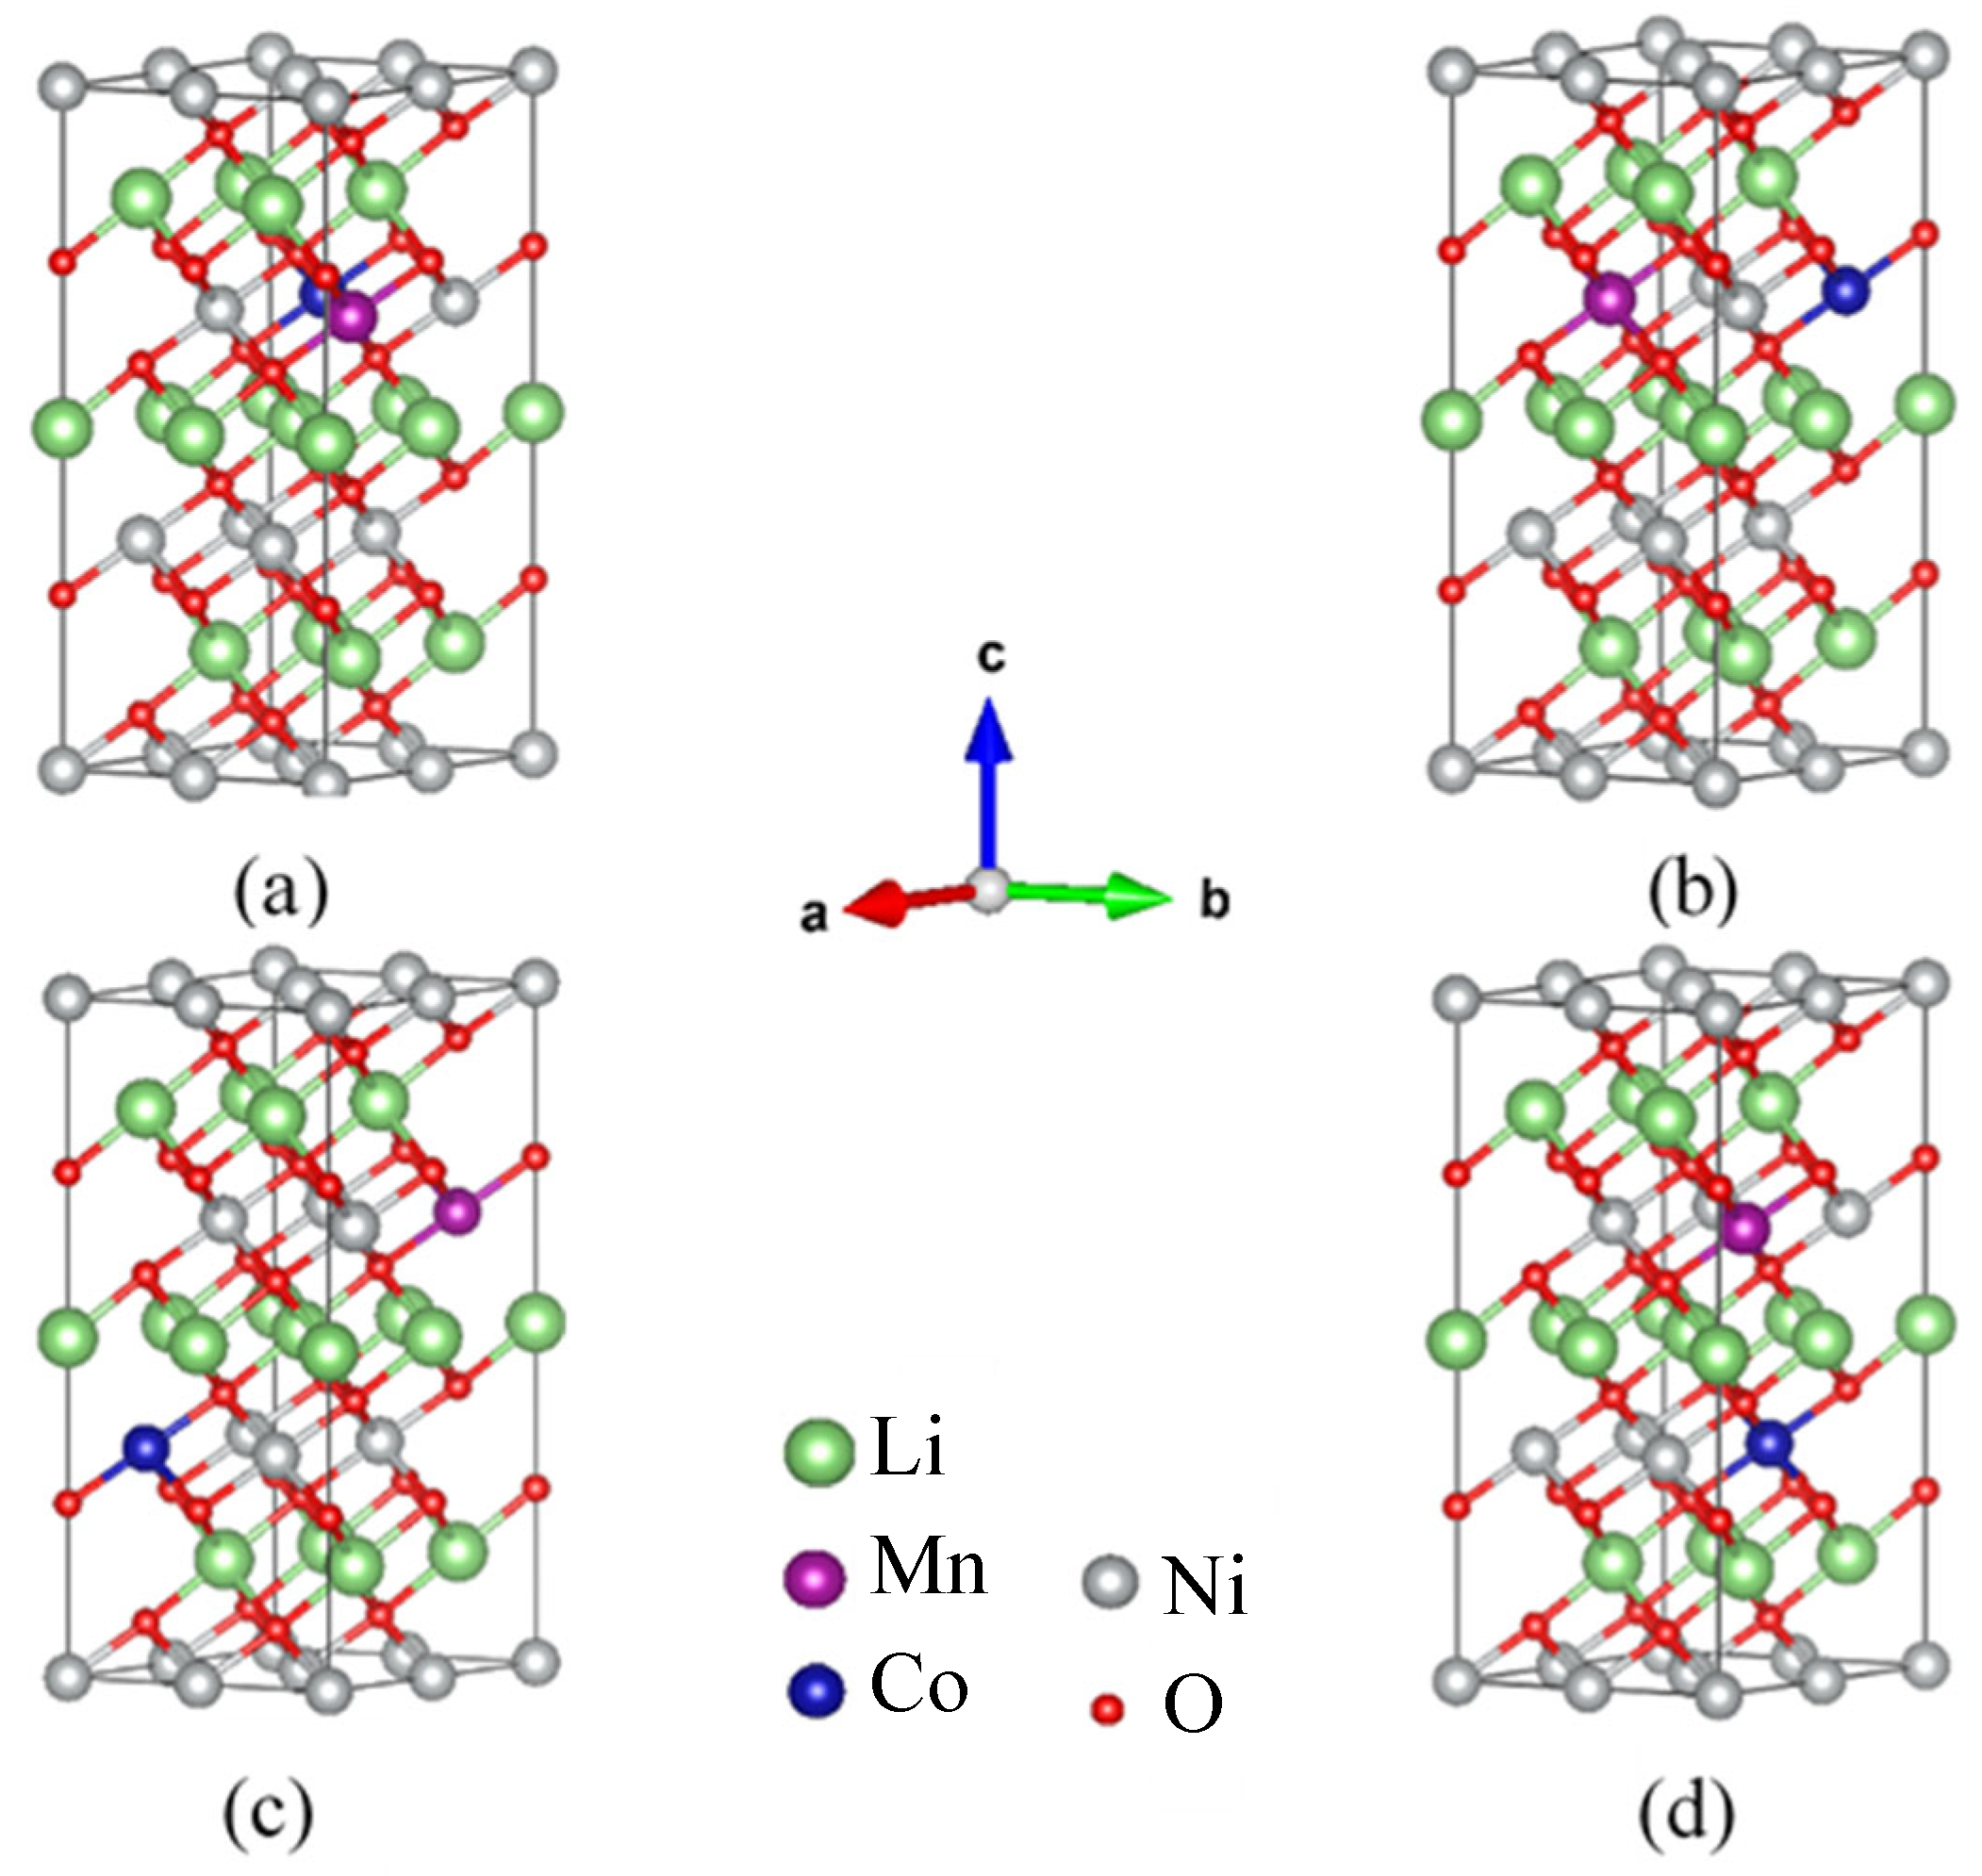
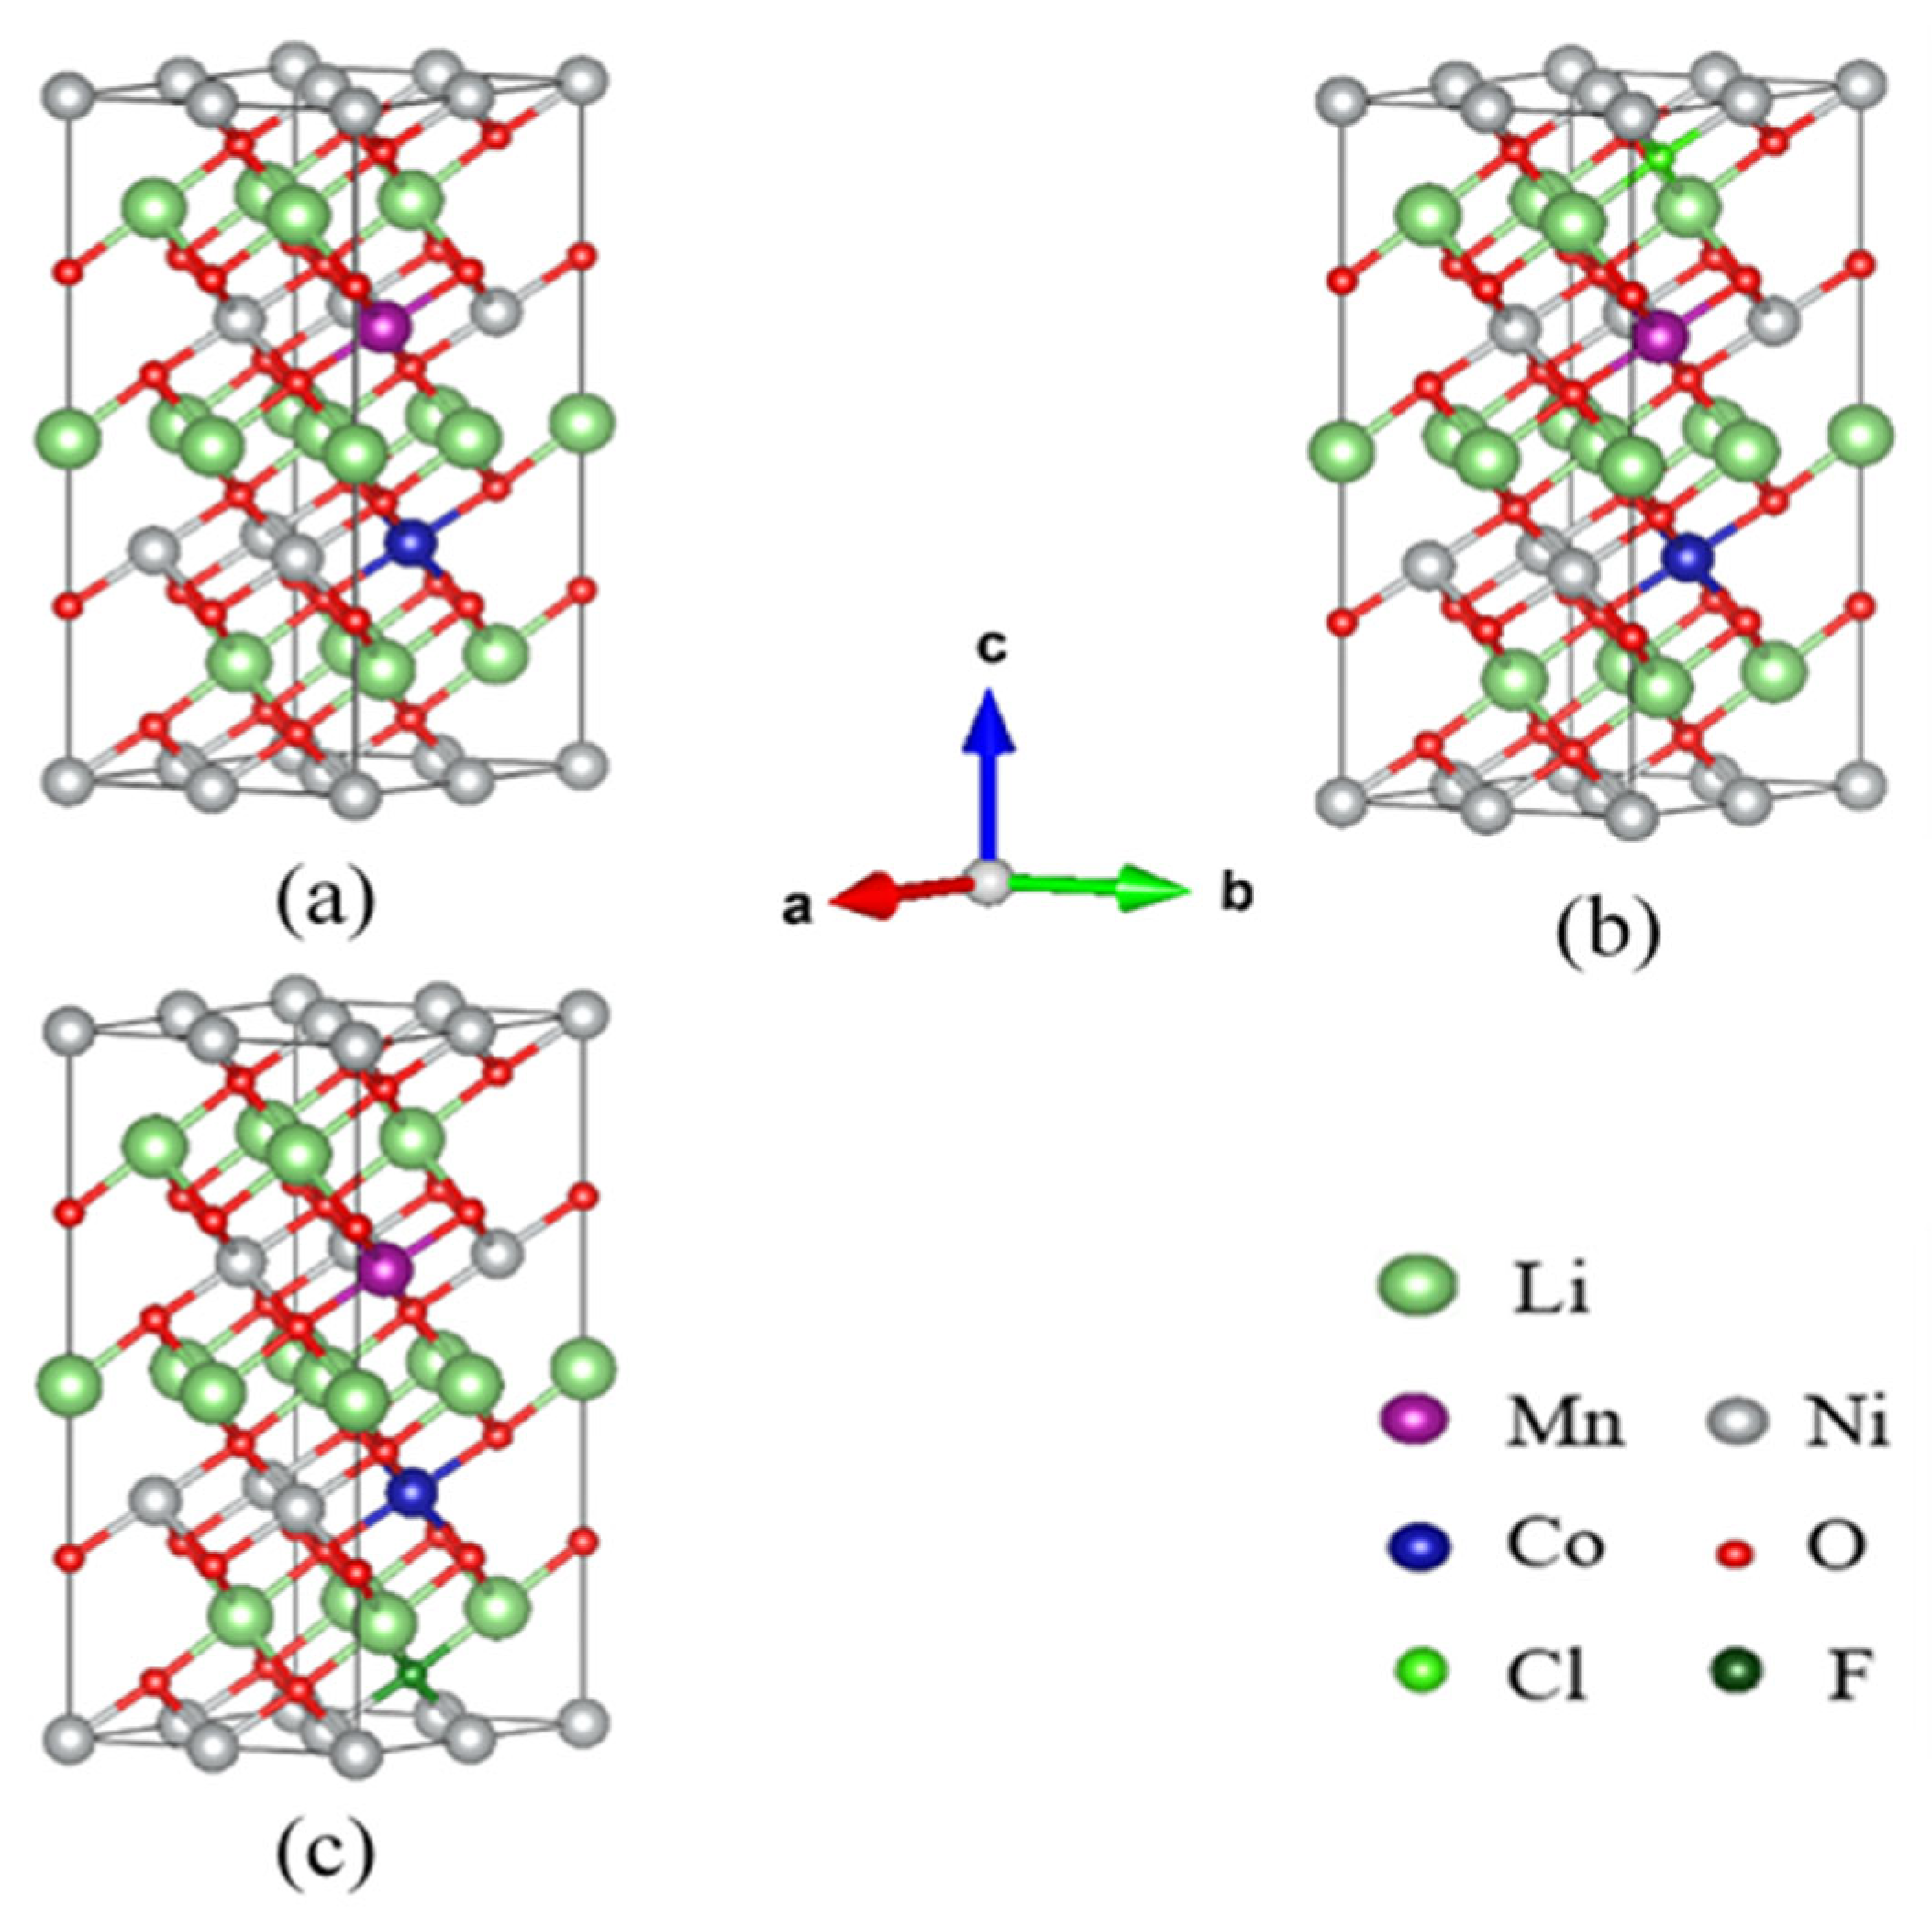
2.2. Structural Model

In order to ensure the doping concentration, it is necessary to establish the unit cell of 2 × 2 × 1 for Li3Ni3O6. Co and Mn atoms replace Ni sites, and the atomic ratio of Li: Ni: CO: Mn: O is 12:10:1:1:24. Whitfield et al. [22] proposed that transition metal ions in LiNi1/3Co1/3Mn1/3O2 were randomly distributed in TM-O layer. Therefore, Co, Mn and Ni ions are randomly distributed in TM-O layer of LiNi0.83Co0.08Mn0.08O2. There are many possibilities for Co and Mn atoms to randomly replace Ni atoms in the unit cell. Due to the equivalence of Ni atoms in the unit cell structure, there are only four actual doping structures, as shown in Figure 1:
In order to obtain the most stable unit cell structure, the energies of four doping types are calculated by VASP software. According to Hohenberg–Kohn theorem [23], the structure with the lowest energy (the most stable doping site) is selected for subsequent anion doping calculation count. The energies of the four atomic arrangements are (Figure 1a) −231.79 eV, (Figure 1b) −231.87 eV, (Figure 1c) −231.86 eV, (Figure 1d) −232.07 eV, respectively. Figure 1d is selected as the subsequent doping calculation. The ground state energies of the four structures are similar, which indicates that the unit cell will not be greatly affected by the random substitution of Mn and Co. The preferred unit cell parameters of NCM811-Intermediates are shown in Table 1.
In order to obtain a relatively stable anion doping structure, the formation energy of doped atoms in each layer of O substitution is calculated. The formation energy of anion doping can be determined by the following formula:
Δ f E O , D = E ( NCM O , D ) + μ ( O ) - E ( NCM P ) - μ ( D )
E(NCMO,D) and E(NCMP) are the ground state energies of the doped and undoped initial cell structures, respectively. μ(O) and μ(D) are the chemical potentials of a single oxygen atom and a dopant atom, respectively.
The calculation results of anion formation energy in different O-layers are shown in Figure 2.
Figure 2 shows the doping formation energies of Cl or F atoms in the (a)~(f) oxygen layer. The results show that the difference in formation energy between different O sites is small (less than 1 eV). As we all know, the amount of formation energy can reflect the difficulty of structure formation. The smaller the formation energy is, the easier the structure is to form.
The formation energy of Cl doping is in the range of 5.3 eV~5.5 eV and F doping is in the range of 1.6 eV~2.0 eV. The formation energy of the Cl-and F-substituted a-layer oxygen site is the smallest. The calculated cell structures of LiNi0.83Co0.08Mn0.08O2 (NCM811-Intermediates), LiNi0.83Co0.08Mn0.08O0.96Cl0.04 (NCM811-Intermediates-Cl) and LiNi0.83Co0.08Mn0.08O0.96F0.04 (NCM811-Intermediates-F) are shown in Figure 3.

3. Results and Discussion

The change in lattice parameters in the process of lithium removal largely depends on how each lithium atom is extracted, it is very important to study the order of lithium-ion removal in the process of lithium removal [25]. Figure 4 shows the arrangement of Li.
By calculating the energy of each possible delithiation structure, the order of delithiation of the three cell structures was determined:
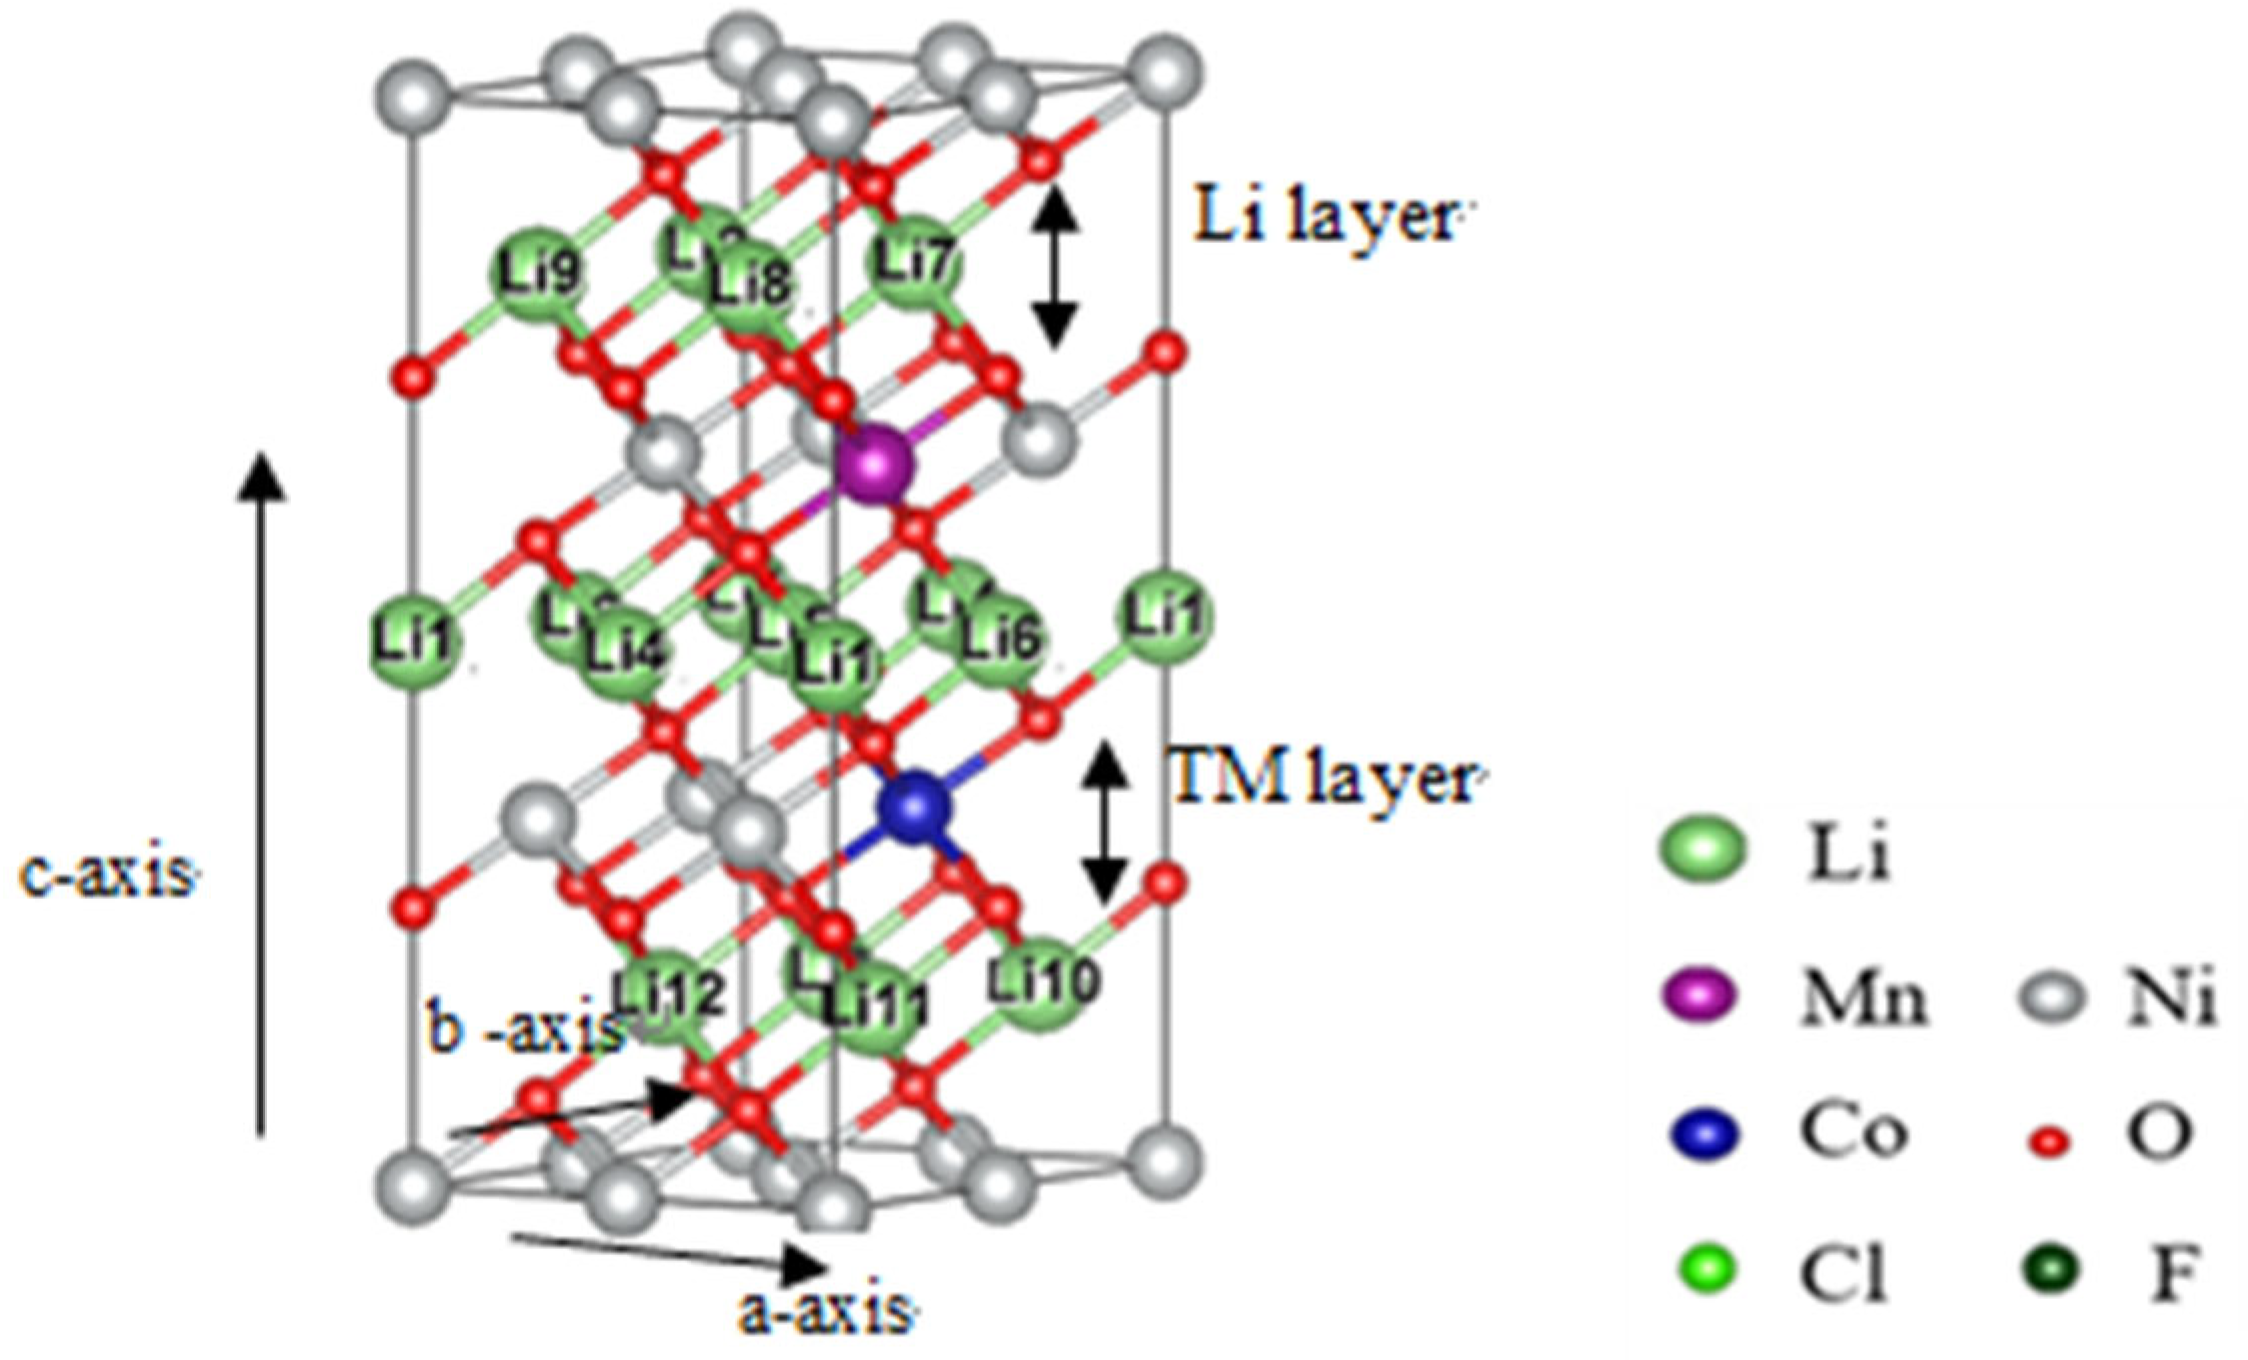
  • NCM811-Intermediates: Li1→Li11→Li8→Li6→Li3→Li7→Li10→Li2→Li4→Li9→Li12→Li5
  • NCM811-Cl Intermediates: Li8→Li9→Li1→Li11→Li6→Li3→Li7→Li4→Li10→Li2→Li5 →Li12
  • NCM811-F-Intermediates: Li1→Li9→Li10→Li6→Li11→Li7→Li4→Li3→Li8→Li2→Li12 →Li5

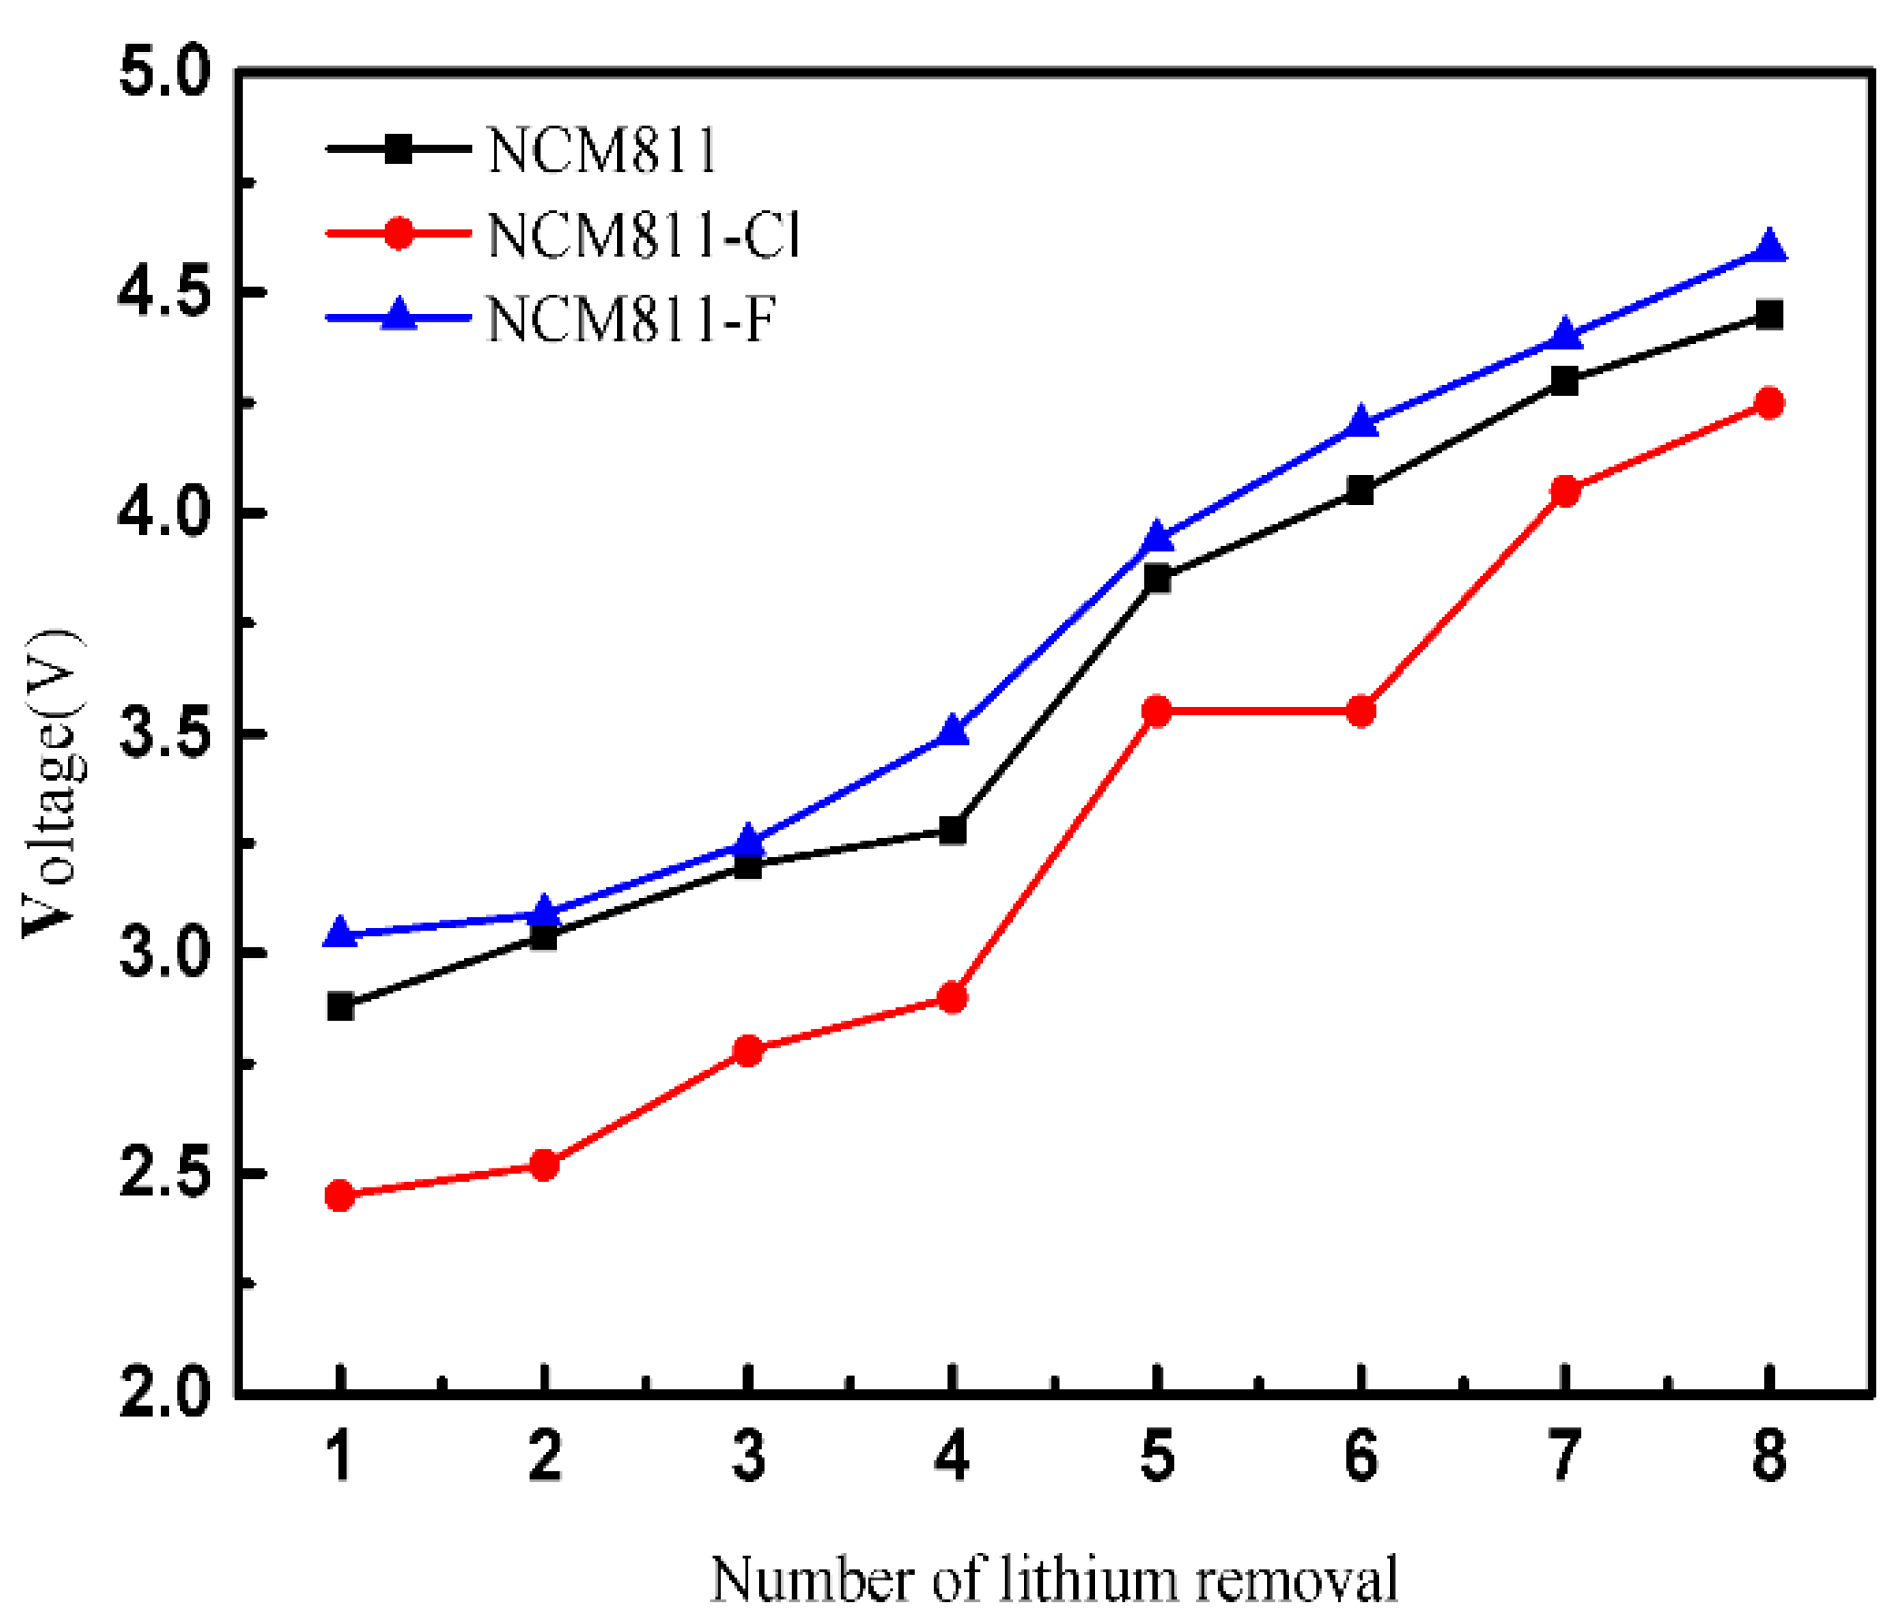
3.1. Delithiation Potential

The delithiation potential is an important electrochemical parameter of electrode materials. The delithiation potential of NCM811-Intermediates, NCM811-Intermediates-Cl and NCM811-Intermediates-F are shown in Table 2.
The delithiation potential can be calculated according to the following formula [26]
V 1 = E ( L i n ) E ( Li ) + E ( L i n - 1 ) e
where n is 1, 2, …, 8. E(Lin) is the energy of removing n Li. E(Li) is the energy of a single lithium atom. e is the number of valence electrons of Li ion in the unit cell, and the value is 1.
Figure 5 and Table 2 show the change in delithiation potential and the specific value of delithiation potential during the process of delithiation. With the progress of lithium removal, the difficulty of lithium-ion removal increases gradually, and the potential of lithium removal increases gradually. In the process of delithiation, NCM811-Intermediates-F cell has the highest delithiation potential, while NCM811-Intermediates-Cl cell has the lowest. The calculated results are in good agreement with the experimental values of Li[Ni0.83Co0.08Mn0.08]O2 voltage (3.5–4.3 V) and Li[Ni0.83Co0.08Mn0.08]O2-zFz voltage (3.6–4.3 V) [27]. The calculation results show that F doping favors increasing the energy required for delithiation and thus increasing the delithiation potential, while Cl doping does the opposite. During the process of delithiation, the fluctuation of delithiation potential of NCM811-Intermediates is ΔV = 1.57 V, NCM811-Intermediates-Cl is ΔV = 1.80 V, NCM811-Intermediates-F is ΔV = 1.56 V. In conclusion, F doping not only increases the average delithiation potential, but also reduces the potential fluctuate, while Cl doping has the opposite effect.

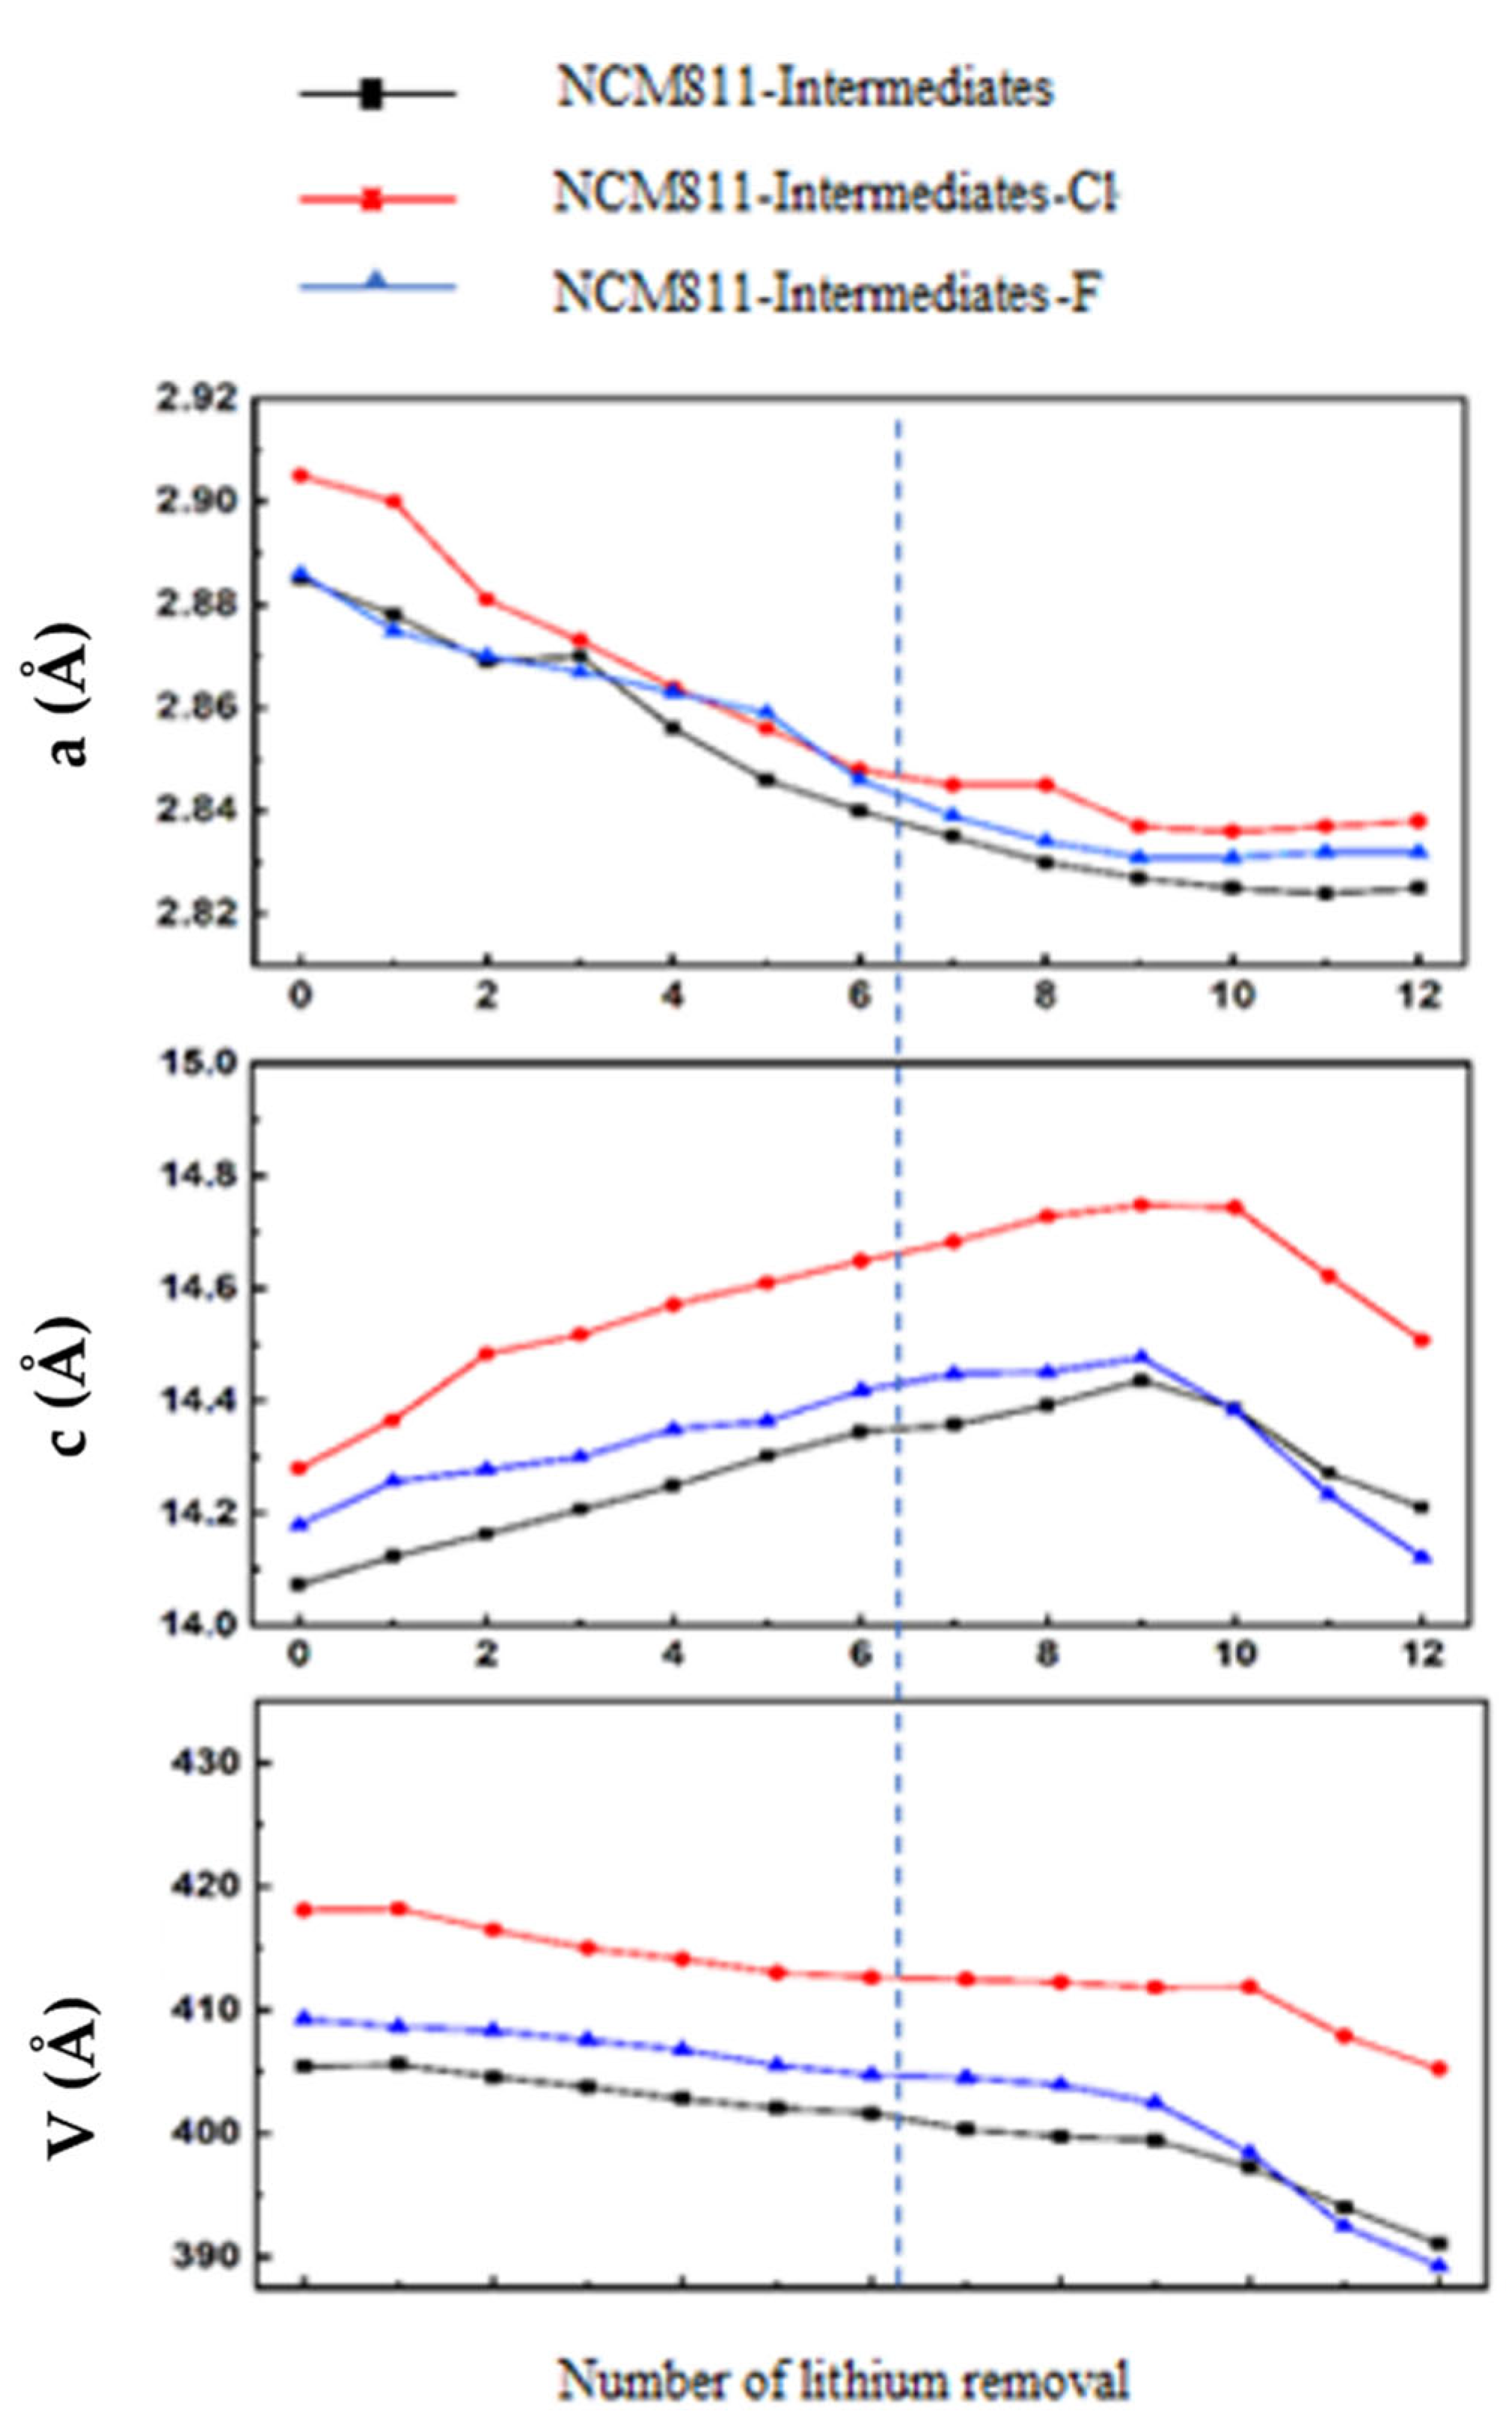
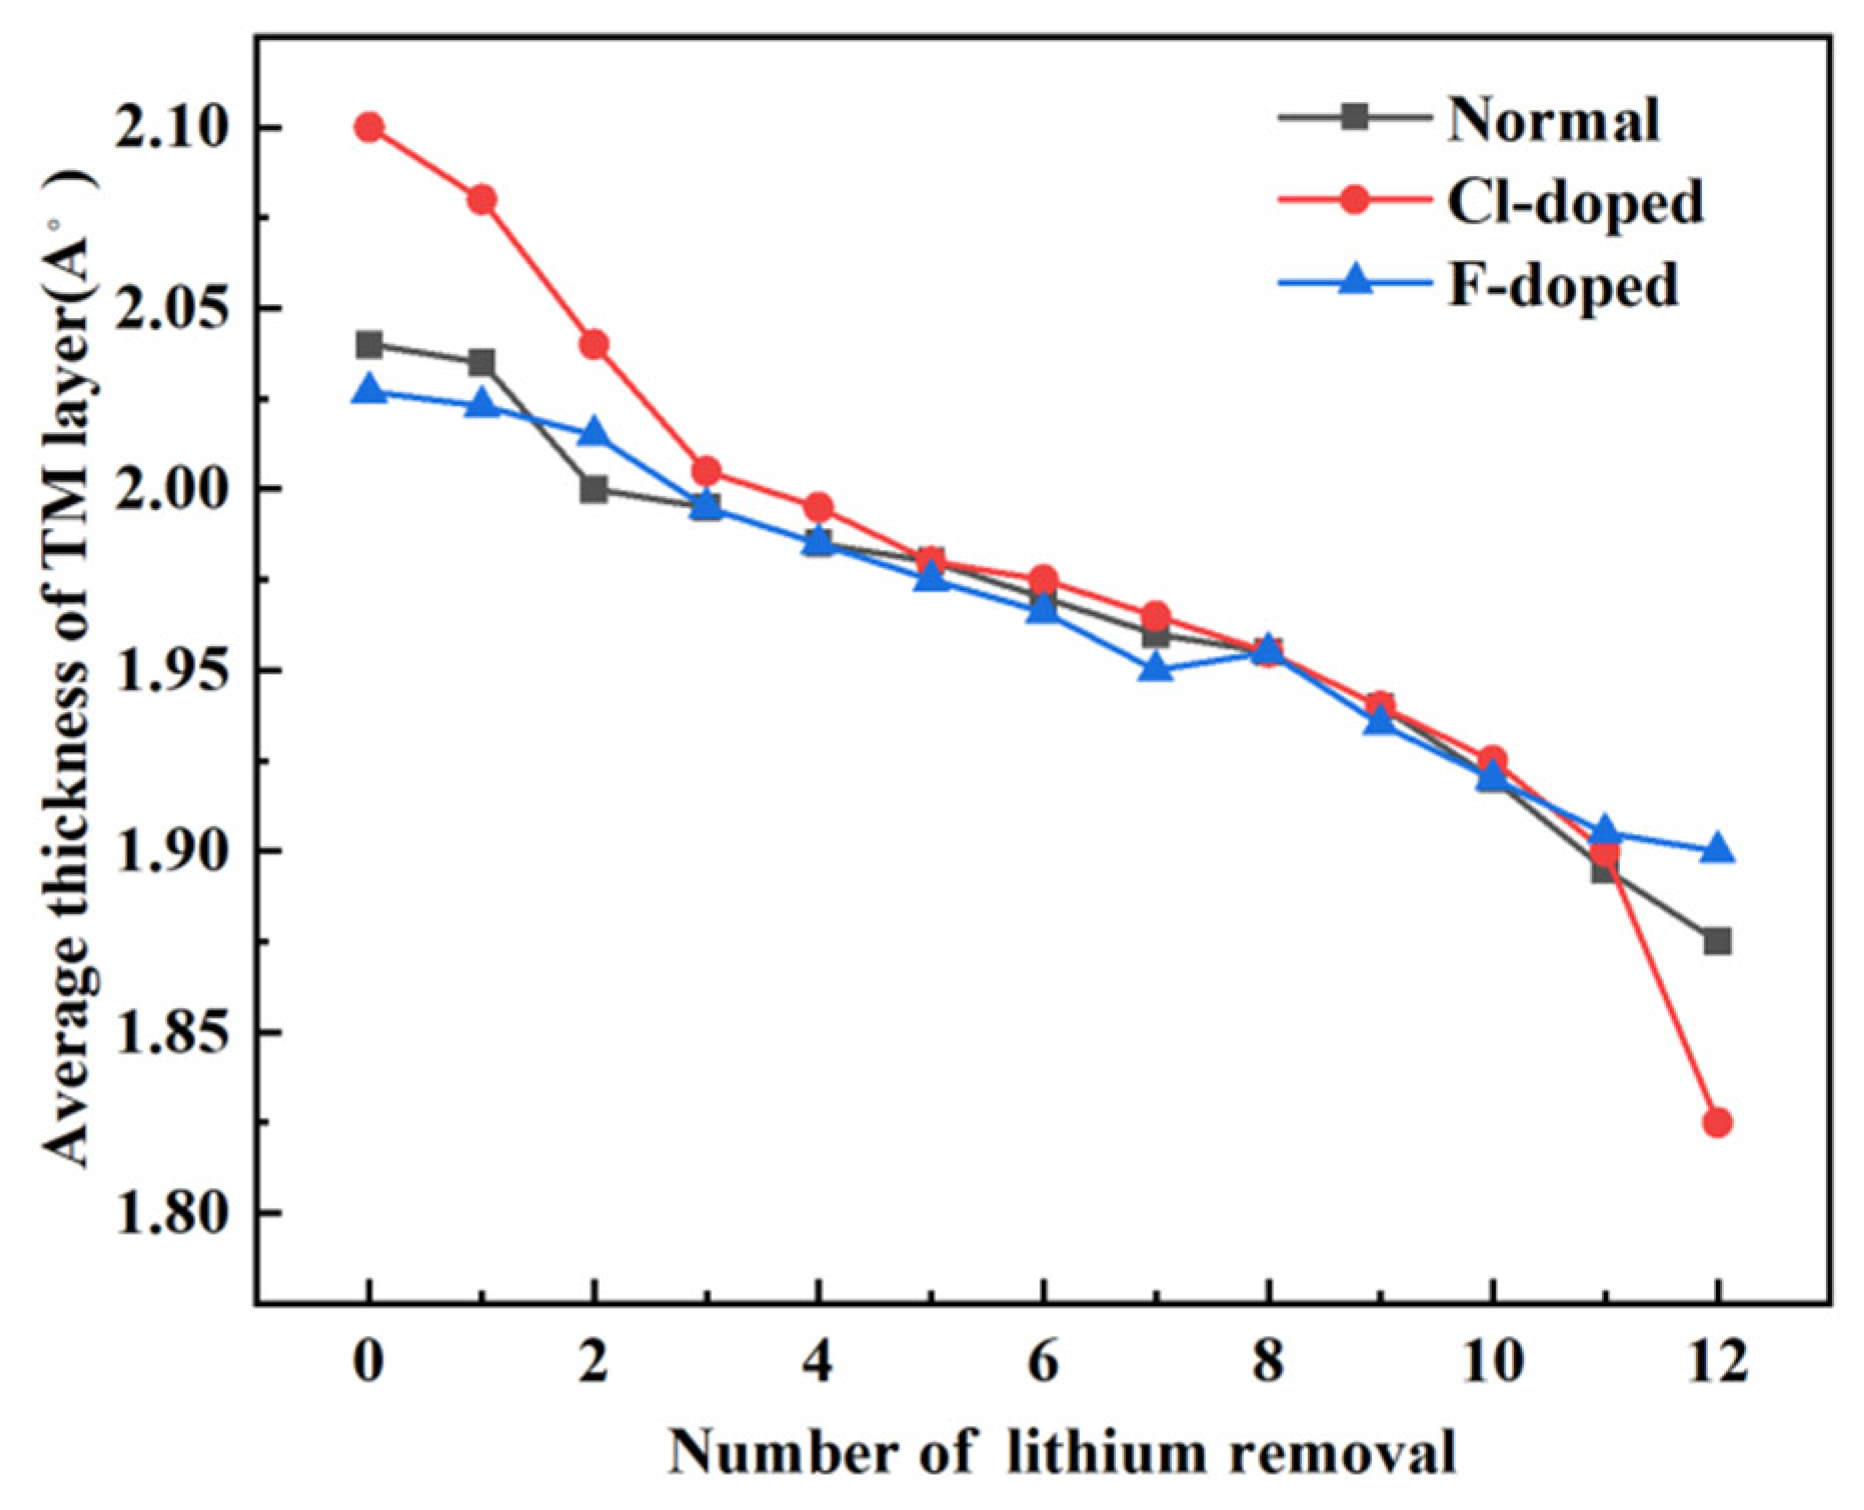
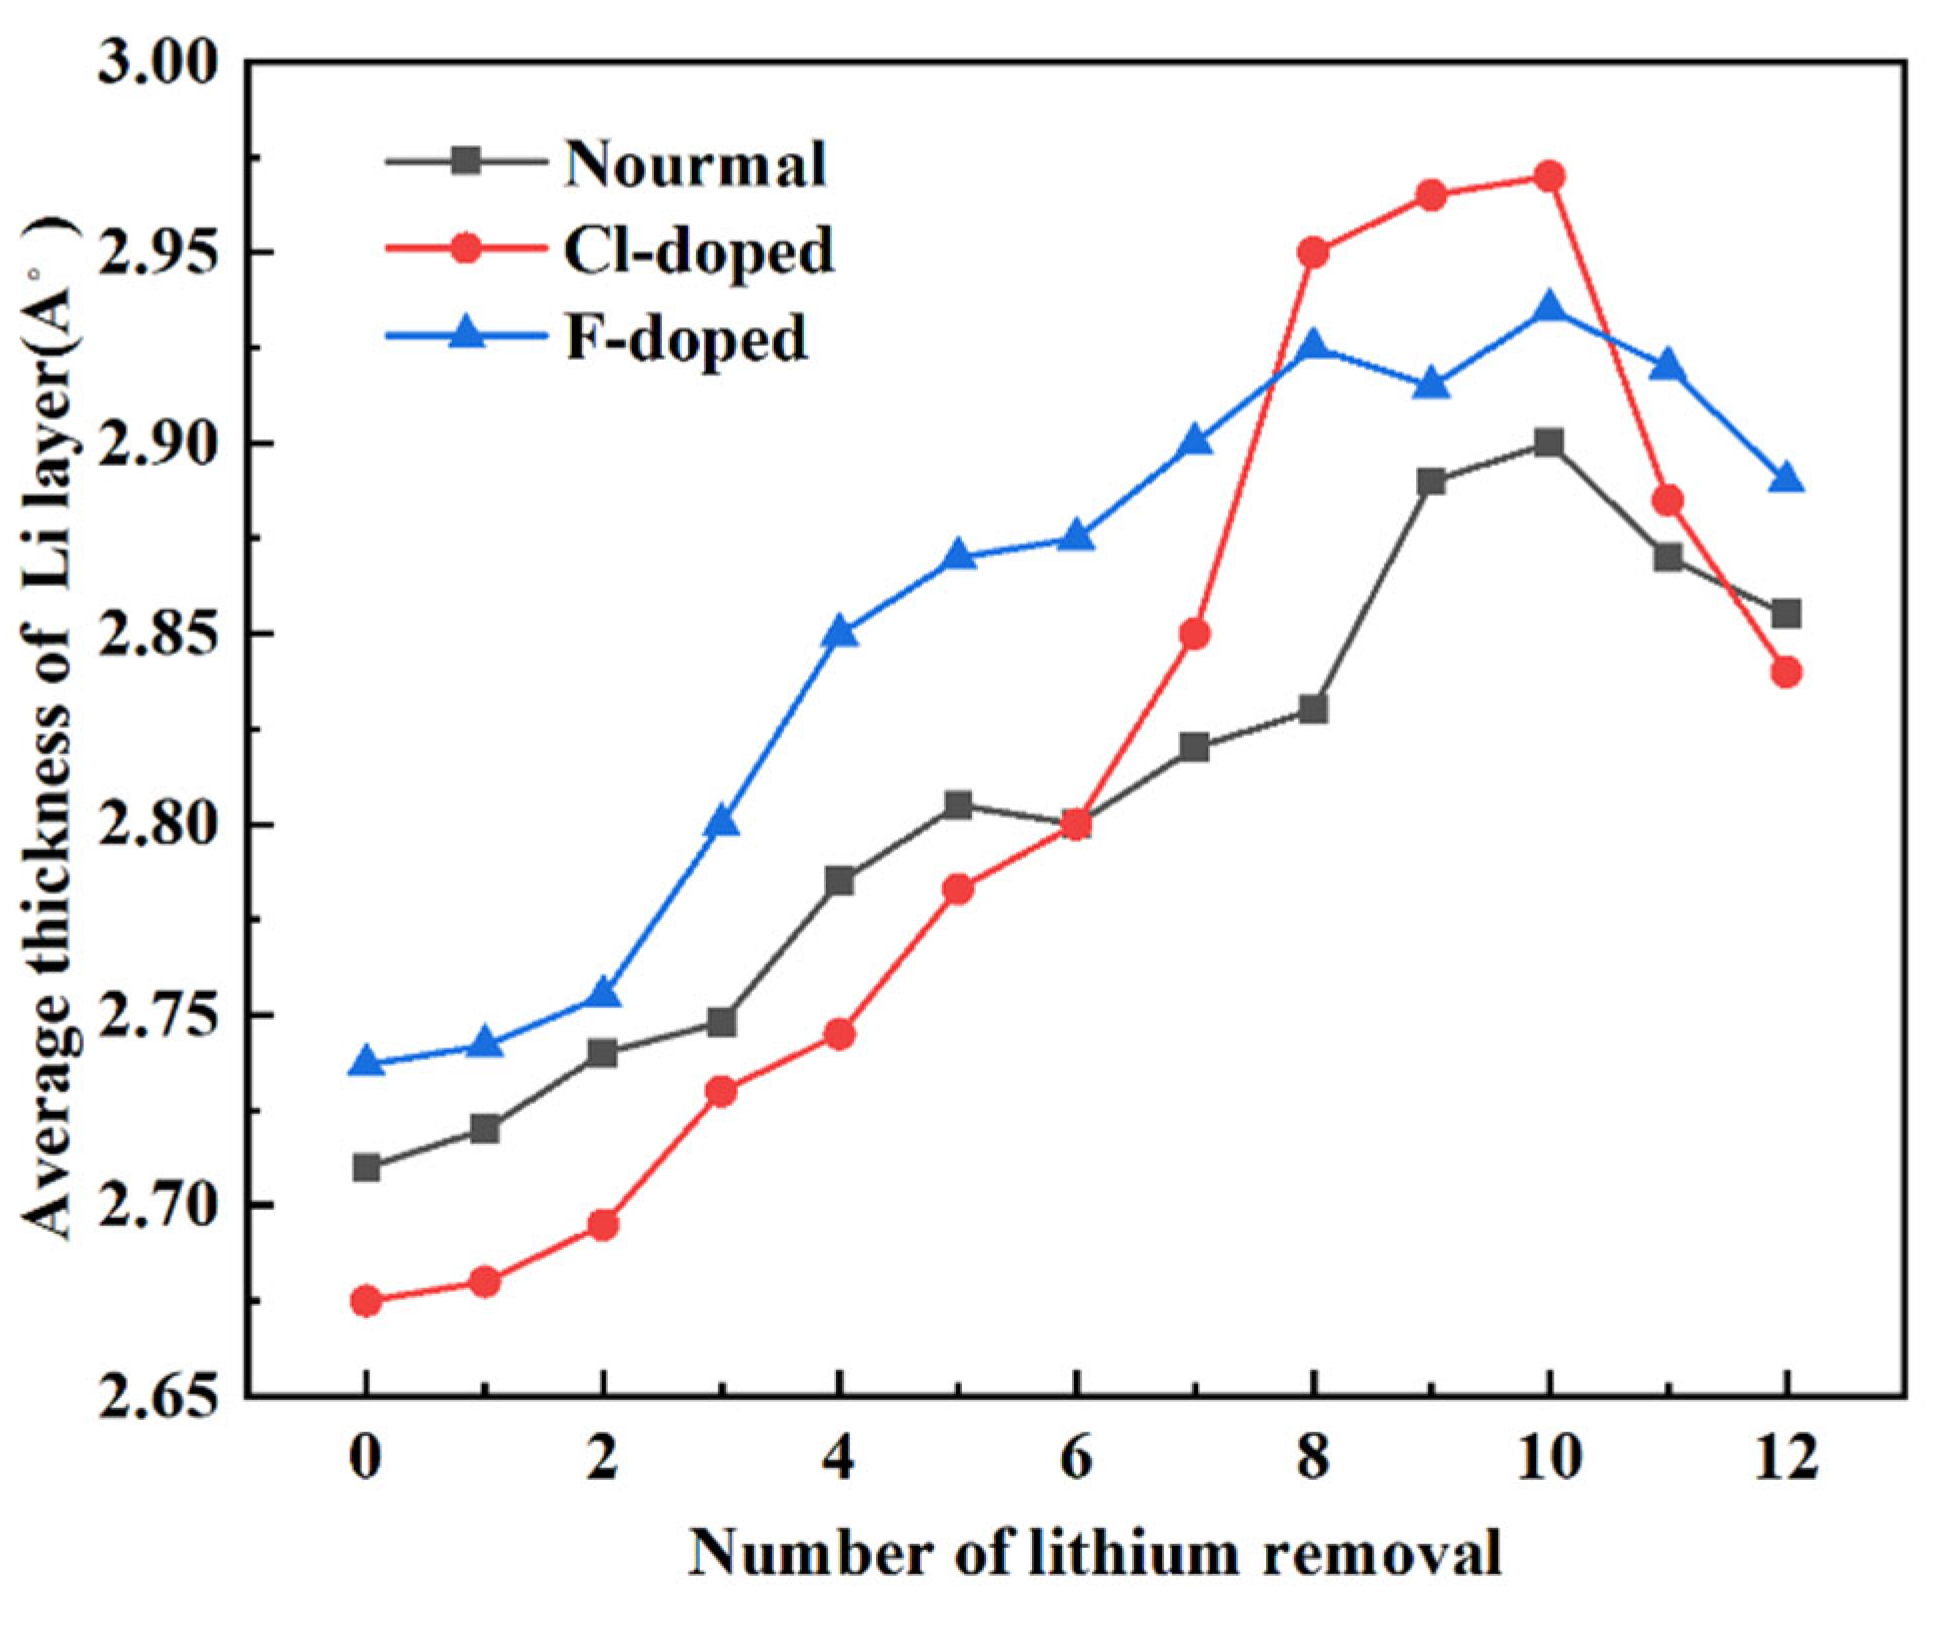
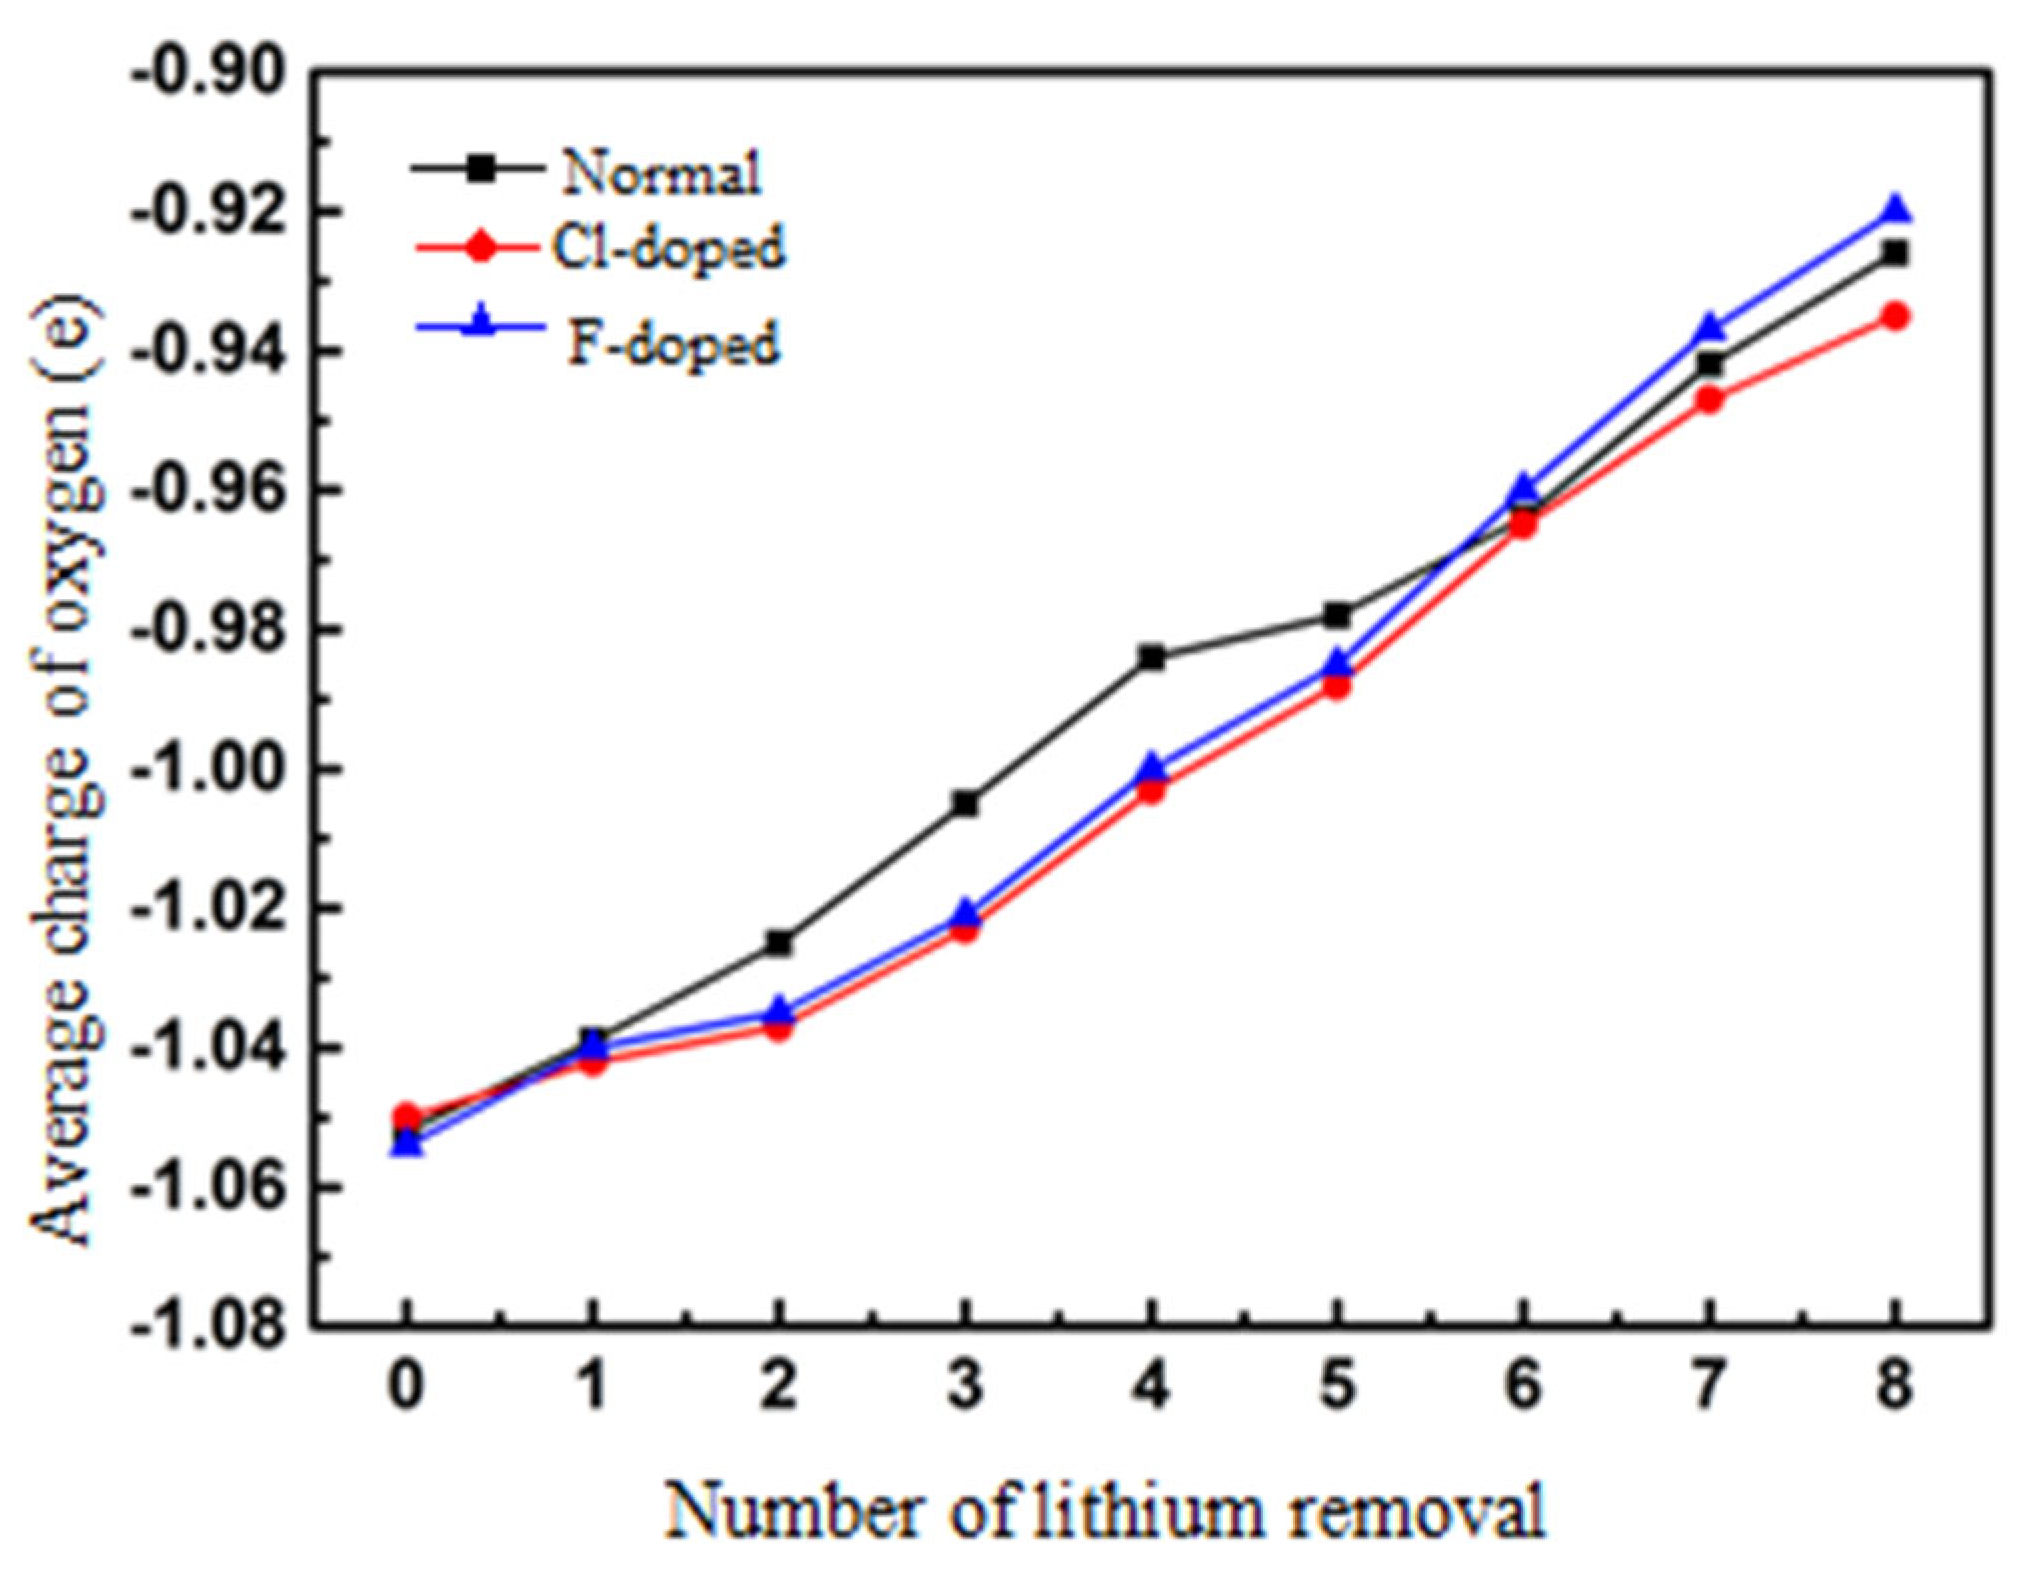
3.2. Lattice Properties during Delithiation

During the charging process of cathode materials for lithium-ion batteries, the lithium-ion removal is accompanied by a change in cell parameters. The stability of cell structure directly affects the electrochemical performance of materials [28]. It is worth noting that due to the limitation of cell structure, the actual amount of lithium removal can only reach 60–70% of the theoretical amount [28,29]. The dotted line in Figure 6 shows the actual amount of lithium removal (x = 8).
In the initial state (x = 0), Cl doping increases the length of a-axis by 0.7% and F doping has no effect on the length of a-axis. The length of c-axis and cell volume increase after being Cl- and F-doped. The change rate of the c-axis and volume of cell doped with Cl is larger: the length of c-axis increases by 1.5% and the volume increases by 3.1%. The change rate of cell parameters of F-doped atoms is small: the length of c-axis increases by 0.3%, and the volume increases by 1%.
During the process of lithium removal, the length change and rate of change in (0 ≤ x ≤ 8) a-axis are NCM811 (−0.055 Å, −1.91%), NCM811-Cl (−0.060 Å, −2.07%), NCM811-F (−0.052 Å, −1.80%), F and Cl doping have little effect on the length of a-axis. In fact, the change in c-axis length is more critical than that of a-axis length during the process of lithium removal. In the whole process of lithium removal (0 ≤ x ≤ 12), the length of c-axis first increases and then decreases, and the calculated results are consistent with the experimental results [29]. In the whole process of lithium removal, Li+ is continuously removed from the unit cell, and the repulsion between adjacent oxygen layers increases, resulting in the increase in c-axis length. As Li+ continues to be removed, the number of nickel–oxygen bonds increases gradually, and the nickel–oxygen bond can reduce the electron repulsion between layers, eventually leading to the decrease in c-axis length [26]. In the actual process of lithium removal (0 ≤ x ≤ 8), the c-axis changes of the three cell structures are as follows: NCM811-Intermediates (+0.320 Å, +2.27%), NCM811-Intermediates-Cl (+0.448 Å, +3.14%), NCM811-Intermediates-F (+0.272 Å, +1.90%). Cl doping leads to the increase in the change rate of c-axis in the process of lithium removal, while F doping leads to the decrease in the change rate of c-axis in the process of lithium removal. The length and rate of change in brackets are relative to the initial structure without lithium removal.
To sum up, in the actual process of lithium removal, the volume change rate of Cl atom-doped cells remains unchanged, but the change rate of cell parameters a-axis and c-axis increases. This shows that the cell shrinks and expands continuously in the process of repeated charging and discharging, and the material particles may suffer structural fracture and pulverization, resulting in poor contact between active particles, increasing the internal resistance of the material battery, and ultimately affecting the reversible capacity of the material. This reduces the material cycle stability and material service life. F atom doping reduces the change rate of the a-axis, c-axis and volume of the cell in the process of lithium removal, improves the stability of the cell in the process of lithium removal, and improves the cycling performance of the material [30]. This result is consistent with the experimental results that indicate F doping can effectively improve the cycling performance of the material [27]. Secondly, both F and Cl doping can increase the length of the c-axis, and the increase in c-axis may lead to the increase in Li diffusion channel and Li+ diffusion rate.
In order to further understand the effect of Cl and F doping on the unit cell in the process of lithium removal, the thickness changes to the Li layer and transition metal layer (TM) in the process of lithium removal are calculated.
The TM layer is the “skeleton” of the layered structure. The large change in TM layer indicates the instability of the unit cell structure during lithium removal. Figure 7 and Figure 8 show that in the actual process of lithium removal (0 ≤ x ≤ 8), the average width of TM layer in NCM811-Intermediates-F cell changes little compared with that in NCM811-Intermediates cell, while the average width of TM layer in NCM811-Intermediates-Cl cell changes greatly (−0.156 Å). This indicates that Cl doping is not conducive to the stability of cell structure.
The Li layer in the cell provides a two-dimensional channel for the diffusion of Li+. The average thickness of an Li layer directly affects the diffusion rate of Li+. In the initial cell structure, the average width of Li layer in NCM811-Intermediates-F cell structure is the largest, which is 2.737 Å. The average Li layer width of NCM811-Intermediates is 2.710 Å. The average width of Li layer in NCM811-Cl cell structure is the smallest, which is 2.670 Å. In the actual process of lithium removal (0 ≤ x ≤ 8), the average width of Li layer in NCM811-Intermediates-F cell structure is larger than that in NCM811-Intermediates cell structure. F doping increases the average width of 2-dimensional Li+ diffusion channel, which may be beneficial to improve the rate performance of cathode materials. In this section, we only study the effect of cell structure on the diffusion rate of Li+, and the diffusion rate of Li+ is also affected by the surrounding electronic environment. Therefore, the effect of doping atoms on Li+ deintercalation rate will be further studied in Section 3.4.

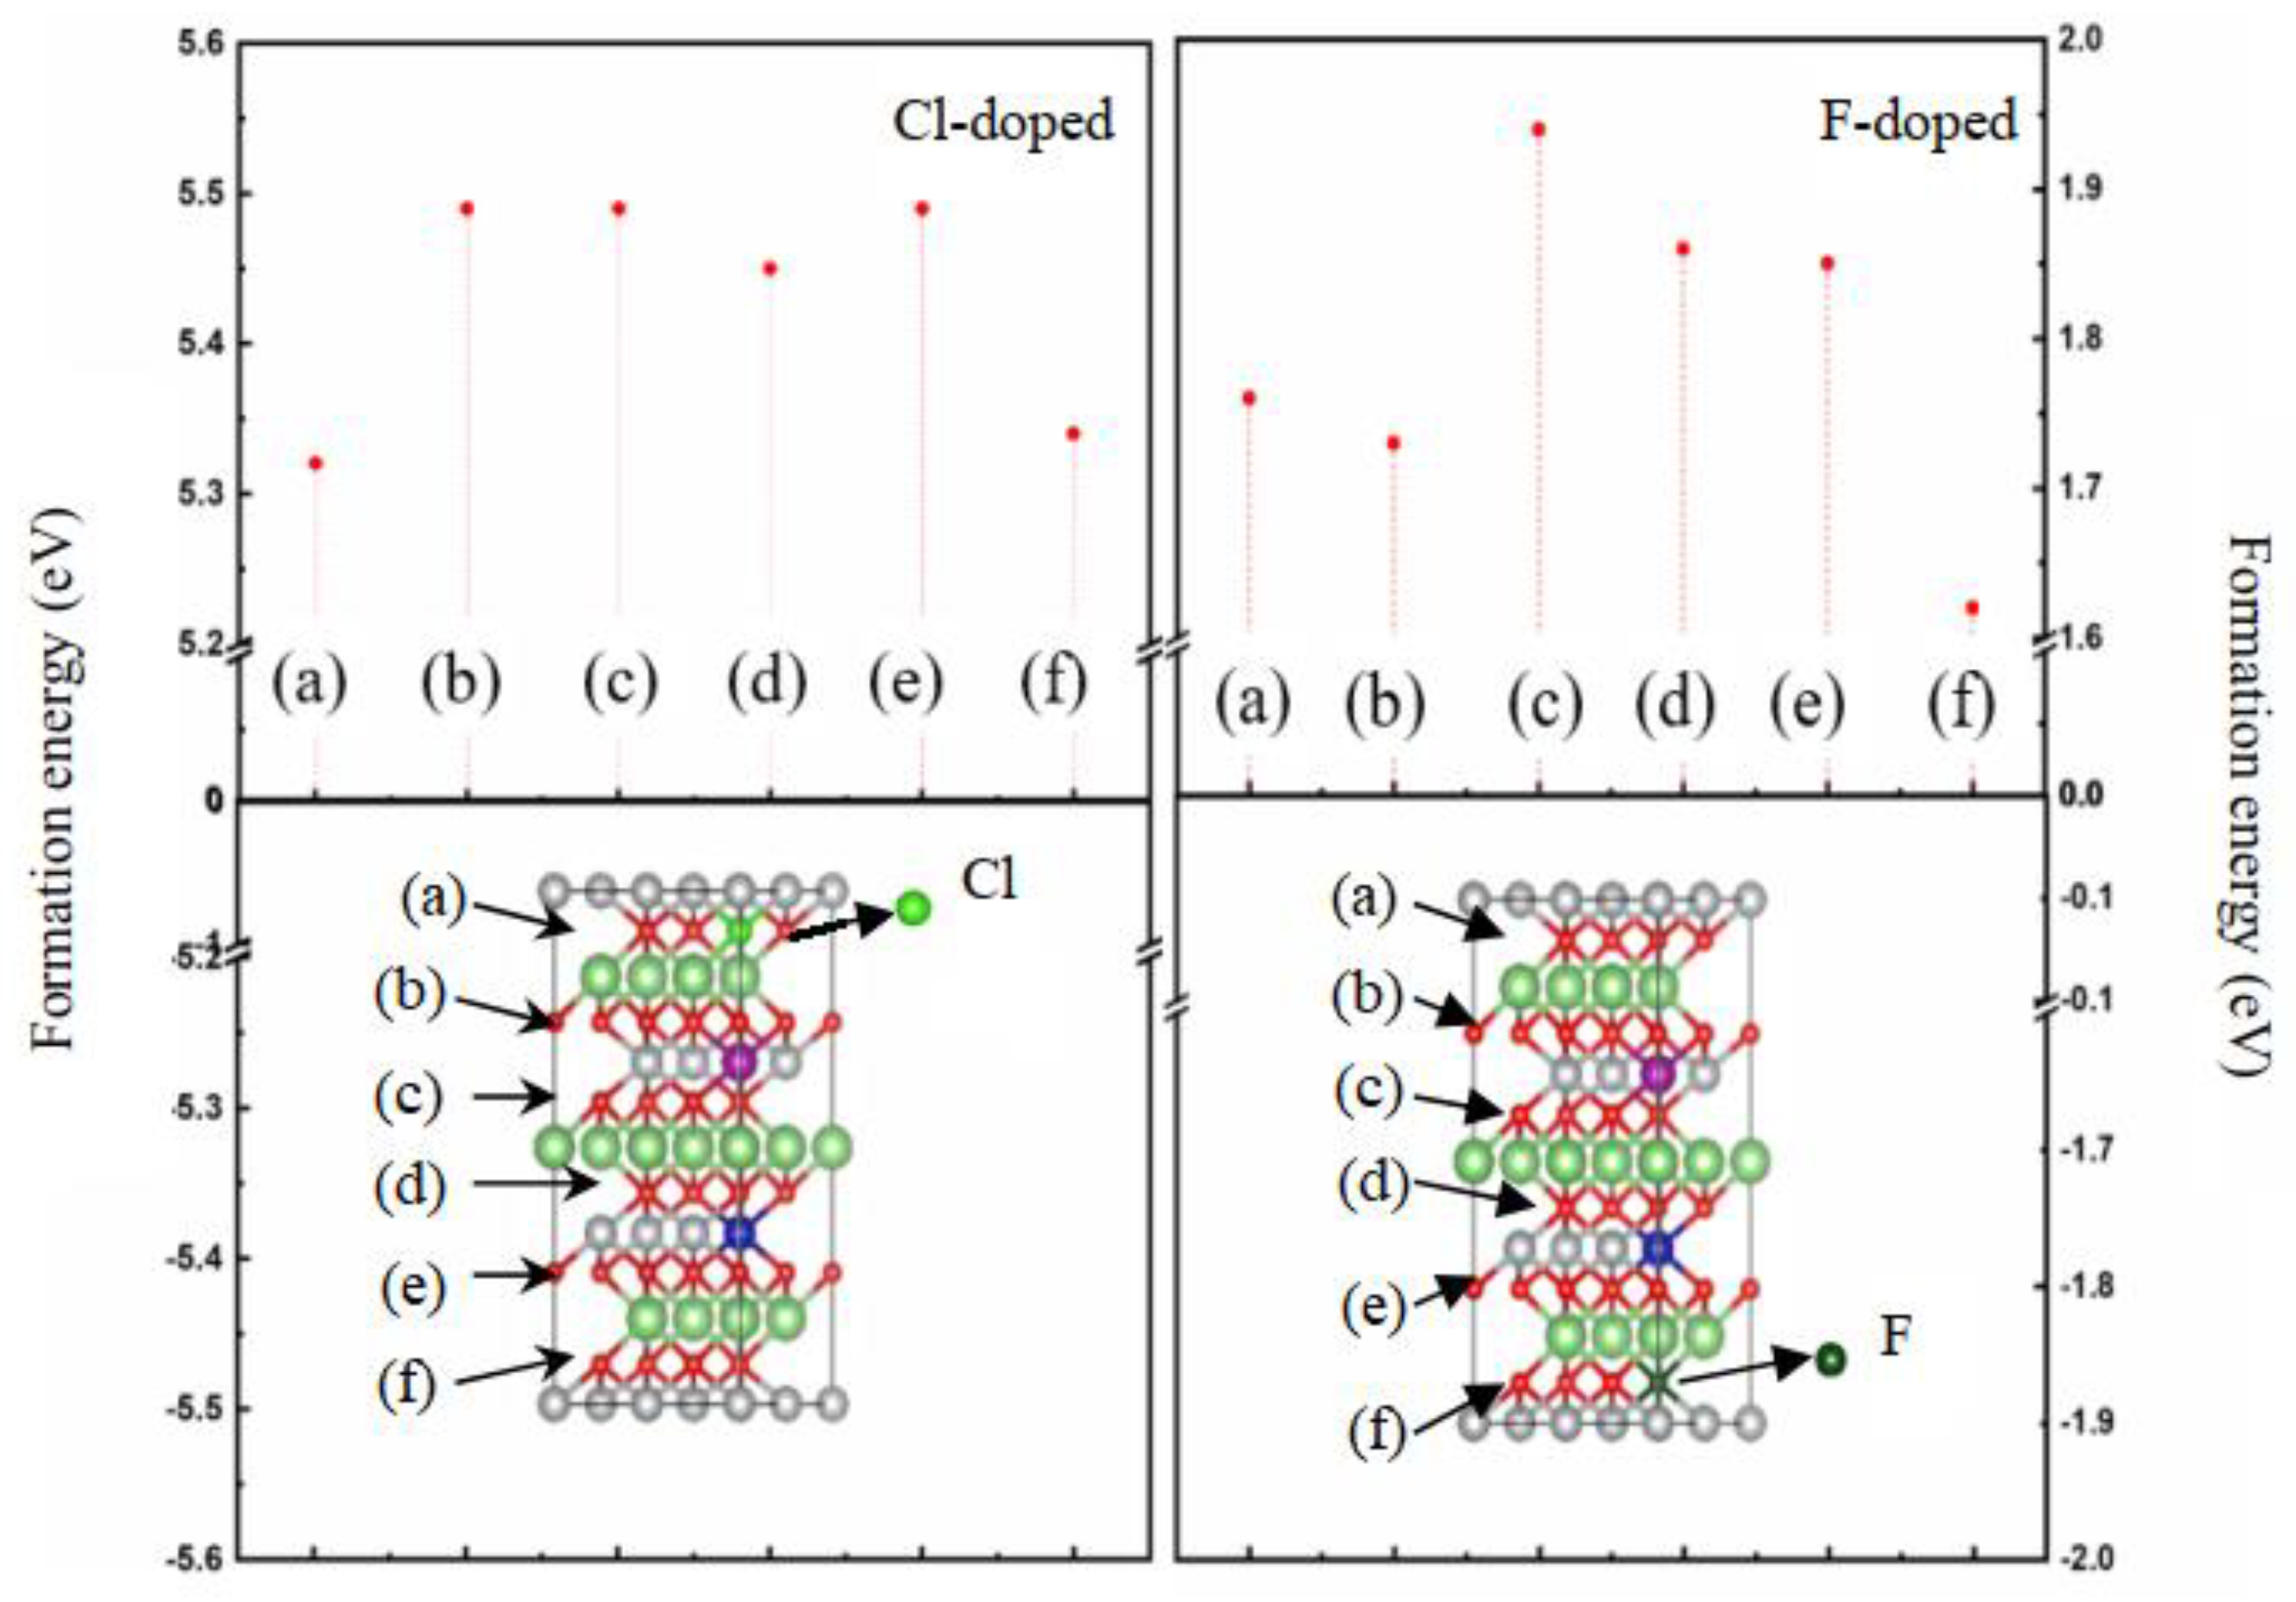
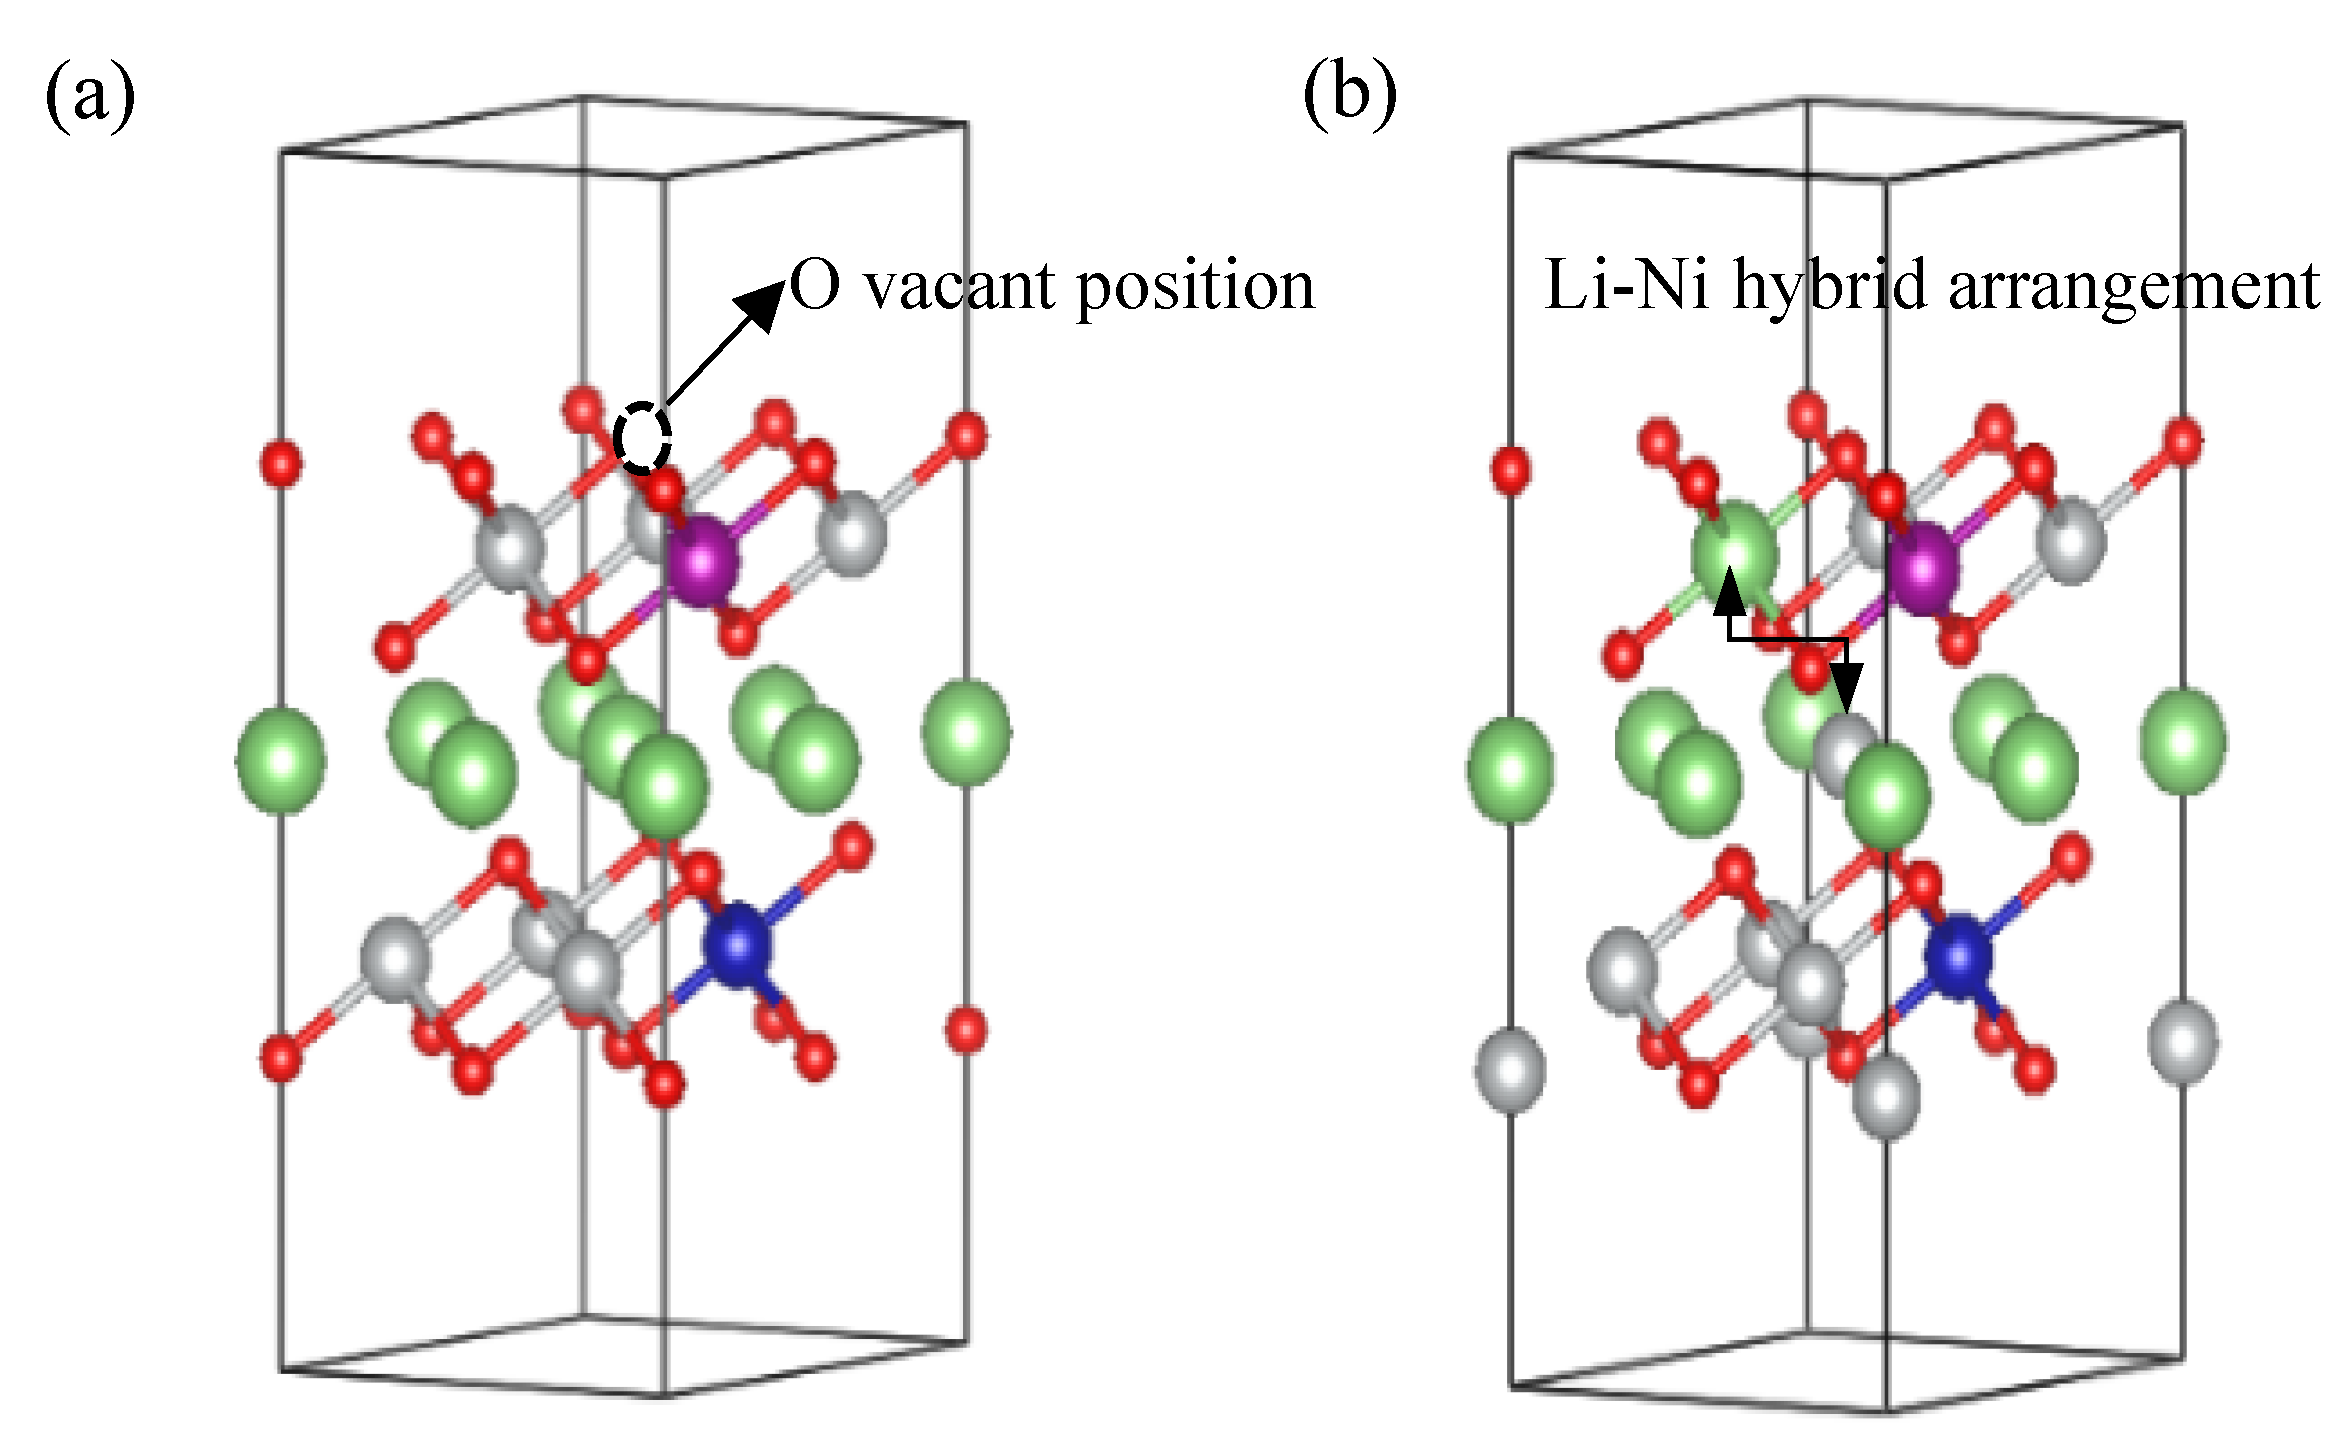
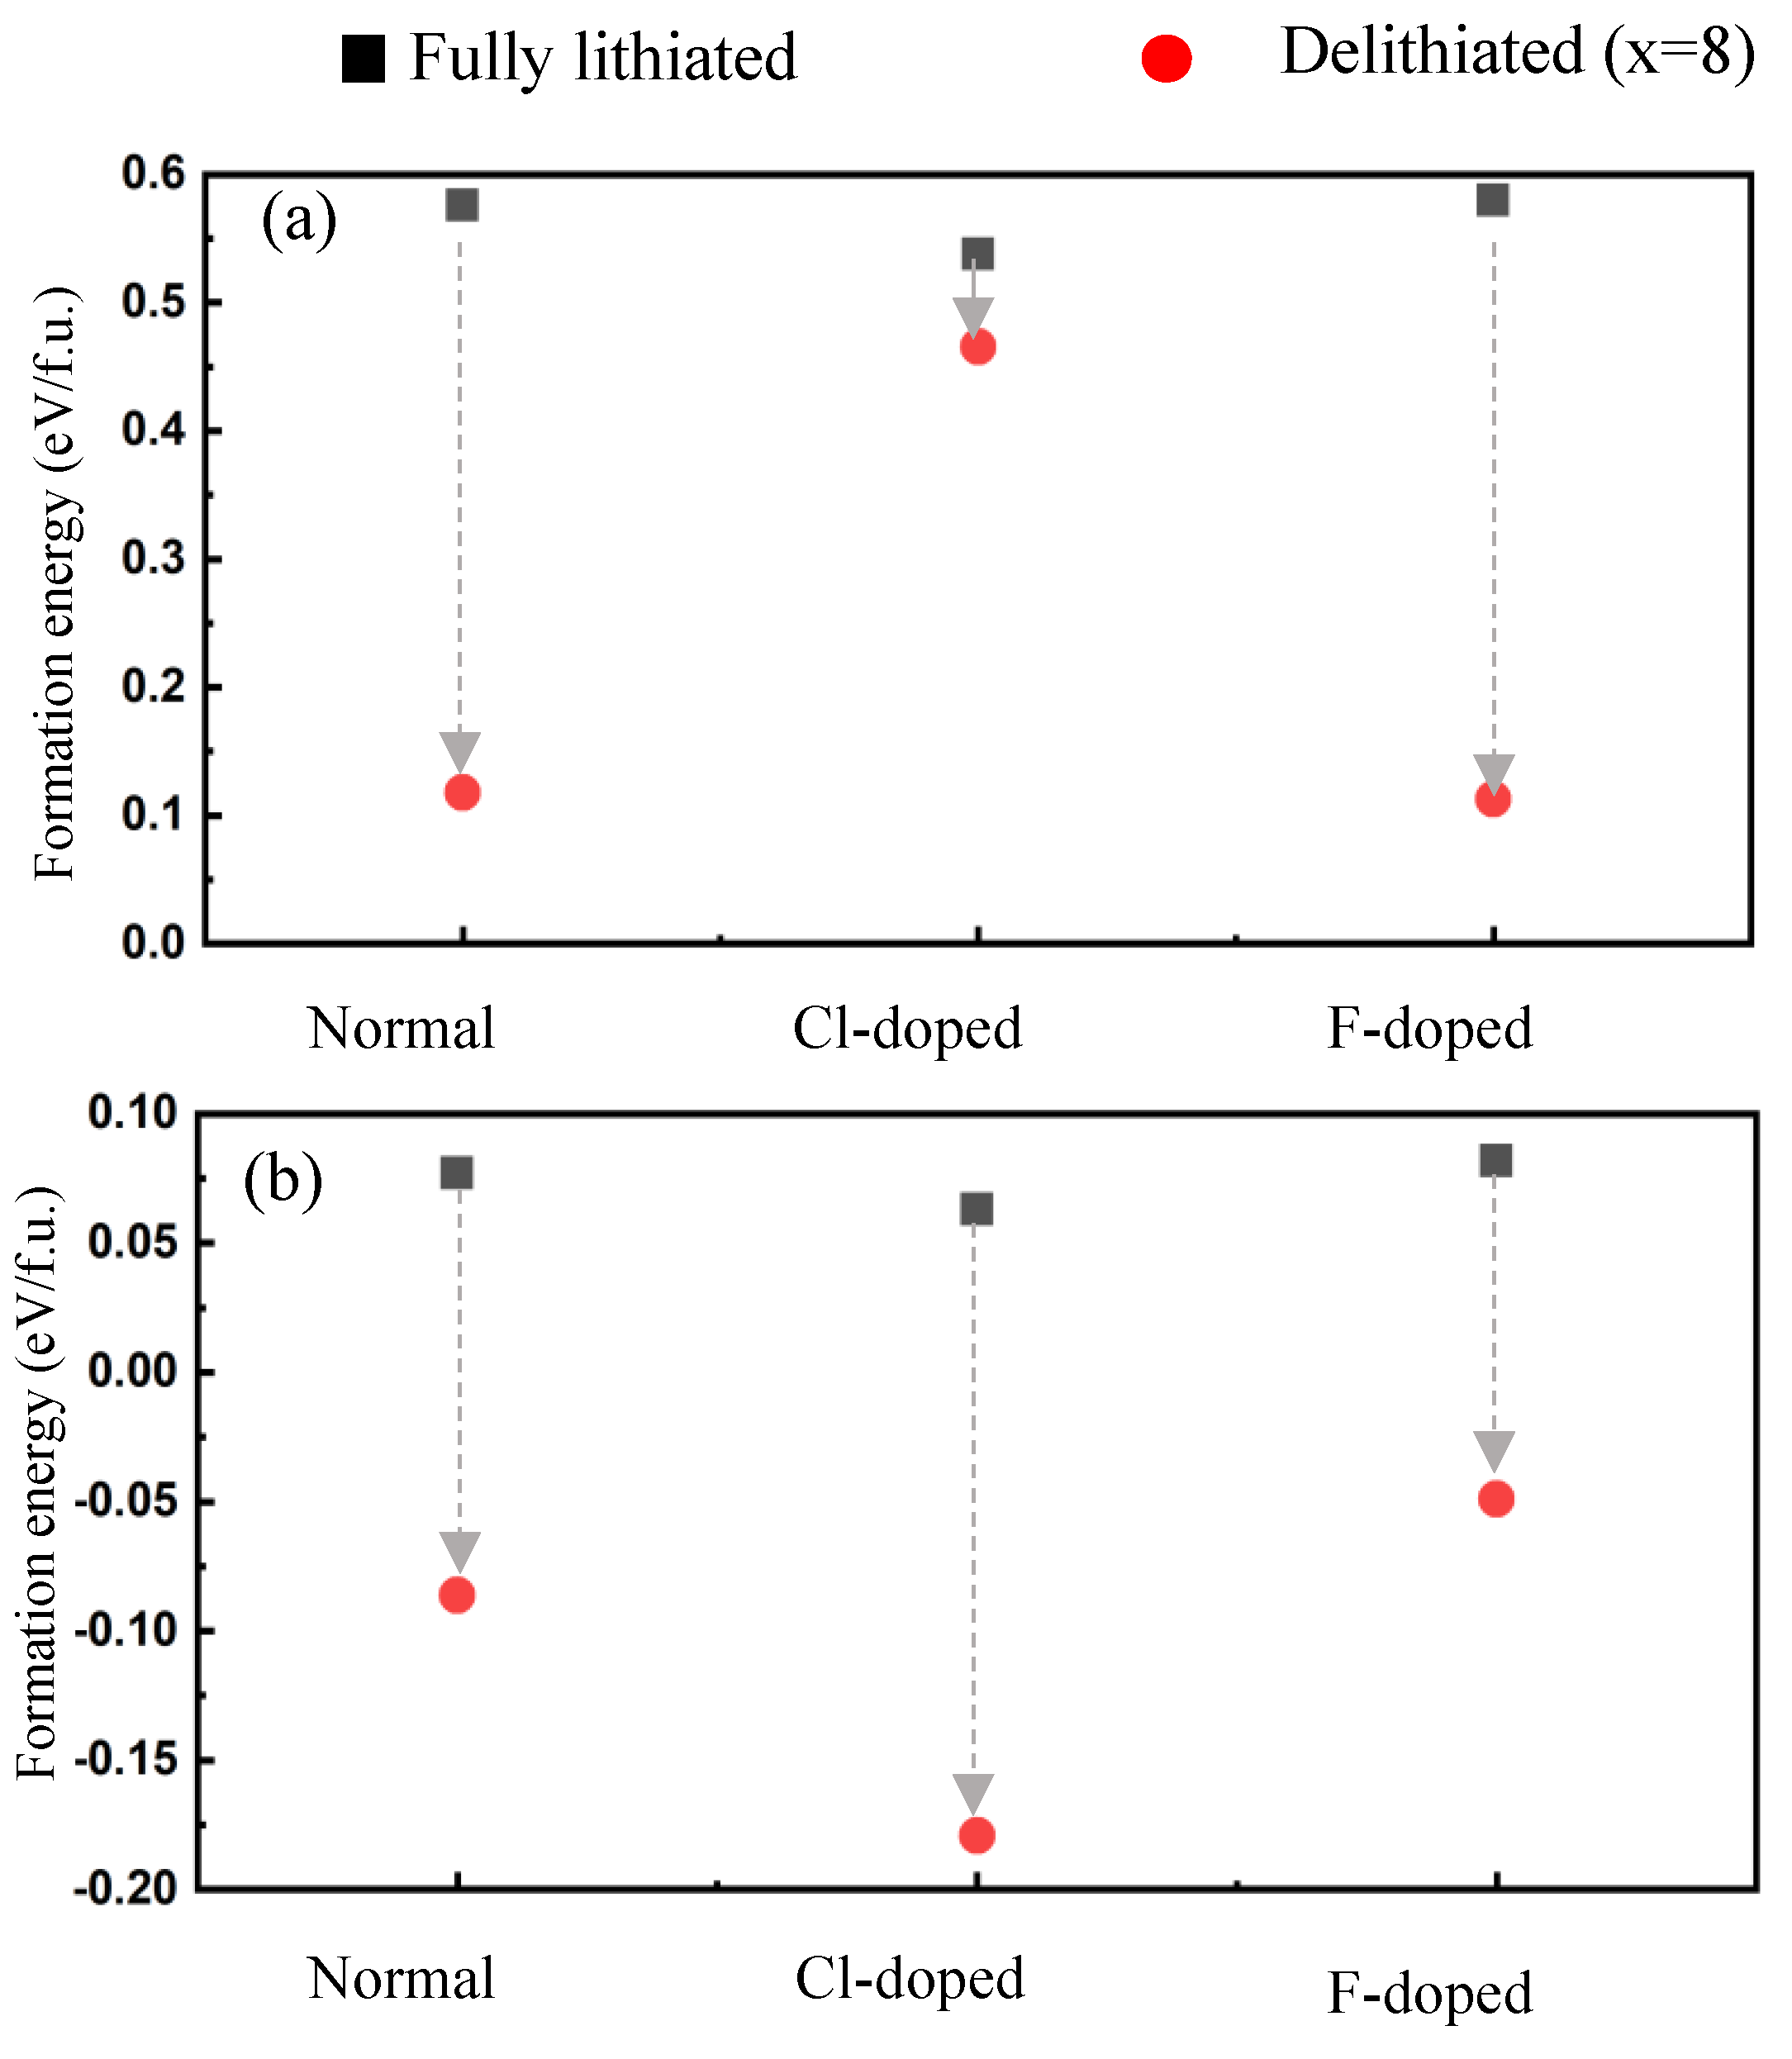
3.3. Typical Defects

Some studies have shown that because of the similar ionic radius of Li+ (r = 0.76 Å) and Ni2+ (r = 0.69 Å), the ternary cathode materials are prone to lithium nickel mixed discharge during material preparation and battery charging and discharging, which will lead to the mixed discharge of Li ions in the “dead lithium” state [31]. In high nickel materials, the mixed arrangement of lithium and nickel is more serious, and the migration of nickel atoms into the lithium layer means the beginning of phase transformation. Serious mixed arrangement of lithium and nickel will lead to the transformation of layered structure into spinel (LiTM2O4, TM3O4, TM = Ni, Co, Mn) structure, and finally form rock salt structure. This phase transition is not what we want to see. In addition, the mixed discharge of Li and Ni results in the “dead lithium” state of some Li ions, which seriously affects the reversible capacity of the material. The formation of oxygen vacancies in cathode materials is an important manifestation of the defects of cathode materials. The liberation of oxygen in the lattice will affect the service life of the battery, resulting in the “bulge” phenomenon of the battery.
Two types of defects are considered, as shown in Figure 9: (a) oxygen vacancy (VO), (b) lithium nickel mixed arrangement (LiNi–NiLi).
The defect formation energy can be calculated according to the following formula:
Δ f E ( V O ) = E ( NCM V O ) + 1 2 E ( O 2 ) E ( NCM )
Δ f E ( Li Ni - Ni Li ) = E ( NCM Li Ni Ni Li ) E ( NCM )
where ΔfE(VO) and ΔfE(LiNi - NiLi) represent the formation energy of oxygen vacancy and Li–Ni mixed arrangement respectively, E( NCM V O ) and E( NCM Li Ni Ni Li ) represent the energy of unit cell with oxygen vacancy and Li–Ni mixed arrangement, E(O2) represents the energy of oxygen, and E(NCM) represents the energy of complete unit cell.
Table 3 and Table 4 show the size of typical defect formation energy in full lithium state and delithiation state respectively. The positive value of the formation energy indicates that the defect can not be formed spontaneously, the larger the value, the more difficult it is to form defects, and the negative value indicates that the defect can be formed spontaneously.
Figure 10 shows more intuitively the change in the defect formation energy in the full lithium state and the delithiated state. During the process of lithium removal, Cl doping can inhibit the formation of oxygen vacancies; F doping has a good inhibitory effect on the Li–Ni mixed arrangement.
In the electrochemical cycling process of cathode materials for lithium-ion batteries, the valence state of transition metal atoms and oxygen atoms must be changed according to the degree of lithium removal to maintain the electrical neutrality of the materials, so the removal of lithium ions is accompanied by the increase in oxygen valence state. As the valence of oxygen atoms in the unit cell increases, the possibility of oxygen vacancy formation increases. Therefore, it is very important to understand the oxidation degree of oxygen atoms in the process of lithium removal.
Figure 11 shows the change in the average valence state of oxygen atom in the process of lithium removal. The lower the average valence state of oxygen atoms, the more difficult it is to be oxidized to zero valence. Based on Bader charge analysis, the change in average charge of oxygen atom in three kinds of cell structure during the process of lithium removal is given. In the process of delithiation, the average valence state of oxygen atom in Cl doped structure is the lowest, Cl atom can effectively inhibit the oxygen precipitation in the unit cell in most delithiation processes.

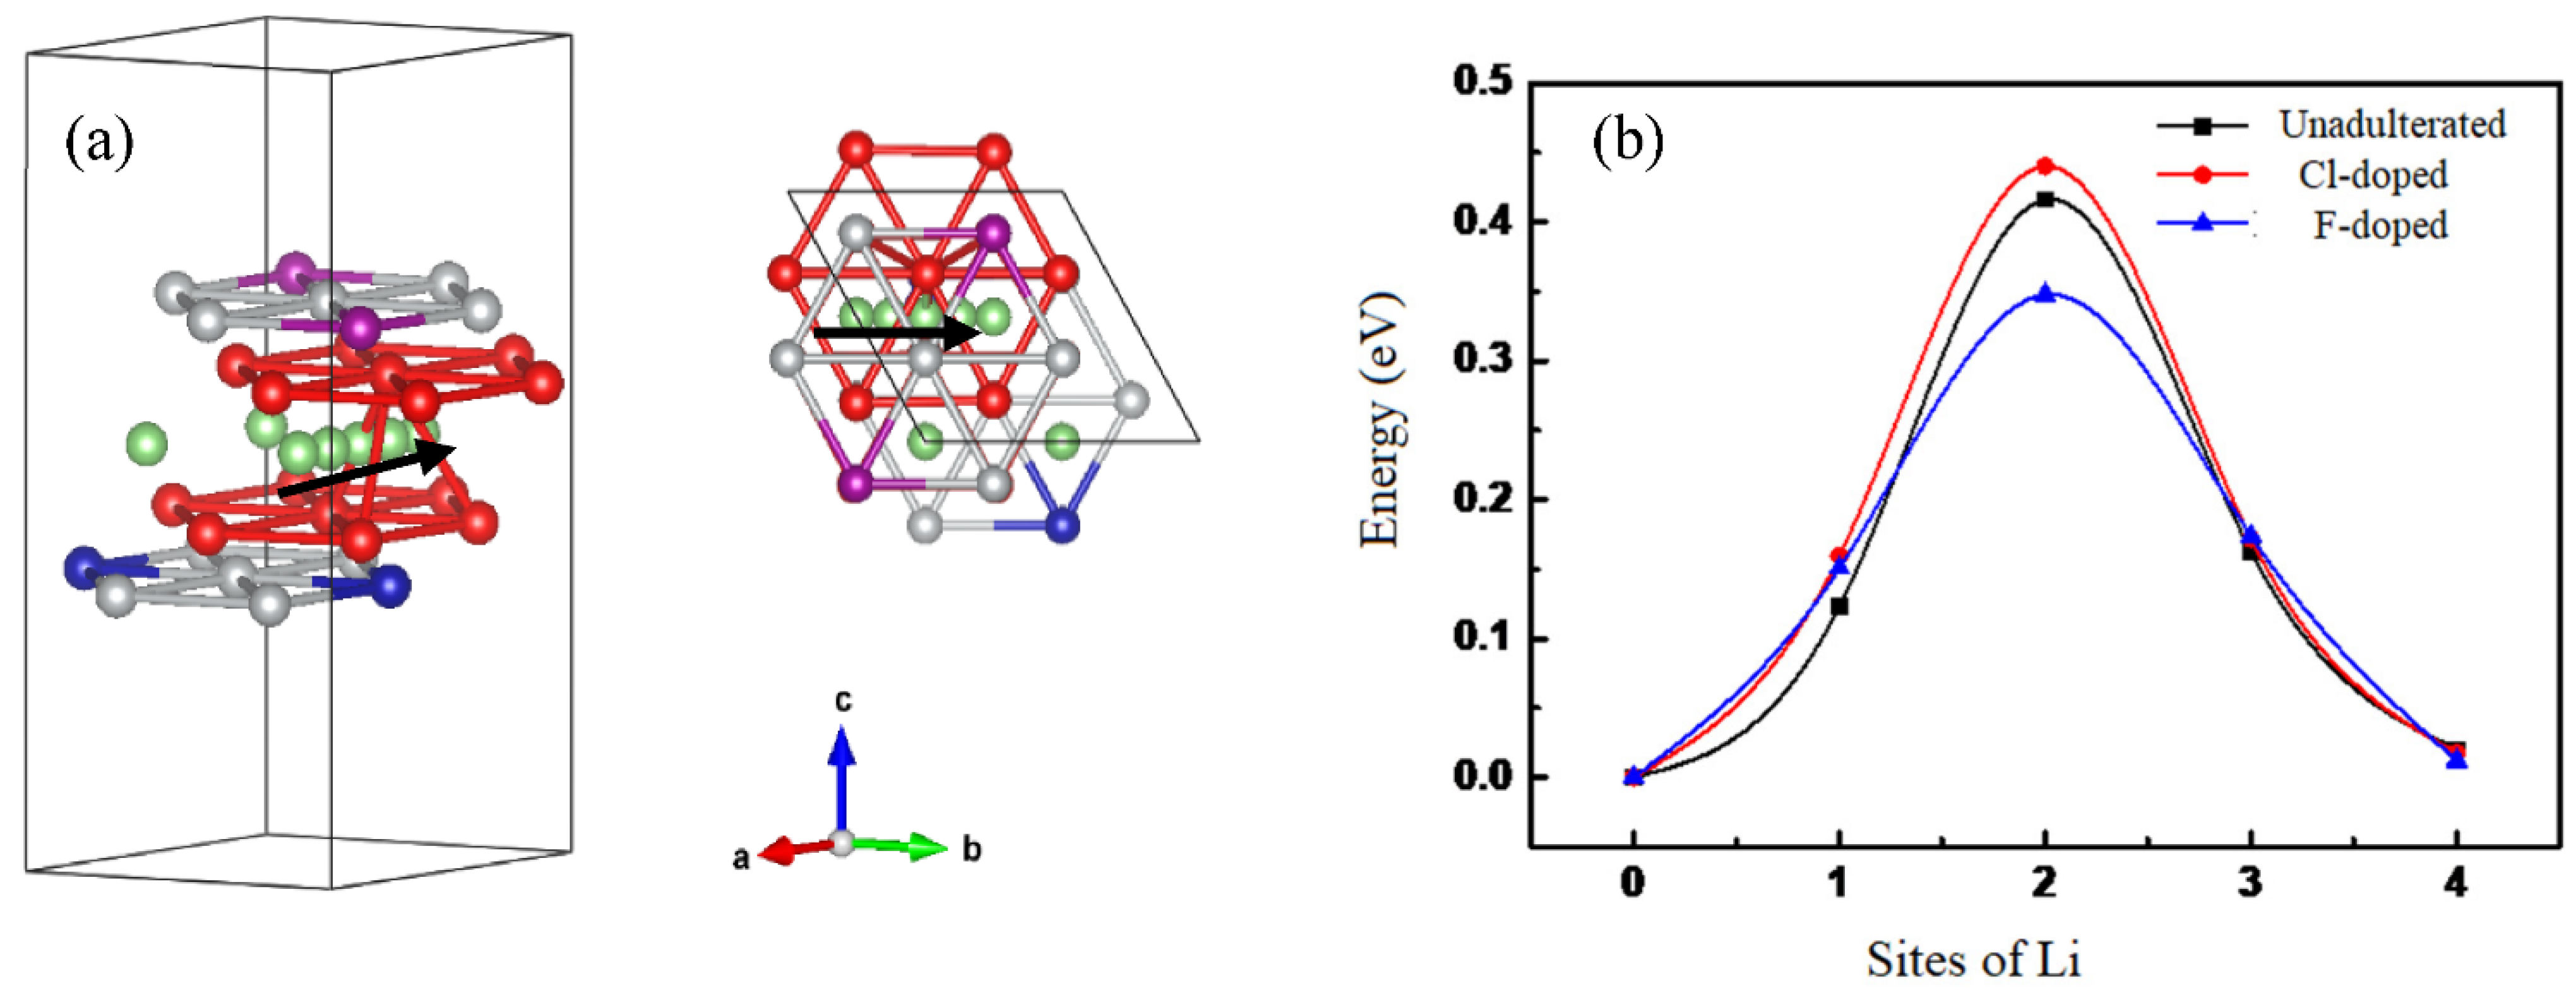
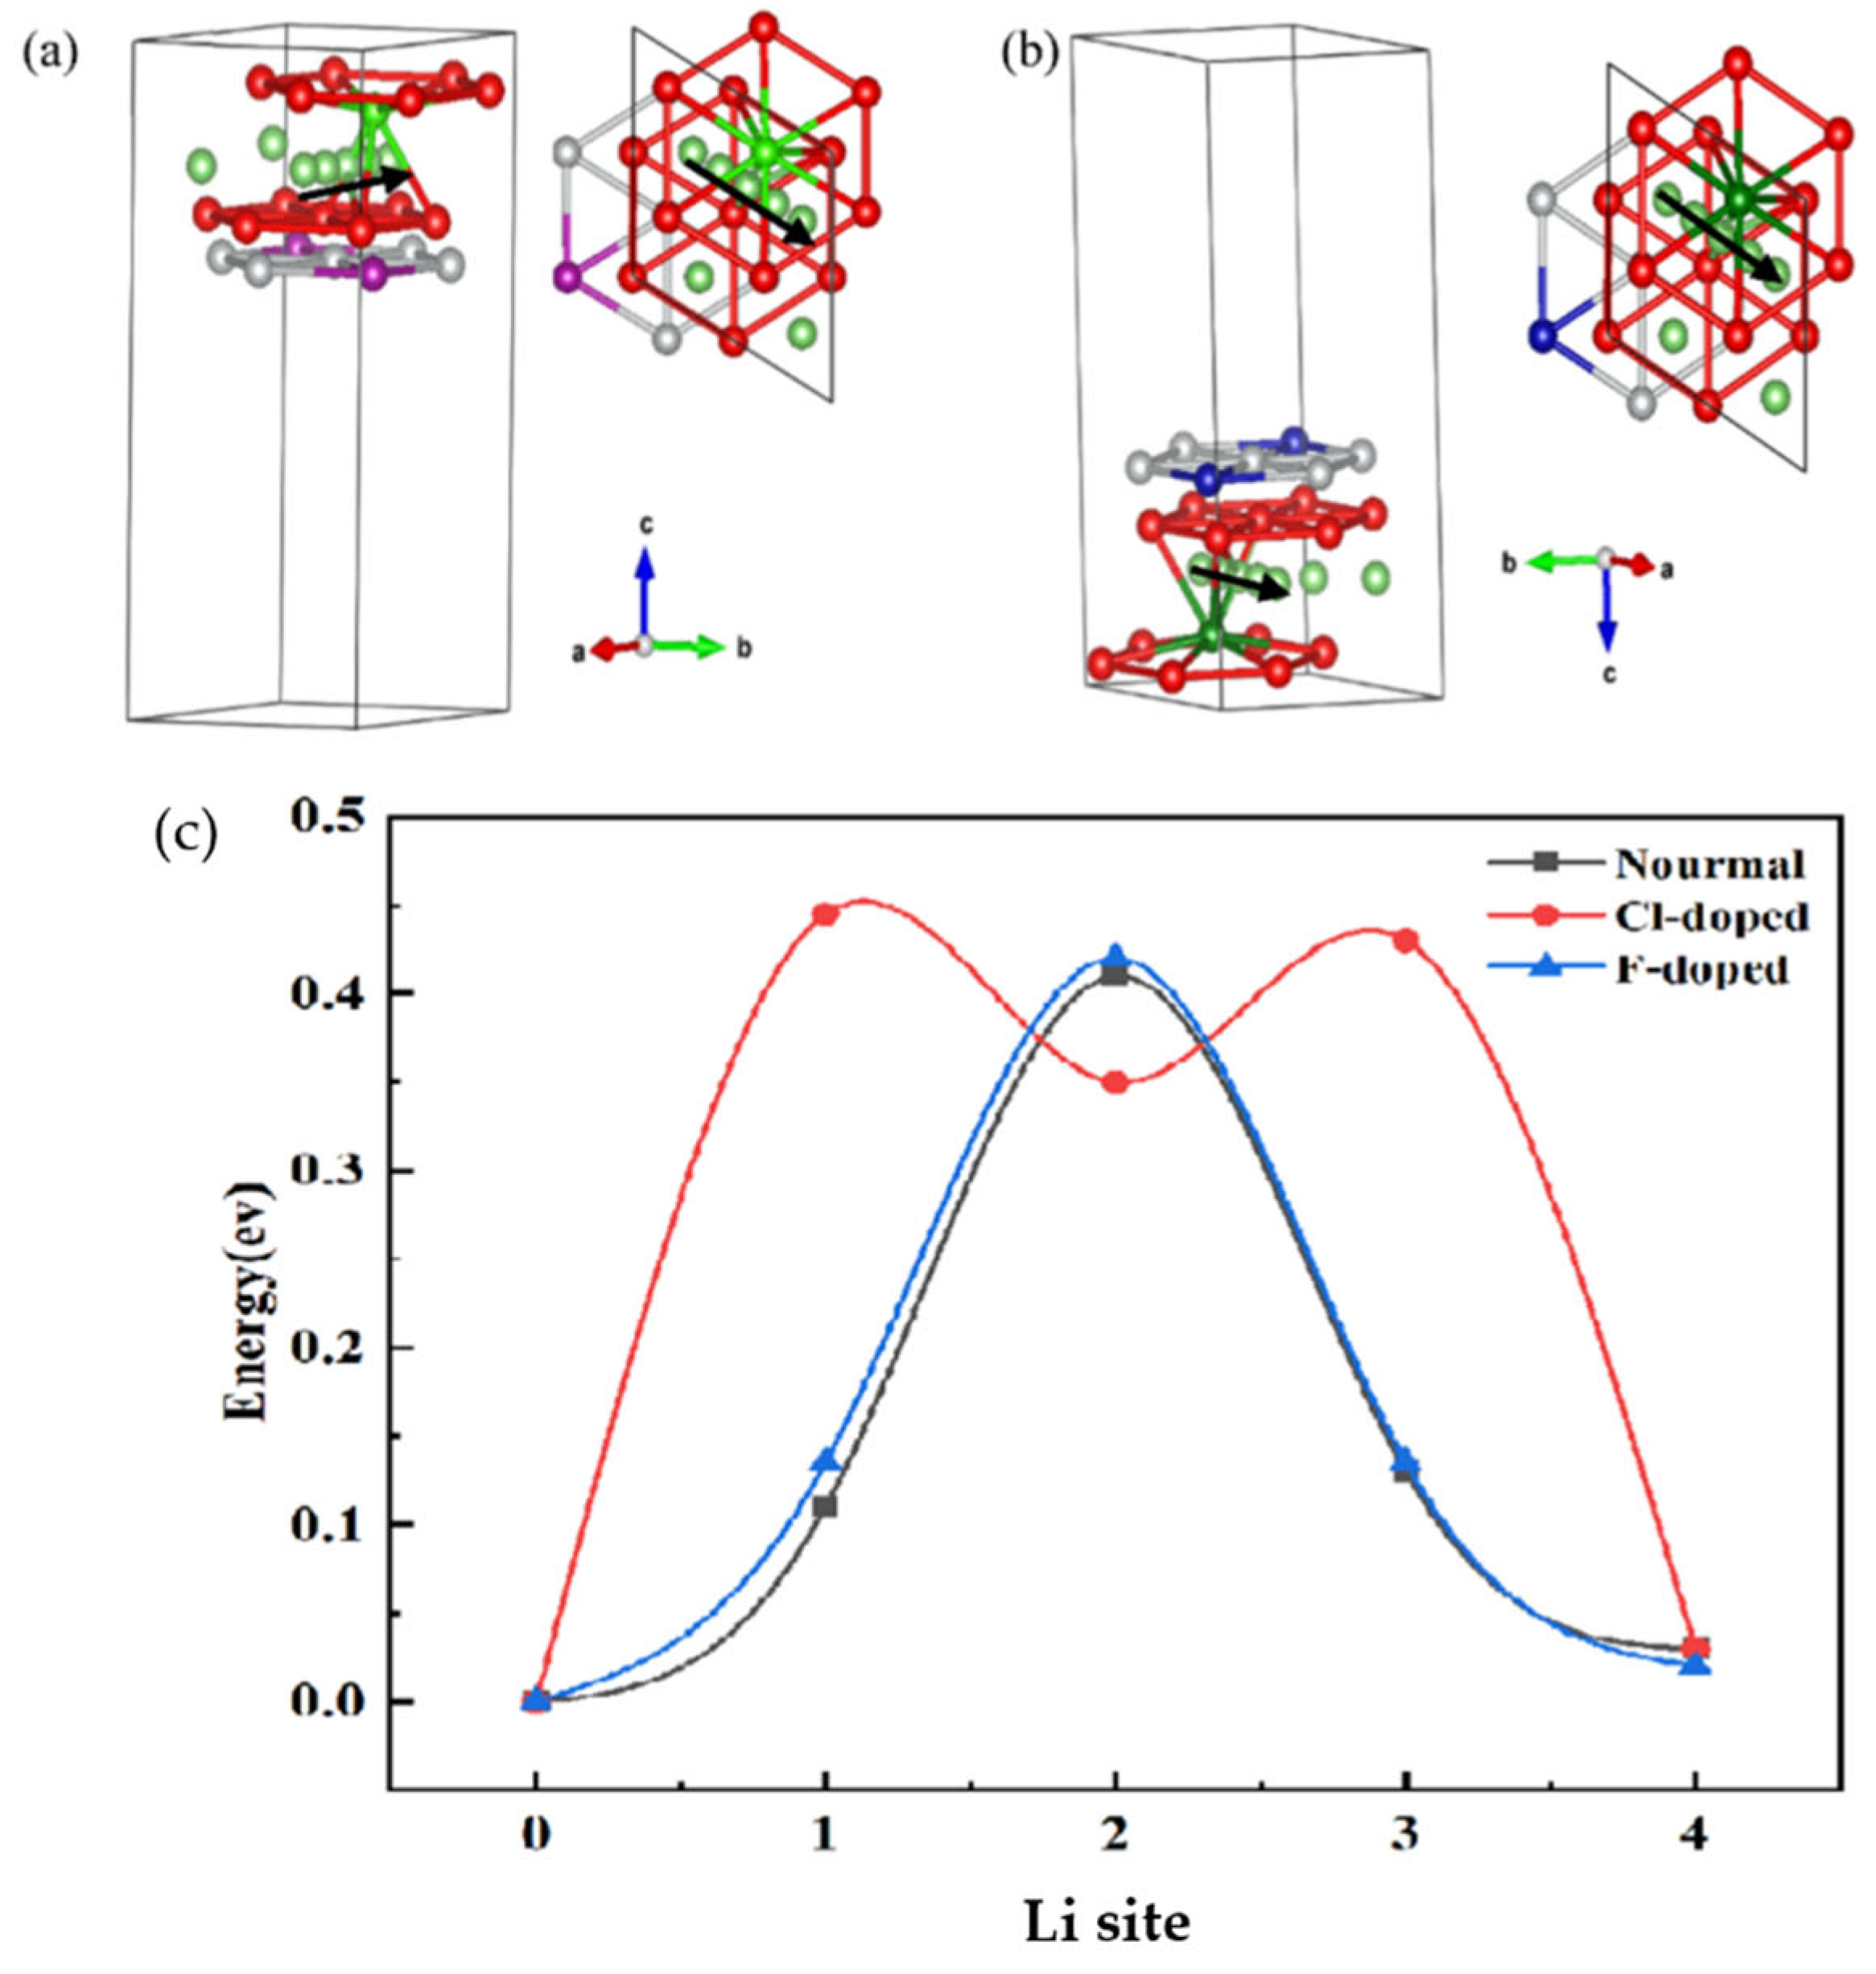
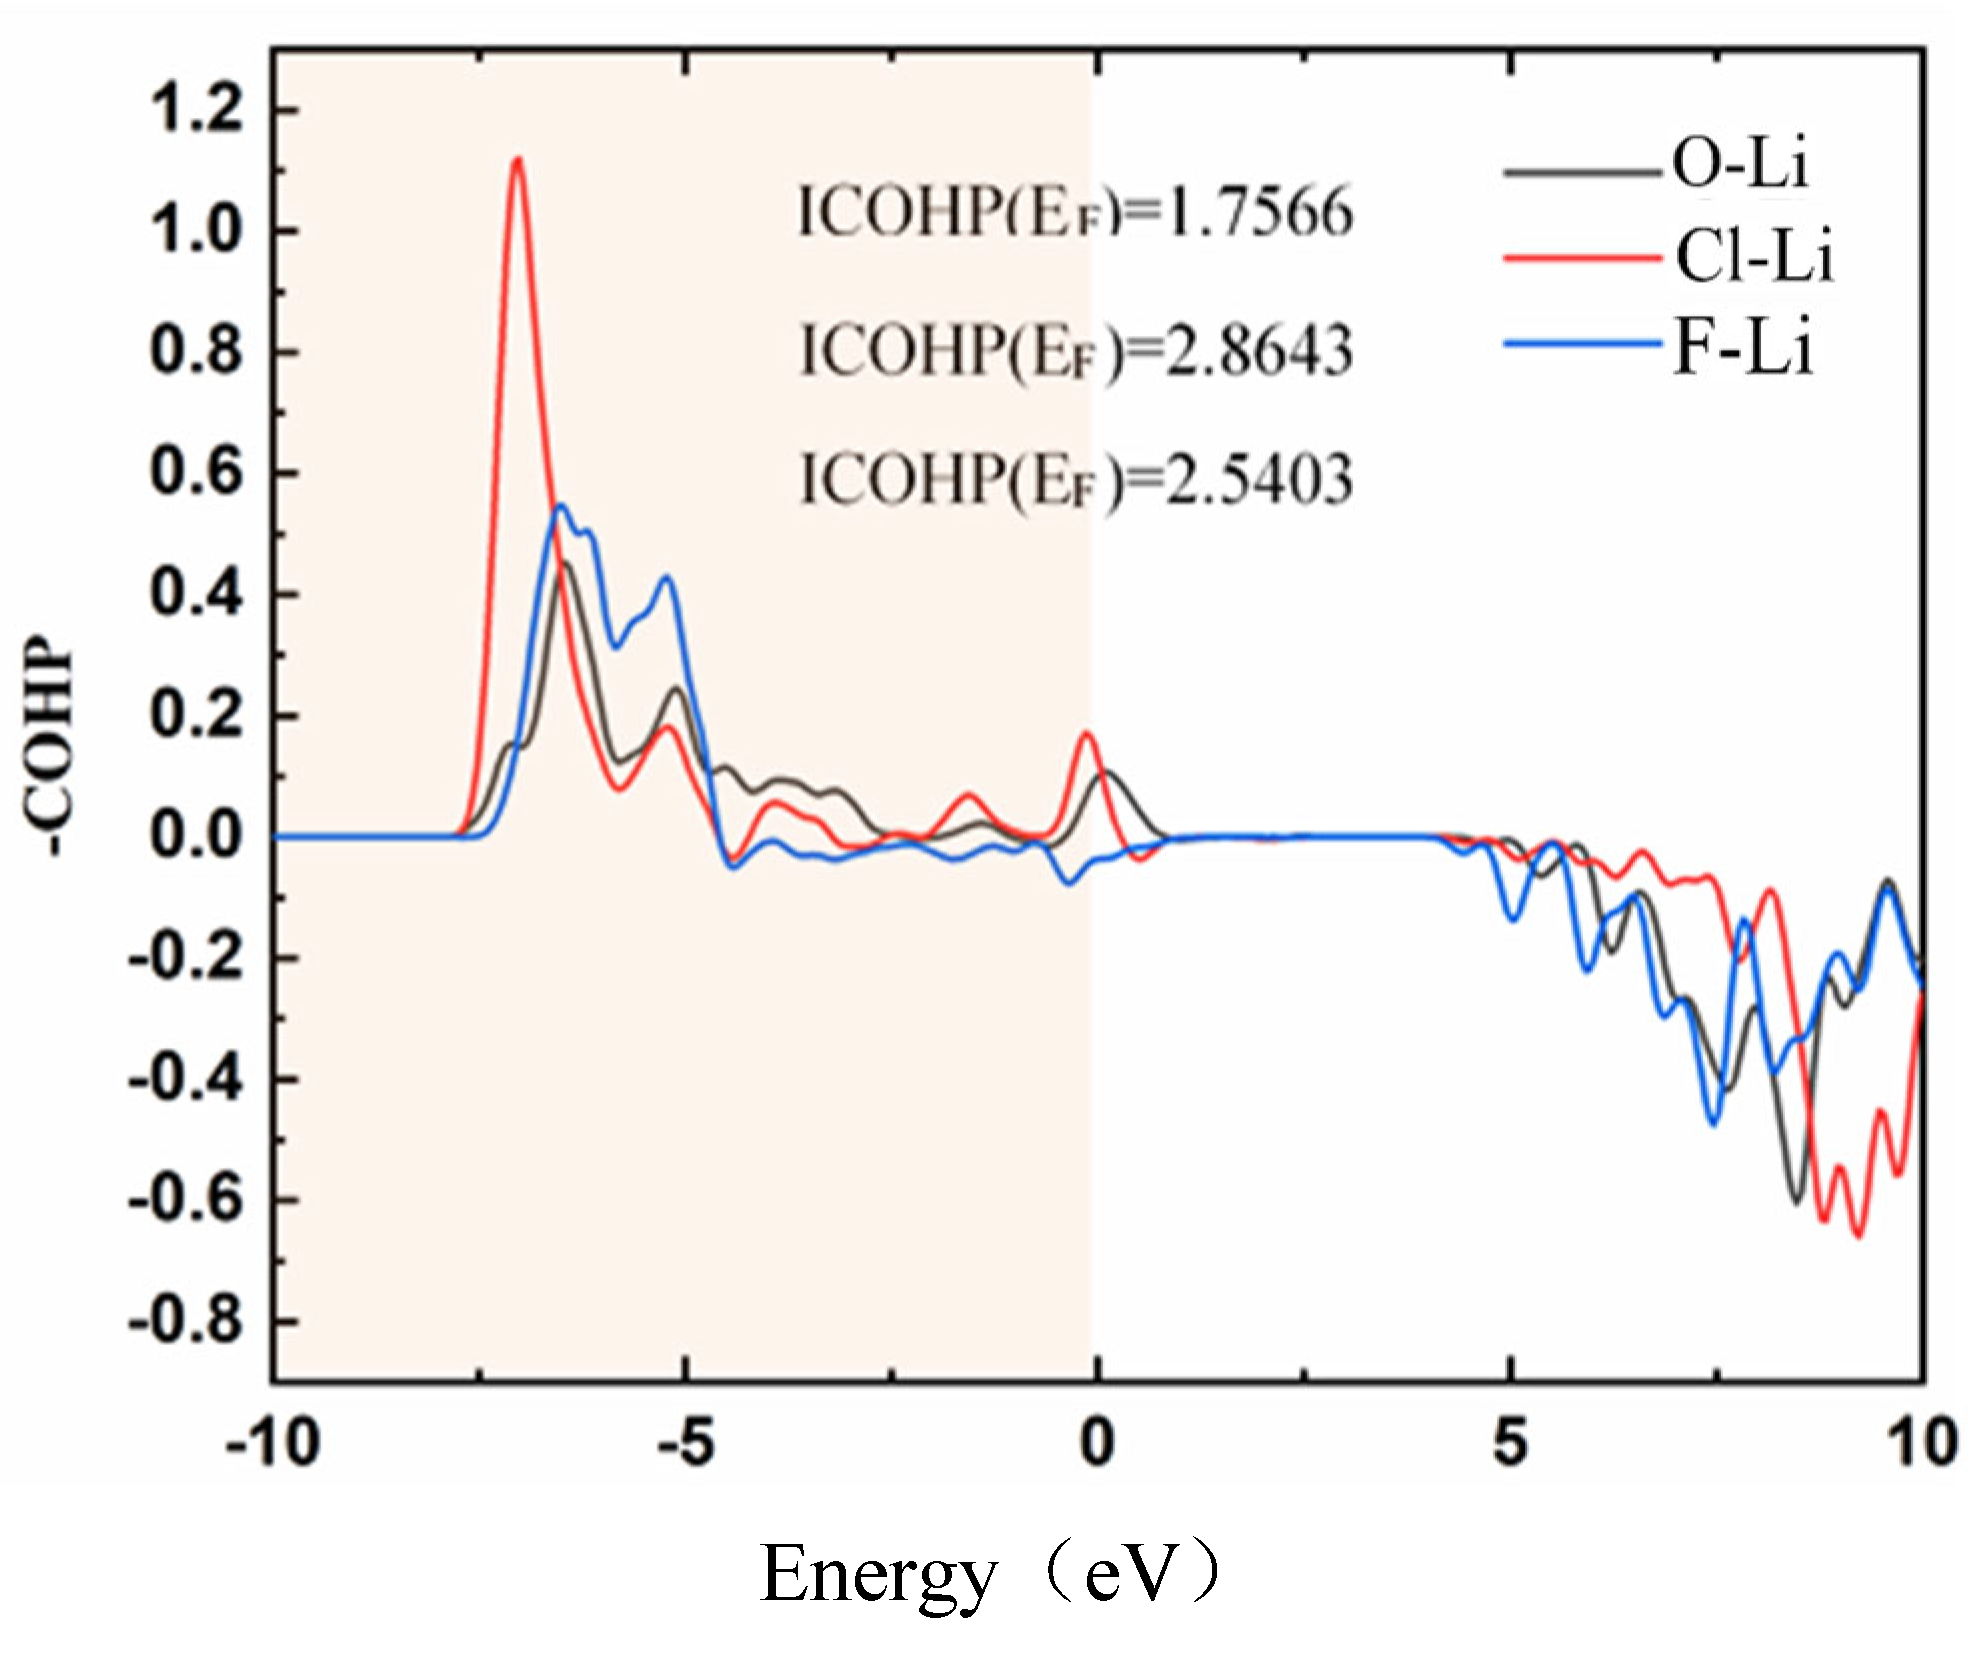
3.4. Diffusion Barrier

In the process of delithiation, Li+ diffuses according to the TSH mechanism, that is, Li+ diffuses from one octahedron to the adjacent octahedron through the intermediate oxygen tetrahedron. In this process, Li+ will encounter strong electrostatic repulsion from nearby atoms [21]. In order to understand the effect of doping atoms on the lithium-ion migration in the cell, we calculated and analyzed the Li diffusion ability of different Li layers (Li layer far away from the doping site and Li layer near the doping atoms) in each cell structure as follows Figure 12.
Cl doping increases the Li migration barrier of Li layer far away from the doping site, which is about +0.024 eV. F doping decreases the Li+ diffusion barrier of Li layer far away from the doping site, which is about −0.069 eV. The tendency of the energy barrier to increase with the change in diffusion channel is called the spatial effect [32,33]. In the calculation of cell structure, the thickness of Li layer far away from doping site of undoped, Cl- and F-doped cell structure is 2.6034 Å, 2.6004 Å (−12%) and 2.6141 Å (+0.41%), respectively. The corresponding diffusion barriers are 0.416 eV, 0.440 eV (+5.8%) and 0.347 eV (−19.6%). In conclusion, in the Li layer far away from the doping site, the size of the energy barrier is mainly affected by the spatial effect. Cl doping leads to the decrease in Li+ diffusion channel and the increase in energy barrier, which reduces the diffusion rate of Li+ in this layer; F doping increases the Li+ diffusion channel and decreases the diffusion barrier, which increases the diffusion rate of Li+ in this layer. The values in brackets are the rate of change relative to the undoped atoms.
Figure 13 shows that in the calculation of cell structure, the thickness of Li layer near the doping site of undoped, Cl and F-doped cell structure are 2.6102 Å, 2.4722 Å (−5.3%) and 2.2831 Å (−12.5%), respectively. The corresponding diffusion barriers are 0.387 eV, 0.463 eV (+19.6%) and 0.408 eV (−5.4%). In the Li layer near the doping site, the influence of space effect cannot fully explain the influence of doping atoms on the energy barrier. The COHP diagram is used to further explain the change in diffusion barrier of Li after doping.
Figure 14 shows the COHP diagram of O–Li, Cl–Li and F–Li. In the energy range of −10 eV to 0 eV, the integral area of the curve and y = 0 can indicate the strength of the bond between atoms. A positive value indicates the stable chemical bond between two atoms. The higher the value is, the stronger the electrostatic interaction between the bonded atoms is. The ICOHP(EF) of O-Li, Cl-Li and F-Li are 1.7566, 2.8643 and 2.5403, respectively. Therefore, near the doping sites, the electrostatic interaction of the bond atoms is enhanced, resulting in the increase in Li+ diffusion barrier and Li+ diffusion resistance.
In conclusion, F doping can increase the diffusion rate of Li+ in Li layer far away from the doping site, mainly because F doping broadens the diffusion channel of Li+. F doping reduces the diffusion rate of Li near the doping site, mainly due to the narrowing of the diffusion channel of Li+ and the enhancement of electrostatic interaction. However, Cl doping leads to the increase in Li+ diffusion barrier and the decrease in Li+ diffusion rate.

4. Conclusions

The effects of Cl and F doping on the potential, cell structure, typical defects and Li+ diffusion barrier of LiNi0.83Co0.08Mn0.08O2 were studied. F doping can effectively improve the delithiation potential of the material from 3.64 V to 3.76 V, and the voltage is relatively stable during the delithiation process, which is helpful to improve the energy density of the material. Cl doping leads to the decrease in the potential and the deterioration of the voltage stability. F doping can improve the stability of the unit cell in the process of lithium removal, and reduce the influence of the poor stability of the unit cell on the cycle performance of the material. Cl doping is just the opposite. From the whole process of lithium removal, F doping can reduce the Li–Ni mixed arrangement of LiNi0.83Co0.08Mn0.08O2. Cl doping can inhibit the formation of oxygen vacancies and the further degradation of the material, that is, when oxygen vacancies or Li–Ni mixed arrangement occurs, the possibility of another defect in the cell decreases. F doping broadens the diffusion channel of Li+ in the Li layer far away from the doping position and reduces the diffusion resistance of Li+ in the Li layer. F doping enhances the electrostatic effect of Li+ in the diffusion process near the doping region and improves the diffusion resistance of Li+ in the layer. Cl doping leads to the enhancement of Li diffusion resistance in each Li layer, which is mainly due to the narrowing of the Li+ diffusion channel in the Li layer far away from the doping position, and the enhancement of electrostatic effect in the Li+ diffusion process near the doping atoms.

Author Contributions

Data curation, B.C.; Formal analysis, C.Y.; Funding acquisition, B.C.; Investigation, C.Z.; Methodology, C.Y. and C.Z.; Resources, B.C.; Software, C.Z. and M.L.; Supervision, M.L.; Writing—original draft, C.Y. All authors have read and agreed to the published version of the manuscript.

Funding

This research received no external funding.

Institutional Review Board Statement

Not applicable.

Informed Consent Statement

Not applicable.

Data Availability Statement

Not applicable.

Conflicts of Interest

The authors declare no conflict of interest.

References

  1. Anwar, A.; Iratxe, D.M.; Andriy, K.; Garcia-Calvo, O.; Ahmed, I.; Sgroi, M.F.; Giuliano, M.; Dotoli, M.; Dumitrescu, M.-A.; Jahn, M.; et al. Progress in solid-state high voltage lithium-ion battery electrolytes. Adv. Appl. Energy 2021, 4, 100070. [Google Scholar]
  2. Shi, S.J.; Tu, J.P.; Mai, Y.J.; Zhang, Y.Q.; Tang, Y.Y.; Wang, X.L. Structure and electrochemical performance of CaF2 coated LiMn1/3Ni1/3Co1/3O2 cathode material for Li-ion batteries. Electrochim. Acta 2012, 83, 105–112. [Google Scholar] [CrossRef]
  3. Noh, H.-J.; Youn, S.; Yoon, C.S.; Sun, Y.-K. Comparison of the structural and electrochemical properties of layered Li[NixCoyMnz]O2 (x = 1/3, 0.5, 0.6, 0.7, 0.8 and 0.85) cathode material for lithium-ion batteries. J. Power Sources 2013, 233, 121–130. [Google Scholar] [CrossRef]
  4. Giffin, G.A.; Moretti, A.; Jeong, S.; Passerini, S. Decoupling effective Li+ ion conductivity from electrolyte viscosity for improved room-temperature cell performance. J. Power Sources 2017, 342, 335–341. [Google Scholar] [CrossRef]
  5. Kondo, H.; Takeuchi, Y.; Sasaki, T.; Kawauchi, S.; Itoua, Y.; Hiruta, O.; Okuda, C.; Yonemura, M.; Kamiyama, T.; Ukyo, Y. Effects of Mg-substitution in Li(Ni,Co,Al)O2 positive electrode materials on the crystal structure and battery performance. J. Power Sources 2007, 174, 1131–1136. [Google Scholar] [CrossRef]
  6. Chen, J.; Yang, H.; Li, T. The Effects of Reversibility of H2-H3 Phase Transition on Ni-Rich Layered Oxide Cathode for High-Energy Lithium-Ion Batteries. Front. Chem. 2019, 7, 500. [Google Scholar] [CrossRef]
  7. Gao, S.; Zhan, X.; Cheng, Y.-T. Structural, electrochemical and Li-ion transport properties of Zr-modified LiNi0.8Co0.1Mn0.1O2 positive electrode materials for Li-ion batteries. J. Power Sources 2019, 410, 45–52. [Google Scholar] [CrossRef]
  8. Zheng, J.M.; Wu, X.B.; Yang, Y. Improved electrochemical performance of Li[Li0.2Mn0.54Ni0.13Co0.13]O2 cathode material by fluorine incorporation. Electrochim. Acta 2013, 105, 200–208. [Google Scholar] [CrossRef]
  9. Liu, S.X.; Zhang, H.L. Effect of Chlorine Doping on Structure and Electrochemical Properties of LiNi1/3CO1/3Mn1/3O2 Cathode Material. Rare Met. Mater. Eng. 2013, 42, 296–300. [Google Scholar]
  10. Nosengo, N. The Material Code. Nature 2016, 533, 22–25. [Google Scholar] [CrossRef]
  11. Umebayashi, Y.; Mitsugi, T.; Fukuda, S.; Fujimori, T.; Fujii, K.; Kanzaki, R.; Takeuchi, M.; Ishiguro, S.-I. Lithium Ion Solvation in Room-Temperature Ionic Liquids Involving Bis(trifluoromethanesulfonyl) Imide Anion Studied by Raman Spectroscopy and DFT Calculations. J. Phys. Chem. B 2007, 111, 13028–13032. [Google Scholar] [CrossRef] [PubMed]
  12. Liu, W.; Xu, H.; Zhou, Q.; Dai, Y.; Hu, W.; Li, H. The Performance of Ni-Doped Spinel-Type LiMn2O4 for Li-Ion Batteries: First-Principles Calculation. J. Electron. Mater. 2020, 49, 5523–5527. [Google Scholar] [CrossRef]
  13. Sgroi, M.F.; Lazzaroni, R.; Beljonne, D.; Pullini, D. Doping LiMnPO4 with Cobalt and Nickel: A First Principle Study. Batteries 2017, 3, 11. [Google Scholar] [CrossRef]
  14. Luo, G.; Zhao, J.; Ke, X.; Zhang, P.; Sun, H.; Wang, B. Structure, Electrode Voltage and Activation Energy of LiMnxCoyNi1-x-yO2 Solid Solutions as Cathode Materials for Li Batteries from First-Principles. J. Electrochem. Soc. 2012, 159, A1203–A1208. [Google Scholar] [CrossRef]
  15. Dixit, M.; Markovsky, B.; Aurbach, D.; Major, D.T. Unraveling the Effects of Al Doping on the Electrochemical Properties of LiNi0.5Co0.2Mn0.3O2 Using First Principles. J. Electrochem. Soc. 2017, 164, A6359–A6365. [Google Scholar] [CrossRef]
  16. Park, K.; Park, J.-H.; Hong, S.-G.; Choi, B.; Seo, S.-W.; Park, J.-H.; Min, K. Enhancement in the electrochemical performance of zirconium/phosphate bi-functional coatings on LiNi0.8Co0.15Mn0.05O2 by the removal of Li residuals. Phys. Chem. Chem. Phys. 2016, 18, 29076–29085. [Google Scholar] [CrossRef] [PubMed]
  17. Kim, G.H.; Kim, M.H.; Myung, S.T.; Sun, Y.K. Effect of fluorine on Li[Ni1/3Co1/3Mn1/3]O2-zFz as lithium intercalation material. J. Power Sources 2005, 164, 602–605. [Google Scholar] [CrossRef]
  18. He, Y.S.; Pei, L.; Liao, X.Z.; Ma, Z.F. Synthesis of LiNi1/3Co1/3Mn1/3O2-zFz, cathode material from oxalate precursors for lithium ion battery. J. Fluor. Chem. 2007, 128, 139–143. [Google Scholar] [CrossRef]
  19. Blöchl, P.E. Projector augmented-wave method. Phys. Rev. B 1994, 50, 17953–17979. [Google Scholar] [CrossRef]
  20. Chadi, D.J. Special points for Brillouin-zone integrations. Phys. Rev. B 1977, 16, 1746–1747. [Google Scholar] [CrossRef]
  21. Ven, A.V.D.; Ceder, G. Lithium diffusion mechanisms in layered intercalation compounds. J. Power Sources 2001, 97, 529–531. [Google Scholar]
  22. Whitfield, P.S.; Davidson, I.J.; Cranswick, L.M.D.; Swainson, I.P.; Stephens, P.W. Investigation of possible superstructure and cation disorder in the lithium battery cathode material LiMn1/3Ni1/3Co1/3O2 using neutron and anomalous dispersion powder diffraction. Solid State Ion. 2005, 176, 463–471. [Google Scholar] [CrossRef]
  23. Hohenberg, P.C.; Kohn, W. Inhomogeneous Electron Gas. Phys. Rev. 1964, 136, B864. [Google Scholar] [CrossRef] [Green Version]
  24. Novikov, P.A.; Kim, A.E.; Pushnitsa, K.A.; Wang, Q.; Maksimov, M.Y.; Popovich, A.A. Study of Structural Changes in LiNi0.8Co0.1Mn0.1O2 Cathode Material for Lithium-Ion Batteries by X-Ray Diffraction Analysis in the In Situ Mode. Russ. J. Appl. Chem. 2019, 92, 1013–1019. [Google Scholar] [CrossRef]
  25. Min, K.; Kim, K.; Jung, C.; Seo, S.-W.; Song, Y.Y.; Lee, H.S.; Shin, J.; Cho, E. A comparative study of structural changes in lithium nickel cobalt manganese oxide as a function of Ni content during delithiation process. J. Power Sources 2016, 315, 111–119. [Google Scholar] [CrossRef]
  26. Aydinol, M.K.; Kohan, A.F.; Ceder, G. Ab initio calculation of the intercalation voltage of lithium-transition-metal oxide electrodes for rechargeable batteries. J. Power Sources 1997, 68, 664–668. [Google Scholar] [CrossRef]
  27. Yue, P.; Wang, Z.; Li, X.; Xiong, X.; Wang, J.; Wu, X.; Guo, H. The enhanced electrochemical performance of LiNi0.6Co0.2Mn0.2O2 cathode materials by low temperature fluorine substitution. Electrochim. Acta 2013, 95, 112–118. [Google Scholar] [CrossRef]
  28. Reimers, J.N. Electrochemical and In Situ X-Ray Diffraction Studies of Lithium Intercalation in LixCoO2. J. Electrochem. Soc. 1992, 139, 2091–2097. [Google Scholar] [CrossRef]
  29. Longo, R.C.; Kong, F.T.; Santosh, K.C.; Park, M.S.; Yoon, J.; Yeon, D.H.; Park, J.-H.; Doo, S.-G.; Cho, K. Phase stability of Li-Mn-O oxides as cathode materials for Li-ion batteries: Insights from ab initio calculations. Phys. Chem. Chem. Phys. 2014, 16, 11233–11242. [Google Scholar] [CrossRef]
  30. Koyama, Y.; Tanaka, I.; Adachi, H.; Makimura, Y.; Ohzuku, T. Crystal and electronic structures of superstructural Li1x[Co1/3Ni1/3Mn1/3]O2 (0 ≤ x ≤ 1). J. Power Sources 2003, 119–121, 644–648. [Google Scholar] [CrossRef]
  31. Li, J.; Downie, L.E.; Ma, L.; Qiu, W.; Dahn, J.R. Study of the Failure Mechanisms of LiNi0.8Mn0.1Co0.1O Cathode Material for Lithium-ion Batteries. J. Electrochem. Soc. 2015, 162, A1401–A1408. [Google Scholar] [CrossRef]
  32. Kang, K.; Ceder, G. Factors that affect Li mobility in layered lithium transition metal oxides. Phys. Rev. B 2006, 74, 094105. [Google Scholar] [CrossRef]
  33. Kang, K. Electrodes with High Power and High Capacity for Rechargeable Lithium Batteries. Science 2006, 311, 977–980. [Google Scholar] [CrossRef] [PubMed]
Figure 1. (ad) shows four possible atomic arrangements of NCM811.
Crystals 12 01297 g001
Figure 2. Formation energies of substitution of Cl and F atoms for different O layers.
Crystals 12 01297 g002
Figure 3. Cell structure diagram: (a) NCM811-Intermediates, (b) NCM811-Intermediates-Cl, (c) NCM811-Intermediates-F.
Crystals 12 01297 g003
Figure 4. The arrangement of Li.
Crystals 12 01297 g004
Figure 5. Delithiation potential in the process of delithiation.
Crystals 12 01297 g005
Figure 6. Changes of unit cell parameters during delithiation.
Crystals 12 01297 g006
Figure 7. Average thickness change in TM layer in the process of lithium removal.
Crystals 12 01297 g007
Figure 8. Variation of average thickness of Li layer during lithium removal.
Crystals 12 01297 g008
Figure 9. Schematic diagram of two typical defects (a) oxygen vacancy (VO), (b) lithium nickel mixed arrangement (LiNi–NiLi).
Crystals 12 01297 g009
Figure 10. Defect forming energy: (a) VO; (b) LiNiNiLi.
Crystals 12 01297 g010
Figure 11. The variation of average valence state of oxygen during lithium removal.
Crystals 12 01297 g011
Figure 12. The lithium diffusion profiles of Unadulterated, Cl-doped and F-doped atoms in the lithium layer far away from the doping site. (a) the TSH diffusion pathway of Li, (b) The NEB energy profiles. Color code for spheres: green—Li atoms, grey—Ni atoms, violet—Mn atoms, red—O atoms, blue—Co atoms. The arrow indicates the diffusion path of Li1 to Li5.
Crystals 12 01297 g012
Figure 13. Diffusion distribution of Normal, Cl-doped and F-doped cells in lithium layer near doping position.(a) the TSH diffusion pathway of Li in Cl-doped, (b) the TSH diffusion pathway of Li in F-doped, (c) The NEB energy profiles. Color code for spheres: green-Li atoms, grey-Ni atoms, violet-Mn atoms, red-O atoms, blue-Co atoms, Light green-Cl atom, Dark green-F atom. The arrow indicates the diffusion path of Li1 to Li5.
Crystals 12 01297 g013
Figure 14. The COHP of O-Li, Cl-Li and F-Li.
Crystals 12 01297 g014
Table 1. Cell parameters of NCM811-Intermediates obtained by different methods.
MothodParameters
a (Å)c (Å)c/aα (°)β (°)γ (°)
DFT2.88414.0724.99090120
experiment [24]2.87314.2034.99090120
The error of a-axis and c-axis is less than 1%, and c/a is more than 4.9. The material has a well-layered structure, which proves that the structure of unit cell is reasonable.
Table 2. Delithiation potential in the process of delithiation.
Voltage (V)x = 1x = 2x = 3x = 4x = 5x = 6x = 7x = 8AverageΔV = Vx=1 − Vx=8
NCM811-Intermediates2.883.043.203.283.854.054.304.453.641.57
NCM811-Intermediates-Cl2.452.522.782.903.553.554.054.253.261.80
NCM811-Intermediates-F3.043.093.253.513.944.214.414.603.761.56
Table 3. Typical defect formation energy of full lithium state.
Formation Energy (eV)NormalCl-DopedF-Doped
VO0.576 (6.911)0.538 (6.455)0.580 (6.958)
VO → LiNi–NiLi0.035 (0.421)0.077 (0.921)0.035 (0.421)
LiNi–NiLi0.077 (0.922)0.063 (0.752)0.082 (0.984)
LiNi–NiLi → VO0.627 (7.529)0.930 (11.162)0.660 (7.924)
Table 4. Formation energy of typical defects in delithiation state.
Formation Energy (eV) Normal Cl-Doped F-Doped
VO0.118 (1.411)0.466 (5.597)0.113 (1.350)
VO→LiNi–NiLi0.067 (0.806)−0.385 (−4.618)0.076 (0.911)
LiNi–NiLi−0.086 (−1.026)−0.179 (−2.151)−0.049 (−0.586)
LiNi–NiLi→VO0.432 (5.186)0.428 (5.131)0.434 (5.202)
Publisher’s Note: MDPI stays neutral with regard to jurisdictional claims in published maps and institutional affiliations.

