Article

Computational Investigation of the Stability of Di-p-Tolyl Disulfide “Hidden” and “Conventional” Polymorphs at High Pressures

by
Valeriya Yu. Smirnova
1,2,
Anna A. Iurchenkova
1,3 and
Denis A. Rychkov
1,2,*
1
Laboratory of Mechanochemistry, Institute of Solid State Chemistry and Mechanochemistry, SB RAS, Kutateladze 18, 630090 Novosibirsk, Russia
2
Laboratory of Physicochemical Fundamentals of Pharmaceutical Materials, Novosibirsk State University, Pirogova 2, 630090 Novosibirsk, Russia
3
Ångstrom Laboratory, Nanotechnology and Functional Materials, Department of Materials Science and Engineering, Faculty of Science and Technology, Uppsala University, 75121 Uppsala, Sweden
*
Author to whom correspondence should be addressed.
Crystals 2022, 12(8), 1157; https://doi.org/10.3390/cryst12081157
Submission received: 27 July 2022 / Revised: 12 August 2022 / Accepted: 13 August 2022 / Published: 17 August 2022
(This article belongs to the Special Issue Pressure-Induced Phase Transformations (Volume II))

Abstract

:
The investigation of molecular crystals at high pressure is a sought-after trend in crystallography, pharmaceutics, solid state chemistry, and materials sciences. The di-p-tolyl disulfide (CH3−C6H4−S−)2 system is a bright example of high-pressure polymorphism. It contains “conventional” solid–solid transition and a “hidden” form which may be obtained only from solution at elevated pressure. In this work, we apply force field and periodic DFT computational techniques to evaluate the thermodynamic stability of three di-p-tolyl disulfide polymorphs as a function of pressure. Theoretical pressures and driving forces for polymorphic transitions are defined, showing that the compressibility of the γ phase is the key point for higher stability at elevated pressures. Transition state energies are also estimated for α → β and α → γ transitions from thermodynamic characteristics of crystal structures, not exceeding 5 kJ/mol. The β → γ transition does not occur experimentally in the 0.0–2.8 GPa pressure range because transition state energy is greater than 18 kJ/mol. Relations between free Gibbs energy (in assumption of enthalpy) of phases α, β, and γ, as a function of pressure, are suggested to supplement and refine experimental data. A brief discussion of the computational techniques used for high-pressure phase transitions is provided.

Graphical Abstract

1. Introduction

High-pressure research of molecular crystals is an important direction of modern crystallography [1,2,3,4,5,6,7,8,9,10,11]. A lot of organic systems have polymorphic modifications at ambient pressure, while other organic crystals undergo phase transitions at extreme conditions [12,13]. These new high-pressure structures may be the result of direct solid-solid transformation and may be called “conventional”. Nevertheless, the formation of new polymorphs may also be hindered by the high transition state energies and crystalize only from liquid phase. These solid–liquid–solid phase transitions (which can also undergo through mobile fluid phase, e.g., partial dissolution) are called “hidden” polymorphs [14,15,16]. The comparison of the thermodynamic stability of both “hidden” and “conventional” phases is a complicated question, especially if several phases exist at the same conditions. High-pressure experiments could only show the structural stability of such phases, but not the thermodynamic stability. If there is no direct phase transition between polymorphs, it becomes impossible to investigate their thermodynamic stability. Both computational and experimental approaches should be used in such cases [13,17].
Di-p-tolyl disulfide (p-Tol2S2) is a demonstrative organic system that contains a “conventional” form and a “hidden” high-pressure form (Scheme 1). The “hidden” form recrystallizes from solution at elevated pressures, while the “conventional” form is obtained via solid–solid transition [18].
Szymon Sobczak and Andrzej Katrusiak previously found that the α phase is the most stable phase at ambient conditions, while, at higher pressures, two phase transitions occur with the formation of β and γ polymorphs [18]. On the one hand, the reversible α → β phase transition occurs at a pressure near 1.6 GPa and the β phase remains stable up to 2.8 GPa (glycerin was used as a pressure transmitting media). On the other hand, α transforms to the γ-phase form near 0.45 GPa via recrystallization (methanol, ethanol, and isopropanol solvents were simultaneously used as hydrostatic fluids). The γ-phase form is also stable up to 2.8 GPa, similarly to the β one. Based on those experiments, the authors suggested a scheme of phase transitions and schematic relations between the free Gibbs energy of the α, β, and γ phases as a function of pressure for p-Tol2S2 (Figure 1).
It is impossible to measure the relative stability of β and γ polymorphs in different pressure regions due to the absence of a direct phase transition between them. Thus, the aim of this study is to calculate the thermodynamic stability of all three polymorphs of the p-Tol2S2 system and explain the driving force for experimentally observed structural reorganization at pressures of 0.45 GPa and 1.6 GPa. Based on several previous works [19,20,21,22,23,24] Force Field (FF) and periodic DFT methods in conjunction with equations of states (EoS), the enthalpies of all polymorphs are calculated as a first rough approximation of the Gibbs energy for each.

2. Computational Details

Lattice energies were calculated using different approaches. The force field approach, as implemented in the CrystalExplorer 21.5 (CE21) software package, calculates pair-wise energies, summing up the energy of all intermolecular energies in the experimental crystal structure in terms of kJ/mol [25,26,27]. CE21 uses data calculated via DFT (e.g., electron density mapped on a Hirshfeld surface at B3LYP/6-31G (d,p)) and should be strictly named as an FF-based method, but, following major principles, it is further referred to as an FF method. Periodic DFT, as implemented in VASP 5.4.4 [28,29,30,31], calculates an overall (electronic) energy of the optimized system, which may be presented as a sum of inter- and intra-molecular interactions (which are of course interrelated from molecular geometry). Thus, periodic DFT (apart from obvious differences in principles in comparison to FF methods) considers conformational changes in crystal structures, whereas the CE21 algorithm does not. Enthalpies were calculated by manual addition of the PV term at pressure points, where volume was known experimentally (for FF calculations) or from EoS calculations (for DFT calculations). Zero-point energy was not considered, as well as temperature (T = 0 K). An overall workflow is presented in Scheme S1.

2.1. FF Method Calculations

CrystalExplorer 21.5 [25] was used with a Gaussian09 [32] backend at D2-B3LYP/6-31G (d,p) level of theory (LOT) with four further terms (electrostatic, polarization, dispersion, and exchange-repulsion) separation. Corresponding default scaling factors for this LOT were used to calculate total energy, which were further interpreted as lattice energy.

2.2. Periodic DFT Calculations

All periodic DFT calculations were performed using the VASP 5.4.4 package using a PBE functional [33] plane-wave basis set with a kinetic energy cut-off of 500 eV and PAW atomic pseudopotentials [34,35]. The integrals in reciprocal space were calculated on a k-point Monkhorst-Pack mesh of 4 × 4 × 2 [36]. Grimme D3 dispersion correction with Becke–Johnson damping was used for better simulation of van der Waals (VdW) interactions in crystal structures [37]. Convergence criteria were applied, where the maximum change in system energy was 10−5 eV and the norms of all forces were smaller than 10−4. The volumes of unit cells in all periodic DFT calculations were fixed at calculated values from corresponding EoS (which are respectively calculated from experimental data), while cell shapes and atom positions were fully relaxed during the optimization procedure (ISIF = 4). Crystal structures for all calculations were prepared manually by editing the experimental lowest pressure structure (cif) file cell parameters. This editing considered the Vp/Vo ratio (preserving same angles as in the initial structures), where Vp is the calculated volume of the crystal structure at pressure P from EoS. All unit cell parameters including angles were fully relaxed further during DFT optimization procedure, keeping volume fixed only. Experimental structure (.cif) files were obtained from the CCDC database [38].

2.3. Equations of States

Experimentally obtained pressure dependencies of unit cell volumes of the polymorphs (Table S1 in Supplementary Materials) were fitted by the EoSFit7-GUI software [39,40], using the third order Birch–Murnaghan equation of state [40,41]. Standard deviations of the volumes and pressures were considered.

3. Results and Discussion

The thermodynamic stability of different polymorphs is described as the enthalpy of these forms in the current study. The authors are aware of possible significant changes in the entropy term due to change in lattice vibrations under pressure. Nevertheless, we suggest such simplification reasonable for this system while taking into account the isothermal conditions of the experiments, minor changes in the molecular arrangement of the α and β forms, which results in very small lattice changes, and the preserved symmetry (P)2 point group of the α and γ polymorphs (Figure S1 and Table S1). Thus, the entropy difference should be less significant than that which is expected for major materials and may be neglected as a rough approximation of the Gibbs energies to save computational resources. Enthalpy may be divided into several terms to find a driving force for phase transitions (Equation (1)).
H = Ucrystal + P × V = Uinter + Uintra + P × V
Lattice energy is presented as an Ucrystal and presents a sum of inter- and intra-molecular interactions. Considering the computational techniques, Equation (1) transforms to Equation (2) in the case of FF calculations as implemented in CrystalExplorer 21.5 software (where only intermolecular interaction energies are parametrized).
H = Ucrystal + P × V = Uinter + P × V
Uintra, being conformational energy, was calculated in the work [18] separately using several gas-phase DFT methods, and is reproduced in Figure S2, showing γ-phase conformations are 6–8 kJ/mol less favorable than the α and γ forms at the same pressures. Thus, Uintra may be added to Uinter manually, which in fact does not change the overall picture for used FF method (Figure S3).
Following this logic, an overall behavior of p-Tol2S2 system may be assessed regarding Ucrystal lattice energies (mostly intermolecular interactions) and PV term (compressibility) to find a driving force for phase transitions and evaluate relative stability of polymorphs using different computational techniques.

3.1. Force Field Calculations

Lattice energies of all experimentally founded crystal structures were calculated using the CrystalExplorer 21.5 software package at corresponding experimental pressure values (Figure 2). The function of lattice energies on the pressure shows relative stability of all three phases in the regions of their structural stability. A significant decrease in the lattice energy of α phase in the interval 0.0–1.5 GPa is probably an artifact of CE21 parametrization, which was already discussed in the work [24]. It was shown that decrease of lattice energies with an initial increase in pressure is similar for all phases/interactions and does not affect results of polymorphs relative energies.
According to the lower lattice energy of the γ phase (Figure 2), it has higher stability in the pressure range of 0.45–2.5 GPa with relatively reversed stability for the β and γ polymorphs at 2.8 GPa. The addition of conformational energies does not change this tendency (Figure S3). Thus, based only on the lattice energies, one can expect a γ to β phase transition at higher pressures. Nevertheless, compressibility of different phases should be considered, which may affect PV term and consequently H drastically [42].
The enthalpies of all phases were calculated at experimental pressures by manual addition of a PV term (Figure S4). Higher lattice energy of the γ polymorph was fully compensated by PV term (compressibility of γ phase) and the γ phase preserved relative stability at 2.8 GPa. It is impossible to compare the enthalpies of all phases at the same pressures in a whole pressure interval (0–3 GPa) due to the limitation of lacking a region where the phases are all structurally stable. This is one of the key limitations for the FF method, because atom coordinates for other pressures cannot be obtained without expensive DFT calculations or new labor-intensive experiments. Linearization of enthalpy data may be successfully used in such cases [17] and be applied for a p-Tol2S2 system (Figure 3).
The phase transitions from α → γ and α → β can be expected when the free energies (in the approximation of the calculations used here—the enthalpies) of the corresponding phases become equal. These calculations predict this to happen at 0.44 GPa and 1.45 GPa, respectively (Figure 3). The obtained theoretical values are extremely close to the experimental values of 0.45 and 1.6 GPa for the α → γ and α → β phase transitions, respectively (Table S2). Nevertheless, the applied approximation of linear enthalpy change (due to high PV energies) at higher pressures is a significant simplification and is recommended for use only with short pressure intervals. The periodic DFT calculations, in conjunction with EoS, were applied to estimate the possible margins of the used approach.

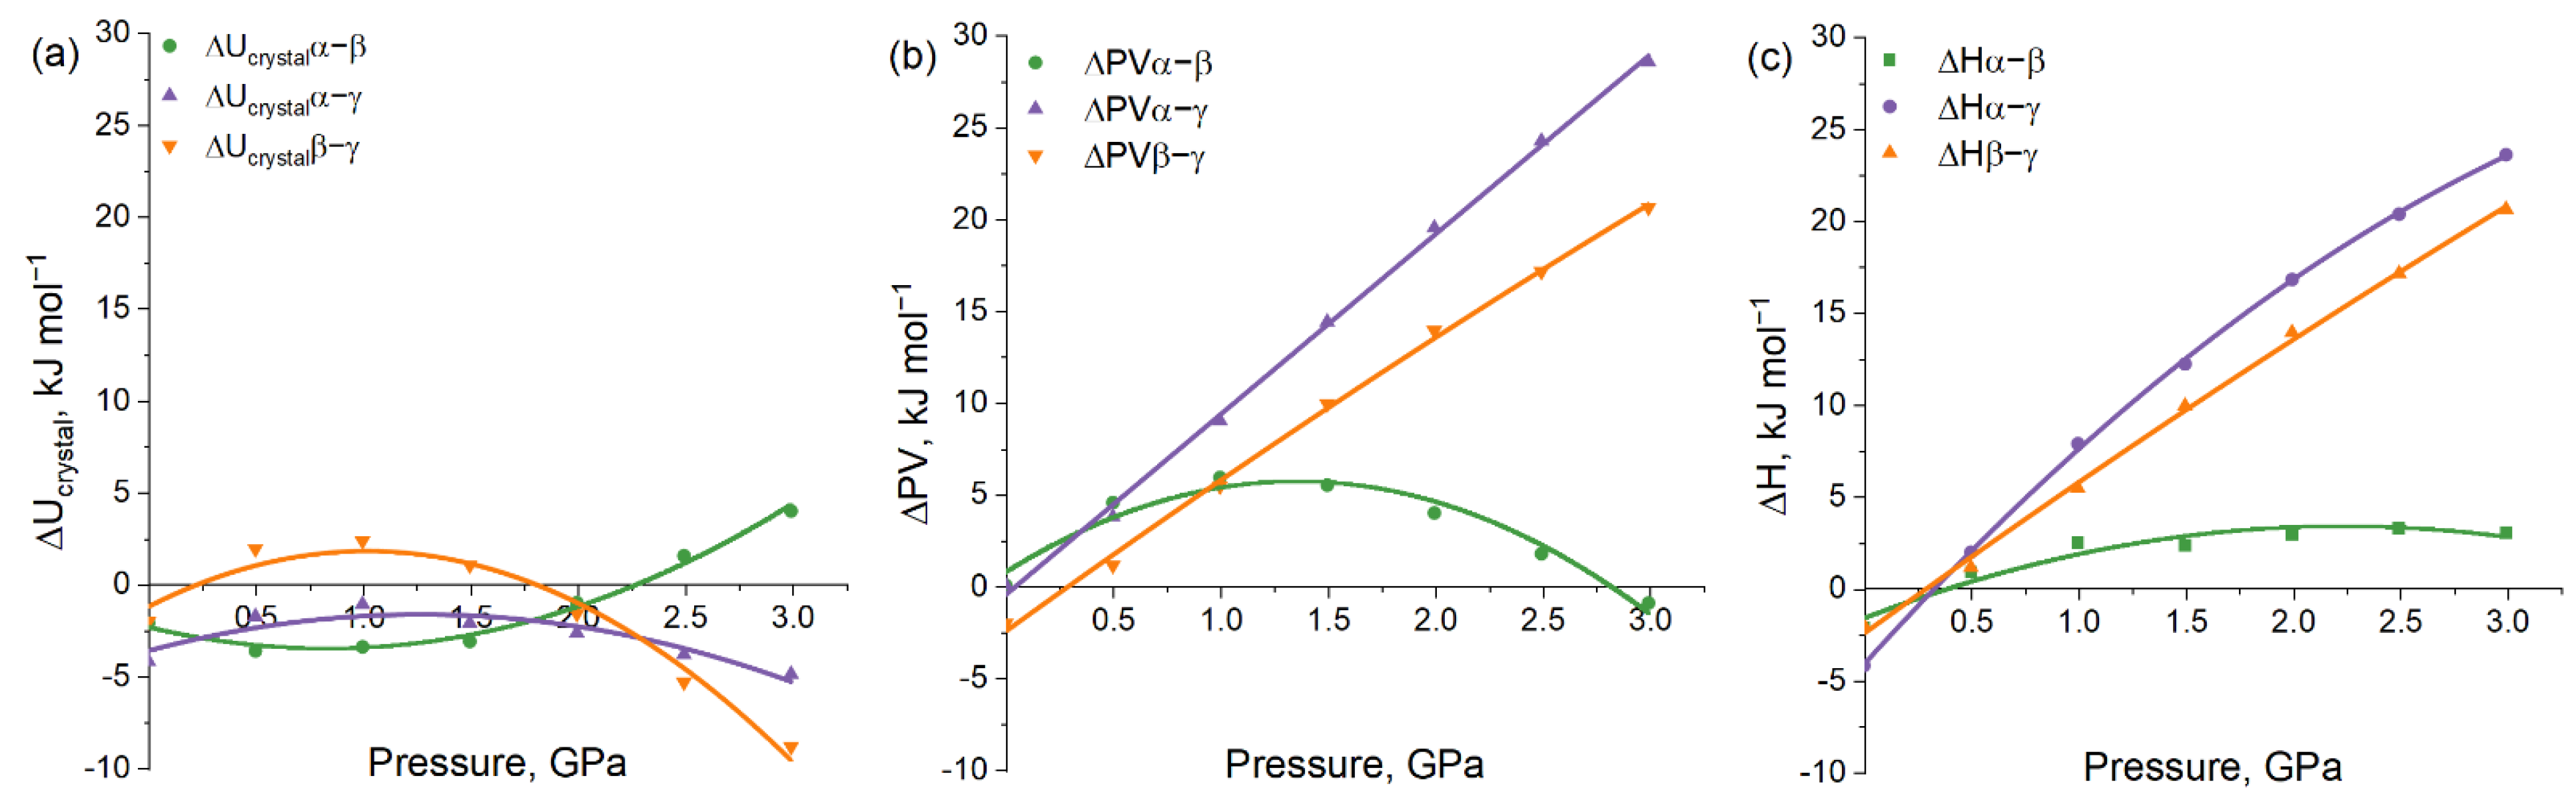
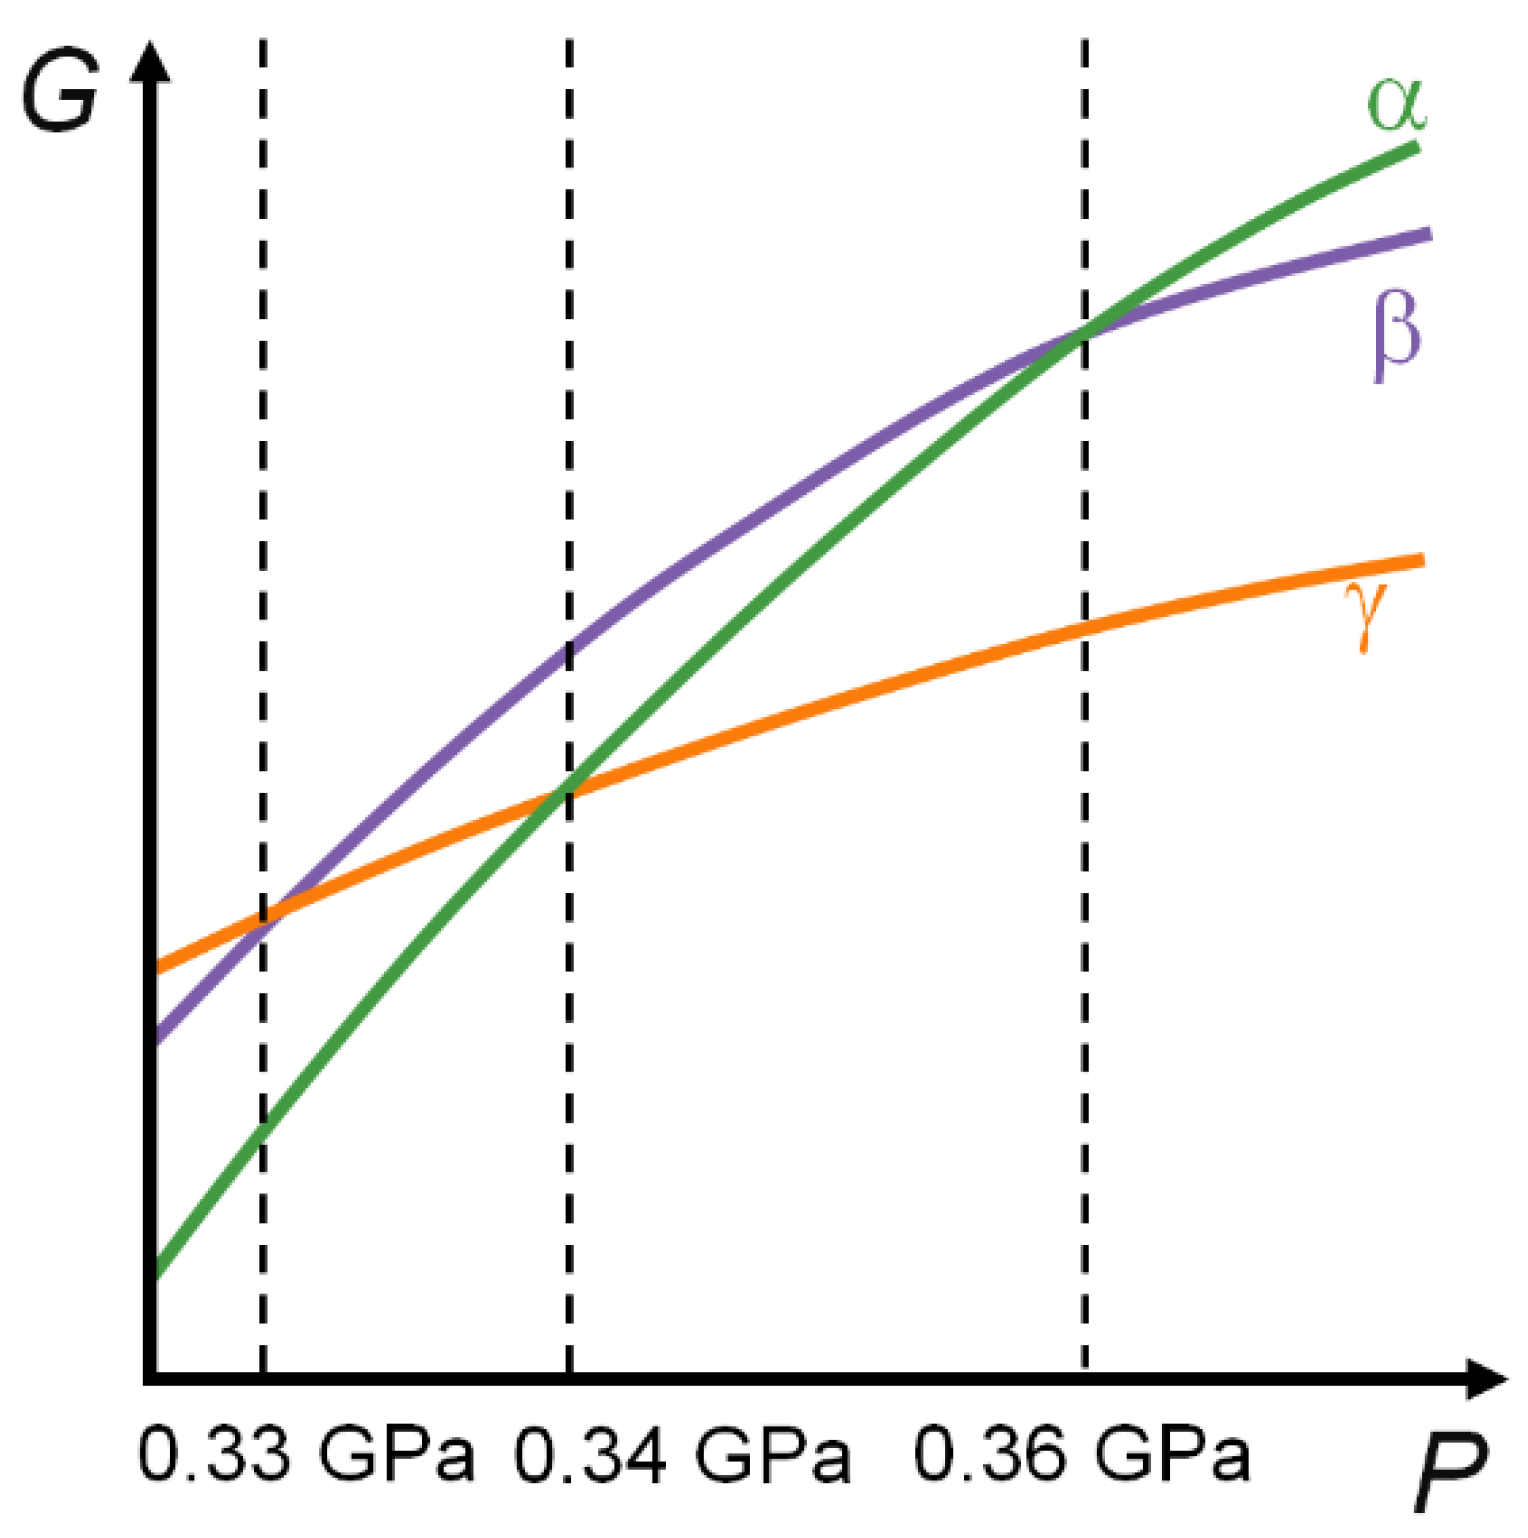
3.2. Periodic DFT Calculations with EoS

The prediction of structure change at finite pressure points is mandatory to overcome the limitations of experimental data at different pressures. A previously reported [21] technique of fully automated structure change prediction at any pressure using the PSTRESS tag in VASP turned out to be inaccurate for small pressure ranges, at least for a p-Tol2S2 system. Thus, a concept similar to those reported in the work [43] was applied. Equations of state were calculated based on experimental data for all three polymorphs to predict the cell volume of each phase at the 0.0–3.0 GPa pressure range with a 0.5 GPa step size (Figure S5 and Table S3). At each pressure point, the full electronic energy was calculated using DFT optimization with a fixed cell volume (Figure 4).
Lattice energies show a similar trend as calculated using the FF approach, predicting that the relative stability of β to γ changes at elevated pressures. The γ phase is slightly less stable than the α phase in the whole pressure range, which may be explained by less favorable conformations. What is more important, however, is that these calculations predict γ and β phase instability at ambient pressure, which fully coincides with the experimental study.
It is not only possible to estimate phase stability, but also to compare separate enthalpy terms and find a prevailing term for phase transition. Pairwise comparisons of lattice energies with PV in terms of polymorphs are presented in Figure 5a,b.
Phase transition α → γ is justified by higher compressibility (the PV component of the enthalpy, rather than the specific pairwise energies) of γ polymorph (what also shown with K’ coefficients from EoS data (Table S3)), whereas α → β transition cannot be unequivocally defined by any term. This also coincides well with structure data, showing β and α phases being very similar in terms of geometry (Figure S1).
Calculated cell volumes from EoS helps to exclude simplification of enthalpy linearization—it is possible to calculate enthalpies at each point by direct sum of Ucrystal (Uinter + Uintra) and PV term (Figure S6). Enthalpy difference is plotted in Figure 5c (and Figure S7 and Table S5 with linearization).
Based on this more sophisticated approach, one can predict phase transitions at 0.34 GPa and 0.36 GPa for α → γ and α → β transitions in comparison to experimental 0.45 GPa and 1.6 GPa. Such deviations may be explained by several factors, apart from the absence of calculated thermal effects. It is mandatory to understand that experimental techniques show a range of pressures where transition occurs, due to features of the high-pressure devices (e.g., a diamond anvil cell and the limitations of a single crystal diffraction technique at elevated pressure). The experimental data are limited, so the exact pressure of phase transition is not reported: α → β transition occurred in the interval 1.52–1.60 GPa, whereas the γ phase was crystallized at 0.45 GPa and other pressures were not checked. On the other hand, transition state energy during phase change may be significant and lead to hysteresis and higher pressures of experimental phase transition in comparison to thermodynamic data [21,44,45]. Finally, the entropy term may also affect transitions, changing the Gibbs energies of different polymorphs. Nevertheless, it is possible to estimate energy limits of the transition state from the suggested enthalpy functions.
The differences in polymorph enthalpies, when at pressure of experimental phase transition, denote the upper limit for the transition state energy. This is because the initial phase (α in this case) stores “excessive” energy in relation to the final phase. Following this logic, the formation of the “hidden” γ polymorph has an energy barrier less than 2 kJ/mol, which is reasonable for solid–liquid–solid phase transition. The “conventional” β polymorph also has very small transition state energy less than 3 kJ/mol, which may be explained by extremely small structure changes during this transition. The β → γ phase transition has a TS energy barrier of no less than 18 kJ/mol. So, the “excessive” energy of the β phase is not enough to result in solid–solid crystal structure rearrangement.
Finally, it is possible to refine the phase diagram for a p-Tol2S2 system based on the enthalpy calculations, where the α form is the most stable in the pressure range of 0.0–0.34 GPa, the γ phase is the most stable at a pressure range from 0.34 GPa to 3.0 GPa, and the β phase is metastable in the whole pressure range from 0.0 GPa to 3.0 GPa (nevertheless, being more stable than the γ phase in the pressure range of 0.0–0.32 GPa) (Table S4). Figure 6 illustrates the thermodynamic relation between p-Tol2S2 polymorphs, which turned out to be more complicated than suggested from experimental data (Figure 1b, Table S6).

4. Conclusions

In this study, we show how different computational techniques supplement previous experimental studies to evaluate thermodynamic stability of p-Tol2S2 polymorphs in the approximation of enthalpy changes. Force field methods (as implemented in CE21) show reliable stability ranking of polymorphs at pressure ranges where phases coexist, if enthalpies are calculated. The “hidden” γ form was predicted to be more stable than the α form in the 0.45–1.52 GPa experimental pressure range, and more stable than the “conventional” β phase in the interval of 1.60–2.8 GPa. Periodic DFT methods, in conjunction with EoS, help to answer questions regarding polymorph stability in the whole pressure (not only experimental) range, even if a specific form does not exist experimentally. It was shown that the α form is the most stable form when in the pressure range 0.0–0.34 GPa, while the γ phase is the most stable from 0.34–3.0 GPa due to higher compressibility (PV term). Upper limits for transition state energies for both experimental phase transitions were estimated from the suggested relations between the free Gibbs energy values of phases α, β, and γ as a function of pressure. Both methods proved to reveal valuable information about relative polymorph stability (FF for experimental and periodic DFT for the whole pressure range). A refined phase diagram (in a rough assumption of calculated enthalpies) over pressure shows the necessity of computational methods for high-pressure crystallography.

Supplementary Materials

The following supporting information can be downloaded at: https://www.mdpi.com/article/10.3390/cryst12081157/s1. Scheme S1: An overall workflow of computational procedures. Table S1: Summarized structural data for p-Tol2S2 polymorphs used in CE21 and EoSFit7 calculations. Figure S1: Crystal structures of (a) alpha, (b) beta and (c) gamma polymorphs of p-Tol2S2. Colors according to symmetry equivalence in corresponding crystal structures. Figure S2: Potential energy changes (ΔEp) calculated by Gaussian (Experimental Section of [14]) for the isolated molecule in its conformation, experimentally determined in the p-Tol2S2 structures of phases α, β, and γ. Figure S3: Lattice energies (the sum of Uinter and Uintra) of phases α, β, and γ as a function of pressure calculated based on experimental data. Regions of structural stability according to experimental data are shown with dashed lines. Uintra is reproduced from work [14]. Figure S4: Enthalpies of phases α, β, and γ as a function of pressure calculated based on experimental data using CE21. Table S2: Predicted by FF and experimental phase transition pressures. Figure S5: p-Tol2S2 volume-pressure dependence based on calculated EoS. Table S3: EoS Birch-Murnaghan 3rd order coefficients. V0—reference pressure volume at ambient pressure, K0—bulk modulus, Kp—derivative of Bulk Modulus (dK/dP). Figure S6: Enthalpies of phases α, β, and γ as a function of pressure calculated using periodic DFT and EoS. Table S4: Relative stability of p-Tol2S2 polymorphs in different pressure ranges calculated by periodic DFT. Figure S7: ΔH differences between p-Tol2S2 polymorph α and γ (green), α and β (purple), β and γ (orange) as a function of pressure (i.e., ΔUα − β = Uα − Uβ, ΔPVα − β = PVα − PVβ, ΔHα − β = Hα − Hβ, etc.). Table S6: Phase transitions of p-Tol2S2 polymorphs under pressure according to various experimental and computational techniques.

Author Contributions

Conceptualization, D.A.R.; methodology, D.A.R.; software, V.Y.S. and A.A.I.; validation, A.A.I. and D.A.R.; formal analysis, V.Y.S. and A.A.I.; investigation, V.Y.S., A.A.I. and D.A.R.; resources, D.A.R.; data curation, V.Y.S. and A.A.I.; writing—original draft preparation, D.A.R.; writing—review and editing, V.Y.S., A.A.I. and D.A.R.; visualization, V.Y.S., A.A.I. and D.A.R.; supervision, D.A.R.; project administration, D.A.R.; funding acquisition, D.A.R. All authors have read and agreed to the published version of the manuscript.

Funding

This research was funded by Ministry of Higher Education and Science, grant number FWUS-2021-0005 (FF and periodic DFT calculations, data processing and analysis) and the Russian Science Foundation, grant number 18-73-00154 (system choice, database search, preliminary calculations).

Institutional Review Board Statement

Not applicable.

Informed Consent Statement

Not applicable.

Data Availability Statement

Data available on request from corresponding author.

Acknowledgments

The Siberian Branch of the Russian Academy of Sciences (SB RAS) Siberian Supercomputer Center (http://www.sscc.icmmg.nsc.ru/, accessed on 12 August 2022) is gratefully acknowledged for providing access to their supercomputer facilities. The authors also acknowledge the Supercomputing Center of the Novosibirsk State University (http://nusc.nsu.ru, accessed on 12 August 2022) for providing computational resources.

Conflicts of Interest

The authors declare no conflict of interest. The funders had no role in the design of the study; in the collection, analyses, or interpretation of data; in the writing of the manuscript; or in the decision to publish the results.

References

  1. Errandonea, D. Pressure-Induced Phase Transformations. Crystals 2020, 10, 595. [Google Scholar] [CrossRef]
  2. Thiel, A.M.; Damgaard-Møller, E.; Overgaard, J. High-Pressure Crystallography as a Guide in the Design of Single-Molecule Magnets. Inorg. Chem. 2020, 59, 1682–1691. [Google Scholar] [CrossRef] [PubMed]
  3. Moggach, S.A.; Oswald, I.D.H. Crystallography Under High Pressures. In 21st Century Challenges in Chemical Crystallography I. Structure and Bonding; Springer: Cham, Switzerland, 2020; pp. 141–198. ISBN 9783030647421. [Google Scholar]
  4. Görbitz, C.H. Crystal structures of amino acids: From bond lengths in glycine to metal complexes and high-pressure polymorphs. Crystallogr. Rev. 2015, 21, 160–212. [Google Scholar] [CrossRef]
  5. Skakunova, K.D.; Rychkov, D.A. Low Temperature and High-Pressure Study of Bending L-Leucinium Hydrogen Maleate Crystals. Crystals 2021, 11, 1575. [Google Scholar] [CrossRef]
  6. Sharma, S.M.; Garg, N. Material Studies at High Pressure. In Materials under Extreme Conditions; Elsevier: Amsterdam, The Netherlands, 2017; pp. 1–47. ISBN 9780128014424. [Google Scholar]
  7. Colmenero, F. Organic acids under pressure: Elastic properties, negative mechanical phenomena and pressure induced phase transitions in the lactic, maleic, succinic and citric acids. Mater. Adv. 2020, 1, 1399–1426. [Google Scholar] [CrossRef]
  8. Colmenero, F.; Lunelli, B. Fluorine-substituted cyclobutenes in the solid state: Crystal structures, vibrational spectra and mechanical and thermodynamic properties. J. Phys. Chem. Solids 2022, 160, 110337. [Google Scholar] [CrossRef]
  9. Ratajczyk, P.; Katrusiak, A.; Bogdanowicz, K.A.; Przybył, W.; Krysiak, P.; Kwak, A.; Iwan, A. Mechanical strain, thermal and pressure effects on the absorption edge of an organic charge-transfer polymer for flexible photovoltaics and sensors. Mater. Adv. 2022, 3, 2697–2705. [Google Scholar] [CrossRef]
  10. Konar, S.; Hobday, C.L.; Bull, C.L.; Funnell, N.P.; Chan, Q.F.; Fong, A.; Atceken, N.; Pulham, C.R. High-Pressure Structural Behavior of para-Xylene. Cryst. Growth Des. 2022, 22, 3862–3869. [Google Scholar] [CrossRef]
  11. Wilson, C.J.G.; Cervenka, T.; Wood, P.A.; Parsons, S. Behavior of Occupied and Void Space in Molecular Crystal Structures at High Pressure. Cryst. Growth Des. 2022, 22, 2328–2341. [Google Scholar] [CrossRef]
  12. Neumann, M.A.; van de Streek, J.; Fabbiani, F.P.A.; Hidber, P.; Grassmann, O. Combined crystal structure prediction and high-pressure crystallization in rational pharmaceutical polymorph screening. Nat. Commun. 2015, 6, 7793. [Google Scholar] [CrossRef]
  13. Mazurek, A.; Szeleszczuk, Ł.; Pisklak, D.M. Can We Predict the Pressure Induced Phase Transition of Urea? Application of Quantum Molecular Dynamics. Molecules 2020, 25, 1584. [Google Scholar] [CrossRef] [PubMed]
  14. Paliwoda, D.; Dziubek, K.F.; Katrusiak, A. Imidazole Hidden Polar Phase. Cryst. Growth Des. 2012, 12, 4302–4305. [Google Scholar] [CrossRef]
  15. Anioła, M.; Katrusiak, A. Conformational Conversion of 4,4′-Bipyridinium in a Hidden High-Pressure Phase. Cryst. Growth Des. 2015, 15, 764–770. [Google Scholar] [CrossRef]
  16. Patyk-Kaźmierczak, E.; Kaźmierczak, M. A new high-pressure benzocaine polymorph—Towards understanding the molecular aggregation in crystals of an important active pharmaceutical ingredient (API). Acta Crystallogr. Sect. B Struct. Sci. Cryst. Eng. Mater. 2020, 76, 56–64. [Google Scholar] [CrossRef]
  17. Fedorov, A.Y.; Rychkov, D.A.; Losev, E.A.; Zakharov, B.A.; Stare, J.; Boldyreva, E.V. Effect of pressure on two polymorphs of tolazamide: Why no interconversion? CrystEngComm 2017, 19, 2243–2252. [Google Scholar] [CrossRef]
  18. Sobczak, S.; Katrusiak, A. Colossal Strain Release by Conformational Energy Up-Conversion in a Compressed Molecular Crystal. J. Phys. Chem. C 2017, 121, 2539–2545. [Google Scholar] [CrossRef]
  19. Rychkov, D.A. A Short Review of Current Computational Concepts for High-Pressure Phase Transition Studies in Molecular Crystals. Crystals 2020, 10, 81. [Google Scholar] [CrossRef]
  20. Munday, L.B.; Chung, P.W.; Rice, B.M.; Solares, S.D. Simulations of High-Pressure Phases in RDX. J. Phys. Chem. B 2011, 115, 4378–4386. [Google Scholar] [CrossRef]
  21. Rychkov, D.A.; Stare, J.; Boldyreva, E.V. Pressure-driven phase transition mechanisms revealed by quantum chemistry: L-serine polymorphs. Phys. Chem. Chem. Phys. 2017, 19, 6671–6676. [Google Scholar] [CrossRef]
  22. Wood, P.A.; Francis, D.; Marshall, W.G.; Moggach, S.A.; Parsons, S.; Pidcock, E.; Rohl, A.L. A study of the high-pressure polymorphs of L-serine using ab initio structures and PIXEL calculations. CrystEngComm 2008, 10, 1154. [Google Scholar] [CrossRef]
  23. Thomas, S.P.; Spackman, M.A. The Polymorphs of ROY: A Computational Study of Lattice Energies and Conformational Energy Differences. Aust. J. Chem. 2018, 71, 279. [Google Scholar] [CrossRef]
  24. Fedorov, A.Y.; Rychkov, D.A. Comparison of different computational approaches for unveiling the high-pressure behavior of organic crystals at a molecular level. Case study of tolazamide polymorphs. J. Struct. Chem. 2020, 61, 1356–1366. [Google Scholar] [CrossRef]
  25. Spackman, P.R.; Turner, M.J.; McKinnon, J.J.; Wolff, S.K.; Grimwood, D.J.; Jayatilaka, D.; Spackman, M.A. CrystalExplorer: A program for Hirshfeld surface analysis, visualization and quantitative analysis of molecular crystals. J. Appl. Crystallogr. 2021, 54, 1006–1011. [Google Scholar] [CrossRef] [PubMed]
  26. Thomas, S.P.; Spackman, P.R.; Jayatilaka, D.; Spackman, M.A. Accurate Lattice Energies for Molecular Crystals from Experimental Crystal Structures. J. Chem. Theory Comput. 2018, 14, 1614–1623. [Google Scholar] [CrossRef]
  27. Mackenzie, C.F.; Spackman, P.R.; Jayatilaka, D.; Spackman, M.A. CrystalExplorer model energies and energy frameworks: Extension to metal coordination compounds, organic salts, solvates and open-shell systems. IUCrJ 2017, 4, 575–587. [Google Scholar] [CrossRef]
  28. Kresse, G.; Hafner, J. Ab initio molecular dynamics for liquid metals. Phys. Rev. B 1993, 47, 558–561. [Google Scholar] [CrossRef]
  29. Kresse, G.; Furthmüller, J. Efficient iterative schemes for ab initio total-energy calculations using a plane-wave basis set. Phys. Rev. B 1996, 54, 11169–11186. [Google Scholar] [CrossRef]
  30. Kresse, G.; Hafner, J. Ab initio molecular-dynamics simulation of the liquid-metal–amorphous-semiconductor transition in germanium. Phys. Rev. B 1994, 49, 14251–14269. [Google Scholar] [CrossRef]
  31. Kresse, G.; Furthmüller, J. Efficiency of ab-initio total energy calculations for metals and semiconductors using a plane-wave basis set. Comput. Mater. Sci. 1996, 6, 15–50. [Google Scholar] [CrossRef]
  32. Frisch, M.J.; Trucks, G.W.; Schlegel, H.B.; Scuseria, G.E.; Robb, M.A.; Cheeseman, J.R.; Scalmani, G.; Barone, V.; Mennucci, B. Gaussian 09, Revision D.01; Gaussian, Inc.: Wallingford, CT, USA, 2009. [Google Scholar]
  33. Perdew, J.P.; Burke, K.; Ernzerhof, M. Generalized Gradient Approximation Made Simple. Phys. Rev. Lett. 1996, 77, 3865–3868. [Google Scholar] [CrossRef]
  34. Kresse, G.; Joubert, D. From ultrasoft pseudopotentials to the projector augmented-wave method. Phys. Rev. B 1999, 59, 1758–1775. [Google Scholar] [CrossRef]
  35. Blöchl, P.E. Projector augmented-wave method. Phys. Rev. B 1994, 50, 17953–17979. [Google Scholar] [CrossRef] [PubMed]
  36. Monkhorst, H.J.; Pack, J.D. Special points for Brillouin-zone integrations. Phys. Rev. B 1976, 13, 5188–5192. [Google Scholar] [CrossRef]
  37. Grimme, S.; Ehrlich, S.; Goerigk, L. Effect of the damping function in dispersion corrected density functional theory. J. Comput. Chem. 2011, 32, 1456–1465. [Google Scholar] [CrossRef]
  38. Groom, C.R.; Bruno, I.J.; Lightfoot, M.P.; Ward, S.C. The Cambridge Structural Database. Acta Crystallogr. Sect. B Struct. Sci. Cryst. Eng. Mater. 2016, 72, 171–179. [Google Scholar] [CrossRef]
  39. Gonzalez-Platas, J.; Alvaro, M.; Nestola, F.; Angel, R. EosFit7-GUI: A new graphical user interface for equation of state calculations, analyses and teaching. J. Appl. Crystallogr. 2016, 49, 1377–1382. [Google Scholar] [CrossRef]
  40. Angel, R.J.; Alvaro, M.; Gonzalez-Platas, J. EosFit7c and a Fortran module (library) for equation of state calculations. Z. für Krist.-Cryst. Mater. 2014, 229, 405–419. [Google Scholar] [CrossRef]
  41. Birch, F. Finite elastic strain of cubic crystals. Phys. Rev. 1947, 71, 809–824. [Google Scholar] [CrossRef]
  42. Bernstein, J. Polymorphism in Molecular Crystals; Oxford University Press: New York, NY, USA, 2002; Volume 14, ISBN 978-0-19-923656-5. [Google Scholar]
  43. Hunter, S.; Sutinen, T.; Parker, S.F.; Morrison, C.A.; Williamson, D.M.; Thompson, S.; Gould, P.J.; Pulham, C.R. Experimental and DFT-D Studies of the Molecular Organic Energetic Material RDX. J. Phys. Chem. C 2013, 117, 8062–8071. [Google Scholar] [CrossRef]
  44. Kolesnik, E.N.; Goryainov, S.V.; Boldyreva, E.V. Different behavior of L- and DL-serine crystals at high pressures: Phase transitions in L-serine and stability of the DL-serine structure. Dokl. Phys. Chem. 2005, 404, 169–172. [Google Scholar] [CrossRef]
  45. Moggach, S.A.; Allan, D.R.; Morrison, C.A.; Parsons, S.; Sawyer, L. Effect of pressure on the crystal structure of L-serine-I and the crystal structure of L-serine-II at 5.4 GPa. Acta Crystallogr. Sect. B Struct. Sci. 2005, 61, 58–68. [Google Scholar] [CrossRef] [PubMed]
Scheme 1. Molecular structure of di-p-tolyl disulfide (p-Tol2S2).
Crystals 12 01157 sch001
Figure 1. (a) Principal scheme of the experimentally observed phase transitions in a di-p-tolyl disulfide system. The α → β phase transition is given by two arrows due to formation of two different molecular conformations. (b) Suggested relations between the free Gibbs energy of phases α, β, and γ as a function of pressure based on experimental study (adapted from [18]).
Crystals 12 01157 g001
Figure 2. Lattice energies (Ucrystal = Uinter) of phases α, β, and γ as a function of pressure calculated based on experimental data. Regions of structural stability according to experimental data [18] are shown with dashed lines.
Crystals 12 01157 g002
Figure 3. Calculated enthalpy differences between p-Tol2S2 polymorph α and γ (green), α and β (purple), and β and γ (orange) as a function of pressure (i.e., ΔHα − β = Hα − Hβ, ΔHα − γ = Hα − Hγ, and ΔHα − β = Hα − Hβ). Phase transition between the involved polymorphs can be expected when their enthalpy difference is equal to zero, marked with circles.
Crystals 12 01157 g003
Figure 4. Relative lattice energies of phases α, β, and γ as a function of pressure calculated based on EoS predicted data. Full electronic structure energy contains both inter and intramolecular interaction energies. The α phase energy at ambient pressure is taken as zero.
Crystals 12 01157 g004
Figure 5. Calculated (a) lattice energy ΔUcrystal, (b) ΔPV term and (c) ΔH differences between p-Tol2S2 polymorphs α and γ (green), α and β (purple), β and γ (orange) as a function of pressure (i.e., ΔUα − β = Uα − Uβ, ΔPVα–β = PVα − PVβ, ΔHα − β = Hα − Hβ, etc.). Phase transition between the involved polymorphs can be expected when their enthalpy difference is equal to zero.
Crystals 12 01157 g005
Figure 6. Suggested relations between the free Gibbs energy of phases α, β, and γ as a function of pressure based on a periodic DFT study where only enthalpies were calculated. Table S4 shows the relative phase stability according to calculated enthalpies in different pressure ranges.
Crystals 12 01157 g006
Publisher’s Note: MDPI stays neutral with regard to jurisdictional claims in published maps and institutional affiliations.

