Article

The Effect of DNA from Escherichia Coli at High and Low CO2 Concentrations on the Shape and Form of Crystal-line Silica-Carbonates of Barium (II)

by
Cesia D. Pérez-Aguilar
1,
Selene R. Islas
2,
Abel Moreno
3,* and
Mayra Cuéllar-Cruz
1,*
1
Departamento de Biología, División de Ciencias Naturales y Exactas, Campus Guanajuato, Universidad de Guanajuato, Noria Alta S/N, Col. Noria Alta, C.P., Guanajuato 36050, Mexico
2
Instituto de Ciencias Aplicadas y Tecnología, Universidad Nacional Autónoma de México, Circuito Exterior S/N, Ciudad Universitaria, Mexico City 04510, Mexico
3
Instituto de Química, Universidad Nacional Autónoma de México, Av. Universidad 3000, Col. Ciudad Universitaria, Ciudad de México 04510, Mexico
*
Authors to whom correspondence should be addressed.
Crystals 2022, 12(8), 1147; https://doi.org/10.3390/cryst12081147
Submission received: 18 July 2022 / Revised: 12 August 2022 / Accepted: 13 August 2022 / Published: 15 August 2022
(This article belongs to the Special Issue State-of-the-Art Research in Biomolecular Crystals)

Abstract

:
The synthesis of nucleic acids in the Precambrian era marked the start of life, with DNA being the molecule in which the genetic information has been conserved ever since. After studying the DNA of different organisms for several decades, we now know that cell size and cellular differentiation are influenced by DNA concentration and environmental conditions. However, we still need to find out the minimum required concentration of DNA in the pioneer cell to control the resulting morphology. In order to do this, the present research aims to evaluate the influence of the DNA concentration on the morphology adopted by biomorphs (barium silica-carbonates) under two synthesis conditions: one emulating the Precambrian era and one emulating the present era. The morphology of the synthetized biomorphs was assessed through scanning electron microscopy (SEM). The chemical composition and the crystalline structure were determined through Raman and IR spectroscopy. Our results showed that DNA, even at relatively low levels, affects the morphology of the biomorph structure. They also indicated that, even at the low DNA concentration prevailing during the synthesis of the first DNA biomolecules existing in the primitive era, these biomolecules influenced the morphology of the inorganic structure that lodged it. On the other hand, this also allows us to infer that, once the DNA was synthetized in the Precambrian era, it was definitely responsible for generating, conserving, and directing the morphology of all organisms up to the present day.

1. Introduction

The prebiotic synthesis of nucleic acids from the polymerization of pyrimidine nucleotides was performed in primitive Earth due to the apparently existing conditions for the chemical synthesis of biological polymers and for the start of life [1,2]. Ribonucleic acid (RNA) has been proposed by some authors as the first biomolecule to be formed in a primigenial phase due to its catalytic activity [3,4,5]. It has also been proposed that, once a certain number of RNA molecules were available, a ribosome started to catalyze the formation of polypeptides; it is currently accepted that the ribosome corresponds to the large subunit of ribosomal RNA [3,4,5,6,7]. As for deoxyribonucleic acid (DNA), some authors propose that it must have been formed at a later stage than RNA. However, it has been recently described that both RNA and DNA must have been synthetized at the same time in the primigenial era; otherwise, it would not have been able to function had there been a sole RNA or DNA world in a prebiotic context [7,8,9,10,11,12,13]. DNA has, therefore, a selective advantage as it has, since then, become the molecule in charge of storing the genetic information. However, DNA also presents another characteristic, whereby its cellular concentration can be related to the cell size remaining stable even in nonfavorable nutritional and environmental conditions [14]. This characteristic has been studied in Bacterium lactis aerogenes, Escherichia coli, Salmonella Typhimurium, Citrobacter freundii, Serratia marcescens, Bacillus subtilis, Erwinia carotovora, Micrococcus anhaemolyticus, Pseudomonas aeruginosa, Lactobacillus bulgaricus, Saccharomyces cerevisiae, Tetrahymena pyriformis GL, and marine organisms, among others [14,15,16,17,18]. The latter is relevant because maintaining life in an organism seems to lie in its ability to maintain the DNA concentration. In this sense, in several vertebrate species, the nuclei of somatic cells contain fixed amounts of DNA [15,19]. In the microorganism Bacterium lactis aerogenes, it was found that the DNA is a constant constituent of the bacterial cell [15]. In other bacteria, such as Escherichia coli, the concentration of proteins increases in proportion to the DNA, without being affected by the growth rate. In this way, the protein/DNA relationship is independent of the growth rate [16]. Both RNA and DNA are molecules that have played a leading role in the chemical origin of life since the primigenial era of Earth. However, we still need to know the minimum required DNA to direct the morphology of the protocell. It is now known that a higher concentration of this nucleic acid in the cell indicates a more complex species. However, despite this information, we still need to know the minimal DNA concentration required to influence the morphology and characteristics of the pioneer cell. In this sense, Wächtershäuser (2006) [20] proposed that the primitive cell was formed by both an inorganic or mineral part and an organic one. Our research team has emulated this cell in a simple way by using biomorphs as study models. Calcium, barium, or strontium silica-carbonate biomorphs are self-assembled crystalline nano- or micromaterials that usually display a variety of biomimetic morphologies. These biomorphs show characteristic curvatures, which are far away from the restrictions of the classic crystallographic symmetry [21,22,23,24,25,26,27,28,29,30]. Recently, our research team showed that the biomorphs are not only interesting from the point of view of morphology but also because they could have been the first mineral structure in which the first biomolecules became isolated from the outside environment, aligned, polymerized, and conserved to give origin to the primigenial cell [29]. We also showed that DNA influences predominantly the morphology adopted by biomorphs [22,23,24,29]. However, the question about the minimal concentration required in pioneer cells for DNA to control the morphology to be adopted still remains. To answer this question, this work aims to evaluate, for the first time, the influence of DNA concentration on the morphology adopted by the biomorphs in two different synthesis conditions, one emulating the conditions of the Precambrian era and the other emulating those of the present one. The morphology of the synthetized biomorphs was assessed through scanning electron microscopy (SEM). The chemical composition and the crystalline structure were determined through Raman and IR spectroscopy. Our results showed that DNA, even at relatively low levels, affected the morphology of the biomorphs structure. They also indicated that, even at the low DNA concentration prevailing during the synthesis of the first DNA biomolecules existing in the primitive era, these biomolecules influenced the morphology of the inorganic structure that lodged it.

2. Materials and Methods

2.1. Extraction of the Genomic DNA

The Escherichia coli JM109 culture was left to grow for 8 h under constant shaking (120 rpm) in Luria–Bertani medium (LB: 5 g/L yeast extract, 10 g/L tryptone, 5 g/L NaCl). From this culture, 5 mL were taken, and cells were collected by centrifugation at 3000× g for 10 min. Then, cells were resuspended in 500 µL of lysis buffer (20 mM Tris-Cl, pH 8.0, 2 mM sodium EDTA, 1.2% Triton X-100, and lysozyme to 20 mg/mL). Starting with the cell lysate, the protocol of the One-4-all genomic DNA kit (Bio Basic Inc., Toronto, Canada) was followed. Briefly, 180 µL of the ACL buffer and 20 µL of proteinase K were added and vortexed. The mixture was incubated in a water bath at 56 °C for 60 min. Then, 200 µL of RNAse- and DNAse-free ethanol at 96% was added. The mixture was transferred to the EZ-10 column and centrifuged at 9000× g for 1 min. The supernatant was discarded, 500 µL of solution CW1 was added, and the mixture centrifuged again at 9000× g for 1 min; then, 500 µL of solution CW2 was added and centrifuged at 9000× g for 1 min. Finally, the DNA was resuspended in 50 µL of nuclease-free water, incubated for 5 min in a water bath at 60 °C, and left to cool at room temperature. The obtained DNA was stored at −20 °C until used in the synthesis of biomorphs. The integrity of DNA was verified in a 0.8% agarose gel. The quantification and purity of the DNA were determined through spectrophotometry at 260 and 280 nm (Nanodrop 2000, Thermo Fisher Scientific, Inc., Waltham, MA, USA), as indicated below.

2.2. Electrophoretic Analysis

The obtained DNA was visualized through electrophoresis of a denaturalized 0.8% agarose gel in TAE 1× buffer (Tris, acetic acid, and EDTA). The gel was stained with 0.1% ethidium bromide, and bands were observed in an UV transilluminator (Gel Doc XR System. Bio-Rad, Hercules, CA, USA).

2.3. Spectrophotometric Analysis

The quality and quantity of the obtained DNA were determined in a spectrophotometer (Nanodrop, 2000, Thermo Fisher Scientific, Inc.). The absorbances at 260 and 280 nm were measured in each sample to estimate their quality ratio at 260 nm/280 nm.

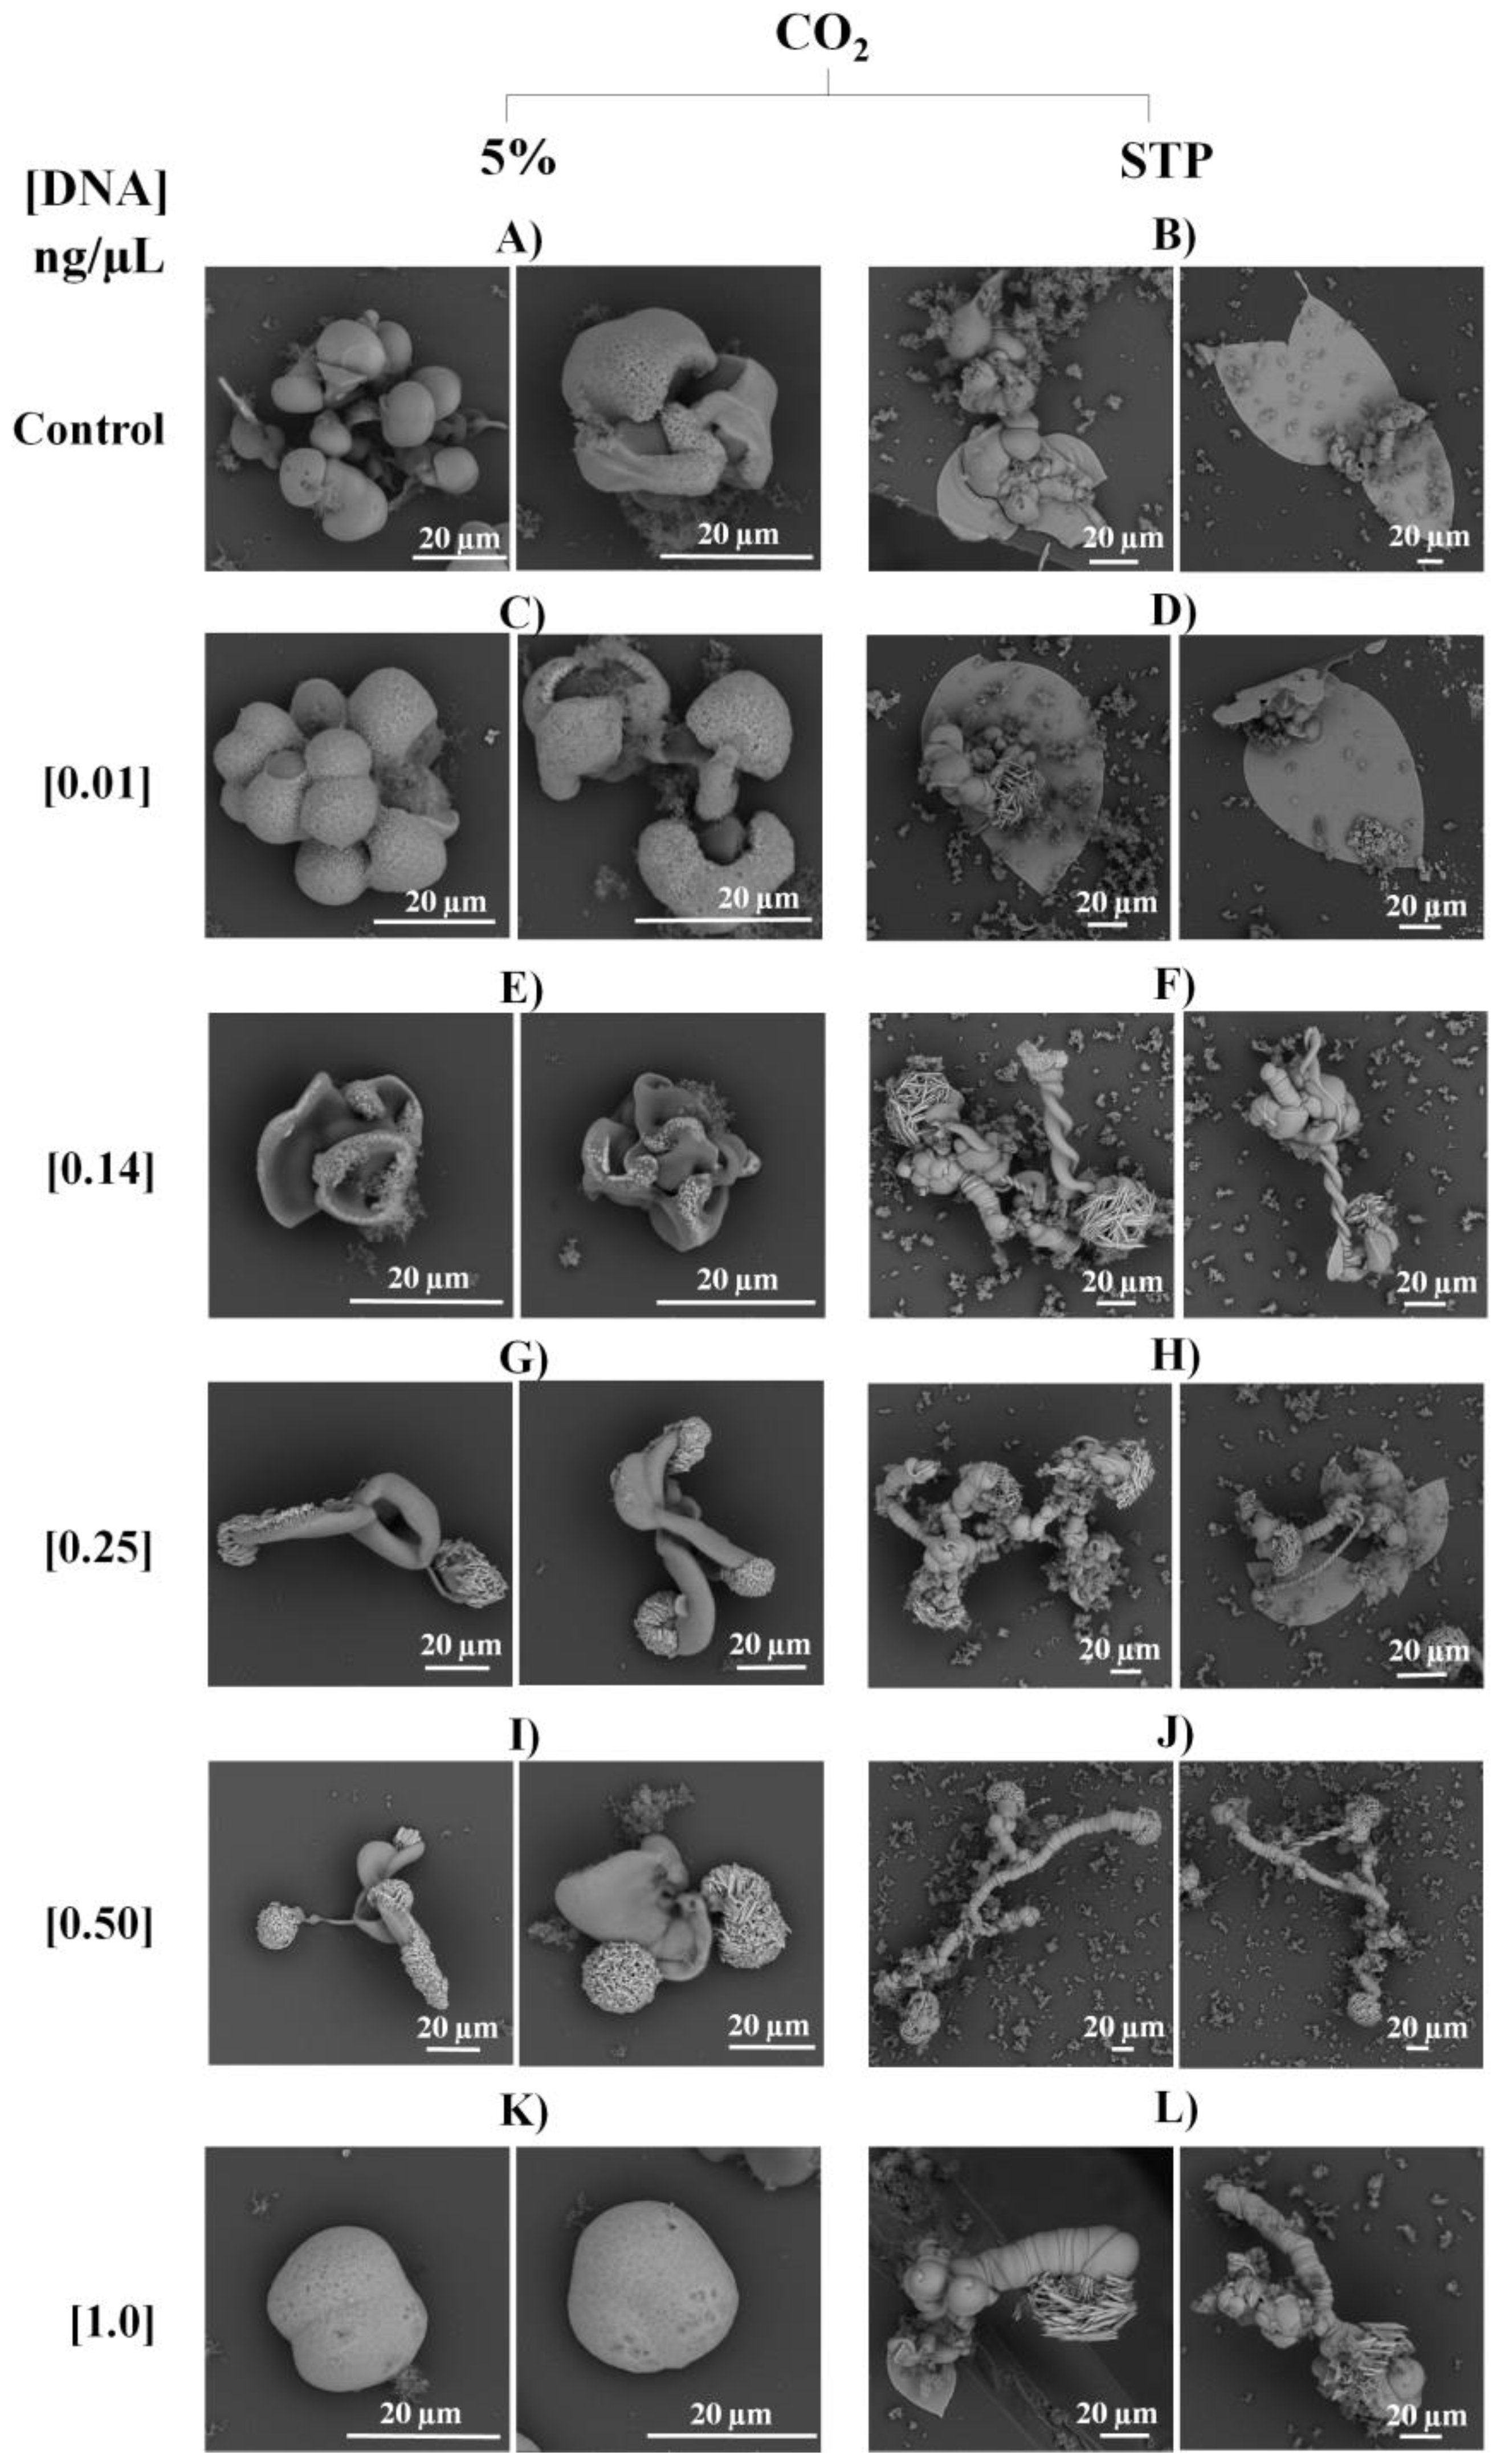
2.4. Biomorphs Formation

The formation of barium silica-carbonate biomorphs was performed by means of the gas diffusion method [22,31]. Experiments were performed on glass 5 mm in length, 5 mm in width, and 1 mm in thickness. The glass plate was placed inside a crystallization cell with a final volume of 200 µL. The solution for the synthesis of biomorphs was prepared with a mixture of 1000 ppm sodium metasilicate, 20 mM barium chloride, and 1.0, 0.5, 0.25, 0.14, and 0.01 ng of genomic DNA. Finally, the pH of the mixture was adjusted to 11.0 with sodium hydroxide. All reagents were from Sigma-Aldrich (St. Louis, MO, USA). Experiments were performed in two different conditions, at a constant 5% CO2 flux in a CO2 incubator (NuAire, Plymouth, MN, US), and with CO2 in standard conditions (STP). In this way, 12 different conditions for biomorph synthesis were obtained. Biomorph formation was allowed for 24 h.

2.5. Characterization of Biomorphs

Biomorphs were observed through scanning electron microscopy (SEM) and analyzed through Raman and Fourier-transform infrared (FTIR) spectroscopy.

2.5.1. Scanning Electron Microscopy (SEM)

Biomorphs were observed by means of SEM microphotographs, using a TESCAN microscope (Brno, Czech Republic) model VEGA3 SB, with a secondary electron detector (SE) from 10 to 20 kV in high vacuum conditions (work distance of 10 mm).

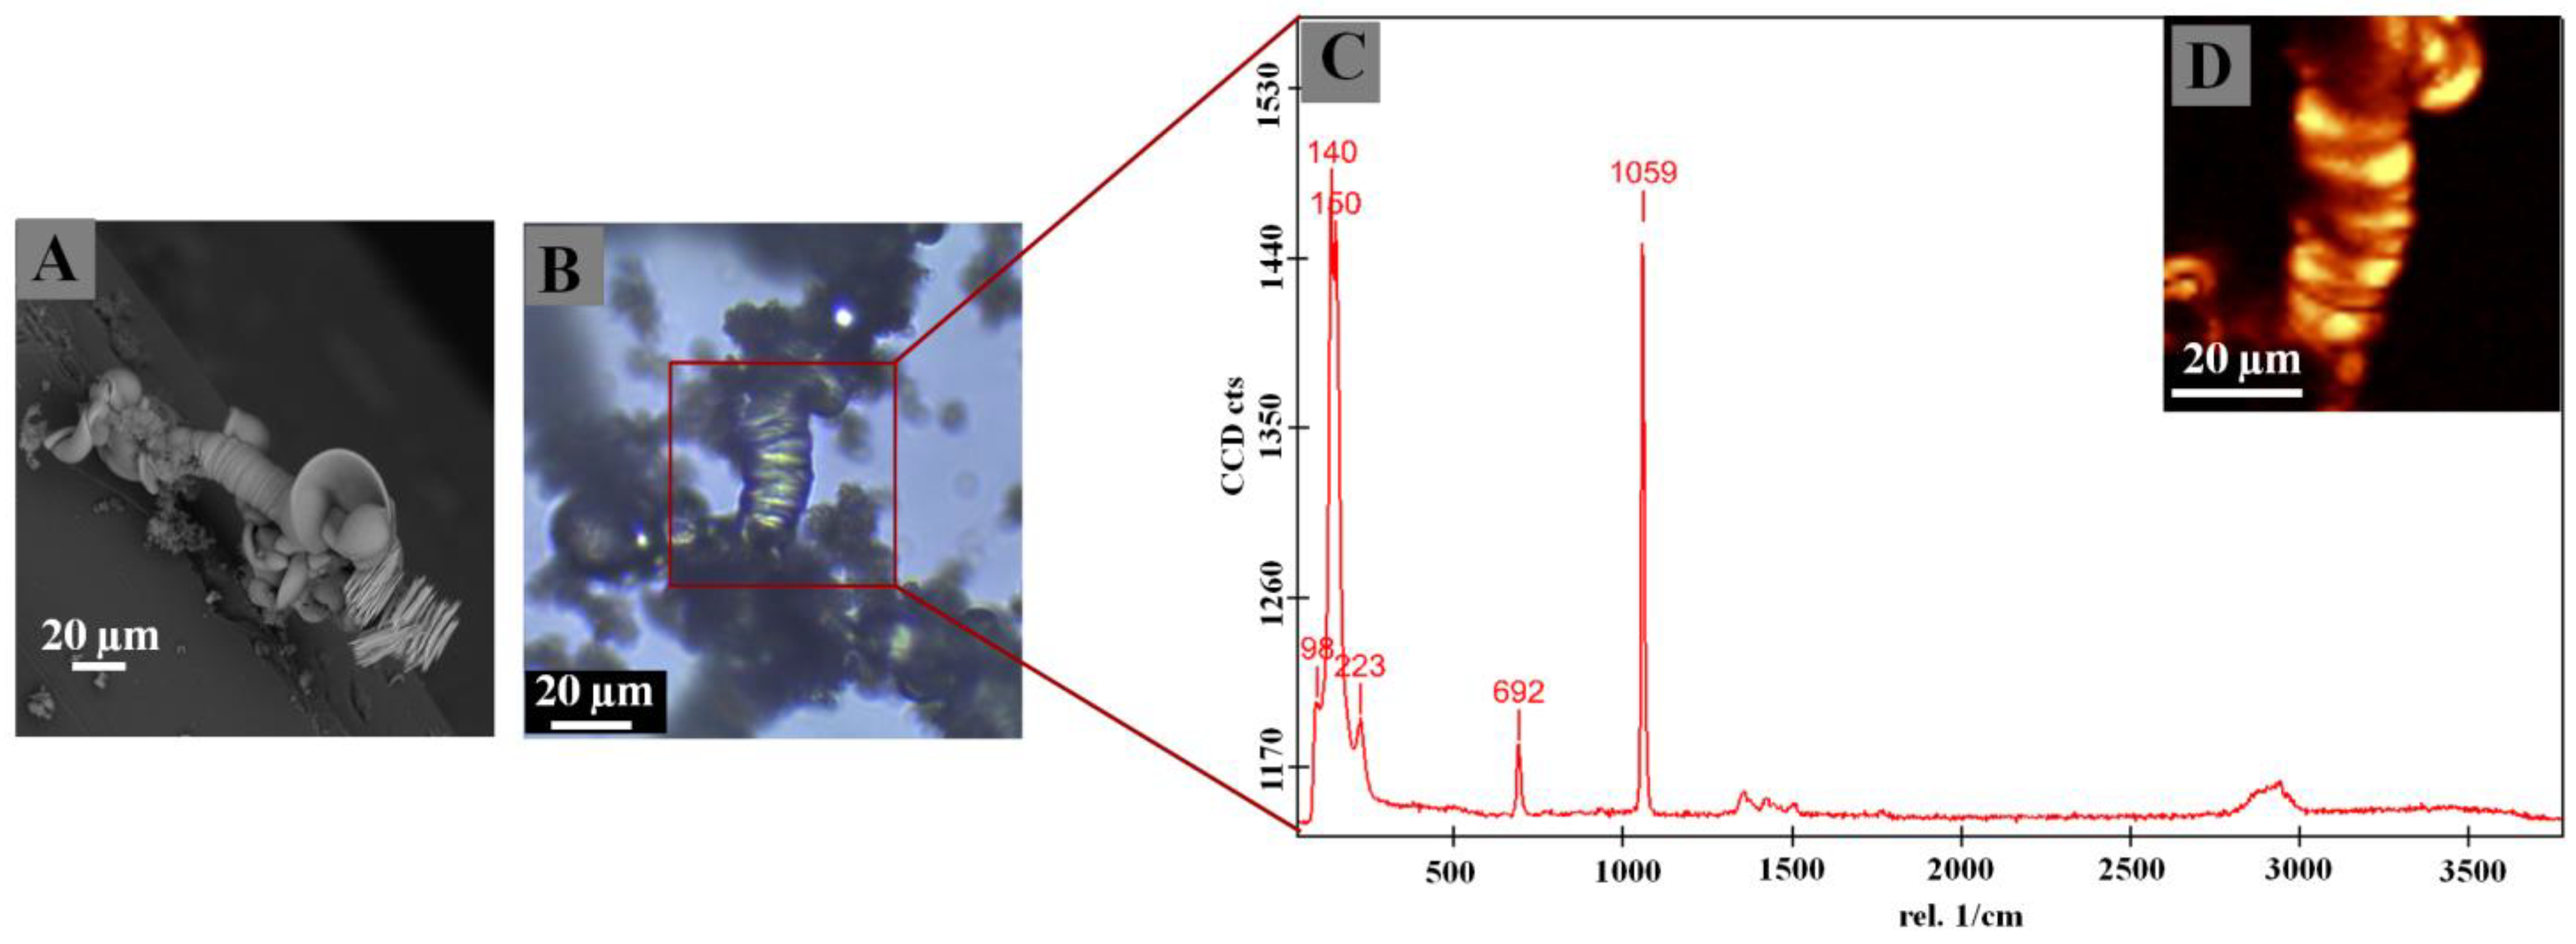
2.5.2. Raman Microspectroscopy

Raman spectra were collected using a WITec alpha300 RA spectrometer (WITec GmbH, Ulm, Germany) under ambient conditions with 532 nm laser light excitation, from a Nd:YVO4 incident laser beam, with a power of 6.37 mW and detection of 672 lines/mm grating. The incident laser beam was focused by 20×, 50×, and 100× objectives (Zeiss, Oberkochen, Germany) with 0.4, 0.75, and 0.9 NA, respectively.
Punctual Raman spectra were obtained with 0.5 s of integration time and 0.03 s for image mapping. The data processing and analysis were performed with the WITec Project Version 5.1 software.

2.5.3. Fourier-Transform Infrared Spectroscopy (FTIR)

Fourier transform infrared spectroscopy (FTIR) analyses were conducted using a Nicolet iS50R Thermo Scientific spectrometer, equipped with an attenuated total reflectance (ATR) diamond crystal accessory (Smart-iTX). Spectra acquisitions were collected with 32 scans and 4 cm−1 spectral resolution, in the range of 525 to 4000 cm−1. The data processing and analysis were performed with the OMNIC version 9 software.

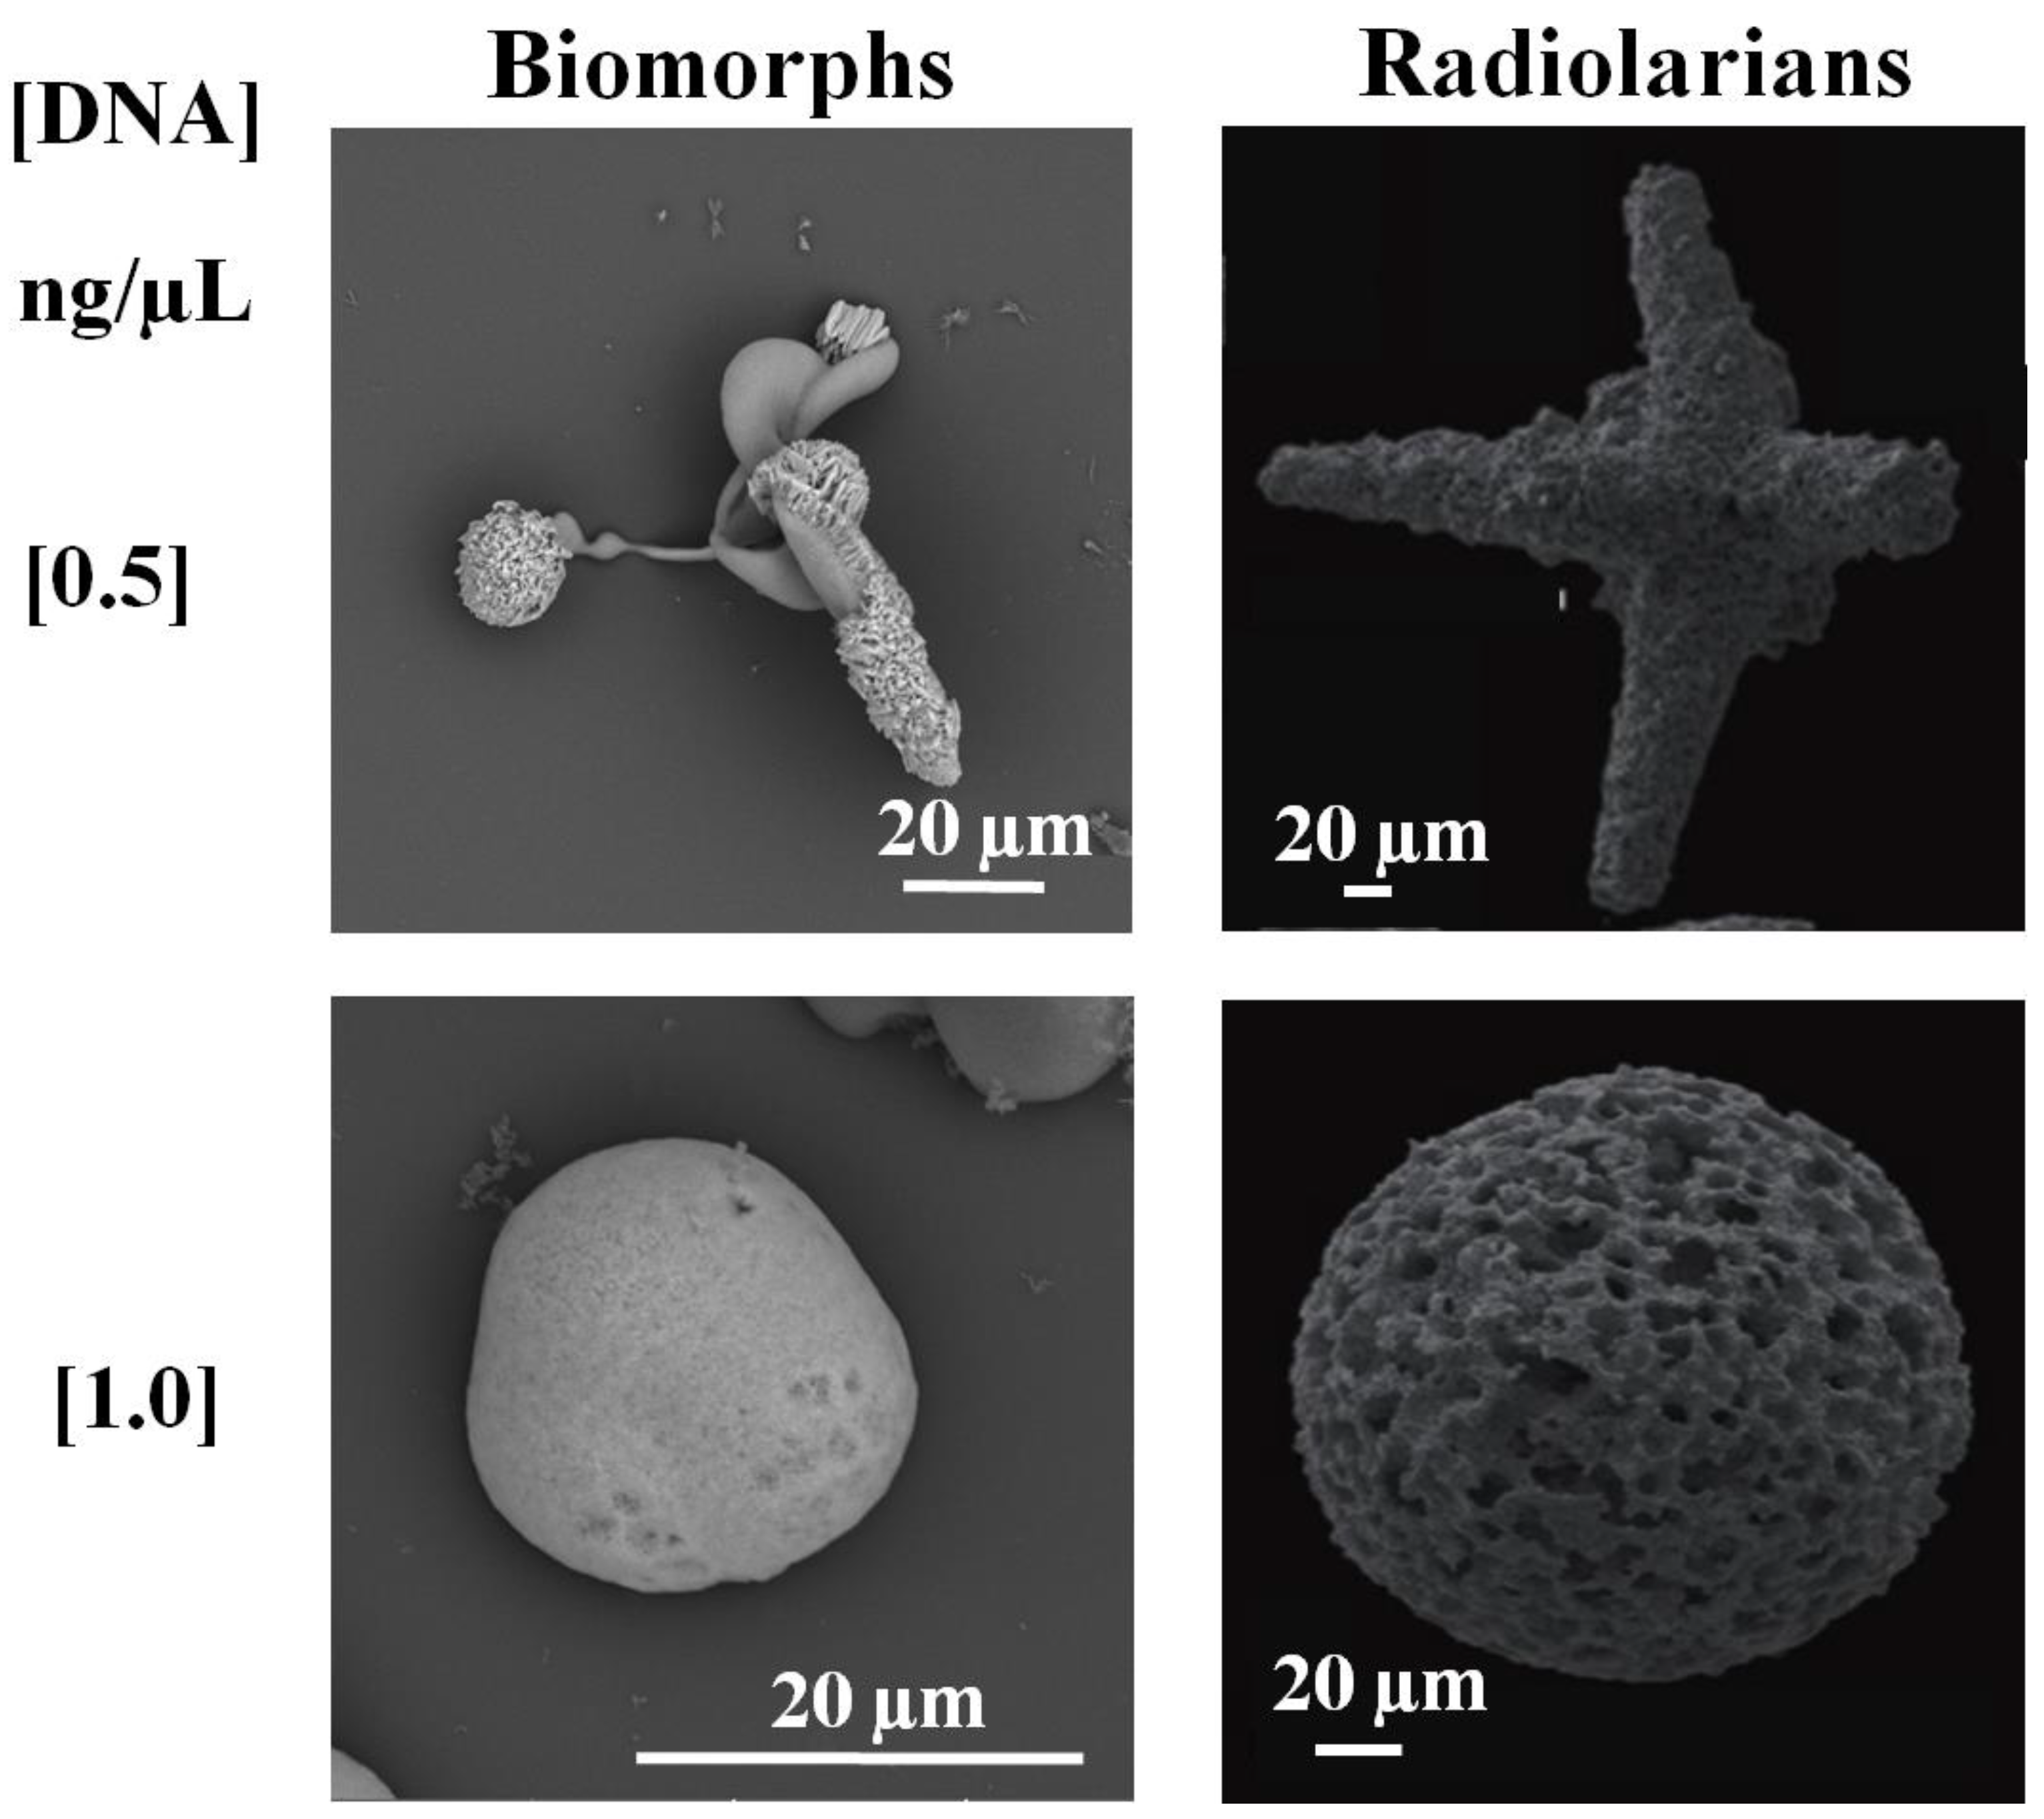
3. Results and Discussion

According to the prevailing conditions on primigenial Earth, we now know that those conditions favored the start of life in our planet. The nucleic acids were the biomolecules from which the cell originated, thus leading to life on Earth. Although the latter is fascinating, we still need to determine the minimal concentration required for the DNA of the pioneer cell to control the morphology that this prebiotic cell had to adopt. Therefore, aimed at knowing whether DNA, even at low concentrations, could affect the morphology of biomorph structures in which DNA became isolated from the environment, we synthetized barium biomorphs at five different DNA concentrations (1.0, 0.5, 0.25, 0.14, and 0.01 ng/µL) and at two CO2 concentrations, one emulating the Precambrian era (5%) and the other emulating the present one (STP). As observed in Figure 1A, in the control samples at 5% CO2, biomorphs presented sphere-type and stem structure morphologies. The formation of spheres at high concentrations of DNA and CO2 was likely caused by the highly charged molecules of the DNA (working as nucleation centers) and the local reduction in pH values at the high concentration of CO2. On the other hand, in standard CO2 conditions (STP), morphologies of leaves, stems, and flowers were found (Figure 1B). These morphologies are the most typically reported for biomorphs of barium silica carbonates in these conditions without DNA [21,22,23,32,33]. Biomorphs obtained at a DNA concentration of 0.01 ng/µL, in both CO2 conditions, presented almost the same morphology as that of the respective control (Figure 1A–D). Interestingly, at a DNA concentration of 0.14 ng/µL under a 5% CO2 flux, the morphology was a bit similar to that observed in the control biomorphs (Figure 1A,E). On the other hand, biomorphs with this DNA concentration under STP conditions started to form complex arrangements of helices (Figure 1F). The biomorphs produced at a DNA concentration of 0.25 ng/µL with 5% CO2 revealed stem morphologies (Figure 1G).
Biomorphs produced under STP conditions were arranged in leaves, short helices, and ribbons (Figure 1H). The biomorphs synthetized at 5% CO2 at a DNA concentration of 0.5 ng/µL presented structural arrangements such as stems with some spheres or leaves with spheres (Figure 1I). On the other hand, these biomorphs at the same DNA concentration but under STP conditions showed morphologies of complex arrangements such as helices and small spheres at the end (Figure 1J). These morphologies with 0.5 ng/µL DNA were different from the control biomorphs (Figure 1A,B). For the biomorphs synthetized with 1.0 ng/µL at 5% CO2 (Figure 1K), a spheric morphology was generally observed. This morphology has been adopted and reported by biomorphs in some specific conditions, such as high CO2 concentrations and in the presence of proteins [29,30]. This result reveals that, at these CO2 and DNA concentrations, DNA did indeed influence the morphology of the crystals of the obtained biomorphs. Biomorphs obtained at the same DNA concentration but in STP conditions had worm-type structure morphologies, forming arrangements with several of these structures (Figure 1L). The morphology adopted by biomorphs synthetized at DNA concentration of 1.0 ng/µL (Figure 1K,L) was completely different from that obtained at the same CO2 concentrations (Figure 1A,B). These results reveal that a DNA concentration of 0.01 ng/µL was no longer sufficient to influence the morphology.
The chemical composition and the crystalline structure of the obtained biomorphs were determined through Raman and IR spectroscopy. Raman analysis of the control biomorphs at 5% CO2 identified bands at 93, 138, 223, 690, and 1058 cm−1 (Table 1), whereas, in the control biomorphs but under STP conditions, bands at 140, 698, 1059, and 2893 cm−1 were identified (Table 1). In both samples, the identified peaks corresponded to the BaCO3 polymorph, aragonite type, named witherite [34]. The microstructure of the barium silica-carbonate crystals was also analyzed through IR spectroscopy, identifying peaks at 629, 787, 855, 937, 1059, 1417, and 1732 cm−1 (Table 1). Results confirm that this was indeed witherite.
In the biomorphs synthetized at 5% CO2 in the presence of DNA at a concentration of 1.0 ng/µL, the Raman spectrum revealed bands at 100, 498, 893, 1451, 1600, 2911, and 2962 cm−1, and the IR spectrum revealed peaks at 629, 761, 787, 891, 1033, 1417, 1732, 1969, 2860, and 2929 cm−1 (Table 1). Figure 2 shows the most representative images of the biomorphs obtained using scanning electron microscopy (Figure 2A) and optical microscopy (Figure 2B), while Figure 2C corresponds to the Raman spectrum (the inset shows the mapping of one of the biomorphs; Figure 2D).
Both Raman and IR peaks were identified as corresponding to the kerogen signal, which has been proposed as a marker of biogenicity [35,36,37,38], and our research team identified the biogenic kerogen signal for the first time in biomorphs synthetized in the presence of DNA pertaining to the five kingdoms in nature [29]. In the Raman spectrum, the kerogen signal is identified in two bands around 1300 (Band “D”) and 1600 (Band “G”) cm−1, and, in the spectrum, there may or may not appear two poorly intense bands between 2600 and 2900 cm−1 [37,38]. In biomorphs, bands D and G appear between 1300 and 1700 cm−1; generally, one or two poorly intense bands can also be identified between 2600 and 2900 cm−1 [29]. In the IR spectrum, the peaks corresponding to the kerogen signal appear approximately at 700, 900, 1630, 1710, 2890, and 2930 cm−1; there could be variations in the values of the peaks, due to the type of kerogen and its maturation degree [39]. Having identified bands characteristic of kerogen, the samples were identified as biotic type to distinguish them from the biomorphs where the kerogen signal was not identified (Table 1). In biomorphs obtained at a DNA concentration of 1.0 ng/µL, but in STP conditions, the characteristic peaks of witherite with kerogen were identified (Table 1), just like in those crystals of barium silica-carbonate produced at the same DNA concentration but under 5% CO2. Biomorphs synthetized with DNA at a concentration of 0.5 ng/µL in both CO2 conditions showed bands corresponding to witherite and kerogen; thus, they were also biotic-type biomorphs (Table 1). On the other hand, in biomorphs obtained at DNA concentrations of 0.25, 0.14, and 0.01 ng/µL under both CO2 conditions, in both Raman and IR spectra, only witherite bands were identified but not those of kerogen (Table 1). These results are relevant, on the one hand, because, in order to find evidence of life, in the Precambrian cherts, for example, we need to analyze a sample containing a minimal concentration of 0.5 ng. This could be a plausible explanation for why most evidence of unicellular life in the primigenial era was lost. In biomorphs, for example, these are generally found on nanometric scales, emulating somehow the unicellular life of the Precambrian. On the other hand, it shows that, even at a given DNA concentration of 0.25 ng, DNA still directs the morphology of the biomorph. That concentration, however, is nonetheless insufficient to identify the trace of a biomarker, such as kerogen. It has been proposed that, in different organisms, the DNA concentration varies from 0.002 pg in prokaryotes to 700 pg in eukaryotes [40,41,42]. This DNA concentration that can be identified in the cells of prokaryotes or eukaryotes differs from the DNA concentration used in the biomorphs; for example, in this case, the kerogen marker was identified in the different obtained biomorphs, which is why biomorphs have been suggested as the antecessors of the Precambrian cherts [29]. Hence, the kerogen must be identified in the biomorphs as a biomarker rather than a determinant of the DNA concentration. The DNA concentration is related to phenotypical characteristics such as the nuclear and cellular volume, the time of duplication, and the rate of embryonic development [40]. Hence, in prokaryote cells, when there is a 100% increase of DNA content, there is a 1060% increase in the cellular volume, whereas, in unicellular eukaryotes, if DNA increases by 100%, the increase in cellular volume is 93% [40]. This variation in both cellular types reveals that the DNA content generates structural differences, which we also found in biomorphs, where the DNA concentration changed the morphology together with the environmental conditions (Figure 1). This is possibly the reason why, in the Precambrian era, the first forms of life adopted morphologies in spheric shapes, with tips and stems, similarly to the morphologies adopted in conditions that emulated the Precambrian era (Figure 1 and Figure 3).
The DNA content in higher organisms has also been shown to vary not only among organisms, but also differs among different cell types of the same organism. Thus, in a study that determined the DNA concentration of 19 different human cell types, it was shown that the amount of DNA was related to the increase in cellular volume [44]. The DNA content in humans compared with other vertebrates varies, e.g., 2–448 pg in human cells, 1–266 pg in fishes, 2–260 pg in amphibians, 2–11 pg in reptiles, 3–17 pg in mammals, and 2–4 pg in birds (Figure 4) [44]. It is important to remark that the vertebrate animals include humans; the plots in Figure 4A and, particularly, Figure 4B show the content of DNA in the cell volume in different types of genomes.
The relationship between the nuclear DNA concentration and the size of the cell has also been observed in plants, in which we identified that the increase in DNA content is associated with cellular differentiation [45]. In plants, the amount of DNA differs among the different organelles and is associated with the cellular size, while the nuclear DNA content varies among species of the same genus [46,47,48]. Additionally, several authors have associated environmental factors (e.g., temperature, elevation, latitude, and precipitation) with the DNA concentration in the cells of plants [49,50,51,52].
This observation that the DNA concentration in plants depends also on environmental factors can be correlated with our results, because we found that the morphology adopted by the biomorphs varied depending on the CO2 concentration, favoring the morphology of leaves and flowers in STP conditions (Figure 1 and Figure 3), indicating that this morphology is favored in the current environment. On the other hand, the fact that the amount of DNA increases due to environmental conditions may explain why, in the current conditions of our atmosphere, the DNA could have increased in the first organisms, leading to an increment in the cellular size and, thus, giving rise to more complex organisms. The fact that DNA is the main biomolecule to which the cellular size is attributed is not a trivial issue because the understanding of what contributes to cell size has been evaluated for more than one century [38].

4. Conclusions

Synthesis of nucleic acids in the Precambrian era of the Earth marked the start of life, with DNA being the molecule where genetic information has been preserved ever since. In this work, we show for the first time how the DNA at relatively low concentrations is able to influence the morphology of the structure in which it is found, e.g., in biomorphs. Our results indicate that, even at a low DNA concentration, as was the case since the synthesis of the first DNA biomolecules available in the primigenial era, these biomolecules influenced the morphology of the inorganic structure in which they were found. This allowed the DNA to become polymerized and increase its concentration, leading to an increase in the size of the first cells, giving origin to cells with different morphologies, and leading to the formation of more complex organisms. On the other side, results allow inferring that, since the Precambrian era, once the DNA was synthetized, it has been responsible for conserving and directing the morphology of all organisms until our current time.

Author Contributions

Conceptualization, M.C.-C. and A.M.; methodology, C.D.P.-A., M.C.-C. and S.R.I.; software and validation, M.C.-C. and S.R.I.; formal analysis, M.C.-C. and A.M.; investigation, C.D.P.-A., M.C.-C., S.R.I. and A.M.; writing—original draft preparation, review, and editing, M.C.-C. and A.M. All authors have read and agreed to the published version of the manuscript.

Funding

This work was carried out with the financial support granted to M. Cuéllar-Cruz by Project No. CF2019-39216 from the Consejo Nacional de Ciencia y Tecnología (CONACYT) and Proyecto-Institucional-UGTO-017/2022 from the Universidad de Guanajuato, Mexico. Additionally, this work was partially supported by the project CONACYT No. A1-S-7509.

Acknowledgments

This work was carried out with the financial support granted to M. Cuéllar-Cruz by Project No. CF2019-39216, as well as Project No. A1-S-7509 granted to Abel Moreno from the Consejo Nacional de Ciencia y Tecnología (CONACYT) and Proyecto-Institucional-UGTO-017/2022 from the Universidad de Guanajuato, Mexico. The authors acknowledge Ingrid Mascher for the English revision of this manuscript, as well as Antonia Sánchez Marín for the final revision and English style correction of the revised manuscript. Cesia D. Pérez-Aguilar acknowledges the Proyecto-Institucional-UGTO-017/2022 grant from the Universidad de Guanajuato, Mexico. The authors thank the Laboratorio Universitario de Caracterización Espectroscópica, LUCE-ICAT-UNAM, and José Guadalupe Bañuelos for their support with the Raman measurements.

Conflicts of Interest

The authors declare no conflict of interest.

References

  1. Oro, J. Chemical evolution and the origin of life. Adv. Space Res. 1983, 9, 77–94. [Google Scholar] [CrossRef]
  2. Powner, M.; Gerland, B.; Sutherland, J. Synthesis of activated pyrimidine ribonucleotides in prebiotically plausible conditions. Nature 2009, 459, 239–242. [Google Scholar] [CrossRef] [PubMed]
  3. Petrov, A.S.; Gulen, B.; Norris, A.M.; Kovacs, N.A.; Bernier, C.R.; Lanier, K.A.; Fox, G.E.; Harvey, S.C.; Wartell, R.M.; Hud, N.; et al. History of the ribosome and the origin of translation. Proc. Natl. Acad. Sci. USA 2015, 112, 15396–15401. [Google Scholar] [CrossRef]
  4. Ban, N.; Nissen, P.; Hansen, J.; Moore, P.B.; Steitz, T.A. The complete atomic structure of the large ribosomal subunit at 2.4 Å resolution. Science 2000, 289, 905–920. [Google Scholar] [CrossRef]
  5. Fedor, M.J.; Williamson, J.R. The catalytic diversity of RNAs. Nat. Rev. Mol. Cell Biol. 2005, 6, 399–412. [Google Scholar] [CrossRef]
  6. Brunk, C.F.; Marshall, C.R. Whole Organism, Systems Biology, and Top-Down Criteria for Evaluating Scenarios for the Origin of Life. Life 2021, 11, 690. [Google Scholar] [CrossRef]
  7. Yadav, M.; Kumar, R.; Krishnamurthy, R. Chemistry of Abiotic Nucleotide Synthesis. Chem. Rev. 2020, 120, 4766–4805. [Google Scholar] [CrossRef]
  8. Orgel, L.E.; Lohrmann, R. Prebiotic Chemistry and Nucleic Acid Replication. Acc. Chem. Res. 1974, 7, 368–377. [Google Scholar] [CrossRef]
  9. Lazcano, A.; Miller, S.L. The Origin and Early Evolution of Life: Prebiotic Chemistry, the Pre-RNA World, and Time. Cell 1996, 85, 793–798. [Google Scholar] [CrossRef]
  10. Oro, J.; Stephen-Sherwood, E. The Prebiotic Synthesis of Oligonucleotides. In Cosmochemical Evolution and the Origins of Life: Proceedings of the Fourth International Conference on the Origin of Life and the First Meeting of the International Society for the Study of the Origin of Life, Barcelona, June 25−28, 1973, Volume I: Invited Papers and Volume II: Contributed Papers; Oró, J., Miller, S.L., Ponnamperuma, C., Young, R.S., Eds.; Springer Netherlands: Dordrecht, The Netherlands, 1974; pp. 159–172. [Google Scholar]
  11. Powner, M.W.; Zheng, S.L.; Szostak, J.W. Multicomponent Assembly of Proposed DNA Precursors in Water. J. Am. Chem. Soc. 2012, 134, 13889–13895. [Google Scholar] [CrossRef]
  12. Follmann, H. Deoxyribonucleotides: The Unusual Chemistry and Biochemistry of DNA Precursors. Chem. Soc. Rev. 2004, 33, 225–233. [Google Scholar] [CrossRef] [PubMed]
  13. Wachtershauser, G. The Place of RNA in the Origin and Early Evolution of the Genetic Machinery. Life 2014, 4, 1050–1091. [Google Scholar] [CrossRef] [PubMed]
  14. Dortch, Q.; Roberts, T.; Clayton, J.; Ahmed, S. RNA/DNA ratios and DNA concentrations as indicators of growth rate and biomass in planktonic marine organisms. Mar. Ecol. Prog. Ser. 1983, 13, 61–71. [Google Scholar] [CrossRef]
  15. Caldwell, P.C.; Hinshelwood, C. The nucleic acid content of Bact. lactis aerogenes. J. Chem. Soc. 1950, 1415–1418. [Google Scholar] [CrossRef]
  16. Dennis, P.P.; Bremer, H. Macromolecular composition during steady-state growth of Escherichia coli B-r. J Bacteriol. 1974, 119, 270–281. [Google Scholar] [CrossRef] [PubMed]
  17. Chícharo, M.A.; Chícharo, L. RNA:DNA ratio and other nucleic acid derived indices in marine ecology. Int. J. Mol. Sci. 2008, 9, 1453–1471. [Google Scholar] [CrossRef]
  18. Leick, V. Ratios between contents of DNA, RNA and protein in different micro-organisms as a function of maximal growth rate. Nature 1968, 217, 1153–1155. [Google Scholar] [CrossRef]
  19. Mirsky, A.; Ris, H. Variable and Constant Components of Chromosomes. Nature 1949, 163, 666–667. [Google Scholar] [CrossRef]
  20. Wächtershäuser, G. From volcanic origins of chemoautotrophic life to Bacteria, Archaea and Eukarya. Philos. Trans. R. Soc. Lond. B Biol. Sci. 2006, 361, 1787–1808. [Google Scholar] [CrossRef]
  21. Cuéllar-Cruz, M.; Moreno, A. Synthesis of crystalline silica-carbonate biomorphs of Ba (II) under the presence of RNA and positively and negatively charged ITO electrodes: Obtainment of graphite via bioreduction of CO2 and its implications to the chemical origin of life on primitive Earth. ACS Omega 2020, 5, 5460–5469. [Google Scholar]
  22. Cuéllar-Cruz, M.; Islas, S.R.; González, G.; Moreno, A. Influence of nucleic acids on the synthesis of crystalline Ca (II), Ba (II), and Sr (II) silica-carbonate biomorphs: Implications for the chemical origin of life on primitive Earth. Cryst. Growth Des. 2019, 19, 4667–4682. [Google Scholar] [CrossRef]
  23. Cuéllar-Cruz, M.; Moreno, A. The role of calcium and strontium as the most dominant elements during combinations of different alkaline Earth metals in the synthesis of crystalline silica-carbonate biomorphs. Crystals. 2019, 9, 381. [Google Scholar] [CrossRef]
  24. Cuéllar-Cruz, M.; Scheneider, D.K.; Stojanoff, V.; Islas, S.R.; Sánchez-Puig, N.; Arreguín-Espinosa, R.; Delgado, J.M.; Moreno, A. Formation of crystalline silica-carbonate biomorphs of alkaline Earth metals (Ca, Ba, Sr) from ambient to low temperatures: Chemical implications during the primitive Earth’s life. Cryst. Growth Des. 2020, 20, 1186–1195. [Google Scholar] [CrossRef]
  25. Cuéllar-Cruz, M. Influence of abiotic factors in the chemical origin of life: Biomorphs as a study model. ACS Omega 2021, 6, 8754–8763. [Google Scholar] [CrossRef]
  26. Zhang, G.; Morales, J.; Garcia-Ruiz, J.M. Growth behaviour of silica/carbonate nanocrystalline composites of calcite and aragonite. J. Mater. Chem. B 2017, 5, 1658–1663. [Google Scholar] [CrossRef] [PubMed]
  27. García-Ruiz, J.M.; Hyde, S.T.; Carnerup, A.M.; Christy, A.G.; Kranendonk, V.M.J.; Welham, N.J. Self-Assembled Silica-Carbons structures and detection of ancient microfossils. Science 2003, 302, 1194–1197. [Google Scholar] [CrossRef] [PubMed]
  28. Opel, J.; Wimmer, F.P.; Kellermeier, M.; Colfen, H. Functionalisation of silica-carbonate biomorphs. Nanoscale Horiz. 2016, 1, 144–149. [Google Scholar] [CrossRef]
  29. Cuéllar-Cruz, M.; Islas, S.R.; Ramírez-Ramírez, N.; Pedraza-Reyes, M.; Moreno, A. Protection of the DNA from selected species of five kingdoms in Nature by Ba(II), Sr(II), and Ca(II) silica-carbonates: Implications about biogenicity and evolving from the prebiotic chemistry to biological chemistry. ACS Omega 2022. submitted at August 2022. [Google Scholar]
  30. Sánchez-Puig, N.; Cuéllar-Cruz, M.; Islas, S.R.; Tapia-Vieyra, J.V.; Arreguín-Espinosa, R.A.; Moreno, A. The influence of silicateins on the shape and crystalline habit of silica carbonate biomorphs of alkaline Earth metals (Ca, Ba, Sr). Cyrstals 2021, 11, 438. [Google Scholar] [CrossRef]
  31. Noorduin, W.L.; Grinthal, A.; Mahadevan, L.; Aiznberg, J. Rationally Designed Complex, Hierarchical Microarchitectures. Science 2013, 340, 832–837. [Google Scholar] [CrossRef]
  32. García-Ruiz, J.M.; Melero-García, E.; Hyde, S.T. Morphogenesis of self-assembled nanocrystalline materials of barium carbonate and silica. Science 2009, 362, 362–365. [Google Scholar] [CrossRef]
  33. Montalti, M.; Zhang, G.; Genovese, D.; Morales, J.; Kellermeier, M.; Garcia-Ruiz, J.M. Local pH oscillations witness autocatalytic self organization of biomorphic nanostructures. Nat. Commun. 2017, 8, 14427. [Google Scholar] [CrossRef] [PubMed]
  34. Lin, C.C.; Liu, L.G. High-pressure Raman spectroscopic study of post-aragonite phase transition in witherite (BaCO3). Eur. J. Miner. 1997, 9, 785–792. [Google Scholar] [CrossRef]
  35. Strauss, H.; Moore, T.B. Abundances and isotopic compositions of carbon and sulfur species in whole rock and kerogen samples. In The Proterozoic Biosphere, A Multidisciplinary Study; Schopf, J.W., Klein, C., Eds.; Cambridge University Press: New York, NY, USA, 1992; pp. 709–798. [Google Scholar]
  36. Schopf, J.W.; Kudryavtsev, A.B. Biogenicity of Earth´s earliest fossils: A resolution of the controversy. Gondwana Res. 2012, 22, 761–771. [Google Scholar] [CrossRef]
  37. Schopf, J.W.; Kudryavtsev, A.B.; Agresti, D.G.; Wdowiak, T.J.; Czaja, A.D. Laser-Raman imagery of Earth’s earliest fossils. Nature 2002, 416, 73–76. [Google Scholar] [CrossRef]
  38. Marshall, W.F.; Young, K.D.; Swaffer, M.; Wood, E.; Nurse, P.; Kimura, A.; Frankel, J.; Wallingford, J.; Walbot, V.; Qu, X.; et al. What determines cell size? BMC Biol. 2012, 10, 101. [Google Scholar] [CrossRef] [PubMed]
  39. Ganz, H.H.; Kalkreuth, W. IR classification of kerogen type, thermal maturation, hydrocarbon potential and lithological characteristics. J. Southeast Asian Earth Sci. 1991, 5, 19–28. [Google Scholar] [CrossRef]
  40. Shuter, B.J.; Thomas, J.E.; Taylor, W.D.; Zimmerman, A.M. Phenotypic correlates of genomic DNA content in unicellular eukaryotes and other cells. Am. Nat. 1983, 122, 26–44. [Google Scholar] [CrossRef]
  41. Gunge, N.; Nakatomi, Y. Genetic mechanisms of rare matings of the yeast Saccharomyces cerevisiae heterozygous for mating type. Genetics 1972, 70, 41–58. [Google Scholar] [CrossRef]
  42. Pedersen, R.A. DNA content, ribosomal gene multiplicity and cell size in fish. J. Exp. Zool. 1971, 177, 65–78. [Google Scholar] [CrossRef]
  43. Zhang, K.; Feng, Q.L. Early Cambrian radiolarians and sponge spicules from the Niujiaohe Formation in South China. Palaeoworld 2019, 28, 234–242. [Google Scholar] [CrossRef]
  44. Gillooly, J.F.; Hein, A.; Damiani, R. Nuclear DNA Content Varies with Cell Size across Human Cell Types. Cold Spring Harb. Perspect. Biol. 2015, 7, a019091. [Google Scholar] [CrossRef] [PubMed]
  45. Zhang, C.; Gong, F.C.; Lambert, G.M.; Galbraith, D. Cell type-specific characterization of nuclear DNA contents within complex tissues and organs. Plant Methods 2005, 1, 7. [Google Scholar] [CrossRef] [PubMed]
  46. Rauwolf, U.; Golczyk, H.; Greiner, S.; Herrmann, R.G. Variable amounts of DNA related to the size of chloroplasts III. Biochemical determinations of DNA amounts per organelle. Mol. Genet. Genom. 2010, 283, 35–47. [Google Scholar] [CrossRef] [PubMed]
  47. Jovtchev, G.; Schubert, V.; Meister, A.; Barow, M.; Schubert, I. Nuclear DNA content and nuclear and cell volume are positively correlated in angiosperms. Cytogenet. Genome Res. 2006, 114, 77–82. [Google Scholar] [CrossRef] [PubMed]
  48. Hendrix, B.; Stewart, J.M. Estimation of the nuclear DNA content of gossypium species. Ann. Bot. 2005, 95, 789–797. [Google Scholar] [CrossRef]
  49. Bennett, M.D.; Smith, J.D.; Lewis-Smith, R.I. DNA amounts of angiosperms from the Antartic and South Georgia. Environ. Exp. Bot. 1982, 22, 307–318. [Google Scholar] [CrossRef]
  50. Caceres, M.E.; Pace, C.D.; Mugnozza, G.T.S.; Kotsonis, P.; Ceccarelli, M.; Cionini, P.G. Genomes size variations within Dasypyrum villosum: Correlations with chromosomal traits, environmental factors and plant phenotypic characteristics and behavior in reproduction. Theoret. Appl. Genet. 1998, 96, 559–567. [Google Scholar] [CrossRef]
  51. Rayburn, A.L. Genome size variation in Southwestern United States Indian maize adapted to various altitudes. Evol. Trends Plants 1990, 4, 53–57. [Google Scholar]
  52. Wakamiya, I.; Newton, R.J.; Johnston, S.J.; Price, J.H. Genome size and environmental factors in the genus Pinus. Am. J. Bot. 1993, 80, 1235–1241. [Google Scholar] [CrossRef]
Figure 1. SEM microphotographs of biomorphs synthetized at different DNA concentrations, in the presence of a 5% CO2 current (A,C,E,G,I,K) or in standard STP conditions (B,D,F,H,J,L).
Crystals 12 01147 g001
Figure 2. Representative image for the identification of the crystalline phase of BaCO3 biomorphs synthesized at STP conditions at a concentration of DNA of 1.0 ng/µL through Raman spectroscopy: (A) SEM microphotograph; (B) optical image; (C) Raman spectrum; (D) mapping of biomorph.
Crystals 12 01147 g002
Figure 3. Representative microphotographs of biomorphs synthetized at 1.0 and 0.5 ng/µL of DNA with 5% CO2 in comparison with a radiolarian of sponge spicules from the Niujiaohe Formation in Chongyi County, Jiangxi Province (with permission from Zhang and Feng, 2019 [43]).
Crystals 12 01147 g003
Figure 4. Relationship between nuclear DNA content and cell volume in humans. (A) Relationship between nuclear DNA content and cell size in diploid and polyploid human cells (blue) in comparison to previously reported relationships for diploid cells of vertebrates, unicellular eukaryotes, and angiosperms. Lines were fitted to previously reported relationships using ordinary least-squares regression. The range of the unicellular eukaryote cell and genome sizes is truncated to clearly show data for other groups. (B) Range of nuclear DNA content in individual human cells in comparison to ranges of diploid genome sizes within vertebrate groups. DNA content was rounded to the nearest whole number; plot and data were taken from [44] with copyright permission.
Crystals 12 01147 g004
Table 1. Identification through Raman and IR spectroscopy of the polymorphs of the barium silica-carbonate biomorphs.
Sample/DNA Concentration [ng/µL]Synthesis ConditionRaman (cm−1)IR (cm−1)Composition
Control (-)5% CO293, 138, 223, 690, 1058629, 787, 855, 937, 1059, 1417, 1732Witherite /abiotic
STP140, 698, 1059, 2893692, 796, 855, 958, 1099, 1417Witherite/abiotic
[0.01]5% CO2106, 147, 151, 700, 1067, 2915692, 789, 855, 1059, 1417, 1999Witherite/abiotic
STP93, 138, 691, 1058692, 787, 796, 855, 946, 1050, 1072, 1416, 1577Witherite/abiotic
[0.14]5% CO2112, 499, 1456, 2918649, 787, 937, 1417, 2000Witherite/abiotic
STP141, 155, 693, 1061592, 692, 767, 899, 1069, 1417, 1577, 2851Witherite/abiotic
[0.25]5% CO293, 138, 155, 222, 690, 1058, 2908582, 692, 789, 855, 1059, 1415, 1732, 1969Witherite/abiotic
STP141, 152, 223, 494693, 1061, 2909, 2967603, 796, 882, 997, 1075, 1415, 1590, 1749, 1974Witherite/abiotic
[0.50]5% CO299, 485, 1280, 1460, 2411, 2910, 2970693, 787, 856, 891, 937, 1057, 1423, 1732, 1970, 2400, 2850, 2940Witherite/biotic
STP96, 156, 692, 1060, 1360, 1415, 2917583, 692, 788, 796, 854, 947, 1071, 1416, 1560, 1770, 1979, 2160, 2480, 2820Witherite/biotic
[1.00]5% CO2100, 498, 893, 1451, 1600, 2911, 2962629, 761, 787, 891, 1033, 1417, 1732, 1969, 2860, 2929Witherite/biotic
STP96, 150, 224, 691, 1059, 1362, 1421, 2942608, 692, 796, 854, 968, 999, 1413, 1780, 2470, 2880, 2920Witherite/biotic
Publisher’s Note: MDPI stays neutral with regard to jurisdictional claims in published maps and institutional affiliations.

