Article

Powder Extrusion Printing and Sintering Densification Behaviors of Ultrafine 98W-1Ni-1Fe Alloy Powder

1
State Key Laboratory of Powder Metallurgy, Central South University, Changsha 410083, China
2
College of Mechanical and Electrical Engineering, Central South University, Changsha 410083, China
*
Author to whom correspondence should be addressed.
Crystals 2022, 12(6), 875; https://doi.org/10.3390/cryst12060875
Submission received: 26 May 2022 / Revised: 14 June 2022 / Accepted: 16 June 2022 / Published: 20 June 2022

Abstract

:
Powder extrusion printing (PEP) is an attractive fabrication technique for the automated mass production of engineering components with complicated shape and high-dimensional accuracy. This paper is concerned with PEP and sintering densification of ultrafine 98W-1Ni-1Fe powder. Three kinds of binder systems were designed. The influence of binder composition on the rheological behavior of the PEP feedstocks has been investigated. Results showed that all the feedstocks present pseudoplastic flow behavior. Compared with the FS-55 and FS-70 feedstocks, the FS-65 feedstock is more suitable for the PEP of ultrafine 98W-1Ni-1Fe powder due to its better comprehensive rheology and more homogeneous microstructure. The PEPed ultrafine 98W-1Ni-1Fe can be sintered to near full density at 1420 °C, which is much lower than traditional micro-scaled powder. The sintered 98W-1Ni-1Fe shows good mechanical performance due to its fine and uniform microstructure, its tensile strength can reach ~800 MPa, and its grain size is about 15 μm.

1. Introduction

Tungsten heavy alloys have the advantages of high density, high strength, and high toughness, so they are widely used in military, nuclear energy, aerospace, and other fields [1]. In recent years, with the rapid development of cutting-edge science and technology in various fields, the need for three-dimensional, complex-shape tungsten alloy components is constantly increasing. But the high hardness and high cost make it very difficult to produce complex-shaped tungsten alloy parts using traditional machining technology. Introducing 3D printing technology into the manufacturing of tungsten alloy components is an ideal solution. At present, the mainstream 3D printing technology includes selective laser melting (SLM), electron beam melting (EBM), and laser deposition manufacturing (LDM). However, due to the very high melting point of tungsten, tungsten alloys prepared with this kind of melting technology have some problems, such as uneven microstructure, easy cracking, and poor mechanical properties.
Compared with previous techniques, powder extrusion printing (PEP) is a more reasonable 3D printing technology for preparing tungsten alloy components. PEP starts by blending a thermoplastic binder with a powder suspension mixture, referred to as feedstock, followed by PEP, binder removal and sintering [2]. PEP is a promising method to produce complex-shaped tungsten alloy parts with high microstructure homogeneity and high mechanical performance.
The feedstock homogeneity has a significant influence on the flow behavior and the performance of sintered parts, so the mixing of binder and powder is a crucial phase in PEP. In the mixing process, powder is mixed with polymeric binders with different ingredients to form a high solid loading suspension, then, under computer control, the suspension mixture (feedstock) is PEPed into a given shape. The feedstock requires a certain degree of fluidity to facilitate complete printing and also needs a sufficient yield stress for shape retention during subsequent binder removal. Thus, the successful PEP would depend strongly on the binder system, because the binder components not merely influence the feedstock rheology, but also critically affect the integrity and shape retention of the printed green part.
Typical particle size of tungsten alloys involved in PEP is at the micro scale (10–20 μm). However, due to the high melting point of tungsten (about 3420 °C), PEPed tungsten alloy always needs a relatively higher temperature to obtain full or near-full density. As a result, the sintered bodies usually show a coarse grain which leads to considerable deterioration in mechanical performance [3,4,5]. Ultrafine powder possesses larger surface-to-volume ratio, so use of ultrafine powder as raw material can remarkably decrease the sintering temperature due to the increase in surface energy of the sintering system [6,7,8]. However, the ultrafine powder possesses diverse intrinsic properties, such as high surface area and strong adhesion, which will result in a remarkable increase in feedstock viscosity and a decrease in powder loading [3]. This means that binder composition selection for such a powder is of great importance in order to achieve low feedstock viscosity [9]. The PEP binder system usually consists of a major component, minor component, and various processing agents such as surfactant and plasticizer [10]. In this study, a wax-polymer-oil binder system, which has not yet been reported, was selected for the PEP of ultrafine 98W-1Ni-1Fe powder because of its low viscosity. The effect of binder composition on the feedstock rheological behavior was investigated in detail. Thereafter, the sintering densification, microstructure, as well as mechanical performances of PEPed 98W-1Ni-1Fe were investigated in detail.

2. Experimental Materials and Procedure

2.1. Powders

The raw material was sol-spray dried and hydrogen-reduced 98W-1Ni-1Fe powder (Lab-made) with a BET size (tested by specific surface area method) of 128 nm. In our previous research, the as-received ultrafine 98W powder shows a powder loading of less than 40% when used for PEP due to its severe agglomeration (As shown in Figure 1a). In order to increase the powder loading, the as-received powder was ball milled, for 5 h using a planetary ball mill at a speed of 200 rpm, adding 1 wt.% stearic acid (SA, Alladdin, Shanghai, China) in the powder as surfactant. Absolute ethyl alcohol (Alladdin, China) was chosen as wet milling medium, ball-to-powder weight ratio (BPR) and liquid-to-solid volume ratio (LSR) were maintained at 2:1. The morphology of the milled powder is shown in Figure 1b. The powder has a BET size of 123 nm and a particle distribution of D10 = 0.28 μm, D50 = 2.14 μm, and D90 = 7.34 μm. The particle morphologies of the as-received and the milled powder were observed with a Scanning Electron Microscope (SEM, JSM-6360LV, Beijing, China), the particle size distribution was measured using a laser scattering particle analyzer (Micro-Plvs, Malvern, UK).

2.2. Binder Systems

Ingredients of the binder used in this study were paraffin wax (PW, Kunlun, Shanghai, China), high density polyethylene (HDPE, Sinopec, Beijing, China), ethylene-vinyl acetate copolymer (EVA, Alladdin, China), oil, dioctyl phthalate (DOP, Alladdin, China) and stearic acid (SA, Alladdin, China). The characteristics of each pure component are shown in Table 1. The compositions of the three binder (feedstock) systems used in the present study are listed in Table 2. For each binder system, the binder components were mixed in an XSS-300 Rheocord mixer (Kechuang, Taizhou, China). The total mixing time was 30 min.

2.3. Feedstock Preparation

The mixing of powder and three binder systems were also conducted in XSS-300 Rheocord mixer (Kechuang, China) at a temperature of 130 °C and rotation speed of 50 rpm for 45 min. In this study, a solid loading of 50% was prepared for mixture. After mixing, the feedstock was granulated.

2.4. Rheological Measurements

A capillary rheometer (Instron 3211, Boston, MA, USA) was used to examine the rheological behavior of each kind of feedstock. In a capillary rheometer, the suspension is pushed by a plunger through the capillary. Under the situation of stable-state flow and from the measurement of the pressure fall and volume flow rate through the capillary, the shearing stress and shearing rate can be obtained, from which the viscosity can be worked out. The rheometer cavity was pre-heated to 105, 115, 125, 135, and 145 °C for each feedstock. The shearing rate was set in range of 1.79~596.1 s−1 and 10 min melting duration was used for each measurement.

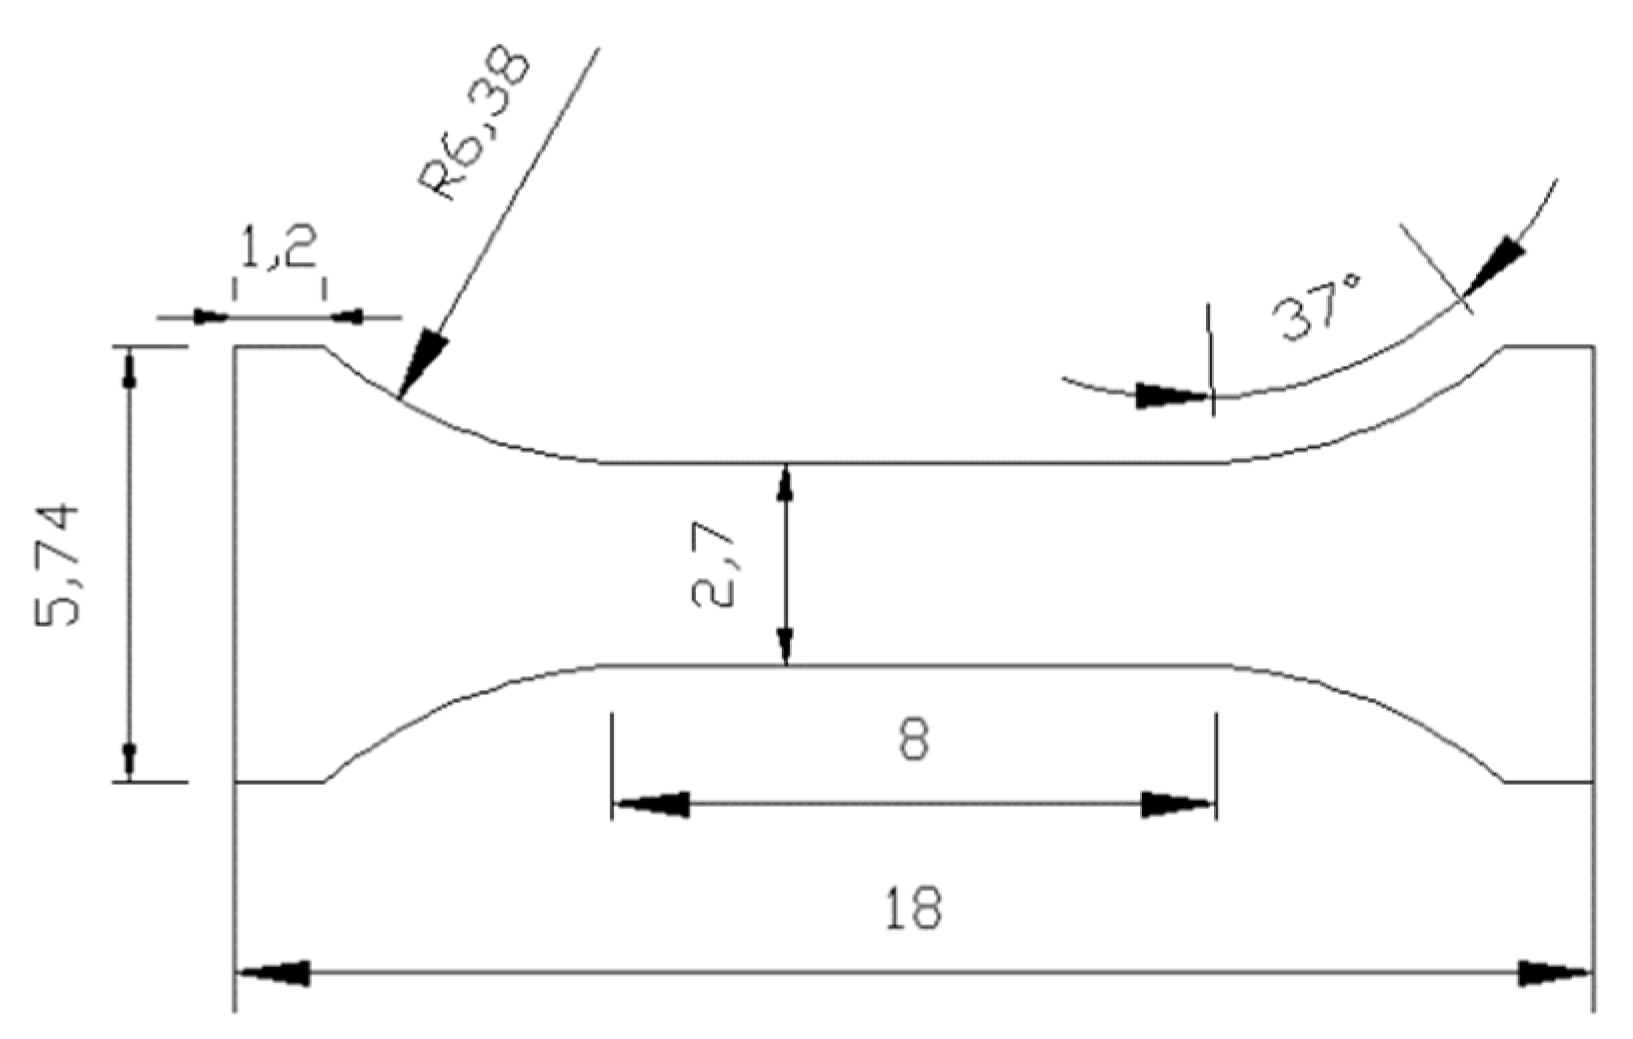
2.5. PEP, Sintering, and Performance Test for the Sintered Compacts

The feedstocks were extruded into ‘I’- shaped standard tensile samples (Figure 2) by a PEP machine (UPRISE 3D, Guangzhou, China). Then the PEPed green compacts were debinded by solvent debinding subsequent with thermal debinding. After that, the debinded compacts were sintered at different temperatures (1360 °C, 1390 °C, 1420 °C, 1450 °C, 1480 °C, 1510 °C) for 2 h, 2 °C/min heating rate and H2 protective atmosphere was employed. The density of the sintered compacts were tested using Archimedes drainage method. The microstructure was observed using SEM (JSM-6360LV, Beijing, China). The tensile strength was tested by mechanical testing machine (Instron 3369, Boston, MA, USA).

3. Results and Discussion

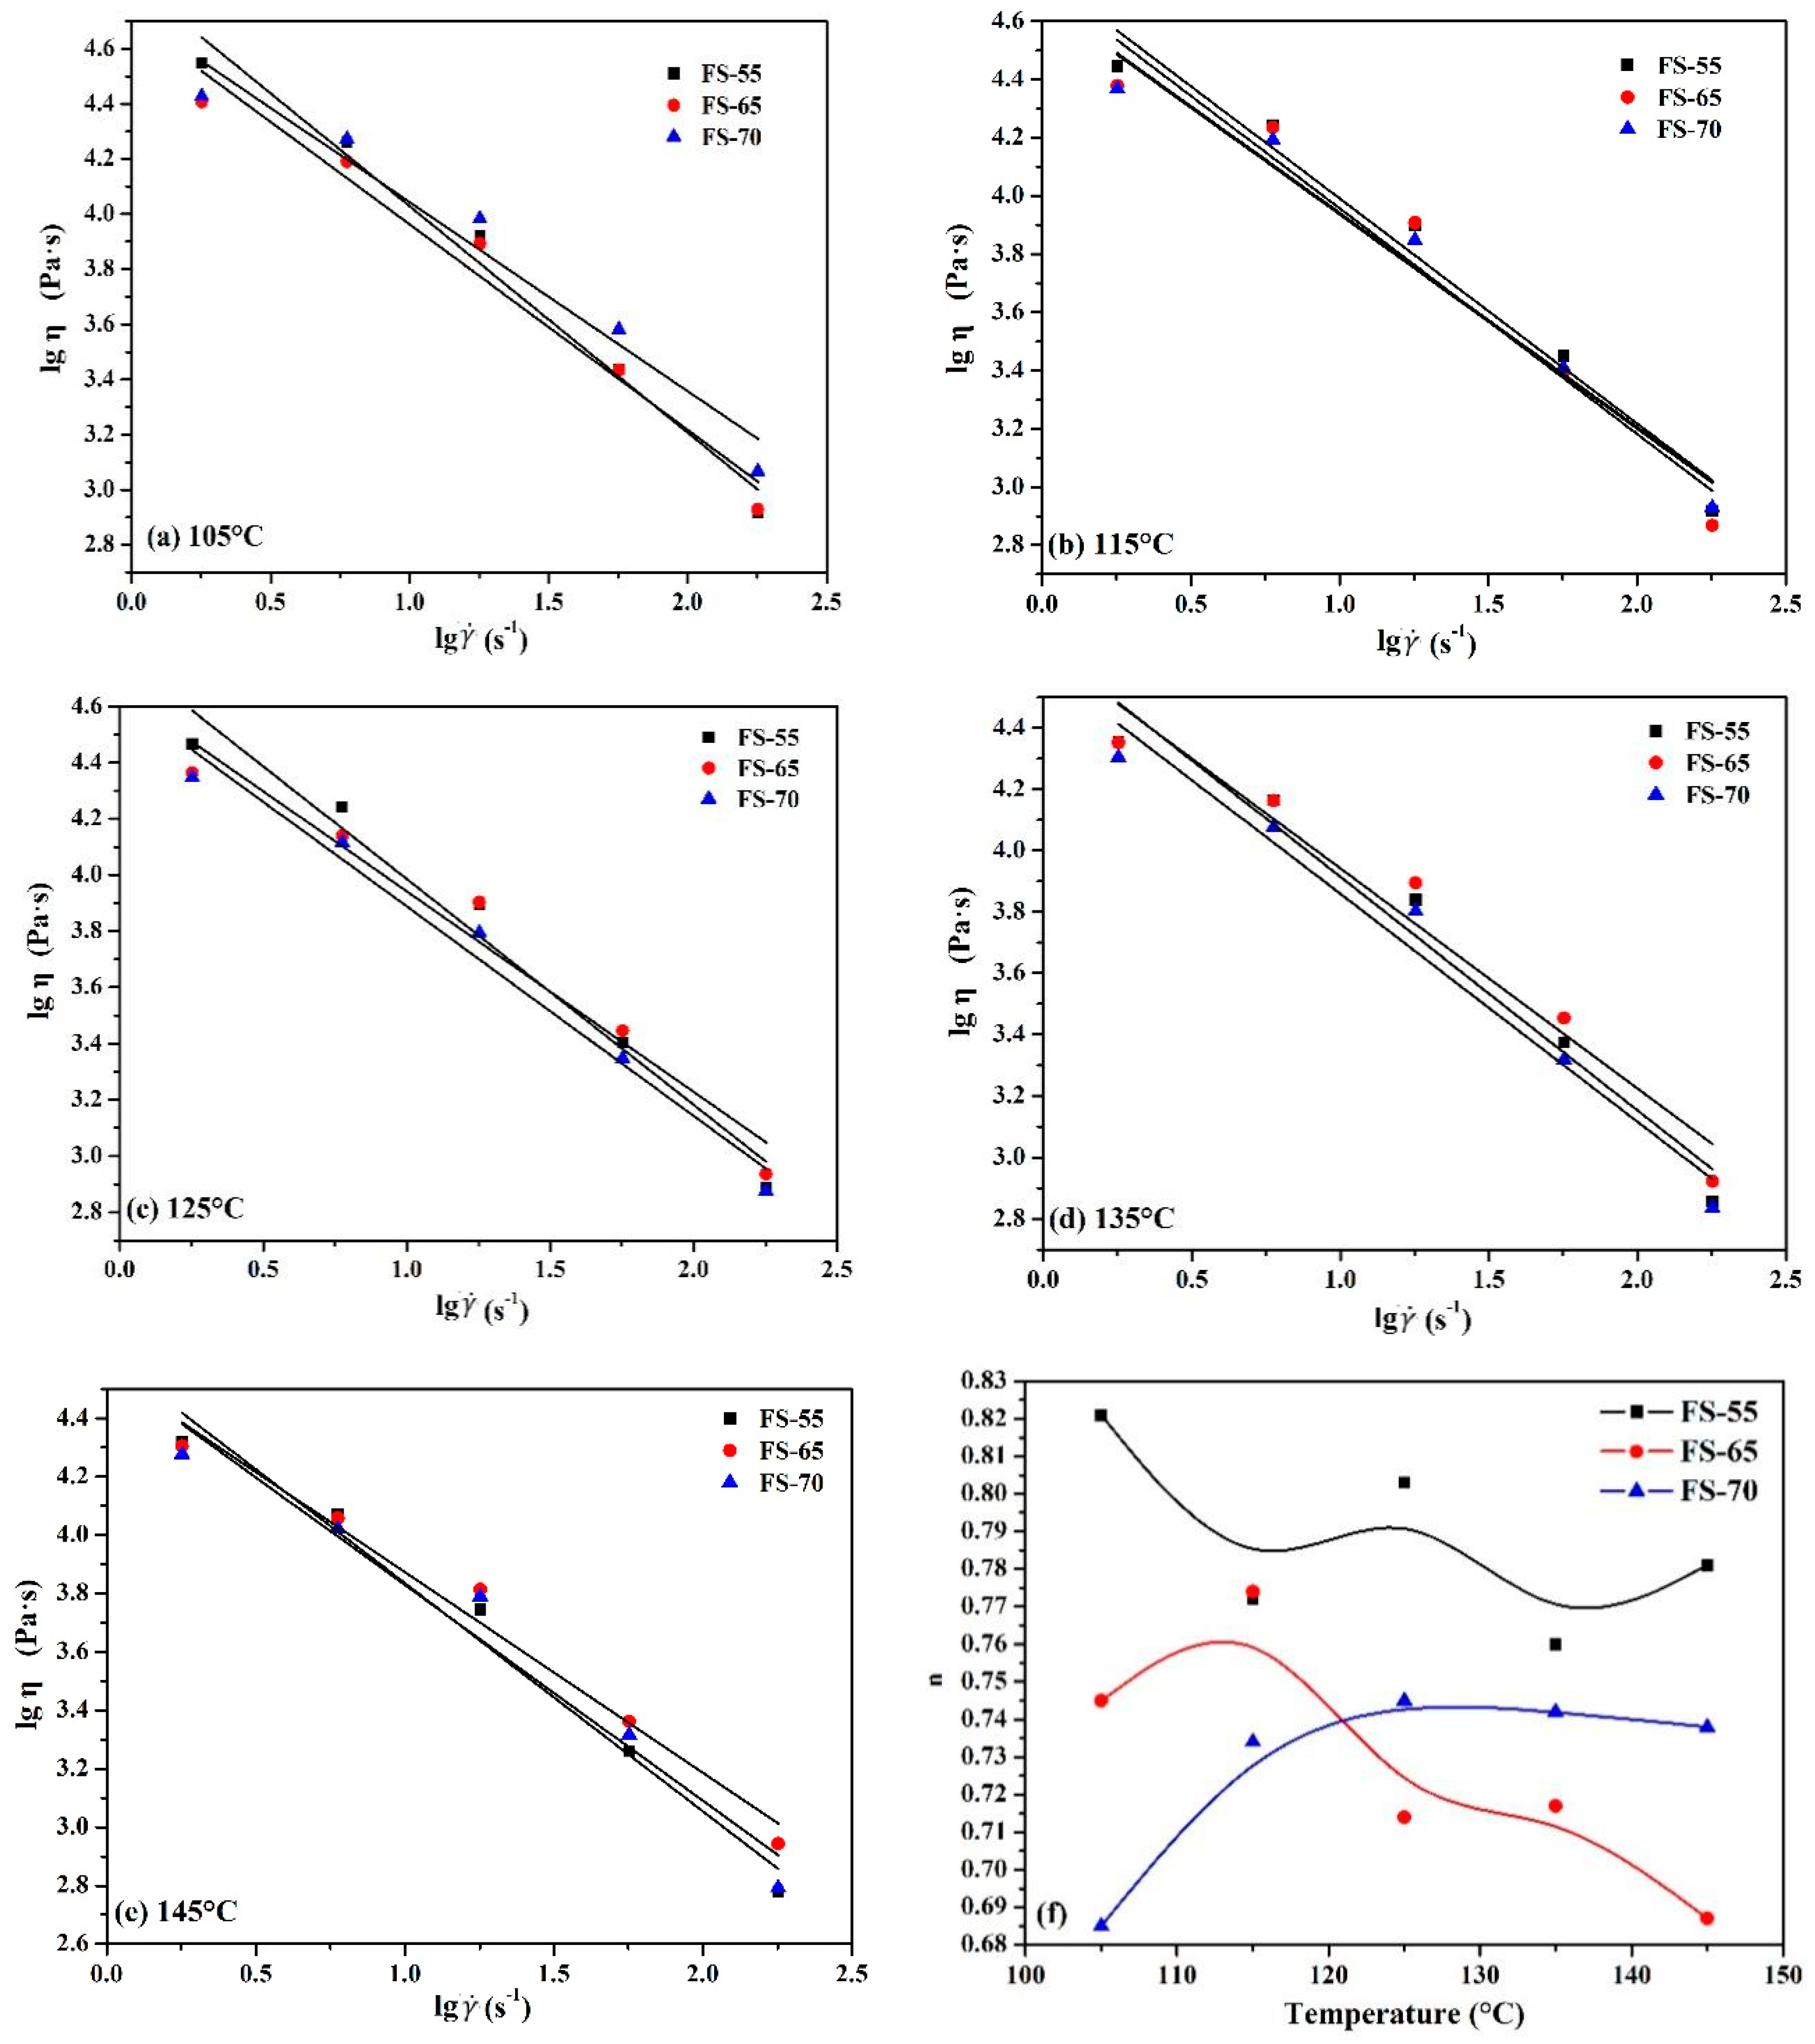
3.1. Feedstock Viscosity

The suspension viscosity, which associates the shearing stress with the shearing strain rate, as well as the viscosity sensitivity with temperature and shearing rate, is usually used to estimate the rheological performances of various feedstocks [11]. Generally, a better feedstock should have low viscosity and insensitivity to temperature and shearing rate to minimize problems produced by a fluctuating condition in the actual PEP procedure [12]. The experimental results of the apparent viscosity versus the shearing rate at different temperatures for three feedstocks are plotted with a log-log scale, as schematically illustrated in Figure 3. It displays that the viscosity of all three kinds of feedstocks declines as the shearing rate goes up. Particularly, it seems to be in good agreement with pseudoplastic behavior because of the good linear fittings according to the following equations [12]:
τ = K γ ˙ n ,   η = τ / γ ˙
where τ is the shear stress (Pa) and, K   is   a   constant , γ ˙ is shearing rate (s−1), η is the viscosity, and n is flow behavior index (n < 1), which shows the sensitivity of viscosity to shearing rate, it can be confirmed by plotting the relation between the viscosity and the shearing rate on a logarithmic scale. A higher n value means slower viscosity changing rate with shearing rate variation and better deformation stability. However, n > 1 shows a dilatant suspension where the binder and powder will separate under a high shearing rate.
The changing of n at various temperatures for three kinds of feedstocks is present in Figure 3f. It shows that n value of FS-55 is the highest at temperature range 105–145 °C, meaning a more stable viscosity to shearing rate than that of other feedstocks. This might be correlated to its highest amount of polymer composition (HDPE + EVA). At the same time, maximum n value emerges at 105 °C, which means it is more stable at lower temperature. For the FS-65, the n value first increases till the maximum is reached at 115 °C and then it shows a decreasing tendency as the temperature further increases. Therefore, the FS-65 is most resistant to shearing at 115 °C. The n value of the FS-70 exhibits a similar trend as the FS-65, but the temperature to yield a peak value is 125 °C and thereby at such a temperature the FS-70 is expected to be most stable.
Figure 4 illustrates the changing in the feedstock viscosity with temperature at shearing rate of 178.8 s−1, which is close to the actual shear rate during PEP. It shows that the FS-70 viscosity decreases rapidly with temperature rising whereas the FS-55 viscosity decreases slowly with temperature increasing. In contrast, the viscosity of the FS-65 merely presents slight fluctuations in the temperature range investigated. Therefore, it can be preliminarily concluded that the FS-65 feedstock has the best thermal stability.
The correlation between viscosity and temperature can be conveyed by Arrhenius-type formula [13]:
η ( T ) = η 0 exp E R T
where η0 is reference viscosity at the reference temperature T0, R is the gas constant, E is viscous flow activation energy, T is temperature. E determines the susceptibility of viscosity to temperature. A larger E means a strong susceptibility of viscosity to temperature variation. When melt extruded from the nozzle, a temperature gradient would produce in the PEPed parts. If the viscosity remarkably fluctuates with temperature, stress concentration, cracks, or shape distortion will occur in large part due to its heterogeneous shrinkage during cooling. On the whole, a smaller E, i.e., a low temperature sensitivity, is expected to minimize these problems. In order to eliminate the shear effects on the temperature sensitivity, we figured out the E values of the three kinds of feedstocks at the shear rate of 1.79 s−1, which is close to zero-shearing. At this condition, the viscosity natural logarithm of the three kinds of feedstocks is plotted against the reciprocal of temperature in Figure 5. E values can be obtained after linearly fitting the experimental data and they are EFS-55 = 128.0 kJ/mol, EFS-65 = 53.4 kJ/mol, and EFS-70 = 85.0 kJ/mol, respectively. Based on the calculated E values, we can conclude that the FS-65 has the lowest temperature sensitivity, which is consistent with the consequences mentioned above.
αSTV, a composite flow index [14], is usually used to assess the comprehensive feedstock rheological property:
α STV = 10 9 η 0 | l o g η l o g γ ˙ | | l o g η 1 / T | = 10 9 η 0 | n 1 | E / R
where S is the sensitivity to shearing rate, T is the sensitivity to temperature and V is viscosity. A higher αSTV represents a better rheological performance. At a shear rate of 178.8 s−1, the αSTV is calculated to be (αSTV)FS-55 = 14.06, (αSTV)FS-65 = 48.42, and (αSTV)FS-70 = 33.23 at 105 °C, 115 °C, and 125 °C, respectively. Therefore, it can be verified that the FS-65 is more appropriate for PEP of the ultrafine 98W powder.
To perform express analysis of homogeneity of prepared green parts before sintering, a sample of each kind was broken and the fracture surface was analyzed. The SEM images (Figure 6) of the three kinds of green parts PEPed at the shearing rate of 178.8 s−1 and at temperature of 105 °C, 115 °C, and 125 °C, respectively, allow suggesting that the microstructure of the FS-65 is more homogeneous compared with the other two.

3.2. Sintering Densification and Mechanical Properties

The ball milled powder was extruded into ‘I’-shape tensile samples using FS-65 binder system at a powder loading of 50% (Named as W-Ni-Fe-5). For a comparison, the as-received powder was also extruded into ‘I’-shape tensile samples using FS-65 binder system at a powder loading of 40% (Named as W-Ni-Fe). Figure 7 shows relative density of the two kinds of powder varying with sintering temperature. It shows that the relative density of the two powder firstly increase with the increase of sintering temperature, both of which can reach above 99% at 1330 °C. The W-Ni-Fe-5 powder reached its highest relative density, 99.82%, at 1420 °C, meanwhile, the W-Ni-Fe powder reached its highest relative density, 99.76%, at 1450 °C. With the temperature continued to rise, the relative densities of the two powders showed a decreasing trend. Before reaching the maximum relative density, the relative density of ball-milled powder at each temperature point is higher than that of non-milled powder. After reaching the maximum relative density, the decrease rate of sintering relative density of ball-milled powder is significantly higher than that of non-ball-milled powder. This suggests that the ball milling promoted the densification process and accelerates the decrease trend of relative density significantly after reaching the maximum relative density. This enhanced sintering effect may be result from ball milling results in a decrease in grain size and an increase in lattice defects in the powder system, which promotes atomic mobility during the sintering process [8].
As is depicted in Figure 8, the tensile strength of the two kinds of powders varies with sintering temperature, it shows that both firstly increase with sintering temperature, with the W-Ni-Fe-5 reaching its maximum tensile strength at 1420 °C and W-Ni-Fe reaching its maximum tensile strength at 1450 °C, which are 781 MPa and 725 MPa, respectively, then both of which decrease as the temperature continues to rise. The tensile strength of sintered W-Ni-Fe-5 is always higher than that of W-Ni-Fe, this shows that the ball milling treatment not only has effect of promoting sintering densification, but also improving the mechanical properties.

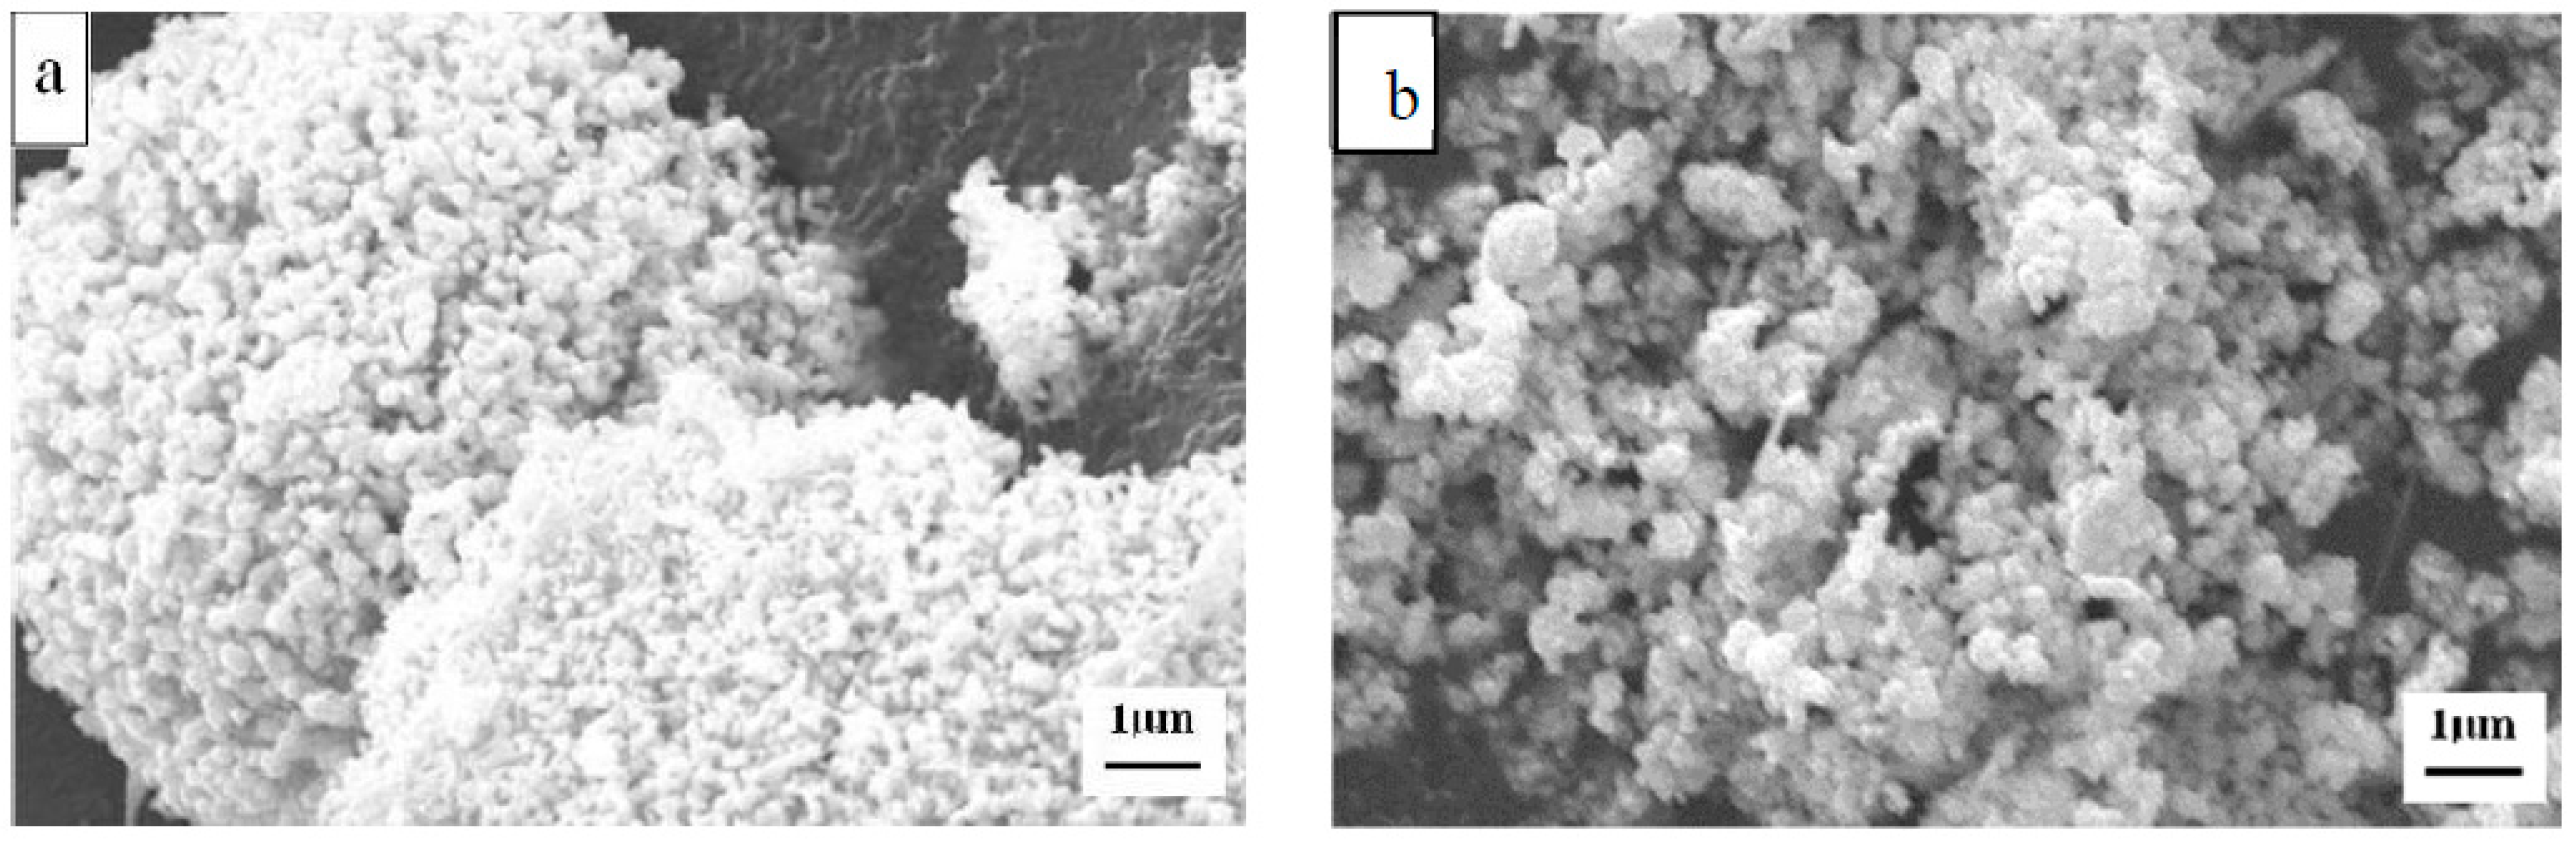
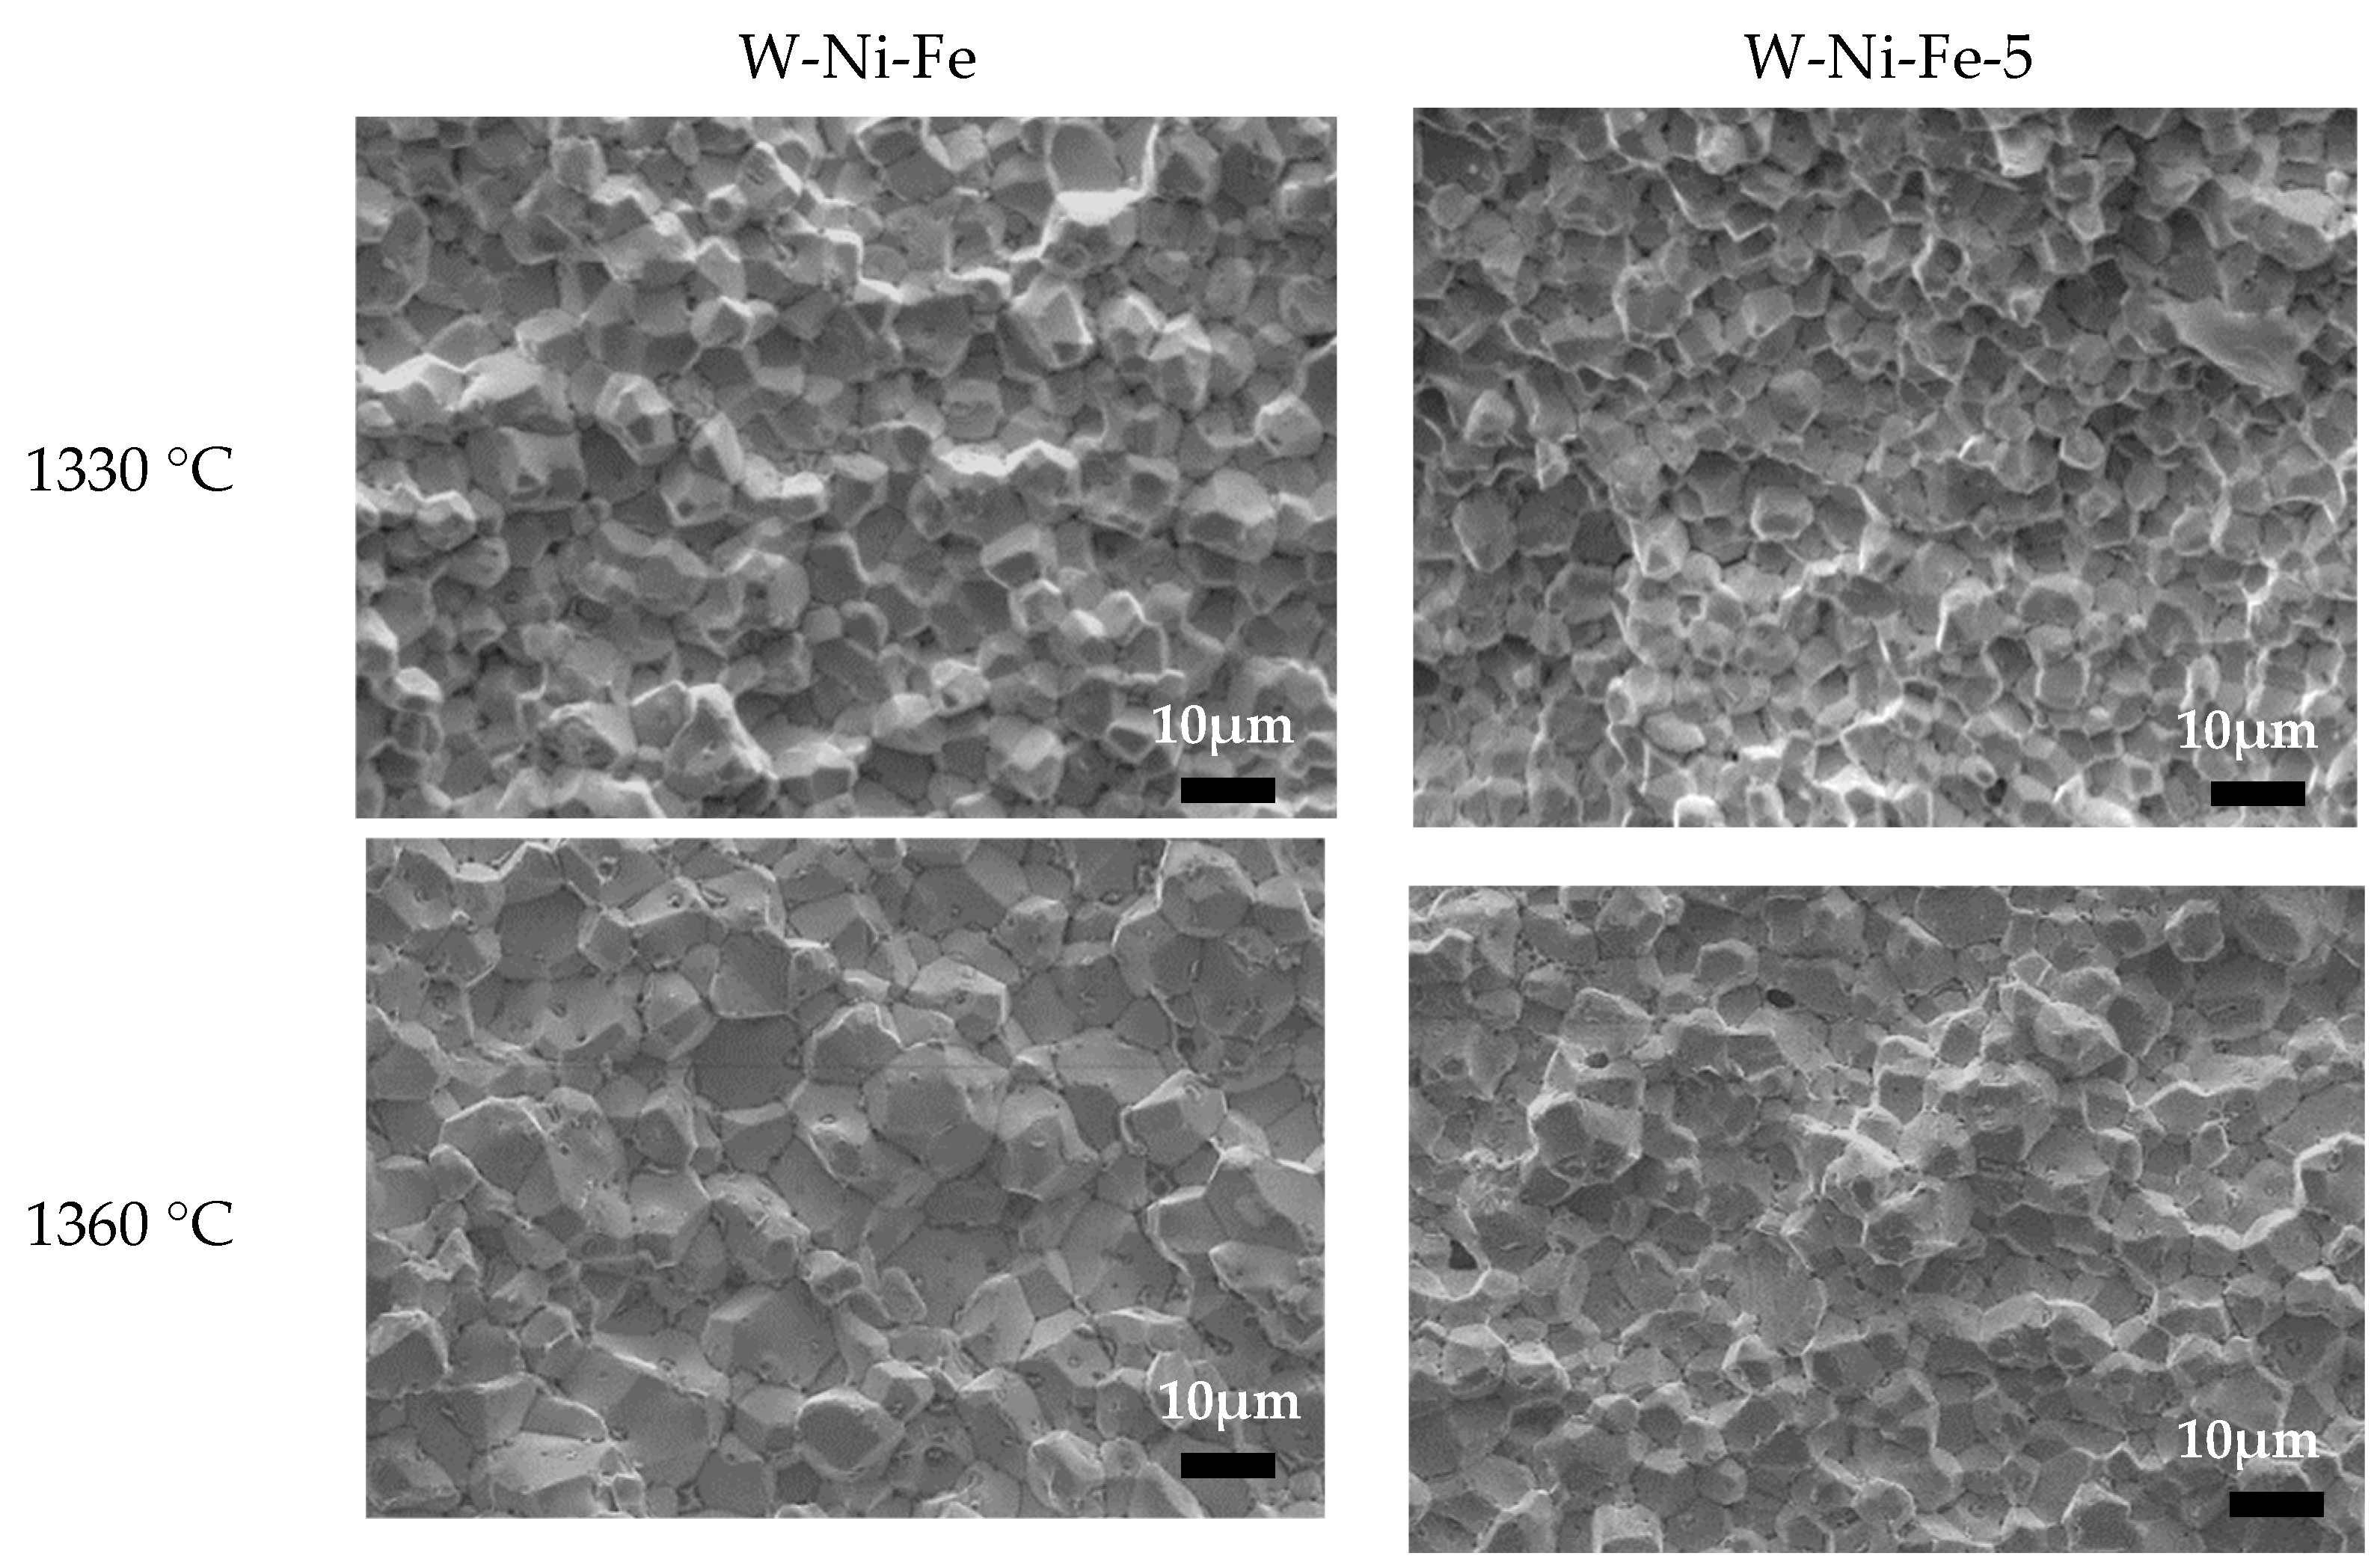
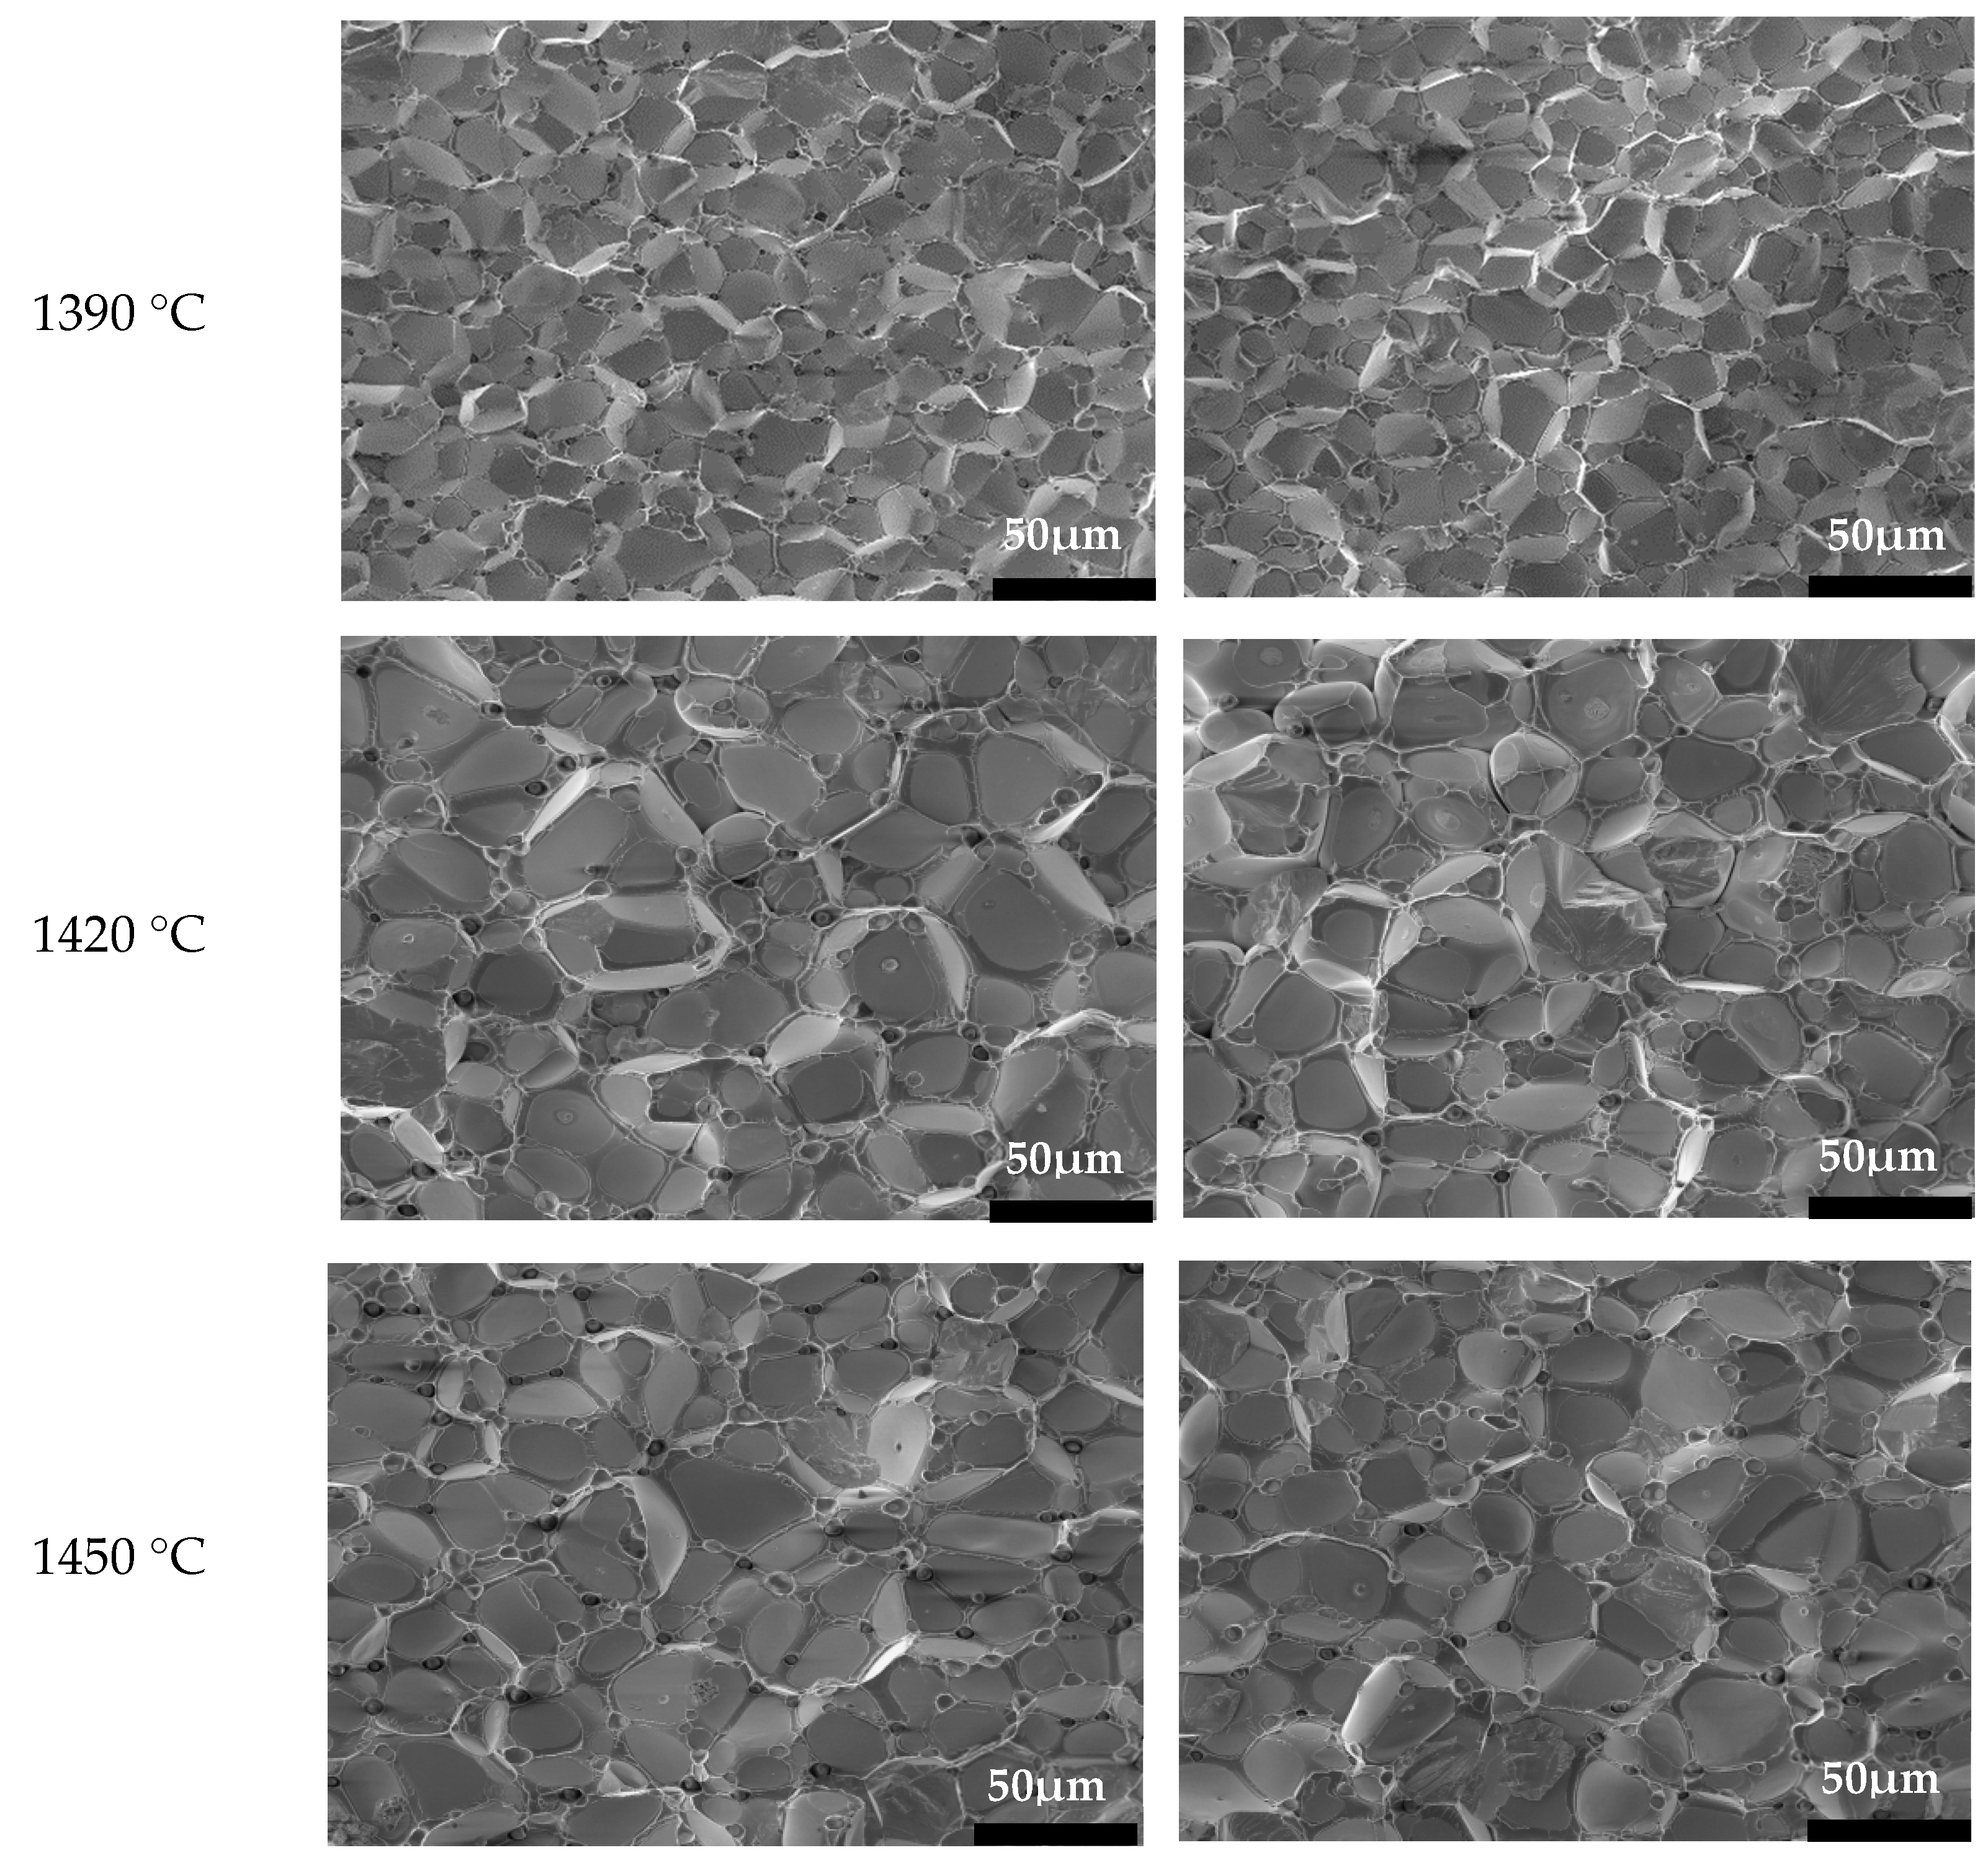
3.3. Microstructures

Figure 9 shows the fracture microstructure morphologies of W-Ni-Fe and W-Ni-Fe-5 sintered at various temperatures. It reveals that, at temperatures below 1360 °C, the sintering of two kinds of powder is solid phase sintering, the sintered materials possess small tungsten grains with polygon shape. It also can be seen that at 1330 °C, some pores exist between grains, and at 1360 °C, both materials become very dense. This suggests that the solid phase sintering plays a very important role in the sintering densification process. In this condition, the material fractures are mainly intergranular fractures due to the low bonding strength between the grains, leading to a lower tensile strength.
As also is portrayed in Figure 9, at a temperature of 1390 °C some liquid phase can be observed in both materials, grain spheroidizing is just beginning. Tungsten grains begin to grow to a certain extent, meanwhile, according to Figure 8, the tensile strength of both materials also show a certain growth. This is due to the presence of liquid phase causing the fractures, mainly tearing in the Ni-Fe bonding phase. When sintering temperature reaches 1420 °C, large quantities of liquid phase generate, and grain size has increased significantly. At this point, the intergranular tear is more apparent, and transgranular fractures are more prominent, so the tensile strength of the material at this time is almost at its highest. When the temperature continues rising to more than 1450 °C, the grain sizes increases continuously, and large grain size leads to a decline in mechanical performance.
Figure 10 shows the grain size changing with the increasing temperature. It can be seen that the grain size of the two kinds of materials firstly increases slowly with increasing temperature, and increases rapidly when the temperature is higher than 1390 °C, this is due to the appearance of the liquid phase. Under 1420 °C, the grain size of W-Ni-Fe-5 material is smaller than that of W-Ni-Fe, this is due to the smaller grain size produced by ball milling. When temperatures continue to rise to 1420 °C, grain size of the W-Ni-Fe-5 material increases very quickly and exceeds that of W-Ni-Fe. This shows that ball milling can provide greater driving force for grain growth and leads to larger grain size. As mentioned above, ball milling provides a smaller grain size, hence smaller tungsten grain size was obtained at a temperature below 1420 °C, which is beneficial for obtaining a higher mechanical strength along with a higher densification rate. Ball milling also provides a much larger internal energy, which can serve as a grain growth driving force, so tungsten grain size grows rapidly when the temperature is higher than 1420 °C.
Majumdar et al. [15] reported the preparation of W-2Ni-1Fe alloy from micro-scaled powder using die pressing subsequent with liquid phase sintering, their results show that this material has a tensile strength of about 850 MPa, and tungsten grain size of 25–40 μm, at the optimized sintering temperature of 1500 °C. As a comparison, the 98W-1Ni-1Fe alloy prepared by PEP method in this study can reach an equivalent mechanical performance at a much lower sintering temperature and tungsten grain size (~15 μm).

4. Conclusions

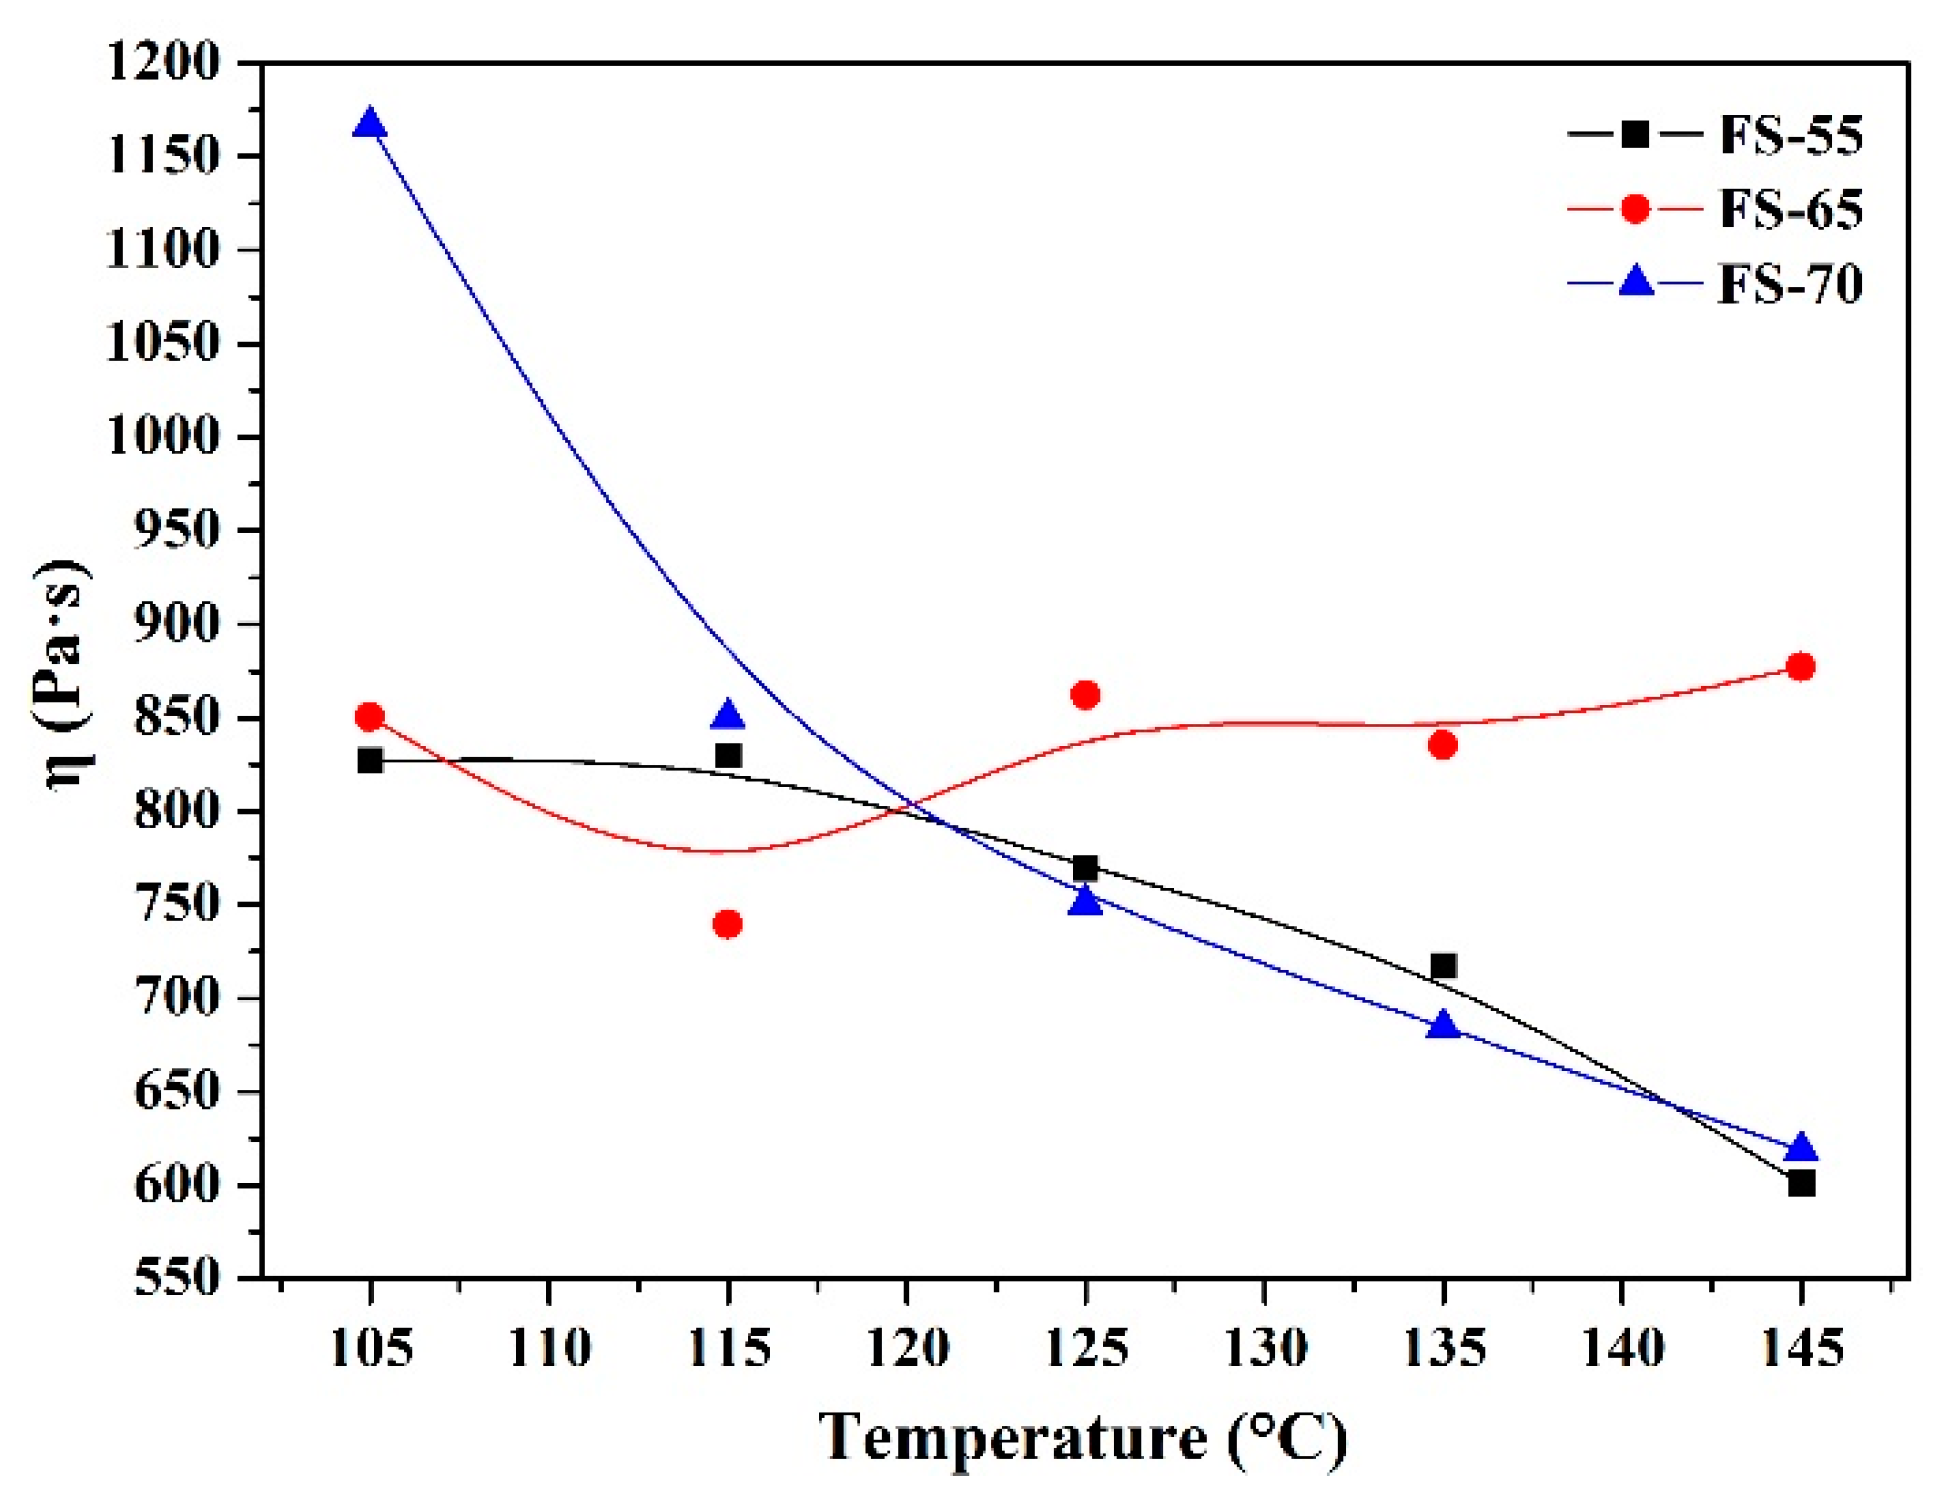
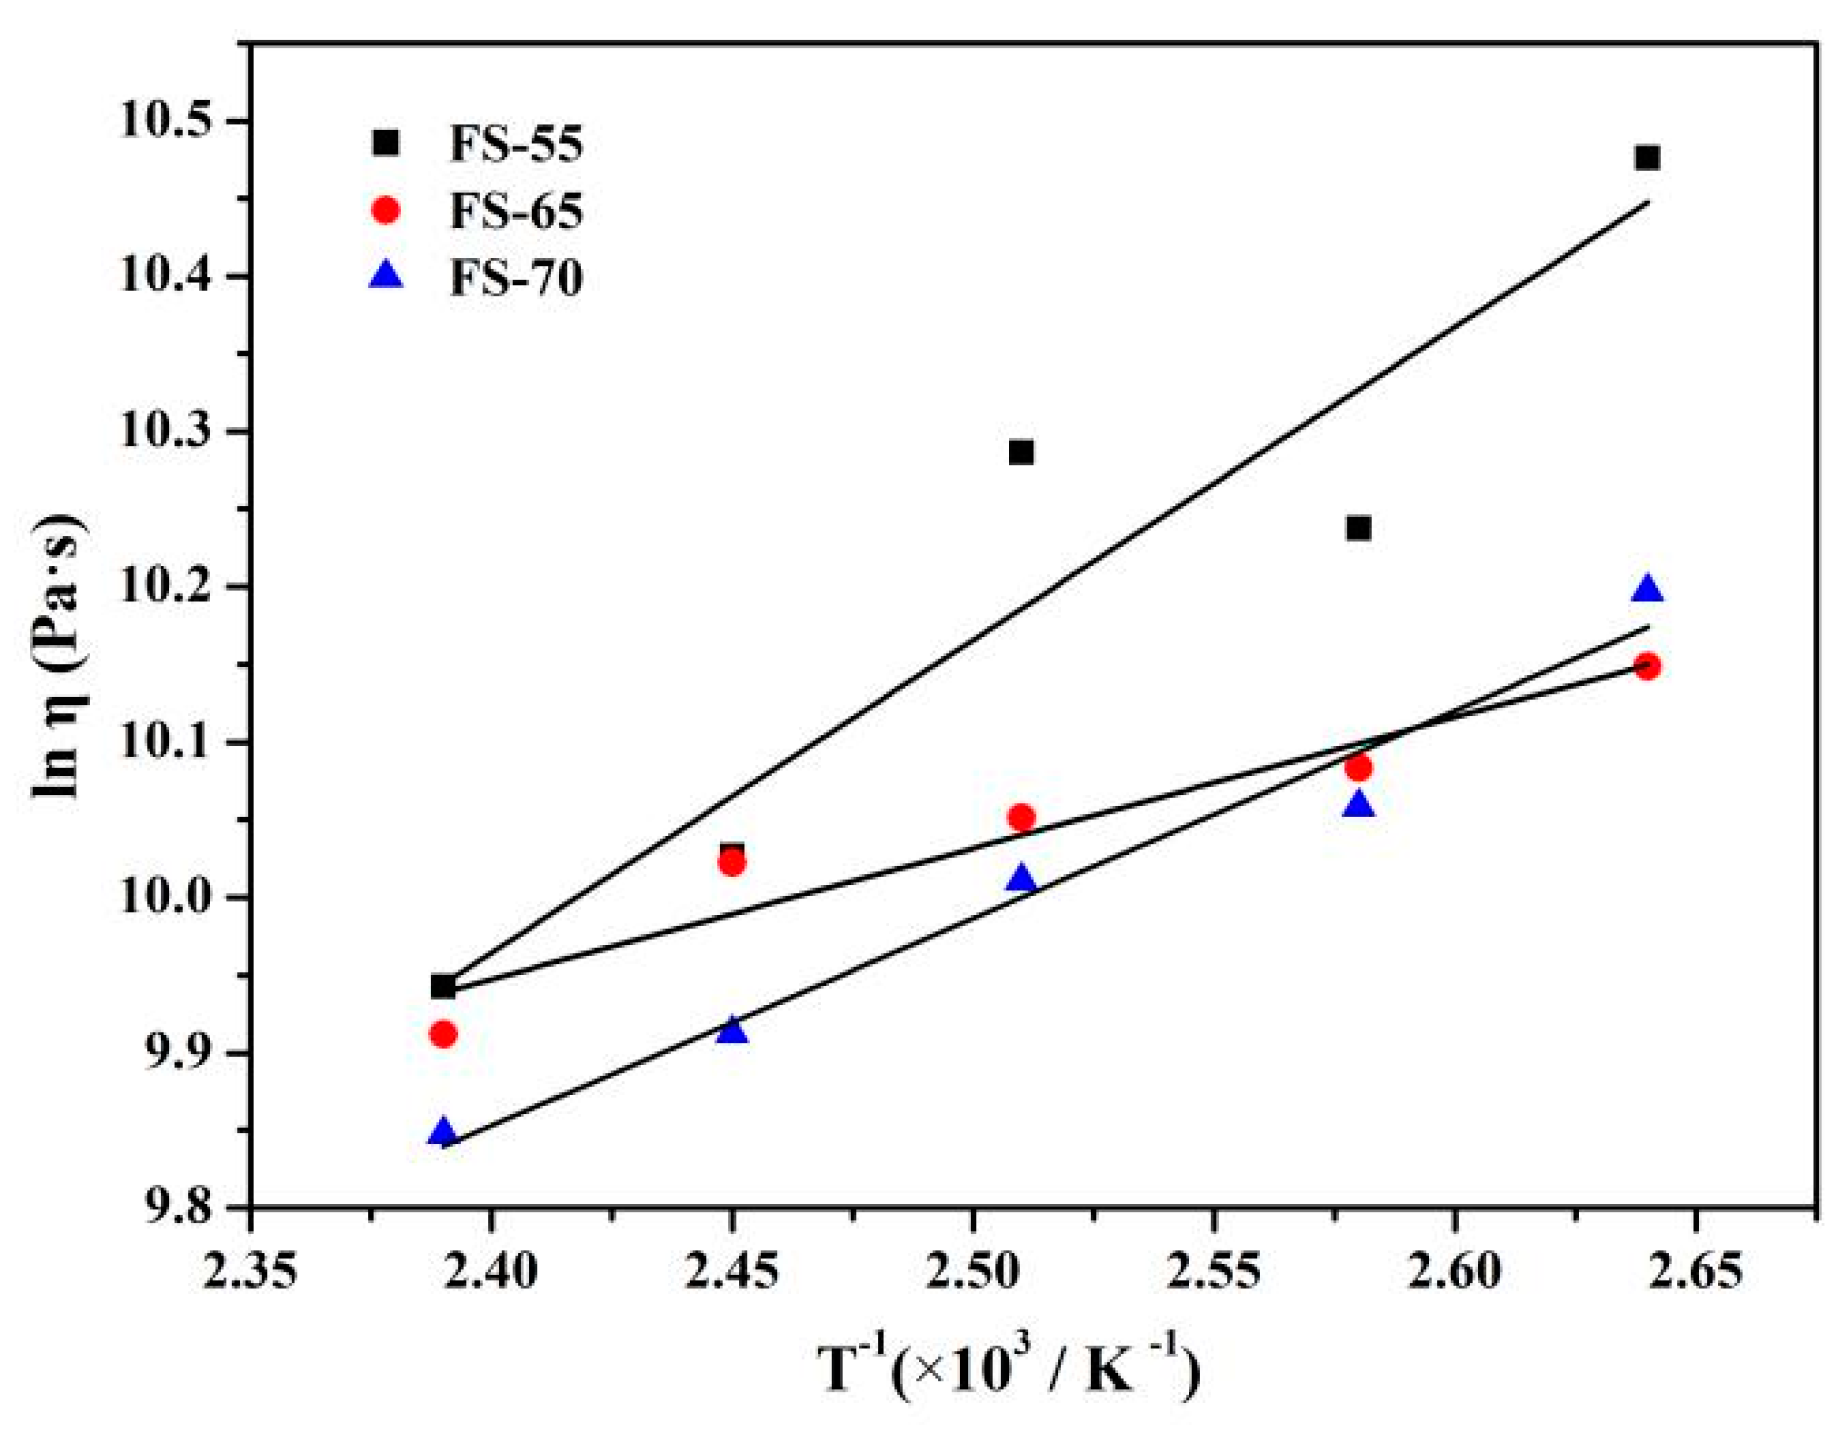
  • Over the temperature range of 105–145 °C, all of the three kinds of feedstocks exhibit pseudoplastic behavior. Within this temperature range, the three kinds of feedstocks reach their different maximum n values at different temperatures. In general, the order of n values from various feedstocks is nFS-70 < nFS-65 < nFS-55, so the FS-55 has the lowest shear sensitive. The order of the E values from various feedstocks is EFS-65 < EFS-70 < EFS-55, so the FS-65 has the lowest temperature sensitive.
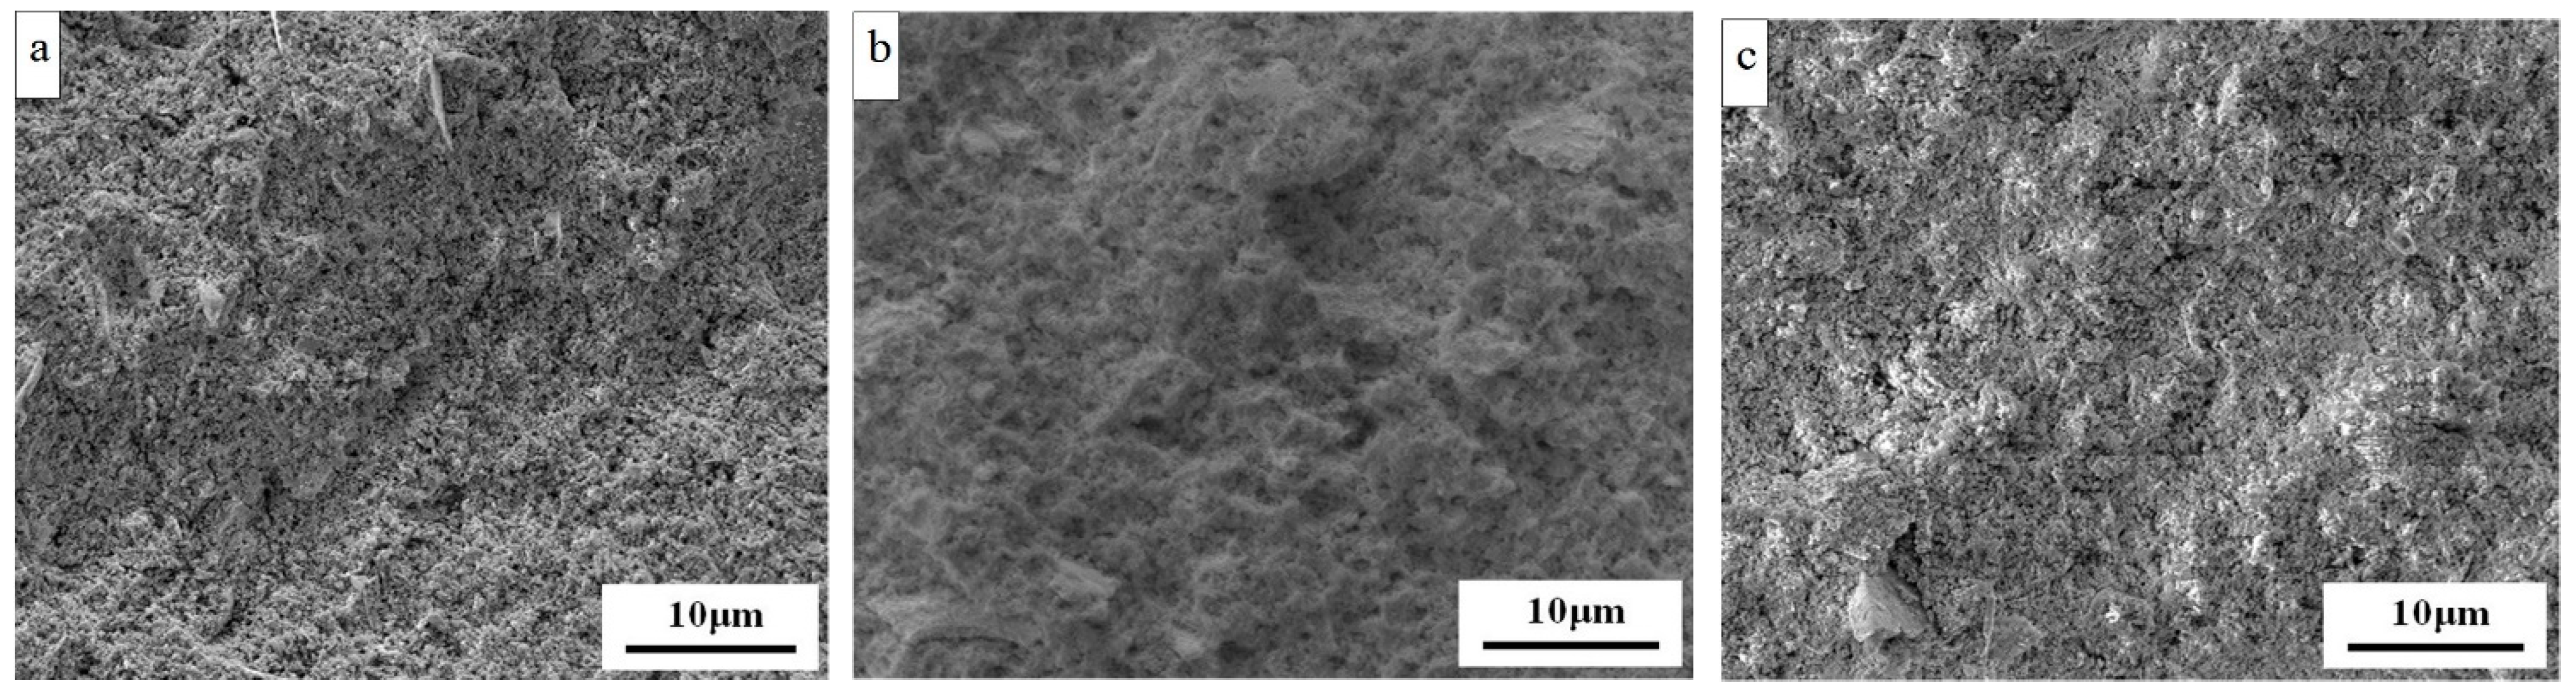
  • Compared with the FS-55 and FS-70 binder system, the FS-65 binder system is more appropriate for the PEP of ultrafine 98W-1Ni-1Fe powder due to its better composite rheology and more homogeneous microstructure.
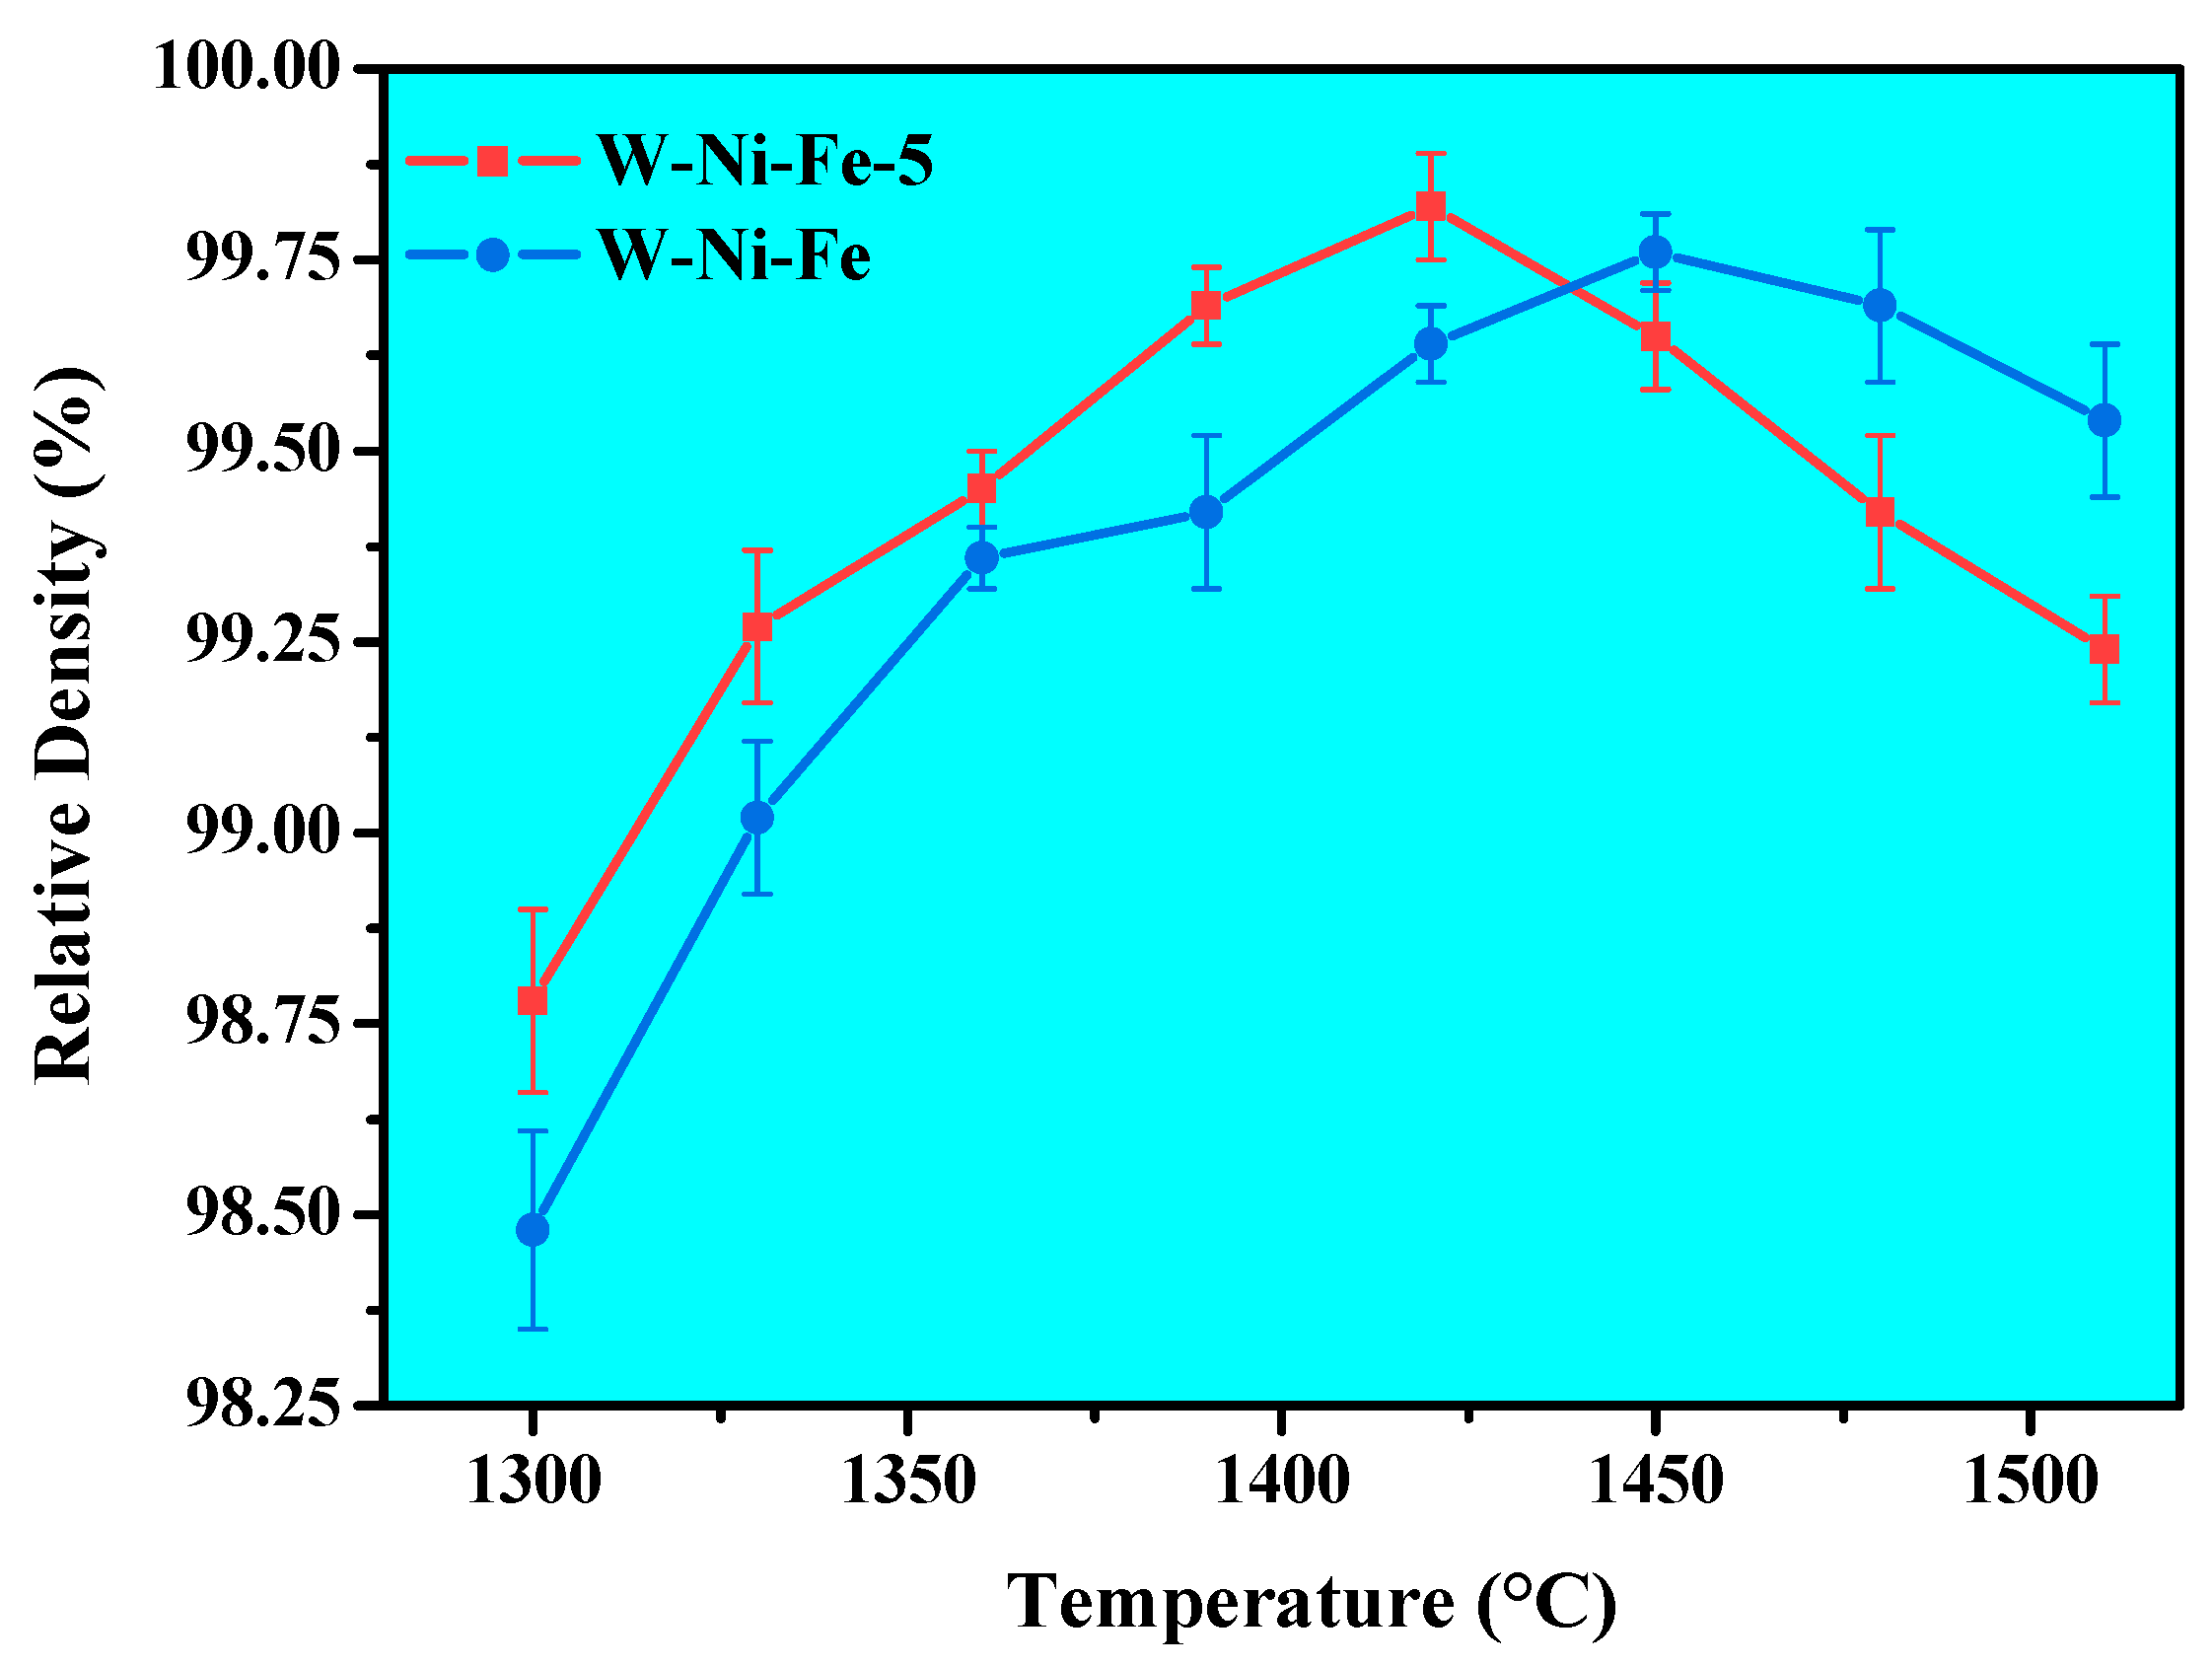
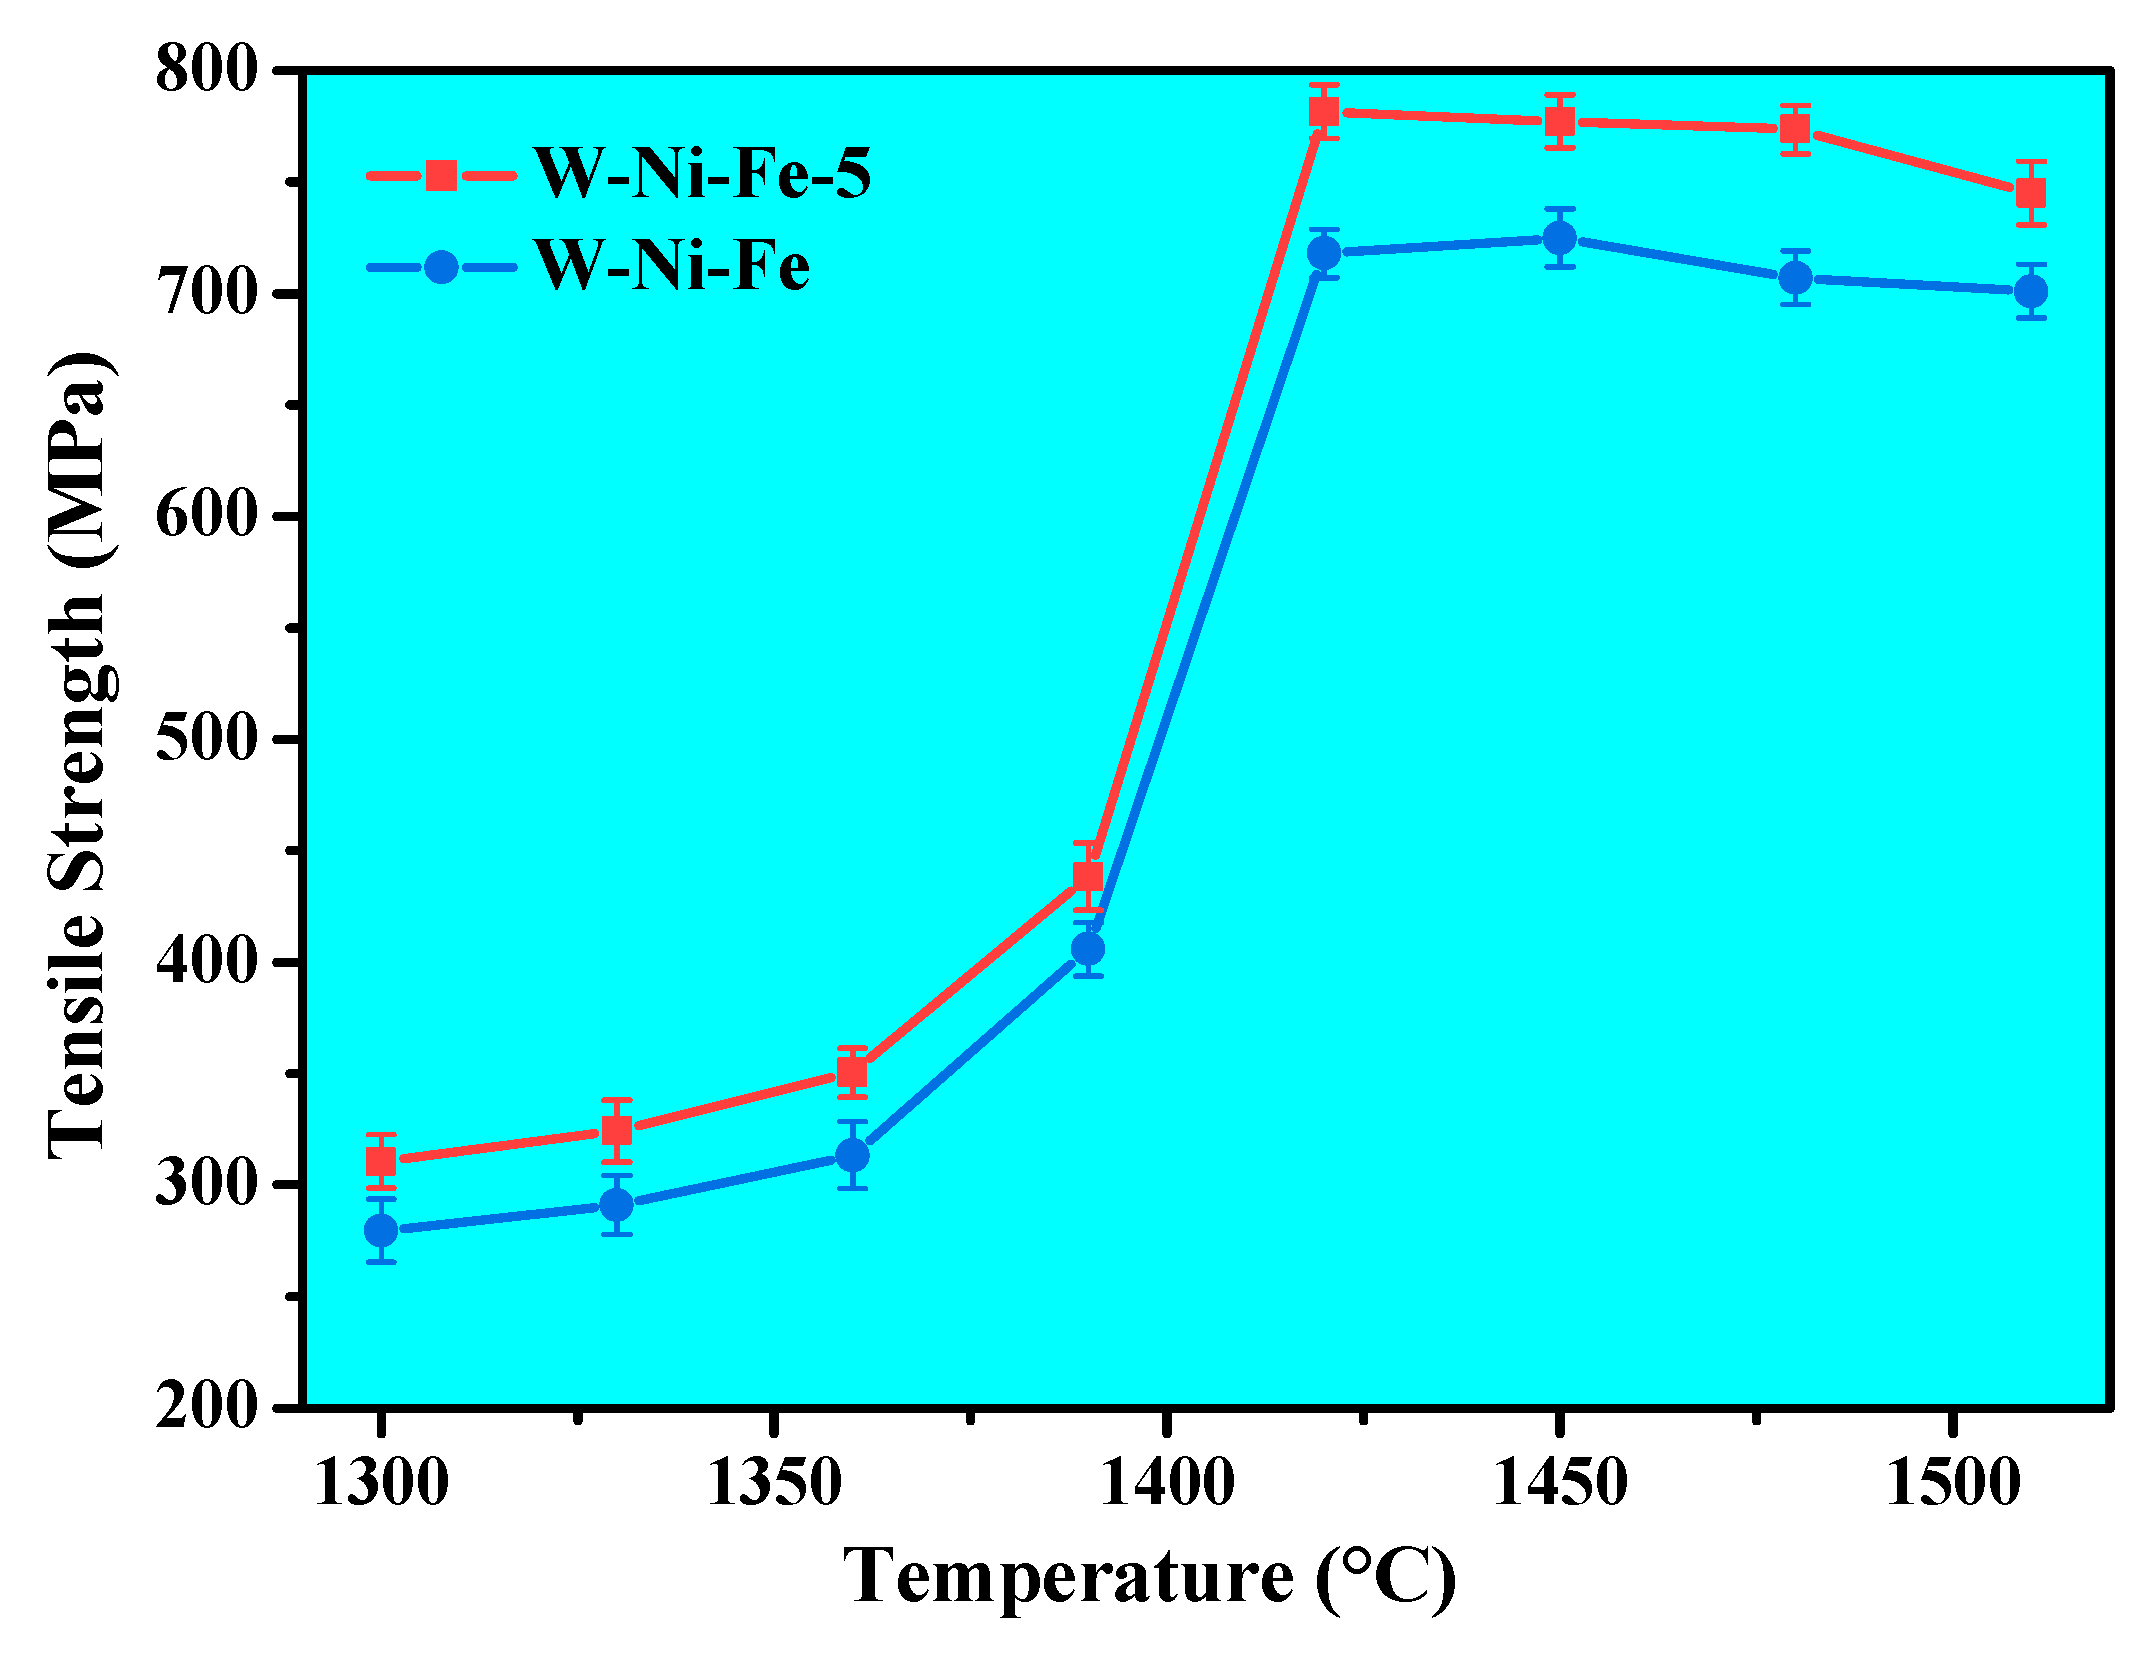
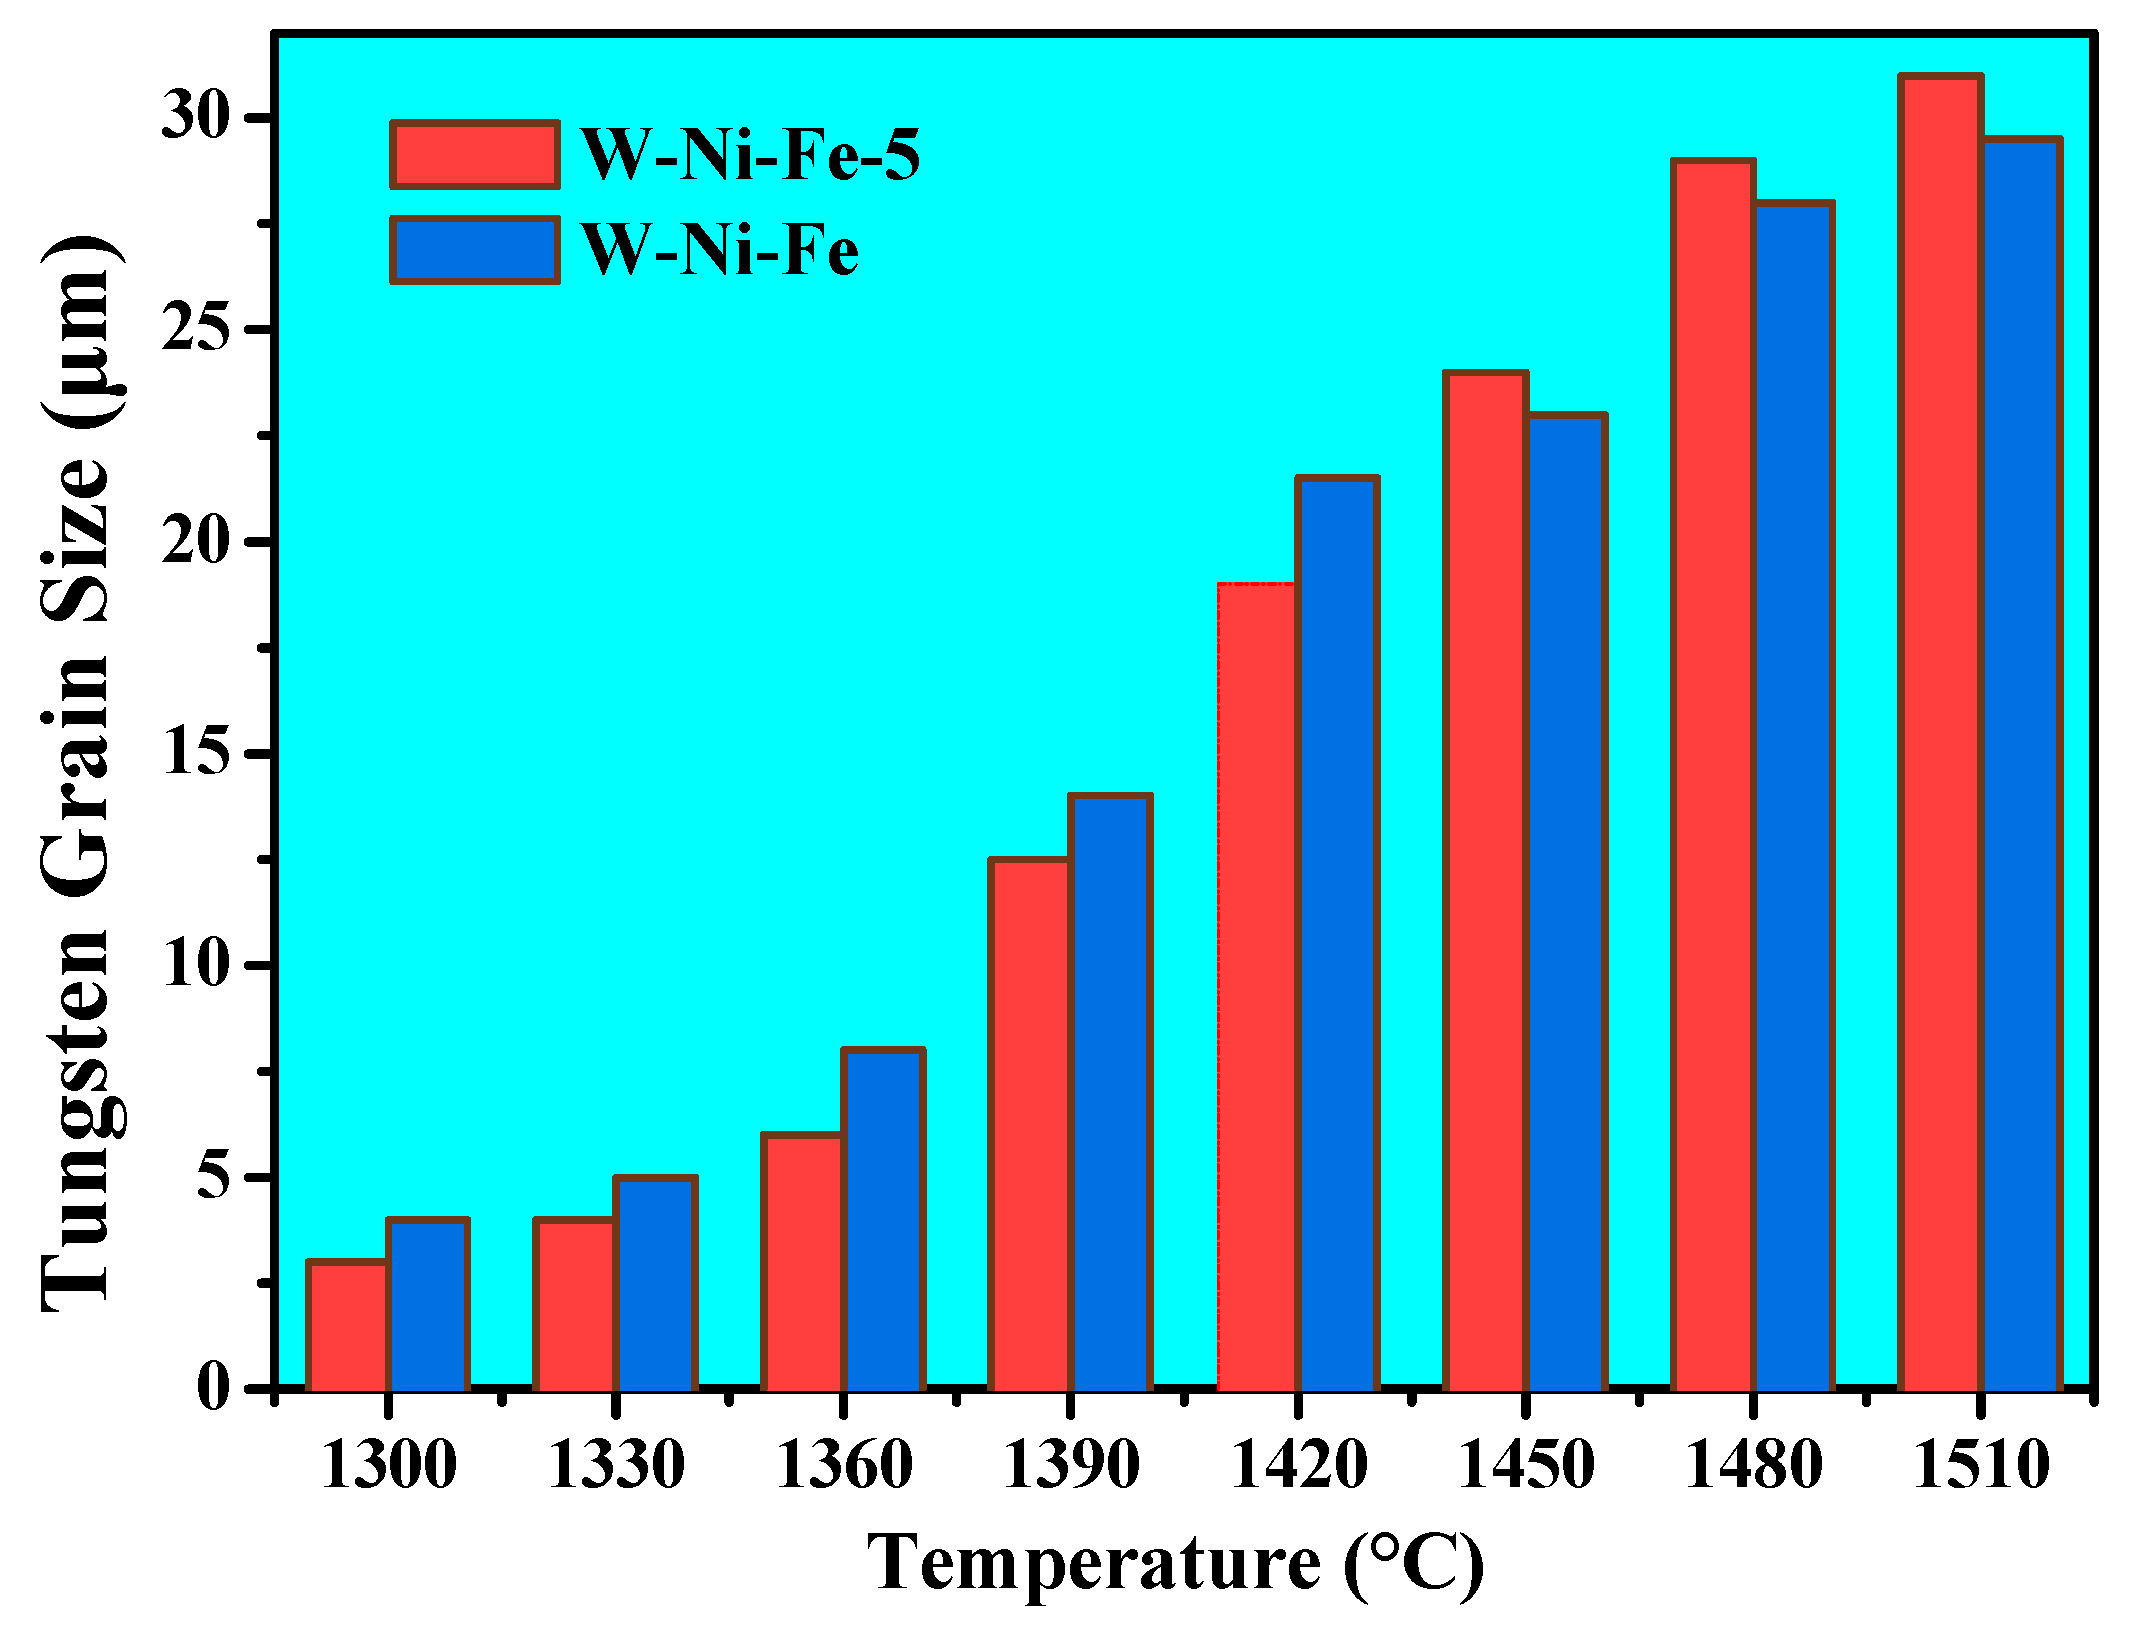
  • The PEPed ultrafine 98W-1Ni-1Fe can be sintered to near-full densification at 1420 °C, which is much lower than traditional micro-scaled powder. The sintered 98W-1Ni-1Fe shows a good mechanical performance due to its fine and uniform microstructure, its tensile strength can reach ~800 MPa, and its grain size is about 15 μm.

Author Contributions

Thought design, experiment design and paper revision, Y.H.; paper writing, X.W.; experiments and tests, X.J. and Y.Y. All authors have read and agreed to the published version of the manuscript.

Funding

This work was supported by the Open Sharing Fund for the Large-scale Instruments and Equipment of Central South University, China with grant number [CSUZC202231].

Acknowledgments

This work was supported by the Open Sharing Fund for the Large-scale Instruments and Equipment of Central South University, China.

Conflicts of Interest

The authors declare no conflict of interest.

References

  1. Yu, Y.; Ren, C.Y.; Zhang, W.C. Compressive behavior of liquid phase sintered 90W-7Ni-3Fe heavy alloy at high temperature and low strain rate condition. Int. J. Refract. Met. Hard Mater. 2018, 76, 149–157. [Google Scholar] [CrossRef]
  2. Zh, A.; Ye, L.; Zhu, Q.B.; Yz, A.; Ji, D.C.; Zy, A.; Zw, A.; Zm, A. The preparation of high-performance 96W-2.7Ni-1.3Fe alloy parts by powder extrusion 3D printing. Mater. Sci. Eng. A 2021, 817, 1–8. [Google Scholar]
  3. Fan, J.L. Tungsten Alloys and The New Technologies for Their Preparation; Metallurgical Industry Press: Beijing, China, 2006. [Google Scholar]
  4. Lin, T.; Zhao, F.; Zhang, L.Y.; Wu, C.Y.; Guo, Z.M. Fine grain tungsten produced with nanoscale powder. J. Univ. Sci. Technol. Beijing 2005, 12, 277–280. [Google Scholar]
  5. Zhou, Z.J.; Ma, Y.; Du, J.; Linke, J. Fabrication and characterization of ultra-fine grained tungsten by resistance sintering under ultra-high pressure. Mater. Sci. Eng. A 2009, 27, 701–704. [Google Scholar] [CrossRef]
  6. Fang, Z.Z.; Wang, H. Densification and grain growth during sintering of nanosized particles. Int. Mater. Rev. 2008, 53, 326–352. [Google Scholar] [CrossRef]
  7. Jiang, Q. Size-dependent initial sintering temperature of ultrafine particles. J. Mater. Sci. Technol. 1998, 14, 171–172. [Google Scholar]
  8. Han, Y.; Fan, J.L.; Liu, T.; Cheng, H.C.; Tian, J.M. The effects of ball-milling treatment on the densification behavior of ultra-fine tungsten powder. Int. J. Refract. Met. Hard Mater. 2011, 29, 743–750. [Google Scholar] [CrossRef]
  9. Supriadi, S.; Baek, E.R.; Choi, C.J.; Lee, B.T. Binder system for STS 316 nanopowder feedstocks in micro-metal injection molding. J. Mater. Processing Technol. 2007, 187–188, 270–273. [Google Scholar] [CrossRef]
  10. Li, Y.M.; Liu, X.Q.; Luo, F.H.; Yue, J.L. Effects of surfactant on properties of PIM feedstock. Trans. Nonferrous Met. Soc. China 2007, 17, 1–8. [Google Scholar] [CrossRef]
  11. Ren, S.B.; He, X.B.; Qu, X.H.; Humail, I.S.; Li, Y. Effects of binder compositions on characteristics of feedstocks of microsized SiC ceramic injection molding. Powder Metall. 2007, 50, 255–259. [Google Scholar] [CrossRef]
  12. Ren, S.B.; He, X.B.; Qu, X.H.; Humail, I.S.; Wei, Y.P. Influence of binder composition on rheological behavior of injection-molded microsized SiC suspensions. J. Univ. Sci. Technol. Beijing Miner. Metall. Mater. 2008, 15, 297–301. [Google Scholar] [CrossRef]
  13. Huang, B.Y.; Liang, S.Q.; Qu, X.H. The rheology of metal injection molding. J. Mater. Processing Technol. 2003, 137, 132–137. [Google Scholar] [CrossRef]
  14. Li, Y.M.; Qu, X.H.; Huang, B.Y. Evaluation of rheological properties of metal injection molding feedstocks. J. Mater. Eng. 1999, 7, 32–35. [Google Scholar]
  15. Majumdar, S.; Kishor, J.; Paul, B.; Kain, V. Densification behaviour, microstructural characteristics and mechanical properties of liquid phase sintered W-2Ni-1Fe alloy. J. Alloys Compd. 2020, 818, 152897. [Google Scholar] [CrossRef]
Figure 1. SEM images of the as-received powder (a), and the ball milled powder (b).
Crystals 12 00875 g001
Figure 2. Geomertry dimensions of the ‘I’-shaped tensile sample.
Crystals 12 00875 g002
Figure 3. Shear rate dependence of viscosity (ae) and values of n (f) at various temperatures.
Crystals 12 00875 g003
Figure 4. Viscosity changing with temperature at shearing rate of 178.8 s−1.
Crystals 12 00875 g004
Figure 5. Relationship between viscosity and inverse temperature.
Crystals 12 00875 g005
Figure 6. SEM images of fracture surfaces of green parts formed from various feedstocks: (a) FS-55; (b) FS-65; (c) FS-70.
Crystals 12 00875 g006
Figure 7. Sintering relative density changing with sintering temperature.
Crystals 12 00875 g007
Figure 8. Tensile strength changing with sintering temperature.
Crystals 12 00875 g008
Figure 9. Fracture microstructure morphologies.
Crystals 12 00875 g009aCrystals 12 00875 g009b
Figure 10. Average tungsten grain sizes changing with sintering temperature.
Crystals 12 00875 g010
Table 1. Characteristics of each binder component.
MaterialChemical Structureρ, g·cm−3Tm (Melting Point), °C
PWCnH2n+20.9058
HDPE(CH2-CH2)n0.96139
EVA(C2H4)x(C4H6O2)y0.9680
DOPC24H38O40.98−55
SACH3(CH2)16COOH0.9666
oil-0.9012
Table 2. Binder (Feedstock) systems.
Binder (Feedstock) System NumberPW
(wt.%)
HDPE
(wt.%)
EVA
(wt.%)
DOP
(wt.%)
SA
(wt.%)
Oil
(wt.%)
B-55 (FS-55)5510154115
B-65 (FS-65)651054115
B-70 (FS-70)707102110
Publisher’s Note: MDPI stays neutral with regard to jurisdictional claims in published maps and institutional affiliations.

