
Numerical Simulation of Molten Pool Dynamics in Laser Deep Penetration Welding of Aluminum Alloys

 , ,
, ,
Abstract
:1. Introduction
2. Mathematical Modeling
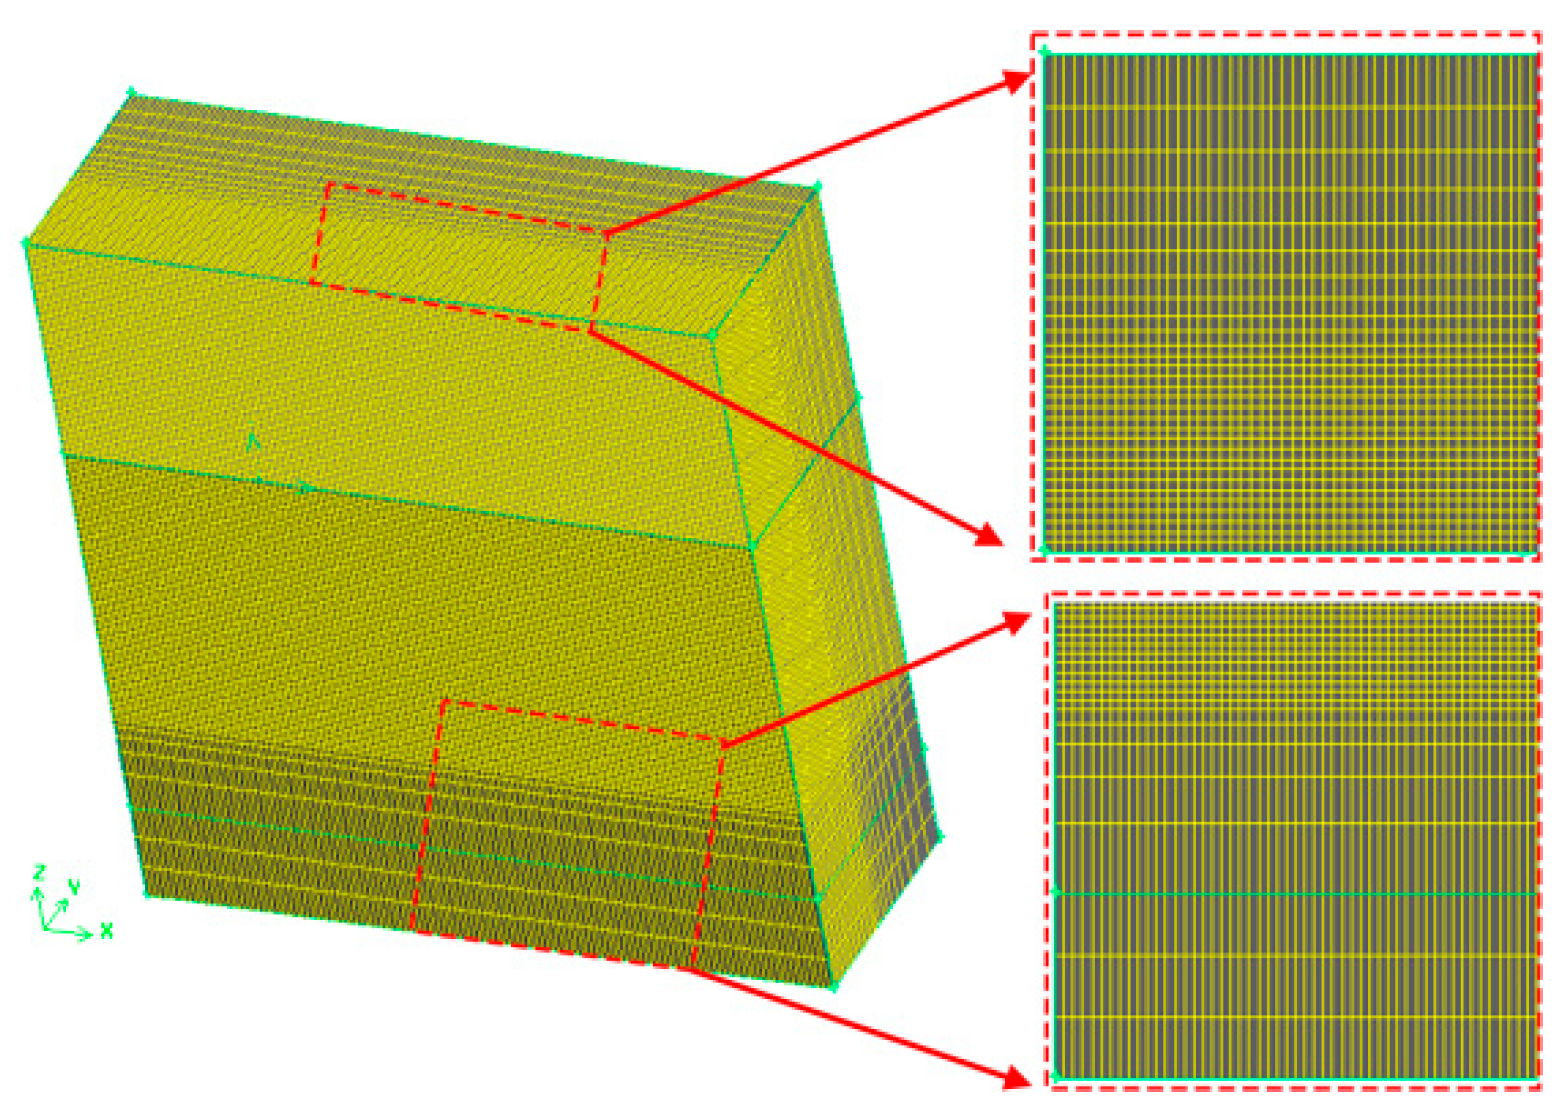
2.1. Numerical Model and Computational Assumptions
- (1)
- The flow state of the liquid metal in the mathematical model was laminar and incompressible.
- (2)
- The influence of the shielding gas on the temperature field and flow field of the molten pool was ignored.
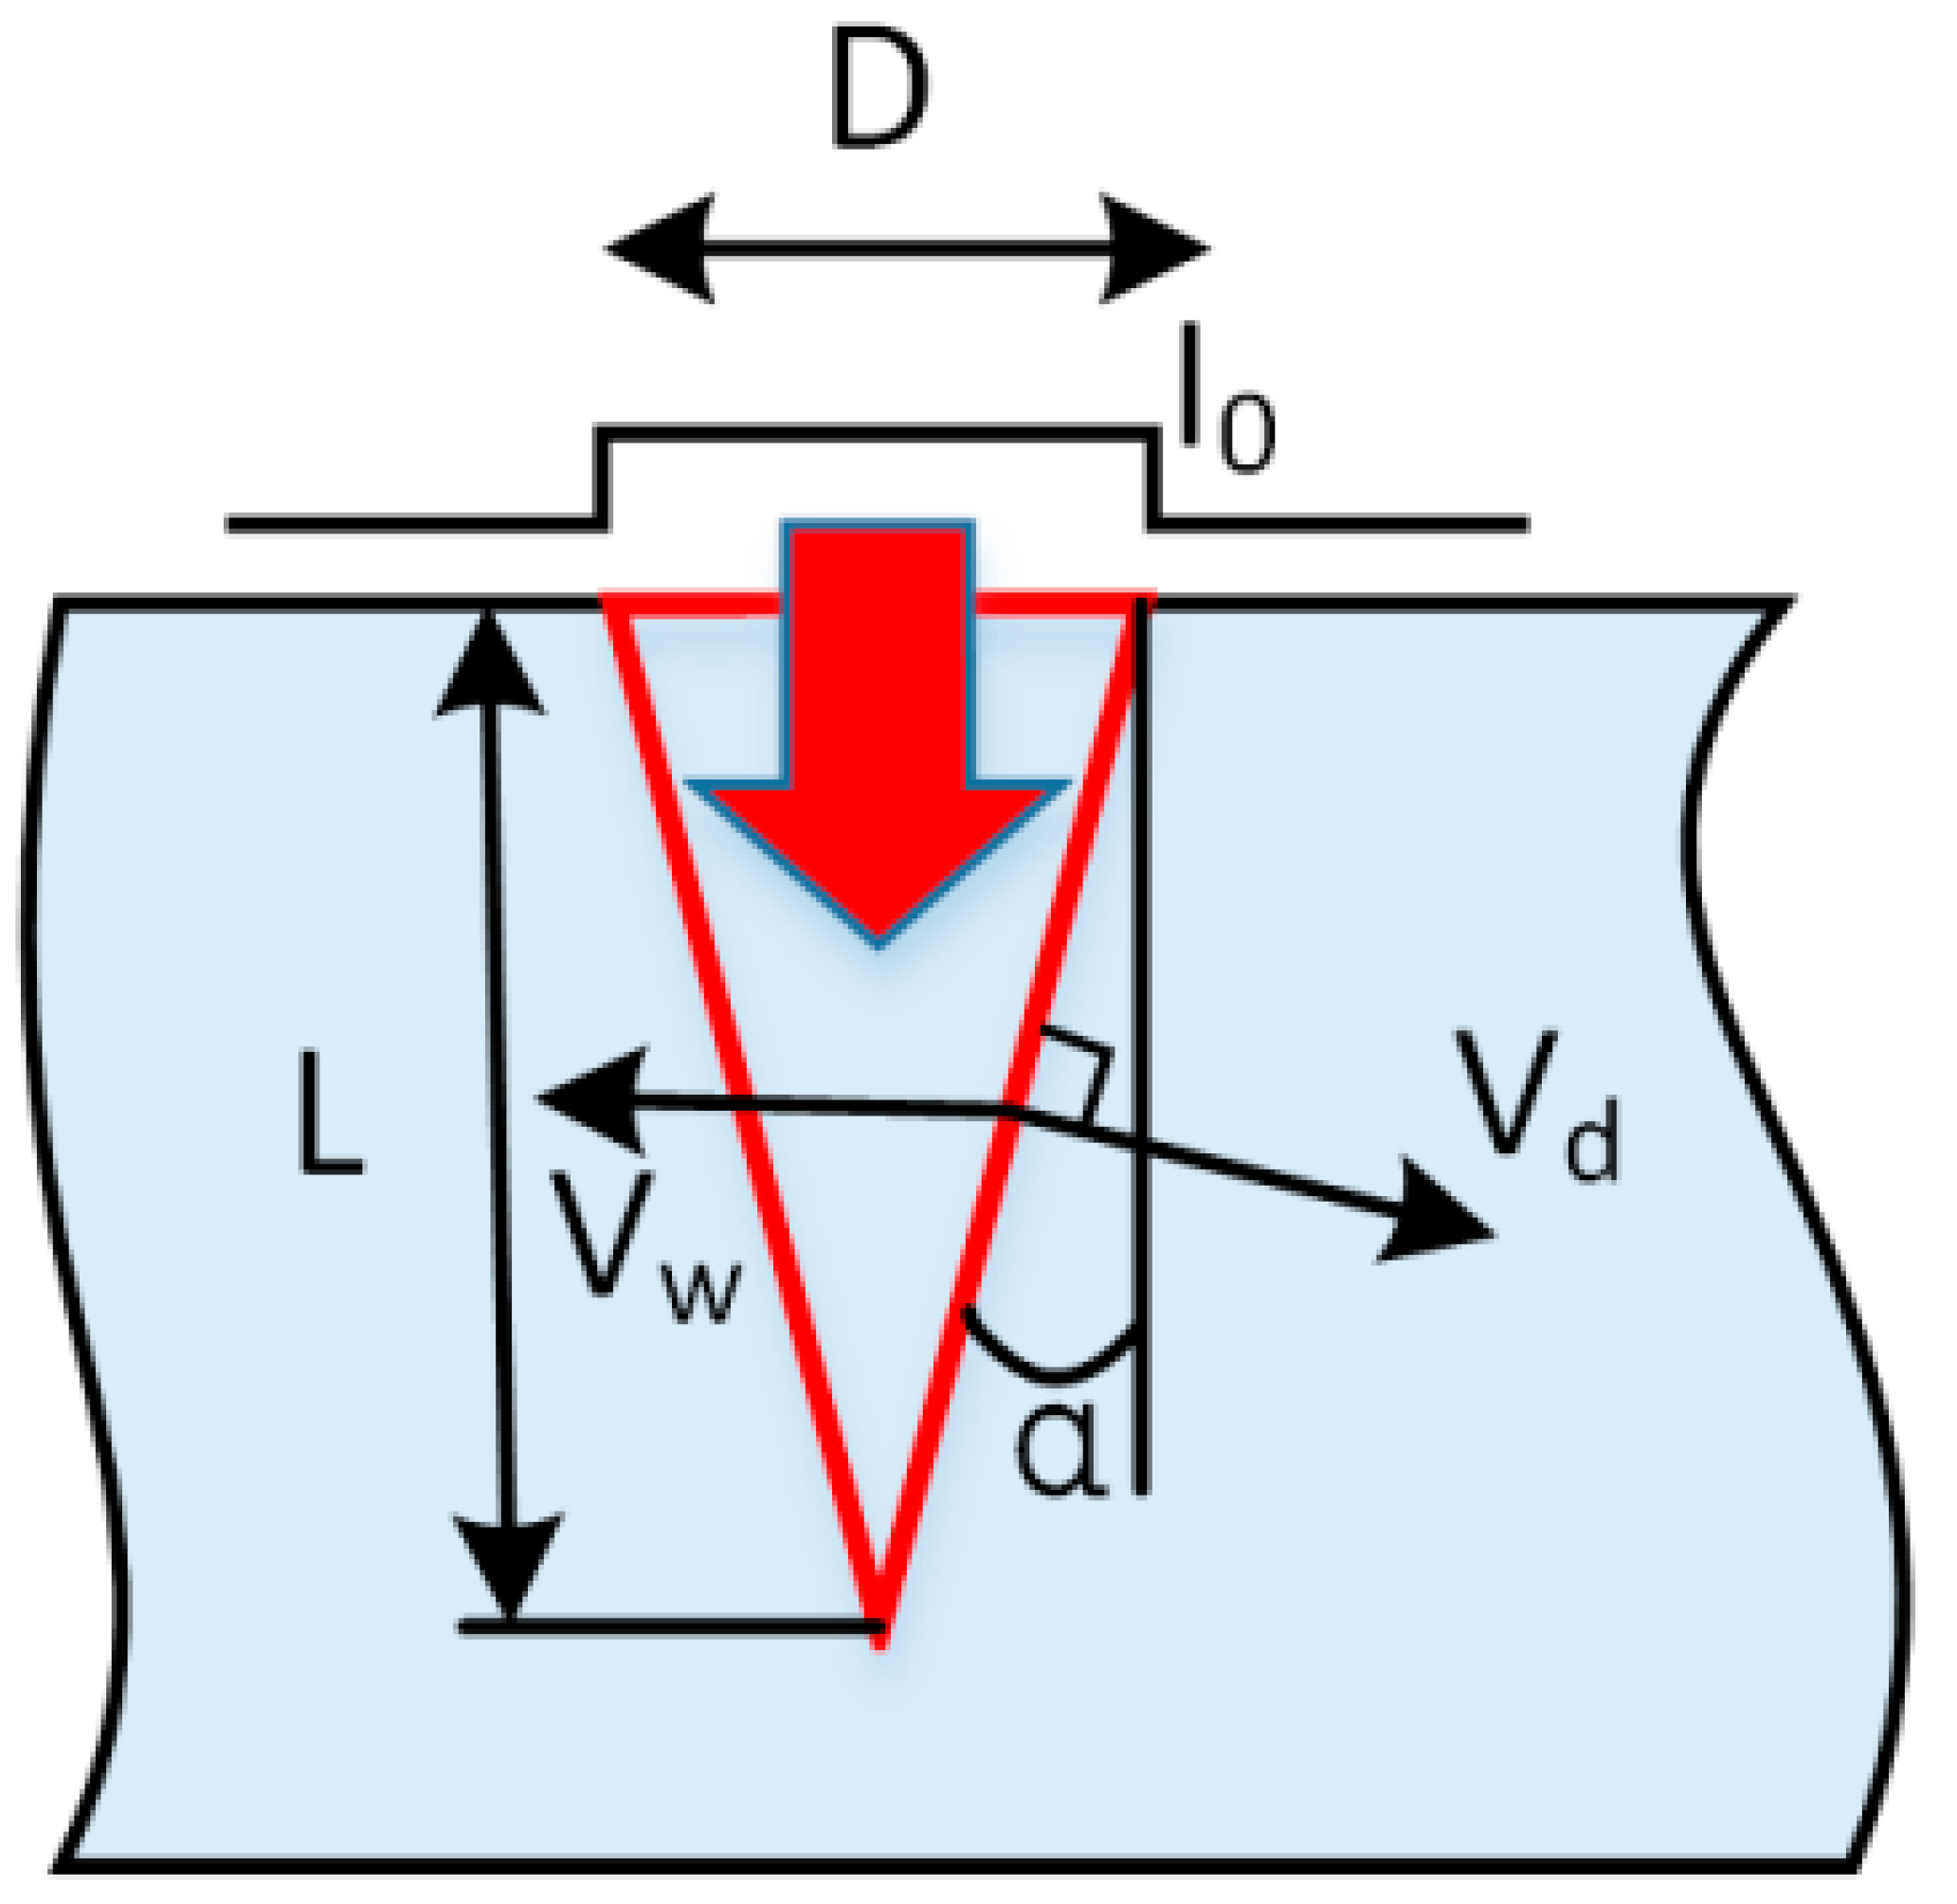
2.2. Heat Source Model
2.3. Governing Equations
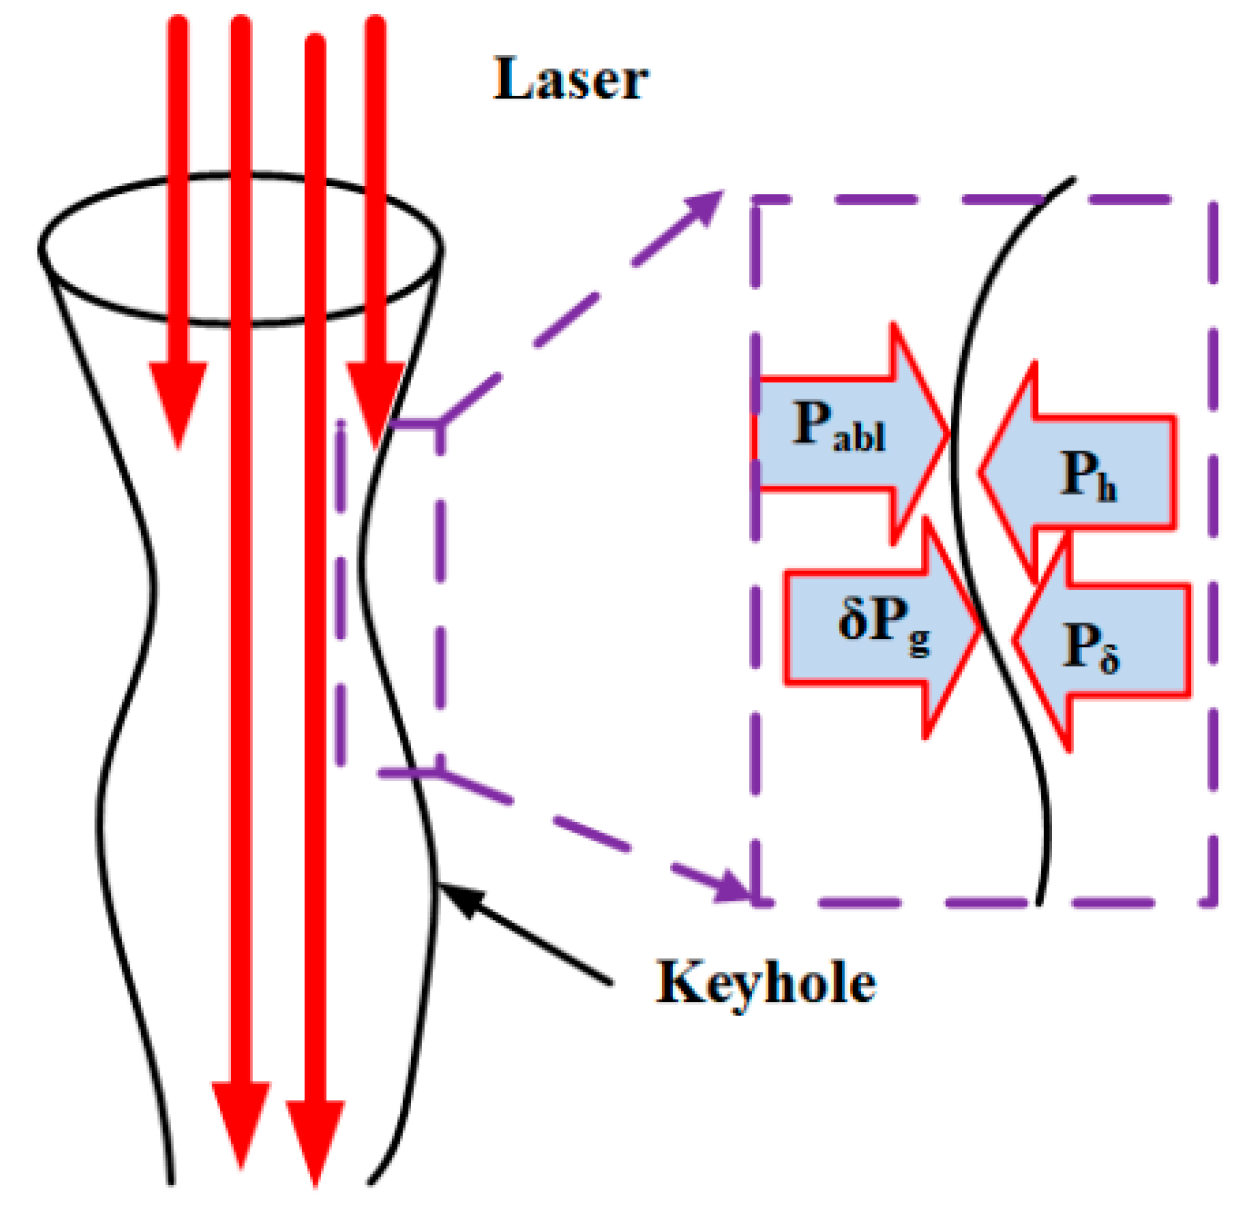
2.4. Driving Force
3. Results and Discussion
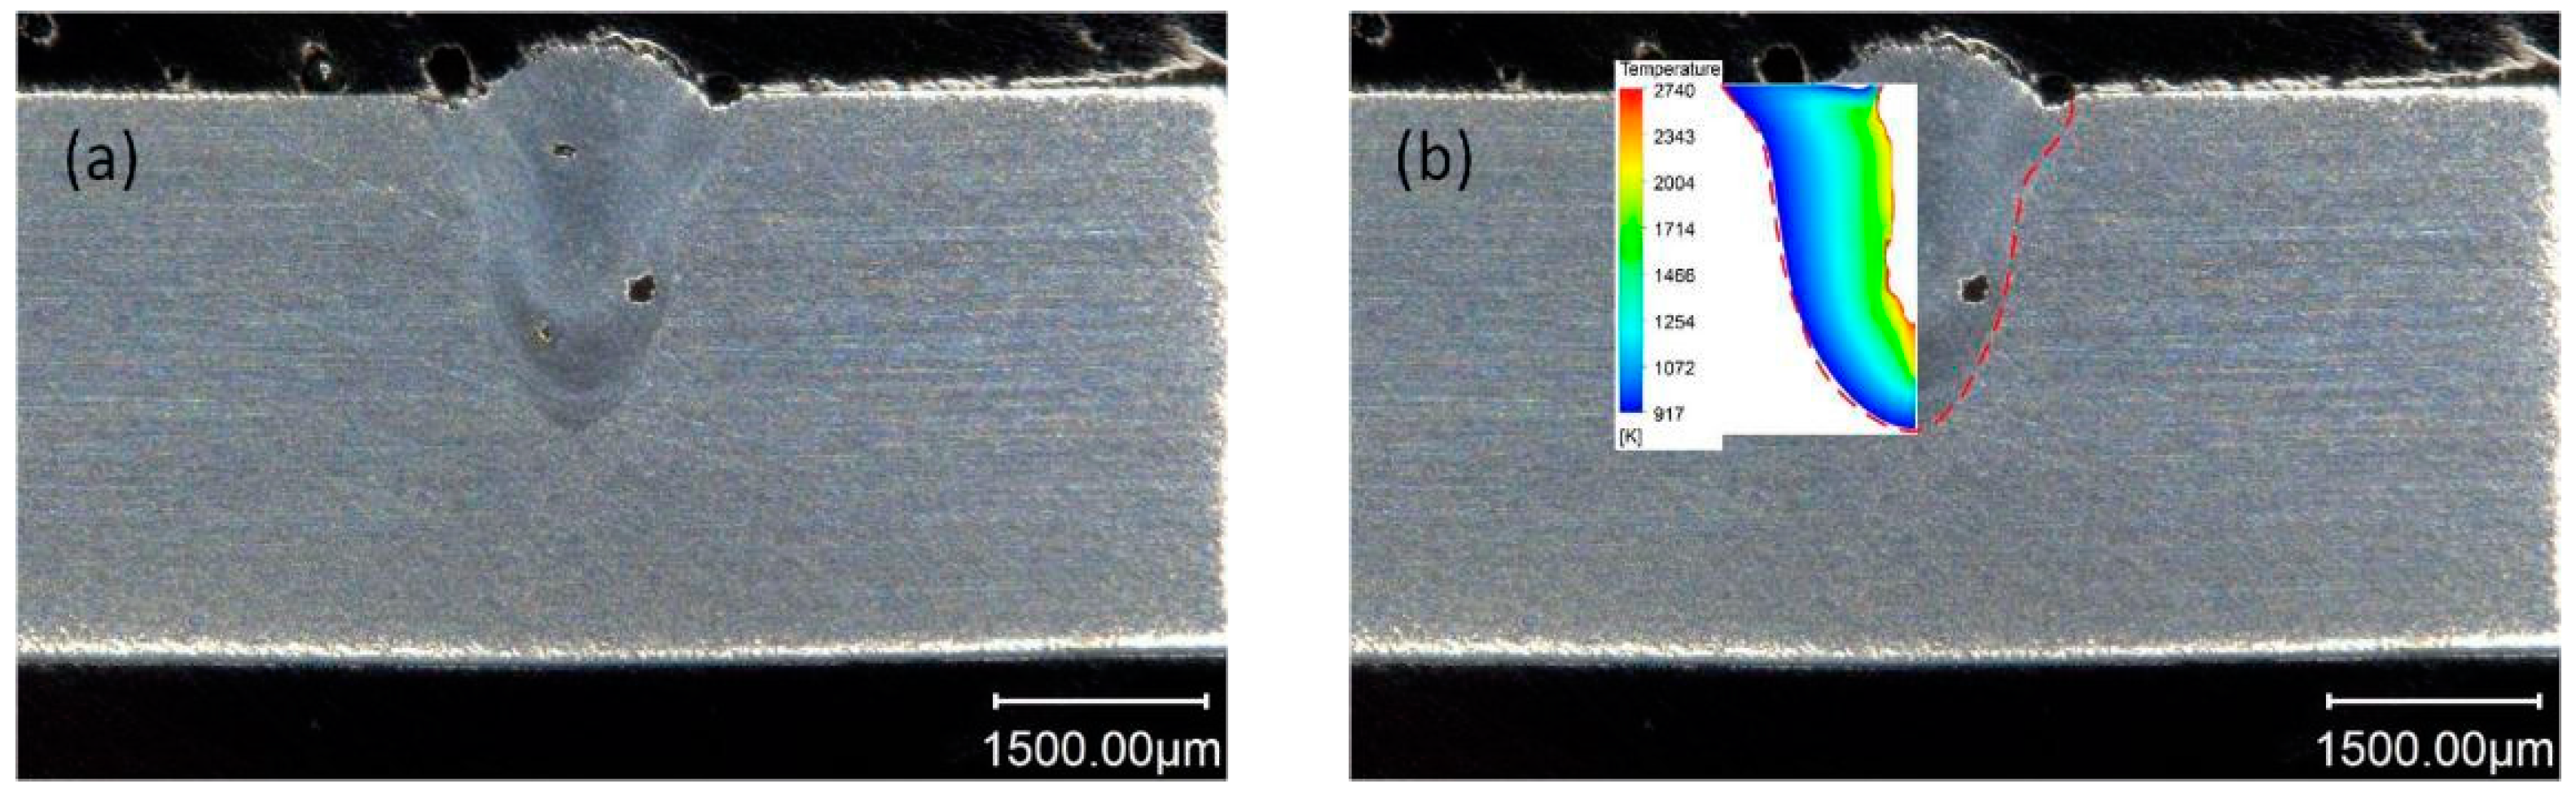
3.1. Comparison between the Calculated and the Experimental Result
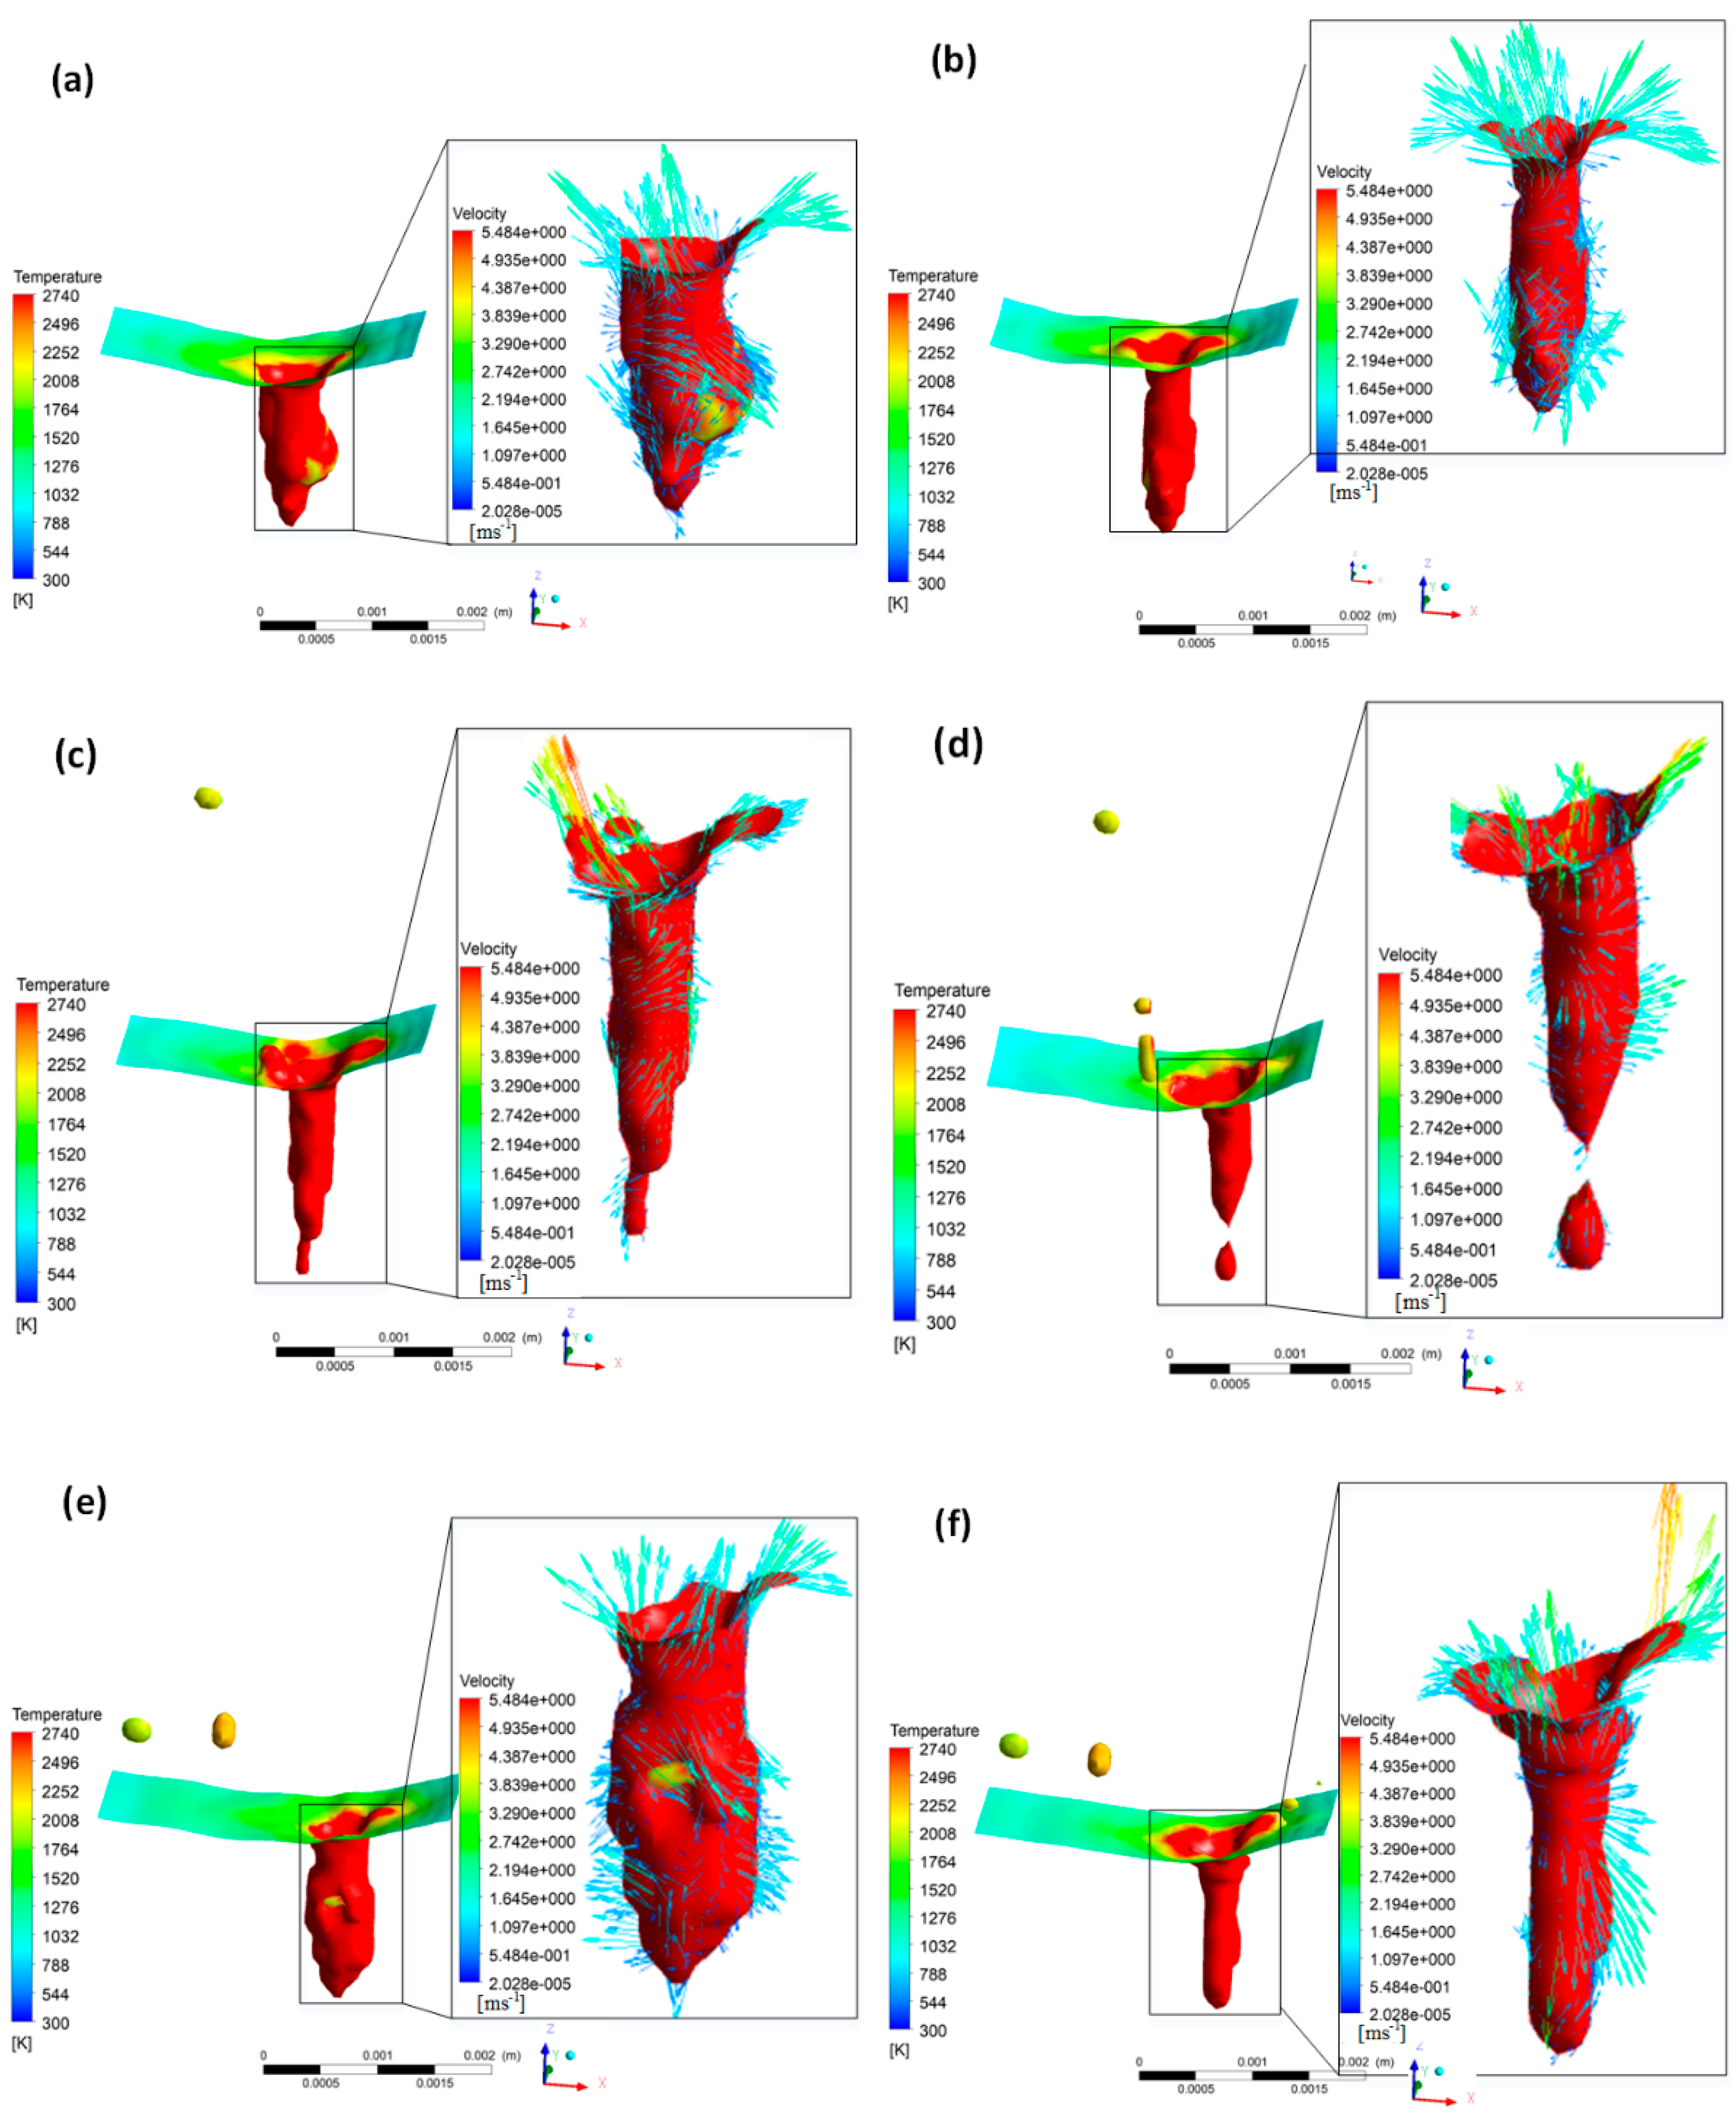
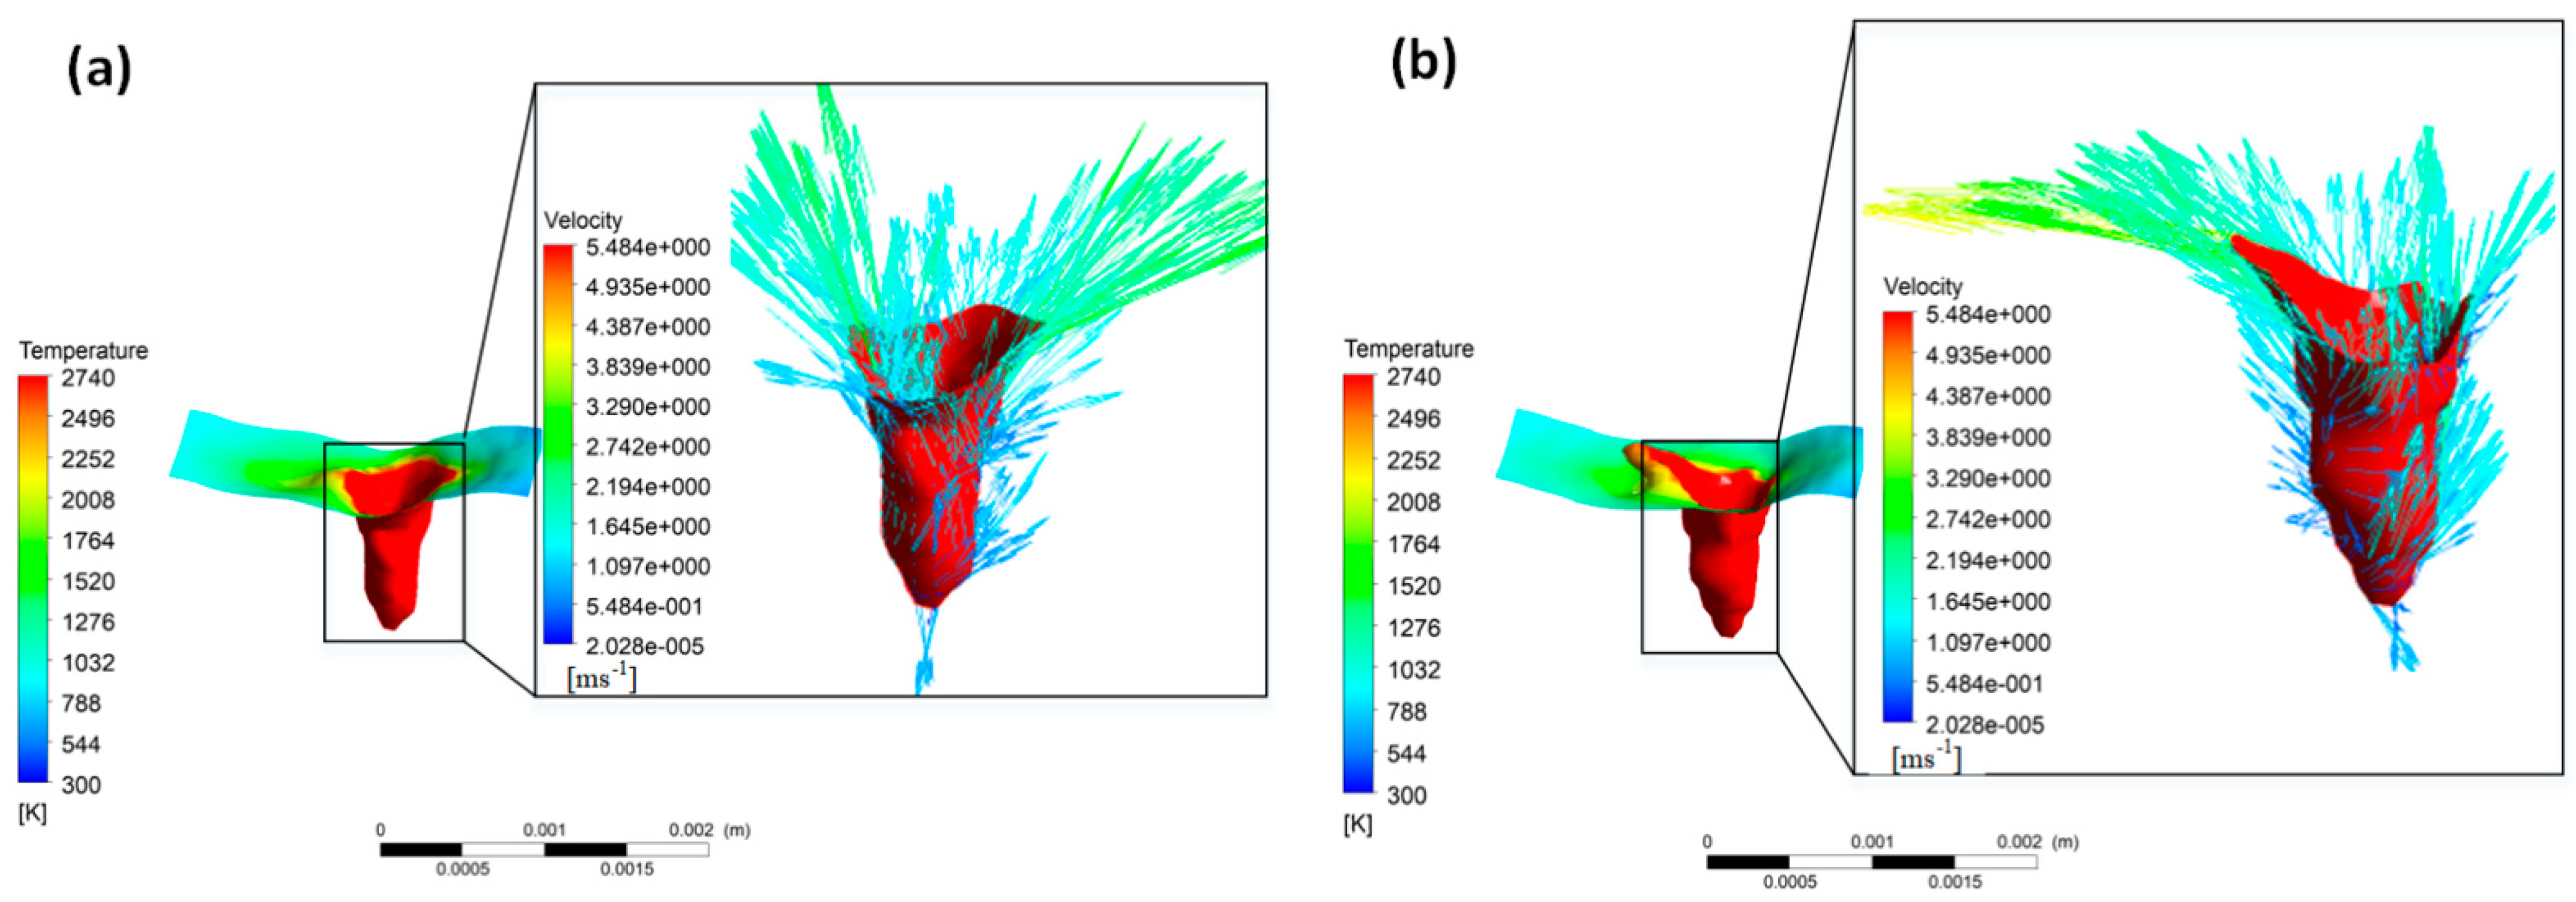
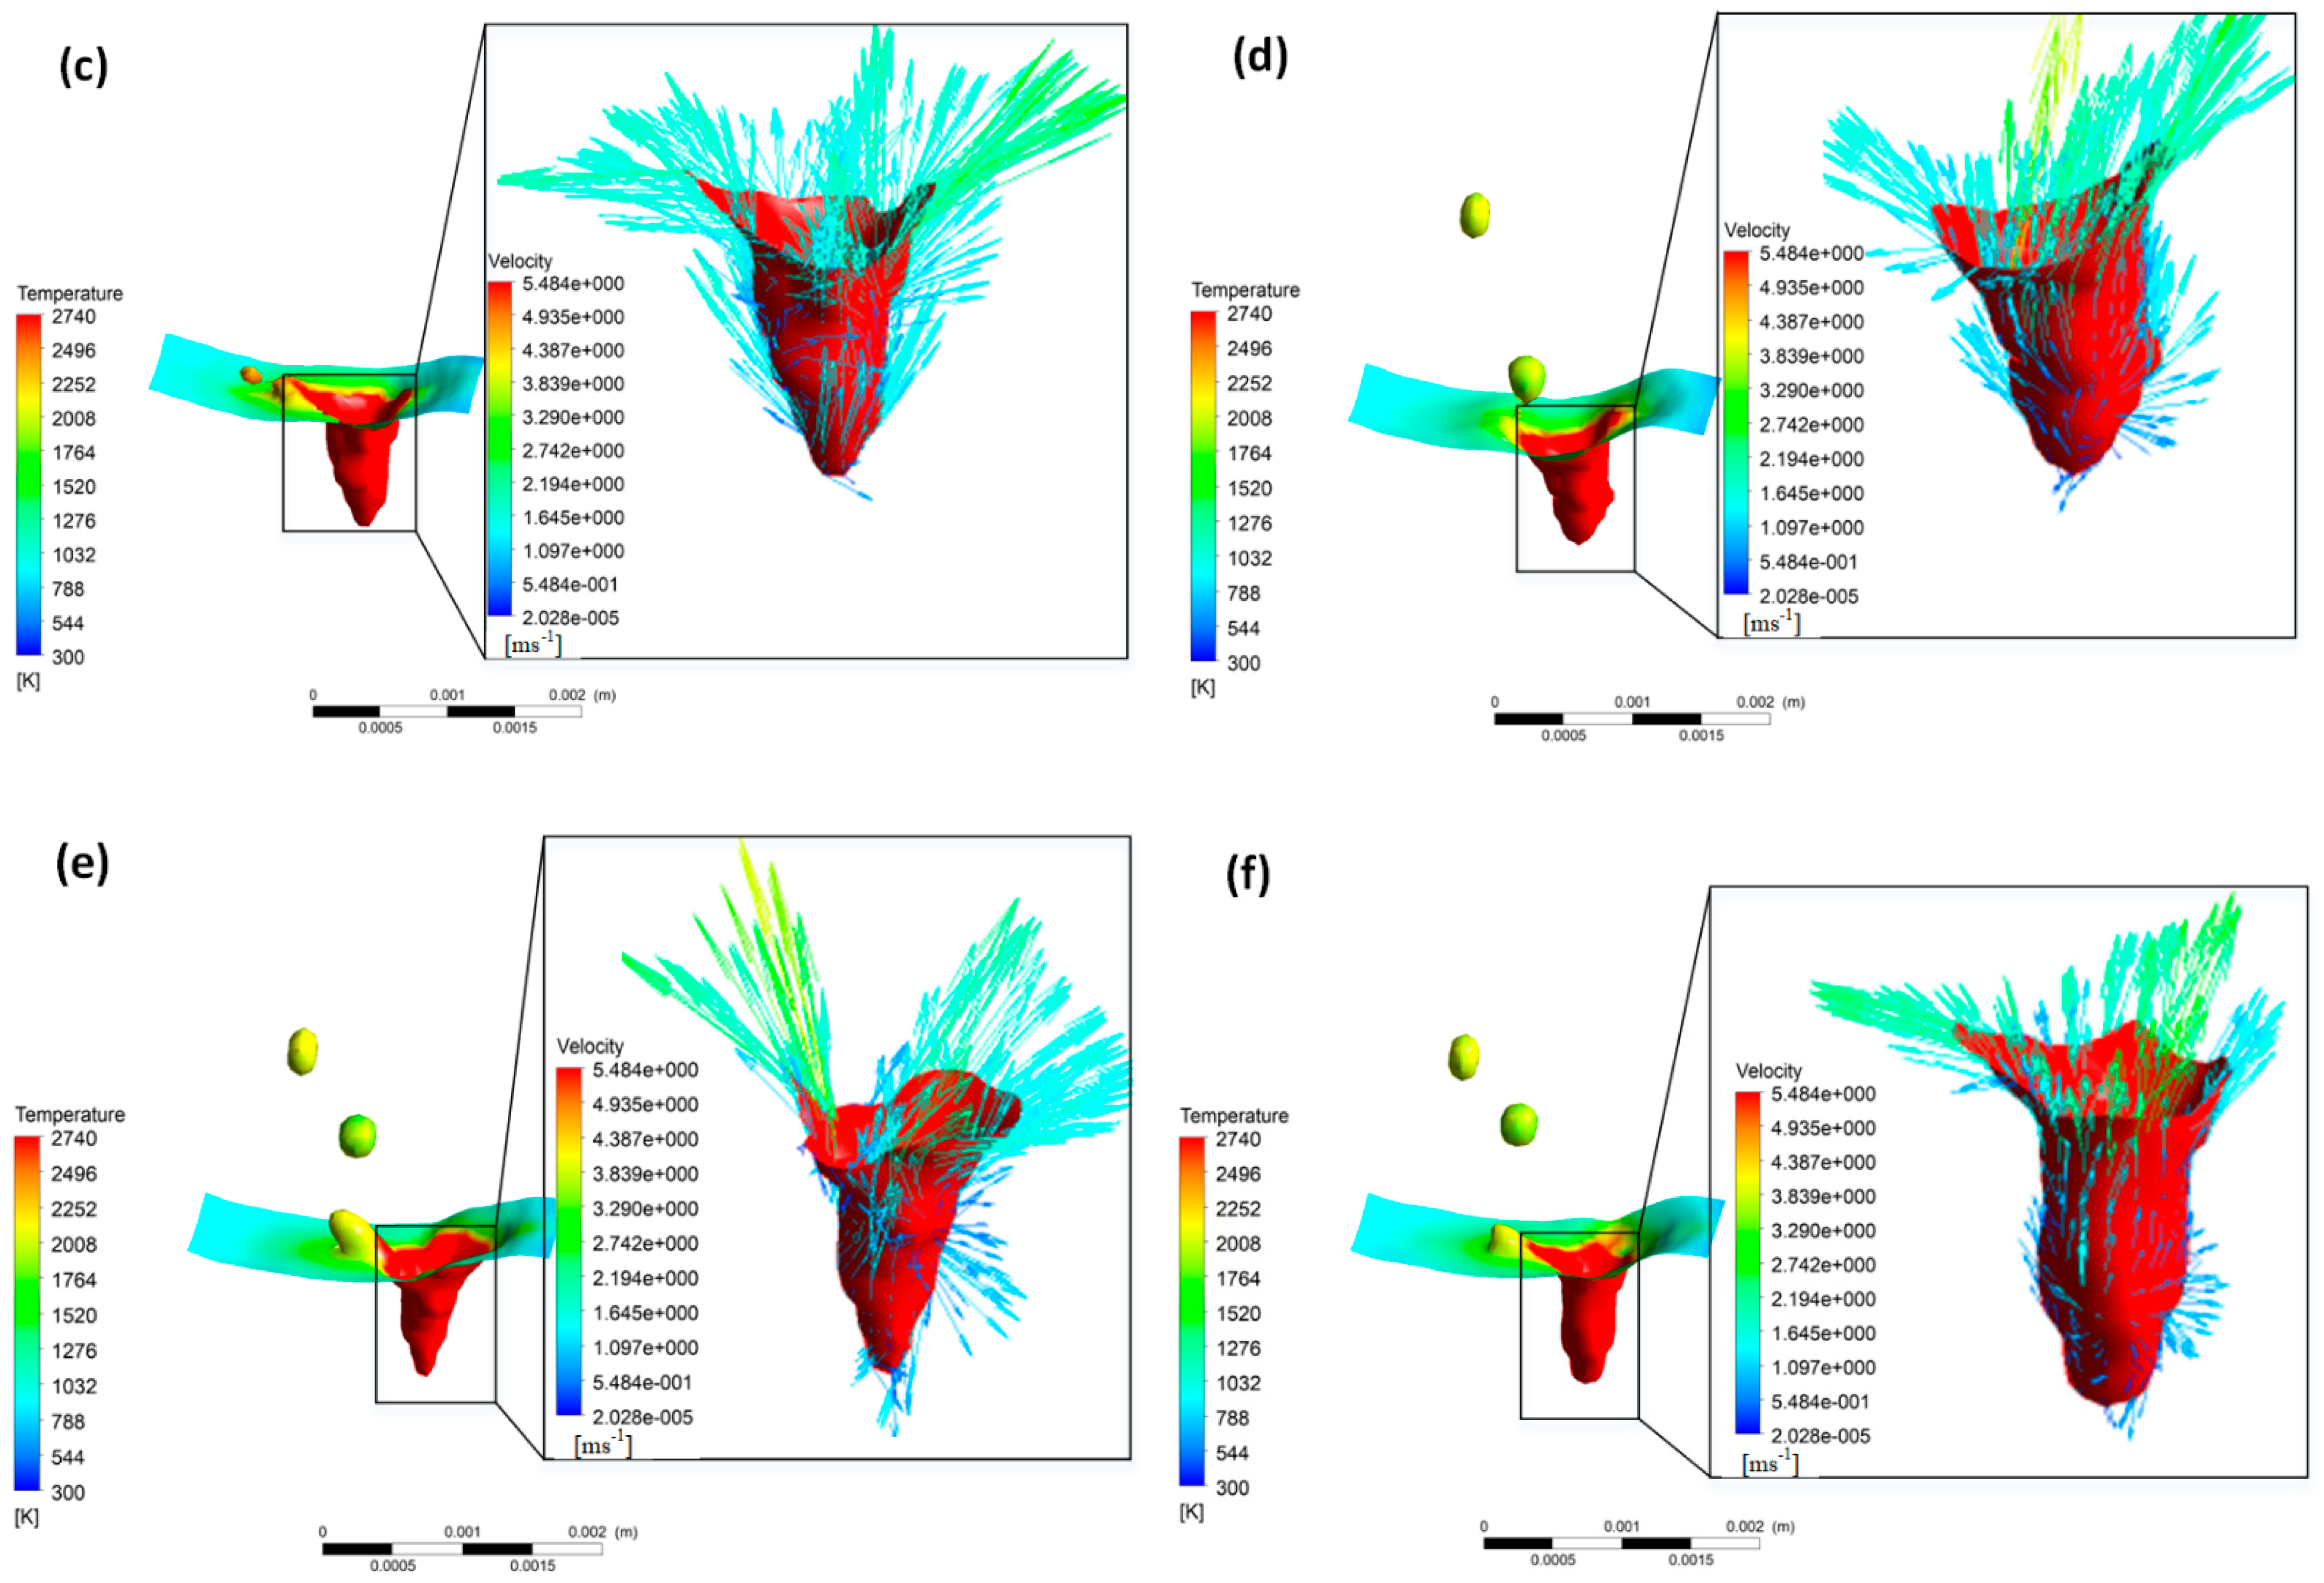
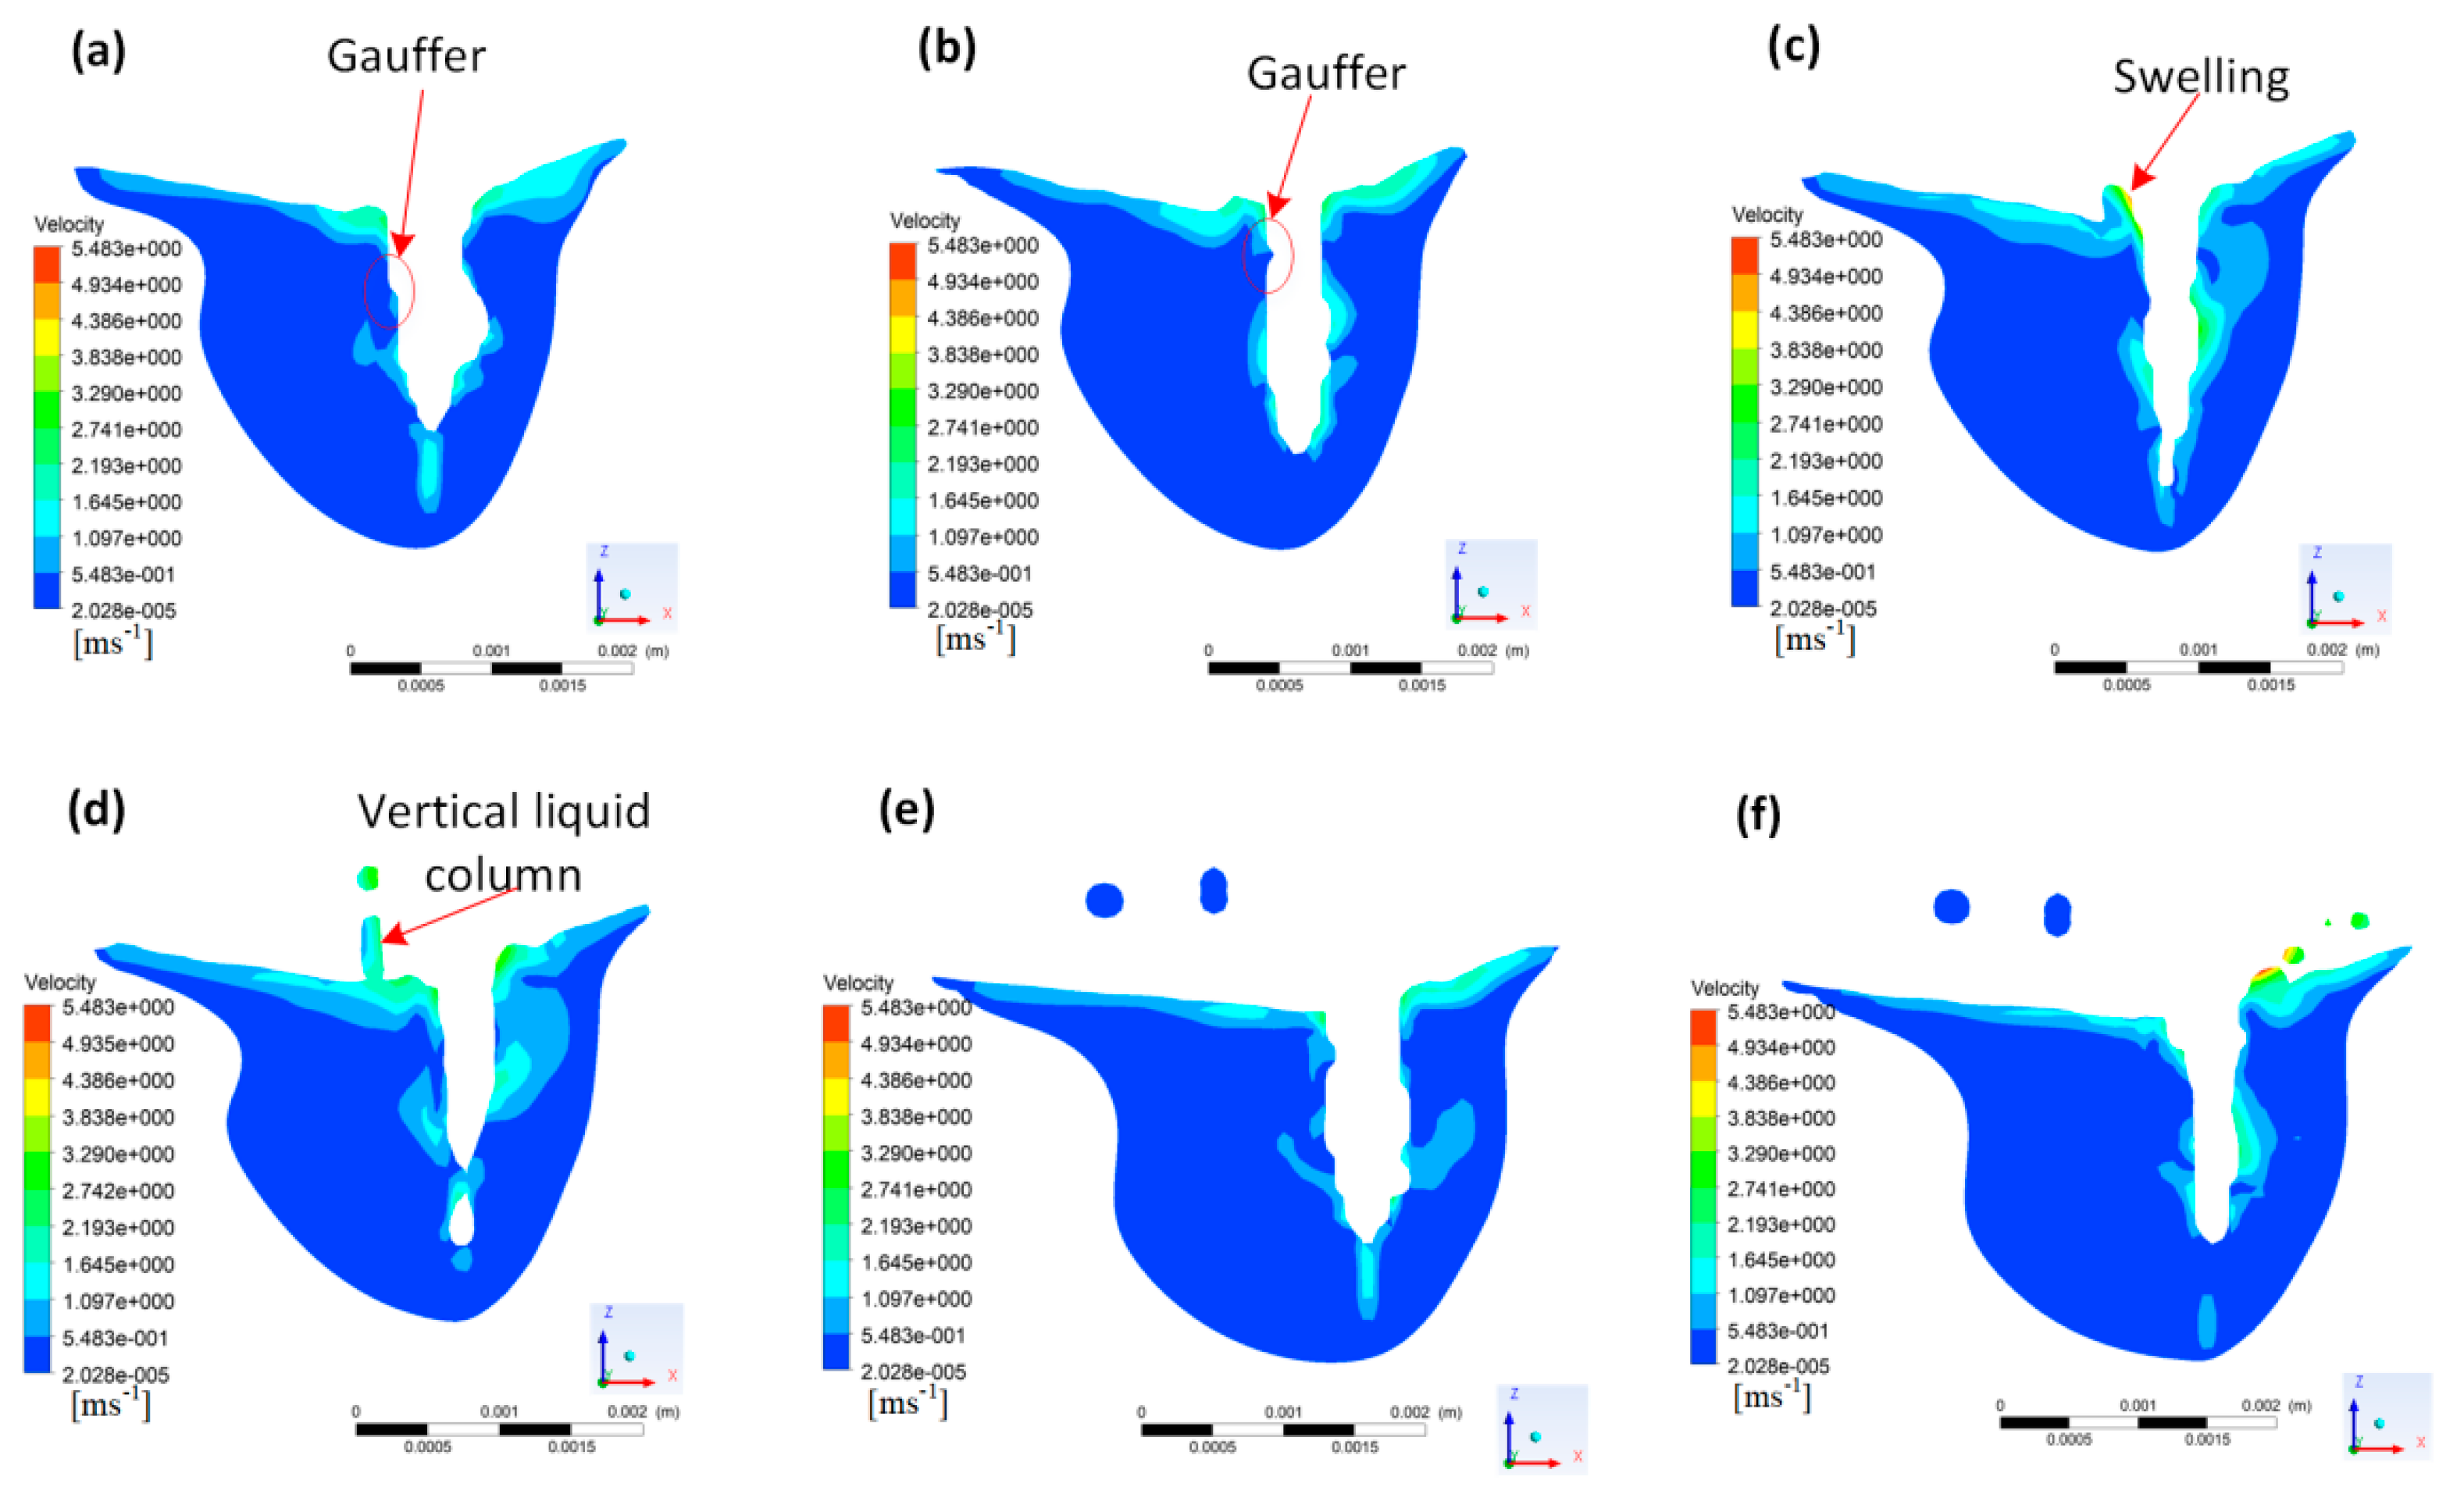
3.2. Three-Dimensional Transient Behavior of Keyhole
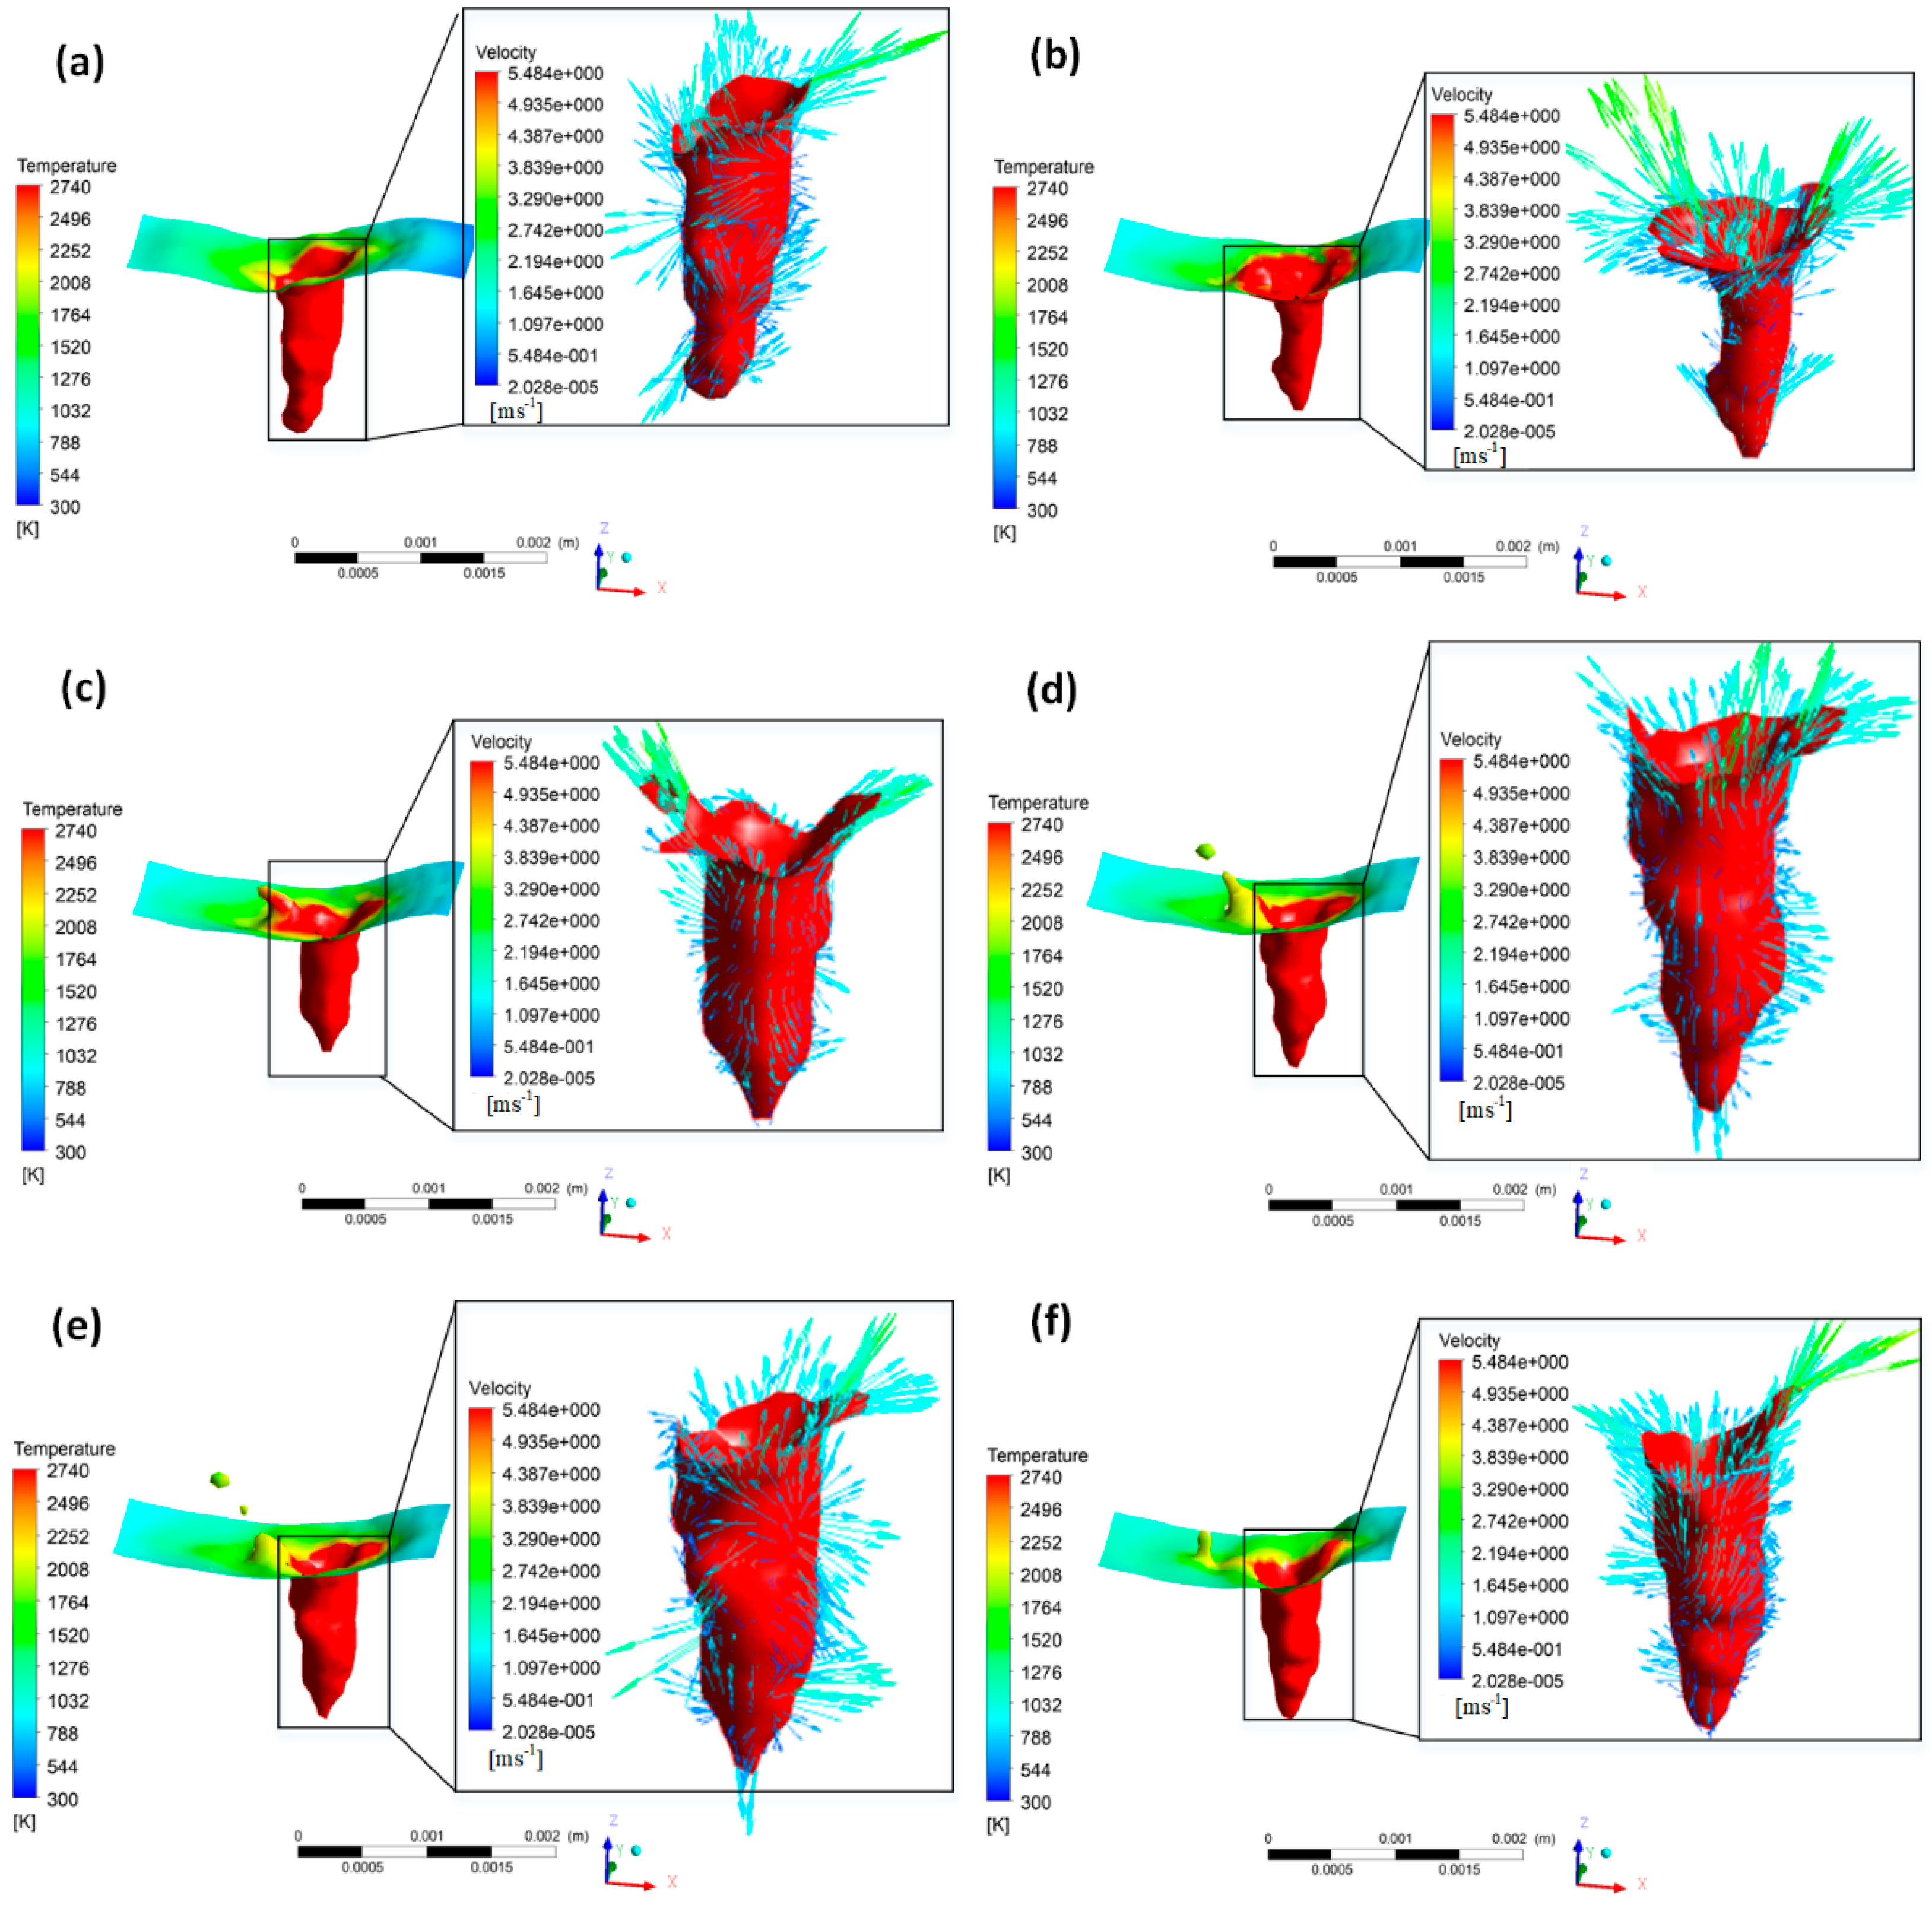
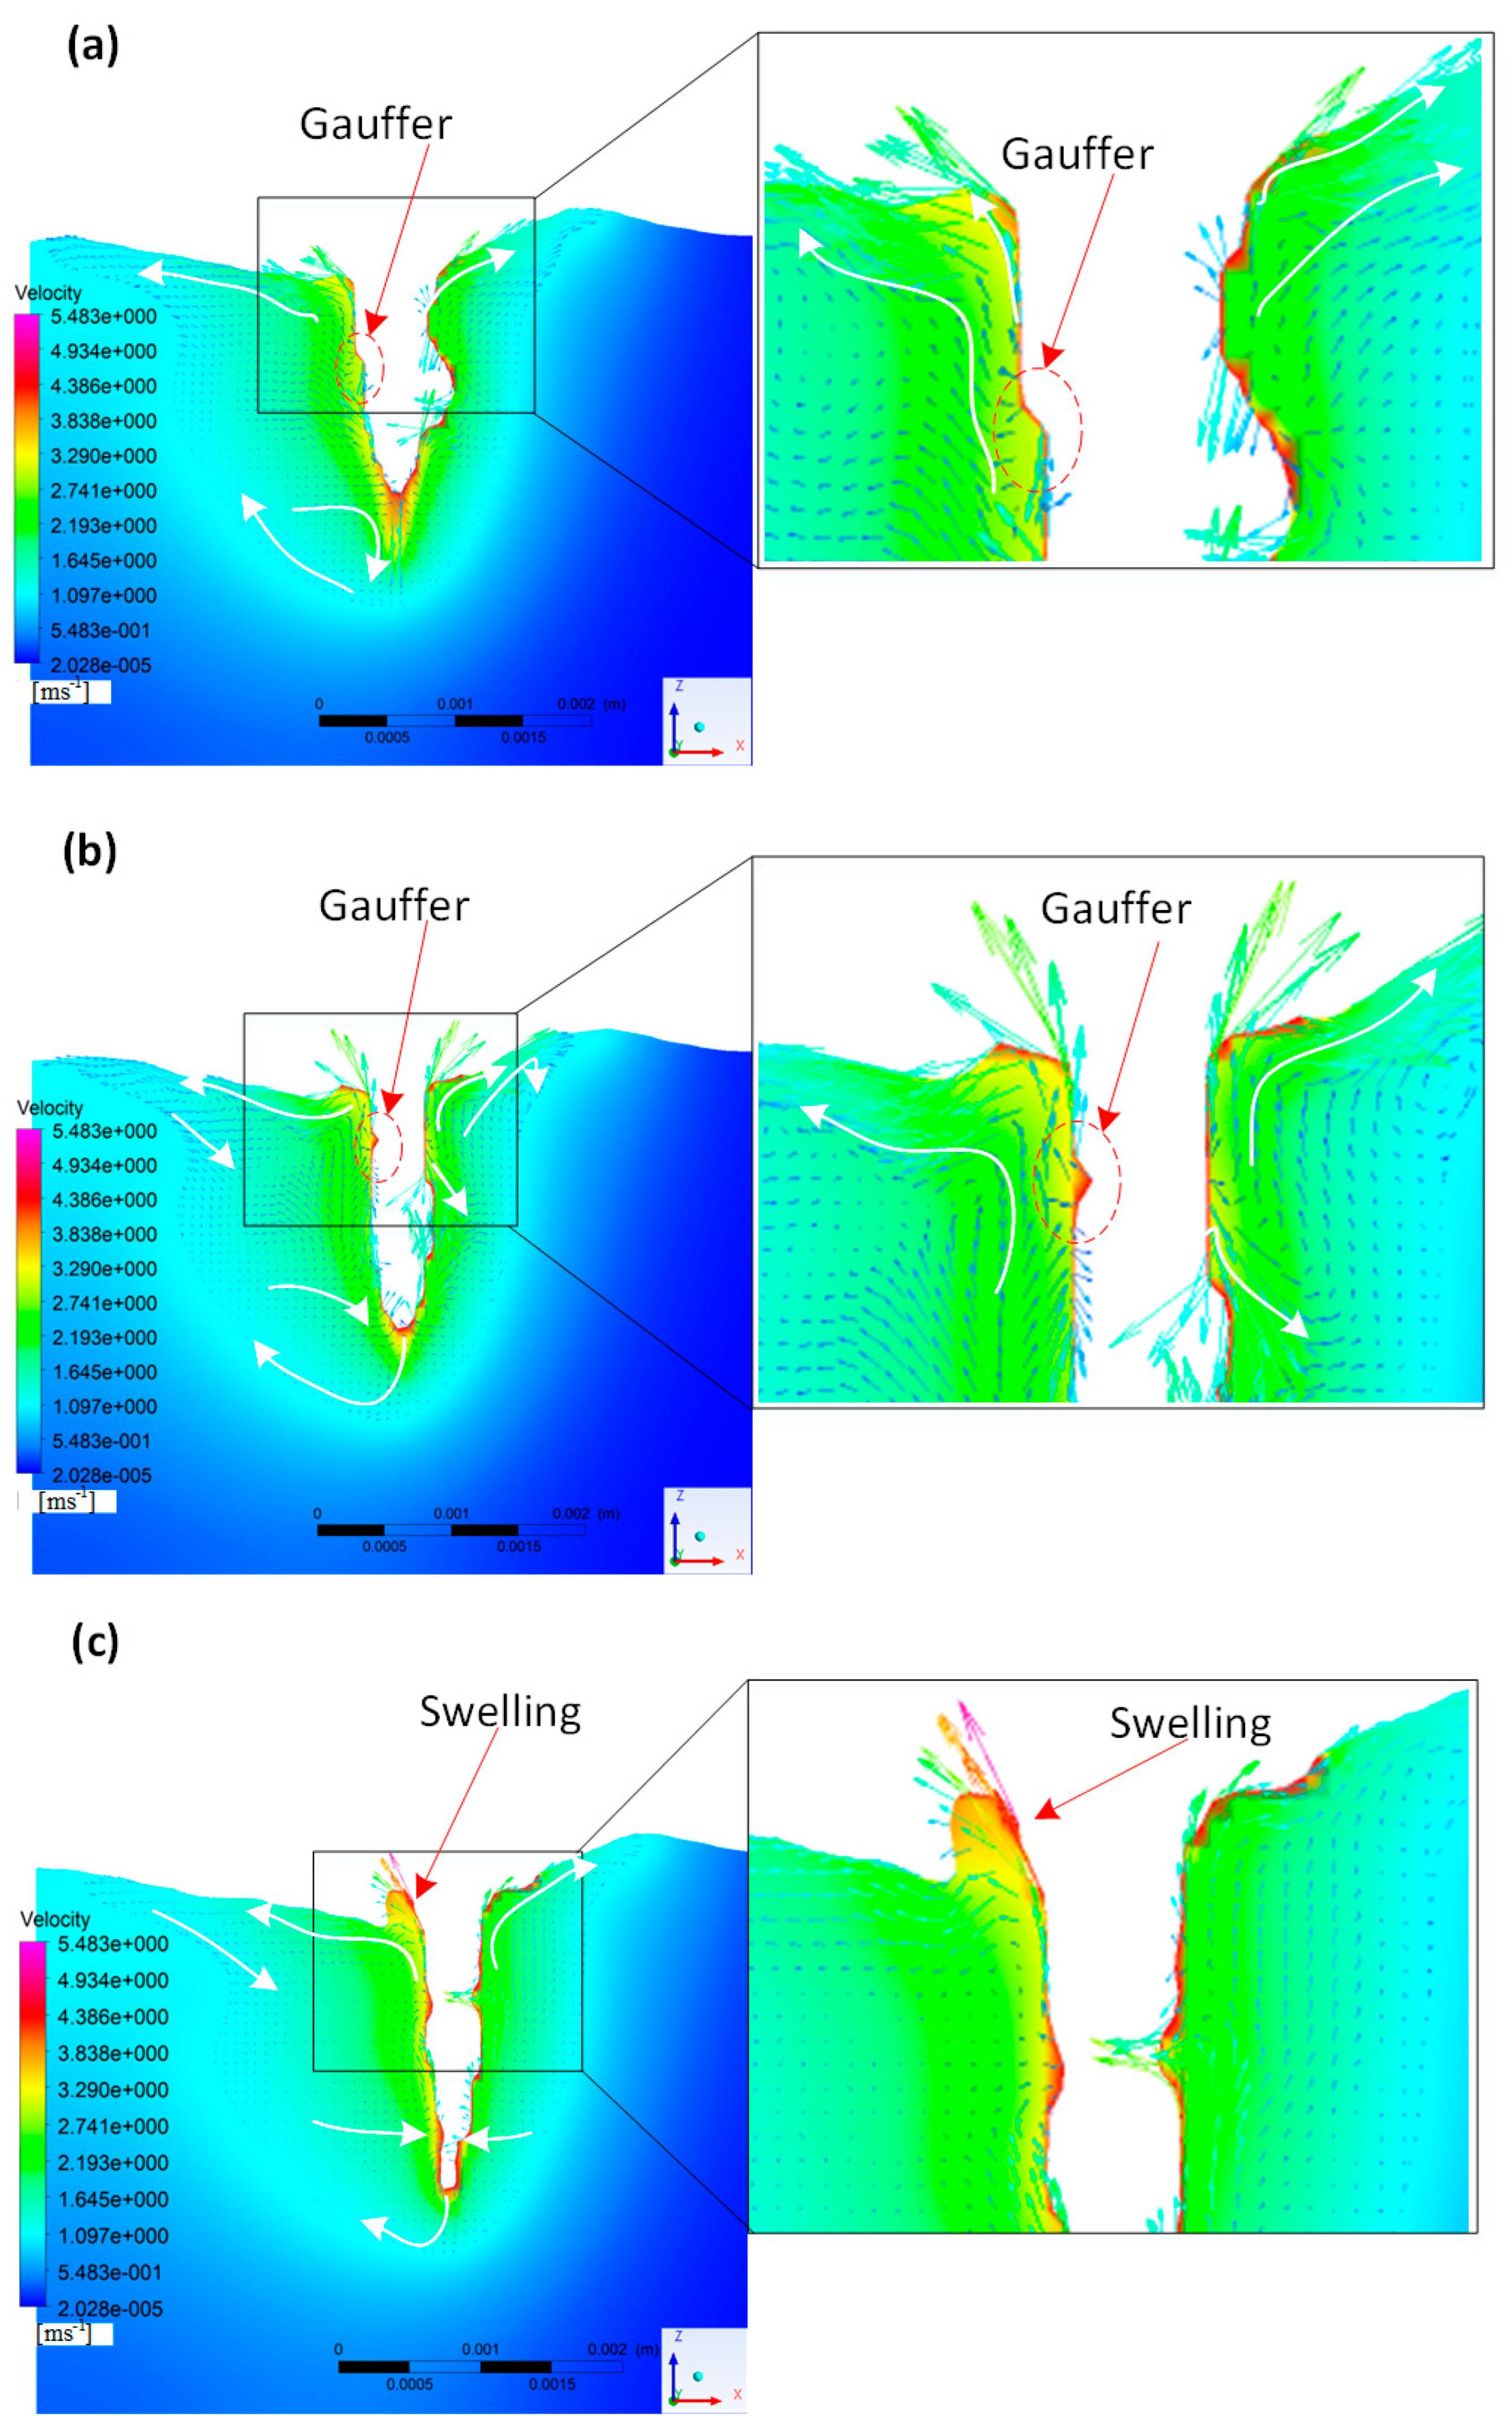
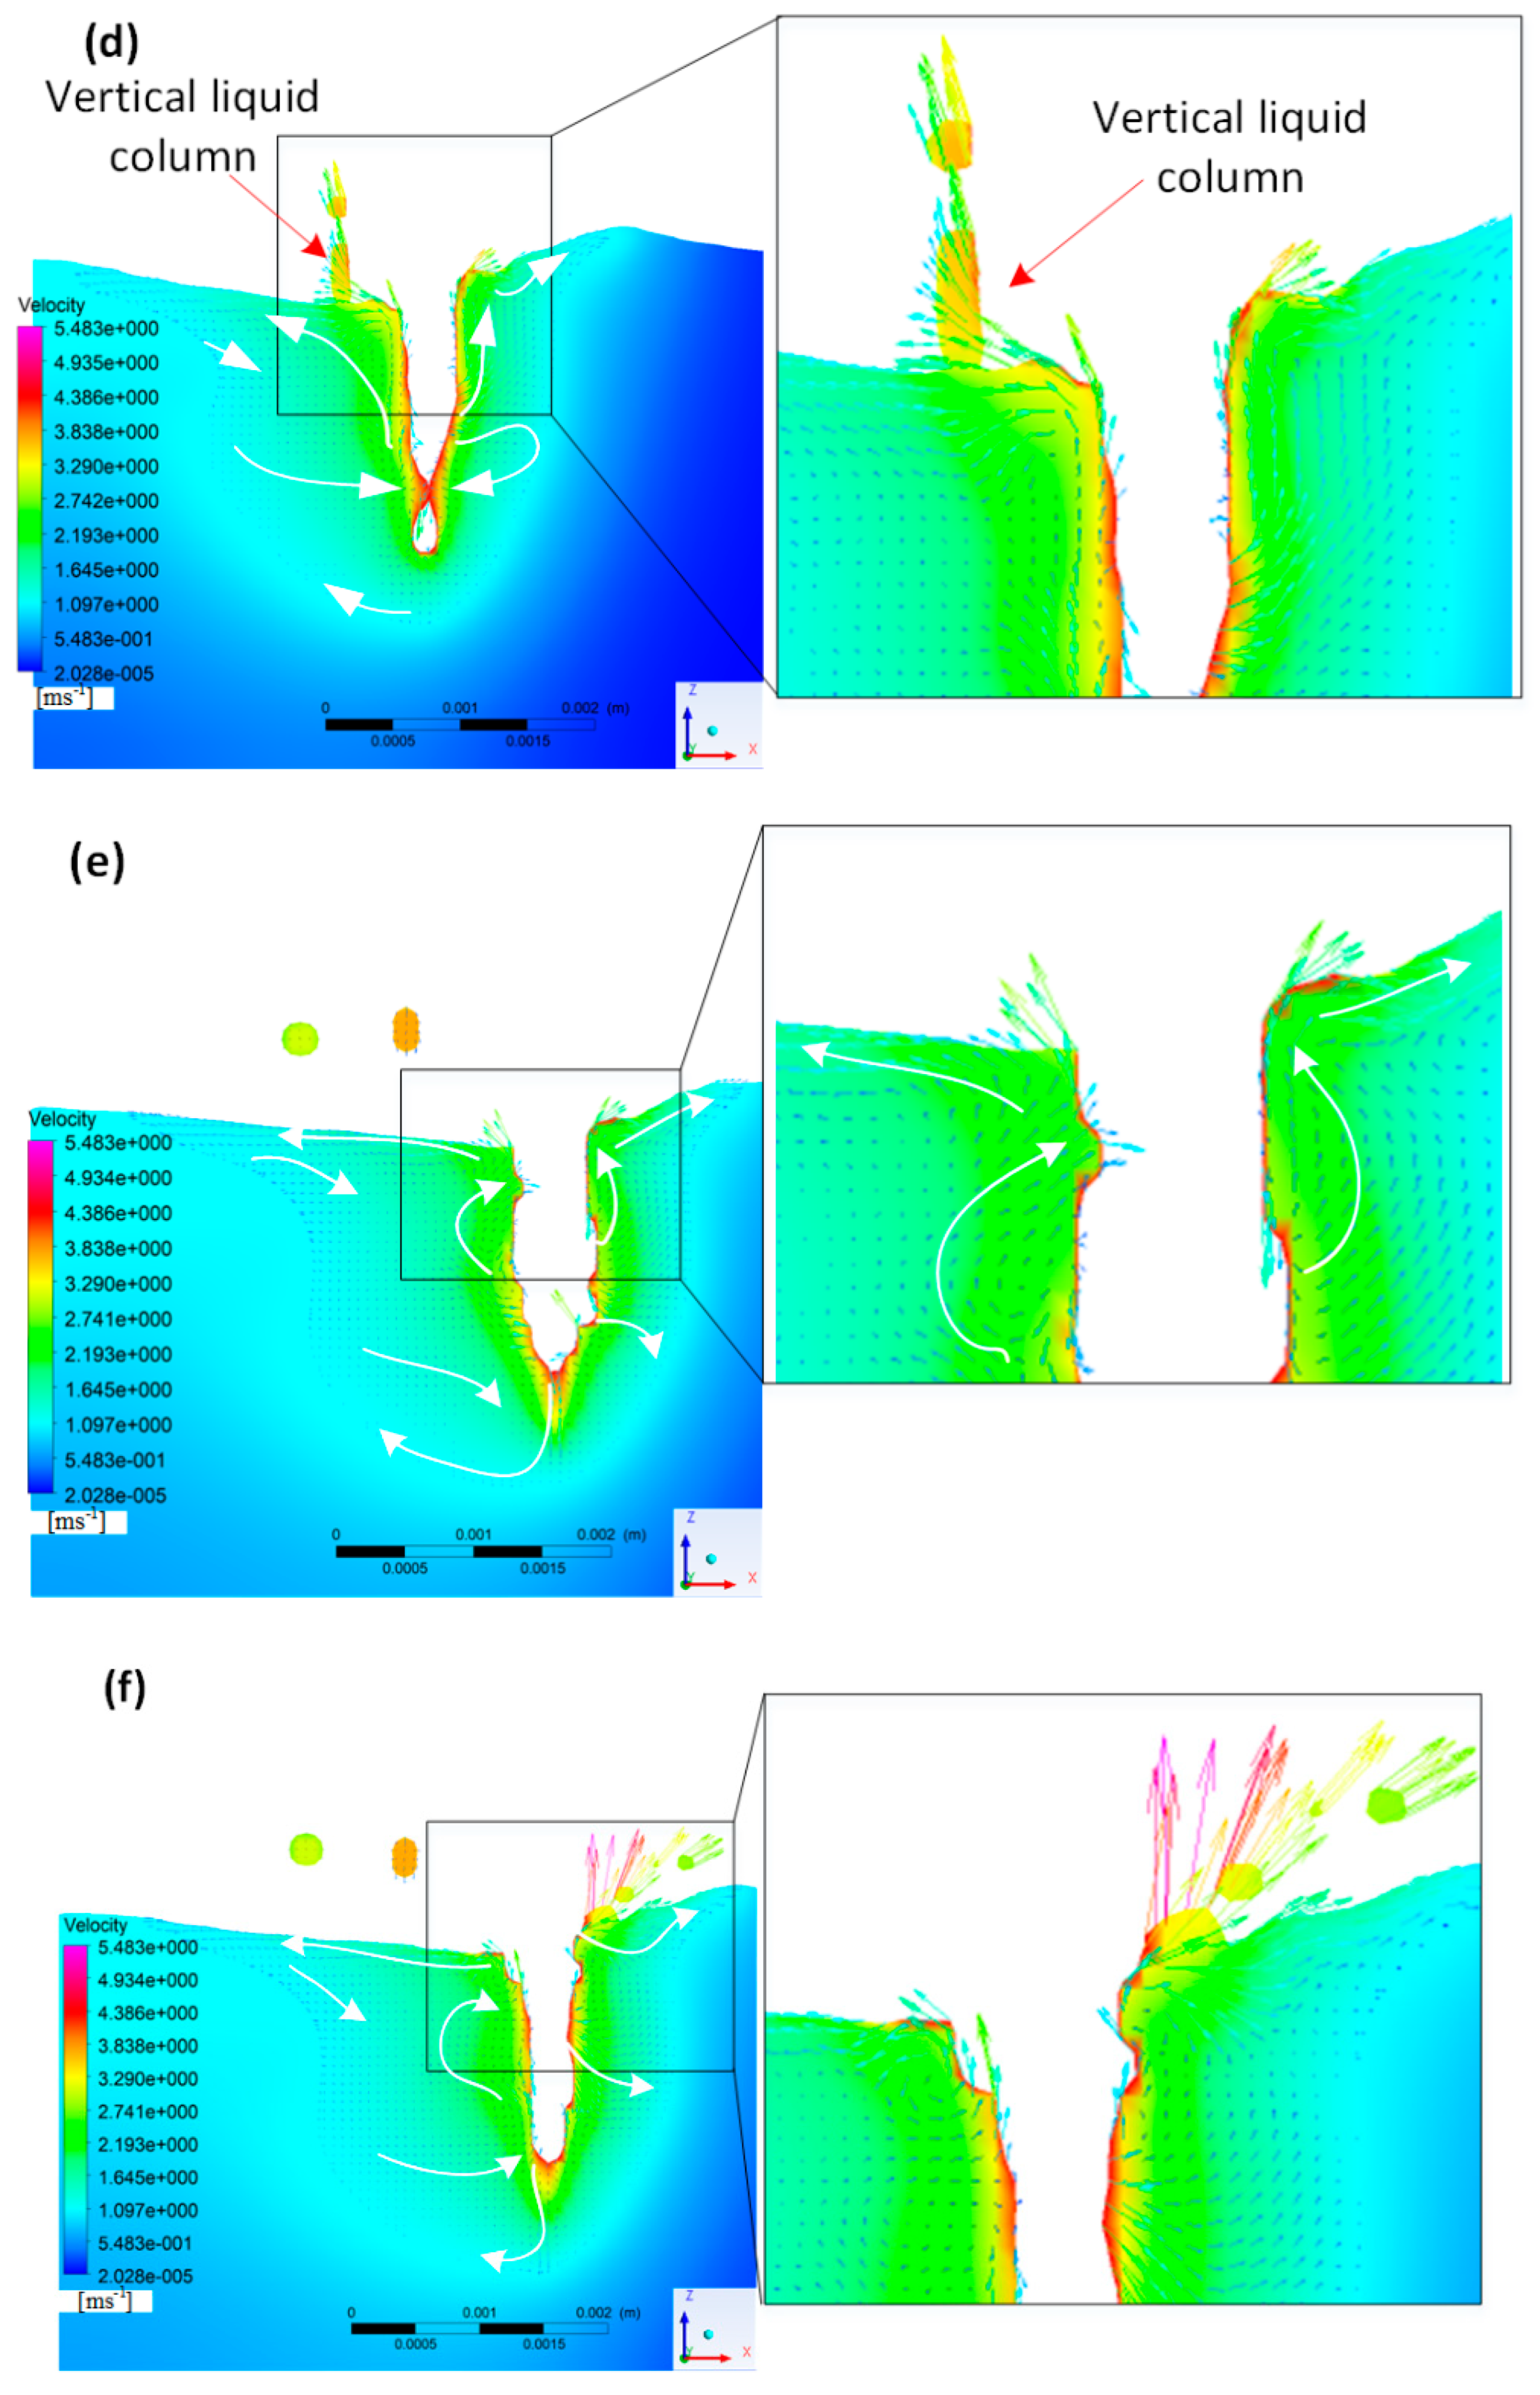
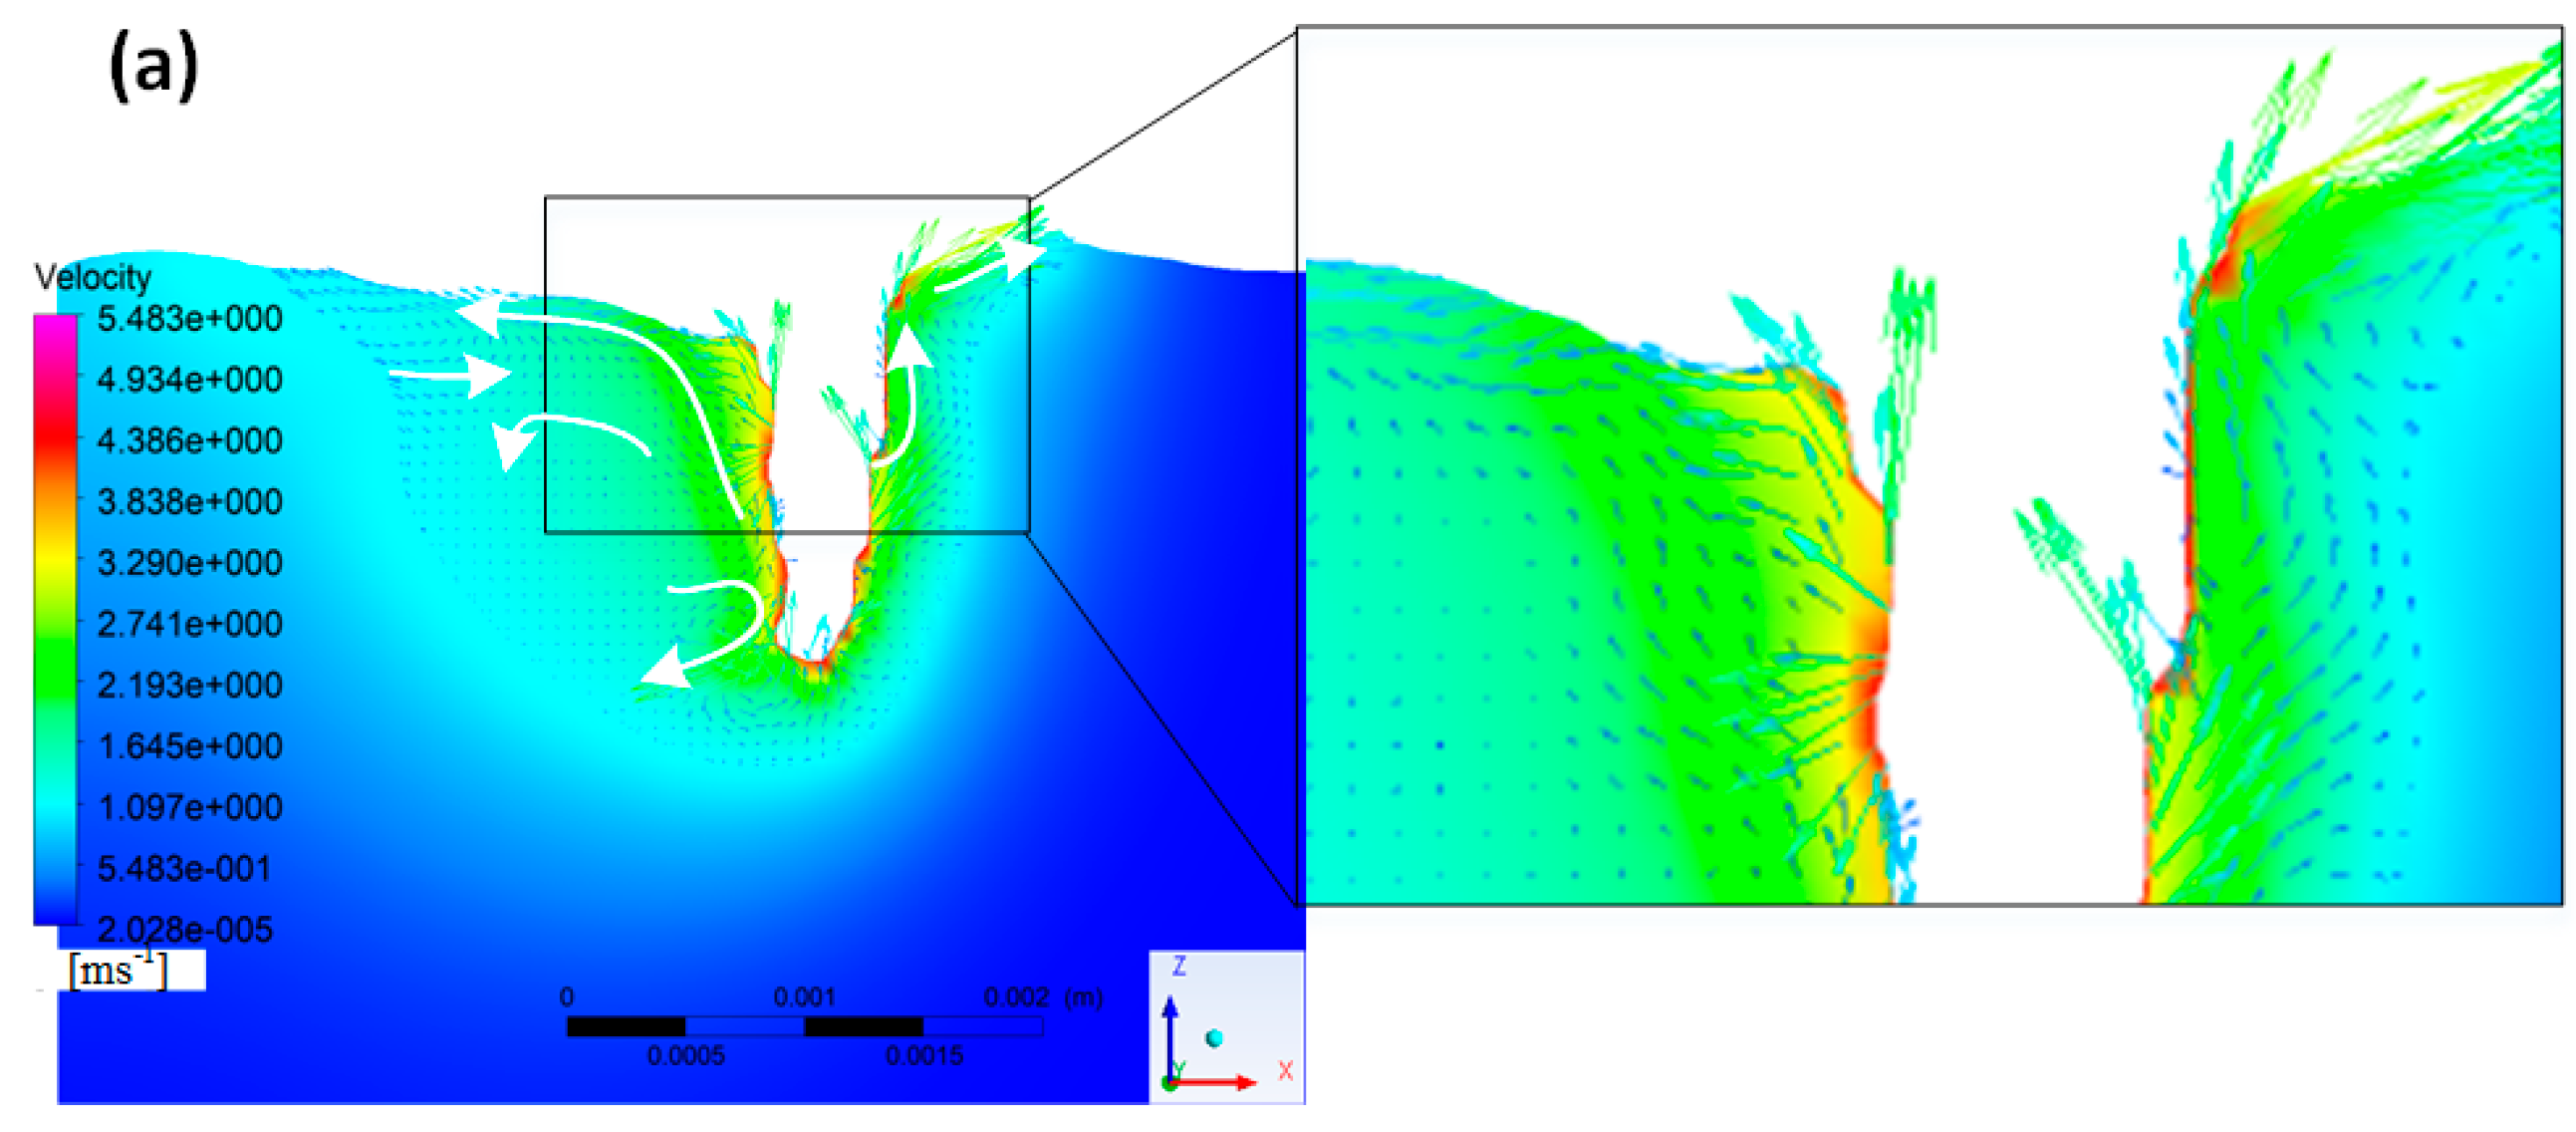
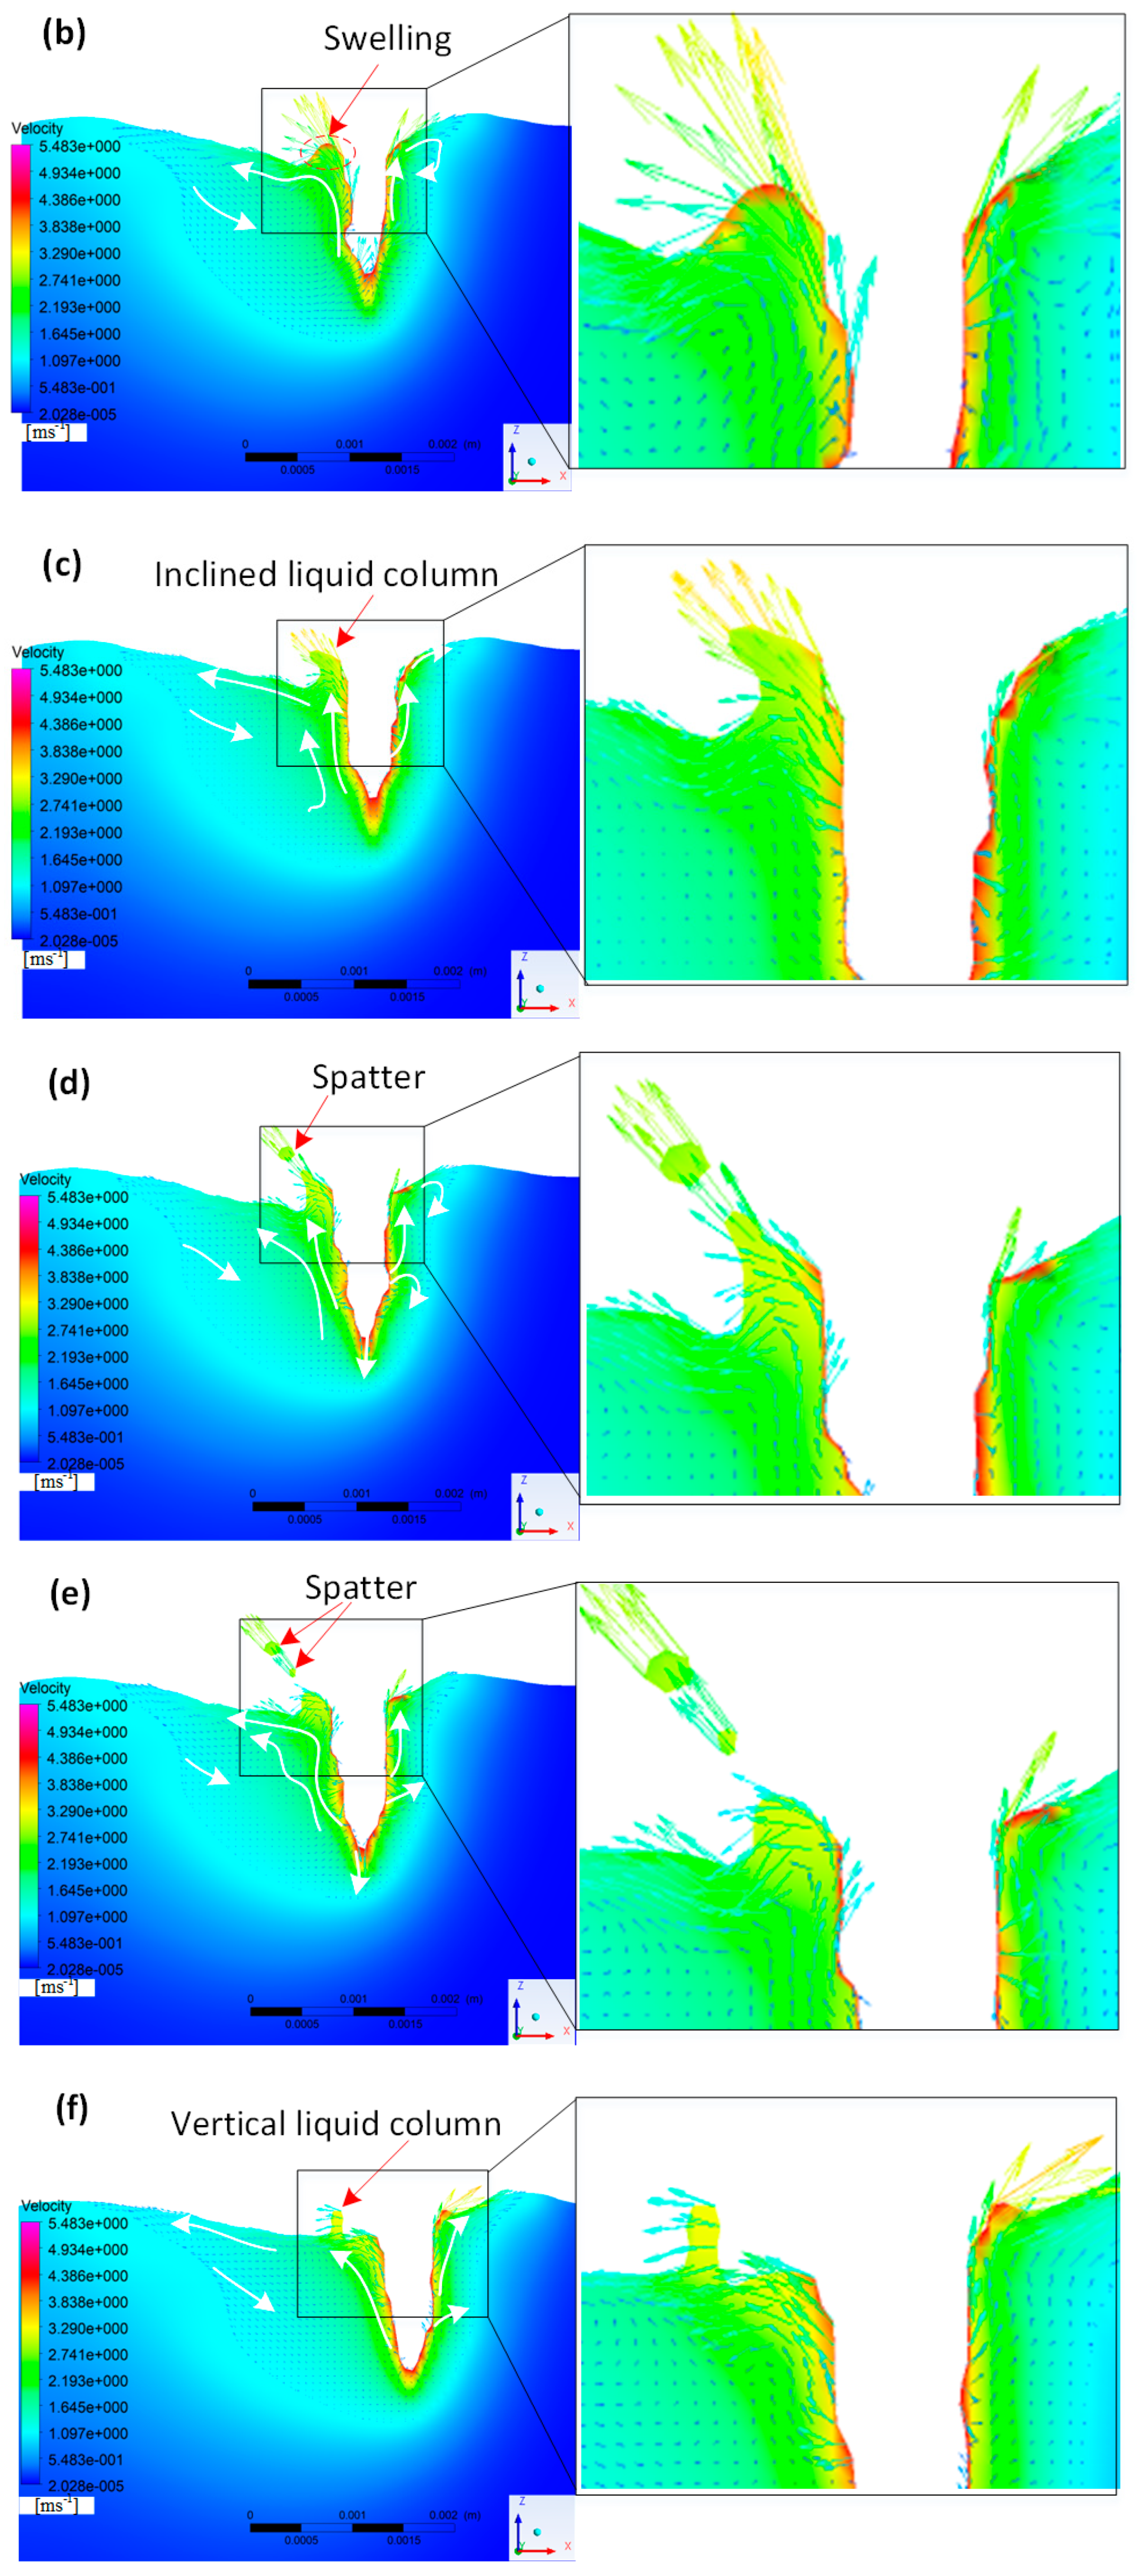
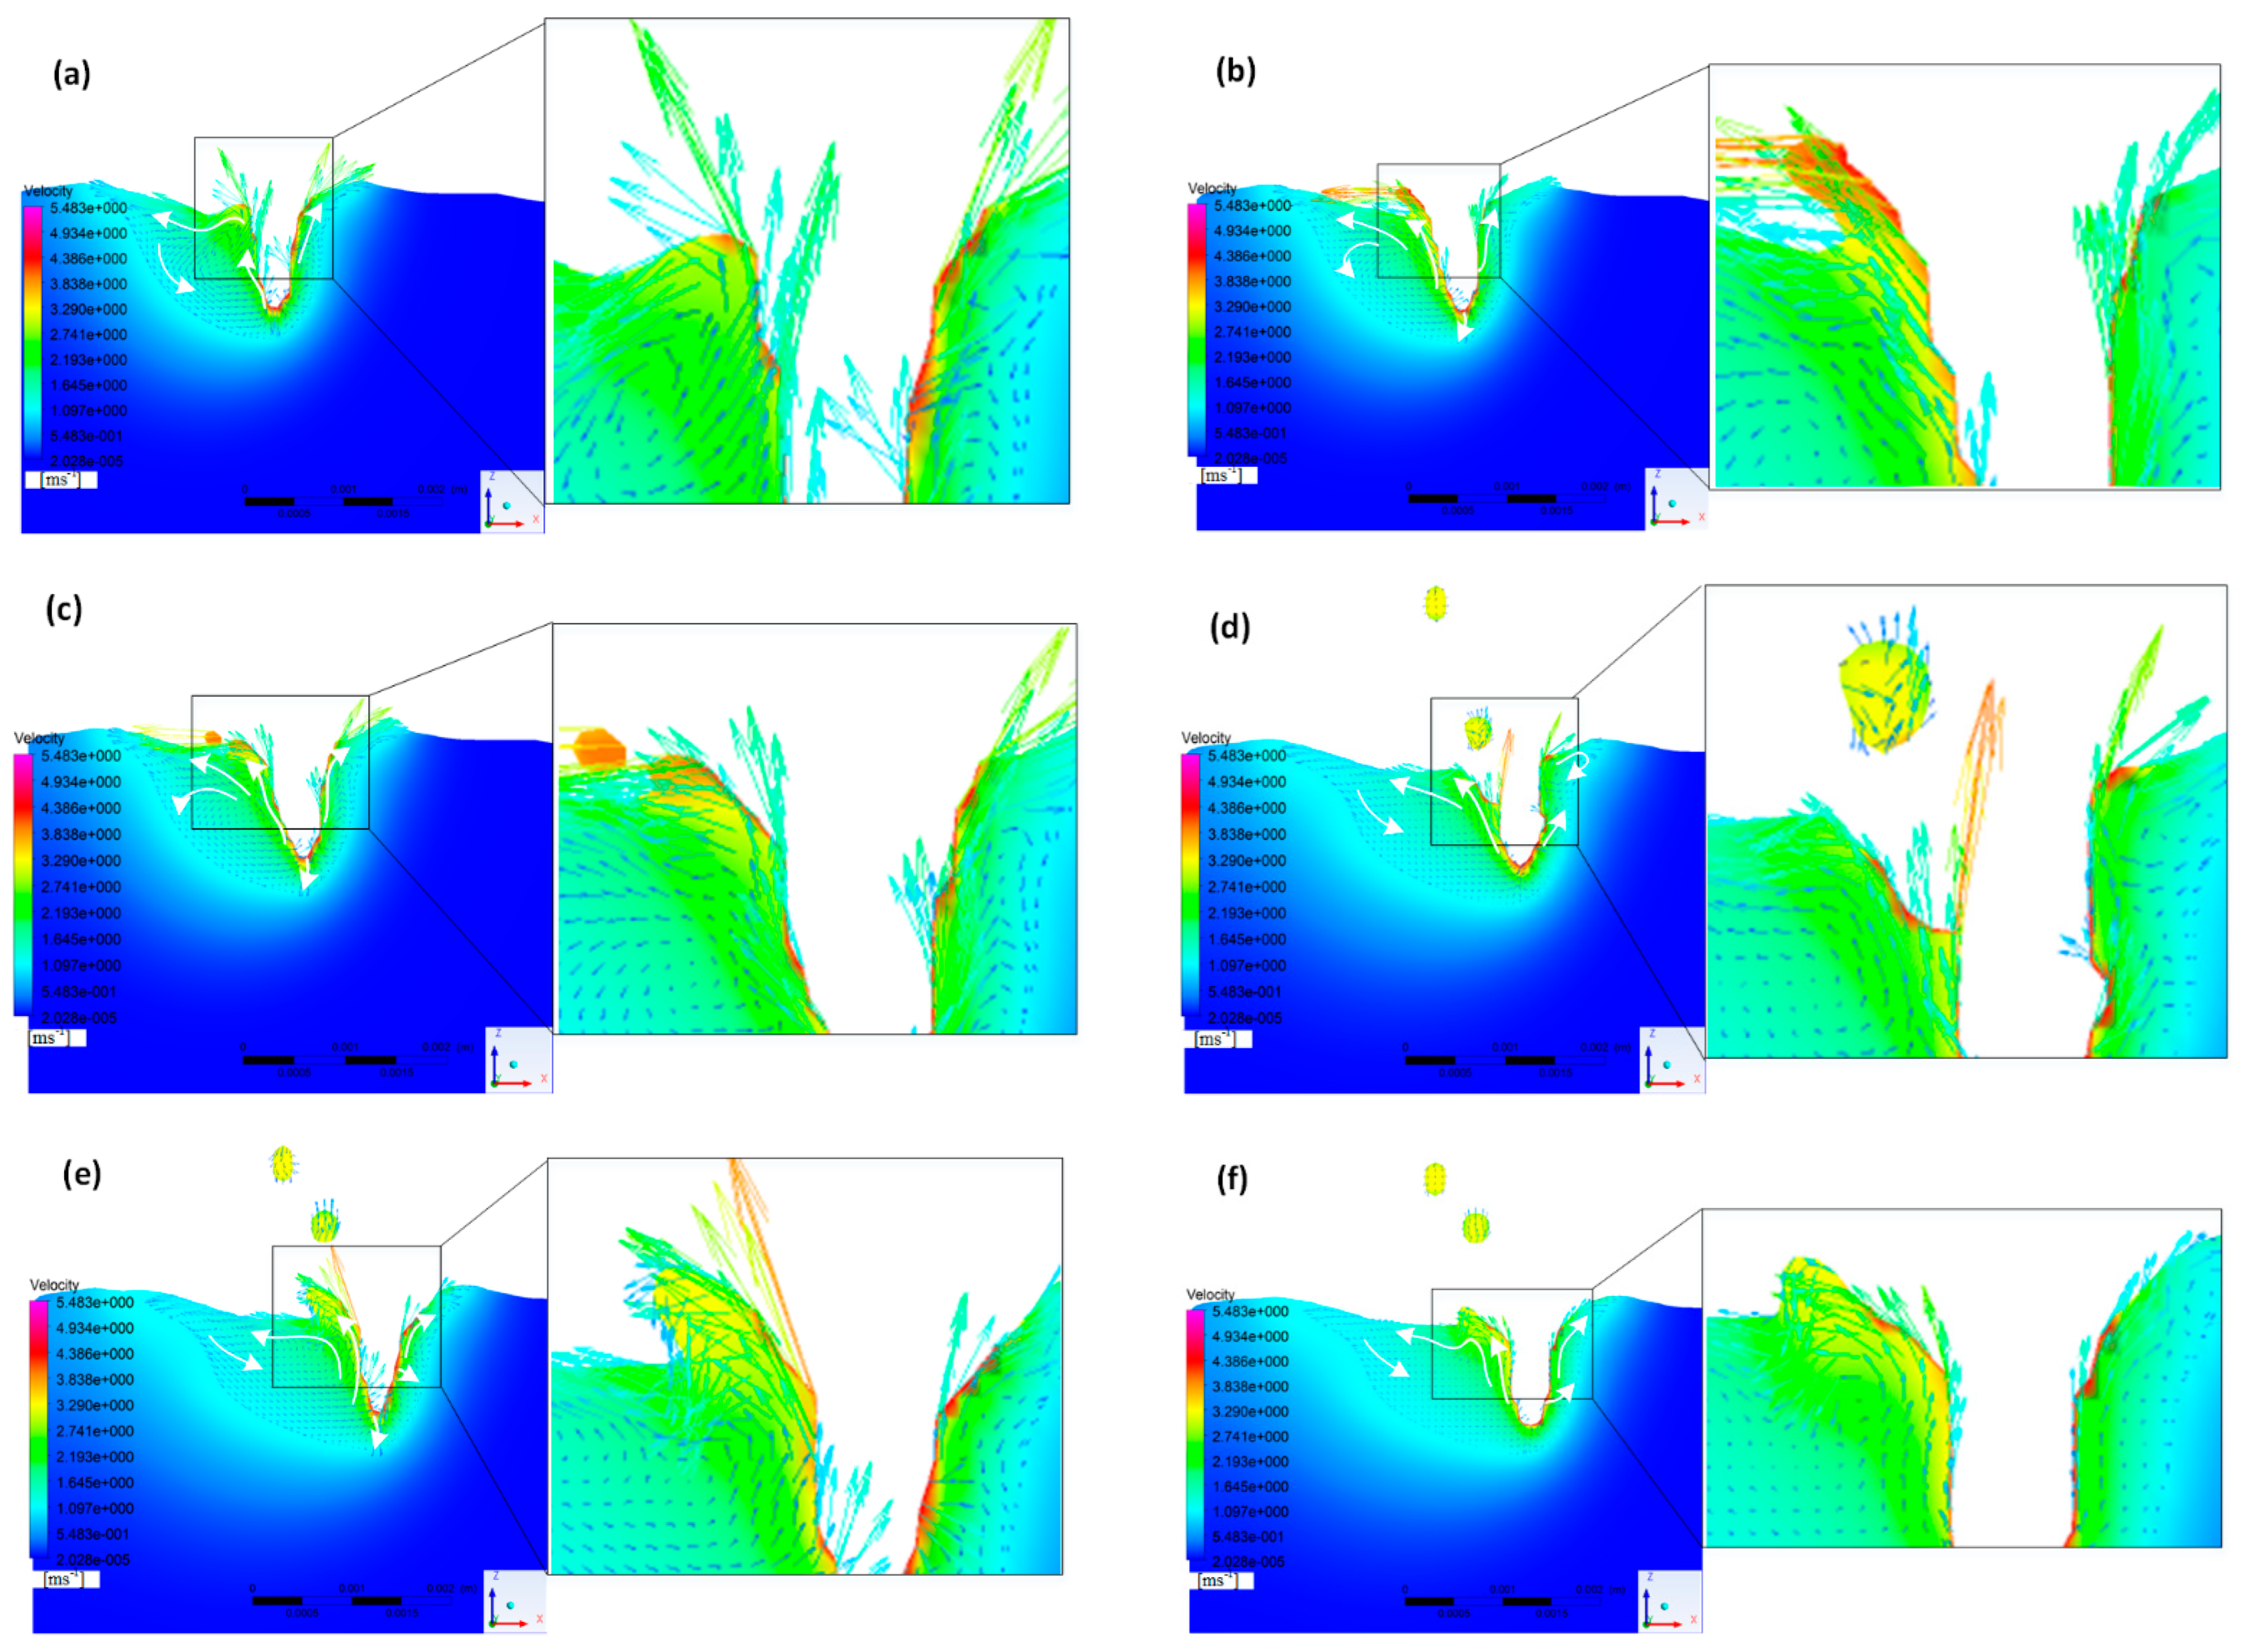
3.3. Flow Field of the Molten Pool
4. Conclusions
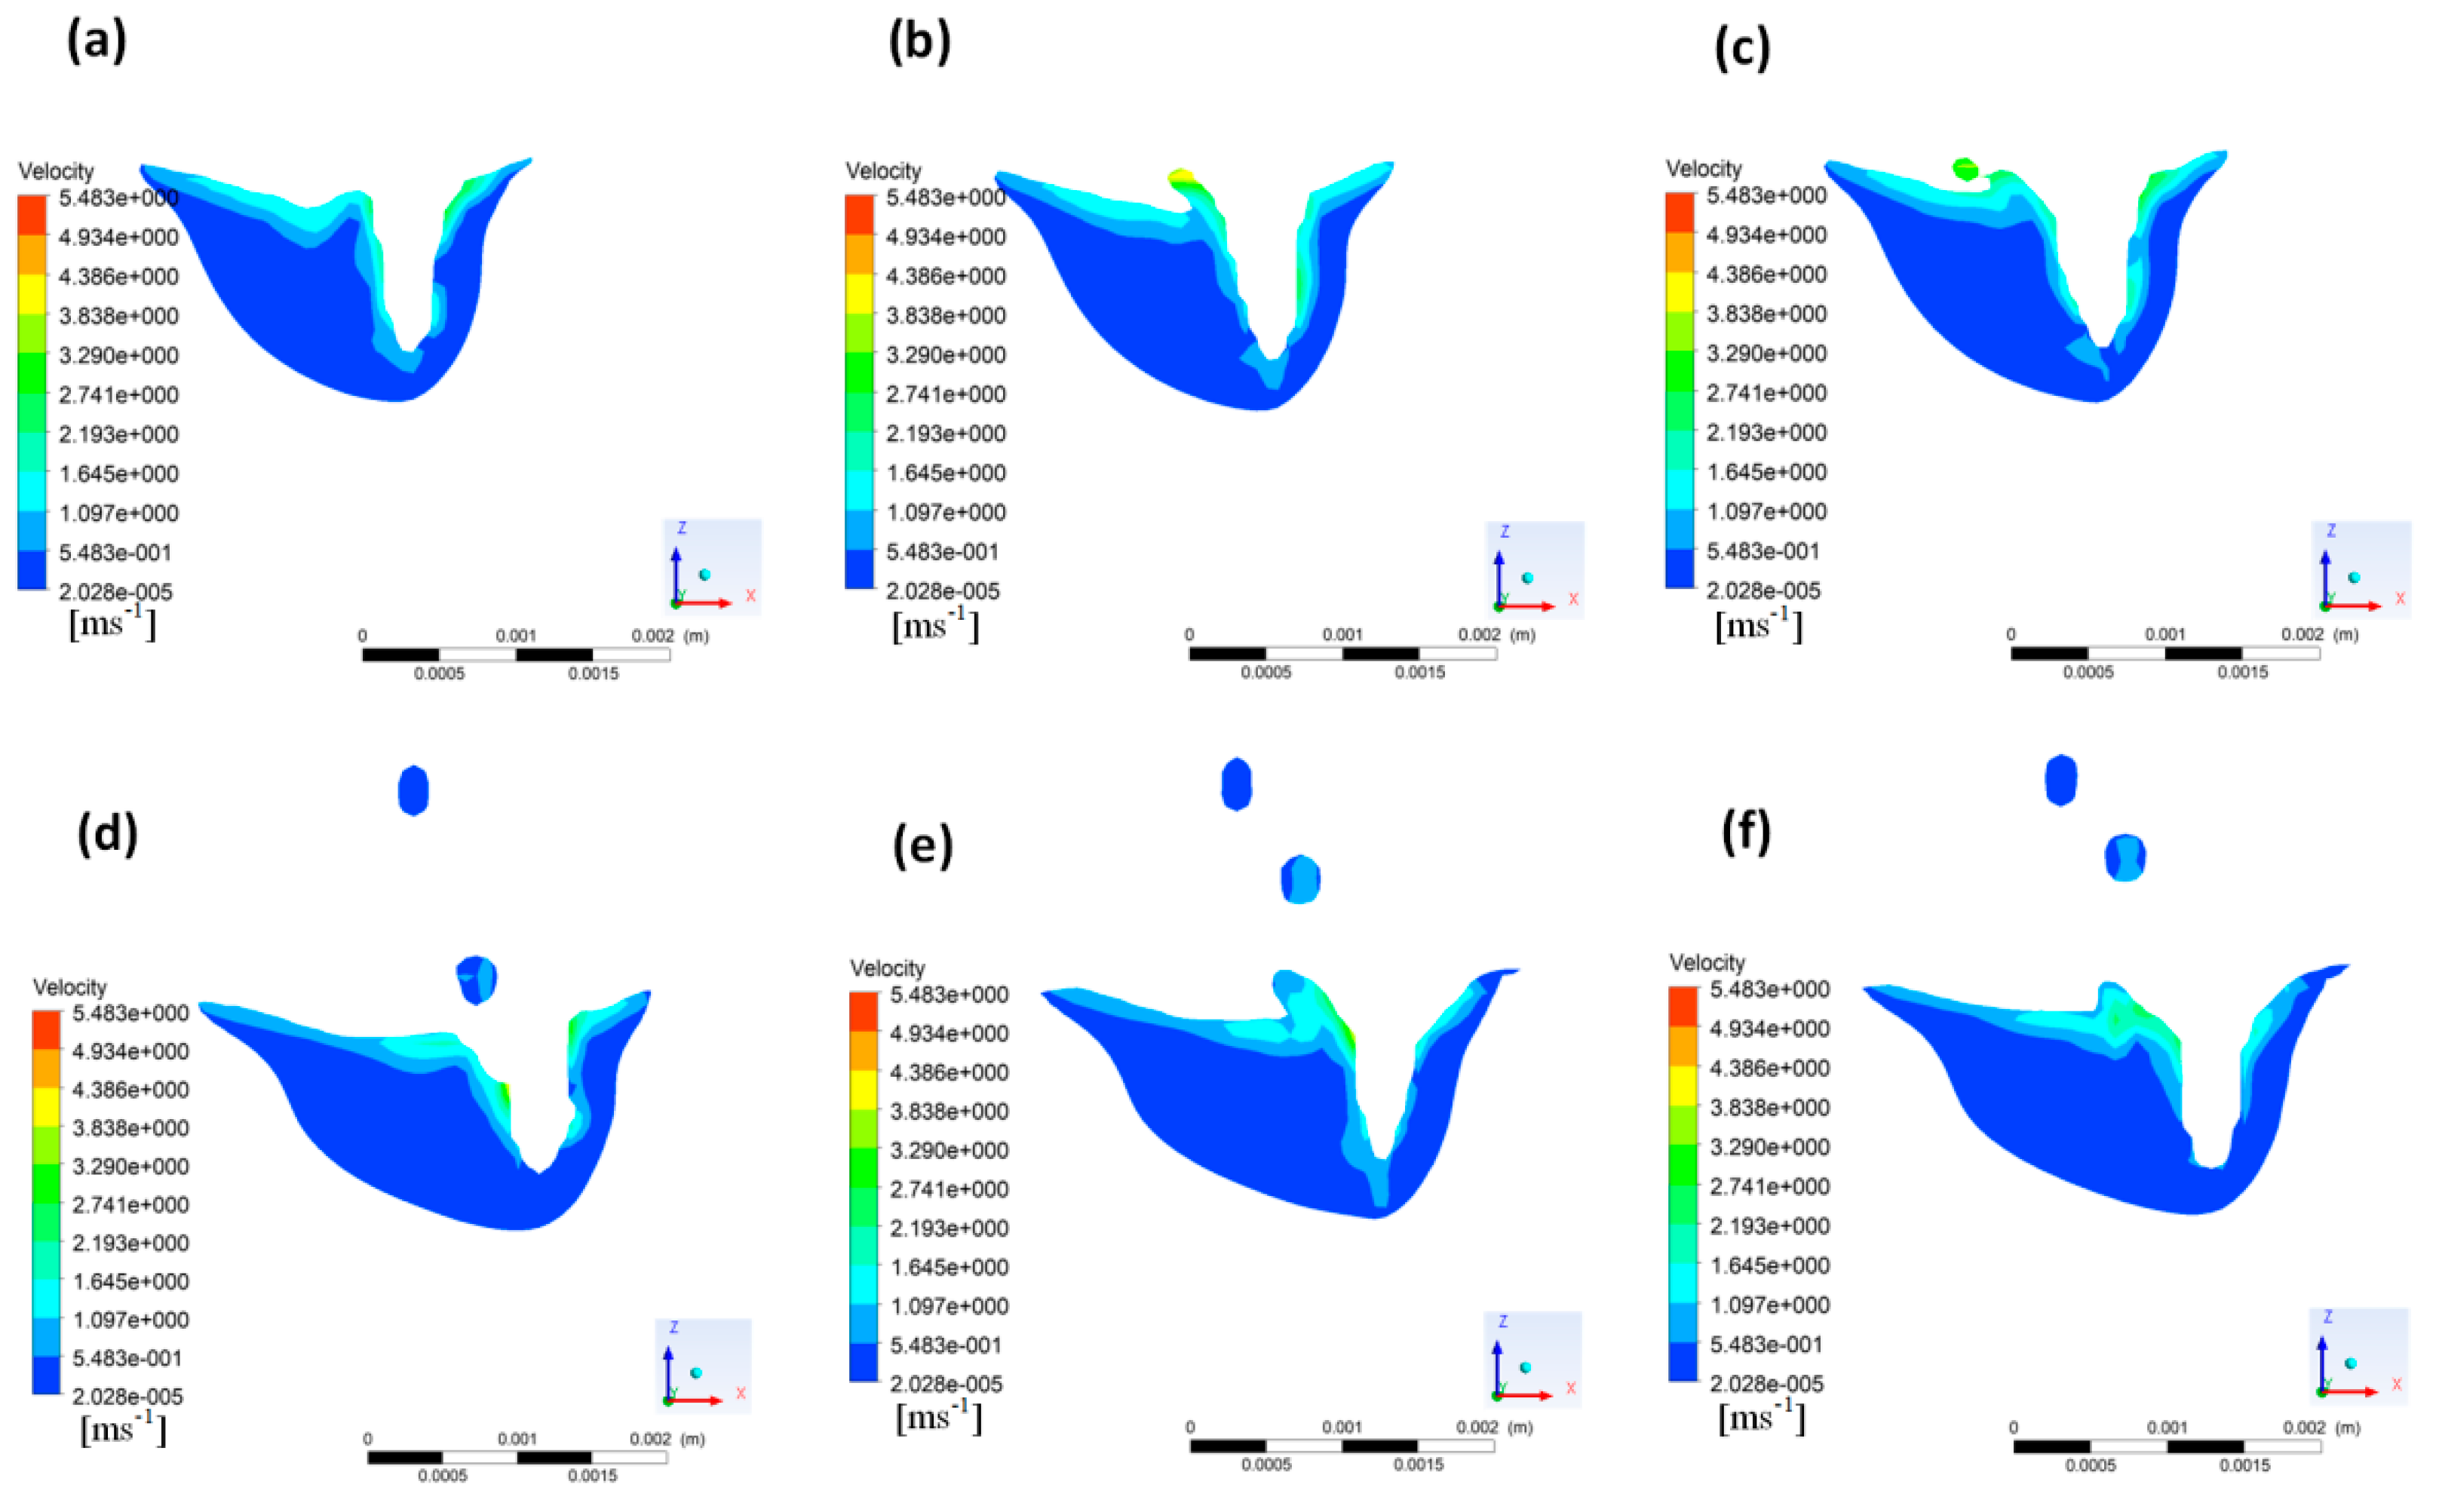
- The generation of welding spatters was directly related to the fluctuation of the diameter size in the middle of the keyhole. When the diameter in the middle of the keyhole increased to a certain extent, welding spatters occurred. When welding spatters occurred, the diameter in the middle of the keyhole became smaller, and the size of spatters at the welding speed of 9 m/min was larger than that at welding speeds of 3 m/min and 6 m/min.
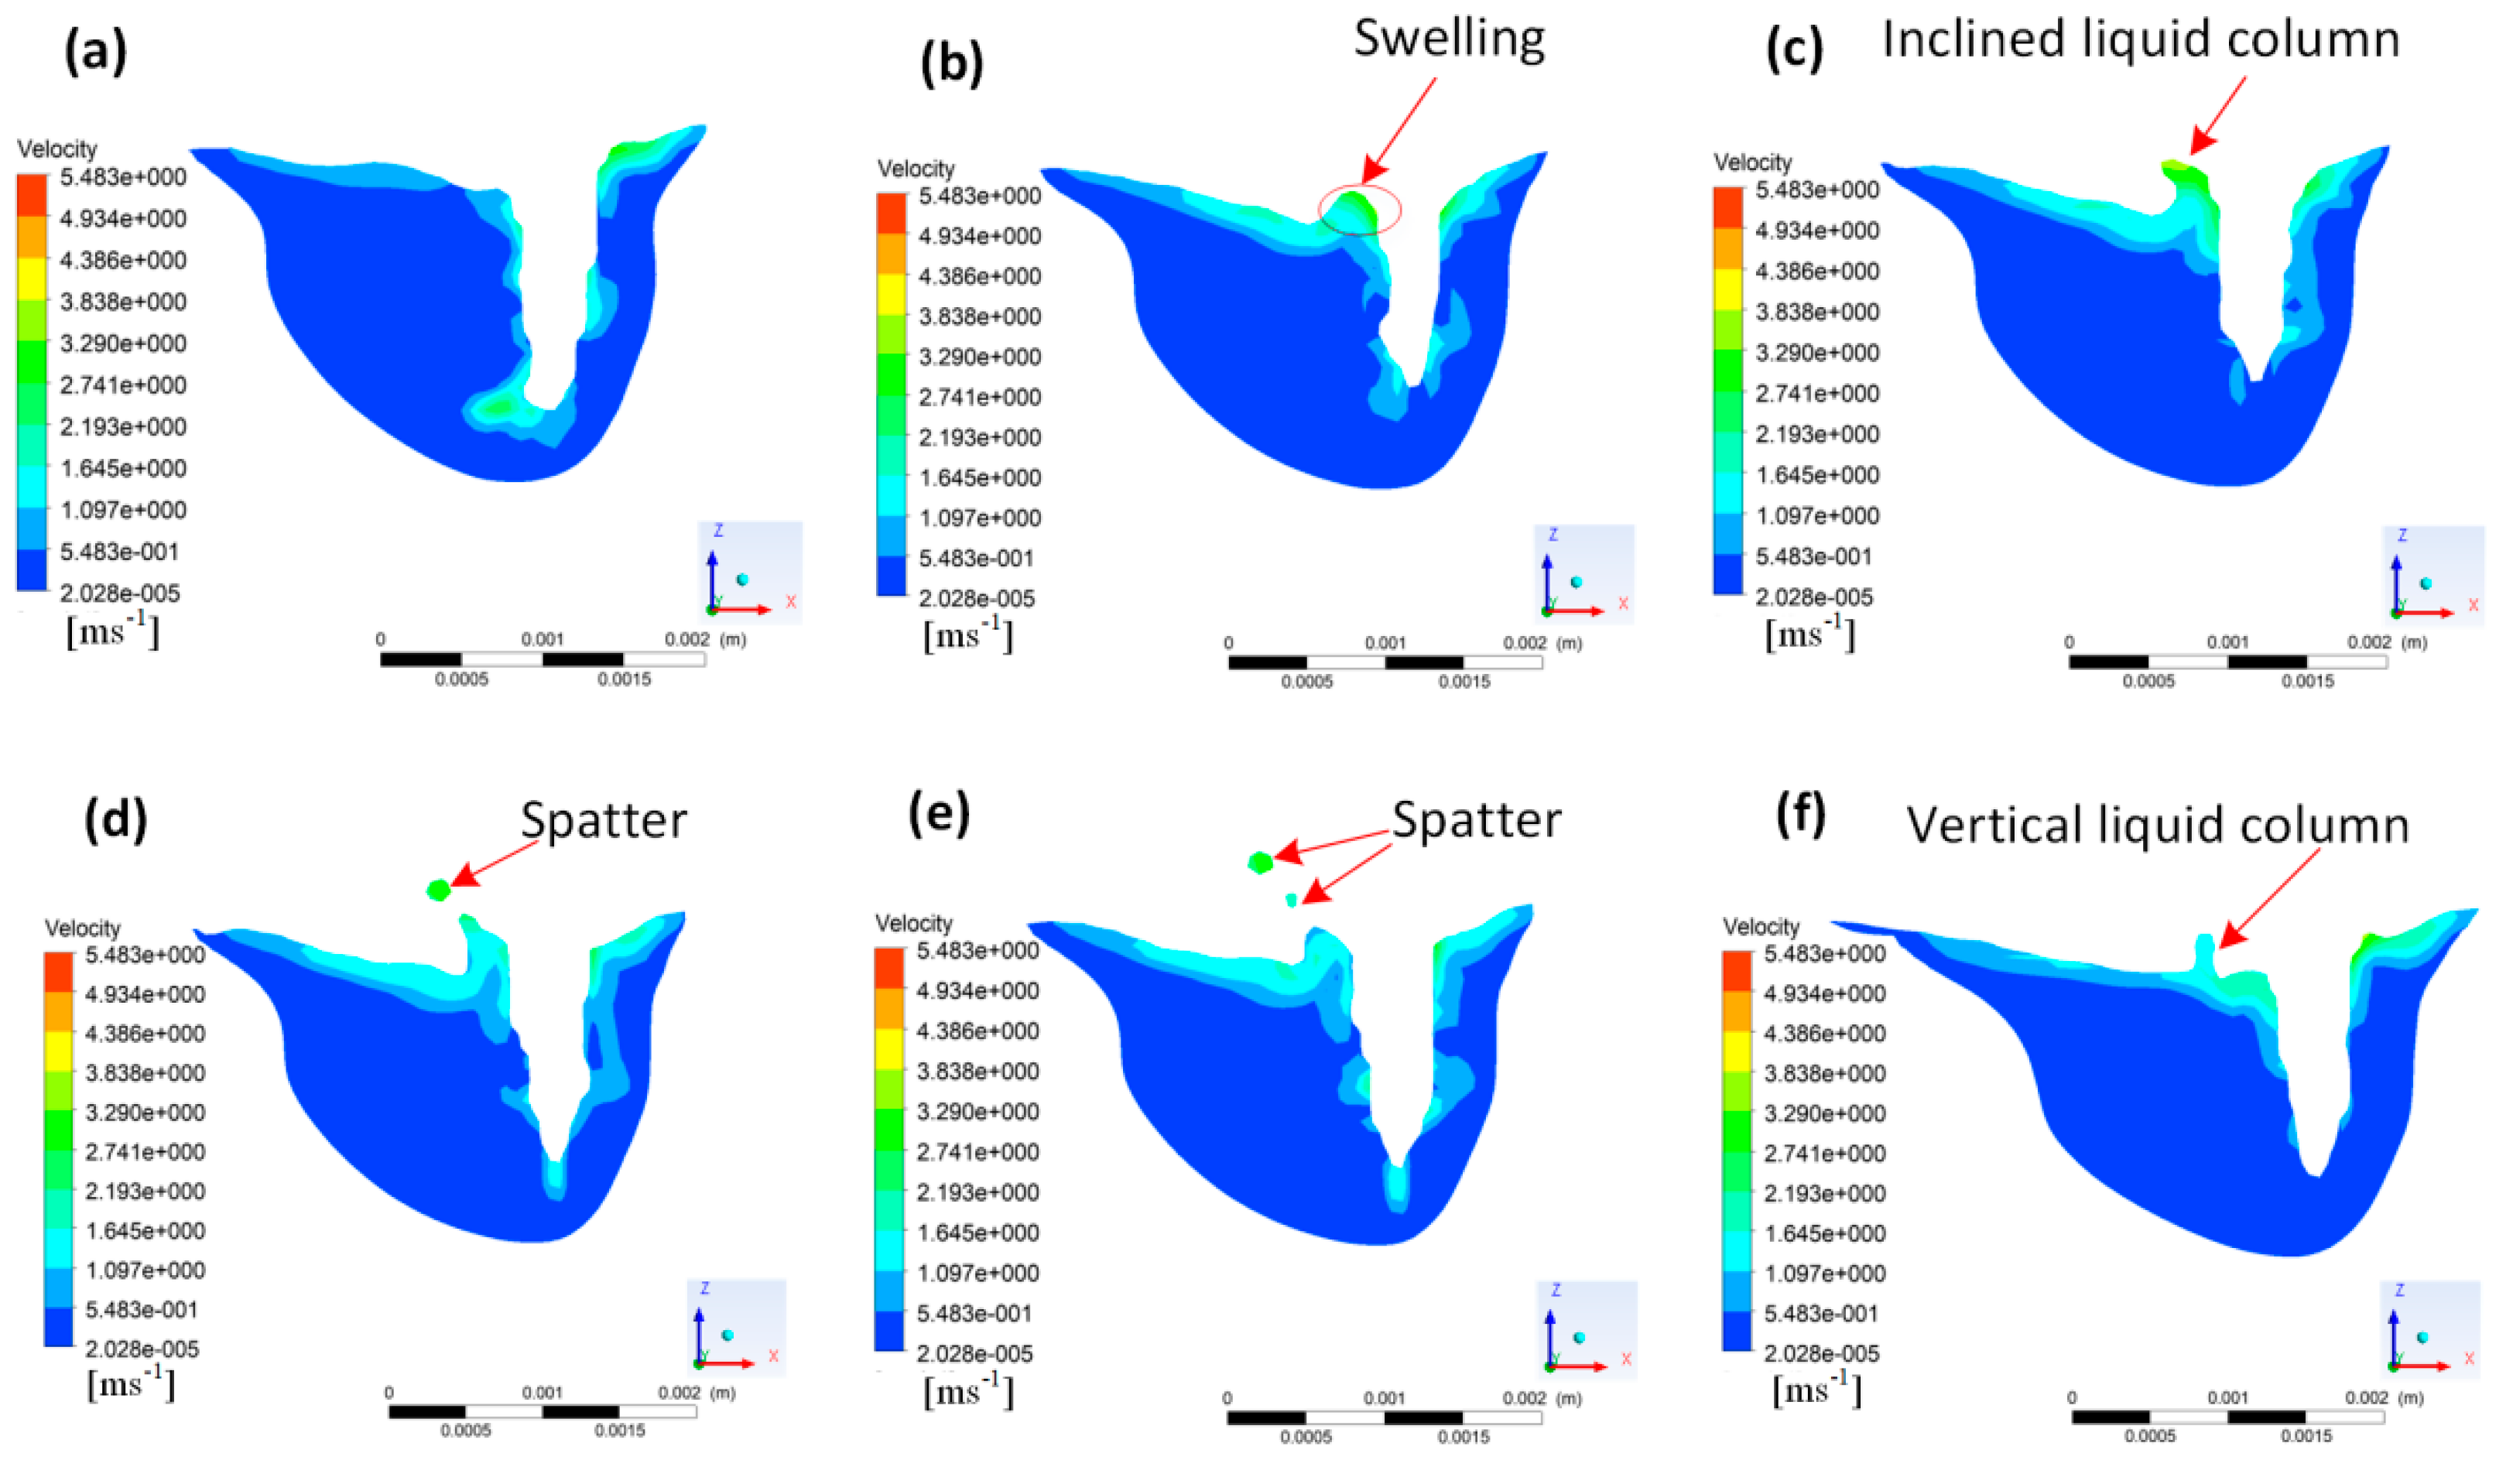
- The welding spatter forms of laser deep penetration welding included: spatter formed by an inclined liquid column behind the keyhole; splash created by a vertical liquid column behind the keyhole; small particles splashed in front of the keyhole. With the increase of the welding speed, the tendency of the welding spatter to form in front of the keyhole and form a vertical liquid column behind the keyhole became weaker. When the welding speed was 9 m/min, only an obliquely upward liquid column appeared on the molten pool surface behind the keyhole.
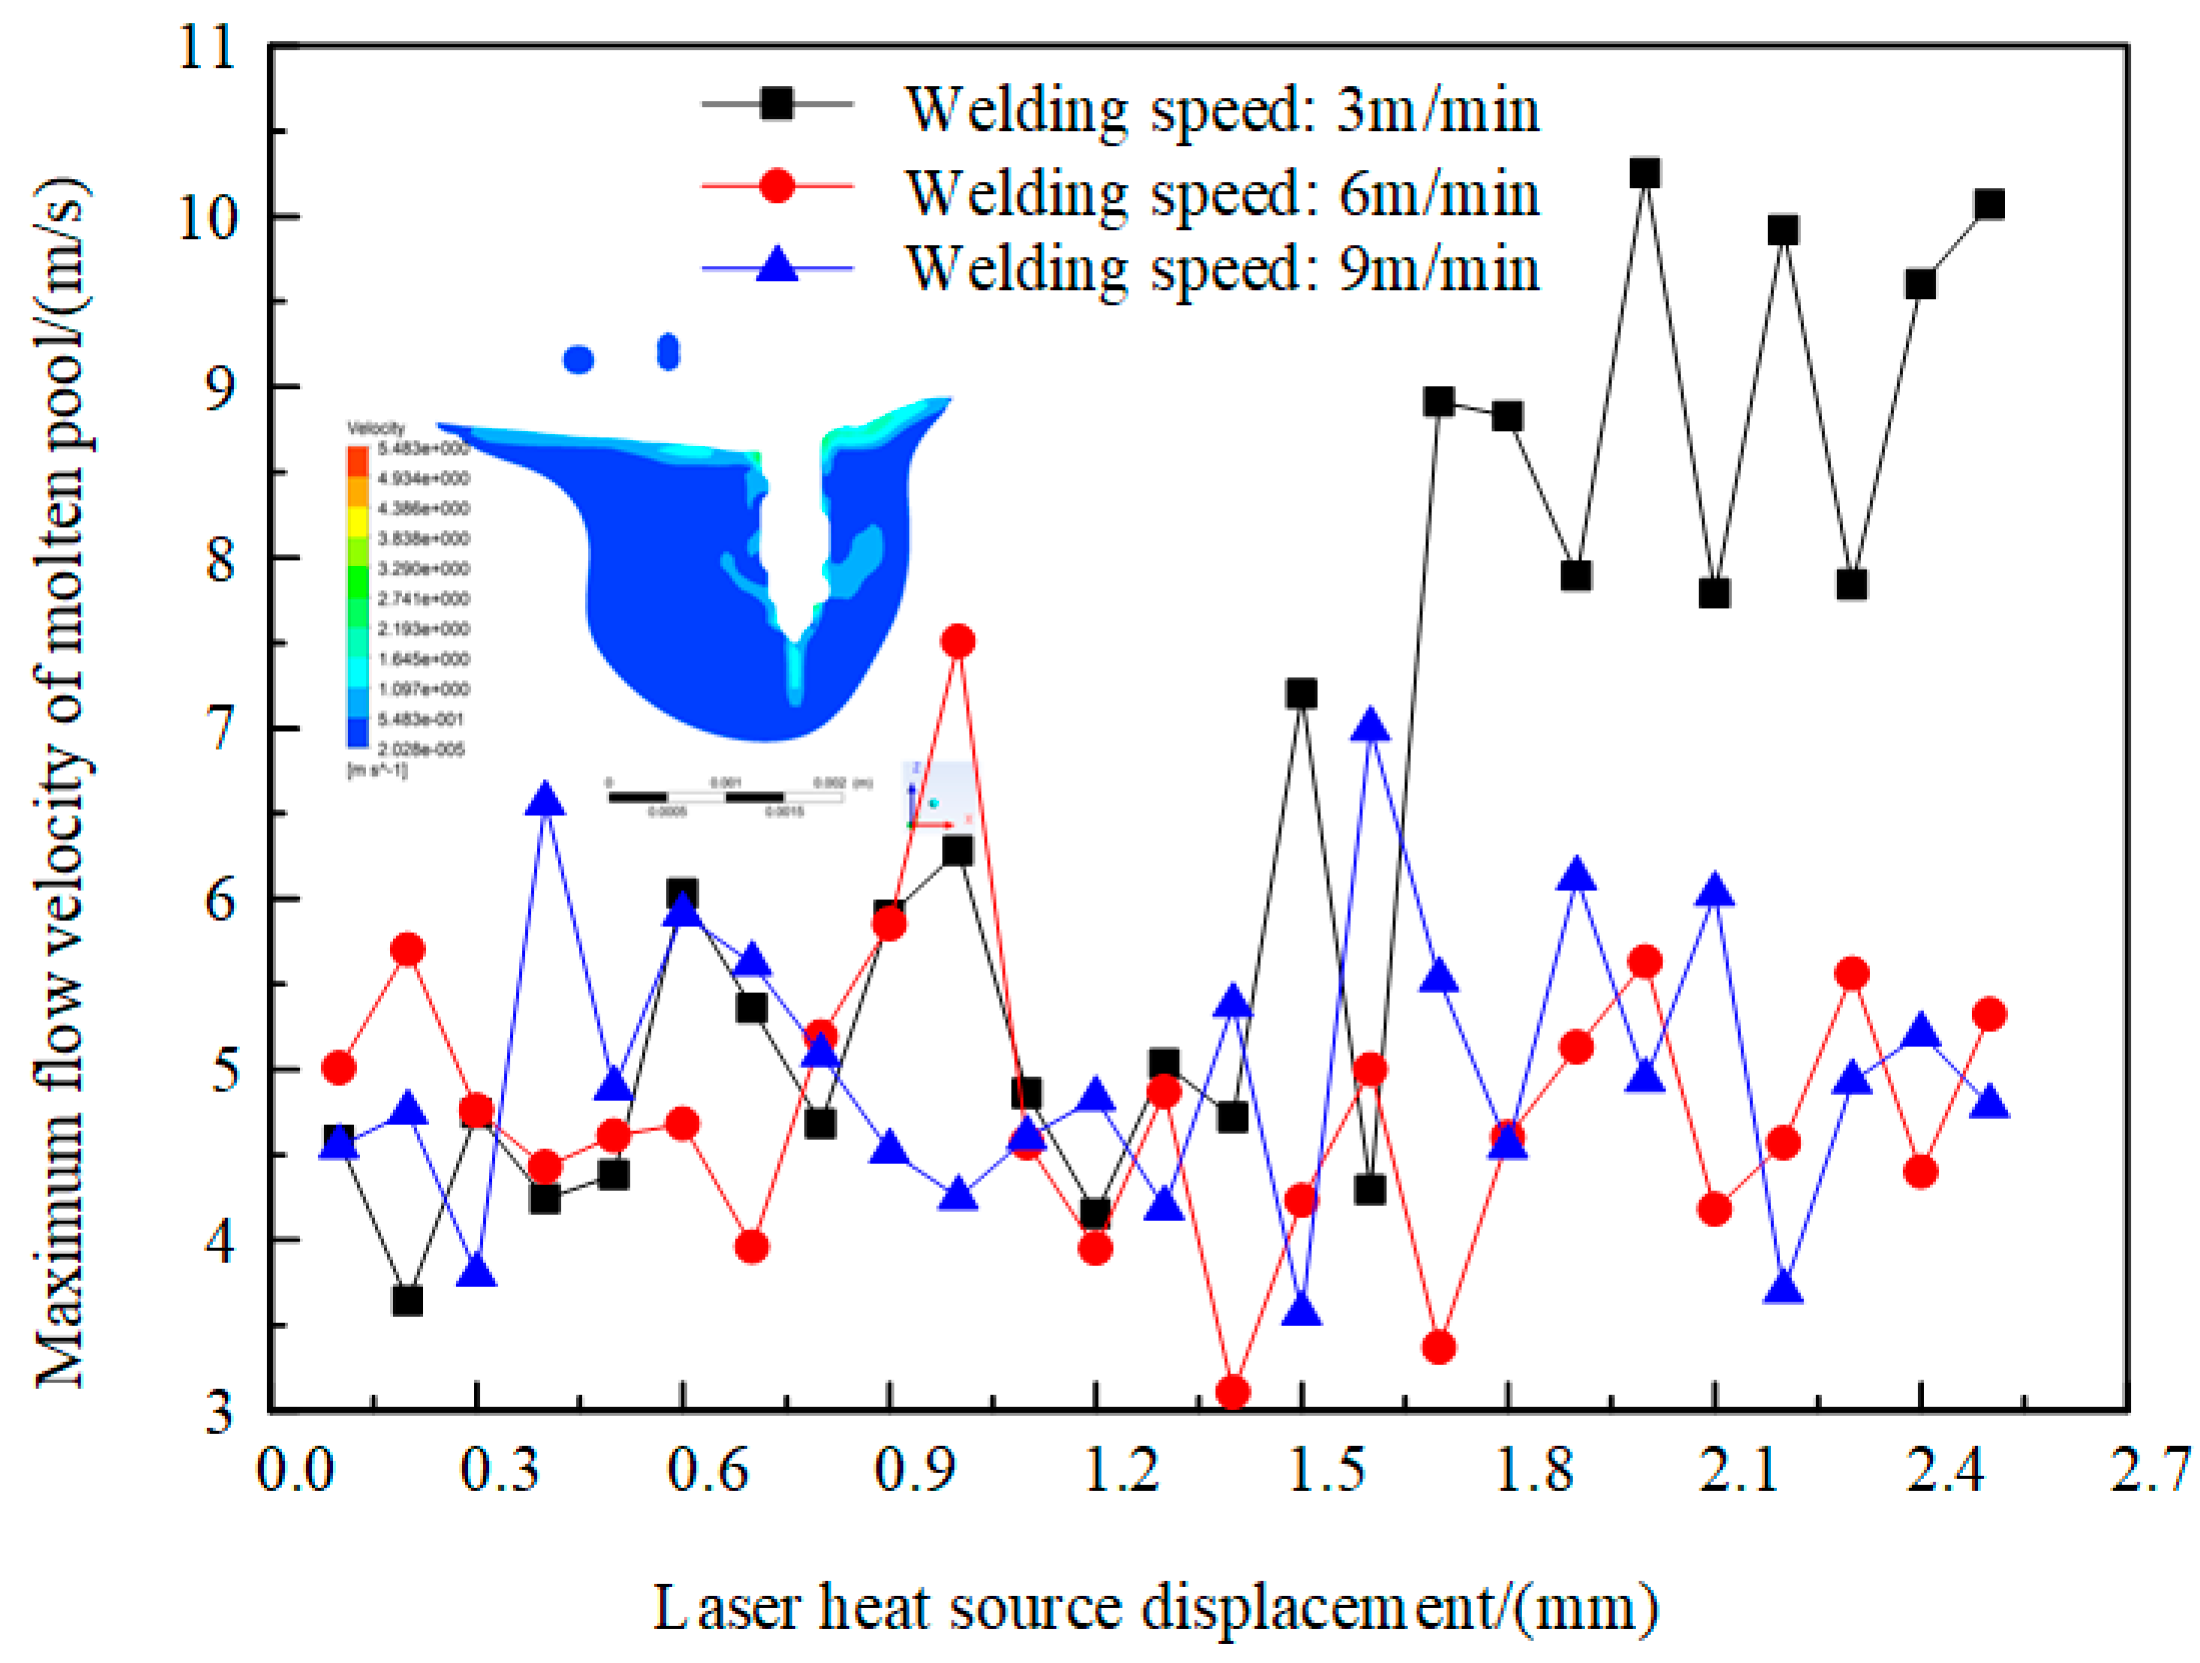
- Compared with the welding speeds of 6 m/min and 9 m/min, the maximum flow velocity fluctuation of the molten pool at the welding speed of 3 m/min was obviously higher. The maximum value of the maximum flow velocity in the molten pool was reduced from 10.25 m/s to 7 m/s as the welding speed increased from 3 m/min to 9 m/min.
- With the increase of the welding speed, the complexity of the keyhole wall flow field decreased. When the welding speed was 9 m/min, the direction of the flow field on the keyhole wall was relatively uniform and showed an upward trend along the keyhole wall.
Author Contributions
Funding
Institutional Review Board Statement
Informed Consent Statement
Data Availability Statement
Acknowledgments
Conflicts of Interest
References
- Frostevarg, J. Factors affecting weld root morphology in laser keyhole welding. Opt. Lasers Eng. 2018, 101, 89–98. [Google Scholar] [CrossRef]
- Atabaki, M.M.; Yazdian, N.; Ma, J.; Kovacevic, R. High power laser welding of thick steel plates in a horizontal butt joint configuration. Opt. Laser Technol. 2016, 83, 1–12. [Google Scholar] [CrossRef]
- Fabbro, R. Scaling laws for the laser welding process in keyhole mode. J. Mater. Process. Technol. 2019, 264, 346–351. [Google Scholar] [CrossRef] [Green Version]
- Yang, Z.; Tao, W.; Li, L.; Chen, Y.; Shi, C. Numerical simulation of heat transfer and fluid flow during double-sided laser beam welding of t-joints for aluminum aircraft fuselage panels. Opt. Laser Technol. 2017, 91, 120–129. [Google Scholar] [CrossRef]
- Sun, Z.; Kuo, M. Bridging the joint gap with wire feed laser welding. J. Mater. Process. Technol. 1999, 87, 213–222. [Google Scholar] [CrossRef]
- Shi, H.; Zhang, K.; Xu, Z.; Huang, T.; Fan, L.; Bao, W. Applying statistical models optimize the process of multi-pass narrow-gap laser welding with filler wire. Int. J. Adv. Manuf. Technol. 2014, 75, 279–291. [Google Scholar] [CrossRef]
- Chen, G.; Liu, J.; Shu, X.; Gu, H.; Zhang, B.; Feng, J. Beam scanning effect on properties optimization of thick-plate 2a12 aluminum alloy electron-beam welding joints. Mater. Sci. Eng. A 2019, 744, 583–592. [Google Scholar] [CrossRef]
- Pang, S.; Chen, W.; Zhou, J.; Liao, D. Self-consistent modeling of keyhole and weld pool dynamics in tandem dual beam laser welding of aluminum alloy. J. Mater. Process. Technol. 2015, 217, 131–143. [Google Scholar] [CrossRef]
- Matsunawa, A. Problems and solutions in deep penetration laser welding. Sci. Technol. Weld. Join. 2001, 6, 351–354. [Google Scholar] [CrossRef]
- Matsunawa, A.; Mizutani, M.; Katayama, S.; Seto, N. Porosity formation mechanism and its prevention in laser welding. Weld. Int. 2003, 17, 431–437. [Google Scholar] [CrossRef]
- Zhang, M.; Chen, G.; Zhou, Y.; Li, S. Direct observation of keyhole characteristics in deep penetration laser welding with a 10 kW fiber laser. Opt. Express 2013, 21, 19997–20004. [Google Scholar] [CrossRef] [PubMed]
- Li, S.; Chen, G.; Zhang, M.; Zhou, Y.; Zhang, Y. Dynamic keyhole profile during high-power deep-penetration laser welding. J. Mater. Process. Technol. 2014, 214, 565–570. [Google Scholar] [CrossRef]
- Han, S.-W.; Cho, W.-I.; Na, S.-J.; Kim, C.-H. Influence of driving forces on weld pool dynamics in GTA and laser welding. Weld. World 2013, 57, 257–264. [Google Scholar] [CrossRef]
- Rai, R.; Roy, G.G.; DebRoy, T. A computationally efficient model of convective heat transfer and solidification characteristics during keyhole mode laser welding. J. Appl. Phys. 2007, 101, 054909. [Google Scholar] [CrossRef] [Green Version]
- Sohail, M.; Han, S.-W.; Na, S.-J.; Gumenyuk, A.; Rethmeier, M. Characteristics of weld pool behavior in laser welding with various power inputs. Weld. World 2014, 58, 269–277. [Google Scholar] [CrossRef]
- Chang, B.; Allen, C.; Blackburn, J.; Hilton, P.; Du, D. Fluid flow characteristics and porosity behavior in full penetration laser welding of a titanium alloy. Metall. Mater. Trans. B 2015, 46, 906–918. [Google Scholar] [CrossRef]
- Zhao, H.; Niu, W.; Zhang, B.; Lei, Y.; Kodama, M.; Ishide, T. Modelling of keyhole dynamics and porosity formation considering the adaptive keyhole shape and three-phase coupling during deep-penetration laser welding. J. Phys. D Appl. Phys. 2011, 44, 485302. [Google Scholar] [CrossRef]
- Wu, D.; Hua, X.; Li, F.; Huang, L. Understanding of spatter formation in fiber laser welding of 5083 aluminum alloy. Int. J. Heat Mass Transf. 2017, 113, 730–740. [Google Scholar] [CrossRef]
- Wu, D.; Hua, X.; Huang, L.; Zhao, J. Numerical simulation of spatter formation during fiber laser welding of 5083 aluminum alloy at full penetration condition. Opt. Laser Technol. 2018, 100, 157–164. [Google Scholar] [CrossRef] [Green Version]
- Li, X.; Lu, F.; Cui, H.; Tang, X.; Wu, Y. Numerical modeling on the formation process of keyhole-induced porosity for laser welding steel with t-joint. Int. J. Adv. Manuf. Technol. 2014, 72, 241–254. [Google Scholar] [CrossRef]
- Kaplan, A. A model of deep penetration laser welding based on calculation of the keyhole profile. J. Phys. D Appl. Phys. 1994, 27, 1805–1814. [Google Scholar] [CrossRef]
- Semak, V.; Matsunawa, A. The role of recoil pressure in energy balance during laser materials processing. J. Phys. D Appl. Phys. 1997, 30, 2541–2552. [Google Scholar] [CrossRef]
- Kawahito, Y.; Mizutani, M.; Katayama, S. Elucidation of high-power fibre laser welding phenomena of stainless steel and effect of factors on weld geometry. J. Phys. D Appl. Phys. 2007, 40, 5854–5859. [Google Scholar] [CrossRef]
- Fabbro, R. Melt pool and keyhole behaviour analysis for deep penetration laser welding. J. Phys. D Appl. Phys. 2010, 43, 445501. [Google Scholar] [CrossRef]


| Property | Symbol | Unite | Value |
|---|---|---|---|
| Solid density | ρs | Kg m−3 | 2720 |
| Liquid density | ρl | Kg m−3 | 2590 |
| Solidus temperature | Ts | K | 860 |
| Liquidus temperature | TL | K | 917 |
| Boiling temperature | Tg | K | 2740 |
| Latent heat of fusion | Lm | J kg−1 | 3.87 × 10⁵ |
| Latent heat of the vapor | Lv | J kg−1 | 1.08 × 10⁷ |
| Thermal expansion coefficient | βk | K−1 | 1.92 × 10⁻⁵ |
| Convective heat transfer coefficient | h0 | W K−1 m−2 | 15 |
| Surface tension | N m−1 | 0.914 | |
| Surface tension gradient | N m−1 K−1 | −3.5 × 10⁻⁴ | |
| Radiation emissivity | ε | - | 0.08 |
| Ambient temperature | Tref | K | 300 |
Publisher’s Note: MDPI stays neutral with regard to jurisdictional claims in published maps and institutional affiliations. |
© 2022 by the authors. Licensee MDPI, Basel, Switzerland. This article is an open access article distributed under the terms and conditions of the Creative Commons Attribution (CC BY) license (https://creativecommons.org/licenses/by/4.0/).
Share and Cite
Peng, J.; Xu, H.; Yang, X.; Wang, X.; Li, S.; Long, W.; Zhang, J. Numerical Simulation of Molten Pool Dynamics in Laser Deep Penetration Welding of Aluminum Alloys. Crystals 2022, 12, 873. https://doi.org/10.3390/cryst12060873
Peng J, Xu H, Yang X, Wang X, Li S, Long W, Zhang J. Numerical Simulation of Molten Pool Dynamics in Laser Deep Penetration Welding of Aluminum Alloys. Crystals. 2022; 12(6):873. https://doi.org/10.3390/cryst12060873
Chicago/Turabian StylePeng, Jin, Hongqiao Xu, Xiaohong Yang, Xingxing Wang, Shuai Li, Weimin Long, and Jian Zhang. 2022. "Numerical Simulation of Molten Pool Dynamics in Laser Deep Penetration Welding of Aluminum Alloys" Crystals 12, no. 6: 873. https://doi.org/10.3390/cryst12060873