Article

Study on Fluorescence Properties of Green-Blue Apatite

School of Gemmology, China University of Geosciences, Beijing 100083, China
*
Author to whom correspondence should be addressed.
Crystals 2022, 12(6), 866; https://doi.org/10.3390/cryst12060866
Submission received: 5 May 2022 / Revised: 15 June 2022 / Accepted: 16 June 2022 / Published: 19 June 2022
(This article belongs to the Topic Optoelectronic Materials)

Abstract

:
The fluorescence phenomenon of apatite is an important feature. In this paper, three apatites with uniform transition from green to blue were selected, and the fluorescence color characteristics of the samples were observed under UV fluorescent lamp and DiamondView. With 3D fluorescence technology, combined with LA-ICP-MS, this paper aims to comprehensively test the fluorescence phenomenon of apatite to explore the relationship between apatite fluorescence and elements and analyze the fluorescence color characteristics. With the experiments mentioned above, this paper explores the fluorescent color characteristics of gemstones and their influencing factors to improve the color system of apatite. UV and DiamondView experiments show that with the change from green to blue, apatites show weak purple–red to strong pink–purple fluorescence. The 3D fluorescence test shows that the samples have two notable fluorescence emission peaks: (1) The fluorescence peak group composed of the double fluorescence peaks around 600 nm is generated by the excitation light source at 450 and 470 nm and a weaker fluorescence peak generated by the excitation at 400 nm; (2) The fluorescence emission peak of the sample gradually becomes prominent and the intensity increases significantly near the areas where the excitation wavelength is 280–330 nm and where the emission wavelength is 380 nm. According to the LA-ICP-MS test combined with the element properties, the fluorescence peak group (1) is mainly affected by Mn2+, Sm3+, and Pr3+, which emit orange fluorescence. The fluorescence emission peak (2) is caused by Ce3+, Eu3+, Dy3+, and Tb3+, which emit purple fluorescence. The mixing of the two fluorescent colors results in violet–pink fluorescence.

1. Introduction

Apatite is a phosphate mineral, which refers to phosphorus-containing ores in which phosphorus exists in the form of crystalline apatite in igneous and metamorphic rocks [1,2,3,4]. It is often used as a raw material in the phosphorus refining industry. Apatite mainly refers to a series of phosphate minerals with calcium as the main cation. According to the difference of additional anions in apatite minerals, the apatite series can be roughly divided into fluorapatite, chlorapatite, hydroxylapatite, etc. [5,6,7,8] Among them, fluorapatite is a relatively common member of the apatite series, often with short, columnar, thick-plate, granular, and well-developed hexagonal bipyramids [9].
The general chemical formula of apatite is A10[PO4]6Z2, where A is a divalent cation site which is mainly occupied by Ca2+ and can also be occupied by Mg2+, Fe2+, Sr2+, Mn2+, Pb2+, Cd2+, etc. Rare-earth elements, such as Ce3+, Nd3+, La3+, and Sm3+, and alkali metal ions Na+ and K+ can also enter the A position to form an equivalent substitution, with [PO4]3 occupied by [SiO4]4, [SO4]2, [CO3]2, etc. The Z position can be replaced by anions such as F-OH-Cl [10,11,12,13,14].
Apatite crystallizes in a hexagonal crystal system, with space group P63/m. The structure consists of orthophosphate groups of PO43− linking two differently coordinated calcium ions: Ca(I) (C3, CaO9) and Ca(II) (C1h, CaO6F). Halogens (F, Cl) are located at the 63 axis, and in natural apatites one type of halogen atom usually dominates over OH, such as in hydroxyl- or chlorine-containing fluorapatites (F > OH, Cl). Samples containing only F, Cl, or OH are rarely present. In addition, the 63 axis contains oxygen and vacancies in different valence states (O2 or O) [15], and these vacancies often play a compensatory role in the non-isovalent substitution of Call cations Ca2+ + F ← TR3+ + O2. Apatite, due to its complex structure and plasticity to isomorphic substitutions, possesses complex centers ranging from simple (f centers) to those representing twisted PO43− tetrahedra.
Fluorescence is an important characteristic of gemstones. The fluorescence of many gemstones has a huge impact on their value, such as the blue fluorescence of diamonds and the red fluorescence of rubies. The color of fluorescence is also an indispensable element in the color system of gemstones. Apatite is rich in rare-earth elements, such as Ce, Pr, Nd, Sm, etc. [16,17,18]. In the crystal field of apatite, energy migration, activation sensitization, and quenching occur between these elements [19,20], which together contribute to the fluorescence phenomenon of apatite. Fluorescence studies of gem-quality apatite are mostly quantitative descriptions or simple spectral tests. Fluorescence color is also an important part of gemstone color, so the study of apatite fluorescence characteristics and the quantitative characterization of apatite are of great value to complement and improve the gemological characteristics and color system of apatite.

2. Materials and Methods
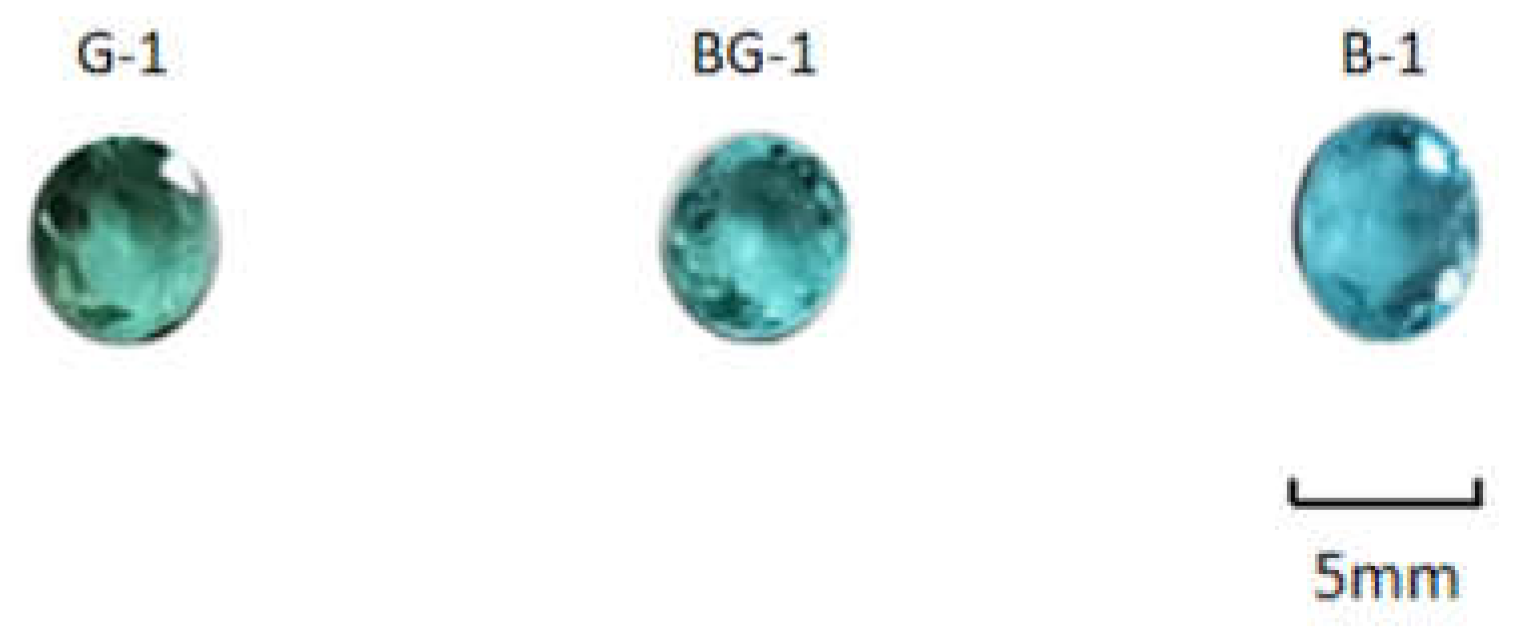
2.1. Sample

Three gem-quality apatites were selected for this experiment, and all samples are around 6 mm × 5 mm × 4 mm in size, with oval-faceted facets, good overall polish, glassy luster, relatively clean interiors, no obvious inclusions, no obvious pits or scratches, and the samples were numbered G-1, BG-1 and B-1 by Green—Bluish-Green—Blue transition (Figure 1).

2.2. Diamond View

DiamondView is an instrument for the identification of synthetic diamonds. The principle is that the diamond to be tested is exposed to intense short-wave UV light and a camera is used to collect fluorescence patterns and observe the color and structural characteristics to identify natural diamonds from synthetic diamonds [21]. The instrument is designed to identify the properties of diamonds, but because the intensity of the UV radiation is much greater than that of conventional UV fluorescent lamps, and because the camera system provides a clearer and more direct picture of the stone’s characteristics, it is often used to observe the fluorescence of other stones as well.
The test was carried out using a DiamondView instrument manufactured by De Beers: resolution, 1280 × 960; maximum field of view, 8.5 mm × 6.4 mm; excitation wavelength, <225 nm.

2.3. 3D Fluorescence

The 3D fluorescence test was carried out at the School of Science, Tsinghua University with an FLS920 transient/steady-state fluorescence spectrometer manufactured in Edinburgh, UK. The conditions for the 3D fluorescence emission spectroscopy were as follows: the excitation light source was a 450 W Xe lamp, the excitation wavelength range was set to 200–840 nm, the emission wavelength range was set to 220–870 nm, and the scanning interval was 10 nm. The slit widths of both incident and emission light were 1 nm.

2.4. LA-ICP-MS

The LA-ICP-MS laser ablation system was the GeoLasPro 193 nm ArF excimer system produced by Conherent (Santa Clara, CA, USA), and the ICP-MS was the Thermo Fisher ICAP Q. The laser ablation sampling process uses helium as the carrier gas, and the laser ablation conditions were set as the beam spot diameter of 30 μm, frequency 6 Hz, energy density 12 J/cm2.
During sample testing, the external standards were NIST SRM 610, NIST SRM612, BCR-2G, BIR-1G, and the monitoring samples were CGSG-1 and CGSG-2. The sampling method was single-point ablation and peak-hopping collection; the acquisition time mode was: 25 s gas blank +60 s sample ablation +25 s flushing. The elemental content of the samples was calculated using the ICP-MS-DATACAL data program.

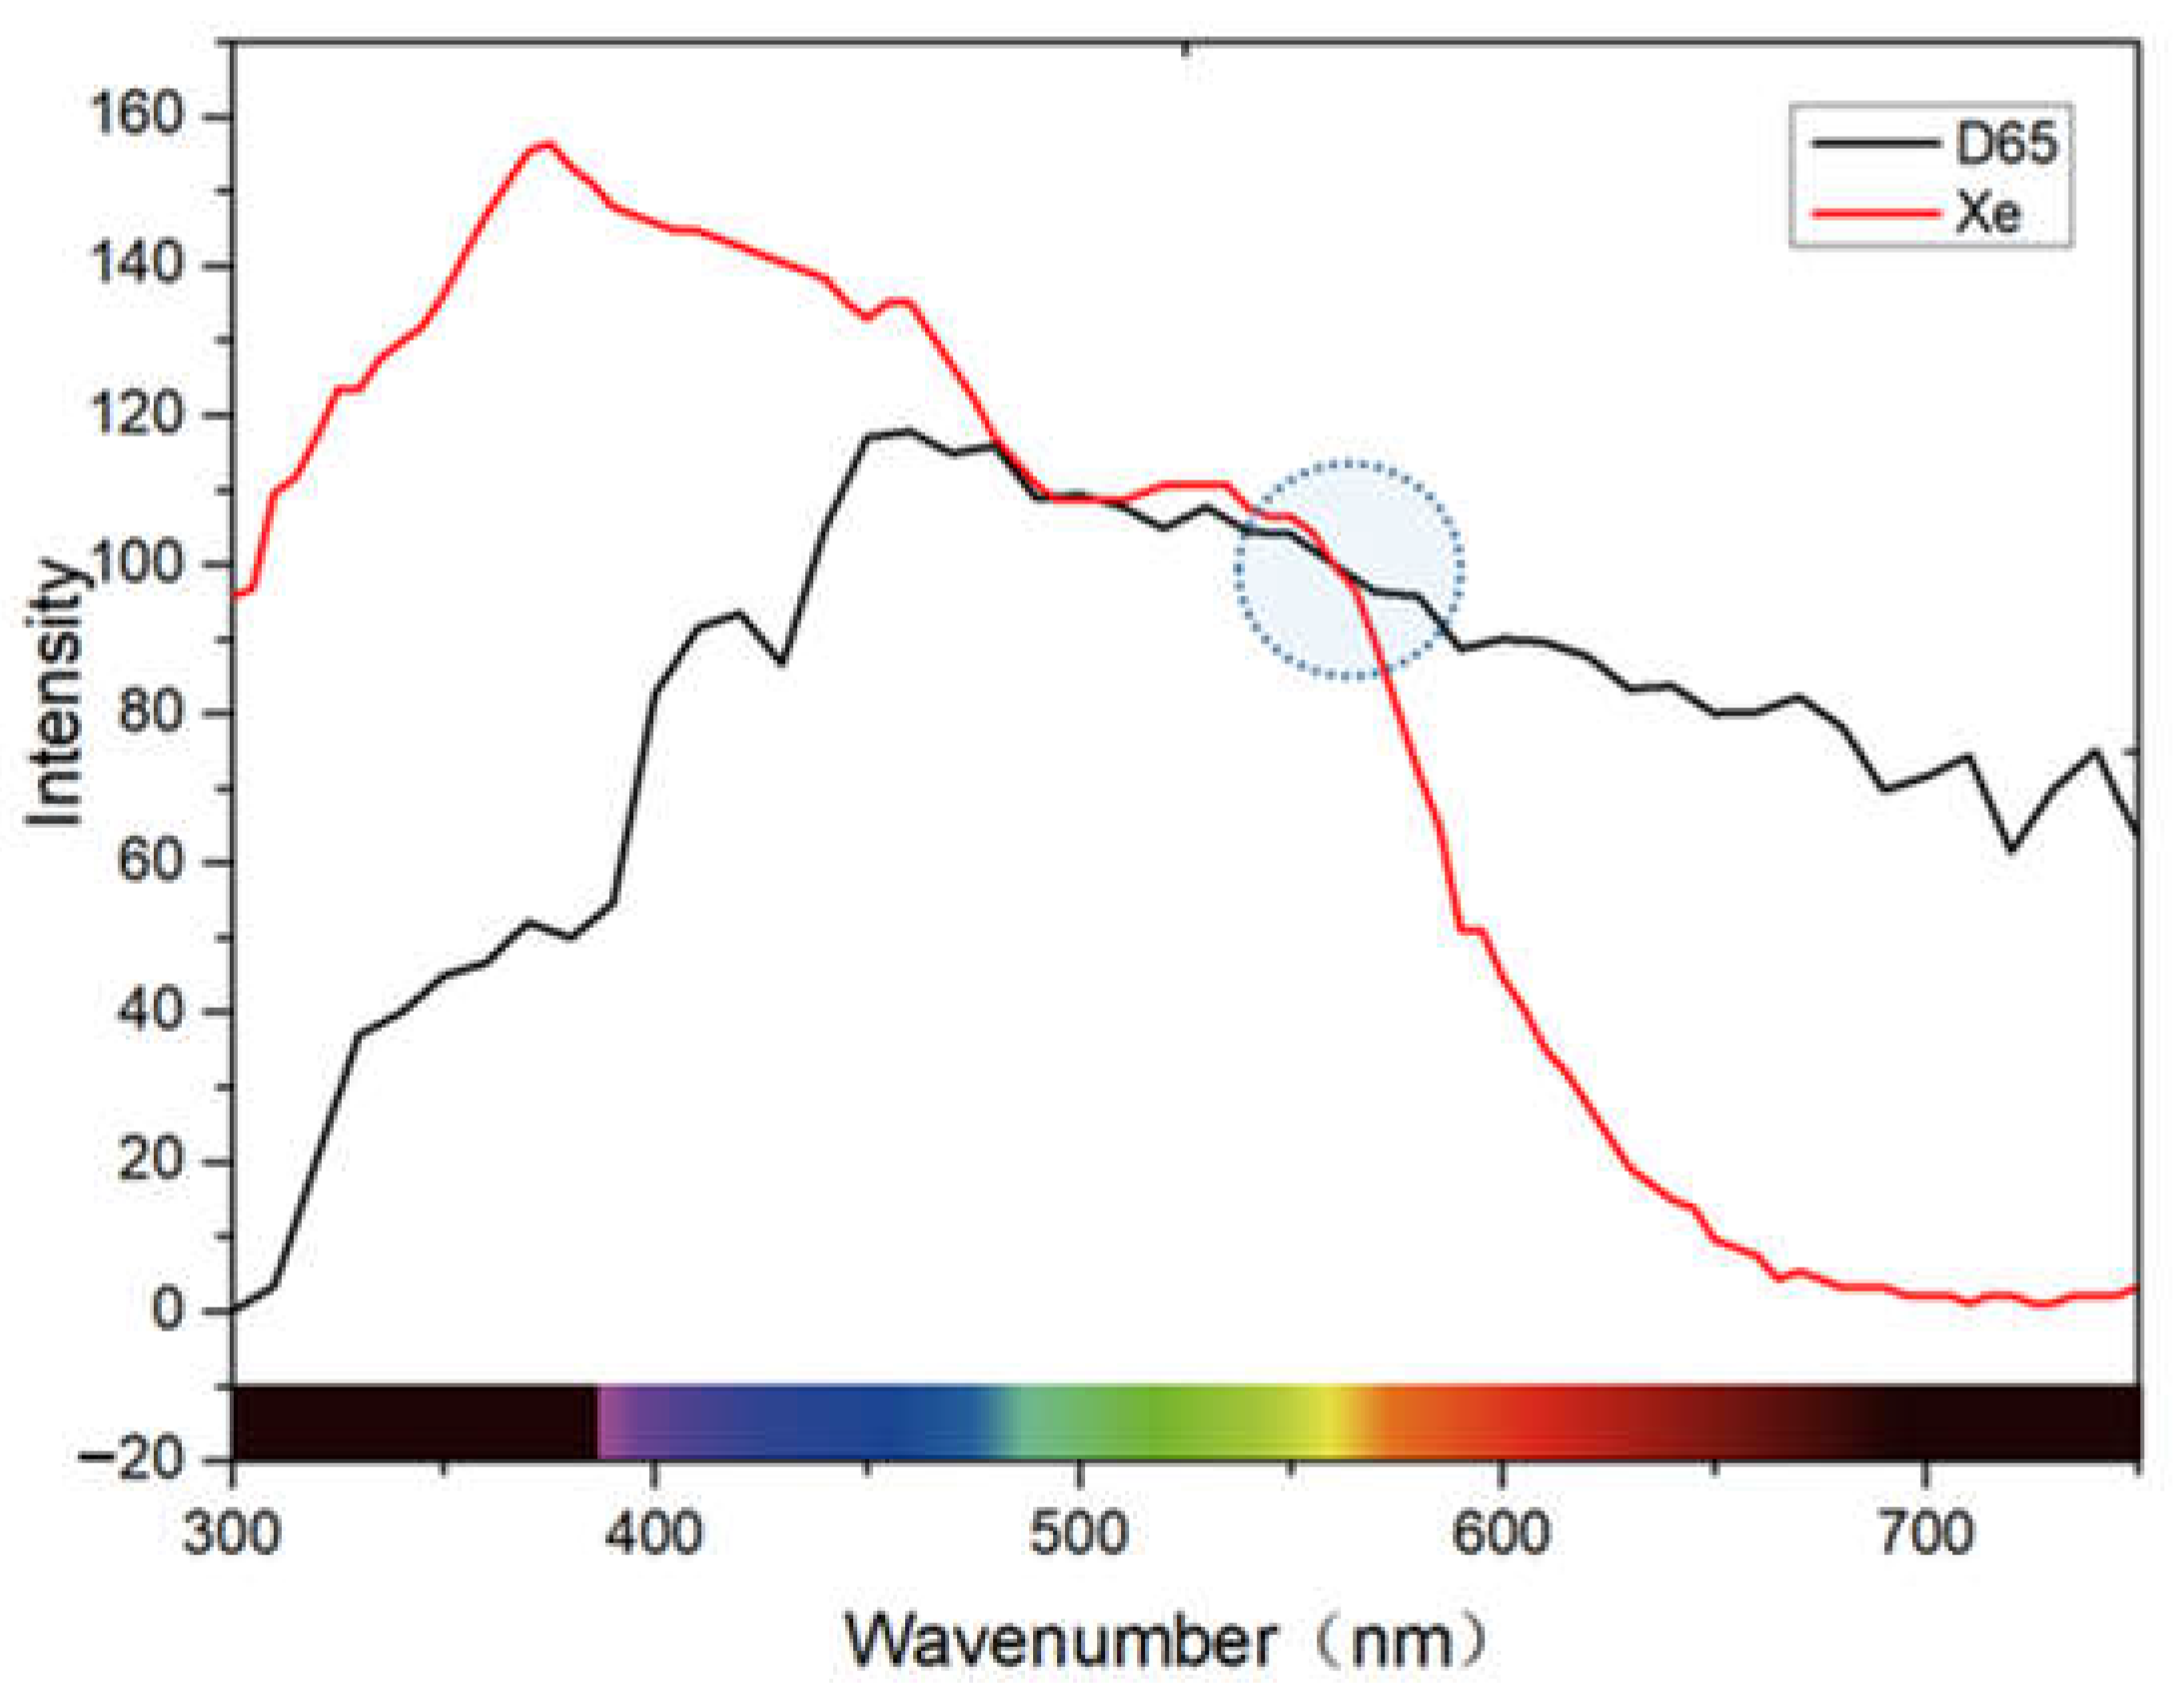
2.5. CIE1931 Standard Colorimetric System

The color characteristics of fluorescent materials are represented by tristimulus values and chromaticity coordinates, and the CIE1931 standard chromaticity system can better express the fluorescent color characteristics of gemstones. In this system, colors are specified as a two-dimensional map of chromaticity coordinates (x, y), forming a horseshoe-shaped region called the CIE1931 chromaticity diagram. In the chromaticity diagram, the dominant wavelength, λ, and the excitation purity, Pe, are often used to characterize the color. The dominant wavelength is roughly the same as the hue in everyday life and refers to the wavelength of a certain spectral color. The dominant wavelength is located on the spectral locus curve of the chromaticity diagram and has maximum saturation; excitation purity is close to chromaticity and refers to the degree to which the spectral color of a color is diluted relative to white light of the same dominant wavelength.
The method for calculating the fluorescence color of the sample is spectrophotometry. Combined with the relative spectral power distribution of the CIE standard illuminator D65 and the CIE1931 standard chromaticity observer color matching function, the tristimulus values and chromaticity coordinates of the complete diffuse reflector under the CIE standard illuminator D65 can be calculated according to the formula:
X = k λ S D ( λ ) β ( λ ) x ¯ ( λ ) λ
Y = k λ S D ( λ ) β ( λ ) y ¯ ( λ ) λ
Z = k λ S D ( λ ) β ( λ ) z ¯ ( λ ) λ
where λ is the wavelength, S D ( λ ) is the relative spectral power distribution of the CIE standard illuminant D65, x ¯ , y ¯ , z ¯ are the CIE 1931 standard chromaticity observer color matching functions, β ( λ ) is the spectral irradiance factor obtained from measuring the fluorescent sample color, λ is the wavelength interval, and k is the normalisation factor, with:
k = 100 S D ( λ ) y ( λ ) λ
Calculate the color coordinates x, y, z under the CIE 1931 standard chromaticity observer by applying the three-stimulus values x, y and z to Equations (1) and (2):
x = X X + Y + Z
y = Y X + Y + Z
z = Z X + Y + Z = 1 x y
3D fluorescence has been shown to be applicable to the characterization of fluorescent colors, and this chapter uses spectrophotometry to calculate the chromophore coordinates (x, y), the principal wavelength, λ, and the excitation purity, Pe, of apatite fluorescent colors. It should be noted that the excitation light source used in the instrumental testing of the fluorescence spectra of apatite samples is a Xe lamp, whereas the conventional observation light source for apatite is daylight or a D65 light source that simulates daylight, and the relative power distribution of the two light sources differs. To match the experimental measurement data to the naked eye, the relative spectral power distribution of the Xe lamp is normalized to 100 at 560 nm and weighted to fit the relative spectral power of the D65 light source at the corresponding wavelength (Figure 2), so that the fluorescence test data under the Xe lamp can be approximated to the fluorescence spectral data under simulated daylight.

3. Results

3.1. UV Fluorescence Observation

After the ultraviolet radiation emitted by the light source is filtered through a filter, it emits short-wave ultraviolet light with a wavelength of 253.5 nm and long-wave ultraviolet light with a wavelength of 365 nm. Observing the luminescence phenomenon of apatite samples under the ultraviolet fluorescent lamp, it is concluded that the fluorescence phenomenon of green apatite is very weak, and the bluish-green and blue apatite exhibit pink–purple fluorescence.
Under the DiamondView observation, the fluorescence intensity of apatite increases with the deepening of the blue tone in the sample, the G-1 has a weak fluorescence phenomenon, the BG-1 sample has obvious pink–purple fluorescence, and in the B1, the fluorescence color is a pink–purple color with significantly increased intensity (Figure 3).

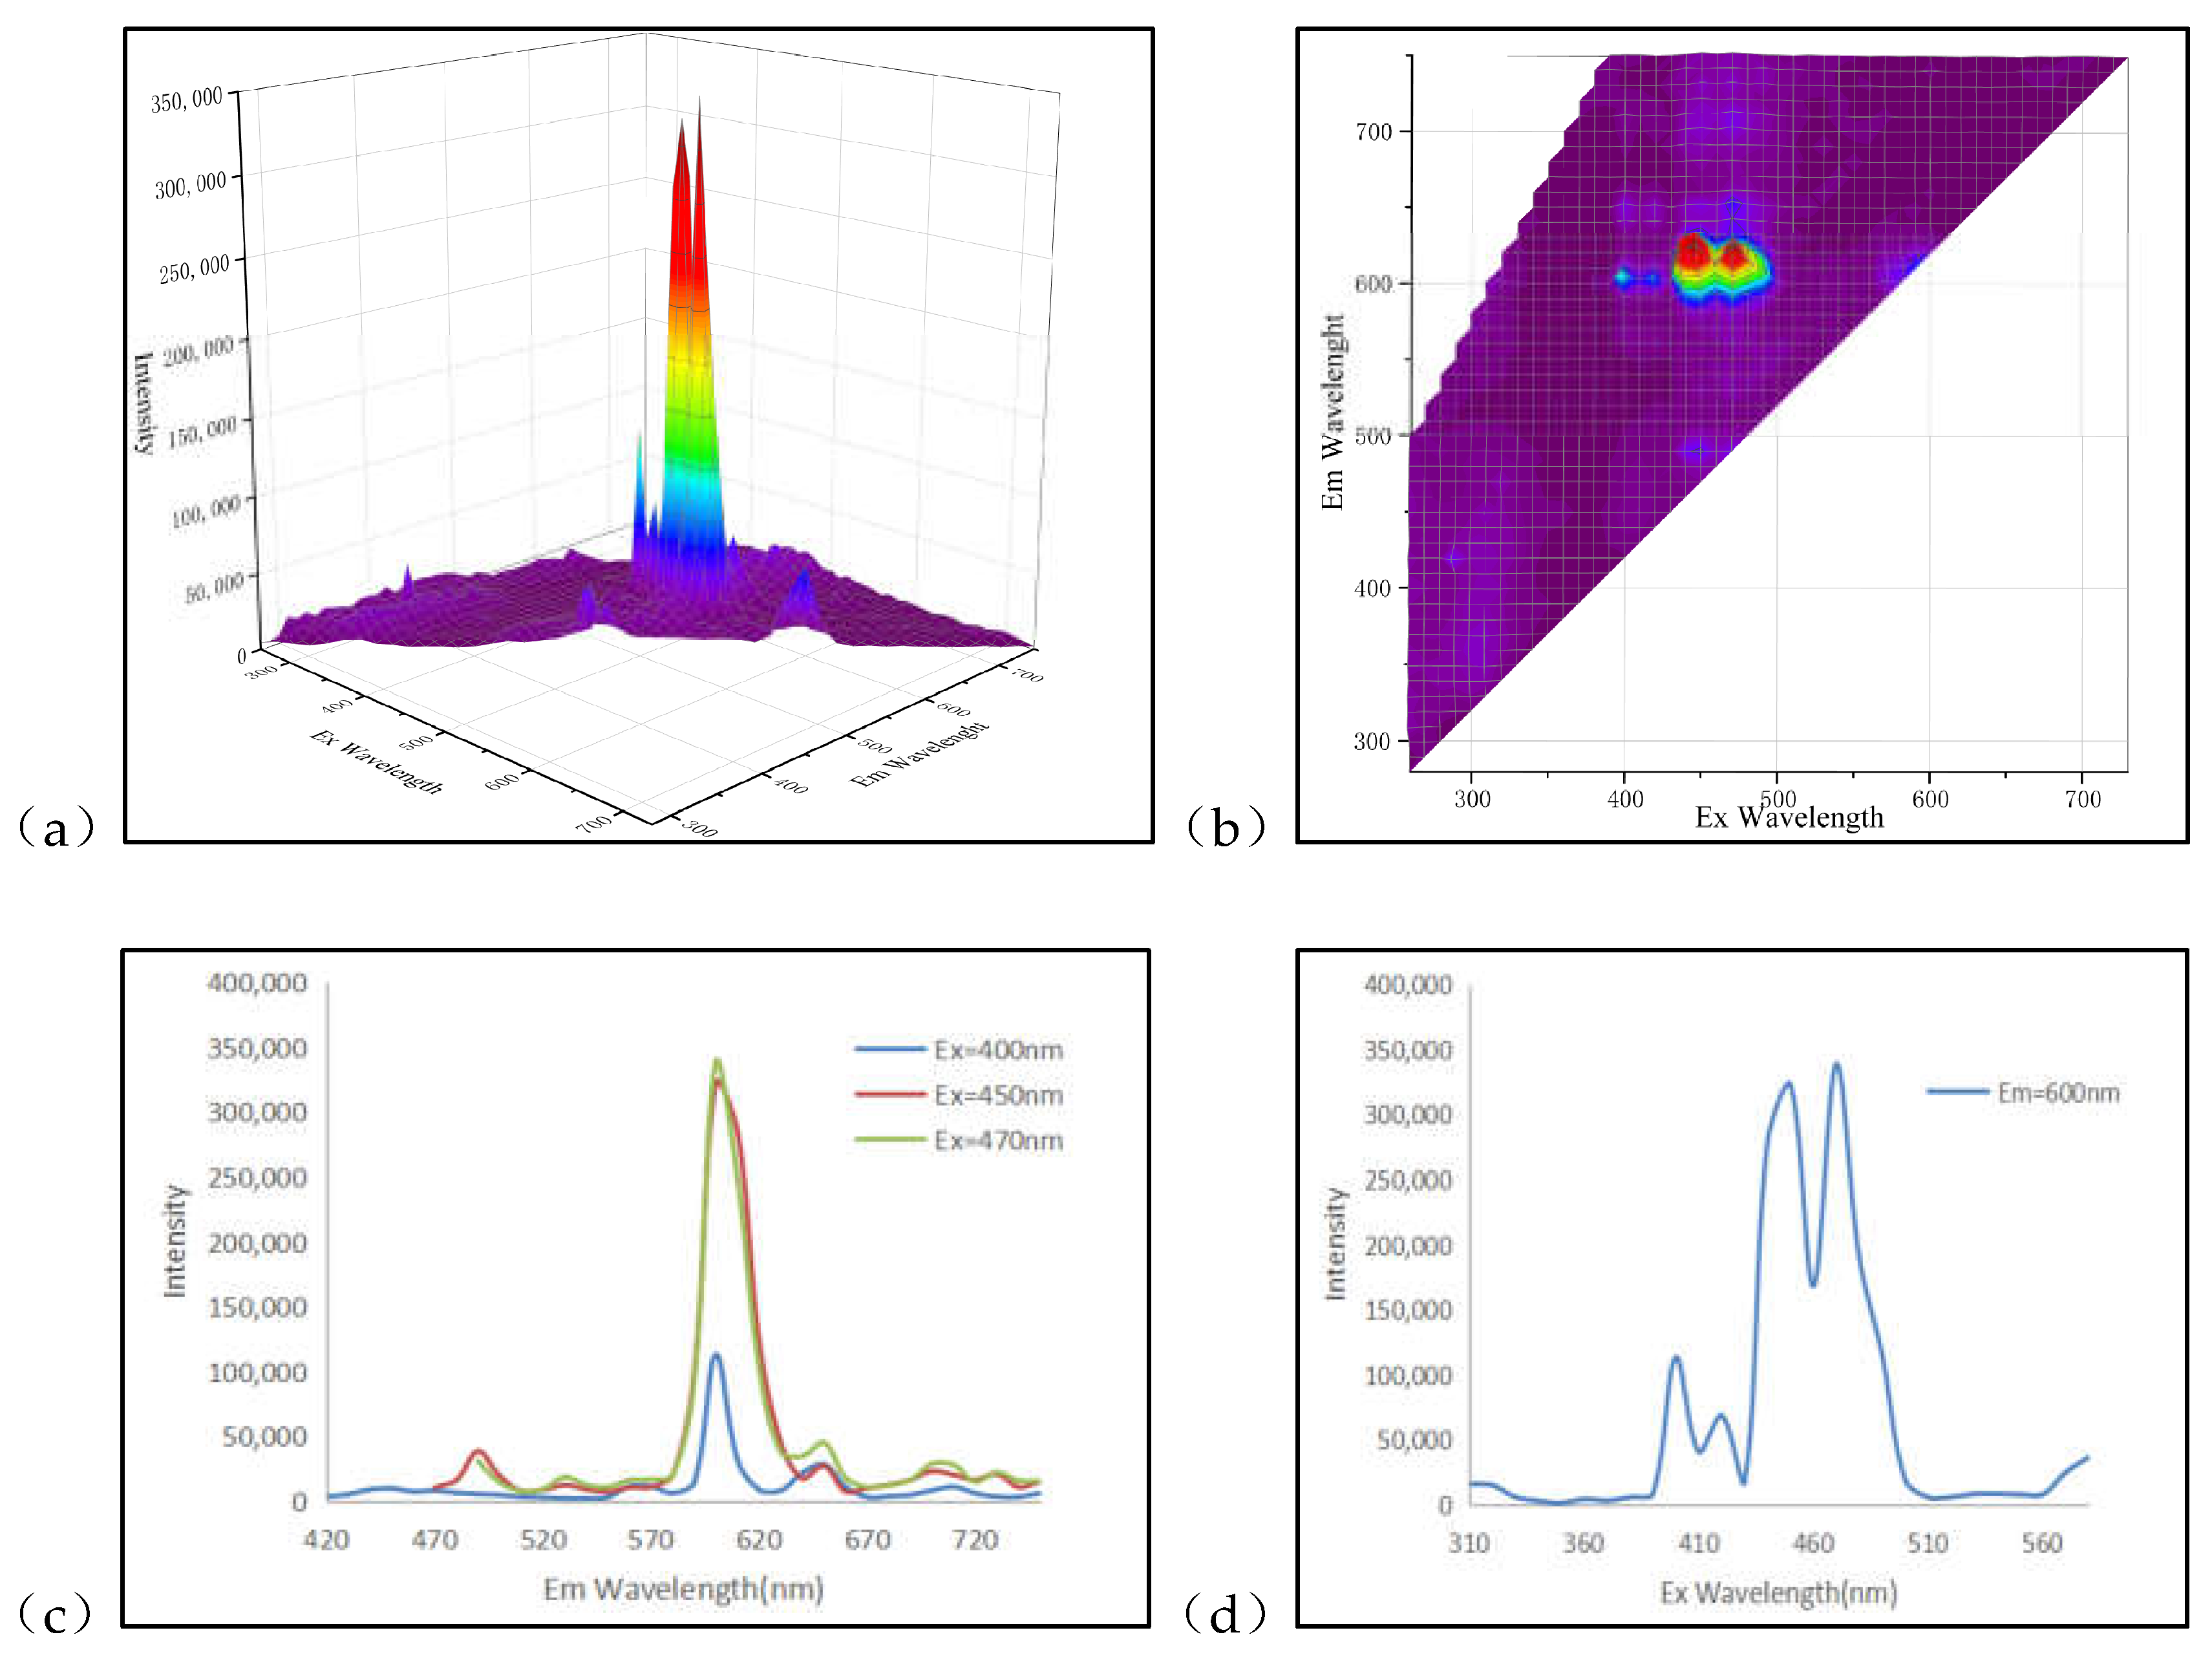
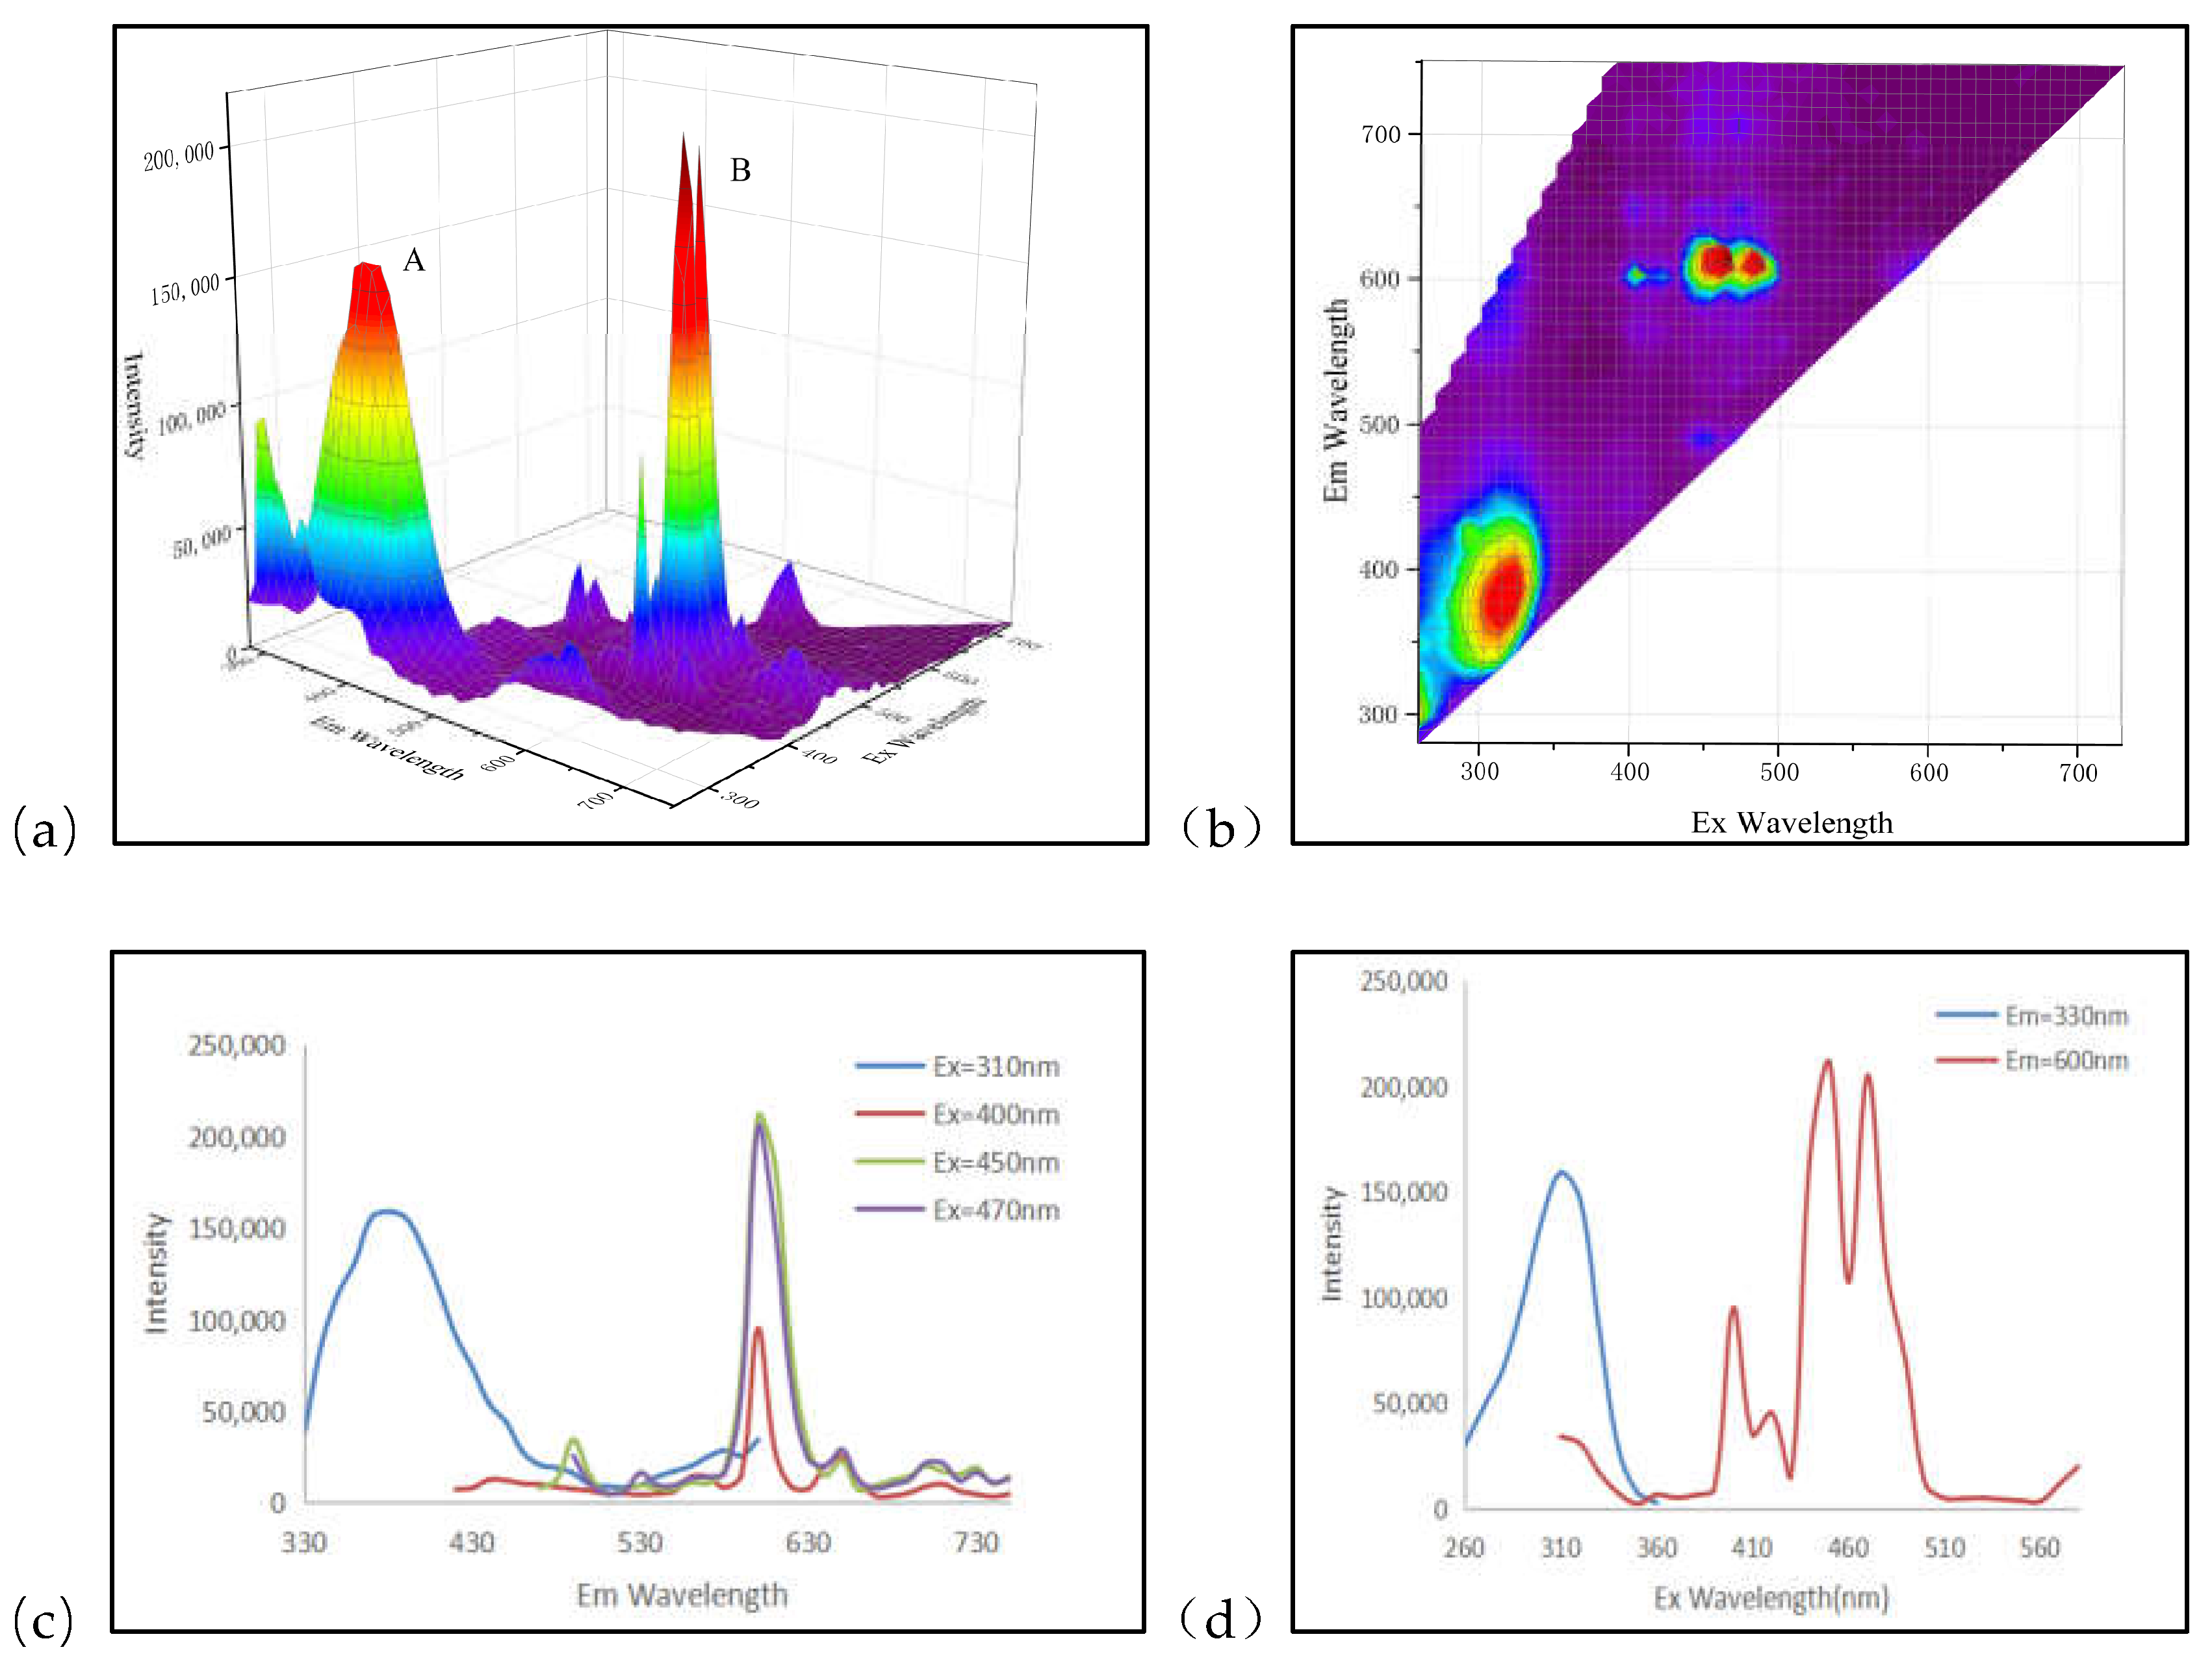
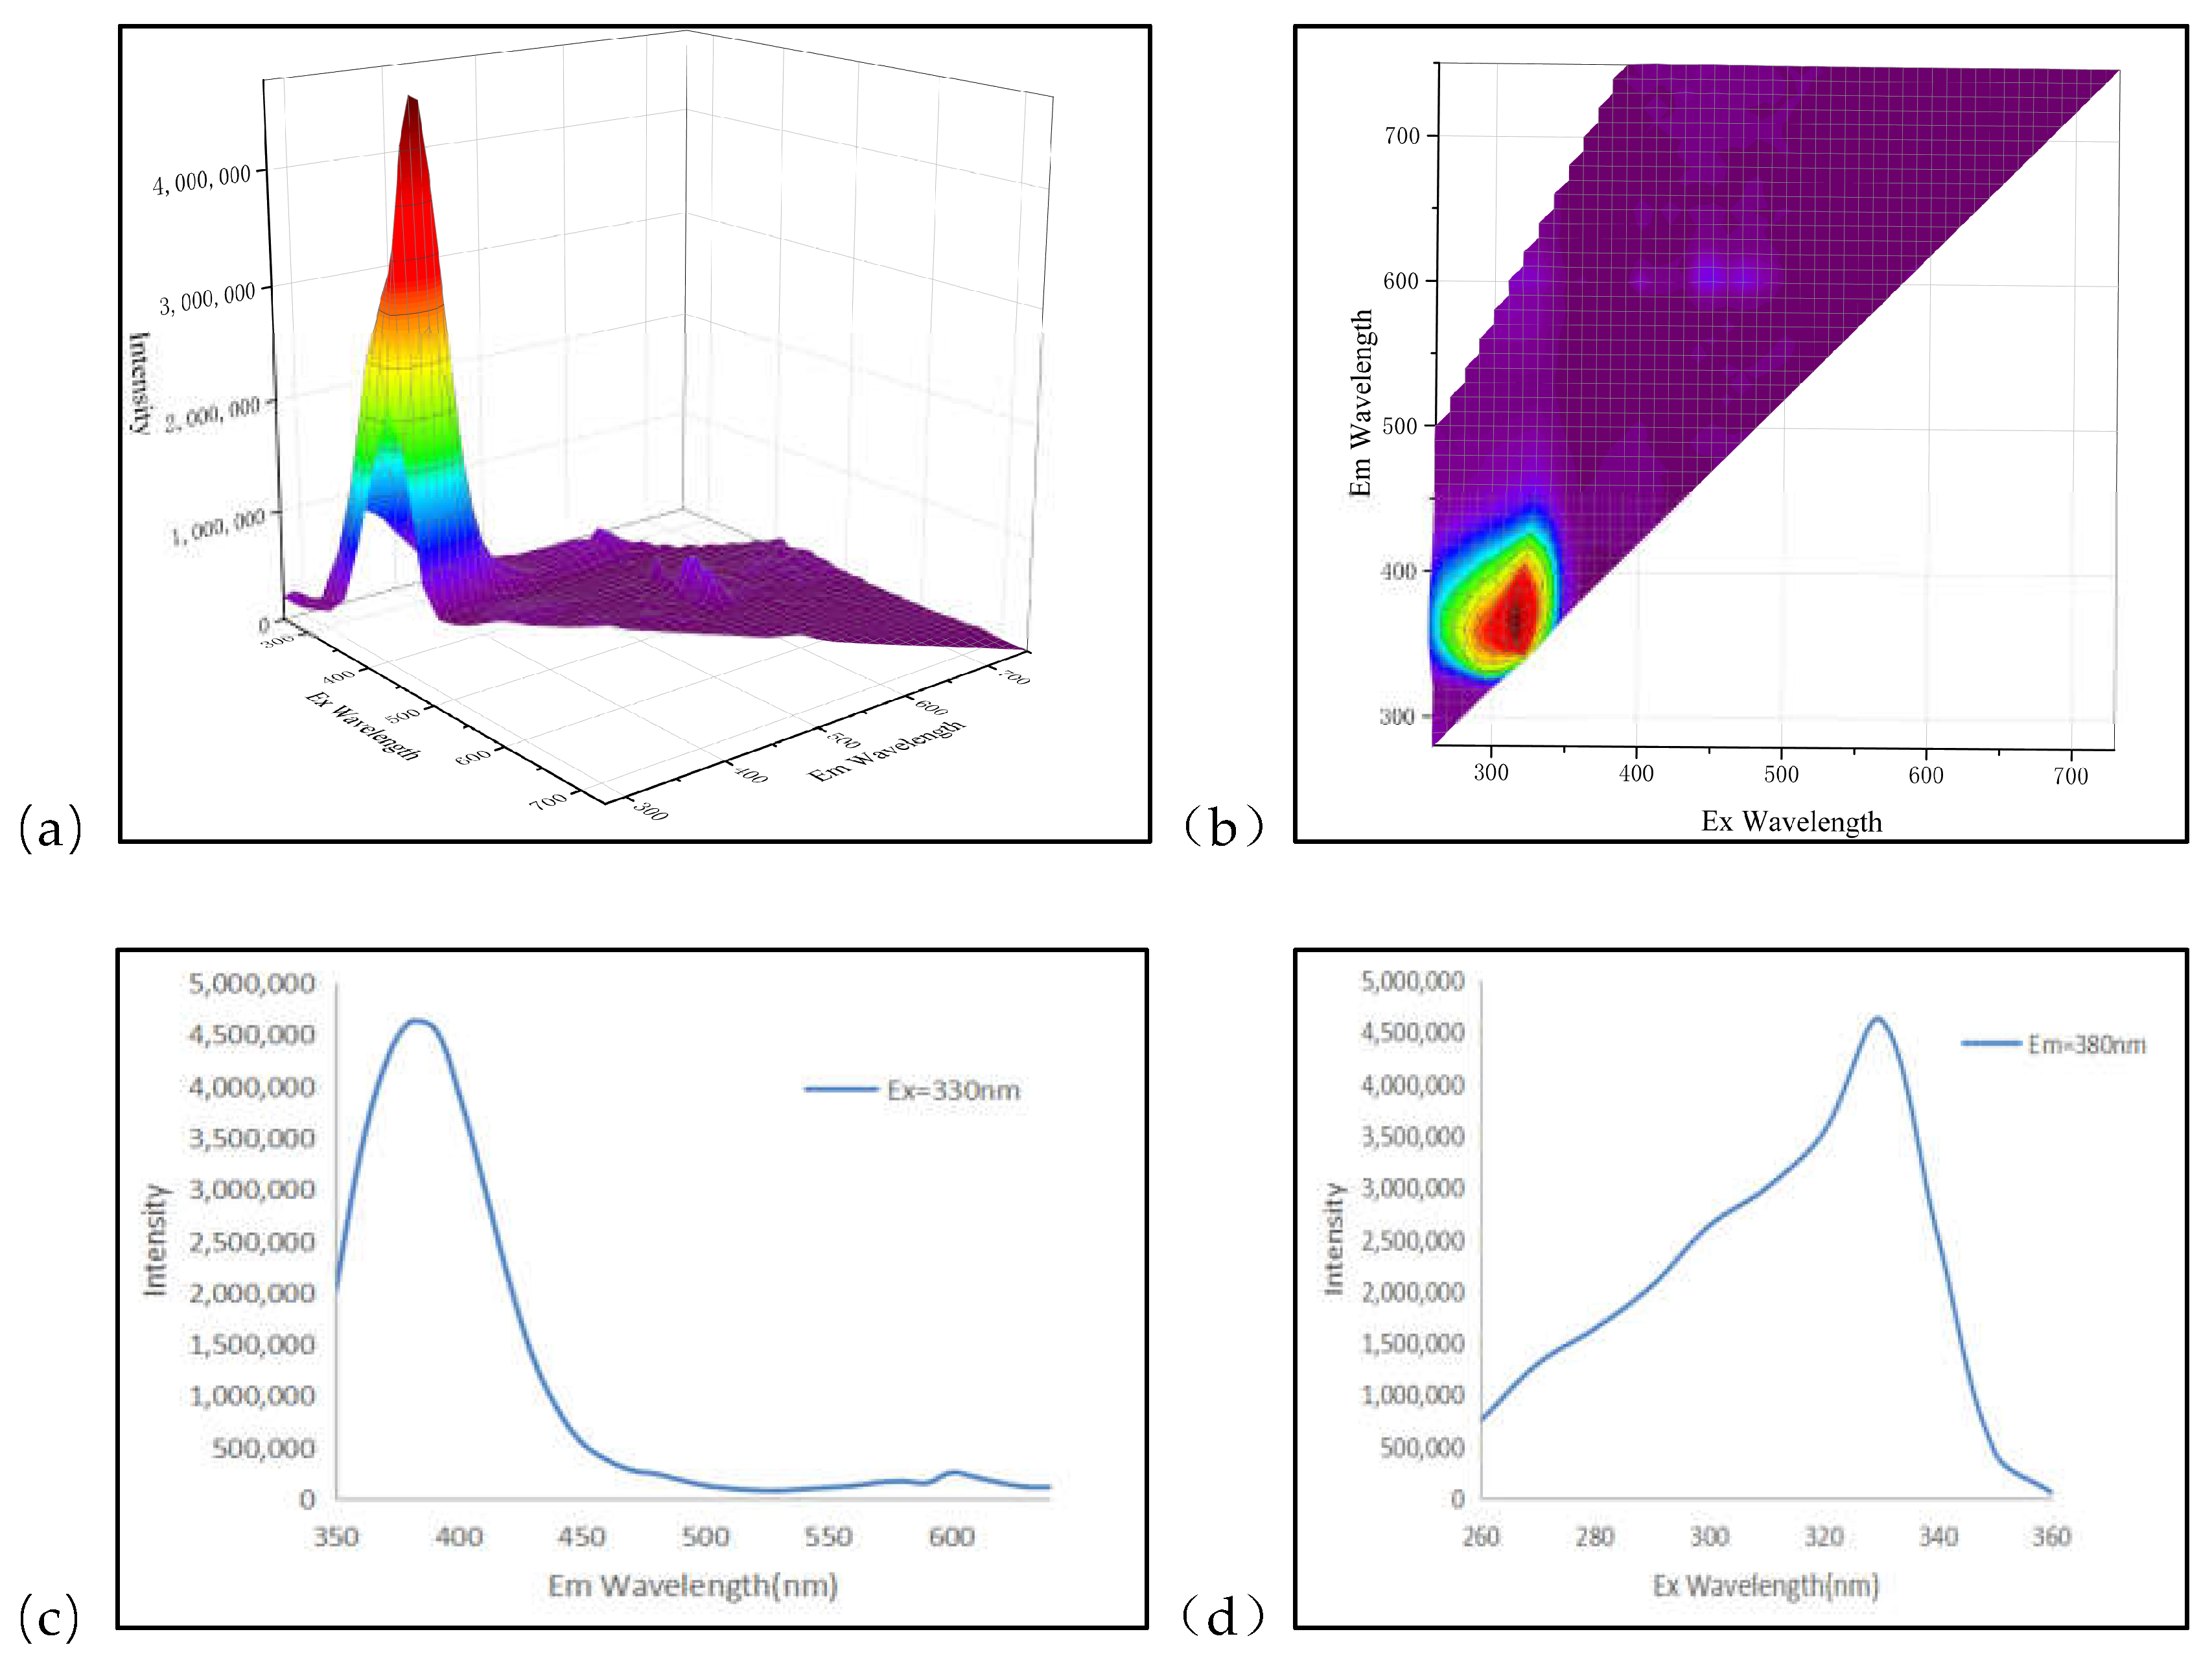
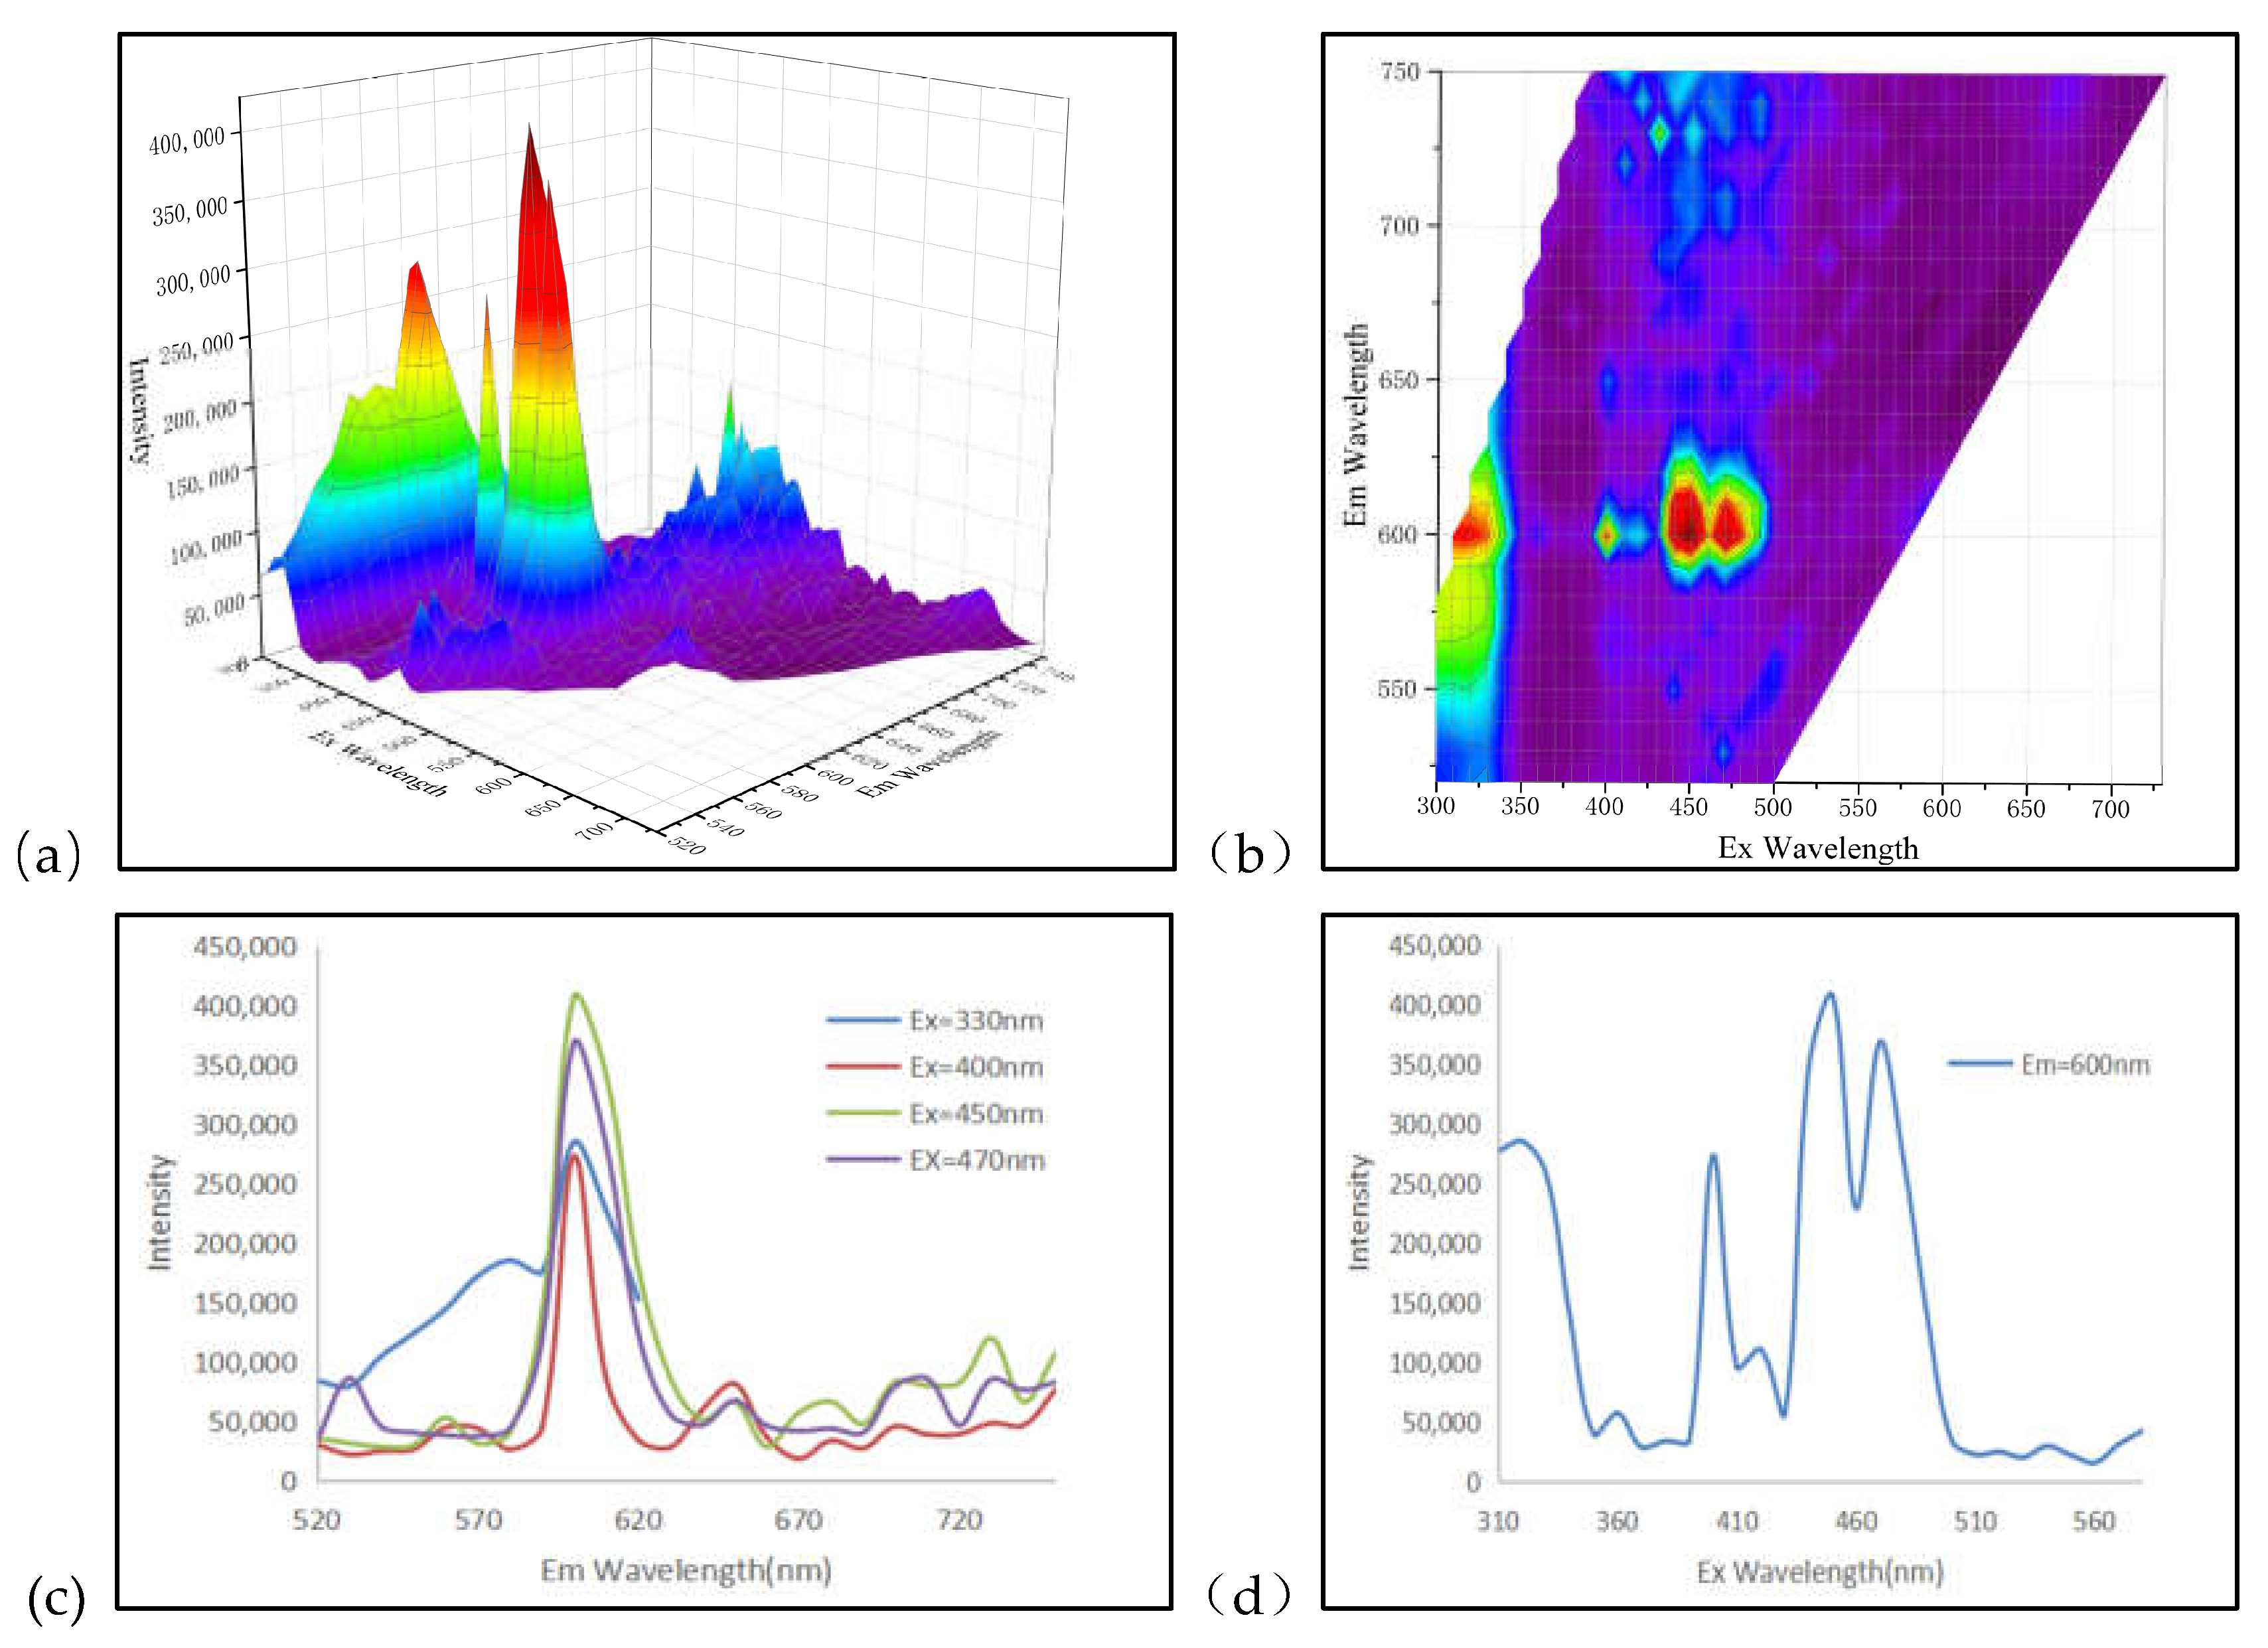
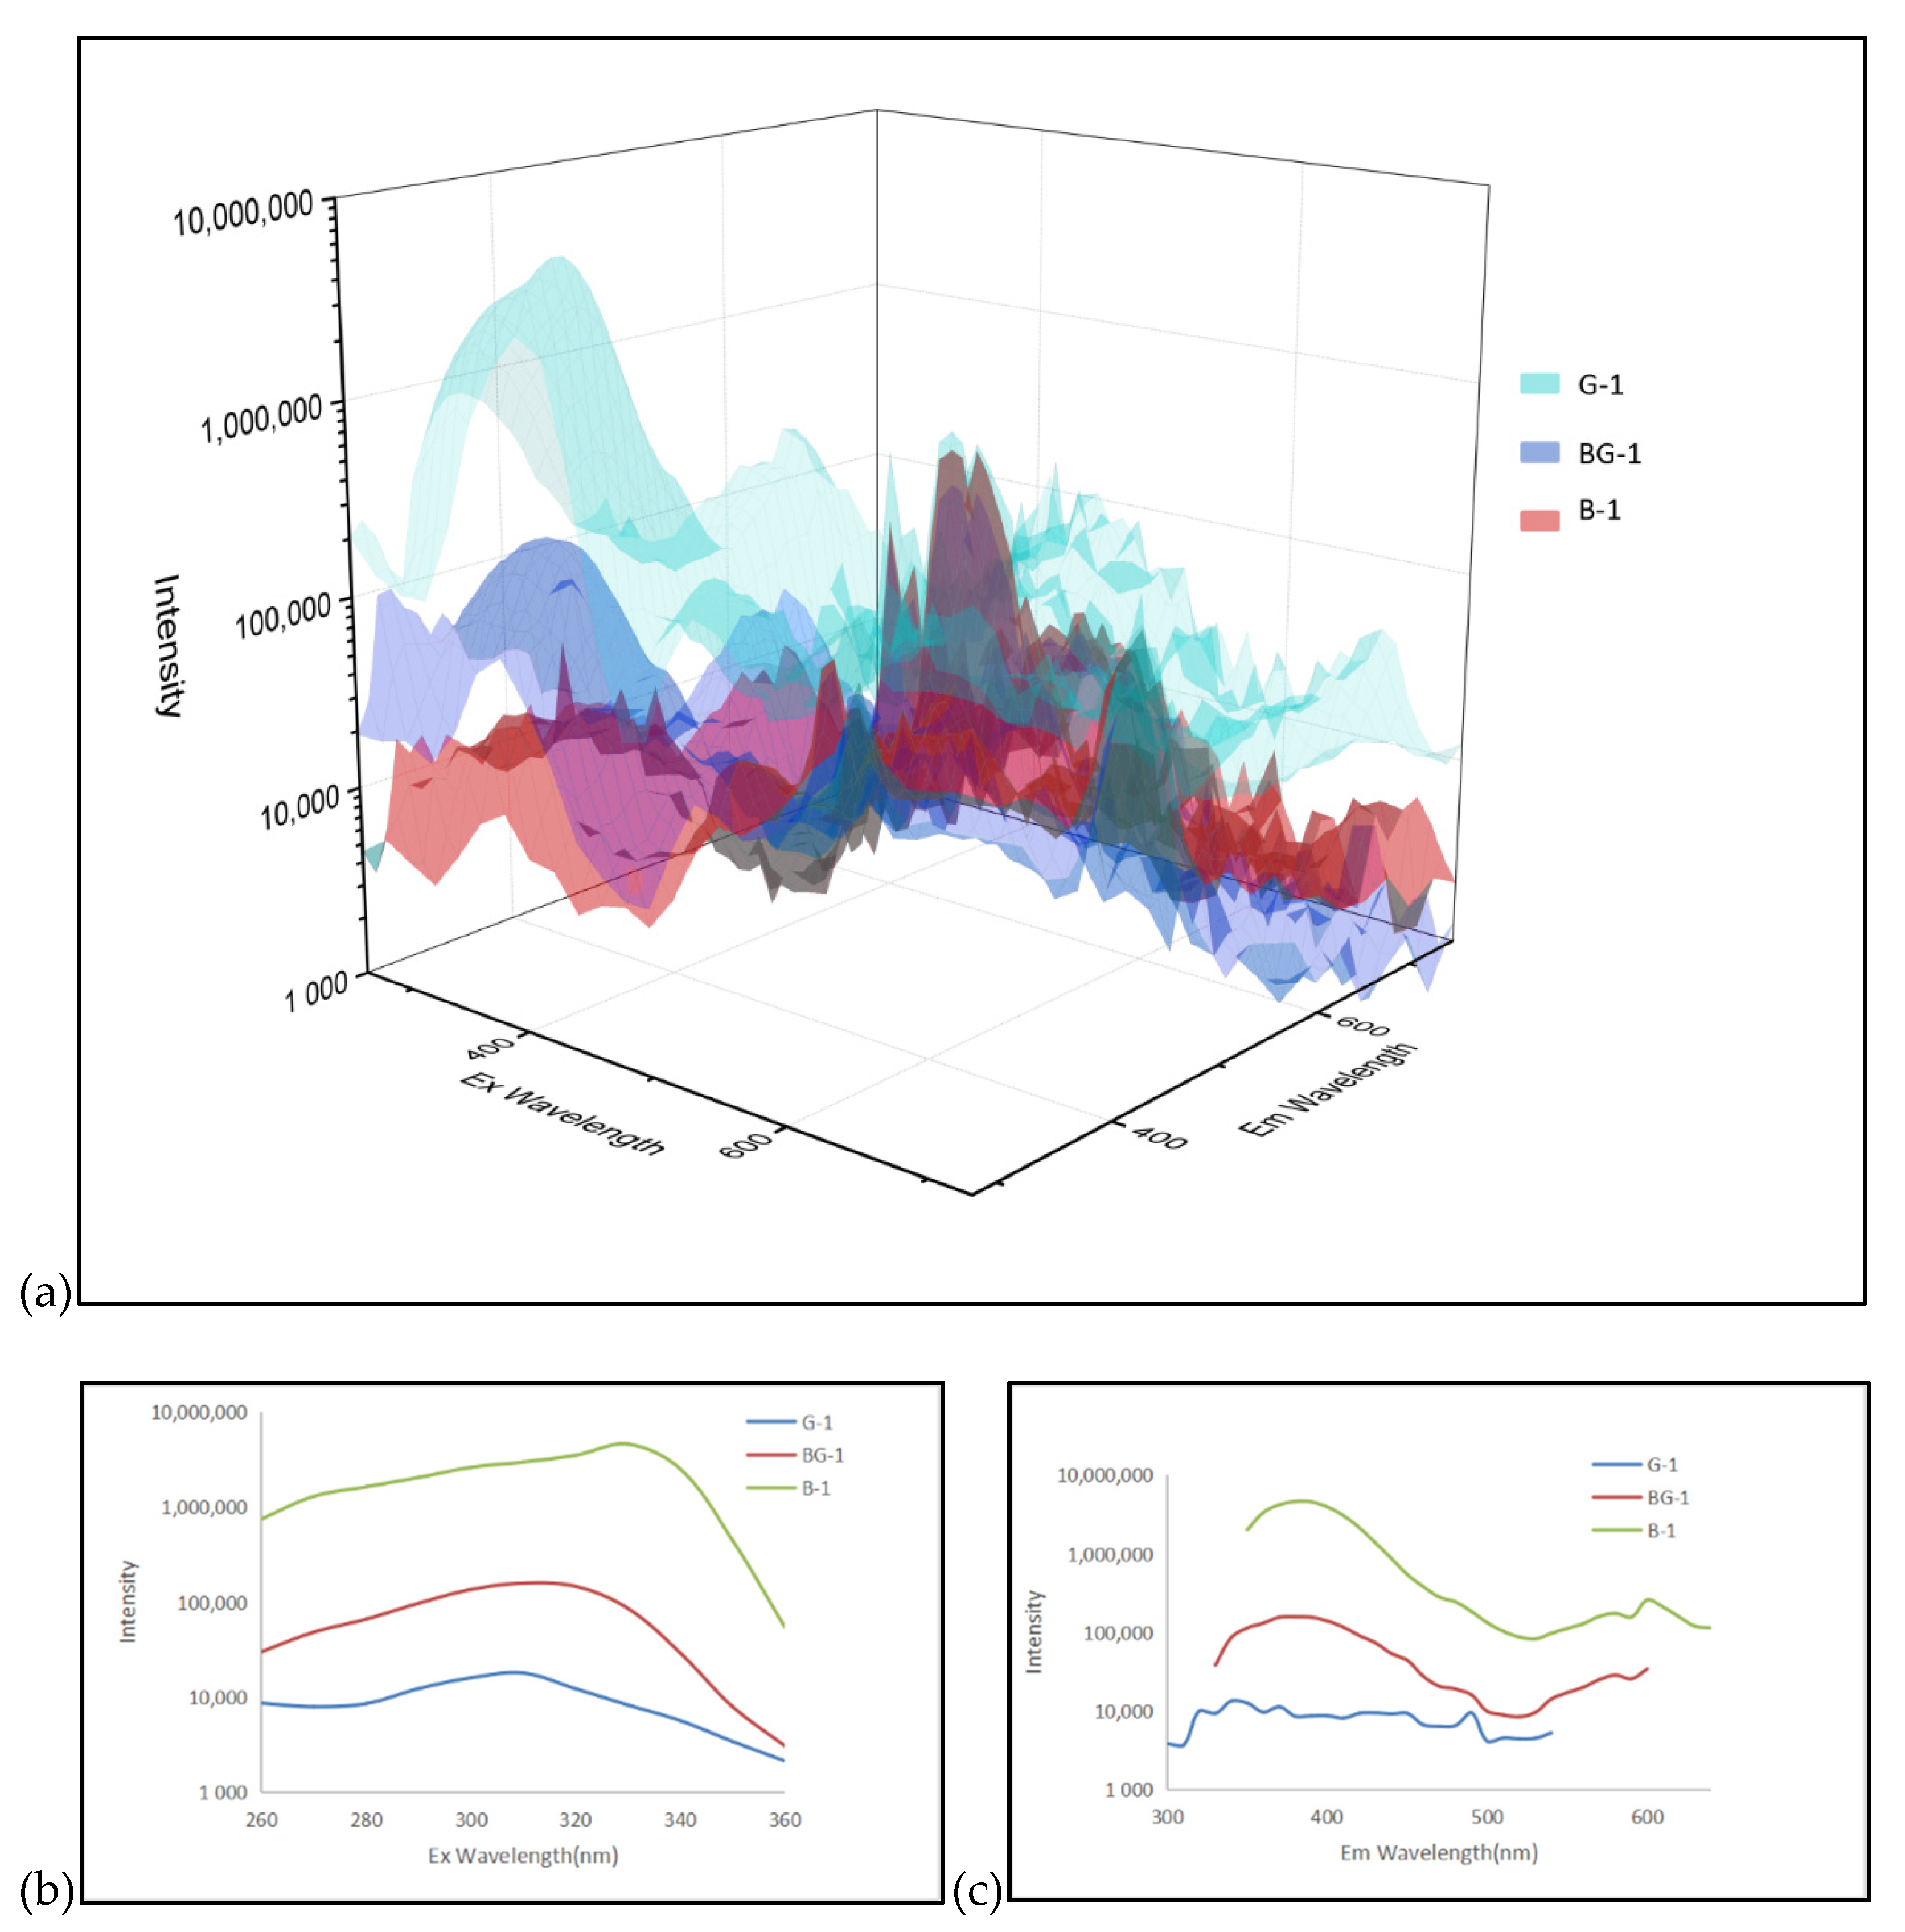
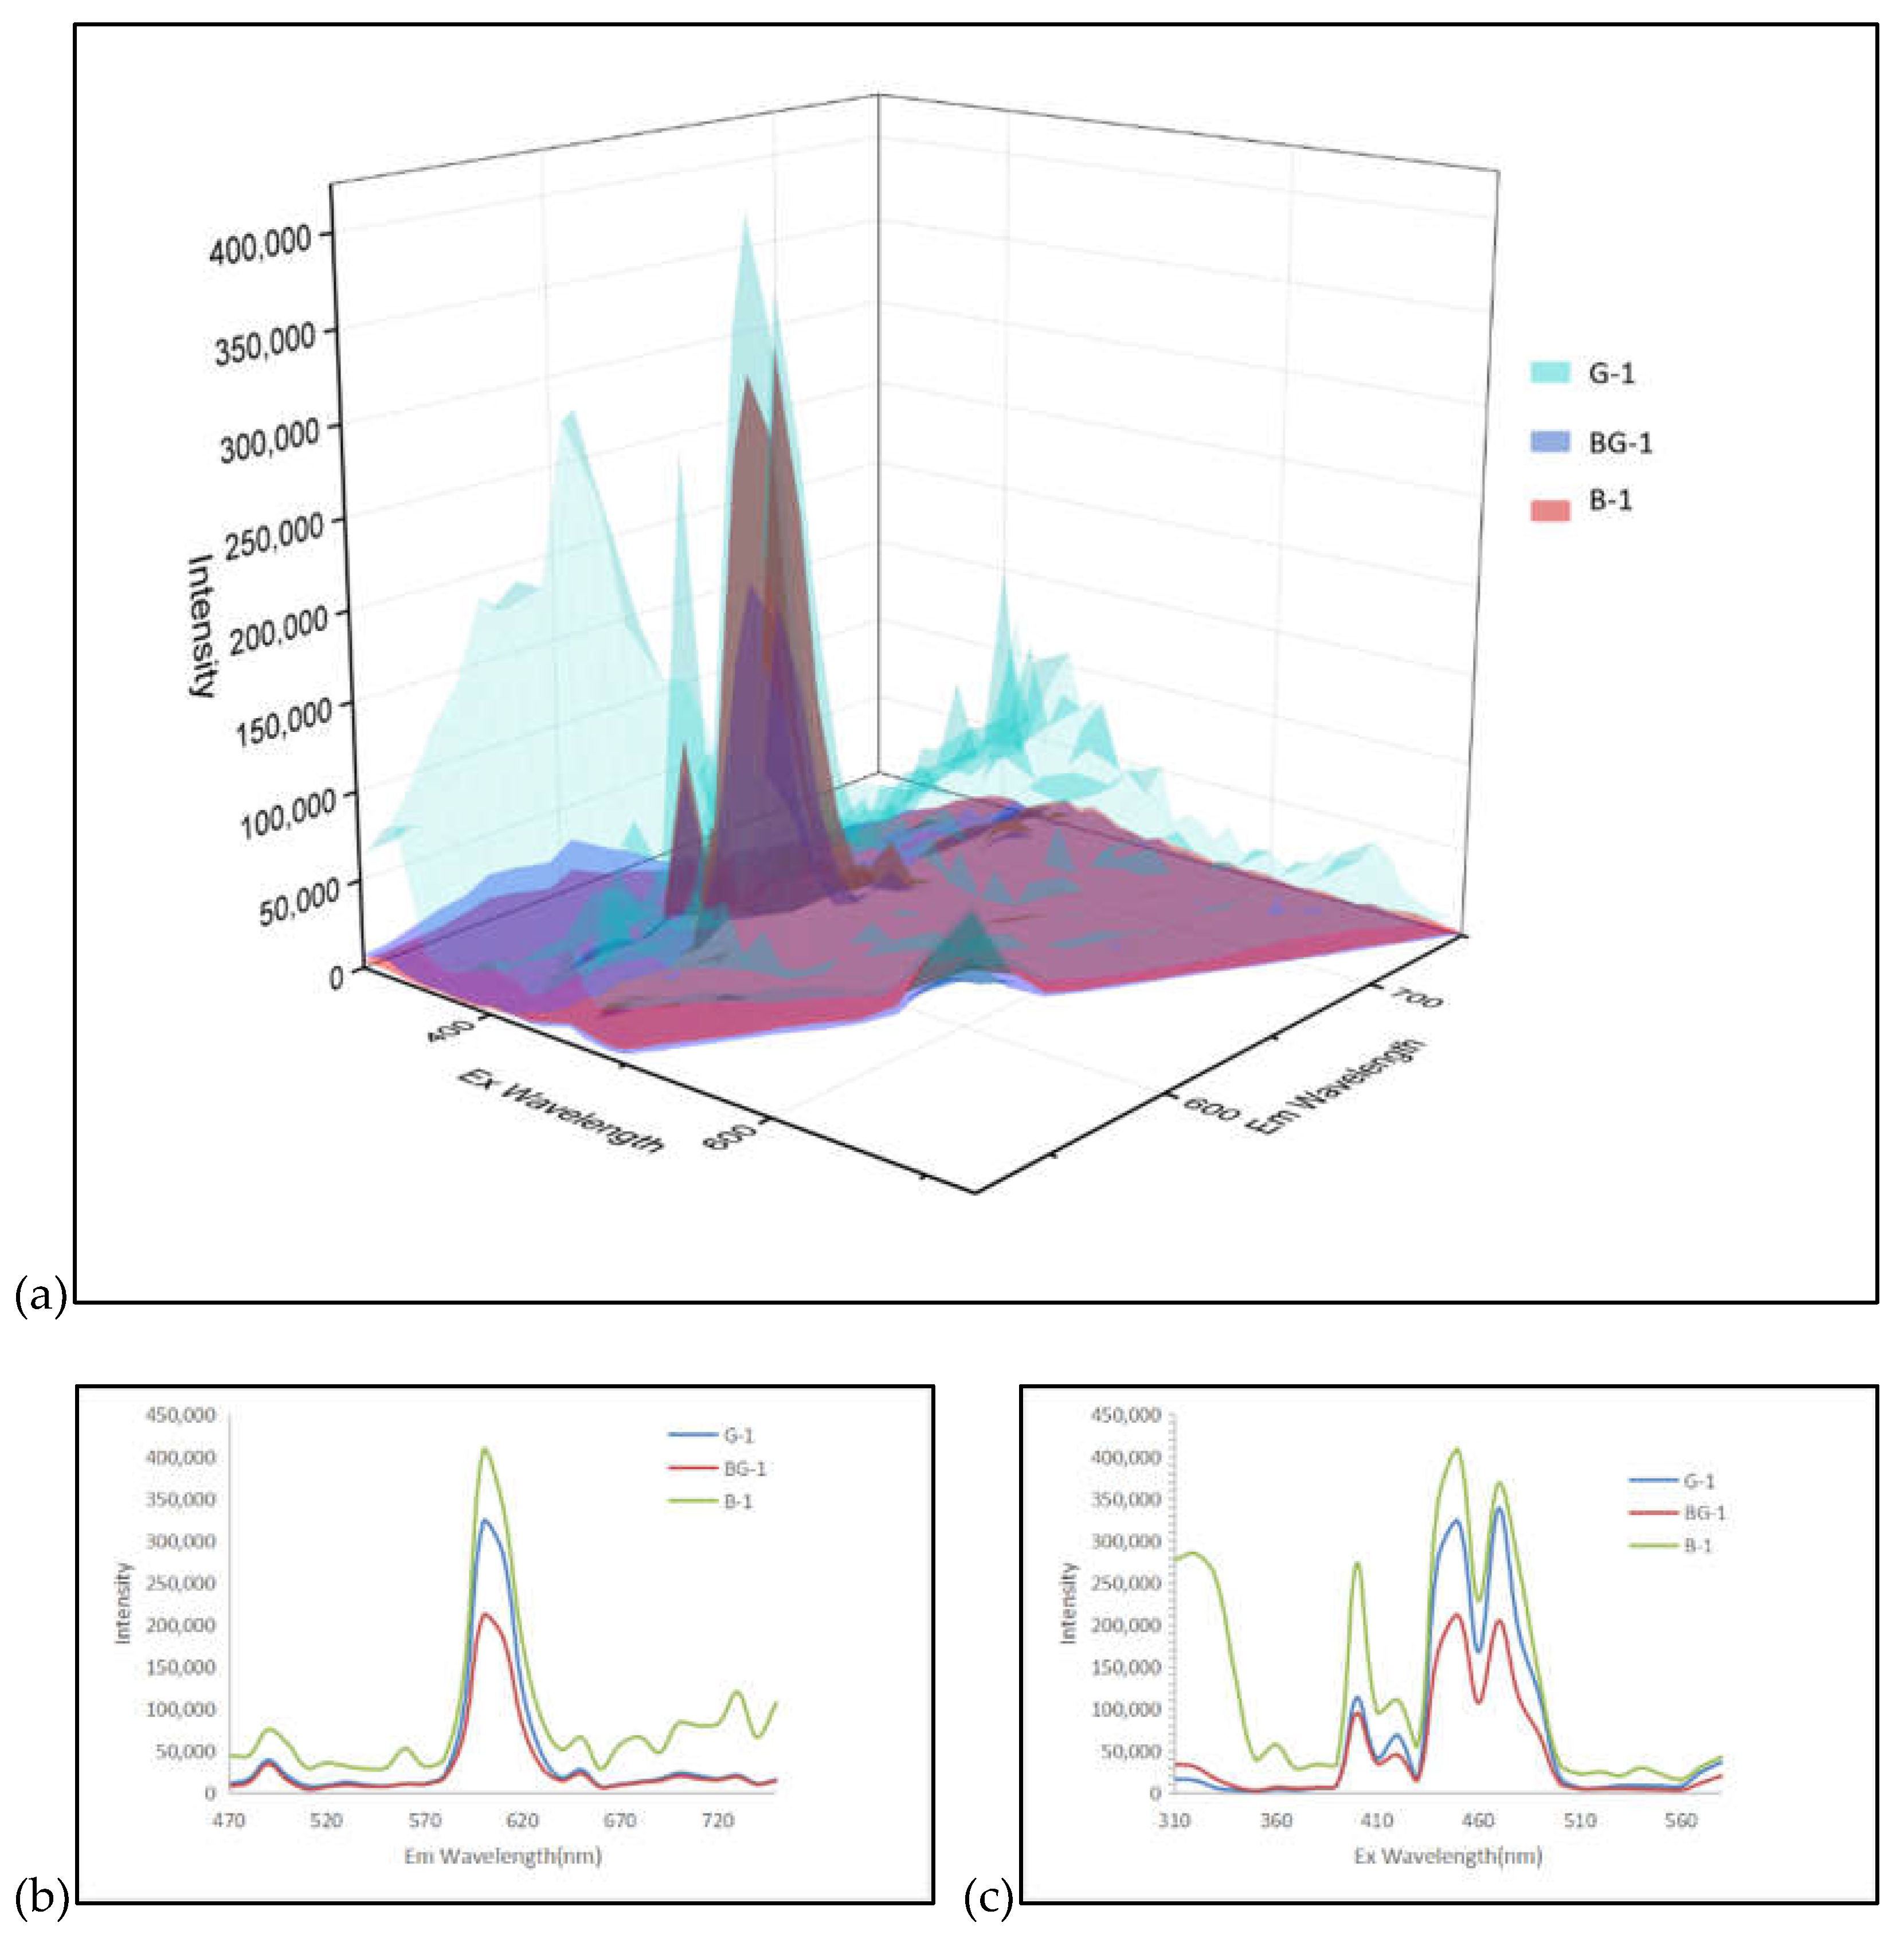
3.2. 3D Fluorescence Features
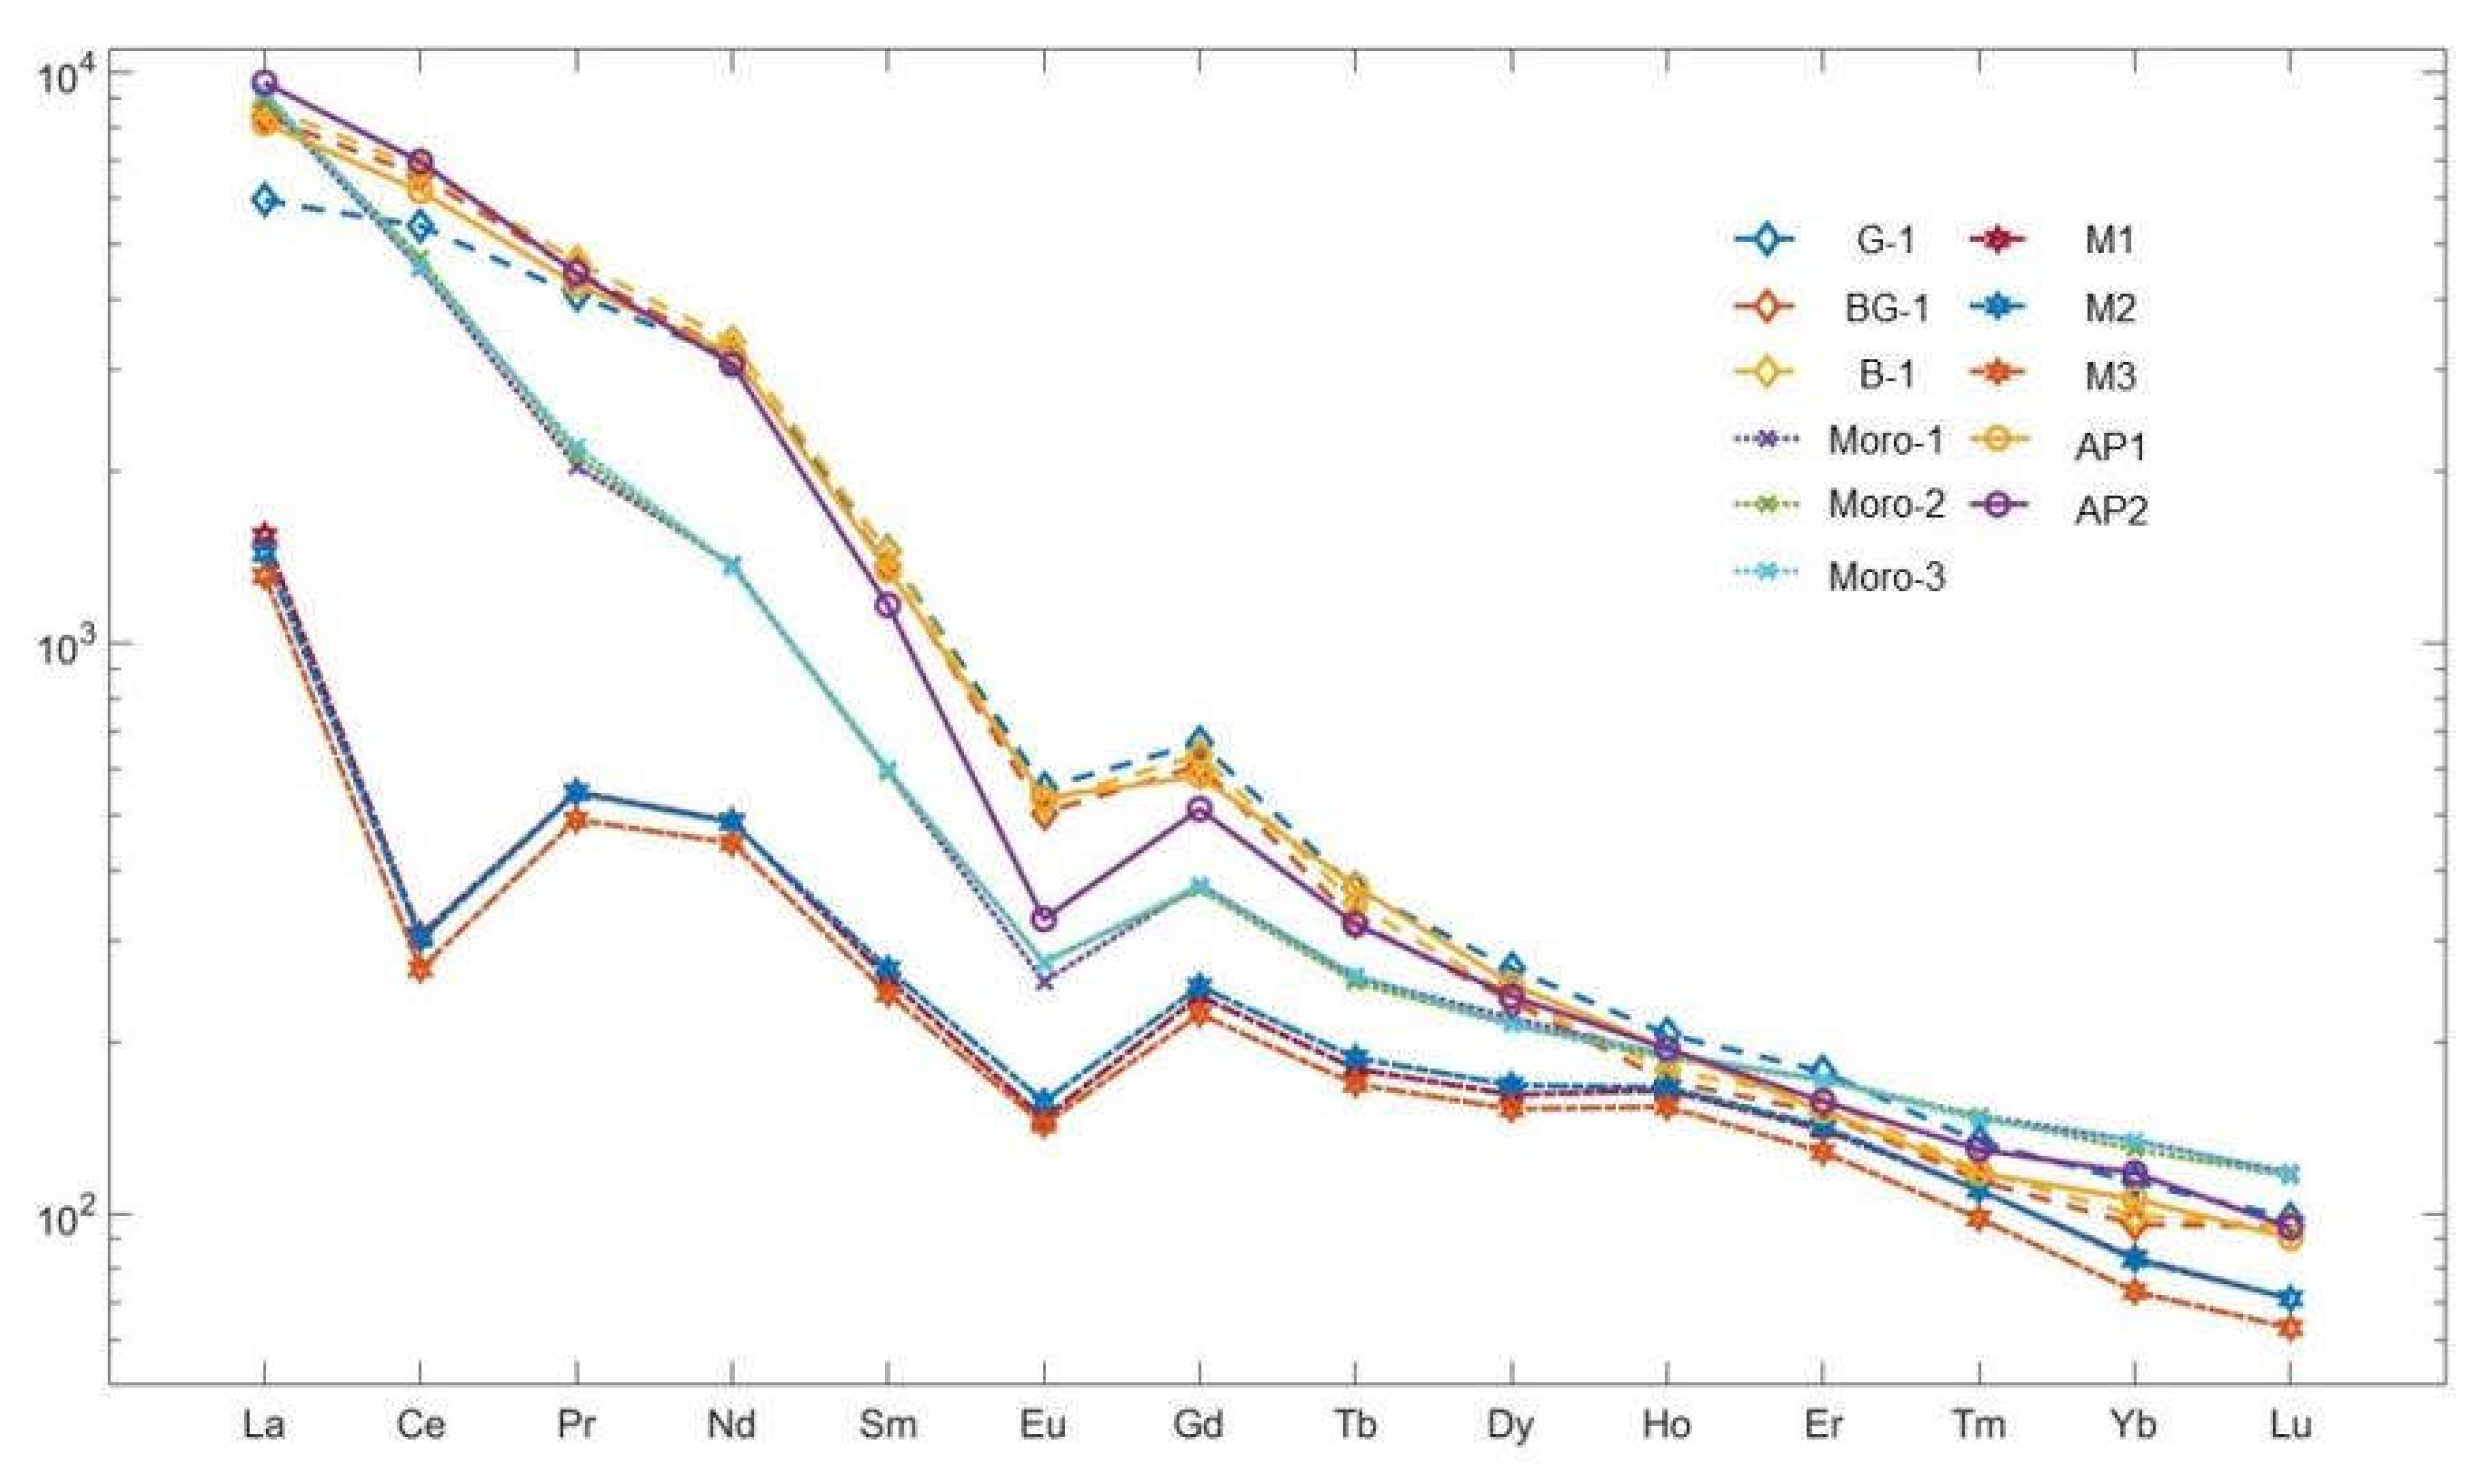
The 3D fluorescence matrix of G-1 apatite is shown in Figure 4a, and the contour map is shown in Figure 4b (This figure is drawn according to Tables S1–S3). In the emission range of visible light, green apatite produces double peaks of fluorescence emission at Ex (Excitation wavelength) = 450 nm and Ex = 470 nm, A slightly weak peak at Ex = 400 nm, the emission wavelength corresponding to the three emission peaks, is Em (Emission wavelength) = 600 nm, and there is no obvious fluorescence reaction in other areas; fixing 400, 450, and 470 nm as the excitation wavelengths, Figure 4c shows that the peak intensities are closer under the excitation of 450 and 470 nm, and the peak intensity of 400 nm excitation is relatively weaker. The full width at half-maximum FWHM (450) = 24.9 nm, FWHM (470) = 22.46 nm, and FWHM (400) = 12.8 nm were obtained by calculation; fixing the emission wavelength at 600 nm (Figure 4d) and combining it with Figure 4c can form a complete fluorescence emission peak feature. The sample has no obvious fluorescence emission peak position under ultraviolet excitation, which is in line with the observation conclusion that the sample is fluorescently inert under ultraviolet fluorescent lamp. It can be inferred from the fluorescence peak position that the sample can exhibit orange–red luminescence under the excitation condition of 400–470 nm.
The 3D fluorescence matrix results of the BG-1 sample are shown in Figure 5a, and the contour map is shown in Figure 5b (This figure is drawn according to Tables S4–S6.). The typical feature of this sample is that there are two obvious fluorescence features in the visible region peaks: a broad emission peak A in the blue–violet region, and a sharper emission peak group B in the orange–red region. Fixing Ex (A) = 310 nm, Em (A) = 380 nm showed that the A peak was excited by UV light and fluoresced in the blue–violet region, which is consistent with the fluorescence observation (Figure 5c,d). The emission peak FWHM = 87.6 nm, the excitation peak FWHM = 47.2 nm. Fixing Ex (B) = 400, 450, 470 nm and Em (B) = 600 nm, the peak characteristics obtained are consistent with those of G-1, but the peak intensities differ slightly.
The result of the 3D fluorescence matrix of B-1 is shown in Figure 6a, and the contour map is shown in Figure 6b. The B-1 sample has a very strong emission peak in the UV region and its fluorescence intensity is much higher than the first two samples. Fixing Ex = 330 nm and Em = 380 nm, the peak position shows strong excitation in the violet-UV region, with FWHM = 65.9 nm for the emission peak and FWHM = 46.6 nm for the excitation peak (Figure 6c,d).
Since the relative fluorescence intensity of the B-1 sample in the ultraviolet region is significantly higher than that of other regions, the emission peak of the orange–red region of the sample cannot be visually observed in Figure 6a,b, we narrowed the excitation wavelength range to highlight the emission peaks in the orange–red region (Figure 7a,b). Combined with the fluorescence matrix data to make a three-dimensional projection (Figure 7a) and contour line (Figure 7b), we fixed Ex = 320, 400, 450, 470 nm and Em = 600 nm then found two characteristics of these fluorescence peaks: (1) The sample has emission peaks at 400, 450, and 470 nm are consistent with the other samples, with the corresponding emission wavelengths concentrated around 600 nm; (2) Different from the previous two, this sample emits orange–red fluorescence at an excitation of Ex = 320 nm and has twice the intensity of the A-peak group of BG-1. This also explains the mixed violet–red fluorescence color of the B-1 sample due to the intense violet region luminescence demonstrated in Figure 6. (Figure 6 and Figure 7 are drawn according to the Tables S7–S9).

3.3. LA-ICP-MS

The elements tested by LA-ICP-MS for the apatite samples are La, Ce, Pr, Nd, Sm, Eu, Gd, Tb, Dy, Ho, Er, Tm, Yb, and Lu, a total of 14 elements.
Table 1 shows the rare-earth element (REE) content of the apatite samples, in which G-1, BG-1, and B-1 represent the measured content of green, bluish-green, and blue apatite. The normalized data obtained from the standard rare-earth value of chondrite meteorites. Taking the rare-earth elements as the abscissa, comparing the apatite samples from Morocco (Moro-1, Moro-2, Moro-3) [22], Zhijin (M1, M2, M3) [23] and Madagascar (AP1, AP2) [24], and normalizing the rare-earth elements of apatite and plotting Figure 8, the rare-earth distribution of apatite in this experiment is highly consistent with other origins; it is characterized by the enrichment of light rare earths and the loss of heavy rare earths.

4. Discussion

4.1. Fluorescence Characteristics and Influencing Factors

We fit the 3D fluorescence matrix data of G-1, BG-1, and B-1 to observe the difference in peak intensity between samples more intuitively. The logarithm of the ordinate is shown in Figure 9a, and the strongest emission peak of each sample in the ultraviolet region is fitted to make the emission spectrum (Figure 9b) and the excitation spectrum (Figure 9c). With the transition from bluish-green to greenish-blue, the relative intensity of the strongest fluorescence peak in the ultraviolet region of the sample shows an obvious multiple difference.
Among the trace elements of apatite, Ce is the most common rare-earth element, and its concentration is relatively high in apatite: 3288ppm (G-1), 4031ppm (BG-1), and 4155ppm (B-1); the luminescence transition of Ce3+ is 5d–4f. The fluorescence emission of fluorapatite shows that Ce3+ has a wide emission band in the ultraviolet and violet regions. At the same time [26], Ce3+ can play a role of sensitizer and transfer its own energy to other rare-earth elements to emit fluorescence.
The Eu3+ transition mode is f-f transition, and the emitting light-red light when the transition occurs. The content of Eu in the samples of apatite is 32, 29, and 30 ppm, respectively. The study found that when the content of Eu exceeds 20 ppm, it produces blue–purple fluorescence under the excitation of short-wave ultraviolet light [27]. In the apatite structure, Eu3+ can be sensitized by Tb3+, amplifying its excitation ability [28].
The content in the Dy3+ samples is 68, 59, and 61 ppm, respectively, and the transition type is the f-f transition. Dy3+ is one of the rare-earth elements that contributes the most to the fluorescence emission of natural apatite. Dy3+ can be sensitized by other rare-earth elements to enhance its own emission in the blue and blue–violet regions [29].
The content of Tb in apatite samples is about 13, 12, and 13 ppm, respectively, and it produces light red fluorescence in the transition. The presence of Tb3+ can sensitize Eu3+, and its excited state energy can be absorbed into the excitation of Eu3+ by resonance.
Overall, the REE results show that the combined action of Ce3+, Eu3+, Dy3+, and Tb3+ leads to the blue–violet fluorescence peak of apatite in the visible region, and the first three are directly involved in the fluorescence emission, and Tb3+ indirectly contributes to this fluorescence peak by sensitizing Eu3+.
The apatite samples also have fluorescence effects in the orange–red region. The 3D fluorescence matrix data of the three apatite samples in the visible orange–red region are fitted as shown in Figure 10a, fixing the excitation wavelengths ex = 400, 450, 470 nm for emission the spectrum (Figure 10b), and emission wavelengths Em = 600 nm for the excitation spectrum (Figure 10c). The three apatites all have emission peaks centered at 600 nm excited by 400, 450, and 470 nm. What is interesting is that the above three peaks have differences in the relative intensity of fluorescence, but only the blue samples can also produce orange–red fluorescence when excited at Em = 320 nm.
The content of Pr3+ in the samples is 386, 424, and 442 ppm, respectively. Pr3+ replaces the Ca(I) position in natural fluorapatite, resulting in a brick-red fluorescence around 610 nm [30]. Pr3+ can sensitize Sm3+ when both show similar characteristic transition energy; in general, Pr3+ plays a greater role as a sensitizer for other REE than for its own emission in the phenomenon of fluorescence.
Mn2+ is the main element of apatite, and the structural replacement of Mn2+ is more inclined to the Ca(I) site. Mn2+ at this position (Ca(I)) in natural apatite has yellow–orange–red luminescent properties. The priority of the Ca(I) site decreases with increasing Mn2+ content [31], and Mn2+ plays the role of luminescence activator and Ce3+ and Sb3+ are the sensitizers that transfer excitation energy to Mn2+. In addition, the Mn content is also related to the apatite’s green–blue transition [32].
Sm3+ produces a yellow emission in the f-f transition. The concentrations of Sm in the samples are 202, 207, and 219 ppm, respectively. Sm3+ is one of the important rare-earth elements that causes apatite fluorescence. Sm3+ can receive energy from other REE and affect the emission in the visible region. [33] Pr3+ can effectively sensitize Sm3+ in orange–red region, and when apatite contains high levels of Sm3+, its main characteristic luminescence band is in the 590–630 nm range
It can be concluded that Mn2+, Sm3+, and Pr3+ contribute to the fluorescence emission peak of apatite, where Pr3+ also sensitizes Sm3+; the content of Mn2+, Pr3+, and Sm3+ increases in the transition from green to blue in the sample, and the interaction of the three leads to the orange–red fluorescence of apatite.
The fluorescence of apatite is the result of color mixing. Under the excitation of a specific light source, the fluorescence of apatite is composed of blue–violet fluorescence generated by Ce3+, Eu3+, and Dy3+ and orange–red components generated by Mn2+ and Sm3+. With the change of the element content in the sample, and the mixing ratio of blue–violet and orange, the fluorescence also changes and leads to pink–purple and red–purple.

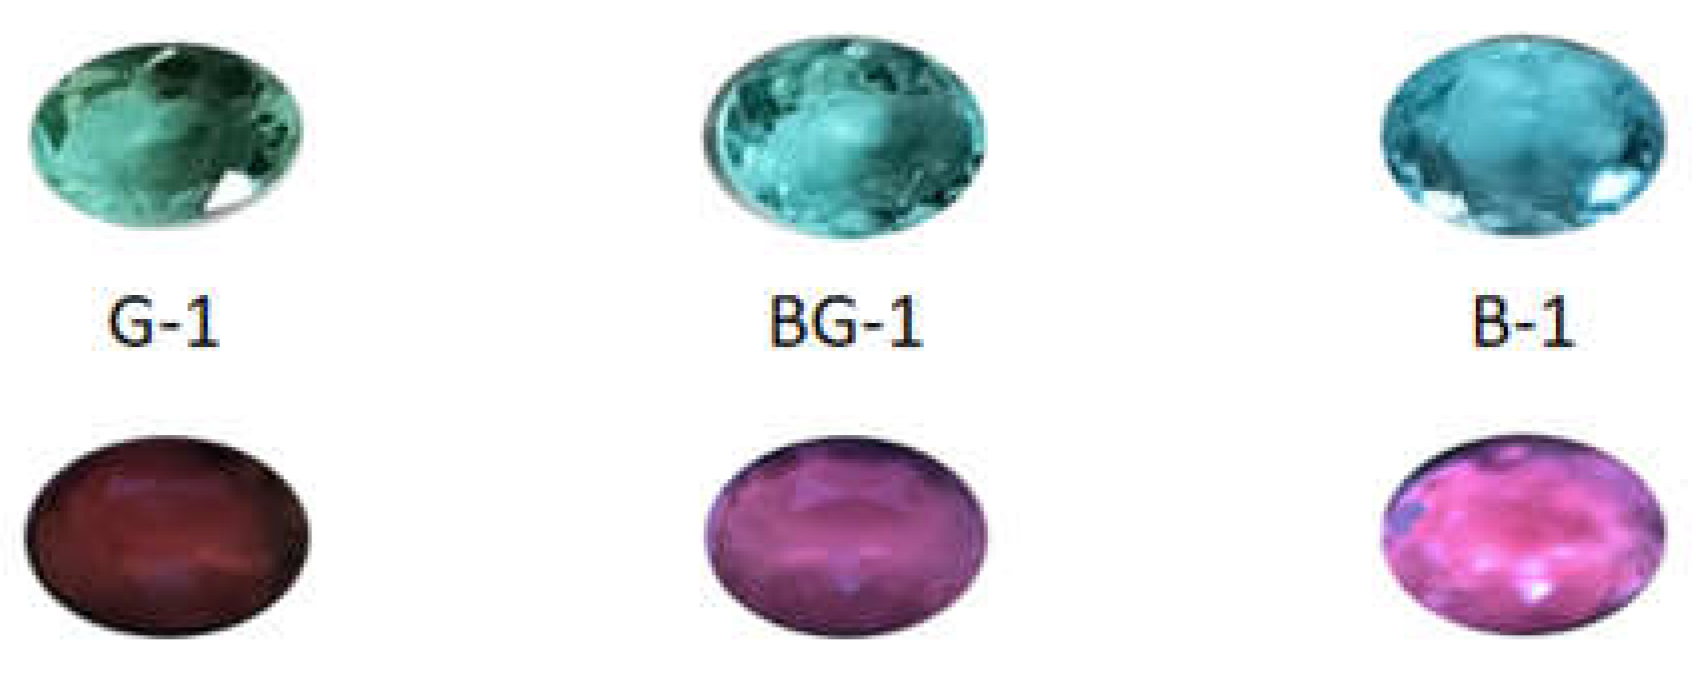
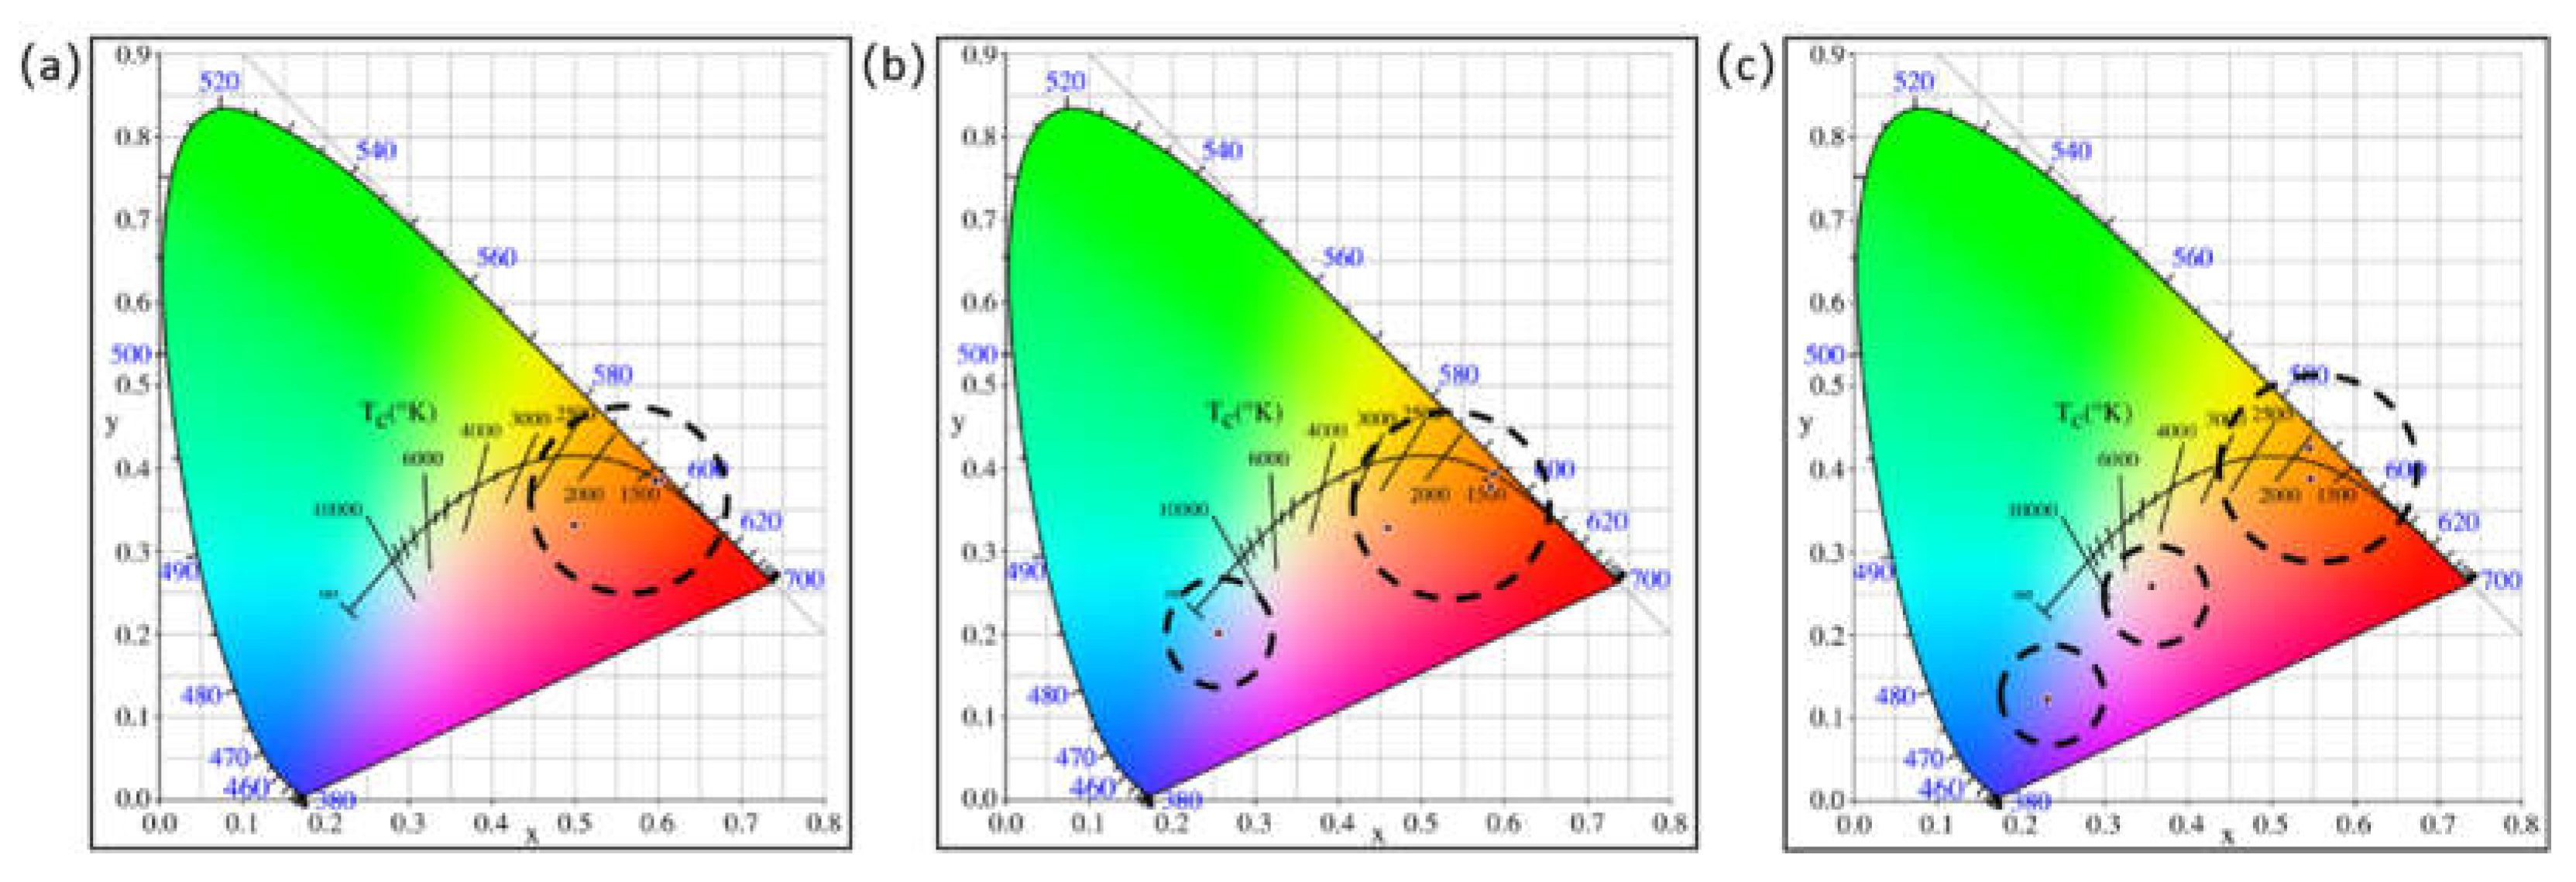
4.2. Fluorescent Color

According to the above Formulas (1)–(3), the measured data is weighted by the light source to calculate the fluorescence color parameters of the G-1, and the color coordinates (x, y) and the dominant wavelength λ and excited purity Pe at the corresponding excitation wavelength are obtained As shown in Table 2 and Figure 11a, the fluorescence color coordinates of the G-1 under the excitation light source of 400 nm are (0.500, 0.332), and the color range according to the CIE1931 chromaticity diagram is set as yellowish pink. The emission spectra of the samples are similar at 450 nm and 470 nm excitation, so the color coordinates of both are close to the main wavelength of orange. The dominant wavelengths of all fluorescence color coordinates are in the orange region of 590–610 nm.
To calculate the color coordinates, dominant wavelength, and excitation purity of the BG-1 sample, as shown in Table 3 and Figure 11b, the color coordinates of the BG-1 sample appeared in the blue–violet region at 310 nm excitation with a dominant wavelength of 454 nm and a purple color; the color coordinates under excitation at 400 nm, 450 nm, and 470 nm are similar to those of the green apatite sample, but the excitation purity is slightly lower.
As shown in Table 4 and Figure 11c, under the excitation of 330 nm, the color coordinates of B-1 are in the purple region, the dominant wavelength is 406 nm, and the color range of the CIE1931 chromaticity diagram is determined as purplish blue; the color coordinate under excitation at 400 nm is close to the coordinate of the D65 light source, the excitation purity is relatively low, and the color is purplish pink. Since the coordinates are in the purple–red region without the dominant wavelength, only the complementary color wavelength is 529 nm (that is, the spectral color at the dominant wavelength of 529 nm mixed with the coordinate color can match the reference white point of the D65 light source). The color coordinates under excitation at 450 nm and 470 nm are similar to those of the G-1 and BG-1 apatite samples, but the excitement purity is the lowest of the three.

5. Conclusions

As the apatite body color transitions from green to blue, its fluorescence characteristics change from inert to a strong pink–purple fluorescence. Two fluorescence peak features were found to exist in green–blue apatite by 3D fluorescence testing: (1) The fluorescence peak group composed of the fluorescence double peaks generated by the excitation light source at 450 nm and 470 nm and the weaker fluorescence peak generated by the excitation at 400 nm, and the emission wavelength of the peak is 600 nm; (2) The fluorescence peak with the excitation wavelength of 280–330 nm and emission wavelength of 380 nm gradually becomes prominent and enhanced as the apatite turns blue.
Combined with the trace element results from LA-ICP-MS, the fluorescence in the orange–red region was due to Mn2+, Pr3+, and Sm3+ and the fluorescence in the blue–violet region was due to Ce3+, Eu3+, and Dy3+. Based on the calculation of the CIE1931 standard chromaticity system, the green sample has yellow–pink and orange fluorescence; the blue-green sample has purple, yellow–pink, and orange fluorescence; and the blue sample has violet–blue, pink–purple, and orange fluorescence.

Supplementary Materials

The following supporting information can be downloaded at: https://www.mdpi.com/article/10.3390/cryst12060866/s1, Tables S1–S3: 3D Fluorescence Data of G-1 Apatite; Tables S4–S6: 3D Fluorescence Data of BG-1 Apatite; Tables S7–S9: 3D Fluorescence Data of B-1 Apatite.

Author Contributions

Conceptualization, Q.Y.; formal analysis, Q.Y.; investigation. Q.Y.; methodology, Q.Y.; supervision, Y.G.; visualization, Q.Y., Z.L.; writing—original draft, Q.Y.; writing—review and editing, Z.L., Y.G. All authors have read and agreed to the published version of the manuscript.

Funding

This research received no external funding.

Data Availability Statement

All data are available in the article and the Supplementary Materials.

Acknowledgments

Part of the experiments in this research were conducted in the laboratory of the School of Gemology, China University of Geosciences, Beijing.

Conflicts of Interest

The authors declare no conflict of interest.

References

  1. Piper, W.W.; Kravitz, L.C.; Swank, R.K. Axially Symmetric Paramagnetic Color Centers in Fluorapatite. Phys. Rev. 1965, 138, 1802–1814. [Google Scholar] [CrossRef]
  2. Comodi, P.; Liu, Y. CO3 substitution in apatite: Further insight from new crystal-chemical data of Kasekere (Uganda) apatite. Eur. J. Mineral. 2000, 12, 965–974. [Google Scholar] [CrossRef]
  3. Nathan, Y. The mineralogy and geochemistry of phosphorites. In Phosphate Minerals; Niagu, J.O., Moore, P.B., Eds.; Springer: Berlin/Heidelberg, Germany, 1984; pp. 275–291. [Google Scholar]
  4. Stoppa, F.; Liu, Y. Chemical composition and petrogenetic implications of apatites from some ultra-alkaline Italian rocks. Eur. J. Mineral. 1995, 7, 391–402. [Google Scholar] [CrossRef] [Green Version]
  5. Comodi, P.; Liu, Y.; Stoppa, F.; Woolley, A. A multi-method analysis of Si-, S-, and REE-1ich apatite from a new find of kasilite-bearing leucite (Abruzzi, Italy). Mineral. Mag. 1999, 63, 661–672. [Google Scholar] [CrossRef]
  6. Nash, W.P. Apatite-calcite equilibria in carboantites: Chemistry of apatite from Iron Hill, Colorado. Geochim. Cosmochim. Acta 1972, 36, 1313–1319. [Google Scholar] [CrossRef]
  7. Le Bas, M.J.; Handley, C.D. Variation in apatite composition in ijiolitic and carbonatiticigneous rocks. Nature 1979, 279, 54–56. [Google Scholar] [CrossRef]
  8. Yardley, B.W.D. Apatite composition and the fugacities of HF and HCl in metamorphic fluids. Mineral. Mag. 1985, 49, 77–79. [Google Scholar] [CrossRef]
  9. Mishima, H.; Miake, Y.; Matsumoto, Y.; Hayakawa, T. Comparative Examination of Natural Apatite Crystal and Biological Apatite Crystal. J. Oral Tissue Eng. 2018, 16, 65–73. [Google Scholar]
  10. Liu, Y.; Comodi, P.; Stoppa, F. A very unusual compositional substitution in apatite from Kasilite foidite (Abruzzi, Italy): A multi method study. Terra Nova Abs 1998, 115, 36. [Google Scholar]
  11. Williams, S.; Cesbron, F. Rutile and apatite: Useful prospecting gui des for porphyry copperdeposits. Mineral. Mag. 1977, 41, 288–292. [Google Scholar] [CrossRef]
  12. Hogarth, D.D. Pyrochlore, Apatite and amphibole: Distinctive minerals in carbonatite. In Carbonatites-Genesis and Evolution; Reith, B., Ed.; Unwin Hyman Ltd.: London, UK, 1989. [Google Scholar]
  13. Hogarth, D.D.; Hartree, R.; Loop, J.; Solberg, T. Rare-earth element minerals in four carbonatites near Gatinau Quebec. Am. Mineral. 1985, 70, 1135–1142. [Google Scholar]
  14. McArthur, J.M. Francolite geochemistry-compositionalcontrols during fonmation, diagenesis, metamorphism and weathering. Geochim. Cosmochim. Acta 1985, 49, 23–35. [Google Scholar] [CrossRef]
  15. Gilinskaya, L.G.; Mashkovtsev, R.I. Blue and green centers in natural apatites by ERS and optical spectroscopy data. J. Struct. Chem. 1995, 36, 76–86. [Google Scholar] [CrossRef]
  16. Gaft, M.; Panczer, G.; Reisfeld, R.; Uspensky, E. Laser-induced time-resolved luminescence as a tool for rare-earth element identification in minerals. Phys. Chem. Miner. 2001, 28, 347–363. [Google Scholar] [CrossRef]
  17. Gruber, J.B.; Zandi, B.; Seltzer, M.D. Spectra and Energy Levels of Trivalent Holmium in Strontium Fluorapatites. J. Appl. Phys. 1997, 81, 7506–7513. [Google Scholar] [CrossRef]
  18. DeLoach, L.D.; Payne, S.A.; Kway, W.L.; Tassano, J.B.; Dixit, S.N.; Krupke, W.F. Vibrational structure in the emission spectra of Yb3+-doped apatite crystals. J. Lumin. 1994, 62, 85–94. [Google Scholar] [CrossRef]
  19. Owens, C.L.; Nash, G.R.; Hadler, K.; Fitzpatrick, R.S.; Anderson, C.G.; Wall, F. Apatite enrichment by rare earth elements: A review of the effects of surface properties. Adv. Colloid Interface Sci. 2019, 265, 14–28. [Google Scholar] [CrossRef] [PubMed]
  20. Waychunas, G.A. Apatite Luminescence. Rev. Mineral. Geochem. 2002, 48, 701–742. [Google Scholar] [CrossRef]
  21. Delaunay, A.; Fritsch, E. A natural diamond showing a “synthetic” pattern in the DiamondView. J. Gemmol. 2014, 34, 107–108. [Google Scholar]
  22. Yuan, P.; Xu, B.; Wang, Z.; Liu, D. A Study on Apatite from Mesozoic Alkaline Intrusive Complexes, Central High Atlas, Morocco. Crystals 2022, 12, 461. [Google Scholar] [CrossRef]
  23. Liu, X.; Zhang, H.; Tang, Y.; Liu, Y. REE Geochemical Characteristic of Apatite: Implications for Ore Genesis of the Zhijin Phosphorite. Minerals 2020, 10, 1012. [Google Scholar]
  24. Yang, Y.-H.; Wu, F.-Y.; Yang, J.-H.; Chew, D.M.; Xie, L.-W.; Chu, Z.-Y.; Zhang, Y.-B.; Huang, C. Sr and Nd isotopic compositions of apatite reference materials used in U–Th–Pb geochronology. Chem. Geol. 2014, 385, 35–55. [Google Scholar] [CrossRef]
  25. McDonough, W.F.; Sun, S.-S. The composition of the Earth. Chem. Geol. 1995, 120, 223–253. [Google Scholar] [CrossRef]
  26. Blanc, P.; Baumer, A.; Cesbron, F.; Ohnenstetter, D.; Panczer, G.; Rémond, G. Systematic cathodoluminescence spectral analysis of synthetic doped minerals: Anhydrite, apatite, calcite, fluorite, scheelite and zircon. In Cathodoluminescence in Geosciences; Springer: Berlin/Heidelberg, Germany, 2000; pp. 127–160. [Google Scholar]
  27. Gaft, M.; Reisfeld, R.; Panczer, G.; Blank, P.; Boulon, G. Laser-induced time-resolved luminescence of minerals. Spectrochim. Acta Part A Mol. Biomol. Spectrosc. 1998, 54, 2163–2175. [Google Scholar] [CrossRef]
  28. Tachihante, M.; Zambon, D.; Cousseins, J.C. Optical study of the Tb3+ to Eu3+ energy transfer in calcium fluorapatite. Eur. J. Solid State Inorg. Chem. 1996, 33, 713–725. [Google Scholar]
  29. Morozov, A.; Morozova, L.; Trefilov, A.; Feofilov, P. Spectral and luminescent characteristics of fluorapatite single crystals activated by rare earth ions. Opt. Spektrosk. 1970, 29, 590–596. [Google Scholar]
  30. Mitchell, R.H.; Xiong, J.; Mariano, A.N.; Fleet, M.E. Rare-earth-element-activated cathodoluminescence in apatite. Can. Mineral. 1997, 35, 979–998. [Google Scholar]
  31. Hughes, J.M.; Cameron, M.; Mariano, A.N. Rare-earth-element ordering and structural variations in natural rare-earth-bearing apatites. Am. Mineral. 1991, 76, 1165–1173. [Google Scholar]
  32. Chenot, C.F.; Kasenga, A.F.; Pappalardo, R.E. Depreciation in cerium-activated fluorapatite phosphors. J. Lumin. 1981, 24, 95–98. [Google Scholar] [CrossRef]
  33. Barbarand, J.; Pagel, M. Cathodoluminescence study of apatite crystals. Am. Mineral. 2001, 86, 473–484. [Google Scholar] [CrossRef]
Figure 1. G-1 (Green), BG-1 (Bluish-Green) and B-1 (Blue)apatite samples.
Crystals 12 00866 g001
Figure 2. Relative spectral power distribution of Xe lamps and D65 light sources.
Crystals 12 00866 g002
Figure 3. G-1, BG-1, and B-1 apatite fluorescence phenomena. Color under D65 (first row); Color observed in DiamondView fluorescence (second row).
Crystals 12 00866 g003
Figure 4. (a) 3D fluorescence projection map of G-1 apatite, (b) 3D fluorescence contour map (Different colors are used to visualize the intensity of the fluorescence), (c) sample emission spectrum, (d) sample excitation spectrum.
Crystals 12 00866 g004
Figure 5. (a) 3D fluorescence projection of BG-1 apatite, (b) 3D fluorescence contour map of sample (Different colors are used to visualize the intensity of the fluorescence), (c) sample emission spectrum, (d) sample excitation spectrum.
Crystals 12 00866 g005
Figure 6. (a) 3D fluorescence projection map of blue apatite, (b) 3D fluorescence contour map of the sample (Different colors are used to visualize the intensity of the fluorescence), (c) sample emission spectrum, (d) sample excitation spectrum.
Crystals 12 00866 g006
Figure 7. (a) Partial 3D fluorescence projection map of B-1 apatite, (b) partial 3D fluorescence contour map of sample (Different colors are used to visualize the intensity of the fluorescence), (c) partial emission spectrum of sample, (d) partial excitation spectrum of sample.
Crystals 12 00866 g007
Figure 8. Normalized rare-earth element distribution map of apatite. Chondrite values come from McDonough and Sun (1995) [25].
Crystals 12 00866 g008
Figure 9. (a) 3D fluorescence fitting diagram of three apatites, (b) emission spectra of the strongest peaks of the three apatites, (c) excitation spectra of the strongest peaks of the three apatites.
Crystals 12 00866 g009
Figure 10. (a) Partial 3D fluorescence fitting diagram of three apatites, (b) partial emission spectra of three apatites, (c) partial excitation spectra of three apatites.
Crystals 12 00866 g010
Figure 11. (a) Fluorescence color coordinates of G-1, (b)fluorescence color coordinates of BG-1, (c) fluorescence color coordinates of B-1.
Crystals 12 00866 g011
Table 1. Content of rare-earth elements in apatite samples.
ElementG-1 (ppm)BG-1 (ppm)B-1 (ppm)
La1411.061978.332064.18
Ce3288.744031.554155.61
Pr386.89424.70442.98
Nd1474.821498.921572.04
Sm220.76207.91219.60
Eu32.2329.1830.48
Gd137.21125.17130.63
Tb13.8512.1313.03
Dy68.2659.8360.99
Ho11.669.6510.09
Er29.3224.8826.23
Tm3.402.913.03
Yb19.2916.2416.86
Lu2.492.412.40
Table 2. Fluorescence color coordinates of G-1.
Excitation WavelengthxyDominant WavelengthPeColor
4000.5000.33261050.63Yellowish Pink
4500.6040.38559796.85Orange
4700.5980.38659794.88Orange
Table 3. Fluorescence color coordinates of BG-1.
Excitation WavelengthxyDominant WavelengthPeColor
3100.2560.20245441.54Purple
4000.4600.32861337.71Yellowish Pink
4500.5840.37759888.35Orange
4700.5880.39359594.54Orange
Table 4. Fluorescence color coordinates of B-1.
Excitation WavelengthxyDominant WavelengthPeColor
3300.2300.12340663.65Purplish Blue
4000.3570.258529 *33.41Purplish Pink
4500.5480.38759481.31Orange
4700.5470.42658892.6Orange
* Complementary wavelength.
Publisher’s Note: MDPI stays neutral with regard to jurisdictional claims in published maps and institutional affiliations.

