Article

Experimental Studies on Mechanical Properties and Microscopic Mechanism of Marble Waste Powder Cement Cementitious Materials

1
School of Civil and Hydraulic Engineering, Ningxia University, Yinchuan 750021, China
2
Ningxia Center for Research on Earthquake Protection and Disaster Mitigation in Civil Engineering, Yinchuan 750021, China
3
School of Architecture and Electrical Engineering, Hezhou University, Hezhou 542899, China
4
Guangxi Key Laboratory of Disaster Prevention Mitigation and Engineering Safety, Nanning 530004, China
5
School of Civil and Architectural Engineering, Guilin University of Technology, Guilin 541004, China
*
Author to whom correspondence should be addressed.
Crystals 2022, 12(6), 868; https://doi.org/10.3390/cryst12060868
Submission received: 10 May 2022 / Revised: 5 June 2022 / Accepted: 14 June 2022 / Published: 19 June 2022
(This article belongs to the Special Issue Geopolymer Composites)

Abstract

:
The resource utilization of waste stone powder is a meaningful way to realize sustainable development. This paper aims to study the influence of marble waste powder particle size and replacement cement dosage on the mechanical properties of cementitious materials and evaluate its microstructure and mineral characterization by SEM and XRD. The results show that the early strength of cementitious materials is obviously improved when the dosage of marble waste powder is in the range of 0–15%, and the lifting effect of marble waste powder with a particle size of 600 mesh instead of cement on the strength and microstructure of cementitious materials is the most obvious. The replacement of cement with different particle sizes of marble waste powder found that it had low chemical activity and participated in the hydration reaction of cement, but the reaction degree was low. The smaller the particle size of marble waste powder instead of cement, the denser the early microstructure, the more obvious the nucleation phenomenon, and the more serious the agglomeration between particles. In addition, the mechanism model of marble waste powder replacing cement cementitious materials was proposed. The strength prediction function model between the material dosage and compressive strength was constructed, and the accuracy of the model was verified.

1. Introduction

As one of the world’s most widely utilized technical building materials, silicate cement has garnered considerable attention for its energy consumption and environmental impact [1]. Marble has a poor usage and utilization rate due to the high quantity of waste powder generated during the mining and processing of natural resources. The treatment methods are mostly landfill or stacking, which wastes resources and pollutes the environment. Therefore, making full use of its resource value to replace cement with marble waste powder in cement-based materials reduces the energy consumption and cost of cement production and has a positive effect on environmental protection and economic benefits [2,3]. It will also become one of the crucial ways to solve the problems in developing the cement and marble industry and realize green and sustainable development [4,5,6].
In recent years, relevant scholars have researched the microscopic mechanism, physical and mechanical properties, and cement production of marble powder in cement-based materials. For marble powder in the cement production process, Hamdy et al. [7] found that, in cement, clinker burning with 5% marble powder will not affect the performance. However, the process of marble powder consumption is less but also produces a lot of energy consumption. Therefore, some scholars have studied the direct substitution of marble powder for cement. The research of Belaidi et al. [8], Corinaldesi et al. [9], and Natarajan et al. [10] found that, after replacing cement with marble powder, CaCO3 in marble powder can accelerate the early hydration of C3S and react with cement, which can prevent the transformation of ettringite to AFm. Replacing marble powder with a cement content of about 10% can improve the mechanical properties of concrete. Xiao et al. [11] studied the influence of marble powder replacing cement on the fluidity, strength, and shrinkage of cementitious materials. It was found that the strength of cement mortar increased first and then decreased with the increase of the marble powder content. When the replacement cement content was 5%, the flexural strength and compressive strength were the largest. The later strength decreased gradually with the increase of marble powder replacing the cement content, and the strength law was not uniform [12]. References [13,14] studied the effects of particle size of marble powder and replacement cement content on the rheological properties of cementitious material slurry and found that the yield stress and plastic viscosity coefficient of slurry increased with the increase of fineness of the marble powder, indicating that the effect of replacement cement with different particle sizes of marble powder on the rheological properties of slurry was more obvious. Valdez et al. [15] used marble powder and limestone powder to replace 30% cement to configure self-compacting concrete, and the effects of two kinds of limestone powder on the mechanical properties were basically the same. However, using marble and granite debris as a concrete admixture, it was found that a replacement cement content of 5% had little effect on the mechanical properties and flow performance. The chemical analysis showed that the two kinds of admixtures were inactive substances and only played a filling role, but marble and granite debris can be used to replace cement [16]. In addition, Ergun [17] found that, when 5% marble powder was used to replace cement with plasticizer, the compressive strength was higher than that of the control group. The maximum compressive strength and flexural strength were obtained by adding 10% diatomite and 5% marble powder. Muhammad et al. [18] used marble powder instead of cement in concrete. The study found that a replacement amount of 10% can increase the strength of concrete. Li et al. [19] found that, under different water–cement ratios, when the dosage of marble waste powder replacing cement was 5%, the mechanical properties increased, and the dosage of marble powder replacing cement could be controlled within 10% [12,20]. However, Rodrigues et al. [21] studied the replacement of cement concrete with 0%, 5%, 10%, and 20% marble powder and found that its mechanical properties decreased, and a replacement rate of less than 10% can meet the specification requirements. In summary, in previous studies, the effect of marble powder replacing the cement dosage on the strength and microscopic mechanism of cement-based materials was mainly considered, and the findings were inconsistent. However, the effects of different particle sizes of marble powder replacing cement on the mechanical properties and microscopic mechanism of cementitious materials were not studied.
In this study, the aim was to explore the effects of three different marble waste powder particle sizes and substitution cement dosages on the mechanical properties, microstructure, and hydration product composition of cementitious materials; putting forward a mechanism model of marble waste powder replacing cement cementitious materials; and constructing a strength prediction function model between the material dosage and compressive strength to provide a reference for promoting the application of marble waste powder in practical engineering.

2. Experimental Section
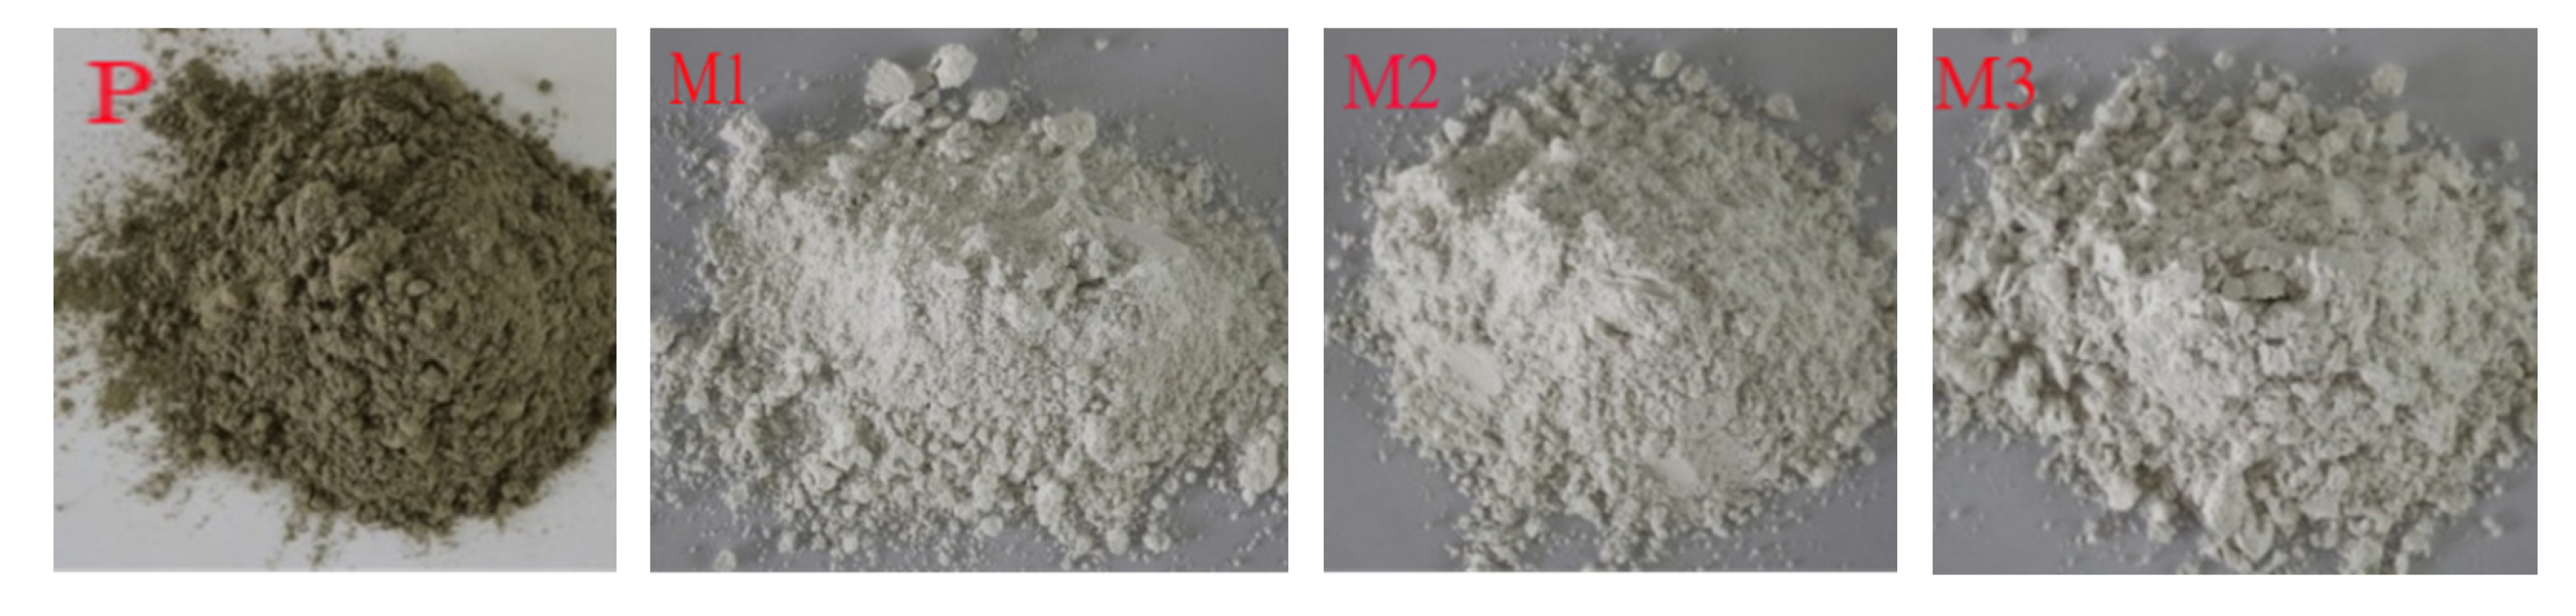
2.1. Raw Materials

Test cement selected was Runfeng PO 42.5 cement produced by a cement plant in Huarun(Hezhou, China), denoted as P; marble waste powder from a marble mining area produced powder(Hezhou, China), denoted as M; the three particle sizes were 3000 mesh (0.0052 mm), 600 mesh (0.023 mm), and 400 mesh (0.038 mm), which are denoted as M1, M2, and M3. The raw material test samples are shown in Figure 1, and the XRD patterns(PANalytical B.V., Almelo, Netherlands) are shown in Figure 2. The particle size distribution characteristics of the material samples are shown in Table 1, and the particle size distribution curve is shown in Figure 3. The chemical components of the cement and marble waste powder materials are shown in Table 2. The test water was tap water.

2.2. Mix Ratio Design

The particle size and dosage of marble waste powder were used as parameters in the experiment. Eight groups of experiments were designed. Group P was used as the control group of the pure cement hydration test. Group PJ was the standard cement mortar. The microscopic test groups of marble waste powder replacing cement were PM1, PM2, and PM3. The test groups for marble waste powder replacing cement mortar were P + M1, P + M2, and P + M3. In the test design group, the water–binder ratio was 0.5, and the binder included cement and marble waste powder.

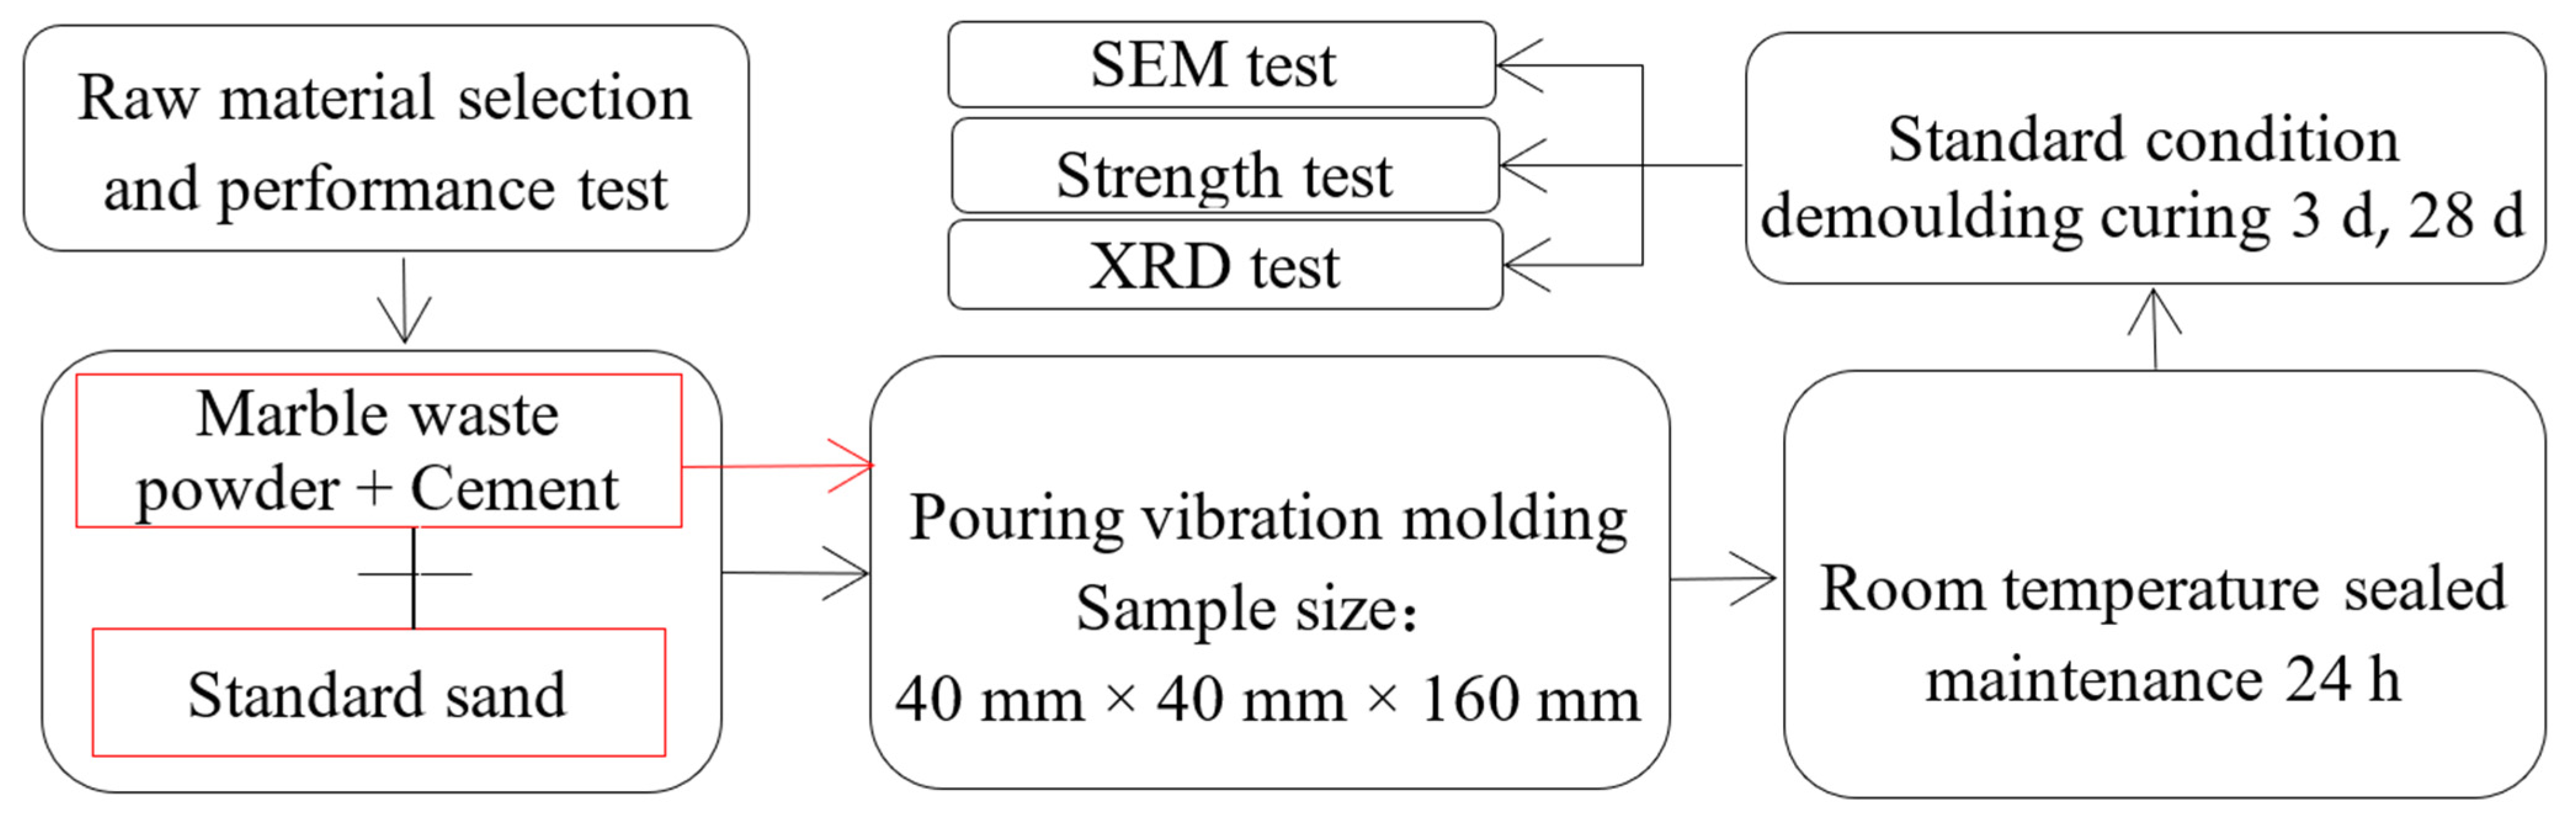
2.3. Test Design and Sample Preparation

The test samples were prepared according to the requirements of standard water consumption of cement, setting time, stability test method (GB/T1346-2011), and strength test method of the cement mortar (ISO method) (GB/T17671-1999) [22,23]. The test design and sample preparation process are shown in Figure 4. According to the test mix ratio (Table 3) and test requirements, test numbers 1–4 each test the mix ratio to prepare 2 samples for a total of 8 samples, and test numbers 5–20 each test the mix ratio to prepare 6 samples for a total of 90 samples.

2.4. Test Method

2.4.1. Mechanical Performance Test

The mortar strength test adopts the YEB-300 universal testing machine (Jinan Hengsishengda Instrument Co., Ltd., Jinan, China), according to the cement mortar strength test method (ISO method) (GB/T50081-2002) [23] specification requirements. During the loading process, the specimens’ compressive strength and flexural strength were tested at a uniform and continuous loading rate of 0.02–0.05 MPa/s for 3 d and 28 d. The strength of each group of specimens was measured by the average value of the parallel test blocks.

2.4.2. Micro-Performance Test

The phase analysis and microstructure test were carried out by a X’Pert PRO MPD X-ray diffractometer (PANalytical B.V., Almelo, NLD) and SUS8020 field emission scanning electron microscope (Hitachi Limited, Tokyo, Japan). Sample preparation: First, the experimental design groups 1 and 2 samples were cured for 3 d and 28 d to remove the skin, the core was removed, and anhydrous ethanol was used to terminate the hydration reserve. About 100 g of samples were dried, and then, the samples were ground with agate mortar through a 0.08-mm square hole sieve for the XRD test. After drying, the block samples were processed into 2-mm thin slices, and the samples were pasted on the test bench and put into the gold spraying instrument to spray gold, and then, the microstructure was tested.

3. Results and Discussions

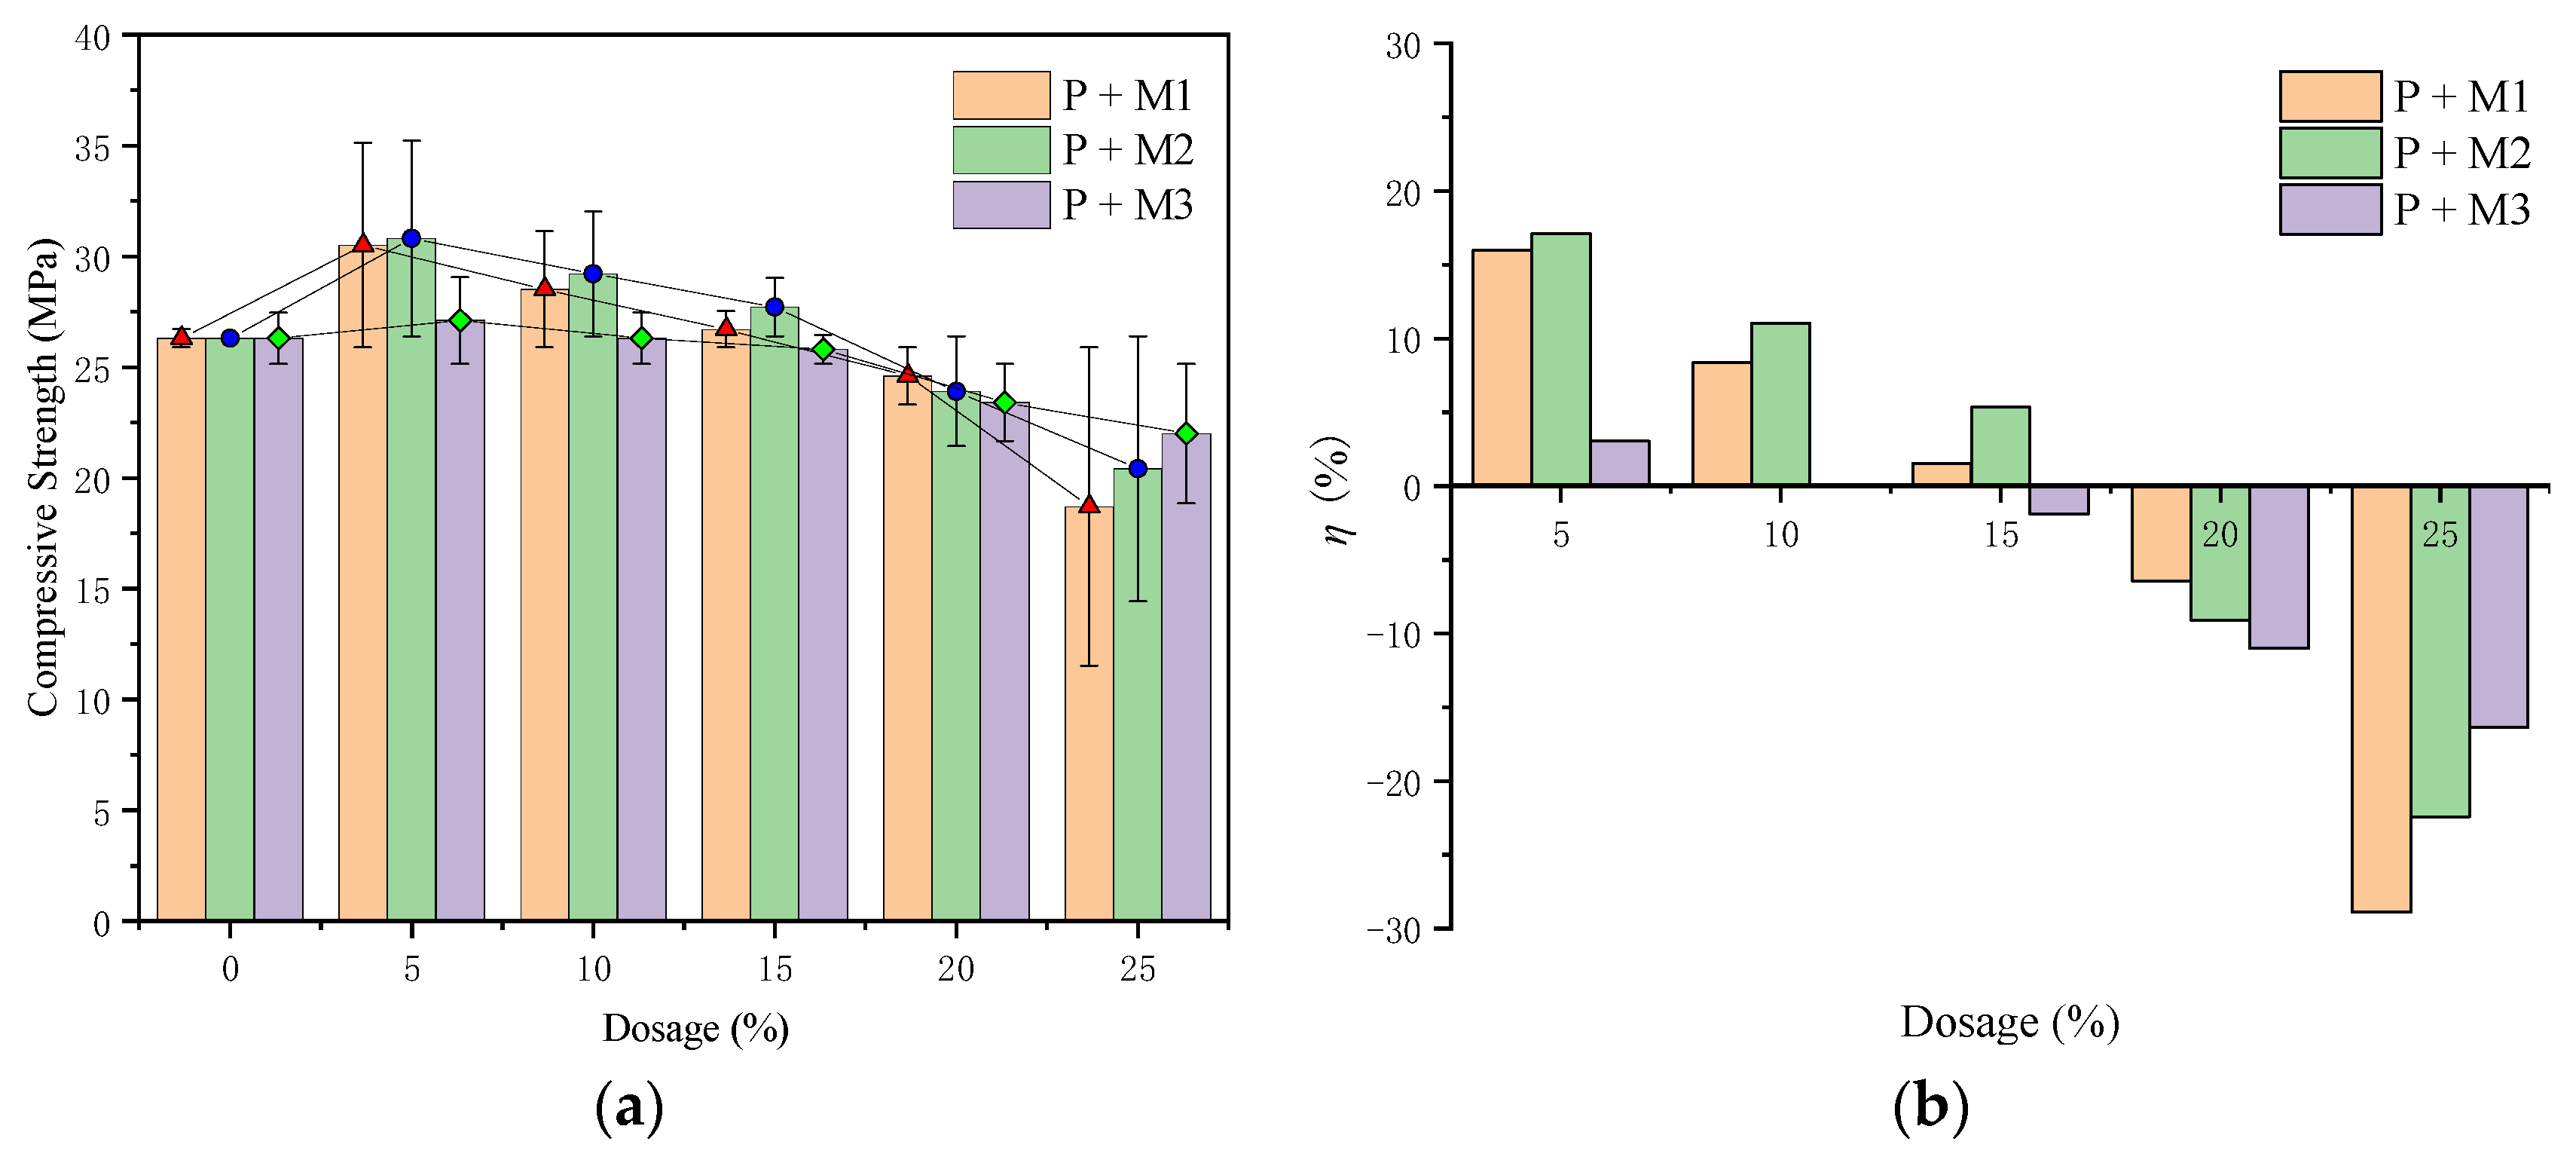
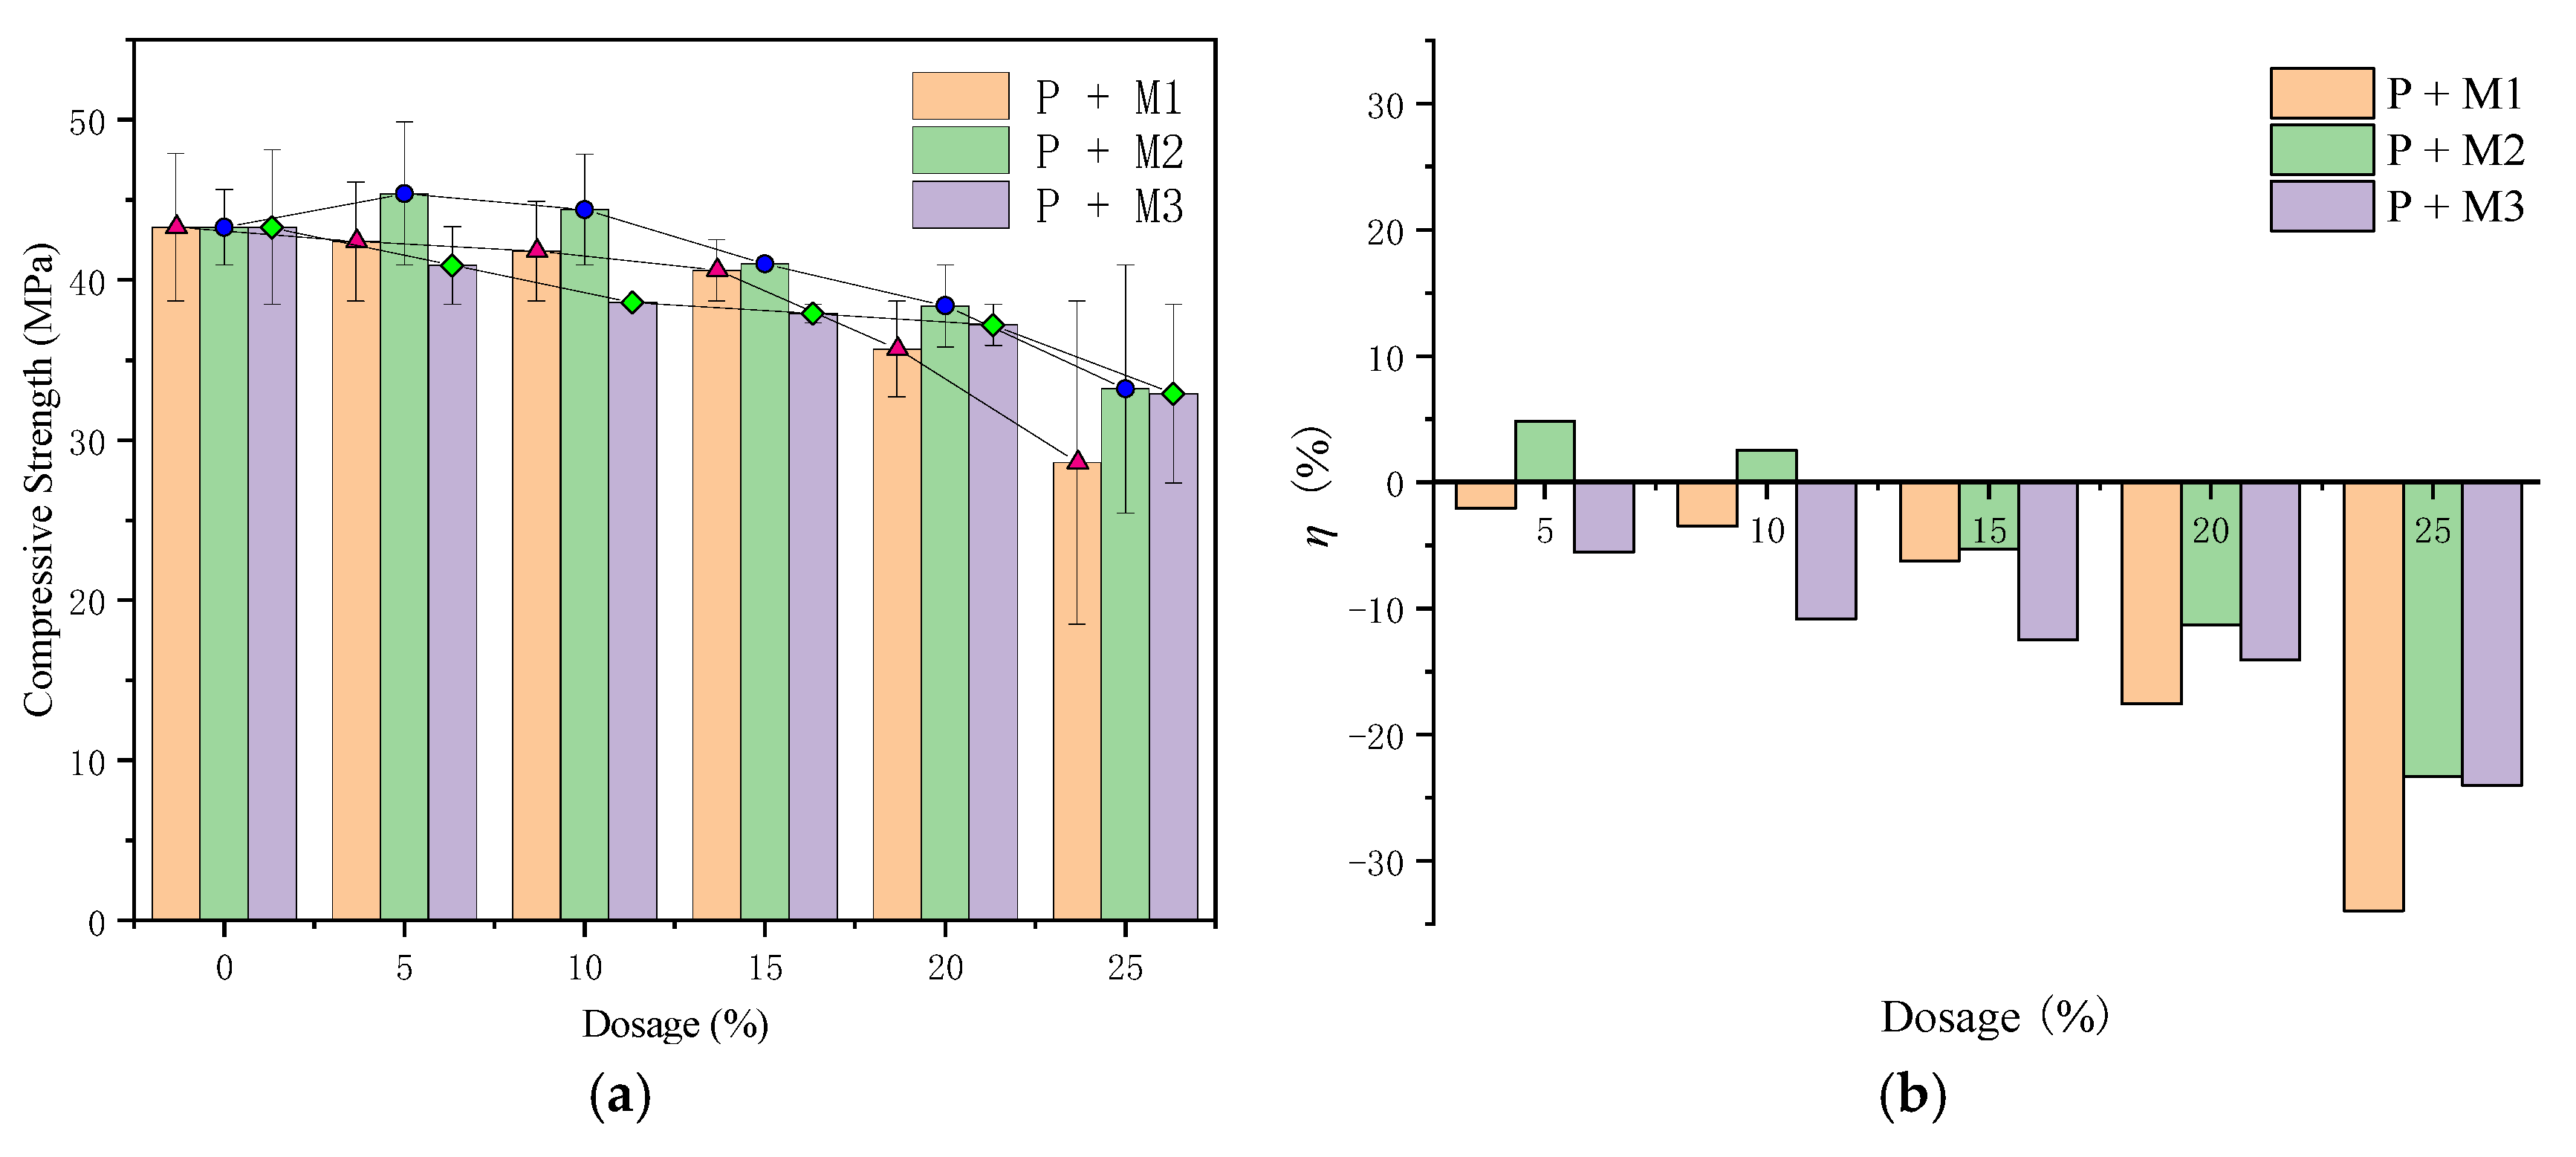
3.1. Results of the Compressive Strength

In order to further reveal the effect of marble waste powder on cementitious materials, the efficiency η of marble waste powder on cementitious materials was defined, reflecting the effect of marble waste powder on the strength improvement of the cementitious materials.
η = W / P
where η denotes the efficiency of marble waste powder on cementitious materials, W denotes the strength change value of the cementitious material compared with the strength of the test piece, unit in Mpa, and P denotes the strength of the comparison specimen, unit in Mpa.
Figure 5 and Figure 6 are the results of 3 d and 28 d of compressive strength. The results show that the compressive strength of all the specimens increased with the increase of the curing time. With the increase in dosage, the 3 d strength first increased and then decreased, and the test results were consistent with those of other scholars [11,24,25]. The 28 d strength P + M1 and P + M3 gradually decreased, while the variation law of P + M2 and the 3 d strength was similar, different from that in Reference [11]. It indicates that the effect of marble waste powder on cementitious materials is not only related to the dosage, but the particle size also has a significant influence on the specimen.
Figure 5 shows that, when the 3 d strength was less than or equal to 15%, the action efficiency of P + M1 and P + M2 was positive, which was increased compared with the strength of the sample, while the action efficiency of P + M3 was negative when the dosage was 15%. When the dosage was 5%, the efficiency of the specimen was the highest, and the maximum strength increased by 16%, 17%, and 3%, respectively. With the same dosage of P + M2, the efficiency was the highest, and the strength of the specimen was the highest. When the dosage was more than 15%, the efficiency of the specimen was negative, indicating that the strength of P + M1, P + M2, and P + M3 was lower than that of the comparative specimen. With the increase of dosage, the smaller the action efficiency value was, the greater the decreased amplitude of the specimen strength was, and the maximum compressive strength decreased by 29%, 22%, and 16%, respectively.
It can be seen from Figure 6 that, when the dosage of 28 d strength is less than or equal to 15%, the P + M2 action efficiency has a positive value, indicating that the strength increases compared with the strength of the comparative specimen, with a maximum increase of 5%, and the compressive strength of the specimen decreases. When the dosage >15%, the efficiency of the specimens was negative, and when the dosage was the same, the efficiency of the P + M2 specimen was the smallest; with the increase of the dosages of all the specimens, the strength reduction amplitude was more prominent, and the strength of P + M1, P + M2, and P + M3 specimens was reduced by 34%, 23%, and 24%, respectively.
The above analysis showed that, when the dosage was controlled within 15%, the marble waste powder had an obvious effect on improving the early compressive strength. A particle size of 600 mesh was more obvious for improving the early compressive strength of cementitious materials. With the increase of the dosage, the compressive strength weakened and deteriorated, and the greater the dosage, the stronger the weakening and deterioration of the strength. Within the scope of this study, under the condition of the same dosage, the 3 d and 28 d compressive strengths of the 600-mesh particle size specimen were better than that of the 3000-mesh and 400-mesh specimens. The main reason is that marble waste powder can promote cement hydration in cementitious materials, which is beneficial to early strength. The cement dosage decreased, the dilution effect was evident, and the strength weakened and deteriorated. The particle size of 600-mesh marble waste powder can better fill in between cement, optimize the structure of the cementitious material matrix, and improve the overall strength.

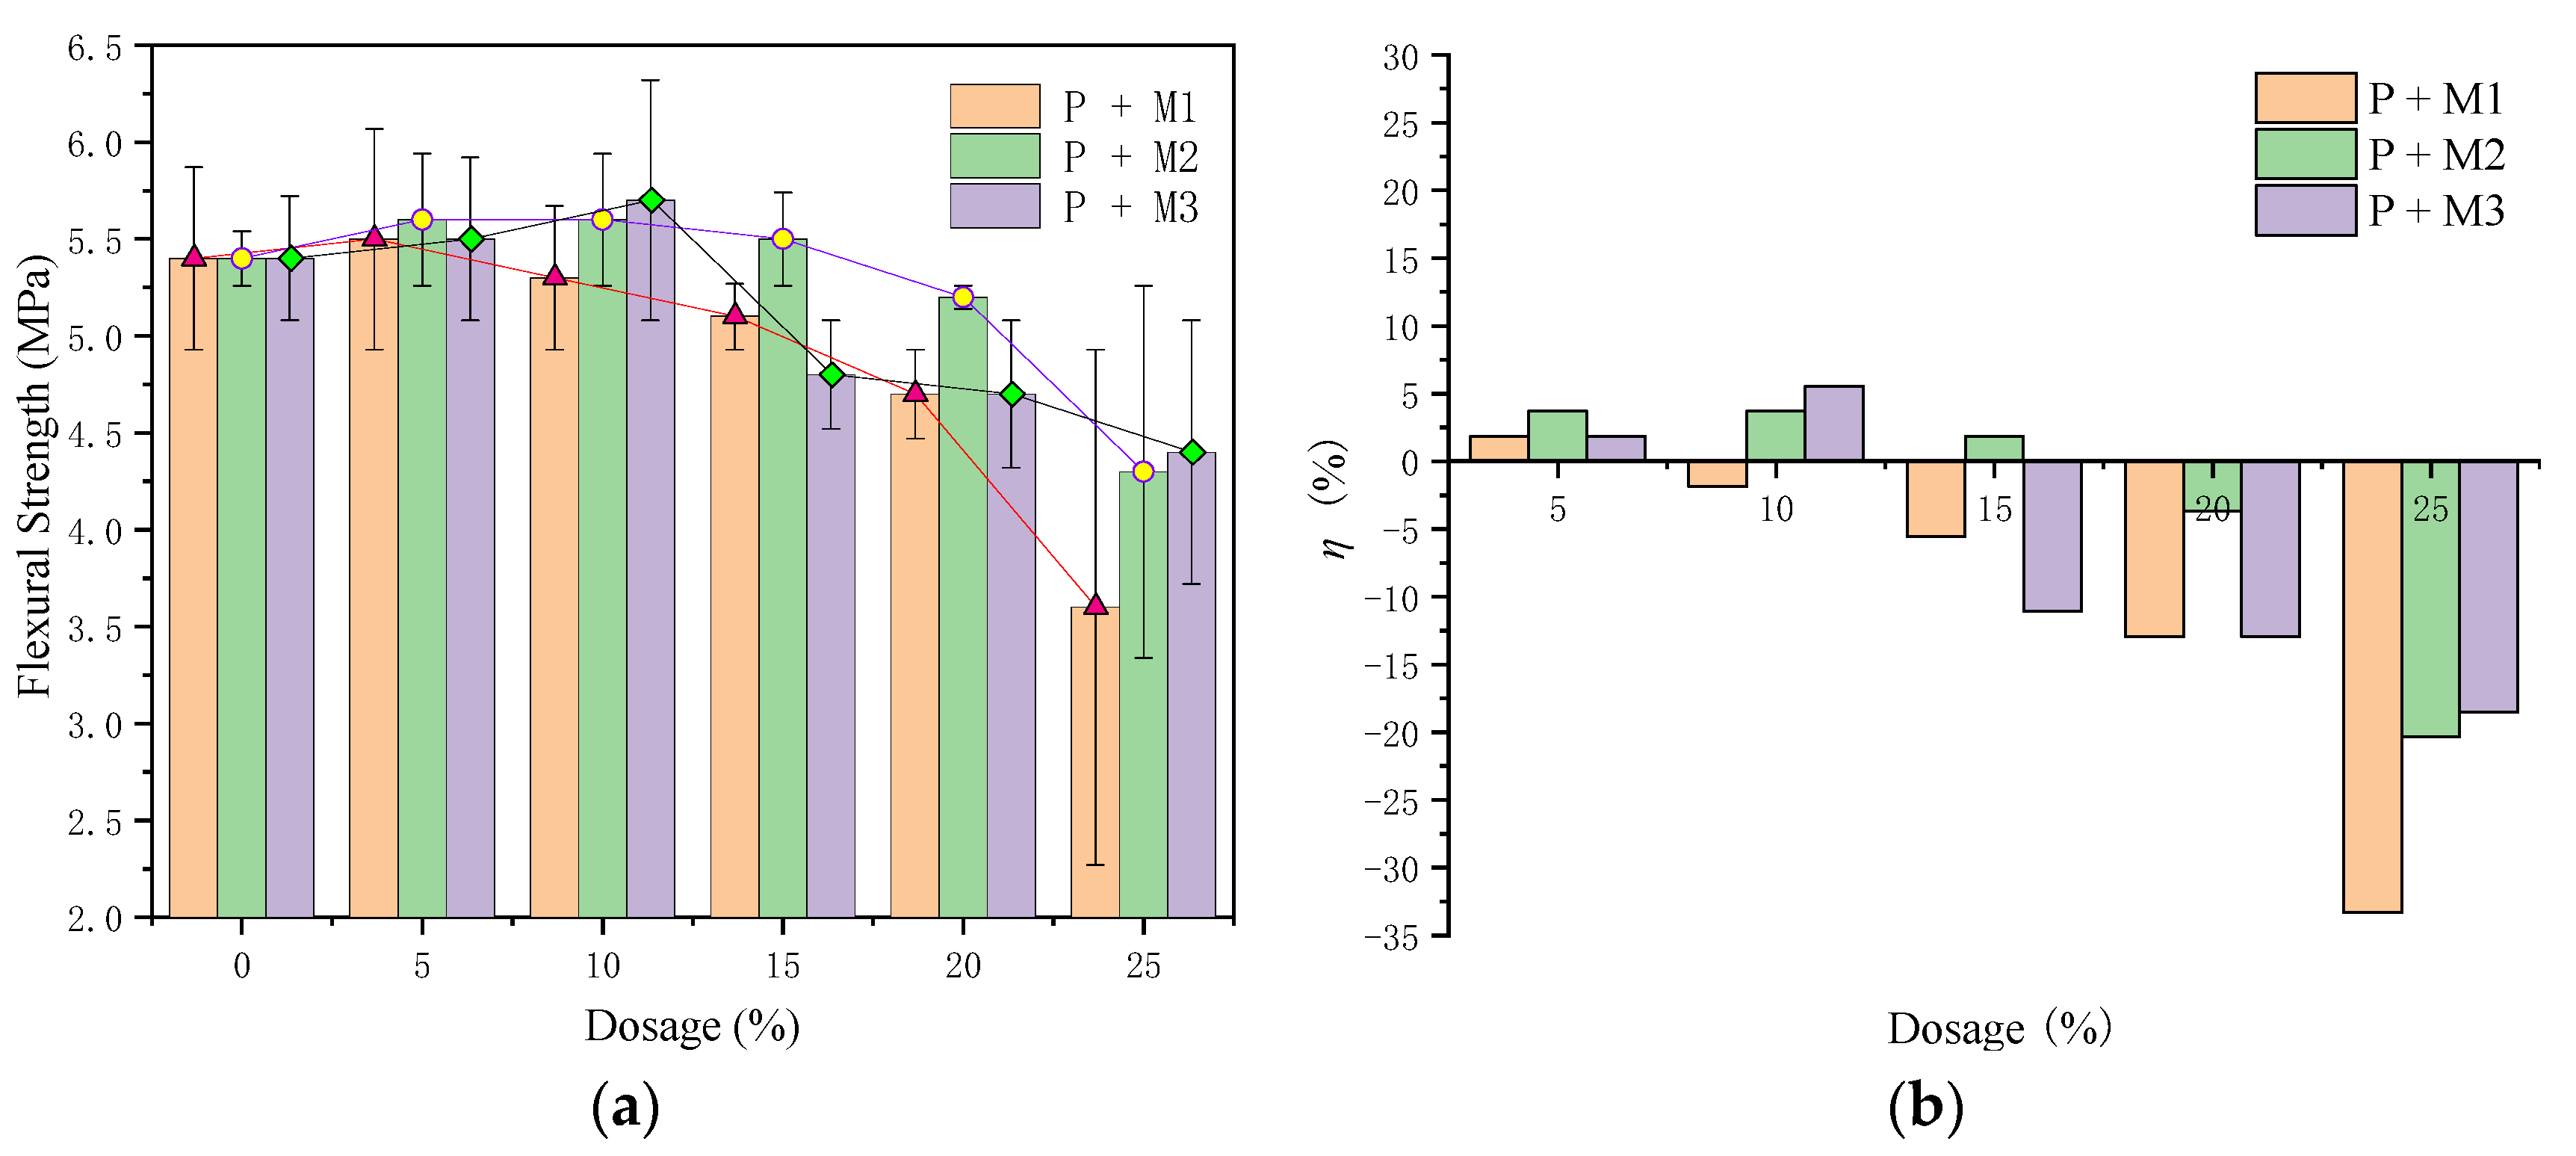
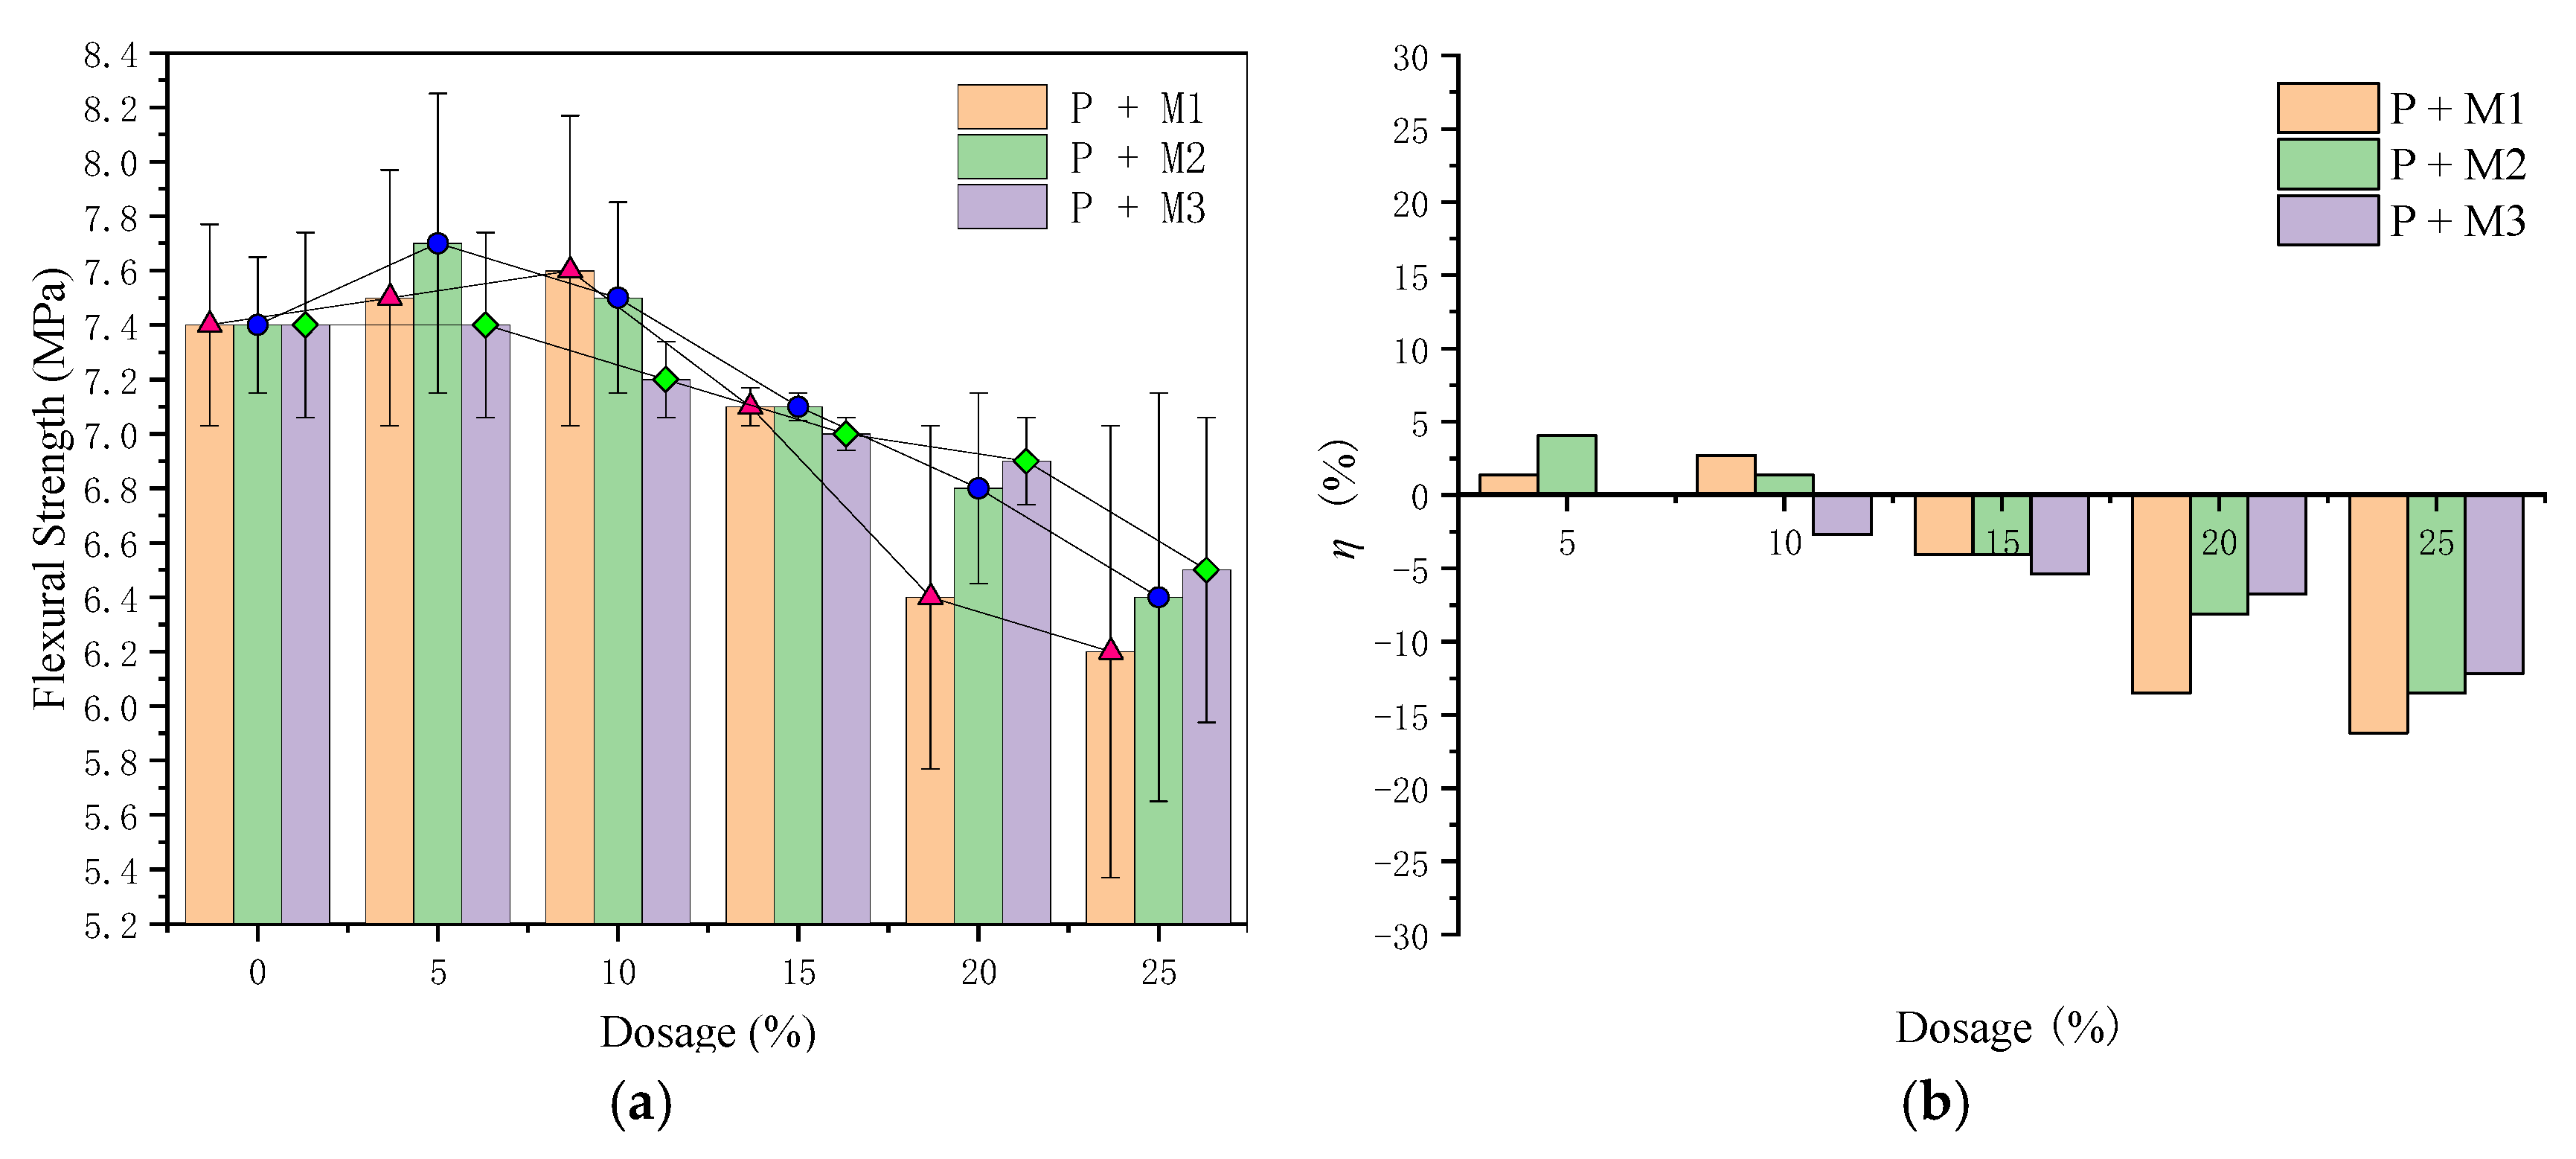
3.2. Results of the Flexural Strength

Figure 7 and Figure 8 are the results of 3 d and 28 d flexural strength, respectively. It can be seen that the influence of the particle size and dosage of marble waste powder on the flexural strength of the specimens was similar to the compressive strength, but there were also significant differences. According to Figure 7, with the increase in dosage, the 3 d flexural strength increased first and then decreased. When the dosage of the P + M1 specimen was 5%, the strength reached the maximum, which was 2% higher than that of the comparison specimen. For a dosage >5%, the strength was lower than the contrast specimen; when the dosage of the P + M2 and P + M3 specimens was 10%, the strength reached the maximum, which was 4% and 6% higher than that of the comparative specimens, respectively. It can be seen from Figure 8 that the 28 d flexural strength of the three groups of specimens and the flexural strength of the P + M1 and P + M2 specimens increased first and then decreased with the increase of the dosage. When the dosage was 10% and 5%, the increase was the largest, which was 3% and 4% higher than that of the specimens, respectively. When the dosage was 0–10%, the flexural strength of the specimens was higher than that of the comparative specimens. However, the strength of P + M3 was always lower than that of the comparative test with the increase in dosage. The larger the dosage was, the greater the amplitude of the strength reduction was. The different particle sizes of marble waste powder to replace cement, with dosages ≤15% of three groups of specimens 3 d to 28 d flexural strength change was relatively stable compared with the contrast specimen and met the standard (GB175-2007) of the 42.5 Portland cement flexural strength values; under the same dosage conditions, the flexural strength effect of marble waste powder with the particle size of 600 mesh on the cementitious material was more prominent.
The above analysis showed that, when marble waste powder replacing cement was ≤15%, the cementitious material met the flexural strength index of each age specified, and the dosage was >15%.

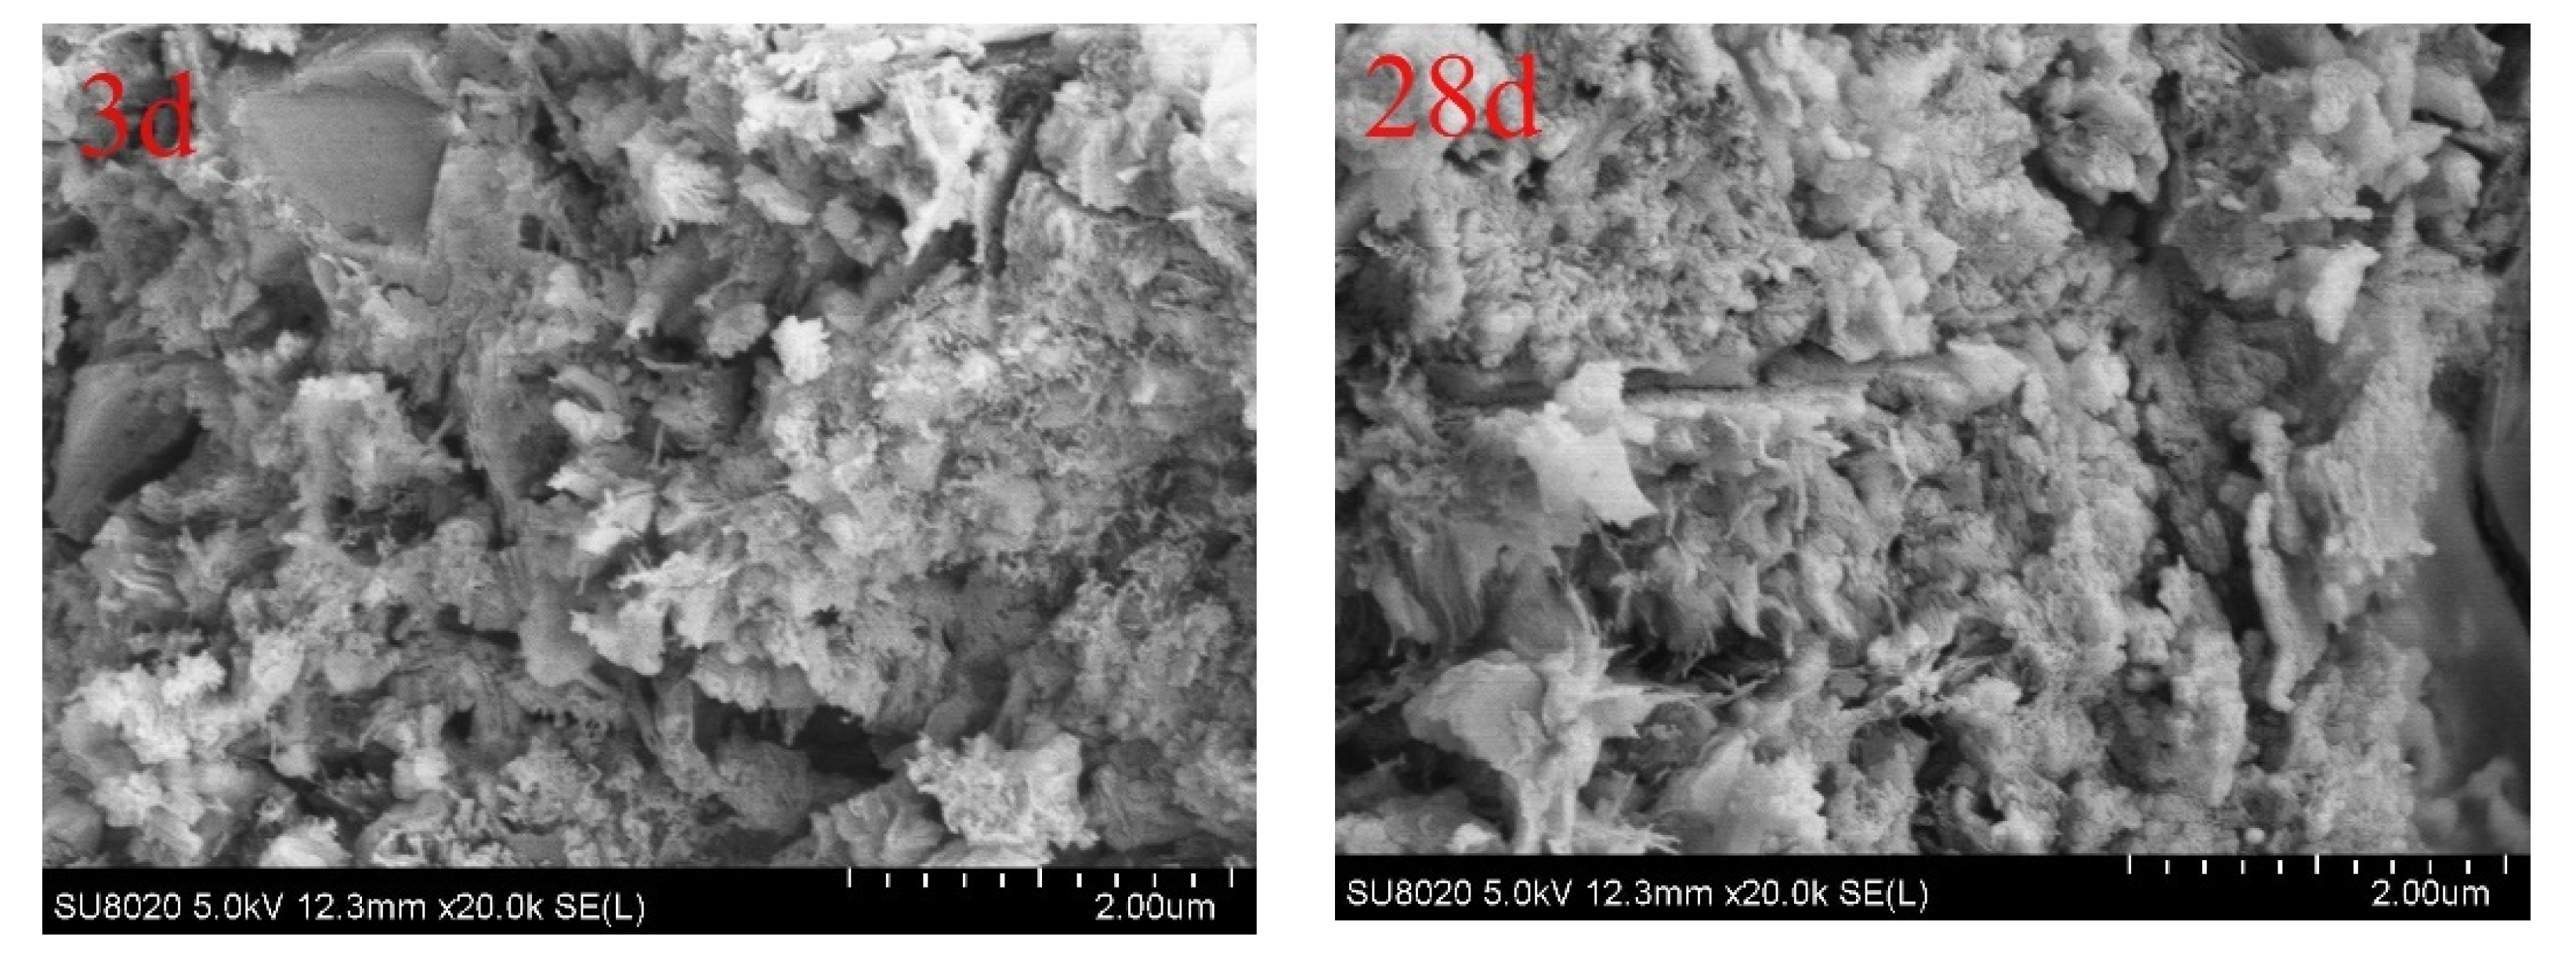
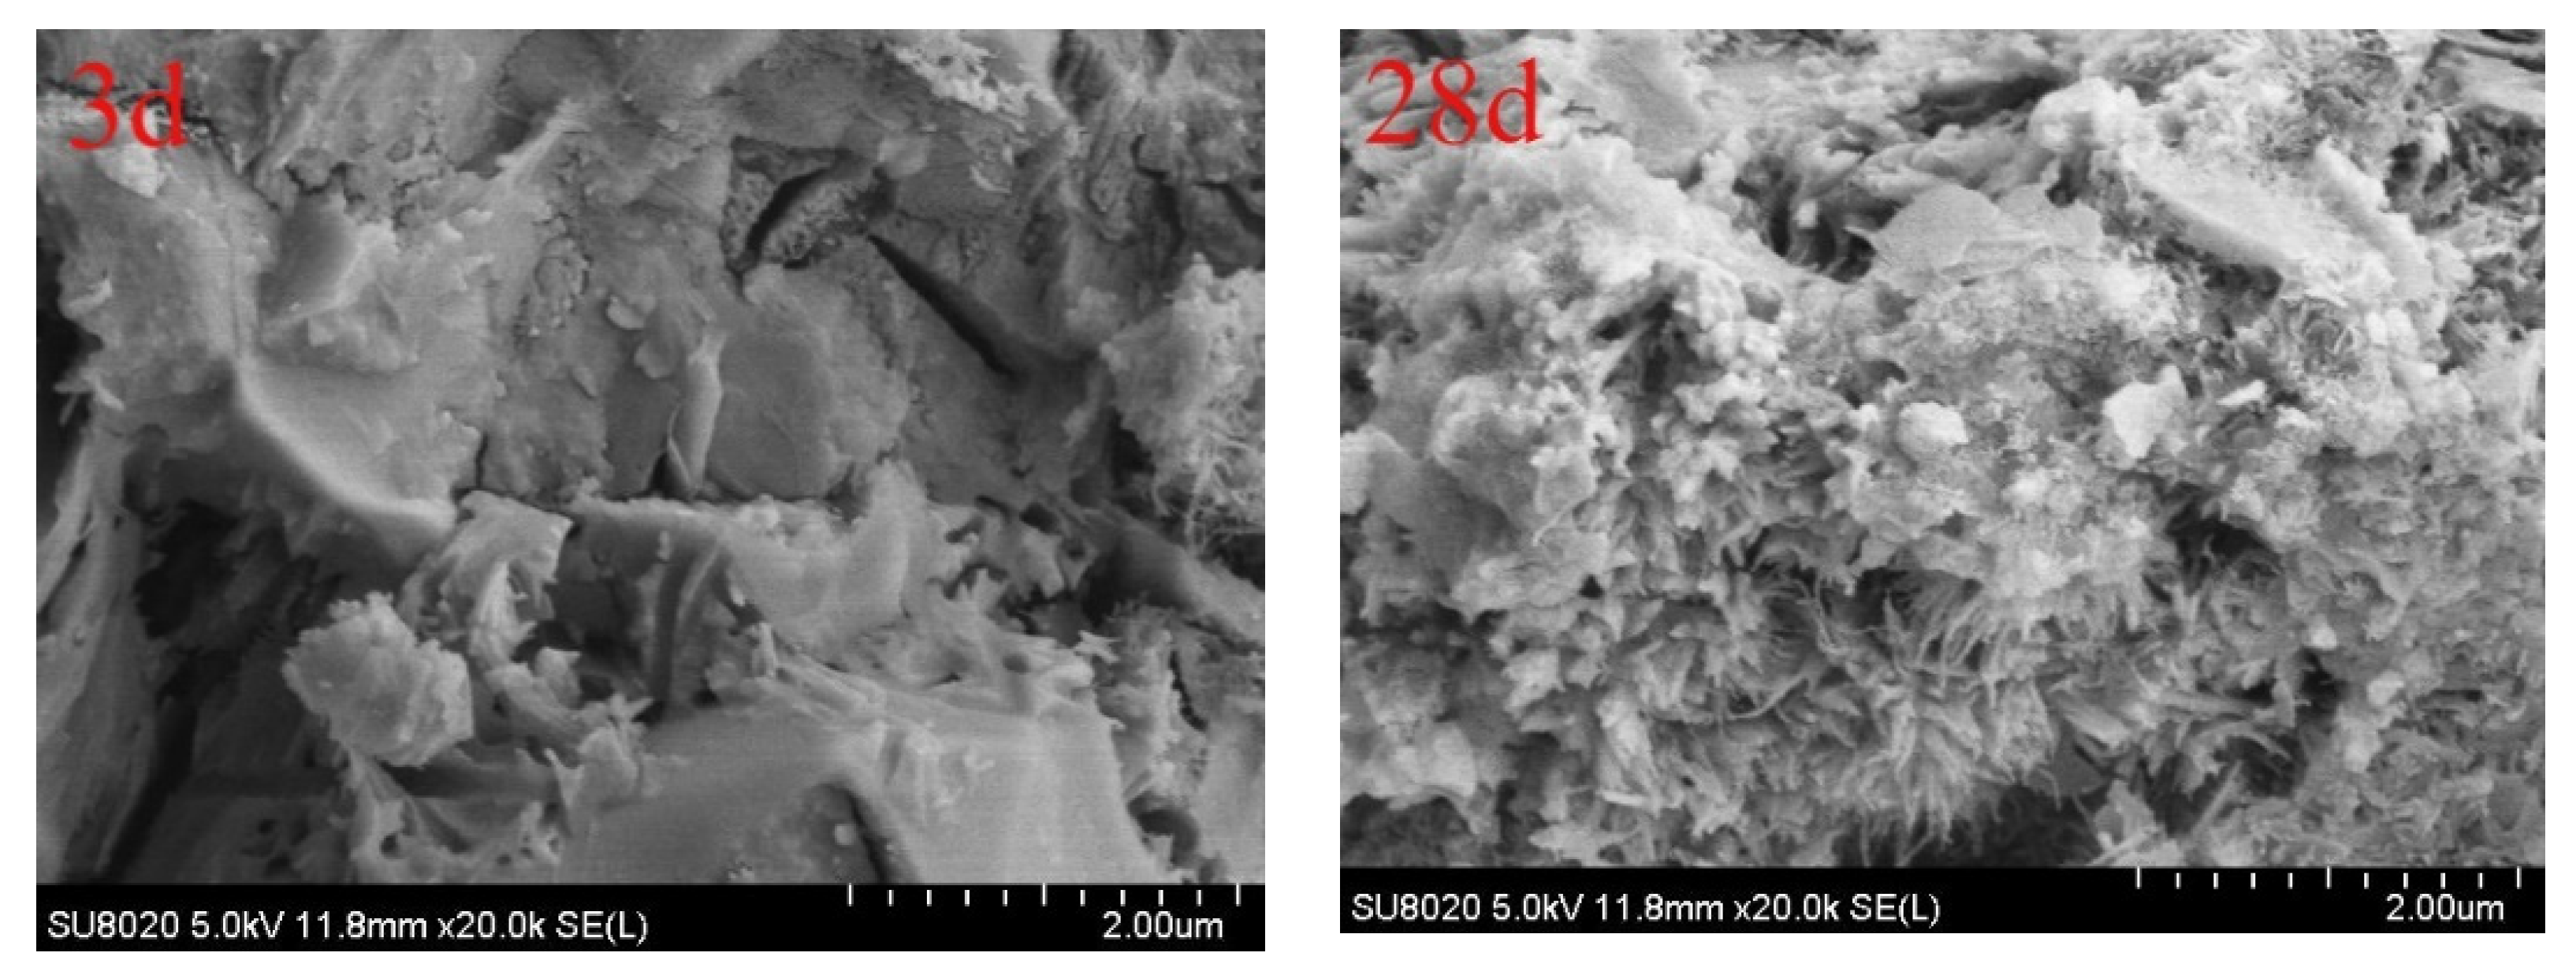
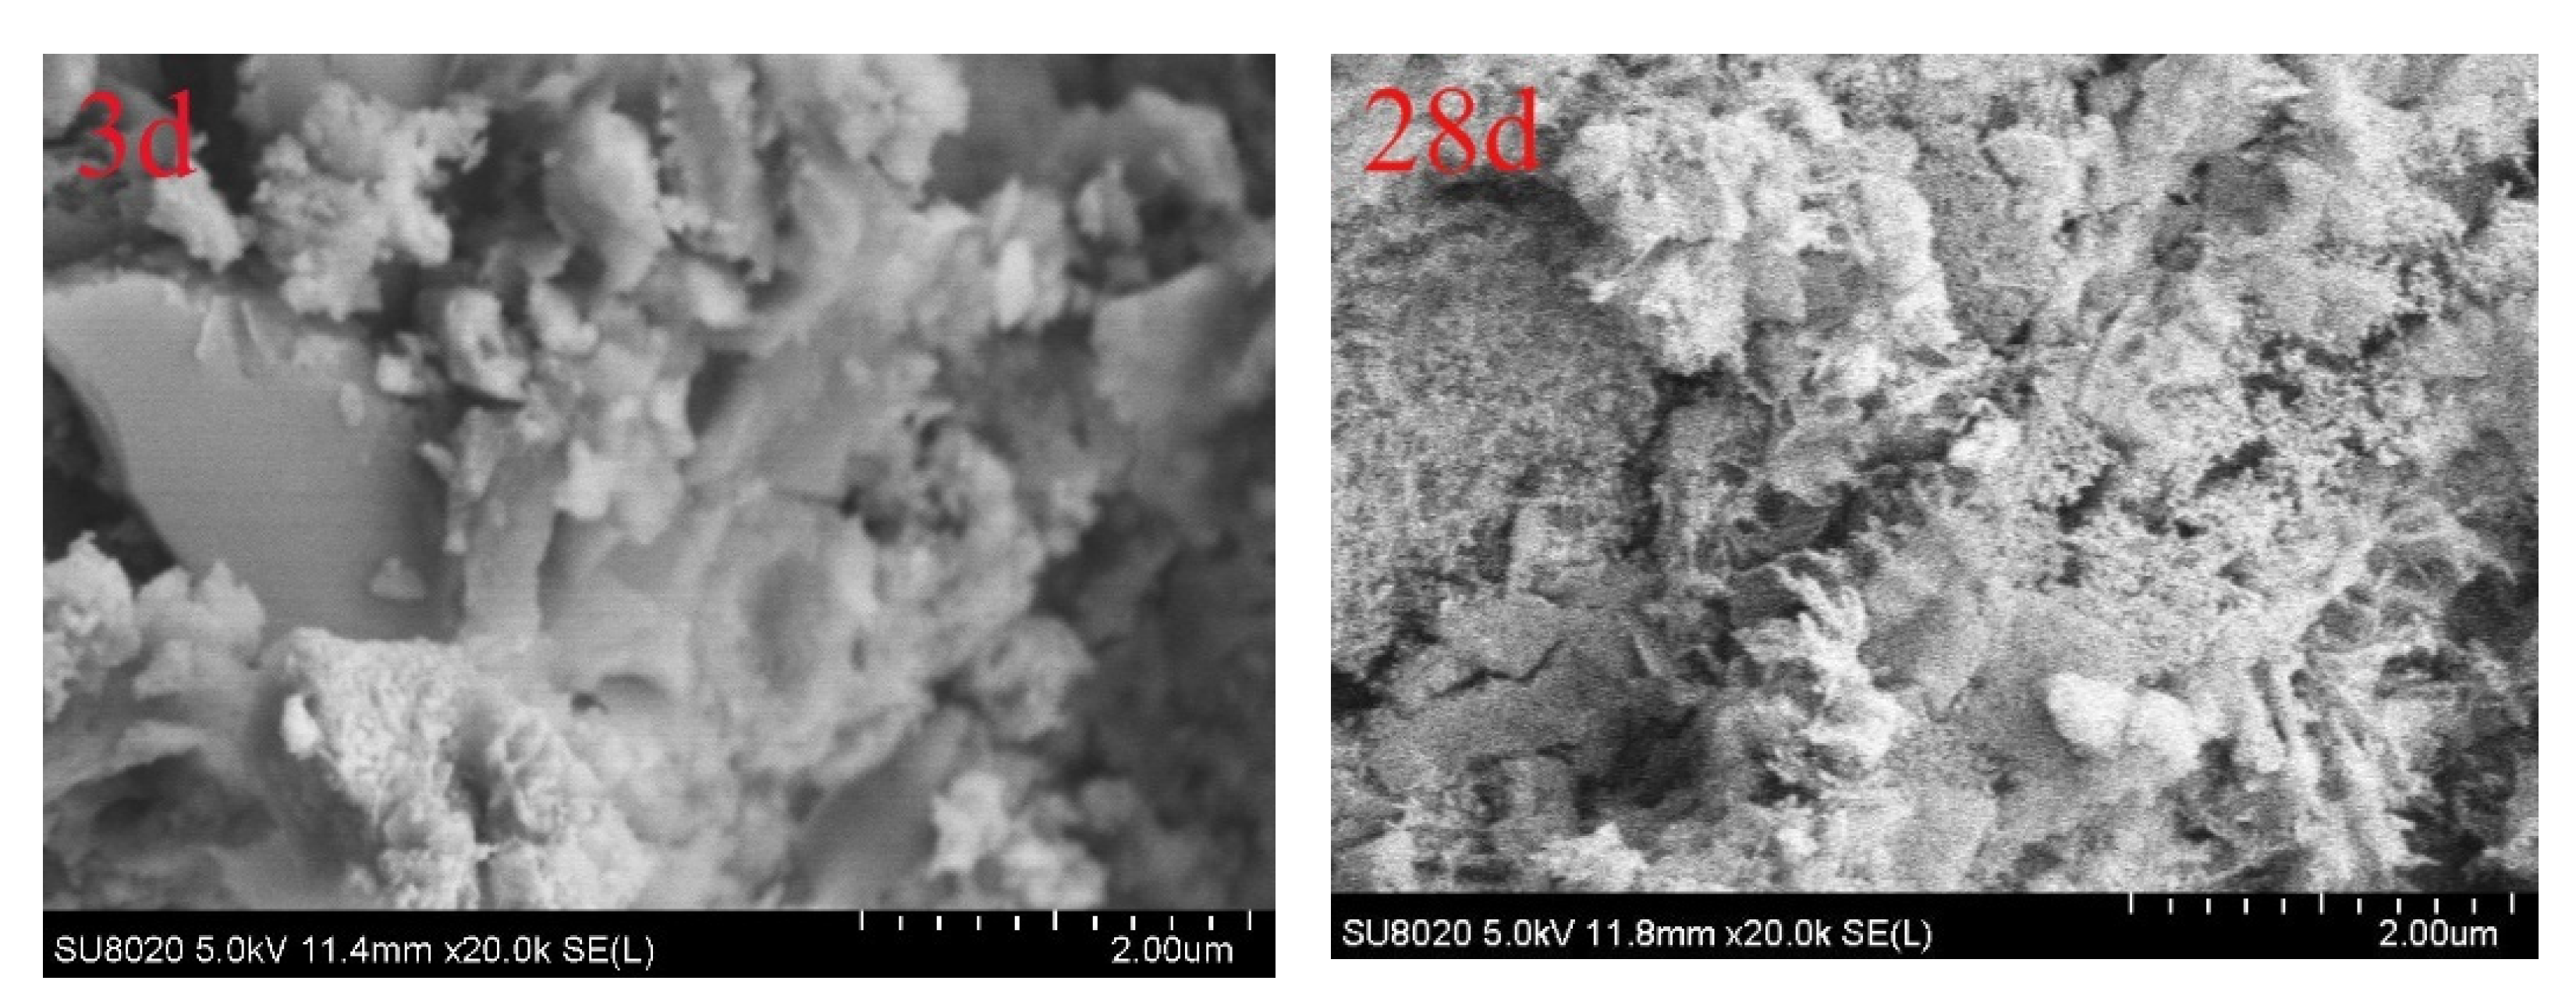
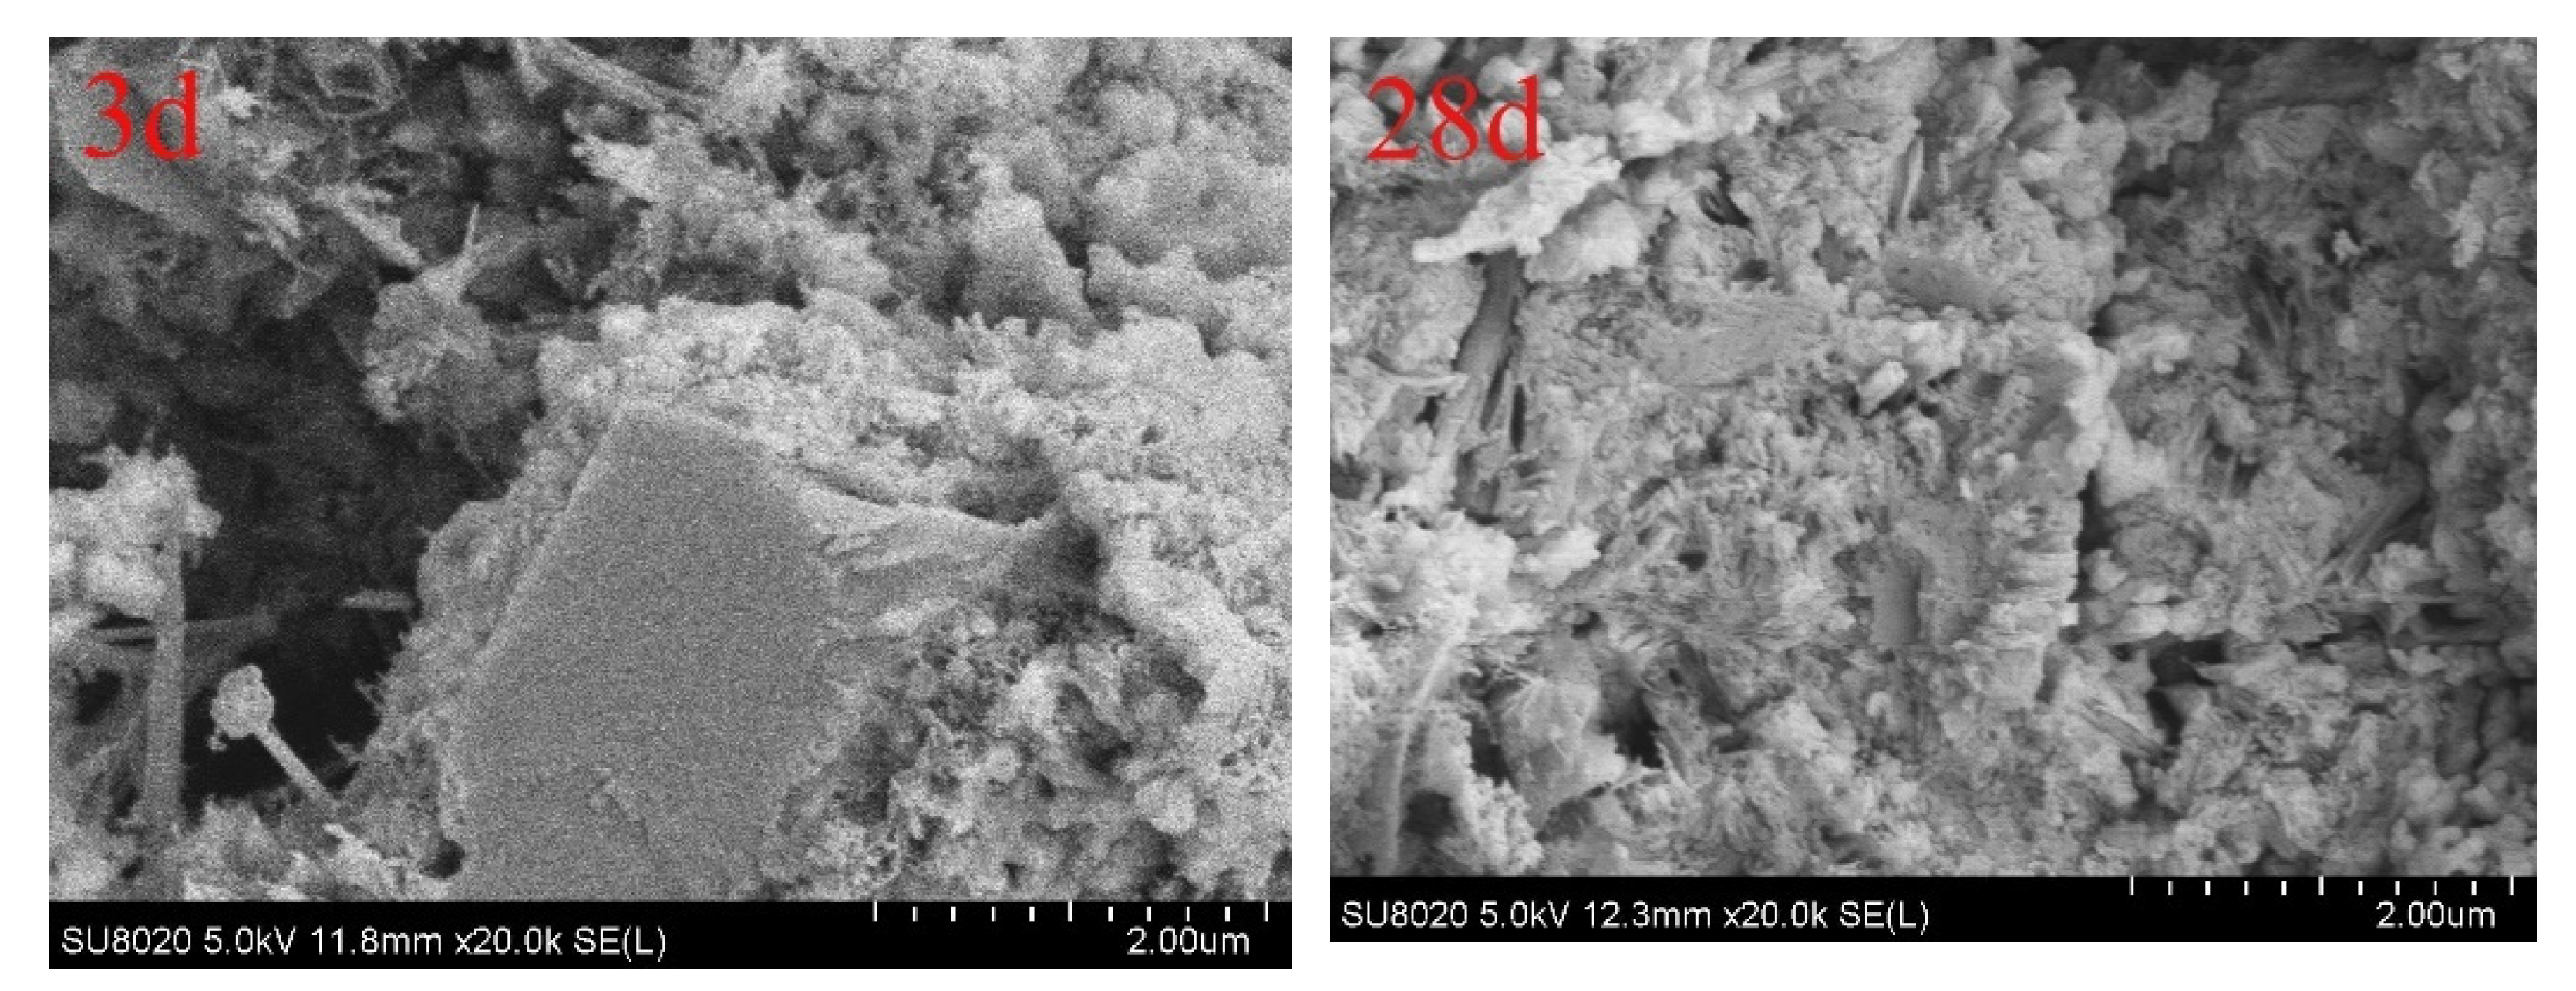
3.3. Microstructural Morphology
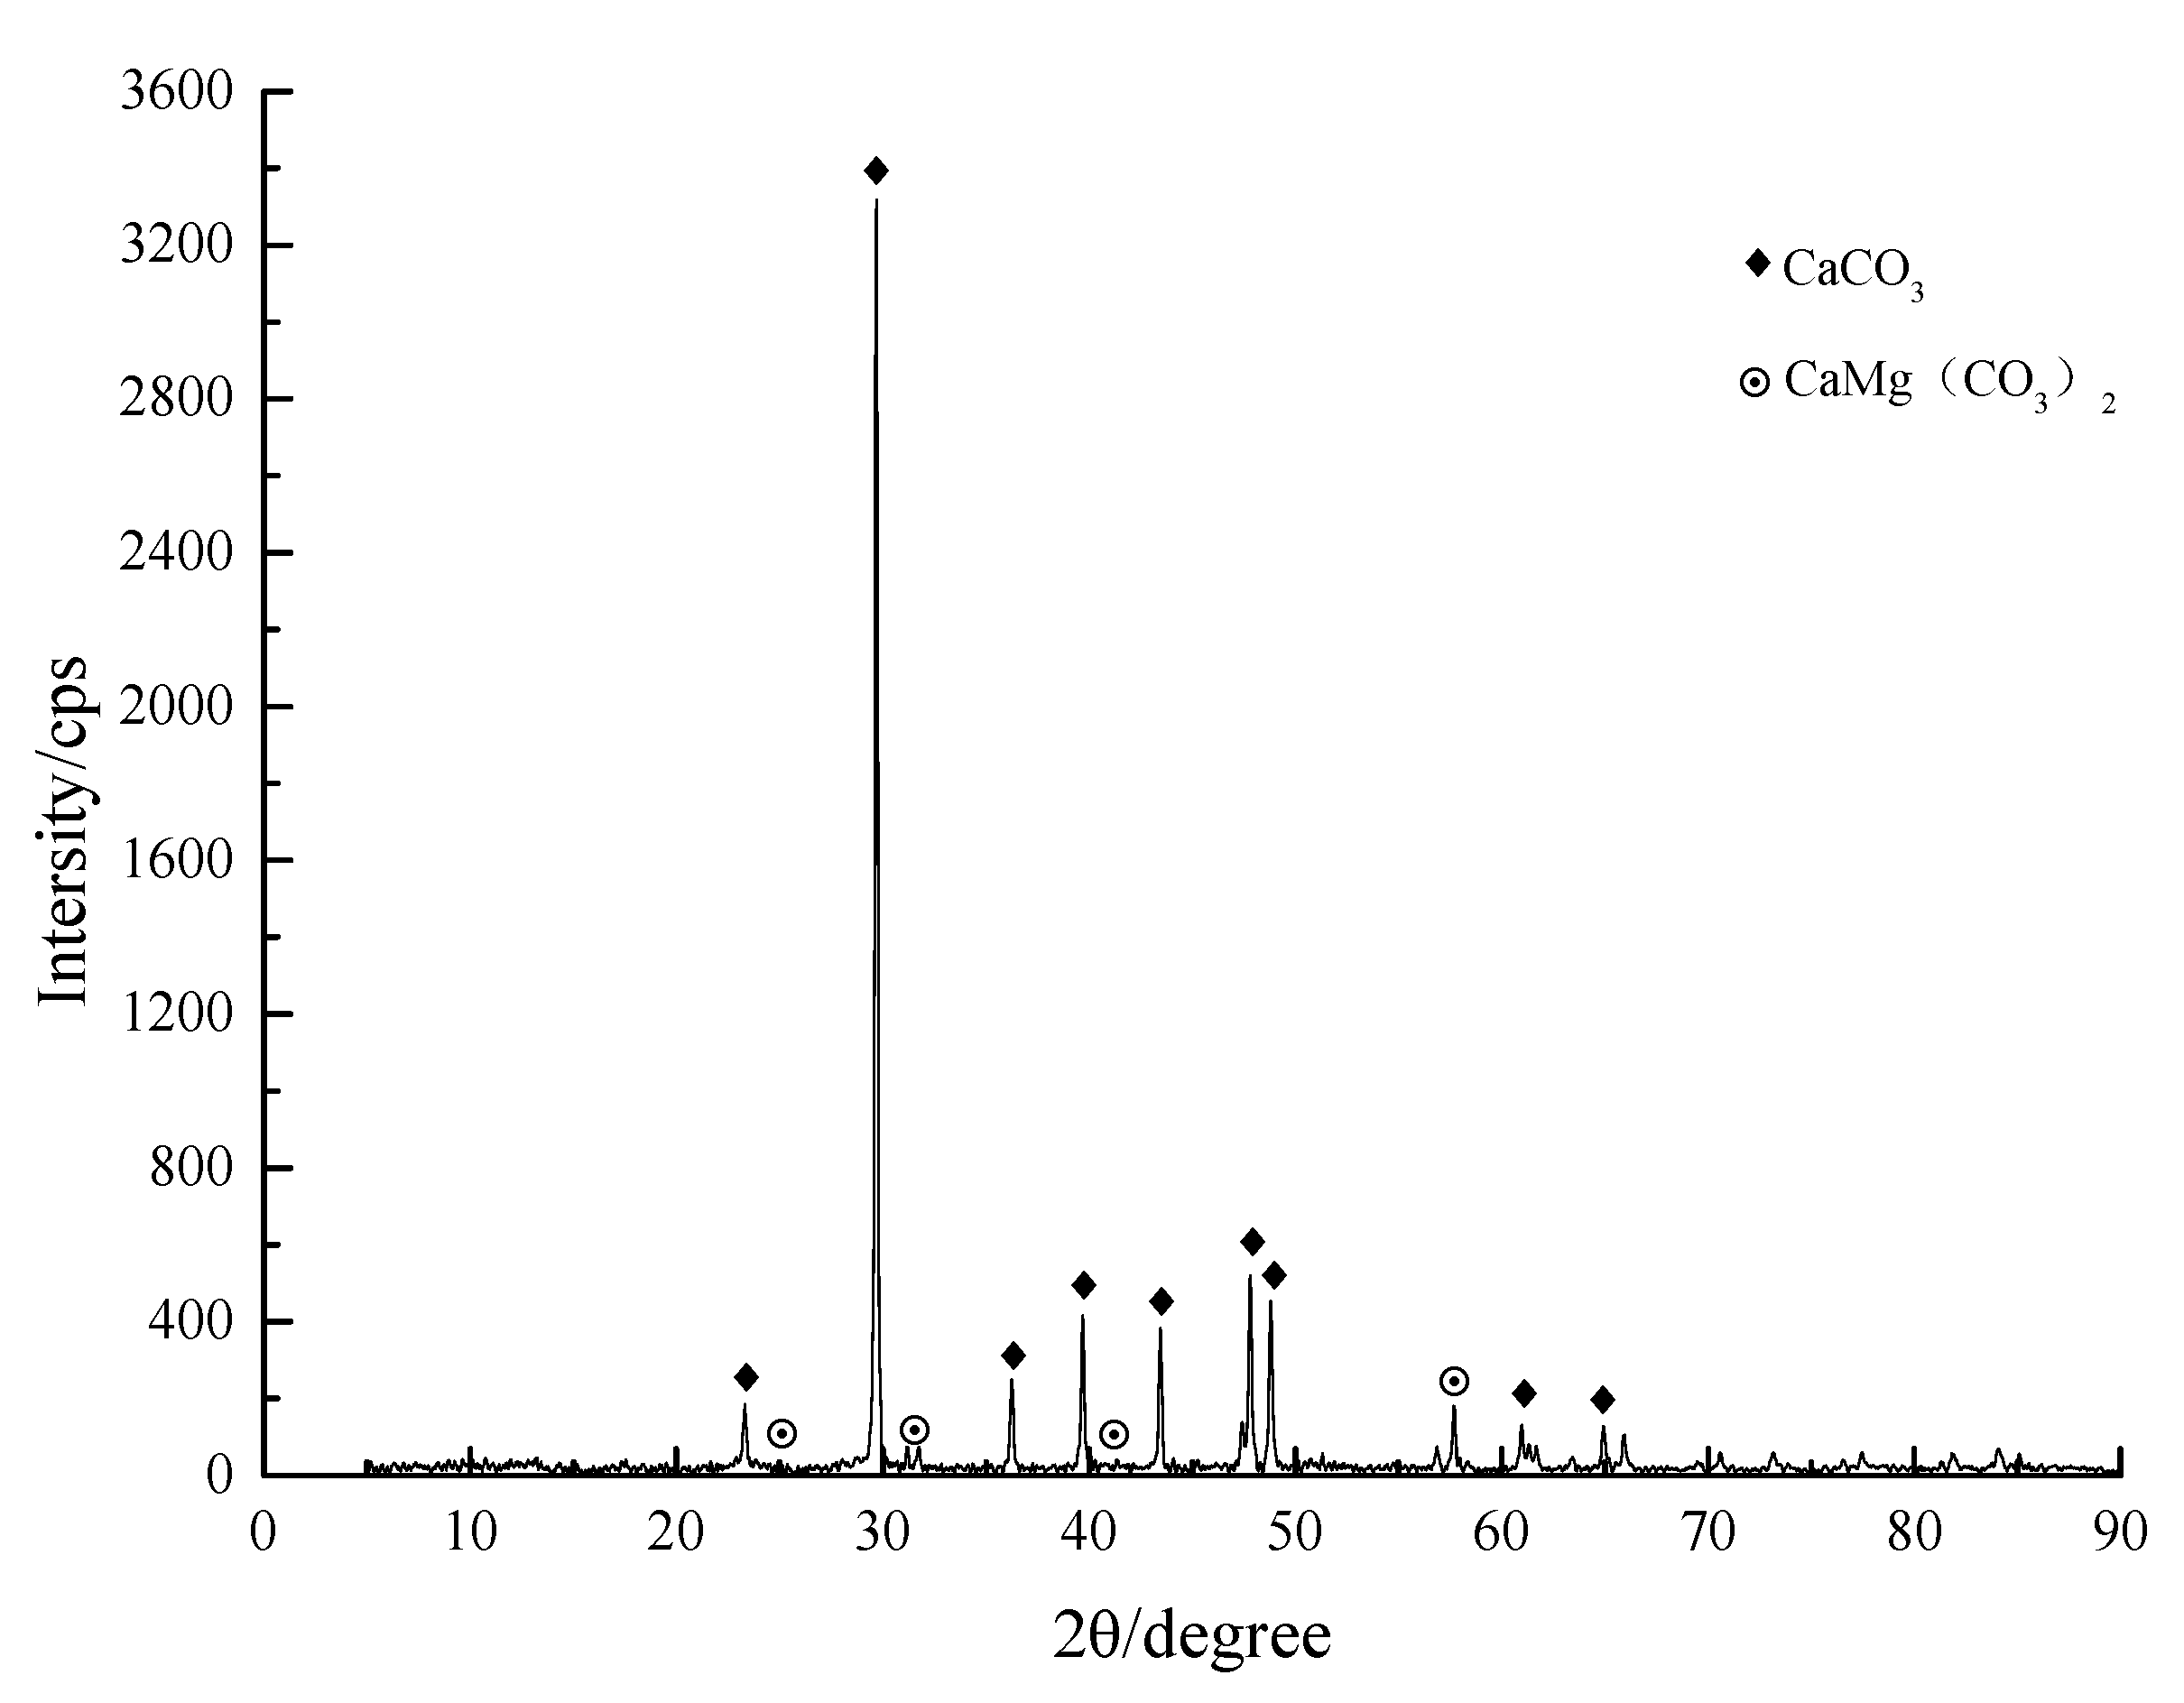
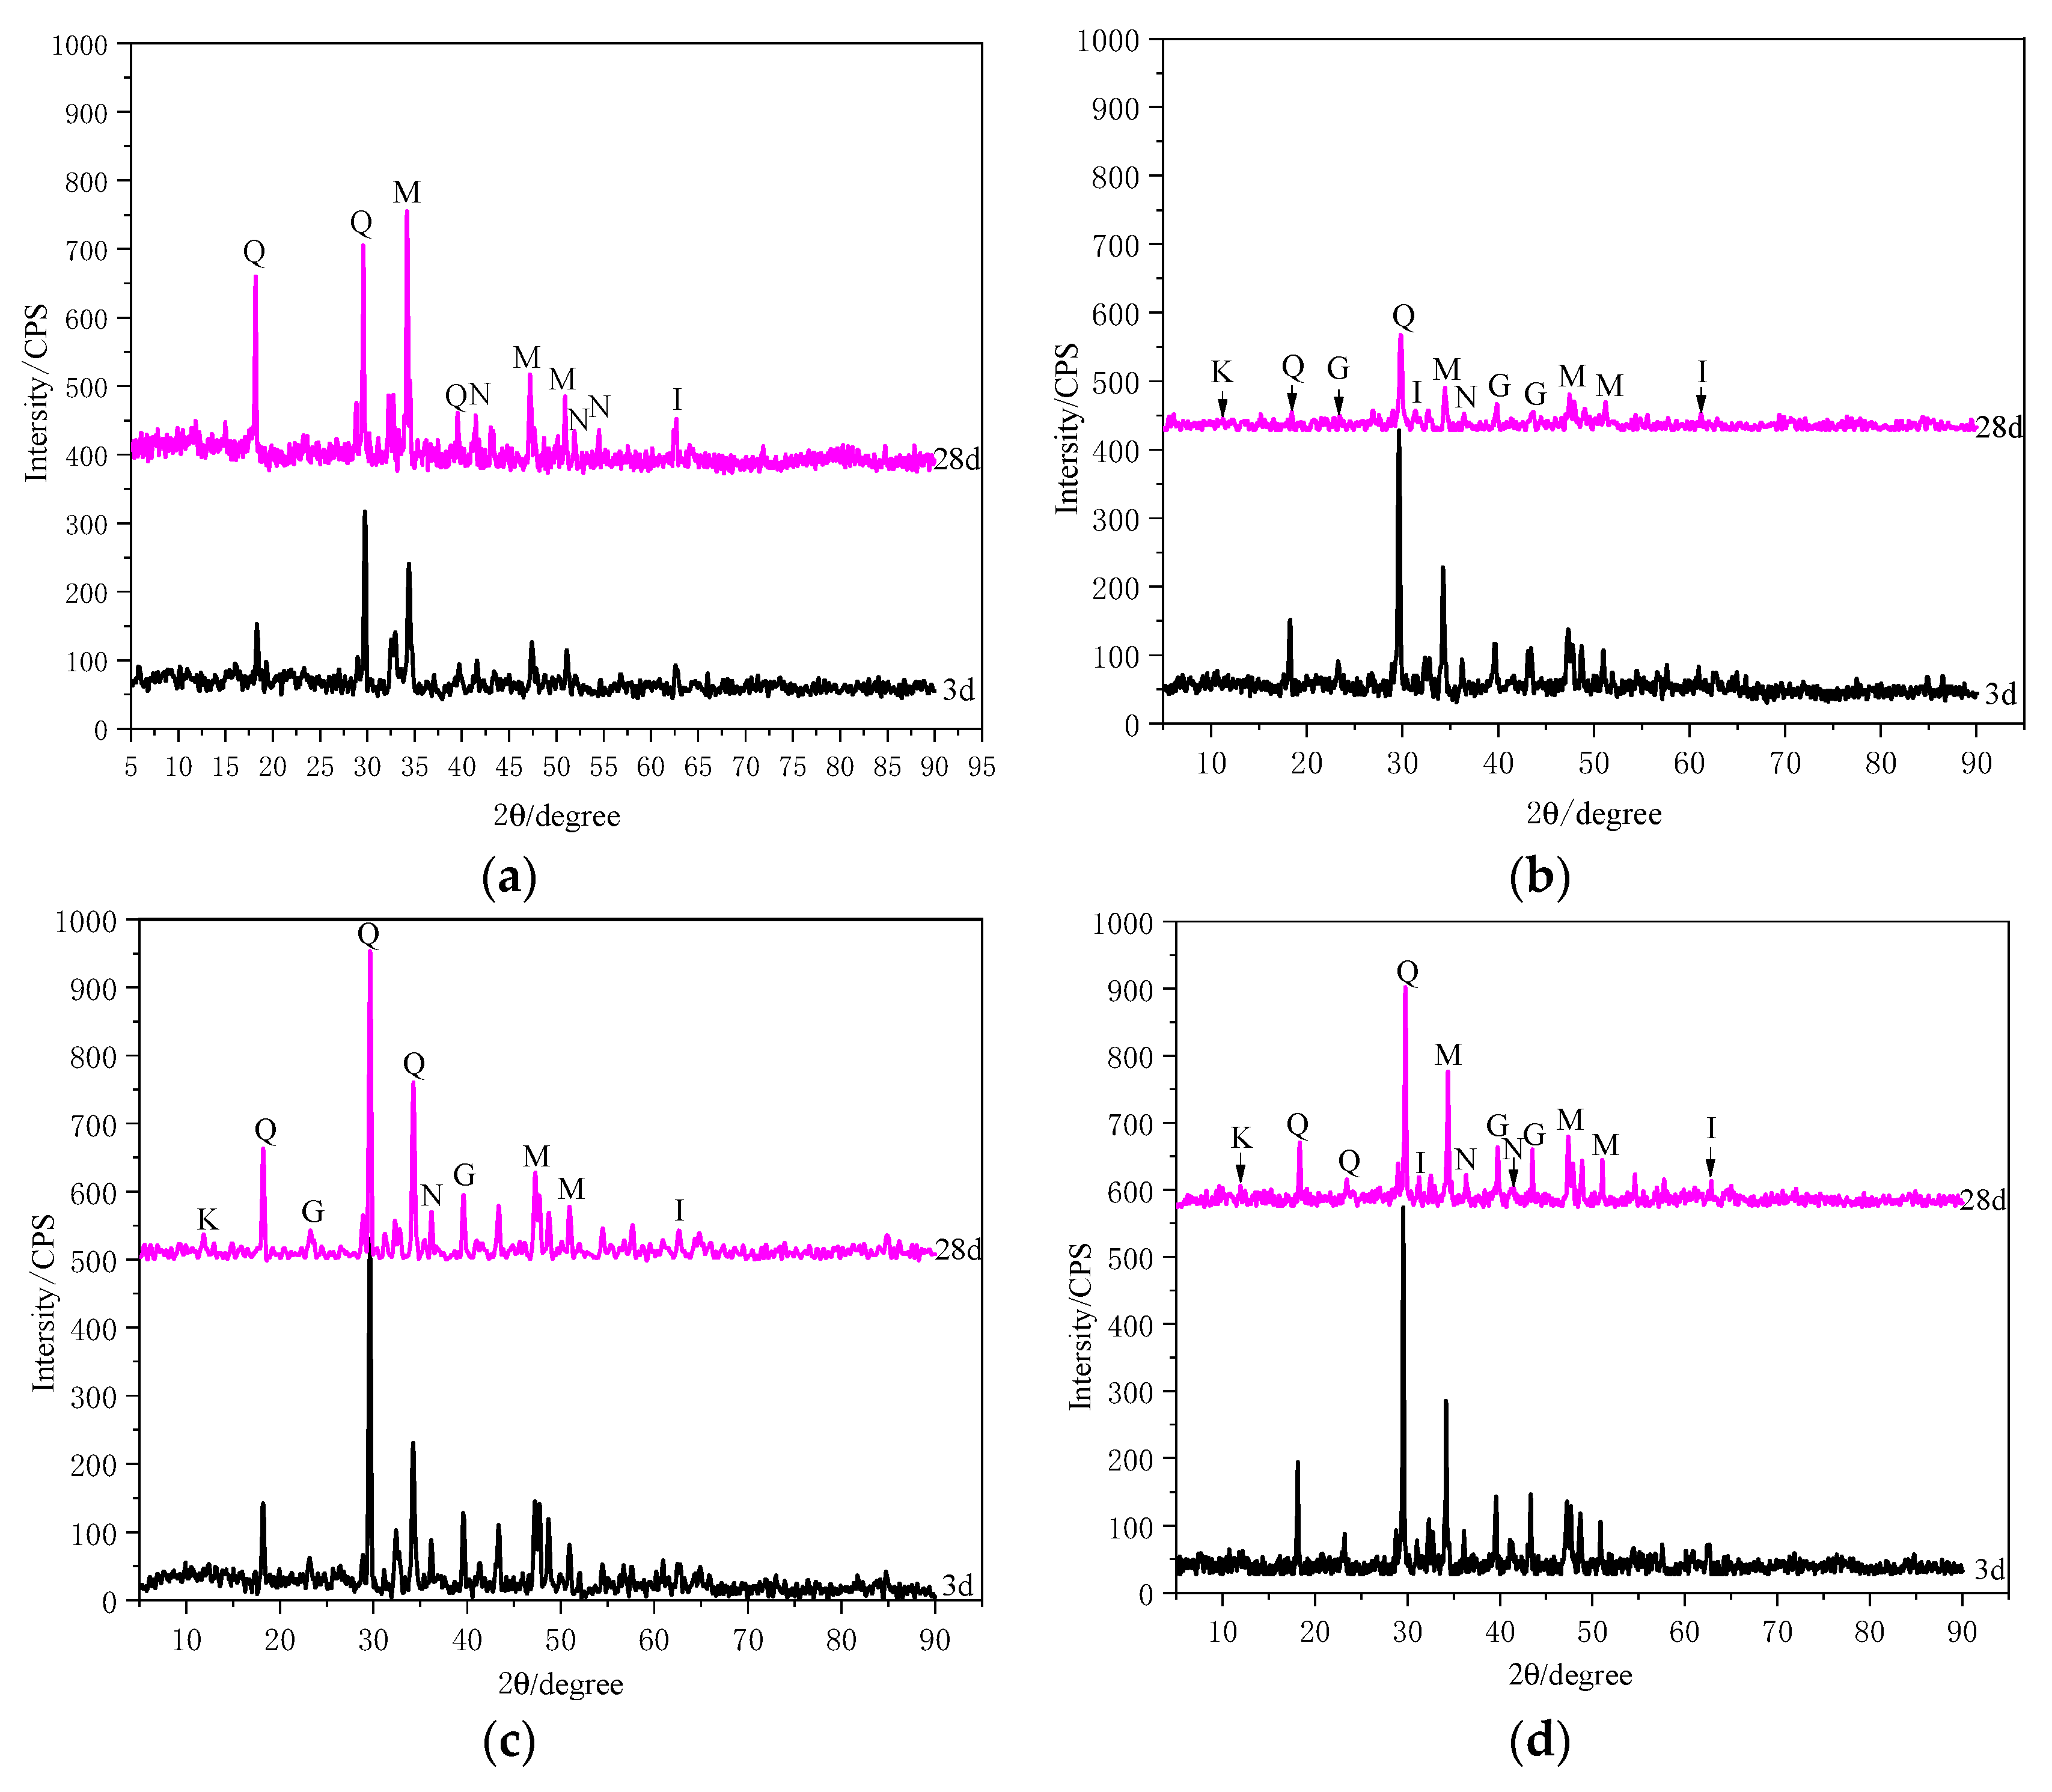
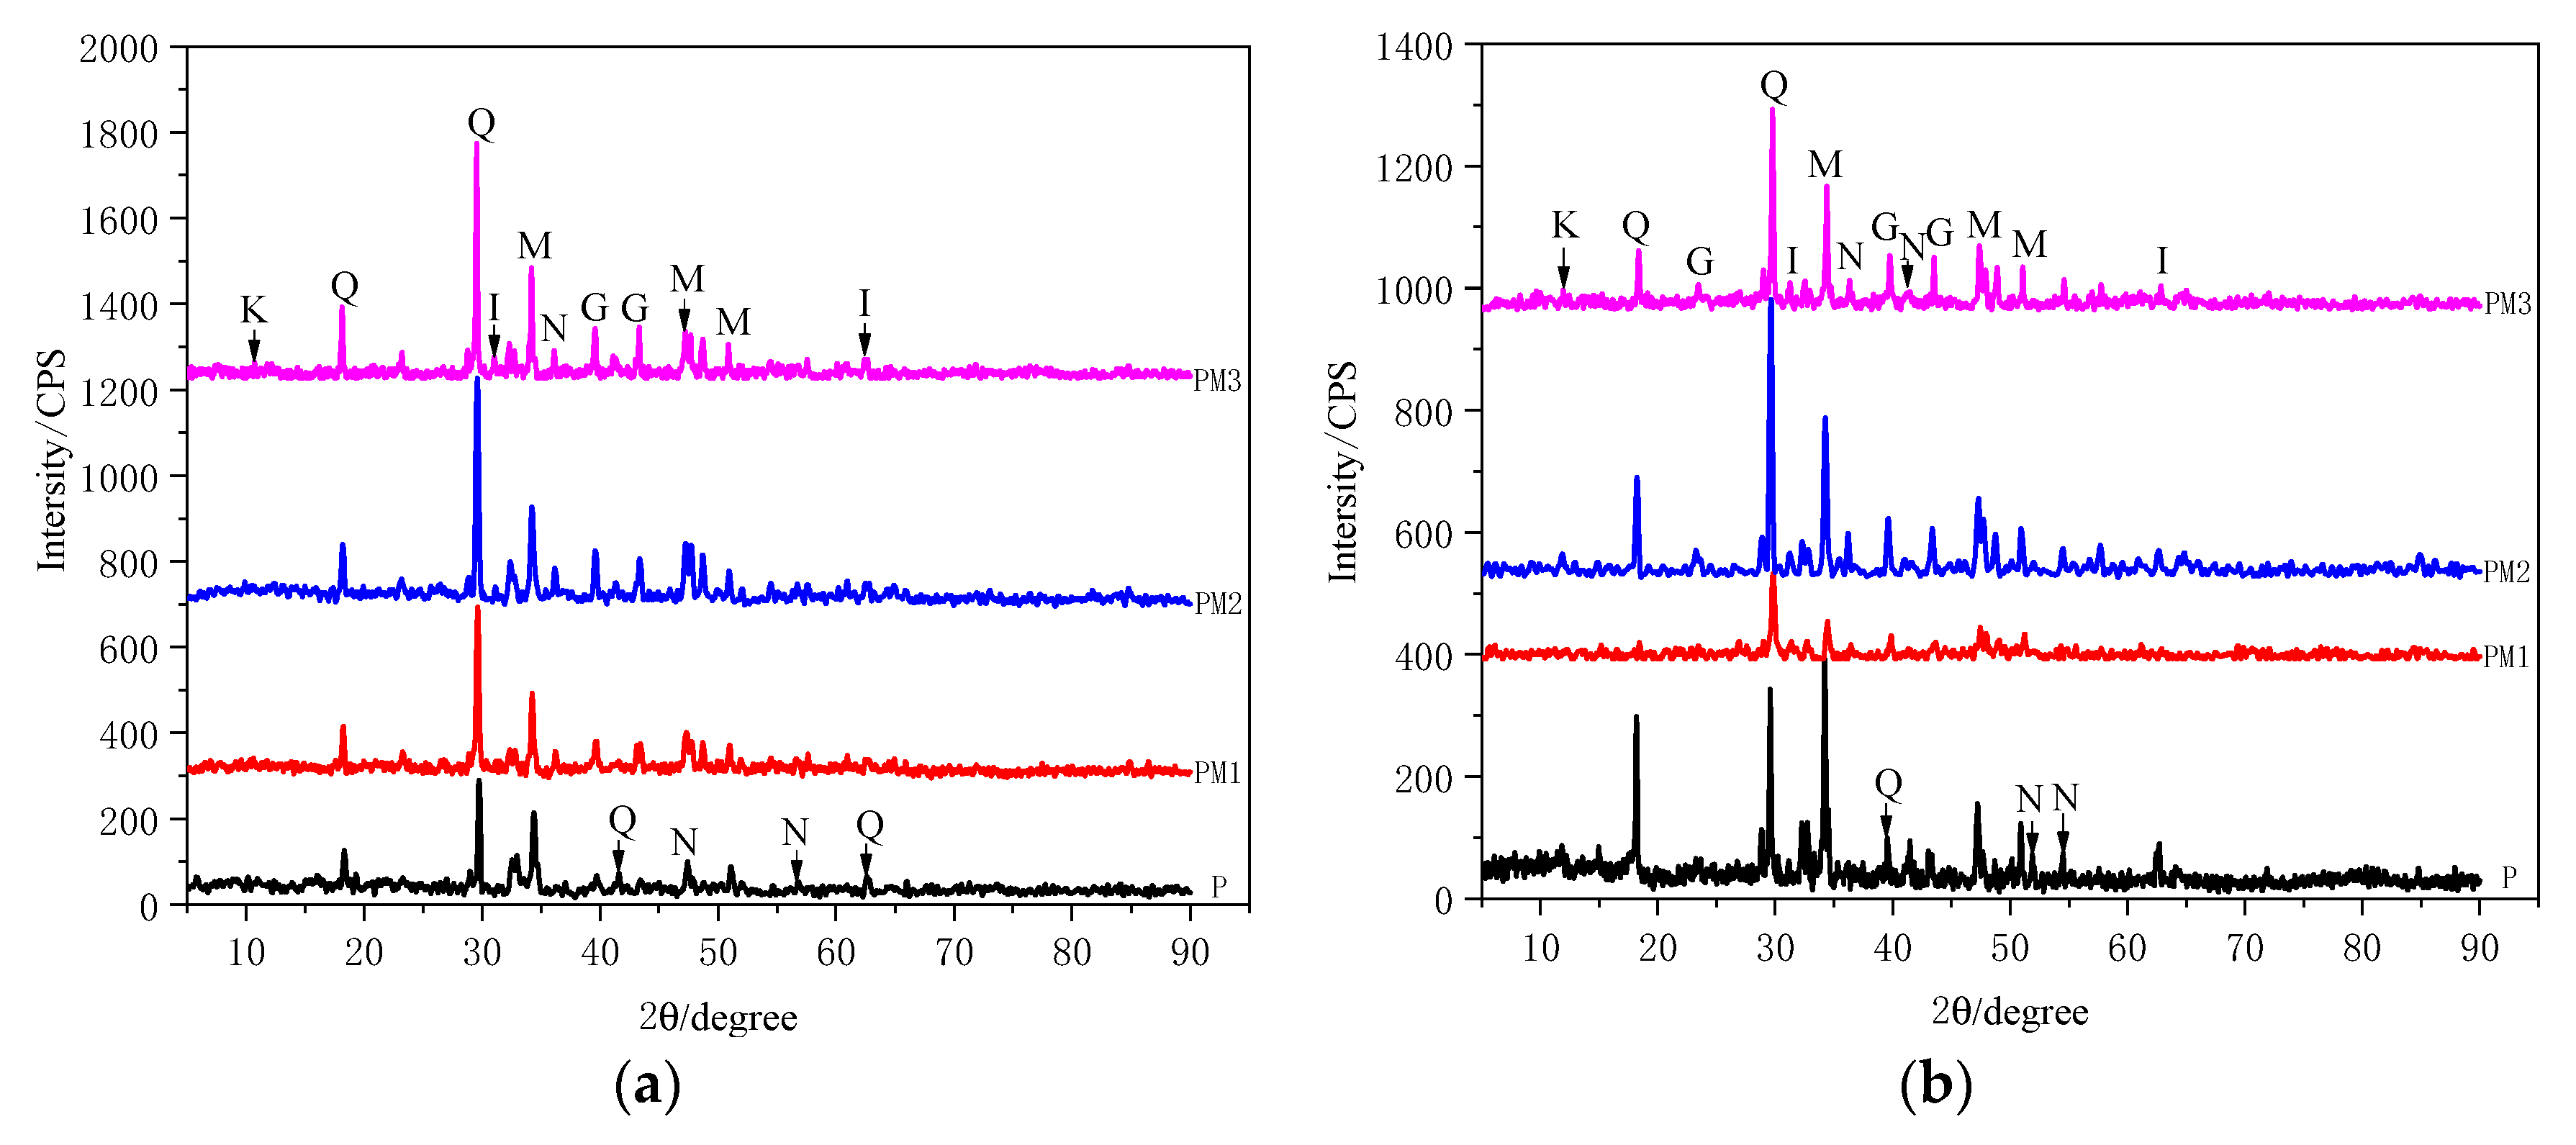
The microstructure directly affects the macroscopic properties of the material. Figure 9 shows the SEM results of pure cement. The hydration products of pure cement are more in 3 d, and there are clear acicular AFt, flocculated C-S-H, and lamellar Ca(OH)2 hydration products and pores. Hydration products are interlaced on the surfaces of non-hydrated cement particles. It can be seen that there are many pores in the matrix, and the microstructure of the slurry is not dense enough and porous. The 28 d sample microstructure morphology can be seen in a large number of hydration products connected to fill in the pores, making them significantly reduced, and the microstructure becomes more uniform and denser.
Figure 10, Figure 11 and Figure 12 are the results of the microstructure and morphology of cementitious materials. It can be seen that flocculated C-S-H, needle stick AFt, and non-hydrated cement and marble waste powder are interlaced together in the third microstructure morphology of different samples, which is significantly less than that of pure cement samples. A certain amount of hydration products are attached to the surfaces of marble waste powder particles, and the pores and microcracks are more evident than those of pure cement. The microstructure PM1 of the 28 d samples had an apparent marble waste powder and agglomeration phenomenon. The needle stick hydration products were significantly increased compared with the 3 d sample, while the PM2 and PM3 samples had no apparent marble waste powder, but there were more pores and cracks, and the microstructure was not dense enough. Compared with the pure cement sample of 28 d, the microstructure of the three samples was looser, resulting in a decrease of the macro-mechanical properties. By comparing the microstructure of the test samples, it was found that the flocculent C-S-H gel attached to the surface of marble waste powder was obviously observed in the cementitious material.

3.4. XRD Analysis

Figure 13 is the XRD results of different samples, and Figure 14 is the comparison results of 3 d and 28 d. The XRD results show that the hydration products of the PM1, PM2, and PM3 samples are basically the same, and the main hydration products are C-S-H gel, Ca(OH)2, C3AH, and non-hydrated C3S and C2S. With the increase in hydration time, the dosages of C3S and C2S gradually decreased, the diffraction peaks weakened and dispersed, and the diffraction peaks of the hydration products increased [26]. Figure 13a shows that the C-S-H gel and Ca(OH)2 diffraction peaks of the pure cement 3 d samples were firm, indicating that the early dosage was high, and the microstructure phenomenon was also apparent. The slightly firm peaks of tricalcium aluminate hydrate and the diffraction peaks of C3S and C2S were found in the XRD pattern, which was accompanied by dispersion, indicating that there were more C3AH formation and non-hydrated cement particles in the early stage. The diffraction peaks of C-S-H gel and Ca(OH)2 in the 28 d samples increased significantly, which reflected that the hydration products increased significantly, and the hydration degree of cement increased. It can be seen from Figure 13b–d that the diffraction peaks of C-S-H gel and Ca(OH)2 in the 3 d spectra of the PM1, PM2, and PM3 samples were relatively strong, and weak C3S and C2S diffraction peaks were found. With the increase of age, the diffraction peaks of C-S-H gel and Ca(OH)2 in the 28 d spectra were lower than those in the 3 d samples, which was contrary to the law of pure cement samples. The main reason was the dilution effect of marble waste powder in the early stage of incorporation, which made the cement hydration in the cementitious material more sufficient and generated more hydration products, C-S-H gel and Ca(OH)2. After that, the improvement of the cement hydration degree was limited. The reduction in the C-S-H gel and Ca(OH)2 concentrations in the 28 d sample and the mechanism by which they participated in the hydration process remain unknown.
It can be seen from Figure 14 that the diffraction peaks of CaCO3 and C3A·CaCO3·11H2O appear in the samples of cementitious materials mixed with marble waste powder. Compared with the results of the pure cement P sample, there was no pronounced diffraction peak of CaCO3, indicating that marble waste powder contained CaCO3 and had a specific chemical activity, which reacted with C3A to generate C3A·CaCO3·11H2O, which was consistent with the results of previous scholars [27,28]. The diffraction peaks of C-S-H and Ca(OH)2) in the 3 d hydration products of the PM1, PM2, and PM3 samples were higher than those of the pure cement samples, which reflected that marble waste powder promoted the early hydration of cement and accelerated the early hydration. The diffraction peaks of C-S-H gel and Ca(OH)2 in the 28 d cementitious material samples were significantly lower than those of pure cement. The marble waste powder with different particle sizes greatly influenced the diffraction intensity of the hydration products of the samples. The diffraction intensity of the hydration products of the PM2 samples was significantly higher than that of PM1 and PM3. The results showed that the effect of adding 600-mesh marble waste powder on the composite cementitious material was better, which was consistent with the macroscopic mechanical properties.

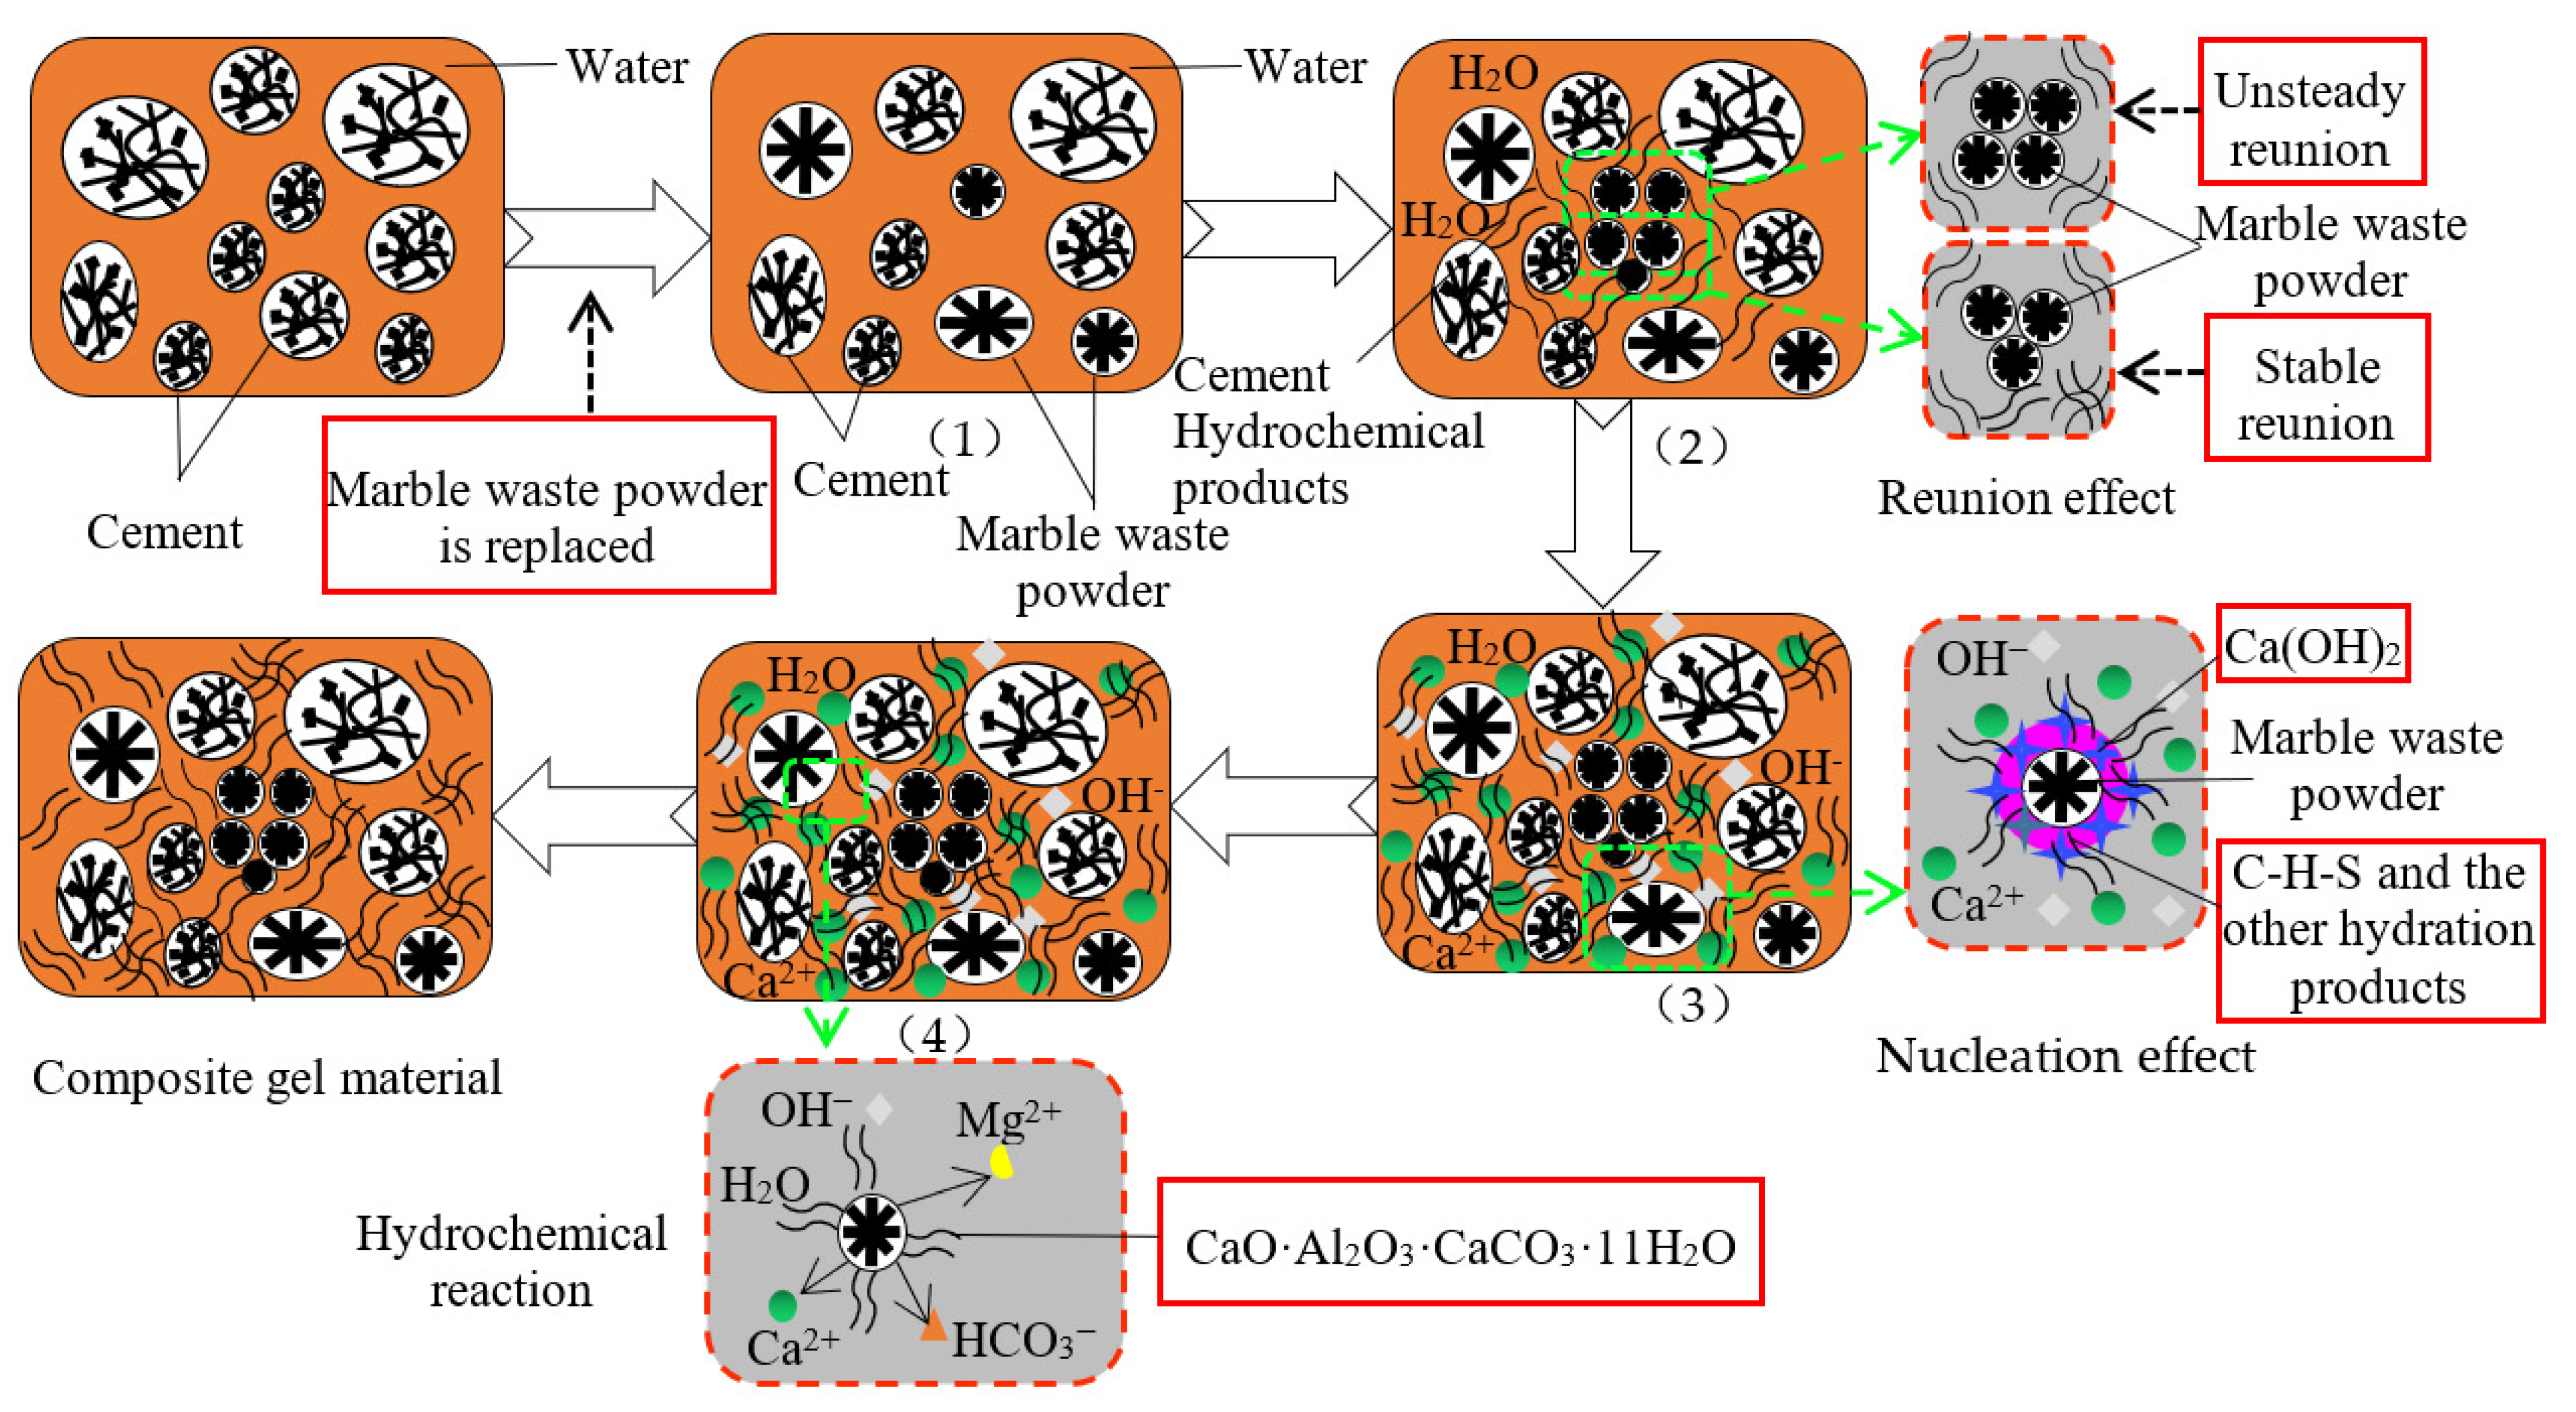
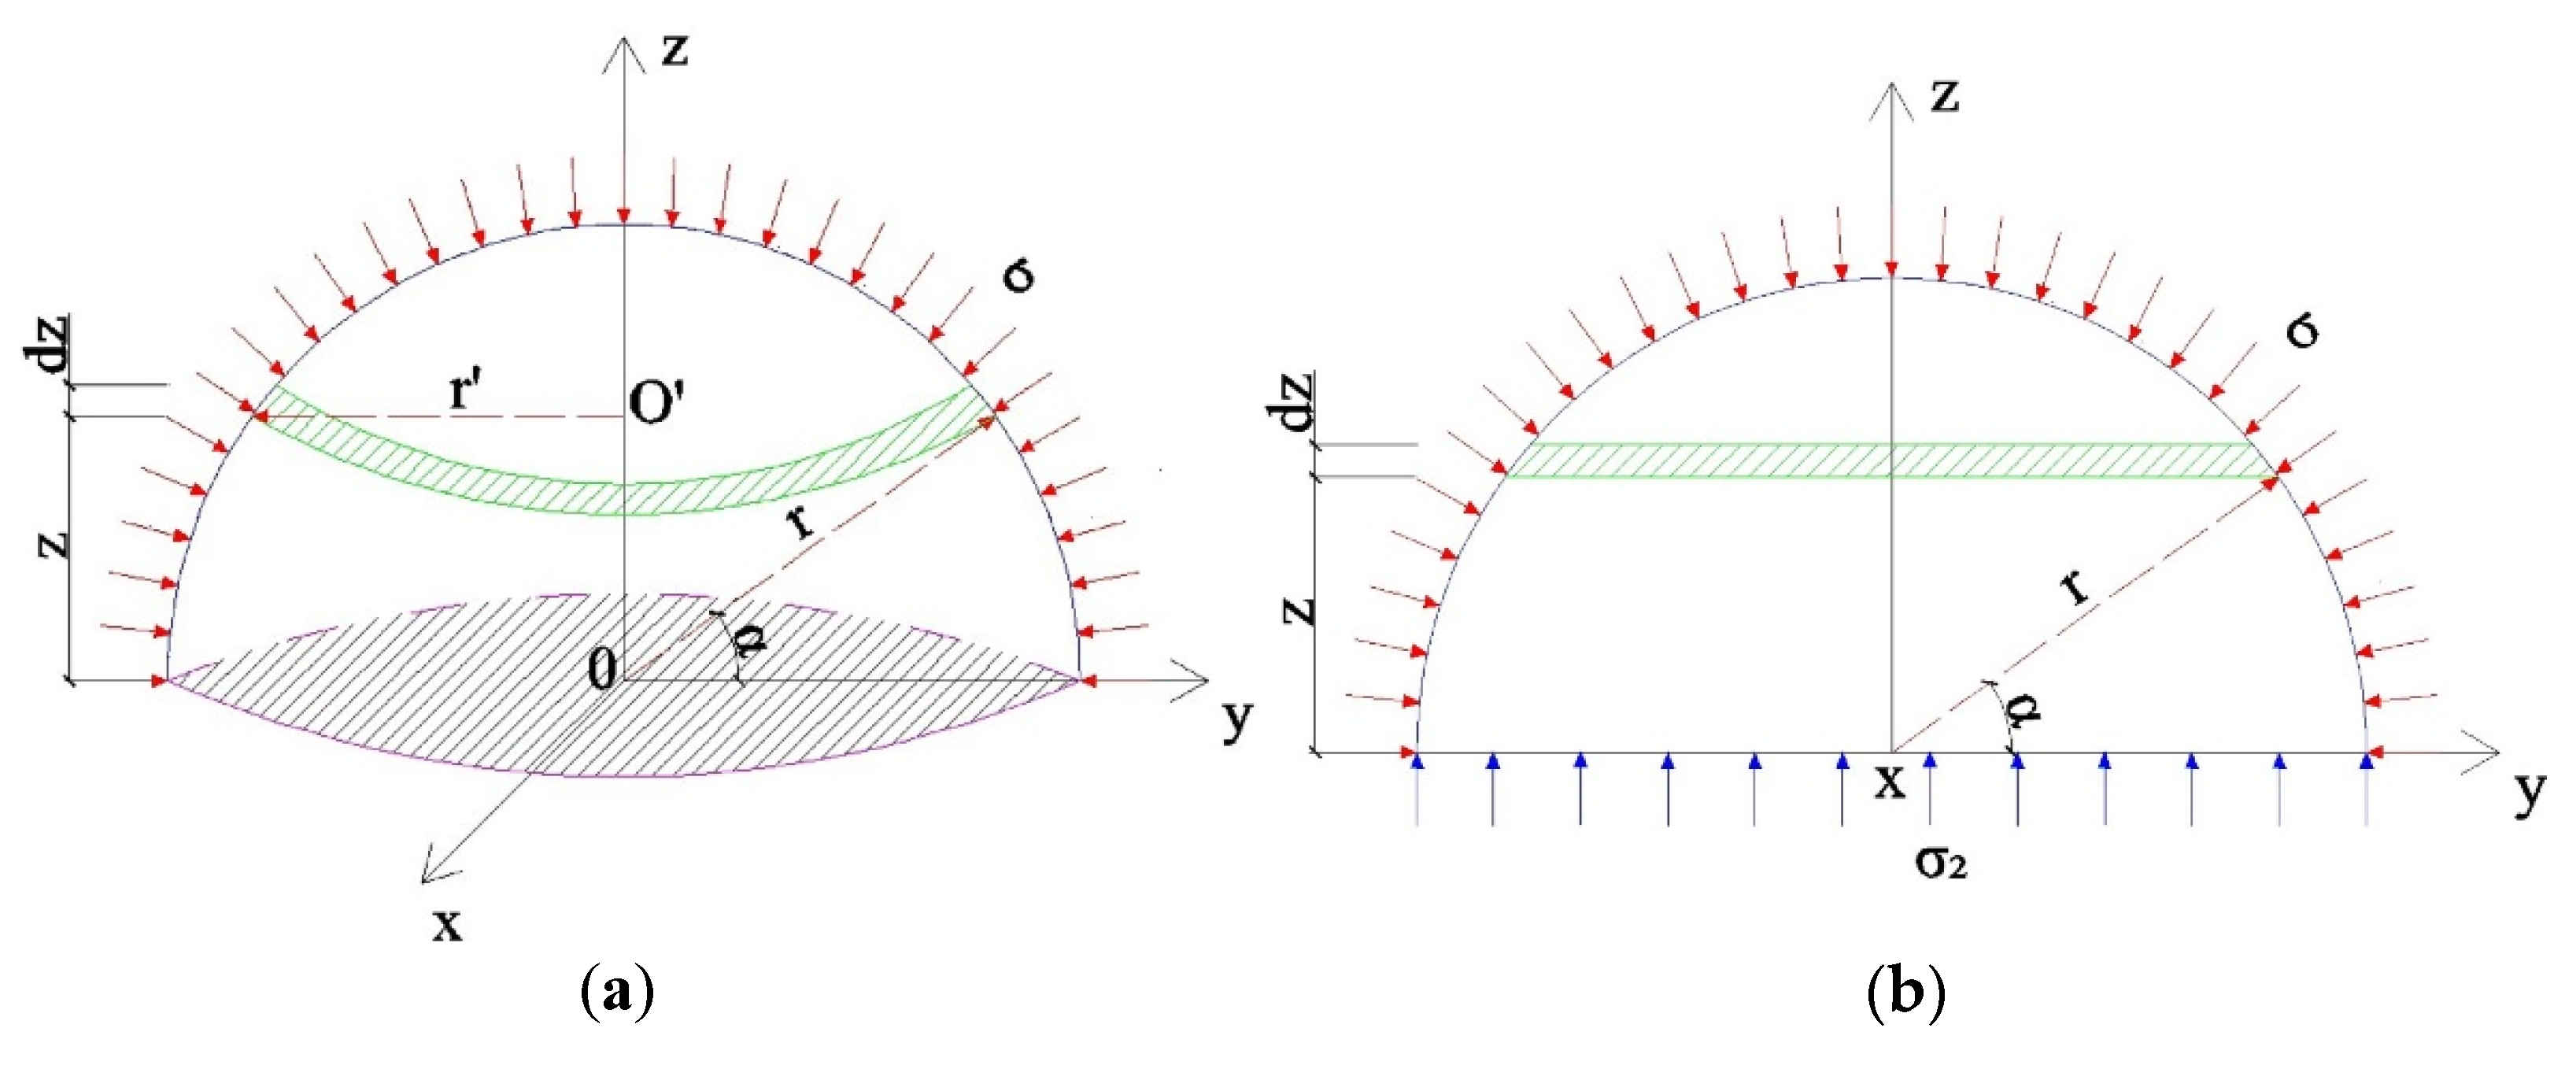
4. Mechanism of Marble Waste Powder in Composite Gel Material

Based on the mechanical properties of the cementitious materials, SEM, and XRD test results, combined with previous research results [29,30,31,32,33,34], the authors put forward the mechanism model of marble waste powder of cementitious materials (see Figure 15). The process of marble waste powder replacing cement in the hydration and hardening of cementitious materials slurry mainly has the following effects.
(1) Dilution effect: Marble waste powder belongs to calcareous rock powder, lacking a volcanic ash effect. When the replacement amount of marble waste powder for cement in cementitious materials increases, the obvious cement is relatively small and the dilution effect on cement in cementitious materials unnoticeable [12,32]. Under the same hydration conditions, the number of hydration products decreases, resulting in a porous microstructure; the matrix is not dense enough, and the compressive strength of cementitious materials decreases.
(2) Aggregation effect: When the amount of marble waste powder of the cementitious material replacing cement is large, the amount of marble waste powder is too large, and there is tension on the surfaces of marble waste powder particles. The smaller the particle size is, the larger the specific surface area. The larger the surface tension of the particles is, the more serious the agglomeration between particles. A large number of marble waste powders produce an agglomeration effect, and the coordination between particles forms small aggregates with steady-state triangular structures or unsteady-state quadrilateral structures, which makes the microstructure of hydration products of cementitious materials weak, resulting in the weakening of the matrix structure performance of cementitious materials and the reduction of strength [19,34].
(3) Nucleation effect: The incorporation of marble waste powder improves the strength of cementitious materials, especially for the early strength. It is mainly due to the nucleation effect of marble waste powder in the hydration process of cement. Due to the incorporation of marble waste powder, a large amount of Ca2+ is produced by C3S and C2S after the beginning of hydration. Marble waste powder is mainly composed of CaMg (CO3)2 and CaCO3 minerals. A small amount of Ca2+ can also be dissolved in itself, as shown in Equations (2) and (3), which makes Ca(OH)2, in the solution reach saturated crystallization and precipitation. It is adsorbed on the marble waste powder particles, and the nucleation sites of Ca(OH)2 increase, which can also increase the condensation of colloids and promote the hydration of cement [33].
Ca 2 x Mg x ( CO 3 ) 2 = ( 2 x ) Ca 2 + + x Mg 2 + + 2 CO 3 2
CaCO 3 + H 2 O = Ca 2 + + HCO 3 + OH
(4) Hydration reaction: CaO·Al2O3·CaCO3·11H2O phase diffraction peaks appear in the hydration products of cementitious materials, mainly due to the reaction of CaCO3 and C3A in marble waste powder to form single calcium carbonate hydrated calcium aluminate (4), which has been confirmed. However, whether the C-S-H gel and Ca(OH)2 diffraction peaks in the 28 d of the cementitious material significantly reduce the reaction with CaCO3 remains to be further explored, indicating that marble waste powder has specific activity in the cementitious material, participates in the hydration reaction, and generates hydration products, which is conducive to the improvement of strength [34]. It is a positive contribution to the cement strength. However, the diffraction peaks of CaO·Al2O3·CaCO3·11H2O in the XRD pattern were not obvious, indicating that marble waste powder had limited participation in the hydration reaction.
C 3 A + CaCO 3 + 17 H 2 O 3 CaO Al 2 O 3 CaCO 3 11 H 2 O + 2 Al 2 O 3 H 2 O

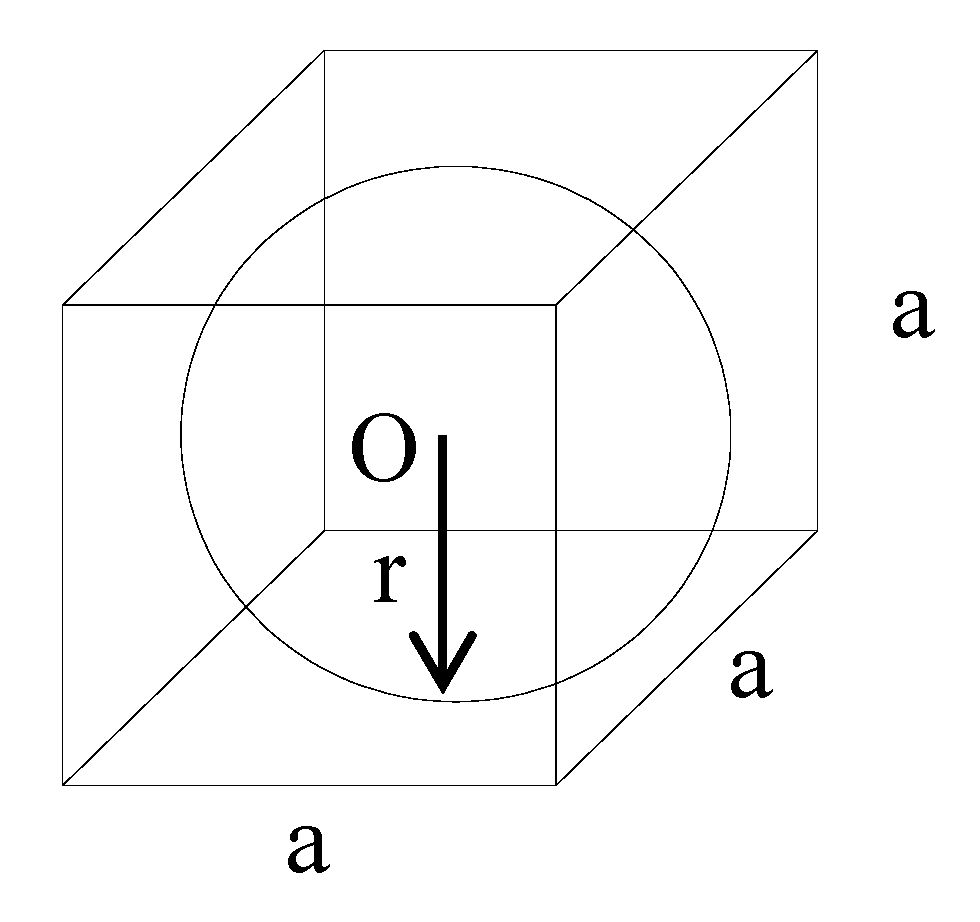
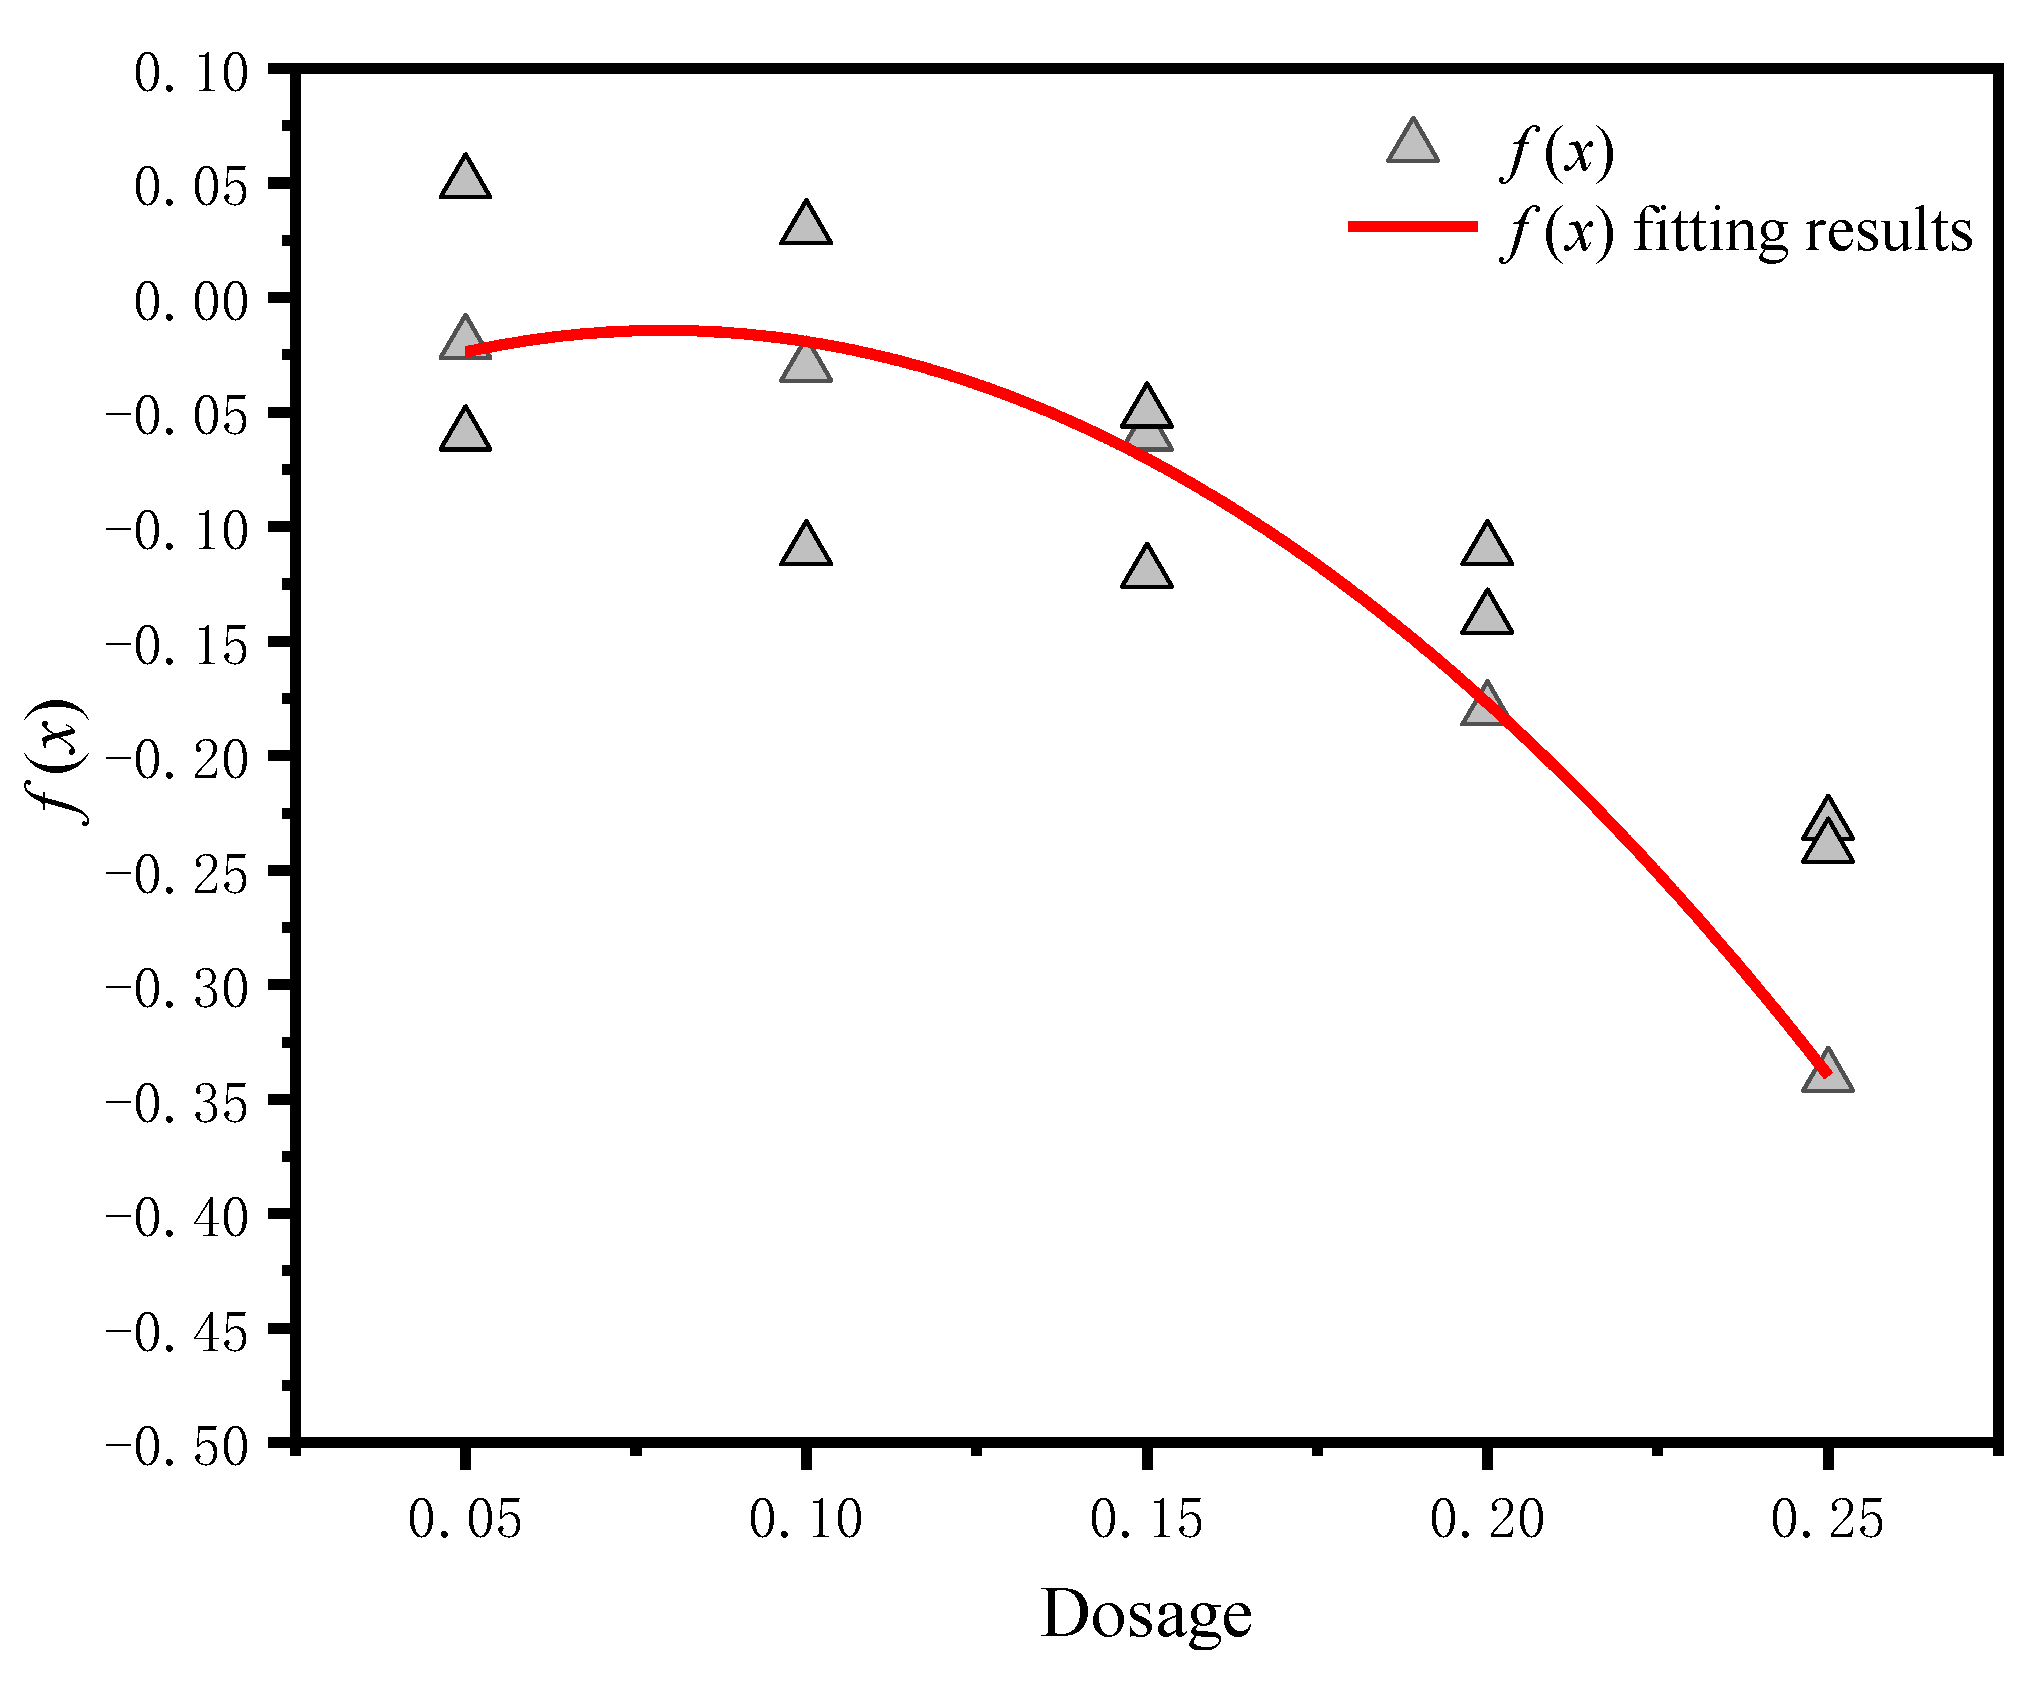
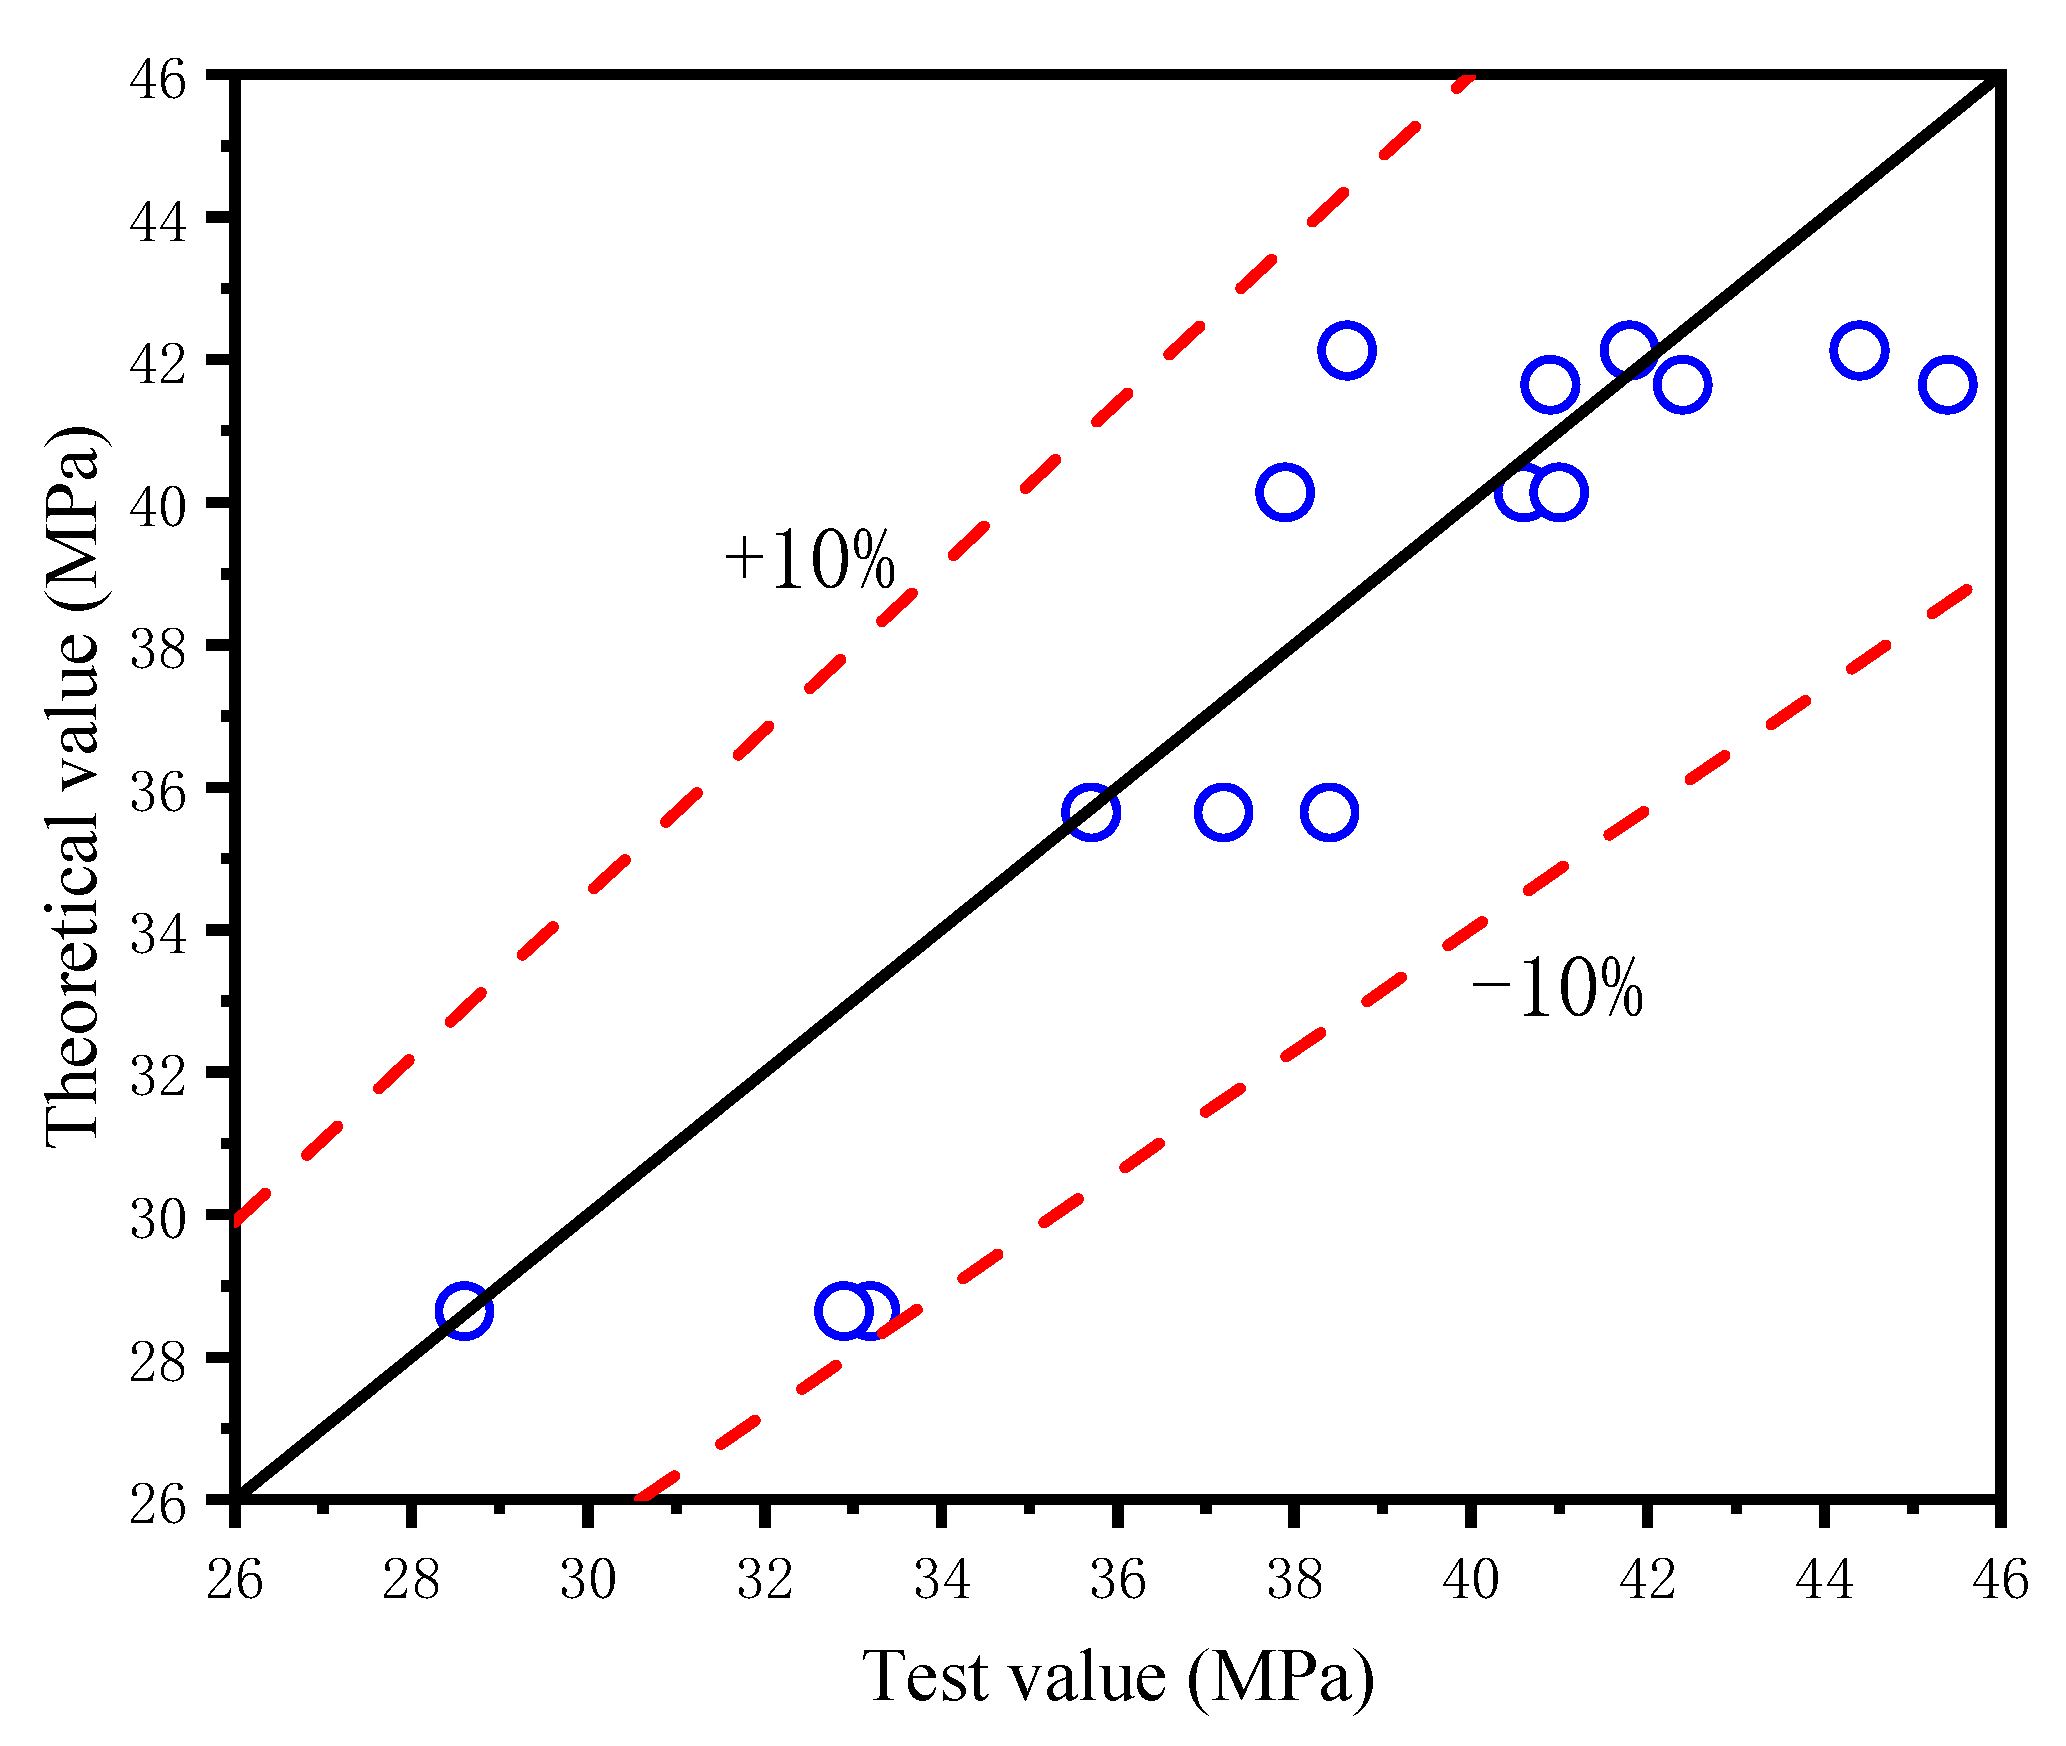
5. Relationship between Marble Waste Powder Dosage and Strength Based on Microstructure

There are three main strength theories of cement stone: the theory of the void ratio, the theory of interfacial energy, and the theory of the crystal contact point. However, none consider the strength relationship between the microstructure and crack development [31]. This paper considers the influence of marble waste powder on cementitious materials’ microstructures and constructs the relationship between strength and material dosage. From the microstructure morphology of the sample, it can be seen that the hydration product presents a network structure and microcracks. Any space unit with a × a × a side length is taken, and the hydration product is filled with spherical particles with a radius r in the micro space unit. The space micro unit of the hydration product is shown in Figure 16.
The volume ratio of hydration products to microscopic space units is ξ
ξ = V hydration   products V Spatial   microscopic   units = 4 π r 3 3 a 3 = 4 π 3 ( r a ) 3
The hydration products are interlaced. Under the action of loading, the mutual compressive stress between hydration products is σ , and the compressive stress of the maximum section of the hydration products is σ 2 . The mechanical calculation model of the hydration products in a microscopic space unit is shown in Figure 17.
According to the mechanical calculation model, taking an infinitesimal dz at the hydration product Z, the resultant force in the Z direction produced by the compressive stress σ of the infinitesimal is dF,
d F = 2 π σ z r r 2 z 2 d z
The resultant force produced by the compressive stress σ of hydration products in the microscopic space unit is P,
P = 0 r d F = 0 r 2 π σ z r r 2 z 2 d z = 2 π σ r 2 3
According to the static equilibrium equation,
Z = 0 ,   σ 2 π r 2 = P
Vertical (7 and 8) available σ2:
σ 2 = 2 3 σ
The compressive stress σ2 is produced by the hydration product of the microscopic space unit, and compressive stress σ1 acts on the microscopic spatial unit:
σ 1 = 2 π σ 3 ( r a ) 2
From the SEM results, it can be seen that there are microcracks in the hardened paste. The failure mechanism of the cement stone material is that the internal cracks are continuously generated, developed, and penetrated under the external force [35], resulting in the failure of the cement stone material. Since the cement stone material belongs to brittle material, according to the damage and fracture mechanism of the material and the macro and micromechanics theory, the micro spatial unit calculates the microcrack bending propagation stress according to the microcrack propagation zone model compressed by the brittle material [36], namely:
σ k = 3 ( 2 ν ) K II c 8 ( sin θ 0 cos θ 0 μ cos 2 θ 0 ) π a u
where μ denotes the friction coefficient between microcracks, αu denotes the statistical mean radius of the microcracks, and KIIc denotes the critical value of type II stress intensity.
θ 0 = a r c t g ( μ + μ 2 + 1 ) , 0 ϕ 0 2 π
Assuming that there are microcracks in the space elements under uniaxial compression, the failure stress is equal to the bending propagation stress of microcracks.
σ 2 = σ k
Vertical (9–11) are available:
σ = 3 2 σ k ,   σ 1 = π σ k ( r a ) 2
Verticals (5) and (14) are available:
f c = σ 1 = 0 . 83 π 1 / 3 σ k ( ξ ) 2 / 3
According to the dosage relationship of cementitious materials [37],
ξ 0 = V c V c + V w = m c m c + m w ρ c
where Vc denotes the cement volume (cm3), Vw denotes the volume of water (cm3), mc denotes the cement quality (g), and ρc denotes the cement quality (g/cm3).
Hydration products accounted for the raw material ratio, and a raw material ratio after hydration produces k volume products:
ξ = k ξ 0
The relationship between Formulas (15) and (17) and the relationship between compressive strength and cement paste material dosage is established:
f c = η ( ζ 0 ) 2 / 3 = η ( m c m c + m w ρ c ) 2 / 3
From the results of the 28 d compressive strength of pure cement:
f c 28 = 55.44 ( m c m c + m w ρ c ) 2 / 3
Cementitious materials are composed of marble waste powder and cement, and marble waste powder plays a significant role in the strength of the cementitious materials. In order to accurately express the effect of marble waste powder on cementitious materials [38], the effect function g(x) of marble waste powder on cement and the effect function u(x) of the matrix microstructure are defined. The 28 d strength model of composite cementitious materials is:
f c m = g ( x ) u ( x ) f c 28
For the values of g(x) and u(x) in the model, the influence of the dosage is mainly considered. Without marble waste powder, the value of g(x) is 1, and g(x) can be defined as the first-order function:
g ( x ) = 1 + A x
where x denotes a marble waste powder dosage; A denotes the action coefficient of marble waste powder, the value range [0,1).
The model’s value of function u(x) is 1 without adding marble waste powder. The form of the function u(x) can be defined as:
u ( x ) = 1 + k ( x ) f ( x )
k ( x ) = 0 ,   x = 0 ;   k ( x ) = 1 ,   x > 0
where x denotes the marble waste powder dosage, k(x) is the harmonic function, and f(x) denotes the influence function of marble waste powder dosage on the matrix microstructure.
According to the 28 d compressive strength test results, the quadratic function was used to fit the relationship between f(x) and the dosage of marble waste powder, as shown in Figure 18. The fitting results were highly consistent, so the value function relationship of f(x) was obtained, as shown in Formula (24).
f ( x ) = 11.143 x 2 + 1 . 763 x 0.084 , R 2 = 0.99
Then, the 28 d strength model function of cementitious materials was:
f c m = 55 . 44 [ ( 1 + 0 . 4 x ) ( 1 + k ( x ) ( 11.143 x 2 + 1.763 x 0.084 ) ) ] ( m c m c + m w ρ c ) 2 / 3
It can be seen from Figure 19 that the theoretical value of the theoretical calculation formula derived in this paper was highly consistent with the experimental value, and the average error of the comparison test results was within 10%, which verified the correctness of the formula.

6. Conclusions

(1) The dosage of marble waste powder in the range of 0–15% is pronounced to improve cementitious materials’ early compressive and flexural strength. The particle size of 600-mesh marble waste powder still improves the later strength, and the effect of 5% is the best. With the increase of the dosage from 15% to 20%, the compressive strength and flexural strength degradation are more serious. Even when dosed the same, the specimen with 600-mesh marble waste powder particle size outperformed those with 3000-mesh and 400-mesh particle sizes in terms of strength.
(2) Different particle sizes of marble waste powder replace the microstructure of cement cementitious materials; the smaller the particle size of marble waste powder instead of cement, the denser the early microstructure, the more obvious the nucleation phenomenon, and the agglomeration between particles in the microstructure of 28 d is more serious. Marble powders with different particle sizes have low chemical activity, which can react with C3A hydration products in cement to form CaO·Al2O3·CaCO3·11H2O, and the reaction degree was low. The smaller the particle size, the higher the reaction degree. The influence of 600-mesh marble waste powder on the microstructure and hydration products of cementitious materials is the most obvious.
(3) For the replacement of cement cementitious materials with different particle sizes of marble waste powder, It was found that the diffraction peaks of C-S-H gel and Ca(OH)2 after 28 d were significantly lower than those at 3 d, which was contrary to that of pure cement. Whether it reacted with CaCO3 needs further discussion.
(4) Based on the experimental results and summary analysis, the dilution effect, nucleation effect, agglomeration effect, and a hydration reaction of marble waste powder were revealed, and the mechanism model of marble waste powder in composite cementitious materials was proposed. A strength prediction function model was created between the material dosage and compressive strength. The accuracy of the model was verified, and the calculation accuracy of the model was high.

Author Contributions

Conceptualization, W.Y.; writing—original draft, T.W.; writing—review and editing, W.Y. and T.W.; methodology, T.W. and J.Z.; visualization, T.W. and J.Z.; investigation, T.W. and J.Z.; supervising, W.Y.; resources, W.Y. and J.Z. and funding acquisition, T.W. and J.Z. All authors have read and agreed to the published version of the manuscript.

Funding

This research was funded by the Science and Technology Development Program Project of Hezhou (grant number, 1908006), Open Project of Guangxi Key Laboratory of Disaster Prevention and Reduction and Engineering Safety (grant number, 2019ZDX003), Open Project of Guangxi Key Laboratory of Water Engineering Materials and Structures (grant number, GXHRI-WEMS-2020-03), and First Class Discipline Construction Project of Ningxia University (grant number, NXYLXK2021A03).

Institutional Review Board Statement

Not applicable.

Informed Consent Statement

Not applicable.

Data Availability Statement

Not applicable.

Conflicts of Interest

The authors declare no conflict of interest.

References

  1. Al-Majidi, M.H.; Lampropoulos, A.; Cundy, A.; Meikle, S. Development of geopolymer mortar under ambient temperature for in situ applications. Constr. Build. Mater. 2016, 120, 198–211. [Google Scholar] [CrossRef] [Green Version]
  2. Mashaly, A.O.; El-Kaliouby, B.A.; Shalaby, B.N.; El–Gohary, A.M.; Rashwan, M.A. Effects of marble sludge incorporation on the properties of cement composites and concrete paving blocks. J. Clean. Prod. 2016, 112, 731–741. [Google Scholar] [CrossRef]
  3. Rana, A.; Kalla, P.; Csetenyi, L.J. Sustainable use of marble slurry in concrete. J. Clean. Prod. 2015, 94, 304–311. [Google Scholar] [CrossRef]
  4. Alyamaç, K.E.; Aydin, A.B. Concrete properties containing fine aggregate marble powder. KSCE J. Civ. Eng. 2015, 19, 2208–2216. [Google Scholar] [CrossRef]
  5. Hai, L.; Dewei, J.; Chenggang, C. Effect of fatty acid methyl ester polyoxyethylene ether on the rheological properties of cement filled with artificial marble waste powders. J. Clean. Prod. 2021, 328, 129053. [Google Scholar]
  6. Zhou, C.F. Study on the Treatment of Wastewater from Sulfur Chemicals by Using Waste Stone Powder and Utilization of Its by-Product. Master’s Thesis, South China University of Technology, Guangzhou, China, 2011. (In Chinese). [Google Scholar]
  7. El-Sayed, H.A.; Farag, A.B.; Kandeel, A.M.; Younes, A.A.; Yousef, M.M. Characteristics of the marble processing powder waste at Shaq El-Thoaban industrial area, Egypt, and its suitability for cement manufacture. HBRC J. 2018, 14, 171–179. [Google Scholar] [CrossRef] [Green Version]
  8. Belaidi, A.S.E.; Azzouz, L.; Kadri, E.; Kenai, S. Effect of natural pozzolana and marble powder on the properties of self-compacting concrete. Constr. Build. Mater. 2012, 31, 251–257. [Google Scholar] [CrossRef]
  9. Corinaldesi, V.; Moriconi, G.; Naik, T.R. Characterization of marble powder for its use in mortar and concrete. Constr. Build. Mater. 2010, 24, 113–117. [Google Scholar] [CrossRef]
  10. Natarajan, S.; Murugesan, P. Synergistic effect of marble powder and green sand on the mechanical properties of metakaolin-cement concrete. Materials 2019, 12, 476. [Google Scholar] [CrossRef] [Green Version]
  11. Xiao, J.; Guo, M.L.; He, Y.Q. Study on the effect of ground marble on the properties of cement gelled Material. Concrete. 2016, 1, 99–102. (In Chinese) [Google Scholar]
  12. Zhang, J.T. Study on the Influence of Marble Powder on Physical and Mechanical Properties of Cement-Based Materials. Ph.D. Dissertation, Guangxi University, Nanning, China, 2019. (In Chinese). [Google Scholar]
  13. Du, Y.; Yang, W.; Ge, Y.; Wang, S.; Liu, P. Thermal conductivity of cement paste containing waste glass powder, metakaolin and limestone filler as supplementary cementitious material. J. Clean. Prod. 2021, 287, 125018. [Google Scholar] [CrossRef]
  14. Ruiz-Sánchez, A.; Sánchez-Polo, M.; Rozalen, M. Waste marble dust: An interesting residue to produce cement. Constr. Build. Mater. 2019, 224, 99–108. [Google Scholar] [CrossRef]
  15. Valdez, P.; Barragán, B.; Girbes, I.; Shuttleworth, N.; Cockburn, A. Use of waste from the marble industry as filler for the production of self-compacting concretes. Mater. Constr. 2011, 61, 61–76. [Google Scholar]
  16. Bacarji, E.; Toledo Filho, R.D.; Koenders, E.A.B.; Figueiredo, E.P.; Lopes, J.L.M.P. Sustainability perspective of marble and granite residues as concrete fillers. Constr. Build. Mater. 2013, 45, 1–10. [Google Scholar] [CrossRef]
  17. Ergün, A. Effects of the usage of diatomite and waste marble powder as partial replacement of cement on the mechanical properties of concrete. Constr. Build. Mater. 2011, 25, 806–812. [Google Scholar] [CrossRef]
  18. Munir, M.J.; Kazmi, S.M.S.; Wu, Y.F. Efficiency of waste marble powder in controlling alkali–silica reaction of concrete: A sustainable approach. Constr. Build. Mater. 2017, 154, 590–599. [Google Scholar] [CrossRef]
  19. Li, L.G.; Huang, Z.H.; Tan, Y.P.; Kwan, A.K.H.; Chen, H.Y. Recycling of marble dust as paste replacement for improving strength, microstructure and eco-friendliness of mortar. J. Clean. Prod. 2019, 210, 55–65. [Google Scholar] [CrossRef]
  20. Zhang, J.; Desuo, C.; Tongkuai, W.; Qin, H.; Kengming, L. Experimental analysis on the effects of artificial marble waste powder on concrete performance. Anna. Chim.-Sci. Mater. 2018, 42, 347–362. [Google Scholar] [CrossRef]
  21. Rodrigues, R.; De Brito, J.; Sardinha, M. Mechanical properties of structural concrete containing very Fine aggregates from marble cutting sludge. Constr. Build. Mater. 2015, 77, 349–356. [Google Scholar] [CrossRef]
  22. GB/T1346-2011; Standard Water Consumption, Setting Time and Stability Test Method for Cement. Standardization Administration of China: Beijing, China, 2011. (In Chinese)
  23. GB/T 17671-1999; Cement Sand Strength Test Method (ISO Method). Standardization Administration of China: Beijing, China, 1999. (In Chinese)
  24. Prošek, Z.; Nežerka, V.; Tesárek, P. Enhancing cementitious pastes with waste marble sludge. Constr. Build. Mater. 2020, 255, 119372. [Google Scholar] [CrossRef]
  25. Varadharajan, S.; Jaiswal, A.; Verma, S. Assessment of mechanical properties and environmental benefits of using rice husk ash and marble dust in concrete. Structures 2020, 28, 389–406. [Google Scholar] [CrossRef]
  26. Mo, Z.; Wang, R.; Gao, X. Hydration and mechanical properties of UHPC matrix containing limestone and different levels of metakaolin. Constr. Build. Mater. 2020, 256, 119454. [Google Scholar] [CrossRef]
  27. Hu, L.; He, Z. A fresh perspective on effect of metakaolin and limestone powder on sulfate resistance of cement-based materials. Constr. Build. Mater. 2020, 262, 119847. [Google Scholar] [CrossRef]
  28. Adu-Amankwah, S.; Zajac, M.; Stabler, C.; Lothenbach, B.; Black, L. Influence of limestone on the hydration of ternary slag cements. Cem. Concr. Res. 2017, 100, 96–109. [Google Scholar] [CrossRef]
  29. Vardhan, K.; Goyal, S.; Siddique, R.; Singh, M. Mechanical properties and microstructural analysis of cement mortar incorporating marble powder as partial replacement of cement. Constr. Build. Mater. 2015, 96, 615–621. [Google Scholar] [CrossRef]
  30. Bayiha, B.N.; Billong, N.; Yamb, E.; Kaze, R.C.; Nzengwa, R. Effect of limestone dosages on some properties of geopolymer from thermally activated halloysite. Constr. Build. Mater. 2019, 217, 28–35. [Google Scholar] [CrossRef]
  31. Aliabdo, A.A.; Abd Elmoaty, M.; Auda, E.M. Re-use of waste marble dust in the production of cement and concrete. Constr. Build. Mater. 2014, 50, 28–41. [Google Scholar] [CrossRef]
  32. Ercikdi, B.; Külekci, G.; Yılmaz, T. Utilization of granulated marble wastes and waste bricks as mineral admixture in cemented paste backfill of sulphide-rich tailings. Constr. Build. Mater. 2015, 93, 573–583. [Google Scholar] [CrossRef]
  33. Bentz, D.P.; Ardani, A.; Barrett, T.; Jones, S.Z.; Lootens, D.; Peltz, M.A.; Sato, T.; Stutzman, P.E.; Tanesi, J.; Weiss, W.J. Multi-scale investigation of the performance of limestone in concrete. Constr. Build. Mater. 2015, 75, 1–10. [Google Scholar] [CrossRef] [Green Version]
  34. Xiao, J. The Study on Characteristics of Cement-Ground Limestone Gelation System. Ph.D. Dissertation, Central South University, Changsha, China, 2008. (In Chinese). [Google Scholar]
  35. Li, D.; Jin, L.; Du, X.L. Concrete mode-I mesoscale fracture model and its application in analysis of size effect at material level. Chin. Civ. Eng. J. 2020, 53, 48–61. (In Chinese) [Google Scholar]
  36. Huang, K.Z. Damage and Fracture Mechanism of Materials and Macro-Micro Mechanical Theory; Tsinghua University Press: Beijing, China, 1999. (In Chinese) [Google Scholar]
  37. Fares, G.; Albaroud, M.H.; Khan, M.I. Fine limestone dust from ornamental stone factories: A potential filler for a high-performance cementitious matrix. Constr. Build. Mater. 2019, 224, 428–438. [Google Scholar] [CrossRef]
  38. Liu, M.H.; Wang, X.Y.; Liu, X.; Jia, S.Y. Study on modification effect of calcium sulfate whiskers on stone powder content of manufactured sand concrete. Chin. Civ. Eng. J. 2021, 54, 56–64. (In Chinese) [Google Scholar]
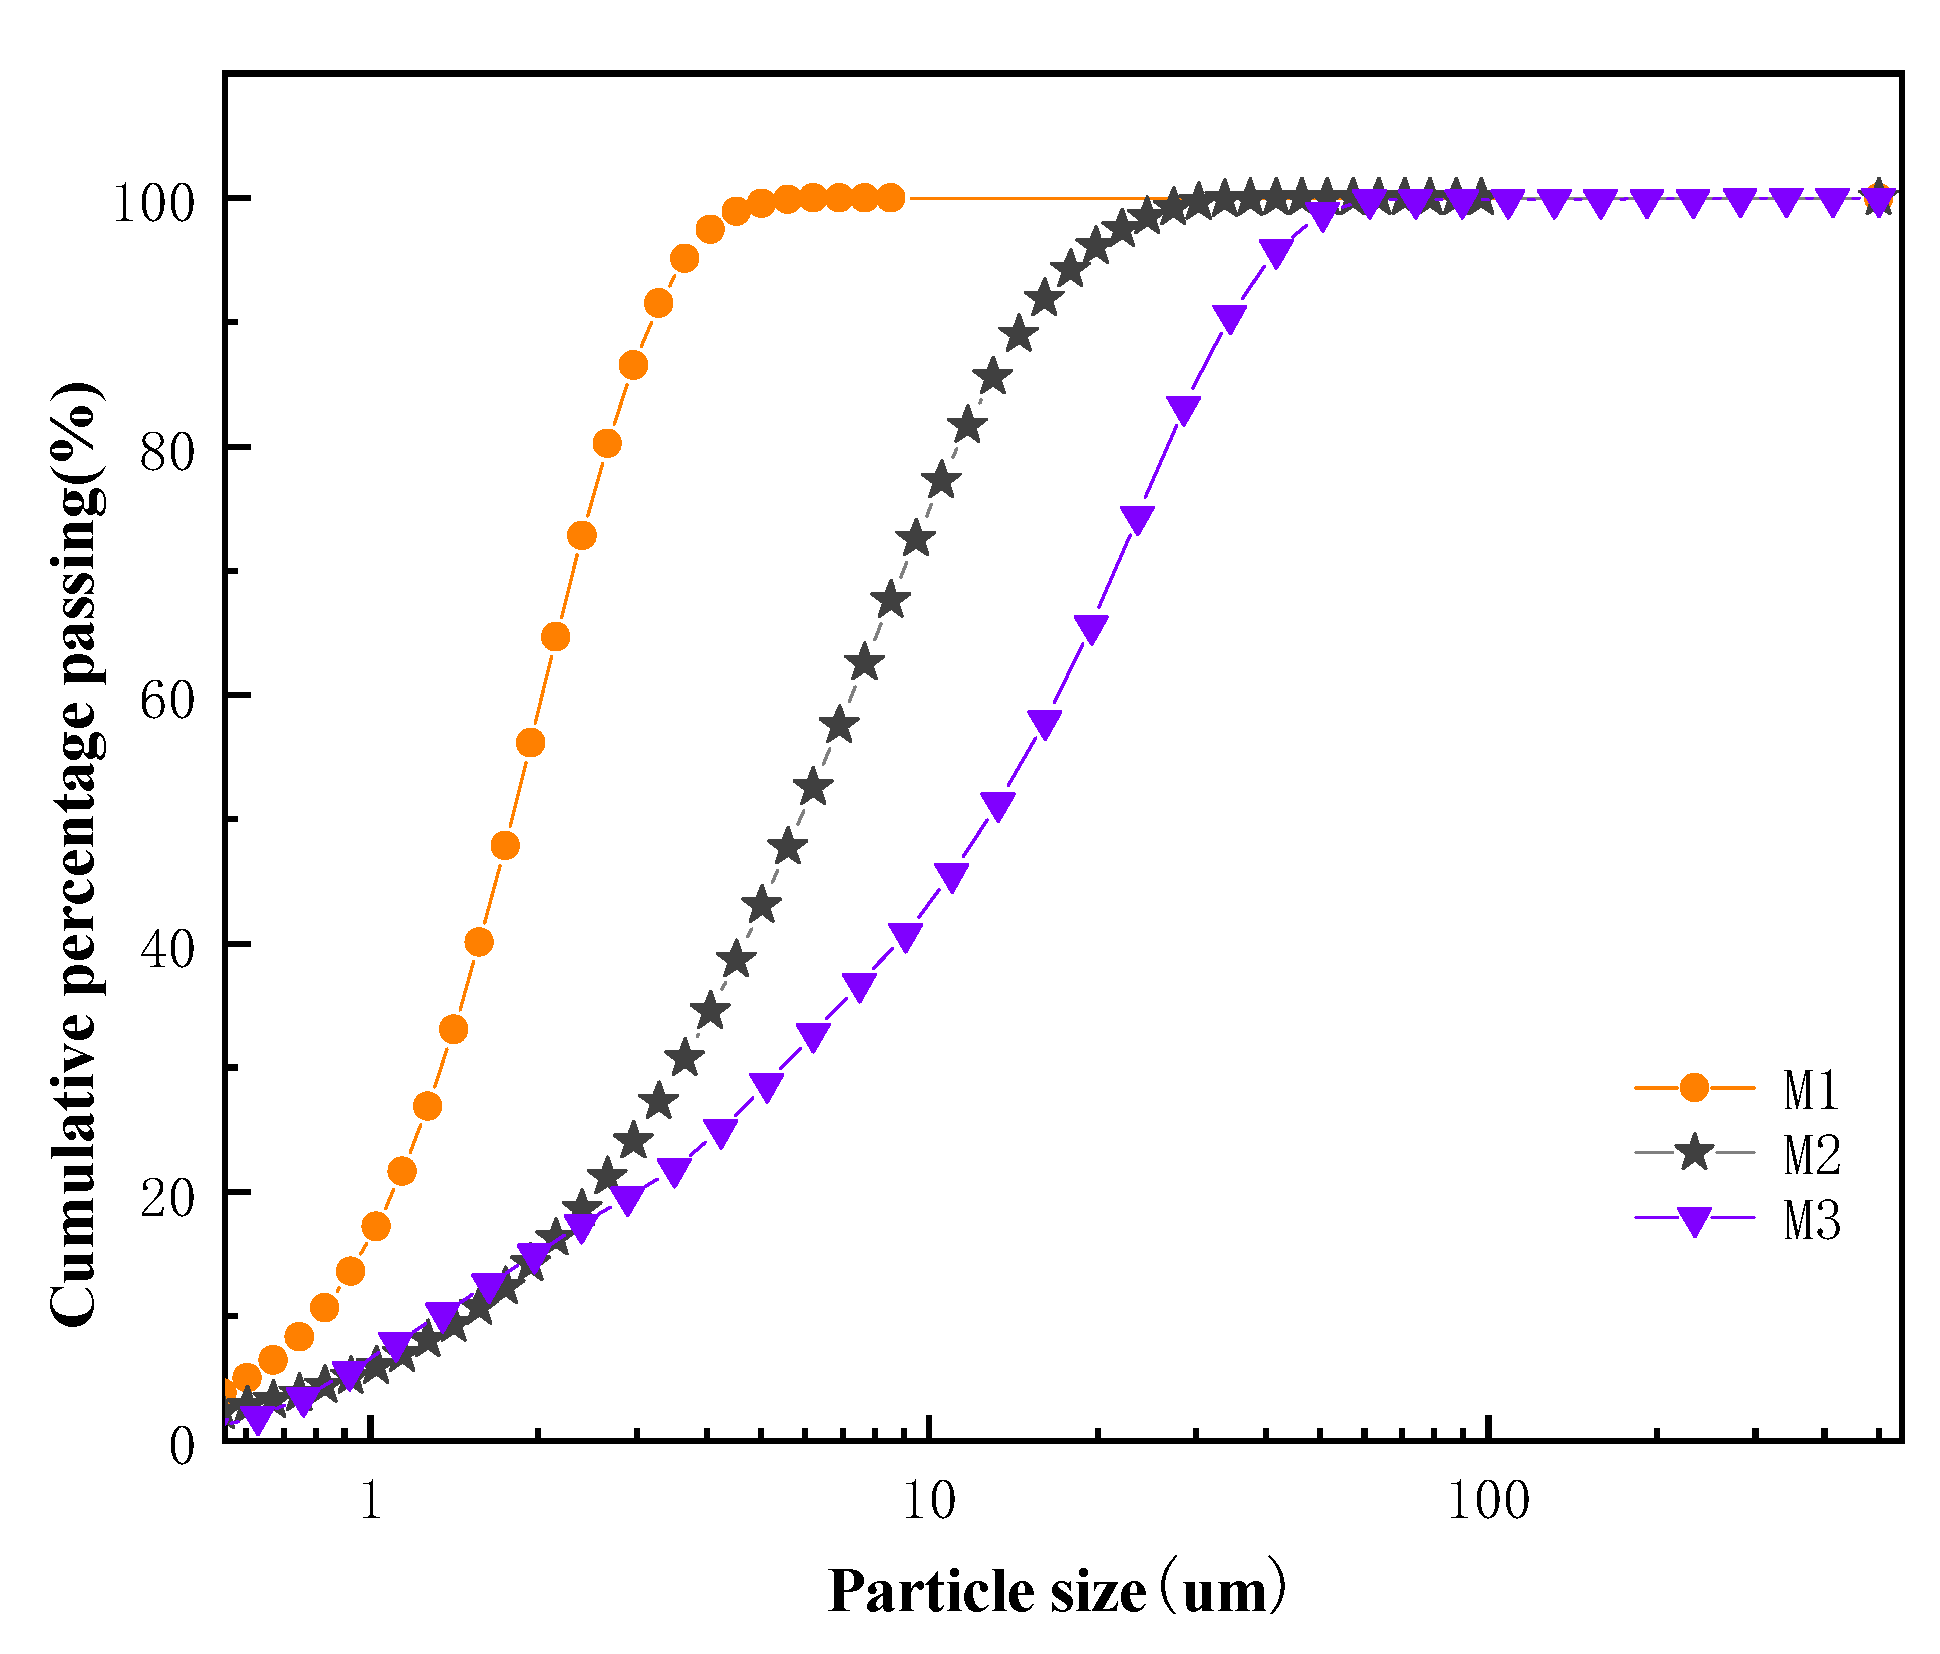
Figure 1. Raw material test samples.
Crystals 12 00868 g001
Figure 2. XRD of the marble waste powder.
Crystals 12 00868 g002
Figure 3. Particle size distribution curve.
Crystals 12 00868 g003
Figure 4. Test design and sample preparation process.
Crystals 12 00868 g004
Figure 5. Results of 3 d of compressive strength. (a) Compressive strength. (b) Efficiency of action.
Crystals 12 00868 g005
Figure 6. Results of 28 d of compressive strength. (a) Compressive strength. (b) Efficiency of action.
Crystals 12 00868 g006
Figure 7. Results of 3 d of flexural strength. (a) Flexural strength. (b) Efficiency of action.
Crystals 12 00868 g007
Figure 8. Results of 28 d of flexural strength. (a) Flexural strength. (b) Efficiency of action.
Crystals 12 00868 g008
Figure 9. Results of the cement sample SEM for different ages.
Crystals 12 00868 g009
Figure 10. Results of the PM1 sample SEM for different ages.
Crystals 12 00868 g010
Figure 11. Results of the PM2 sample SEM of different ages.
Crystals 12 00868 g011
Figure 12. Results of the PM3 sample SEM of different ages.
Crystals 12 00868 g012
Figure 13. XRD of different samples. (a) XRD of p sample.(b) XRD of PM1 sample. (c) XRD of PM2 sample. (d) XRD of PM3 sample. Q: C-S-H. M: Ca(OH)2. N: C3S + C2S. G: CaCO3. K: C3A·CaCO3·11H2O. I: C3AH.
Crystals 12 00868 g013
Figure 14. Comparison of the 3 d and 28 d XRD of Samples. (a) 3 d XRD of Samples. (b) 28 d XRD of Samples. Q: C-S-H. M: Ca(OH)2. N: C3S + C2S. G: CaCO3. K: C3A·CaCO3·11H2O. I: C3AH.
Crystals 12 00868 g014
Figure 15. Mechanism of the action model of marble waste powder of the composite gel material.
Crystals 12 00868 g015
Figure 16. Space micro unit of the hydration product. O is the central point of the hydration product. r is the radius of the spherical hydration product. a is space micro unit length size.
Crystals 12 00868 g016
Figure 17. Mechanical calculation model of the hydration products in a microscopic space unit. (a) Schematic illustration of the spatial stress of hydration products. (b) Stress profile of hydration.
Crystals 12 00868 g017
Figure 18. f(x) fitting results.
Crystals 12 00868 g018
Figure 19. Comparison of the theoretical and test values.
Crystals 12 00868 g019
Table 1. Sample particle size distribution.
SampleVolume Average Size (μm)Average Surface Area Particle Size (μm)Average Grain Diameter (μm)
D10D50D90D97
P18.282.860.9311.1333.8646.18
M11.911.400.811.793.193.98
M27.283.001.485.8815.0421.37
M316.874.181.3613.2837.5552.63
Table 2. Chemical compositions of the raw materials (wt%).
SampleSiO2Al2O3Fe2O3TiO2CaOMgOSO3K2ONa2OLOI
P21.804.602.400.1064.471.401.990.600.302.34
M0.030.010.010.1347.248.850.000.010.2043.52
Table 3. Test mix ratio.
SampleMarble Waste Powder (%)Marble Waste Powder (g)Cement (g)Standard Sand (g)Water (g)
1P00500-250
2PM120100400-250
3PM220100400-250
4PM320100400-250
5PJ004501350225
6P + M1522.5427.51350225
710454051350225
81567.5382.51350225
920903601350225
1025112.5337.51350225
11P + M2522.5427.51350225
1210454051350225
131567.5382.51350225
1420903601350225
1525112.5337.51350225
16P + M3522.5427.51350225
1710454051350225
181567.5382.51350225
1920903601350225
2025112.5337.51350225
Publisher’s Note: MDPI stays neutral with regard to jurisdictional claims in published maps and institutional affiliations.

