1. Introduction
Methods for processing polycrystalline materials, especially hard-to-deform alloys, via severe plastic deformation (stamping, drawing, extrusion, forging, etc.) usually include high homological temperatures [
1,
2]. An actual problem that manufacturers face during this processing is to obtain structures and products with optimal mechanical properties (high strength, high yield strength, low weight, etc.) [
3,
4]. Plastic deformation in these processes is usually accompanied by the appearance and evolution of structural defects at various structural-scale levels, which in turn causes inhomogeneity of the physical and mechanical properties [
5,
6]. The high temperature of the plastic deformation process and subsequent heating reduce the number of defects and promote their redistribution, increasing the uniformity of the structure. This is possible due to the implementation of a combination of two high-temperature processes, namely dynamic recovery (DRV) and dynamic recrystallization (DRX) [
5,
7,
8,
9,
10]. DRV is followed by reduction and redistribution of defects (primarily, dislocations) and densities, which usually results in the formation of subgrain, block–cellular, and cellular structures [
5,
7,
8,
11]. DRX refers to the formation and further development of new, less-defective grains by absorbing neighboring grains [
5,
7,
8]. If this process is implemented in the material in a heterogeneous way, where the stages of formation of DRX nuclei and their subsequent growth are clearly separated, then it is called discontinuous dynamic recrystallization (DDRX) [
5] or classical DRX [
7]. However, if the DRX process occurs homogeneously in such a way that the stages of formation and growth of new grains are not clearly distinguished, then it is called continuous dynamic recrystallization (CDRX) [
5,
7]. The main material characteristic of the development of a grain and defect structure during DRX and its type is the stacking fault energy (SFE). The increased SFE values promote the formation of a subgrain structure under active recovery effects, and accordingly the implementation of CDRX, while the lower SFE values are responsible for the occurrence of DDRX [
5,
7].
At present, the multilevel models of inelastic deformation with internal variables are widely used to simulate changes in the structure and responses of the materials [
6,
12,
13,
14,
15,
16]. There are three classes of multilevel models: statistical, direct, and self-consistent. Statistical models consider a representative macrovolume of a material (“macropoint”) as a set of individual grains combined into a polycrystalline aggregate, as hypothesized by Voigt, Reiss, and Kroener [
17,
18,
19]. Self-consistent (mean-field) models are based on solving the boundary single inclusion problem of a crystallite (grain, subgrain, fragment) embedded in a matrix by imaging the averaged (effective) characteristics of a polycrystal [
20,
21,
22]. Direct models rely on solving boundary value problems and on determining the field values of the model (stresses, strains, and internal variables) for each crystallite included in the representative macrovolume under consideration [
13,
23,
24]. Statistical models have been recognized by many authors as the least accurate among all three classes of models, yet their modifications make it possible to explicitly consider the current state of neighboring grains by highlighting their contact interactions along the conjugate flat sections of boundaries (facets) of grains [
25,
26]. Additionally, these models have high computational efficiency [
27]. One of the main drawbacks of the self-consistent models is that they are unable to take into account real physical interactions between the neighboring crystallites (e.g., exchange of dislocation flows, formation of orientation misfit dislocations) and require the replacement of the environment by a continuum with averaged properties, which do not reflect the real state of the grain and defect structures. Direct models are known to be the most accurate models, yet they remain the most resource-intensive [
28]. The implementation of direct models of crystallites with varying compositions and moving boundaries involves great computational difficulties, especially when studying a wider range of physical processes, including solid-state phase transitions and recrystallization processes.
Numerous approaches and methods have been developed to model DRX [
5,
29,
30]. Phenomenological models are the most simplified models, which include an empirical or semi-empirical description of a recrystallized material fraction. The Johnson–Mehl–Avrami–Kolmogorov (JMAK) kinetic equations form the basis for describing the evolution of the recrystallized volume fraction of polycrystals in these models [
31,
32,
33]. The development of this approach is associated with creating models able to describe such characteristics of the grain structure, as the grain size, grain shape, and grain boundary orientation [
34,
35,
36]. The JMAK equations often turn out to be insufficient for studying the grain structure evolution because they do not take into account the heterogeneous nature of the DRX process and are only applicable within a narrow range of variation in the initial structure, temperature, strain, and strain rate [
37,
38]. Recent developments in the computer technology provide an opportunity to develop physical approaches that permit an explicit description of the grain structure evolution [
5,
6]. In the framework of this class of models, internal variables and parameters are introduced to characterize the material structure and to assess factors responsible for the formation of DRX nuclei and for the migration of grain boundaries. Due to this, these models are applied to describe the formation of the required material structure, and they are well suited to technological regimes in the metallurgical and manufacturing industries. Within this physical approach, there are several types of models that include descriptions of dynamic recrystallization, in particular self-consistent [
8,
21,
39,
40] and direct [
41,
42,
43] models. One of the main problems encountered in modeling DRX processes is the description of the grain structure evolution that occurs due to the formation of new grains and due to the migration of their high-angle boundaries. To describe the grain structure evolution by applying the models of the above type, various approaches are typically used, including the Monte Carlo method [
44], cellular automaton method [
38,
45,
46], phase-field method [
47], level set method [
43,
48], graph theory based methods [
49,
50], and some others.
Despite the great number of approaches and methods, the problem of modeling the grain structure evolution during DRX still remains an urgent research issue and requires further research. Recent papers [
8,
38,
40,
43] are indicative of a current interest in this subject. The topicality of the problem is also related to the presence of a relationship between the current state of the grain structure and the macro-properties of polycrystals. This fact has been repeatedly confirmed by the results of many independent experiments [
5,
51,
52]. The most well-known manifestation of the influence of the state of the grain structure on the properties of the material is the dependence of the yield strength on the average grain size (Hall–Petch equation) [
53,
54,
55]. Severe hot plastic deformation produces significant changes (usually refinement) in the grain structure, which are mainly associated with DRX [
5,
7]. The grain structure determined by the shape and size of crystallites is of decisive importance in providing effective mechanical properties (plasticity, creep, hardness, fatigue, etc.) of a polycrystalline material [
56,
57]. As an example, the formation of equiaxed grains and their refinement during recrystallization facilitate the implementation of grain boundary sliding, and consequently the initiation of deformation in the structural superplasticity mode under appropriate temperature and velocity conditions [
26,
58]. This causes abnormally large deformations to appear at almost constant and relatively low values of plastic flow stress.
In view of the foregoing, the problem of developing an advanced constitutive physical model of a polycrystalline material relying on an explicit physical description of the DRX process needed to analyze the evolution of grain and defect structures is of particular importance. In this paper, we propose an original method of statistical modeling to form and reconstruct the grain structure by applying Laguerre polyhedra [
59]. The developed geometric model for describing the grain shape and grain size allows one to overcome the above-mentioned difficulties inherent in using self-consistent and direct models. It has high computational efficiency and is able to describe the peculiarities of physical mechanisms, where the decisive factor is the interaction between contacting grains.
Section 2 presents the structure, scale levels, and relationships of an advanced statistical multilevel model for describing inelastic deformation with allowance for the DDRX and the mechanism governing the formation of nuclei and their development into individual low-defect grains.
Section 3 discusses a method for grain structure formation and reconstruction during high-temperature deformation using the Laguerre polyhedra, as well as subsequent processing and transfer of the obtained data on the grain structure to the advanced statistical model.
Section 4 gives a description and analysis of the obtained results.
2. The Advanced Statistical Multilevel Model for Describing Inelastic Deformation during Discontinuous Dynamic Recrystallization
This study investigates DDRX, which is a common phenomenon encountered in plastic formation of a wide class of polycrystalline materials with medium and low SFE values, including copper, nickel, austenitic steels, and some aluminum alloys [
5,
7]. At the initial stage of hot plastic deformation, DDRX is characterized by the formation of low-defect nuclei, which absorb the neighboring more-defective grains due to boundary migration. Thus, two processes are responsible for the occurrence of DDRX: (1) the formation of nuclei and their further development into new grains; (2) the migration of the high-angle boundaries of DRX grains [
5,
7]. DRX nuclei have a characteristic size of the order of a micrometer and are not formed due to random fluctuations, as in the case of phase transitions [
5]. They appear in the course of directed rearrangement of defect and subgrain structures. For most metals, the commonly accepted mechanism of nuclei formation during DDRX involves the movement (“bending”, “swelling”) of the grain boundary regions associated with the original subgrains of a polycrystal [
60,
61,
62,
63]. This mechanism, first investigated for static recrystallization, was described in [
64]. The presence of this phenomenon during DDRX was confirmed by the theoretical and experimental results of many researchers [
60,
61,
63,
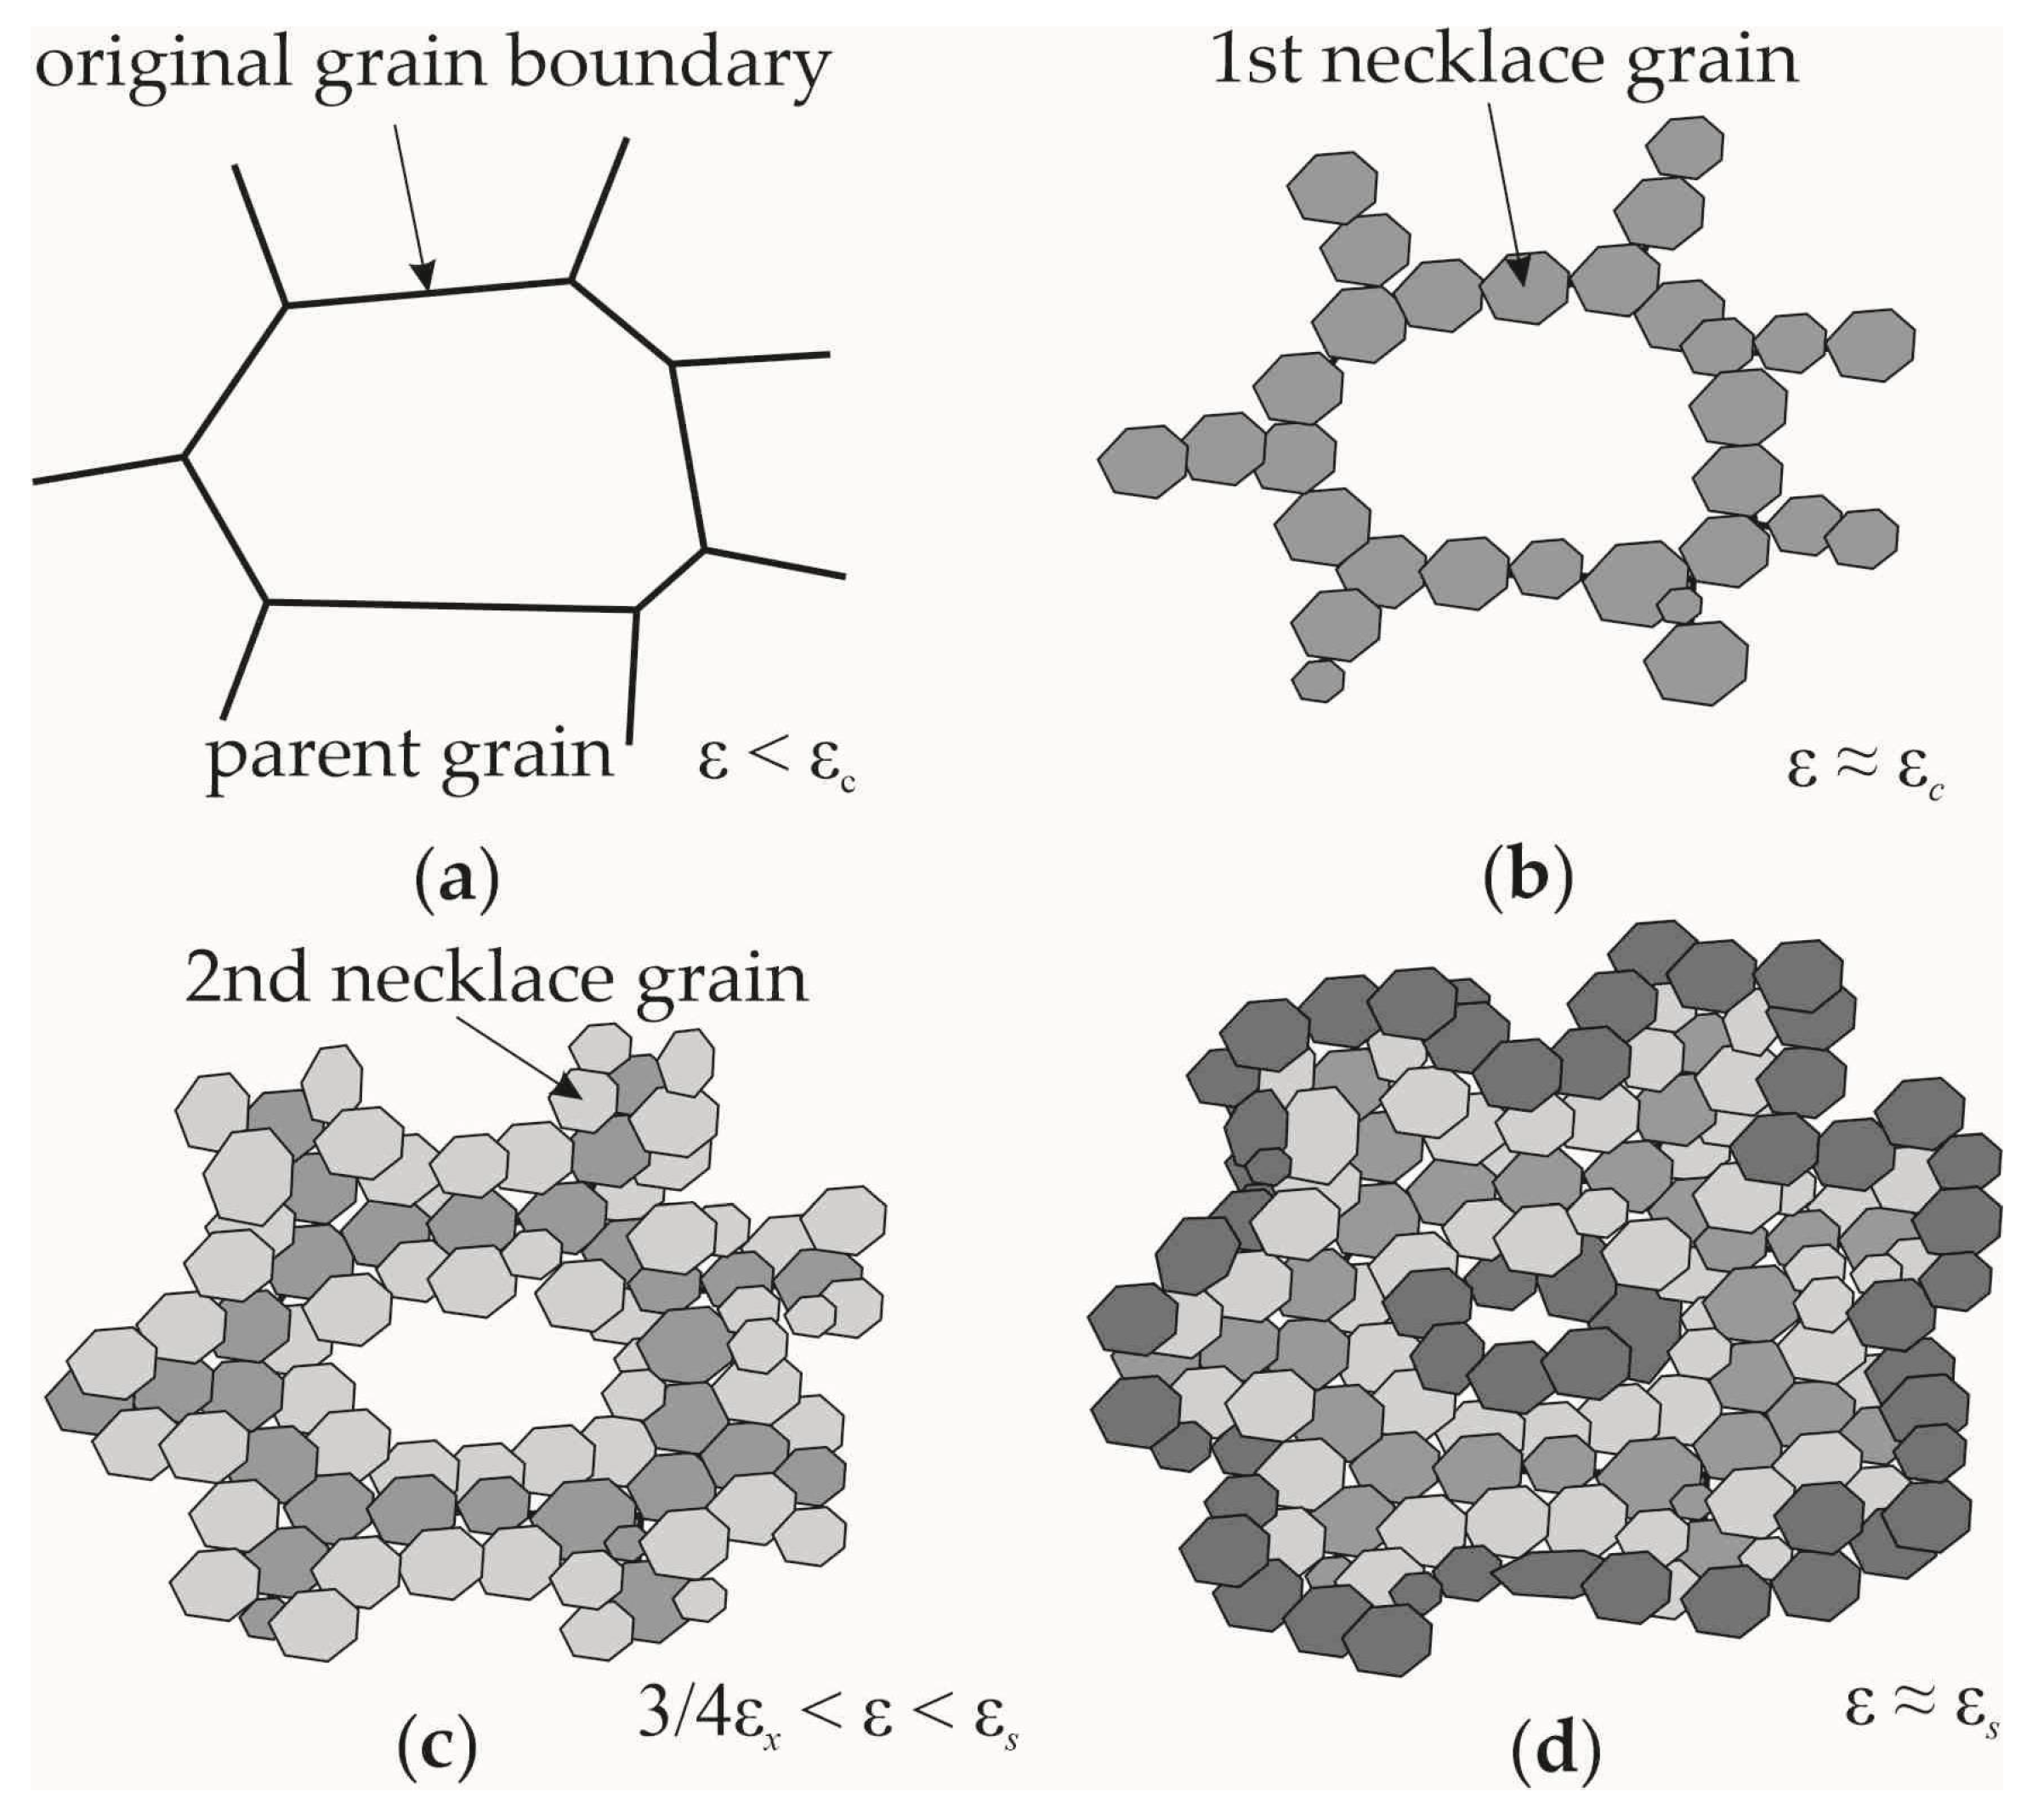
65]. The development of the DDRX process governed by this mechanism is presented schematically in
Figure 1. Initially, the first nuclei layer is formed at the original grain boundaries, and it has orientation coherency with the parent grain (
Figure 1b). In a similar way, new grains (their average size decreases gradually) are formed at the boundaries of previously recrystallized grains (
Figure 1c,d). These grains occur due to the addition of atoms to a subgrain (a DRX nucleus) along the grain boundaries and due to their subsequent penetration deep into the defective grain. In
Figure 1, the following designations are used:
is the critical deformation up to which no DRX occurs;
is the deformation corresponding to the maximum value of stresses
in the load diagram;
is the deformation corresponding to almost complete recrystallization of the material;
is the deformation corresponding to one recrystallization cycle (
).
Previously, the authors developed an advanced statistical multilevel model intended for describing static [
25] and dynamic recrystallization [
66,
67]. In these papers, the processes of preliminary plastic deformation and the subsequent annealing of the material or its deformation at a given temperature were investigated to evaluate the initial stage of recrystallization. The present article provides a description of a significantly modified model in regard to refining the simulation of the polycrystal grain structure evolution. The model is designed to study the processes of severe plastic deformation of polycrystalline materials at elevated temperatures of inelastic deformation.
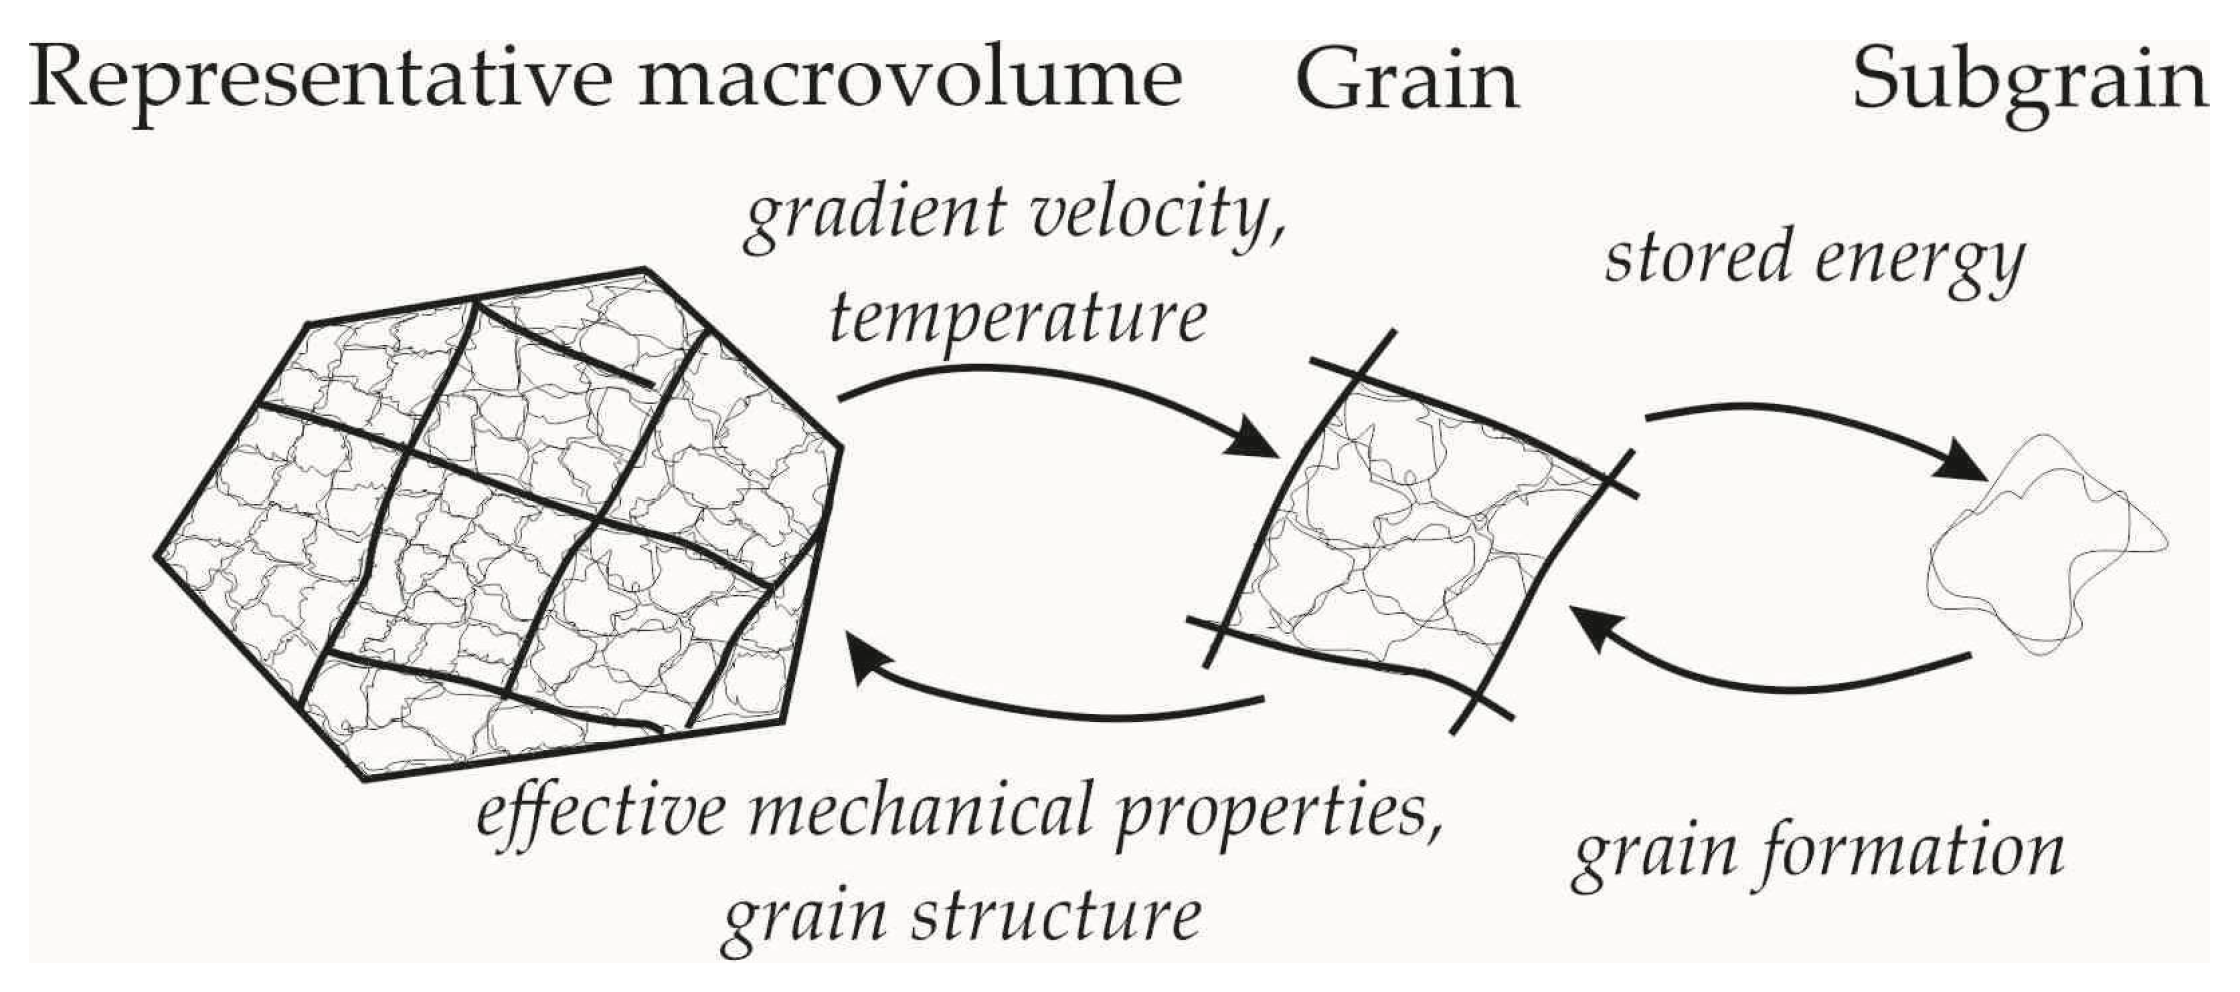
In solving the formulated problem, we distinguish three structural levels in the structure of a statistical multilevel model. They are the macrolevel, mesolevel-I, and mesolevel-II. At the macrolevel, the statistical description of a representative number of grains with uniform distribution of orientations of crystallographic axes in the space of the reference configuration is carried out. At mesolevel-I, the behavior of a separate grain consisting of mesolevel-II elements (homogeneous subgrains) is investigated. The grains are separated by high-angle boundaries, whose misorientation is greater than 10–15 degrees; the subgrain misorientation is about several degrees, and as a rule it increases with increasing inelastic deformation [
5,
68]. A scheme illustrating the relationship between the scale-based submodels is shown in
Figure 2.
At the macrolevel, the effective properties of the material are determined and the impacts are transferred from this level to the underlying scale levels. For each moment of time
, the mechanical and thermal effects are prescribed and the velocity gradient
and temperature
are assumed to be known at the macrolevel. Therefore, for each grain, the following equality is true [
6]:
where
is the velocity gradient of the grain’s material particle;
is the grain temperature;
is the Hamilton operator in the current Lagrangian coordinate system;
,
are the velocity vectors obtained at macro and mesolevels. The indexes denoting the grain (subgrain) number are omitted hereinafter, unless otherwise specified.
At mesolevel-I, the problem of determining the stress–strain state of a grain and the corresponding internal variables of the model is solved using an advanced statistical model. The mathematical formulation of a mesolevel-I model contains the following relations [
66,
67]:
The corresponding initial conditions are written as follows [
6]:
Here,
is the mesolevel weighted Kirchoff stress tensor;
is its corotational derivative;
is the mesolevel Cauchy stress tensor;
is the strain measure satisfying the objectivity requirement;
,
are the mesolevel elastic and inelastic components of the strain rate measure;
is the elastic component of the transposed velocity gradient;
denote the material density in the reference and current configurations, respectively;
is the shear rate on the
k-th intragranular slip system;
is the shear rate on the slip system when the tangential stress reaches the critical shear stress;
is the strain rate sensitivity exponent of the material;
are the unit vectors of the slip direction and the normal to the
k-th slip system, respectively;
H is the Heaviside function;
are the shear and critical stresses of the
k-th system, respectively;
are the components of critical stresses of the
k-th system, which occur due to the interactions of dislocations with the dislocation structure and grain boundaries, respectively;
are the total squared critical stresses in the grain under study at the current and initial instants of deformation, respectively;
is the matrix describing the crystal hardening caused by the interactions between dislocations and forest dislocations;
is the latent hardening parameter;
is the saturation stress;
,
are the parameters describing material hardening;
,
denote the number of slip systems and the number of facets of the considered grain, respectively;
,
are the grain area and the
j-th grain facet, respectively;
is the parameter characterizing the interactions between the dislocations of the
s-th slip system of the considered grain and those of the neighboring grain along the
j-the facet, respectively (the definition of this parameter is given in [
69]);
is the component of the shear barrier stresses acting on the
k-th slip on the side of orientation misfit dislocations that appear in the facets because of the dislocation motion on the
s-the system;
is the dimensionless parameter defined during the model identification procedure;
is the elastic tensor of the crystallite, the components of which
were defined and turned out to constant in the actual basis
(in the reference configuration, the basis vectors are denoted by
) of the rigid moving coordinate system (MCS) rotating with spin
. The rigid orthonormal coordinate system is related to one crystallographic direction and the crystallographic plane containing this direction. In the reference configuration, the basis of the MCS coincides with the basis of the crystallographic coordinate system (CCS). The basis of the CCS is distorted during deformation, while the basis of the MCS remains rigid. The motion relative to the CCS is a deformation motion. The definition of MCS and spin is given in [
70];
is the tensor that combines the MCS with the laboratory coordinate system (LCS);
is the dimensionless experimentally determined correction parameter characterizing the fraction of energy stored in dislocations;
is the shear modulus;
is the Kronecker delta; the dot above the corresponding mesolevel variables denotes the material time derivative
; the subscript
denotes the transpose of the value of the second rank tensor. The transition to macrolevel variables is implemented via volume averaging of the corresponding mesolevel variables. To describe hardening by analyzing the interaction of mobile dislocations with forest dislocations (relation for
), we apply the known hardening law [
71,
72] and the grain boundary hardening law (relation for
) described in [
69].
At the macrolevel, we calculate the average values of stresses
, elastic properties
, and an inelastic component of the velocity gradient
[
6]:
where
is the volume averaging operator.
At the mesolevel-II (the level of individual subgrains), which is an auxiliary level, there is an opportunity to accurately evaluate the above DDRX recrystallization mechanism when modeling the formation of the nuclei located near the grain boundary. When the Bailey–Hirsch criterion is satisfied, the DRX nuclei start to grow, and as a result new grains are formed. According to this criterion, a decrease in local volume energy due to defect elimination must be greater or equal to an increase in grain boundary energy that is caused by an increase in the boundary area during the formation of a recrystallized grain [
73]:
where
is the increase in the boundary area when a subgrain volume (a DRX nucleus) changes by
,
is the difference between the specific energies of adjacent subgrains stored per unit volume
i and
j, and
is the energy per area unit for the boundary between the
i-th and
j-th subgrains.
In order to apply criterion (15) and calculate the values of
,
, we introduce an additional mesolevel-II variable (a characteristic subgrain size)
. We speak of nuclei that are spherical in shape and assume that the initial subgrain size distribution obeys the Rayleigh law [
62,
63]. If the necessary experimental data are available, then we can use other distribution laws. It is assumed that the size of subgrains does not change during deformation. The recrystallization nuclei are located near the boundary (a set of facets). Each facet of the grain under consideration is assigned a sample of subgrain sizes (recrystallization nuclei)
r according to the Rayleigh law. The validity of the recrystallization criterion (15) is verified for every subgrain separated by the high-angle boundary from the neighboring ones.
We do not consider here the mechanism governing the formation of new grains from subgrains during their rotation until the high-angle misorientations with the parent grain occur. We suppose that new grains are formed only during the DRX process. In the volume of one grain, the subgrains are separated by the low-angle boundaries and are slightly misoriented relative to each other. Thus, it is reasonable to believe that the stored energy
, determined by relation (15), is approximately the same in all subgrains within one grain. The data on the stored energy
calculated at mesolevel-I and needed to verify the validity of the recrystallization criterion (15) are transmitted to mesolevel-II. Thus, we have:
where
is the stored energy at mesolevel-II. The difference in stored energy between the subgrains belonging to different grains but having a common high-angle boundary may be significant.
In fulfilling criterion (15), we assume that DRX nuclei are active and that they are separated into individual grains. This separation proceeds in two stages. At the first stage, when condition (15) is satisfied, the active nuclei are added to the static model; at the second stage, the polyhedral grain structure is rearranged by considering new recrystallized grains. The description of this method is given in
Section 3. The new DRX grains are considered to be low-defective; thus, all internal variables of a recrystallized grain in the annealed material correspond to the reference configuration, with the exception of the new grain orientation determined by the tensor
and the geometric characteristics. A refined definition of these characteristics is also given in
Section 3. The volume of the new DRX grain is subtracted from the volume of the parent grain. Experimental data [
5,
61] indicated that for the mechanism of DRX nuclei formation considered here, the new (recrystallized) grains have a consistent orientation coherency with the parent grain. It was shown that the new grain is separated from the parent grain by a high angle boundary, and it has initial orientation with respect to the parent grain within the range from 10 to 15° with a random axis of rotation [
5,
61]. The DRX grain orientation with respect to the neighboring (absorbed) grain is arbitrary (
Figure 1b). At this stage of modeling, in order to evaluate the influence of grain boundary hardening, we assume that the new grain is surrounded by six identical facets, and the neighboring grains are determined in a random way.
The migration of the high-angle boundary of a new grain occurs at temperatures sufficient to ensure its mobility. The Arrhenius law is used to study the effect of temperature on the high-angle mobility [
5]:
where
is the absolute temperature;
is the universal gas constant;
is the activation energy of the grain boundary migration;
is the experimentally determined pre-exponent. The high angle boundary migration velocity
is determined by the product of the driving force
(the indexes denoting the neighboring crystallites are omitted) and the mobility
[
5]:
At this stage of model development, we assume for simplicity that the shape of the recrystallization nuclei is spherical (the refine geometry of recrystallized grains is described in
Section 3) and that each new recrystallized grain penetrates deep into the neighboring grain. In this case,
is equal to the rate of change of the ball radius
, which describes the shape of the recrystallized grain, i.e.,
(the dot above
shows the material derivative). The absorbed grain volume is reduced by the volume of recrystallized grains. The volume fraction of the recrystallized material
in a polycrystal is determined through the following relation:
where
is the initial value of the representative volume of a polycrystal under consideration;
is the DRX material volume;
is the number of DRX grains;
is the
i-th DRX grain volume.
3. Rearrangement of the Grain Structure Formed during High-Temperature Deformation with Recrystallization
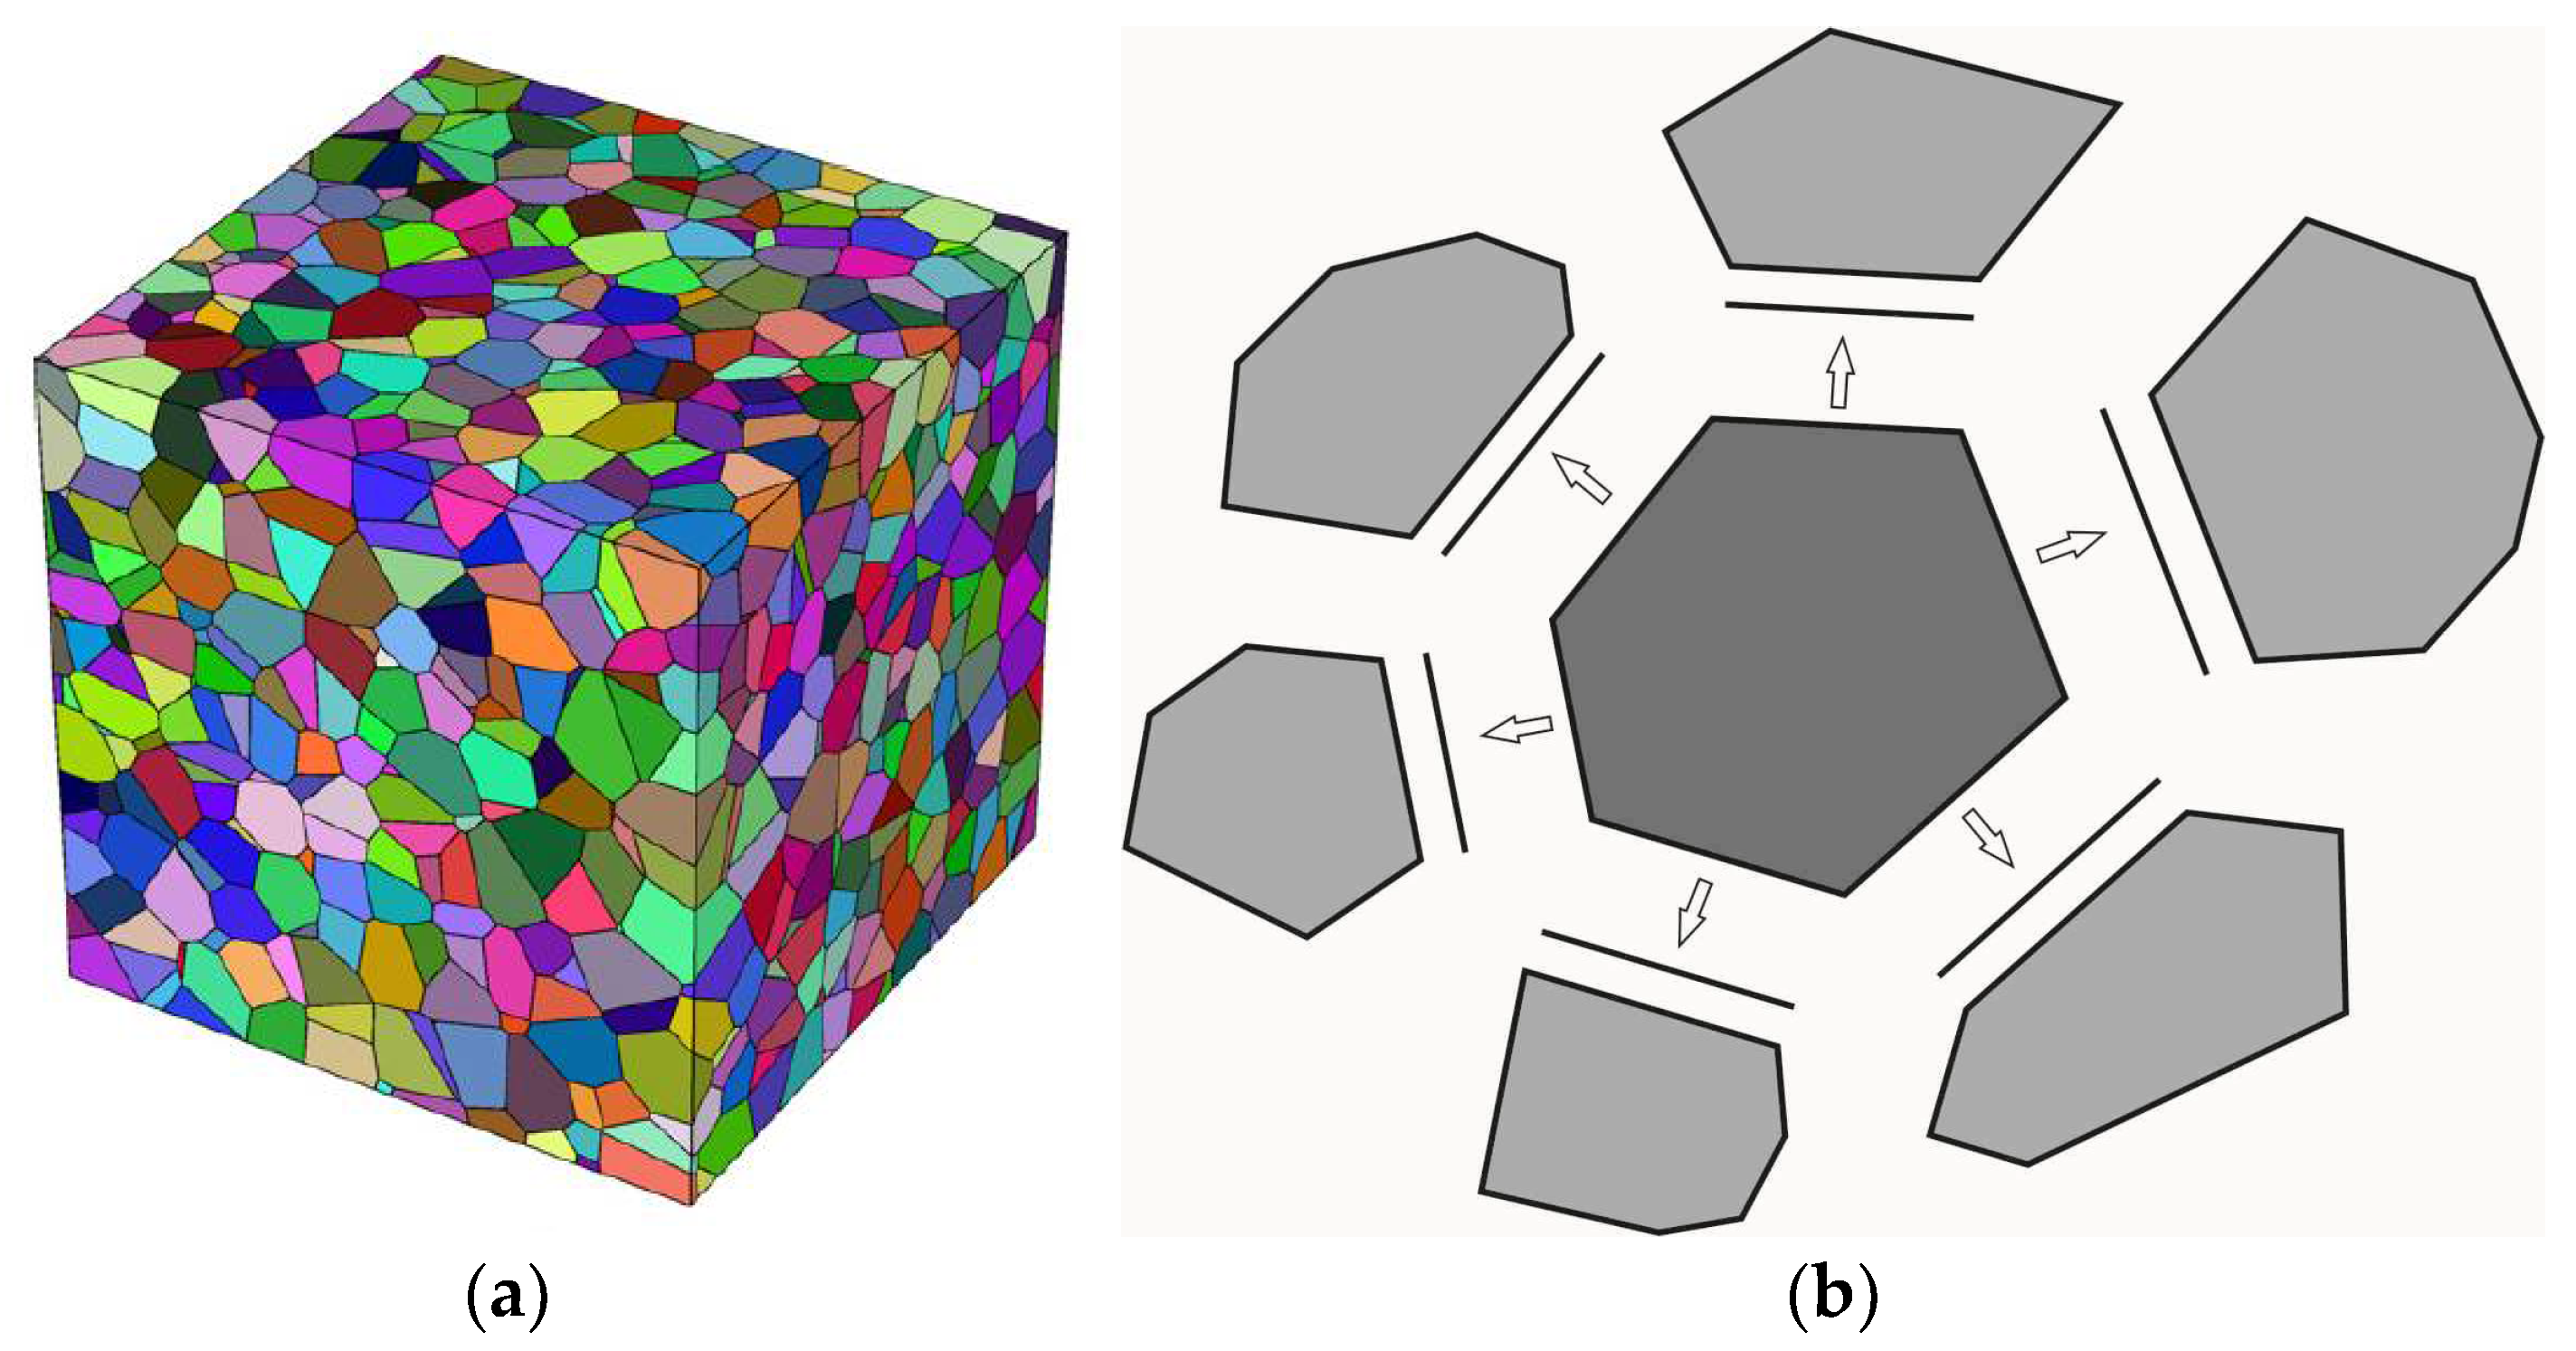
During recrystallization, the grain structure varies continuously; changes are related to changes in the number, shape, and size of the grains under study. We propose a method for the formation of the grain structure and its rearrangement during deformation, which allows consideration of the formation of new DRX grains. The developed method is applied for a statistical model, one of the main tasks of which is to solve the problem of grain structure rearrangement during recrystallization and to establish a correspondence between the geometric image of a real grain structure described by polyhedra (
Figure 3a) and its model representation in the framework of the modified statistical model (
Figure 3b). In this model, the grain structure is determined by such internal variables as the grain volume
, the facets with the normal
and the area
(where
j denotes the number of a facet), and through assigning neighboring grains to the considered grain. First, the initial polyhedral grain structure is formed in the software package Neper [
59]. Then, the obtained data are transferred to the calculation module of the statistical model for the implementation of the inelastic deformation model described above.
The modeling of active recrystallization nuclei proceeds in two stages. Information on the first stage of the simplified description is given in the previous section of this article. During this stage, subgrains (DRX nuclei) are assigned to each facet of the initial grains. As the recrystallization criterion (15) is met, these subgrains are considered as independent grains added, without taking into account their geometric shape, to sample data of the statistical model. When the volume fraction of active recrystallization nuclei
reaches its critical value of 20% (found in computational experiments), the second stage at which the new grains are introduced into the geometric model of a representative volume begins. To this end, we again start the procedure for generating a polyhedral grain structure in the Neper program [
59]. This allows us to take into account new grains and to find whether the statistical model is consistent with the calculation scheme. With the software package Neper, we construct a polyhedral structure on the basis of the laws of distribution through the sphericity parameters
(the ratio of the surface area of the sphere, whose volume is equal to the volume of a considered grain to the grain surface area) and the normalized grain size
(
, where
is the grain size defined as the radius of a sphere of equivalent volume and
is the average grain size). To this end, the Neper involves the numerical implementation of optimization methods [
59].
After the polyhedral grain structure is formed in Neper, the obtained data (grain volumes, normals, and facet areas with indication of neighboring grains) are transferred to the statistical model, where the grain structure is redefined. Note that new crystallites are introduced into the geometric structure of the considered region through DRX simulations; previously, the statistical model does not take into account the geometry of this region. To compare the initial and newly deformed structures, we consider two types of grains: original defective grains and new DRX grains. The main geometric characteristic of grains is their size, which is determined by the volume of an equivalent sphere. The defect structure is primarily characterized by the stored energy
. At critical deformation
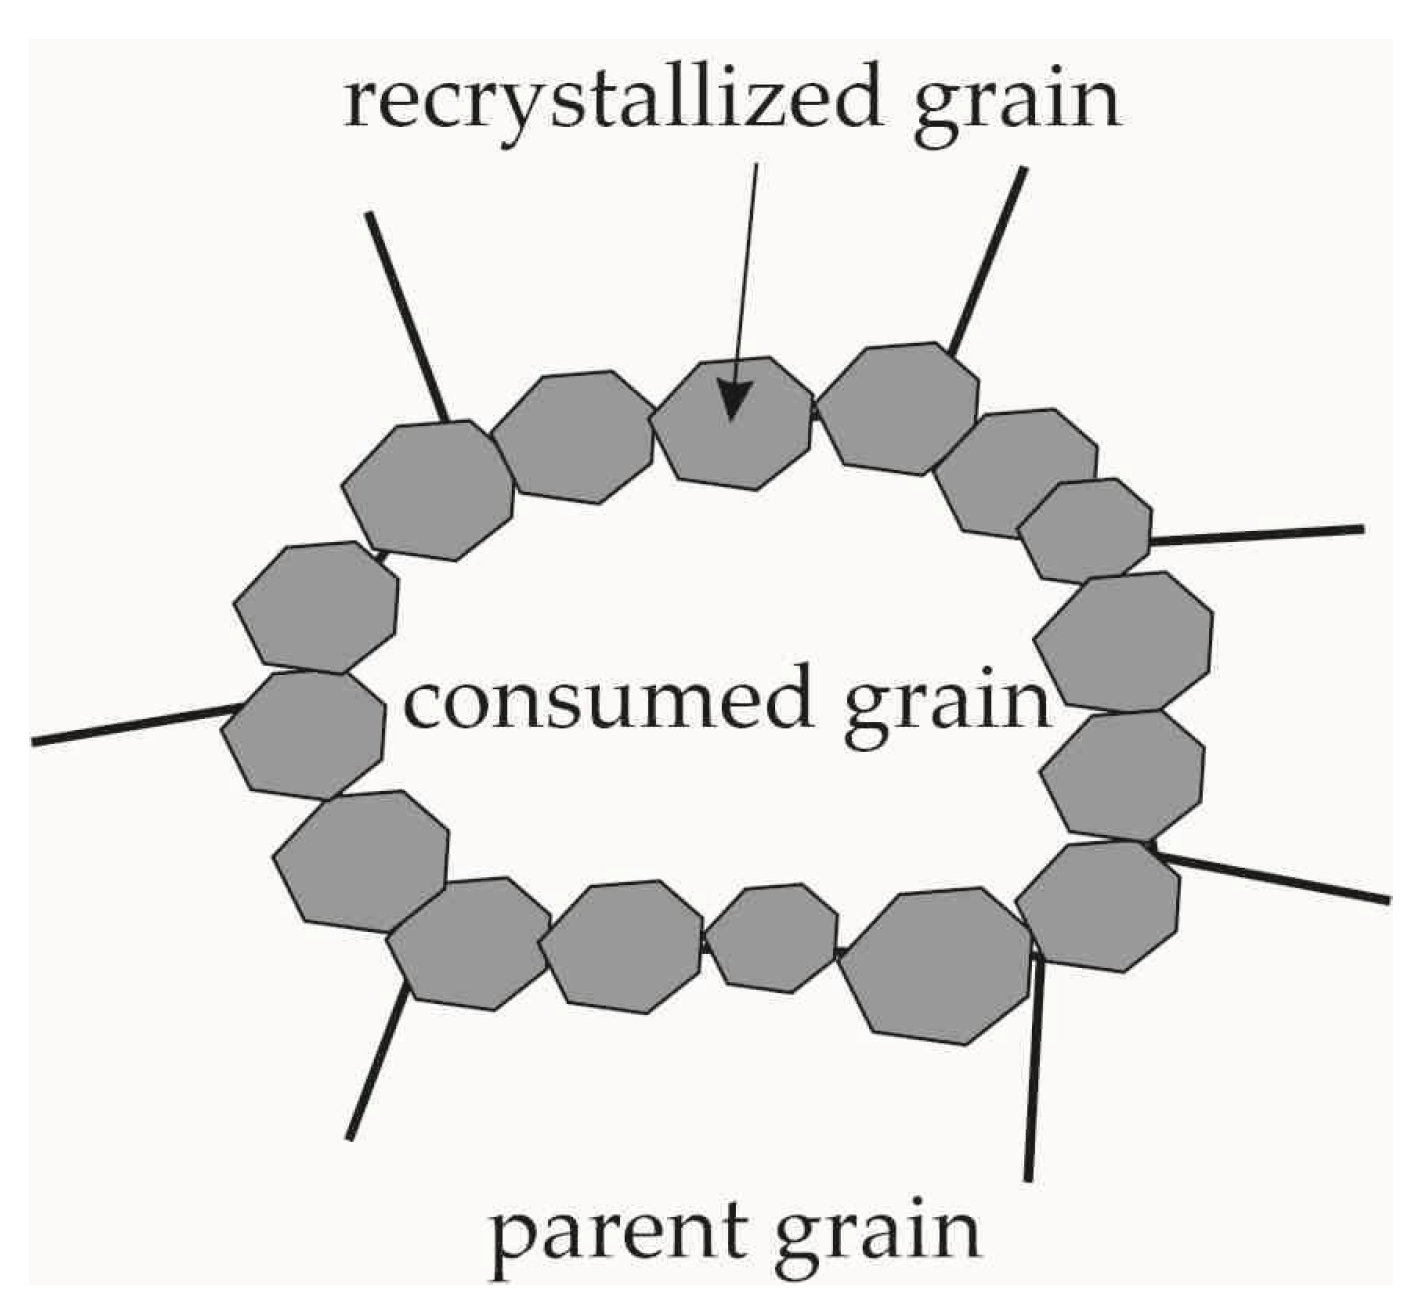
, large non-recrystallized grains usually coexist with fine recrystallized grains (
Figure 1b), and a bimodal grain size distribution is generally observed. In this case, we distinguish a cluster of grains, namely a large “consumed” defective grain surrounded by fine DRX grains for the initial grain structure (
Figure 4). Initially, we compare all grains according to their characteristic sizes. For this purpose, the square of difference in grain sizes is assumed to be minimal for original and new grain structures. At later recrystallization stages where the grain size distribution is close to unimodal (
Figure 1d), the grains are also compared vs. their sizes. In both cases, the variant of the grain structure, determined with regard to the best fit of grain sizes, is taken as the initial approximation. Then, the genetic algorithm method [
74] is applied to perform a purposeful selection of grains. This allows us to reach a minimum in distribution of the difference between the energies stored in the grains of original and new structures (comparison is made by the mathematical expectation of the stored energy distribution and grain sizes). The conditions for the migration of grain boundaries before and after the geometric structure rearrangement will be statistically equivalent, which ensures “continuity” in the simulation of the recrystallization process.
Next, we describe the grain structure evolution in terms of a statistical model. The grain structure is subjected to thermomechanical loading change for the following two reasons. The first is due to mechanical influences, mainly due to the movement of dislocations during inelastic deformation, whereby the areas and normals of grain facets vary according to the known formulas of continuum mechanics [
75]:
where
are the areas of facets in the reference and actual configurations with corresponding normal
;
is the operation of a determinant; is the facet number. The changes in grain volume observed during elastoviscoplastic deformation are neglected. The statistical model of inelasticity is based on the Voigt hypothesis, and a deformation gradient
is known at every instant of deformation.
The second mechanism governing the grain structure changes is diffusion, which is realized when the high-angle boundaries migrate deep into the defective grains in the direction of the outer normal. Due to this process, both the numbers of grains and their neighbors (adjacent grains) change, and hence there arises a need for reconstructing a polyhedral grain structure in the software package Neper. In DRX simulation, the known value is the boundary migration velocity
, which is determined by Equation (18) for each facet at every instant of thermomechanical process. The driving force
is determined by relation (15), where
,
mean that the area and volume, respectively, of recrystallized grains increase. As the grain grows, the second term in (15) does not contribute to
, meaning this value is almost completely determined by the difference in stored energy between neighboring grains. It is assumed that the migration velocity of the boundary facet is directed along the outer normal
of the boundary facet, i.e., the following ratio is true:
Due to its significant non-linearity, the problem is solved by a step-by-step method, where the step size
is determined from the analysis of the results of a series of numerical experiments. It is assumed that in the time interval
,
is constant. The velocity vector
resulting from the boundary migration is calculated for
by integrating (21) as:
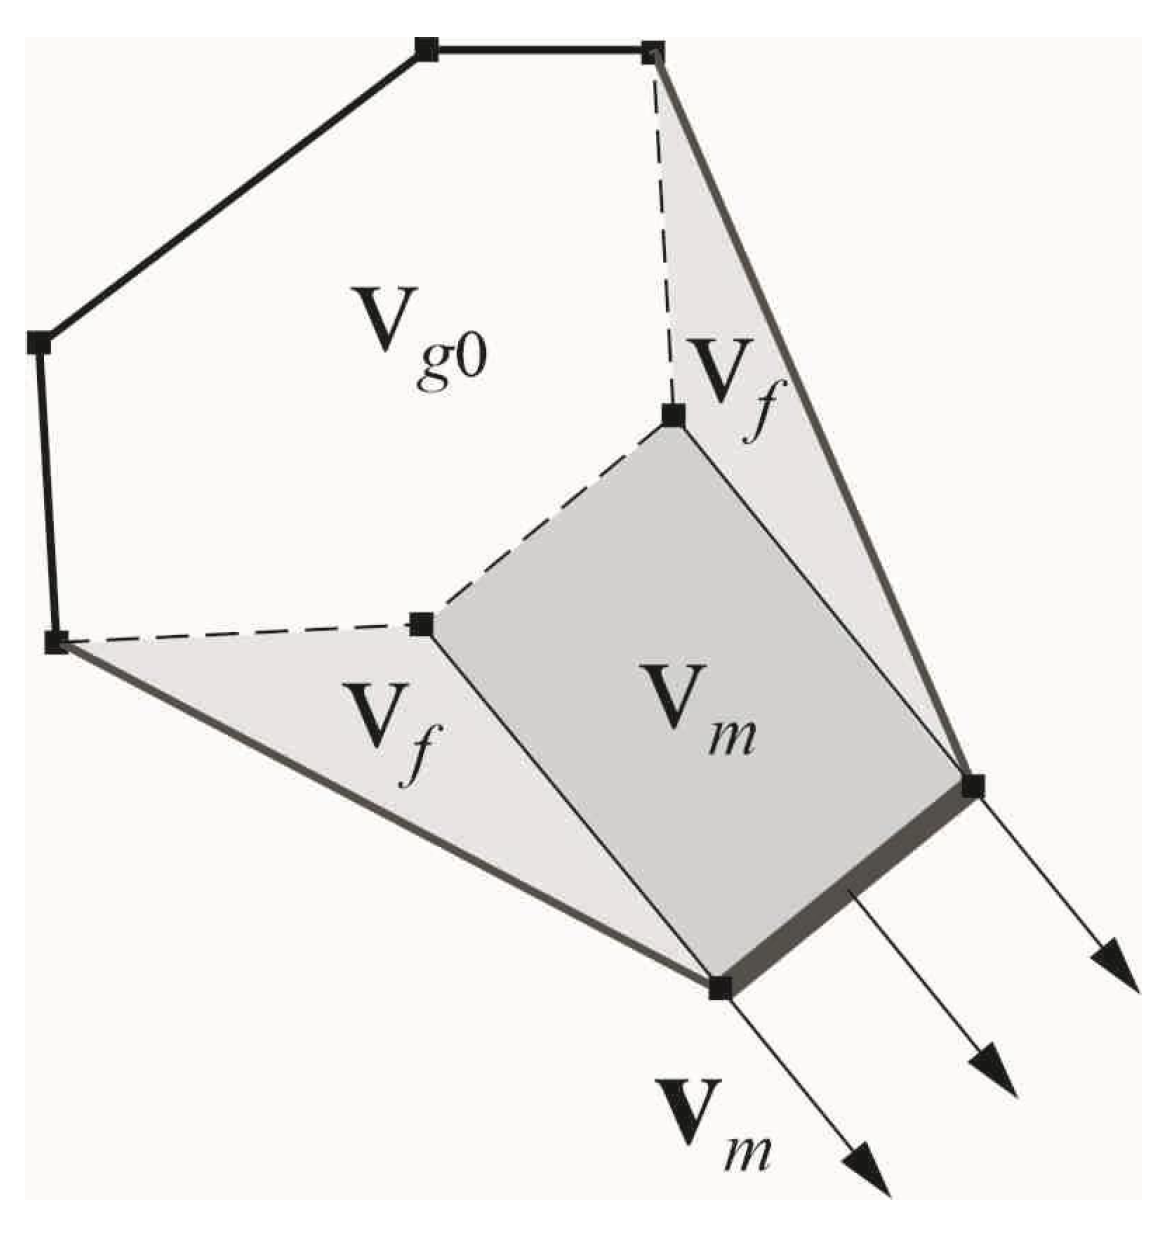
Figure 5 presents a scheme illustrating how the grain shape changes during the migration of the facet with the normal
. Further, we will consider only the migrating facet and the adjacent facets. The elements of the migrating facet are denoted by the index
and the adjacent facets by the index
. In this model, the grain structure is represented by flat sections, meaning the “bending” of the boundary cannot be described. However, there is a possibility of considering the rotation of the adjacent facets under the assumption that an increase in volume is provoked by this effect (see
Figure 5). In this case, it is assumed that the polyhedron remains convex. In the statistical model, the change in the geometry of the polyhedra is not actually simulated. The characteristic size and sphericity of grains needed for rearrangement of the polyhedral grain structure in Neper are determined in a simplified way after a certain number of time steps.
According to the scheme given in
Figure 5, the volume of the recrystallized part of the grain occurred due to the facet migration
is calculated as the sum of two terms:
where
is the volume swept by the mobile facet;
is the total volume made up of the “rotation” of the facets;
> 1 is the parameter describing the change in the volume of a DRX grain due to the migration of the facets. The relation for
is determined assuming that the swept volume is the volume of a rectangular parallelepiped:
where
is the area of the migrating facet. During the facet migration and assuming that the rectangular shape of the facets remains unchanged, the area of each of the adjacent facets increases by the value
:
where
is the initial area of the facet adjacent to the migrating facet. For the consumed grain adjacent to the migrating facet, the volume decreases by the value
calculated by relation (23), and the areas of the neighboring grain facets adjacent to the migrating facet decrease by the values determined by (25). If the volume of the neighboring grain reduces to zero (to an accuracy of computational error), then it is replaced by the grain from a representative volume of the statistical model. This grain is determined from the facet of the closest orientation, which is assumed to be conjugated with the migrating facet.
Finally, the characteristic size
(to do this, the sphere of equal volume is associated with a grain) and sphericity
are obtained for each grain:
where
,
is the volume and area of the grain determined by the above-mentioned relations. The distributions of
and
obtained for the considered representative volume are transferred to Neper to construct a new polyhedral structure, and then the grain structure data are introduced into the statistical model; this procedure is repeated many times.
4. Simulation Results and Their Analysis
This paper investigates the inelastic deformation of a copper polycrystal sample. The multilevel model parameters are given in
Table 1.
The identification of material parameters for the inelastic deformation model (
Table 1) was carried out on the basis of the experimental data [
78]. This table includes the results of experimental studies of the stress–strain state of cylindrical samples measuring 8 mm in diameter and 12 mm in height. The uniaxial compression tests were carried out at a temperature of 775 K and at a strain rate of 2 × 10
–3 s
–1 for a polycrystal of commercial pure copper, which was pre-treated by annealing at 973 K for two hours [
78]. The values of the anisotropic elastic moduli of the grain
[
76] and the shear modulus of the polycrystal
[
77] correspond to the absolute temperature 775 K adopted for the numerical experiment. In order to perform specific calculations by applying an advanced statistical model, the grain structure of a polycrystal should be given in the reference configuration (the procedure for grain structure formation is described in [
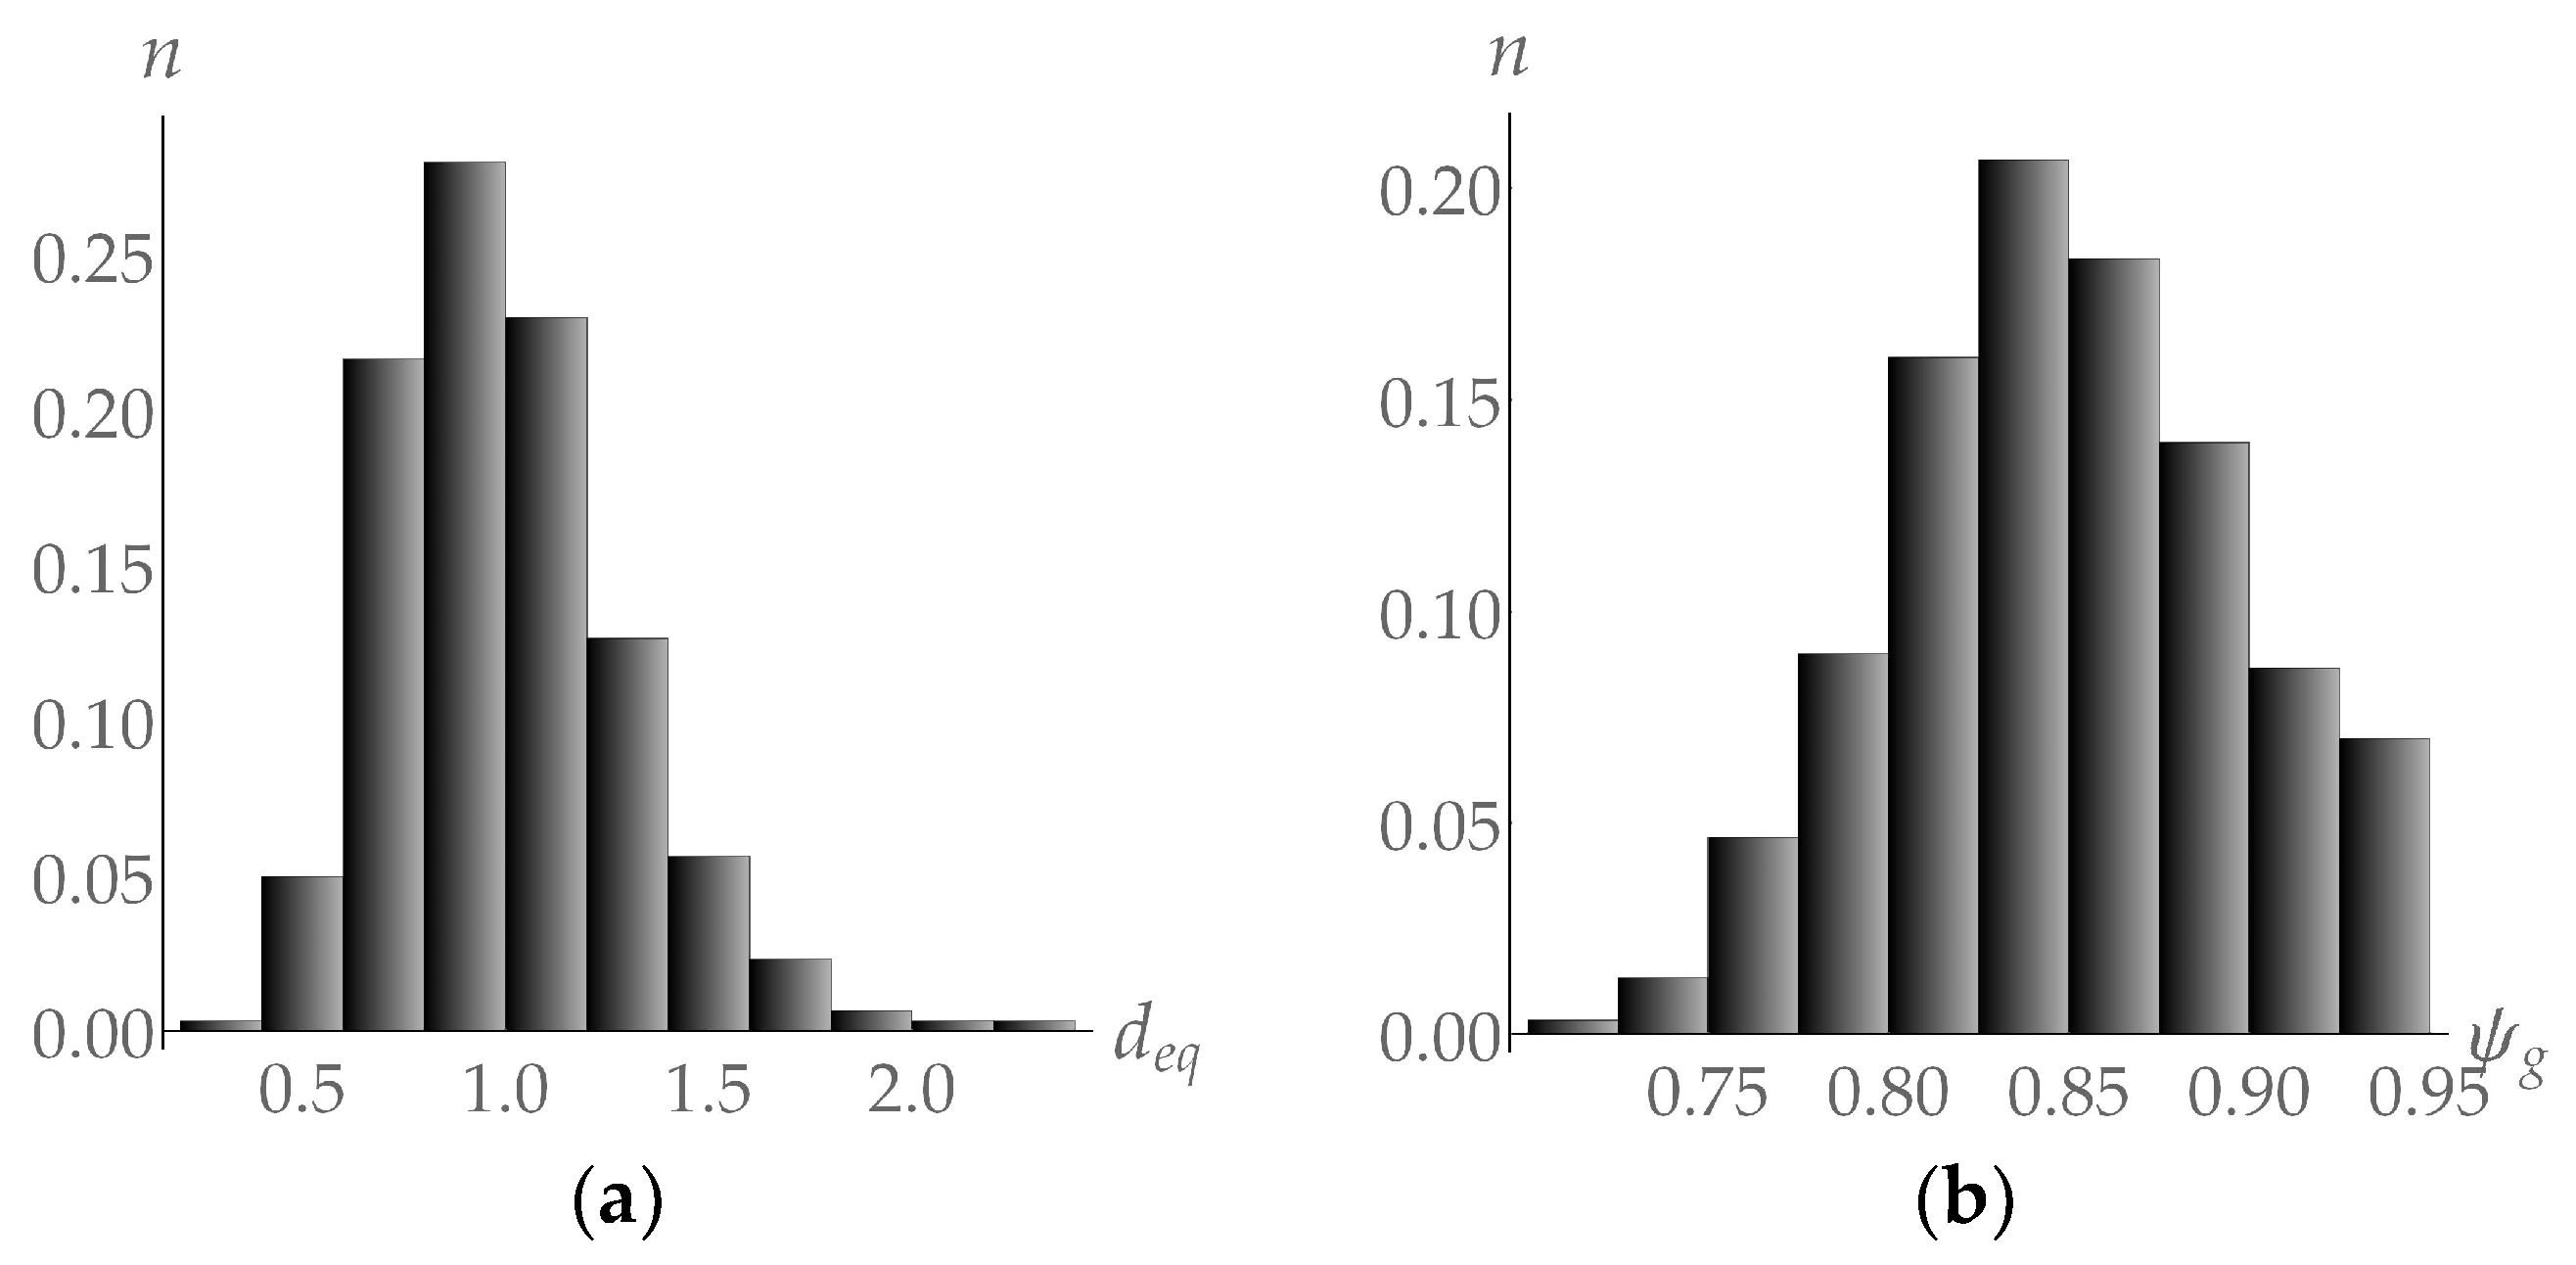
79]). Based on the available experimental data, statistic laws were derived for the distribution of normalized grain size
and sphericity
of the copper polycrystal grains. The average polycrystalline copper grain size
was 78 µm [
78]. To approximate the grain size distribution, the lognormal law was used [
80,
81]. According to the data collected from the microsectional analysis [
78], there is a scattering in grain sizes, which is characteristic of annealed materials. The following parameters are needed to specify a log-normal distribution: μ = 3.86, σ = 1 such that the mathematical expectation exp(μ + σ
2/2) be equal to the average grain size
d0 = 78 μm. If the representative experimental data on grain size distribution exist, then there is no difficulty in solving the optimization problem of determining the statistical distribution law and identifying its parameters, as was done in [
82] for subgrain size distributions. We suppose that in the initial state, the copper sample after annealing has predominantly equiaxed grains with an average sphericity
= 0.90; the data on sphericity are given in [
83].
Figure 6 presents the grain size distribution
deq and grain sphericity
histograms obtained based on existing experimental data [
78,
83].
The applied statistical two-level mathematical model is based on Voigt’s hypothesis. The kinematic influence is prescribed and the velocity gradient is known. Plastic deformations corresponding to uniaxial deformation are considered [
6]:
where
is the orthonormal basis of the laboratory coordinate system;
is the prescribed deformation velocity.
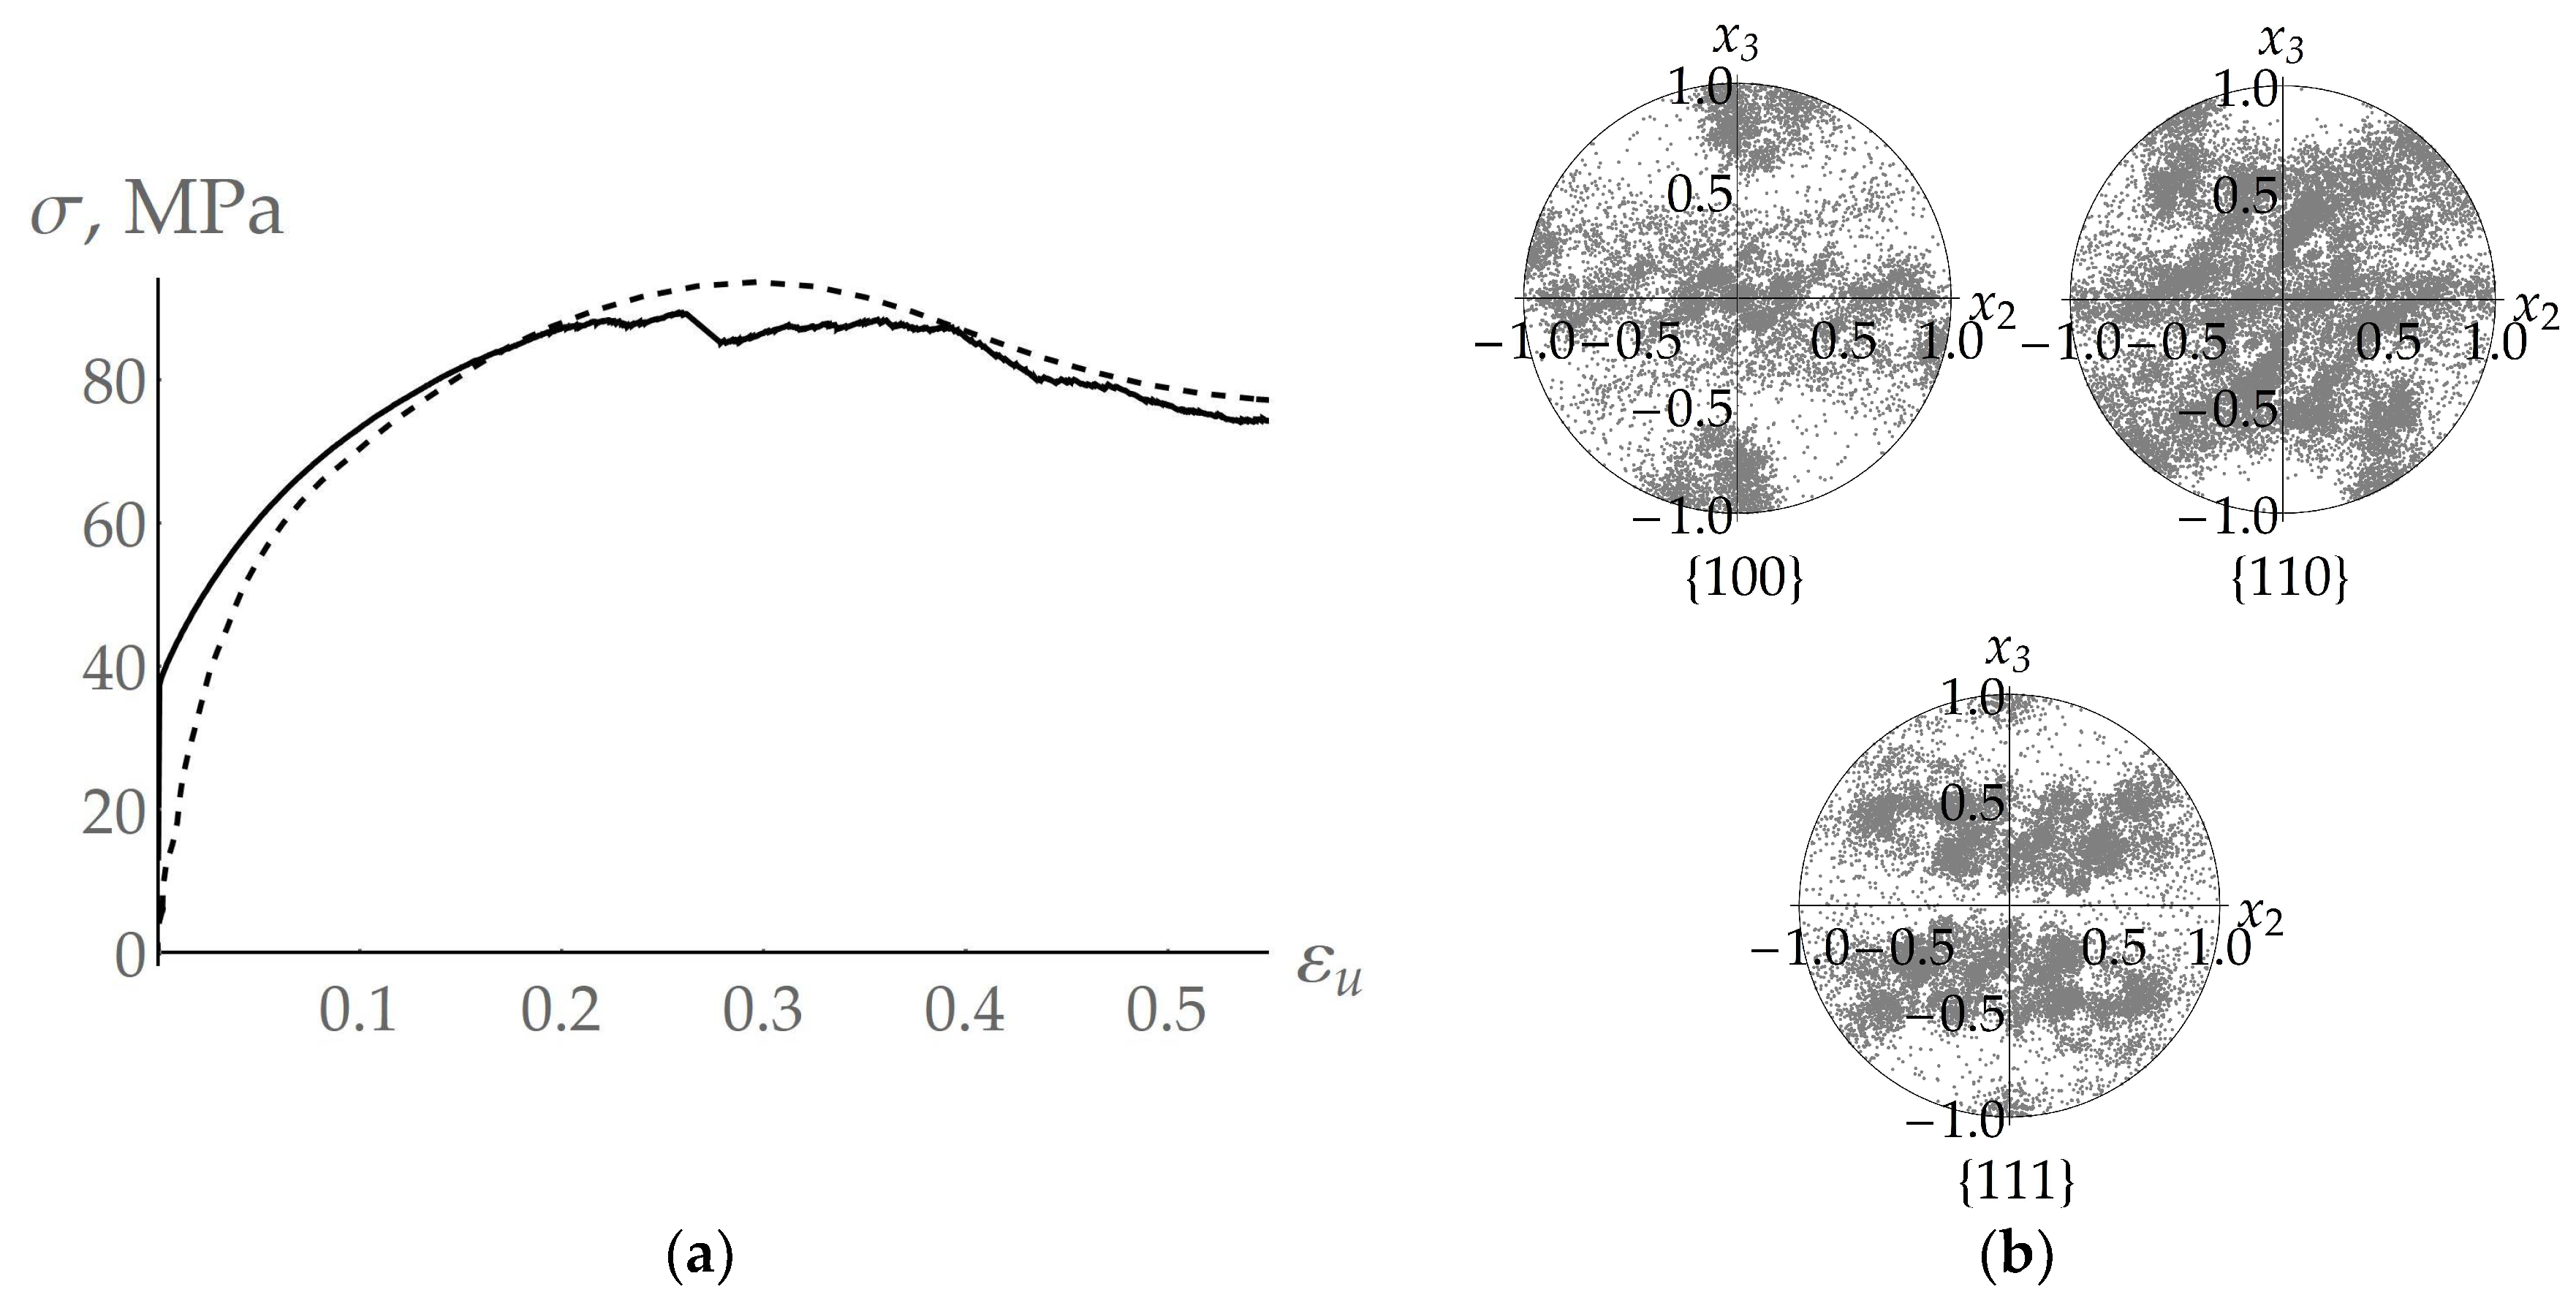
Further, we present the results of the computational experiments carried out at deformation velocity
= 10
–3 s
–1 and temperature
= 775 K. The loading diagram (with and without the recrystallization process) is given in
Figure 7a, and the corresponding deformation textures formed after the end of plastic deformation are shown in
Figure 7b. We emphasize a significant contribution of recrystallization to the deformation texture “blurring”, which is attributed to the appearance of new DRX grains with an orientation consistent with the parent grain—numerous points for DRX grains are seen on the pole figure near the point reflecting the orientation of the parent grain.
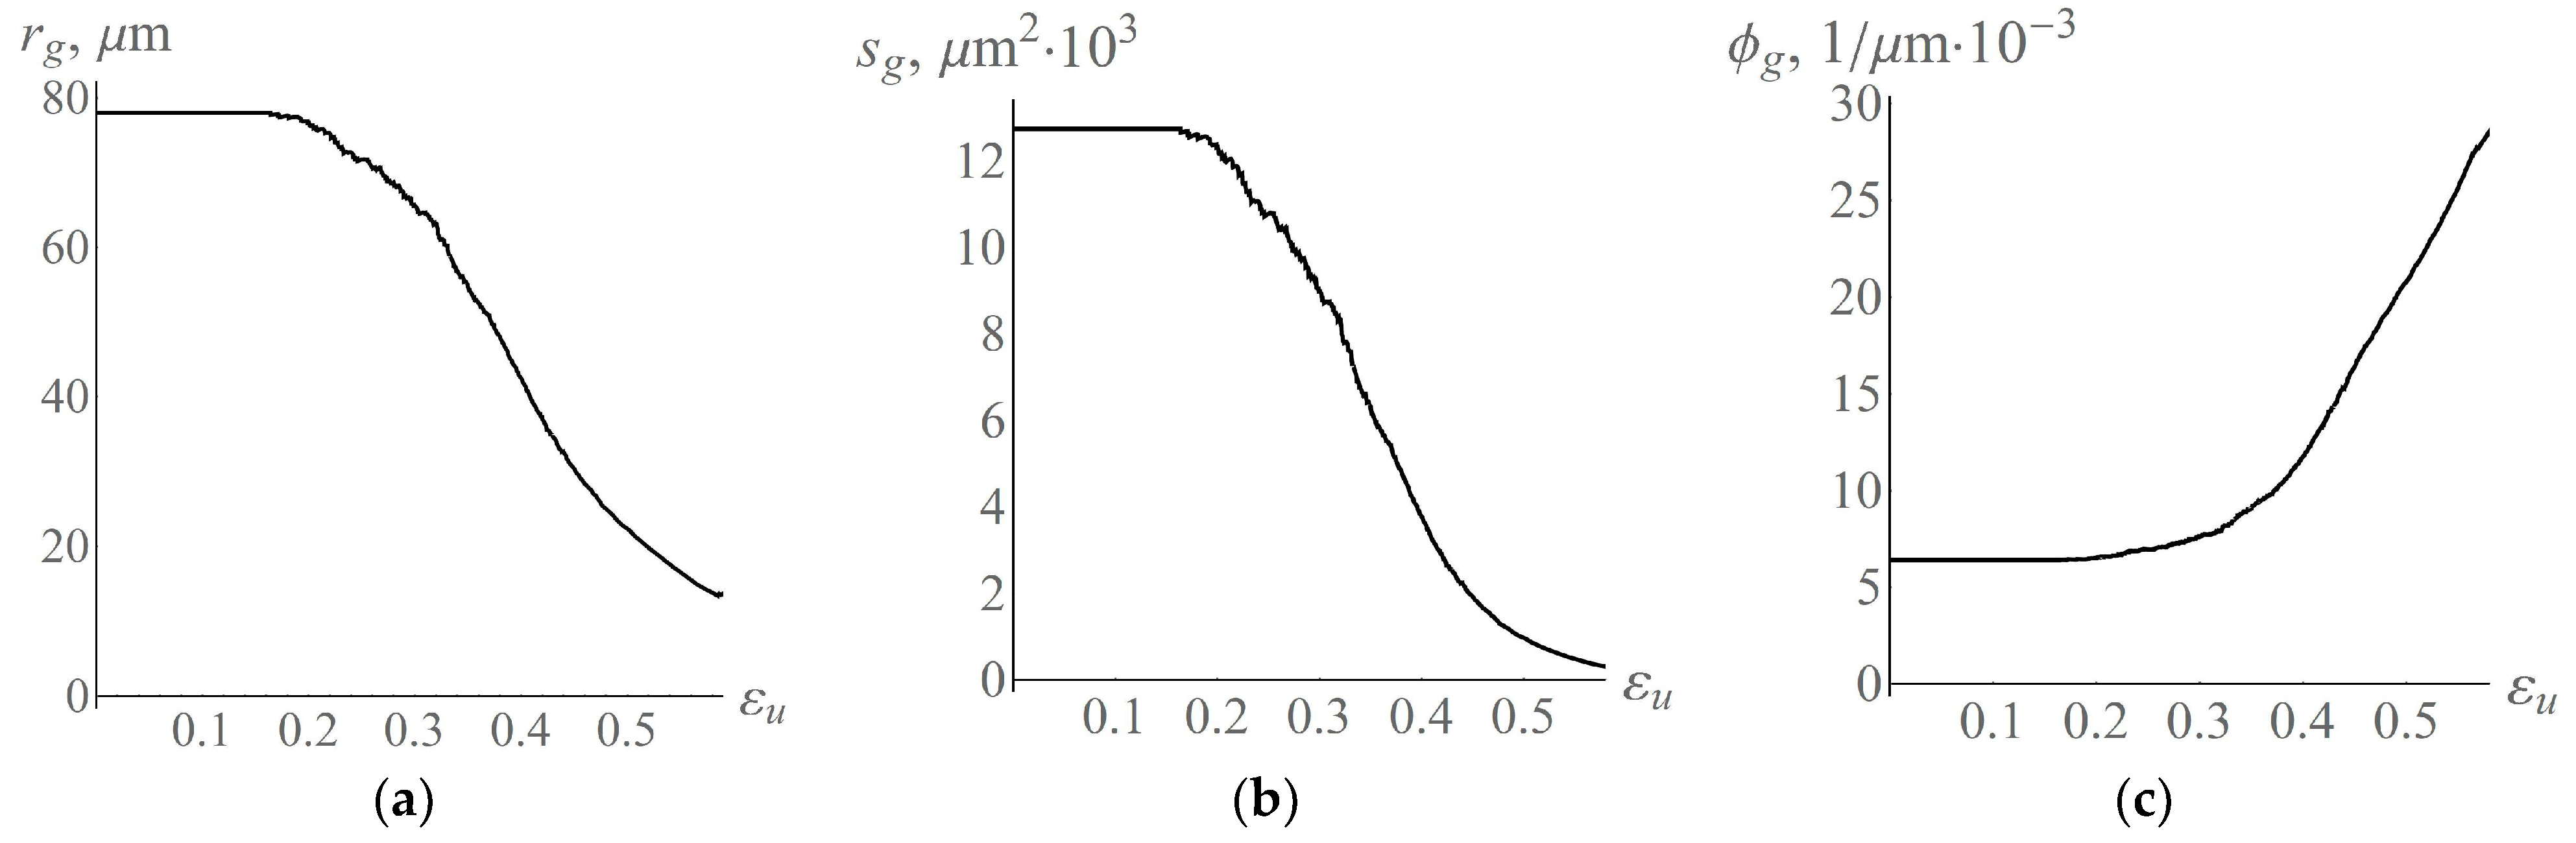
Figure 8a illustrates the evolution of the average grain size
during plastic deformation.
Figure 8b shows a change in the average value of the facet area
.
Figure 8c demonstrates the evolution of the ratio of the average grain volume to the facet area
. Notice that the recrystallization process refines the initially coarse polycrystal grains. At the end of deformation, the average grain size reaches a value of 14 μm. The fraction of high-angle boundaries also increases due to the appearance of many recrystallized grains (
Figure 8c). Initially, the representative volume of the polycrystal contains 300 grains, and at the end of deformation it consists of 2017 grains. In the reference configuration, the edge of the representative volume in the form of a cube is about 421 μm. At the end of deformation, the size of the edge along which tension occurred is 767 μm, and the remaining two edges are 312 μm in size. The violations of the curves correspond to the instants of time at which the polyhedral grain structure rearranges in Neper.
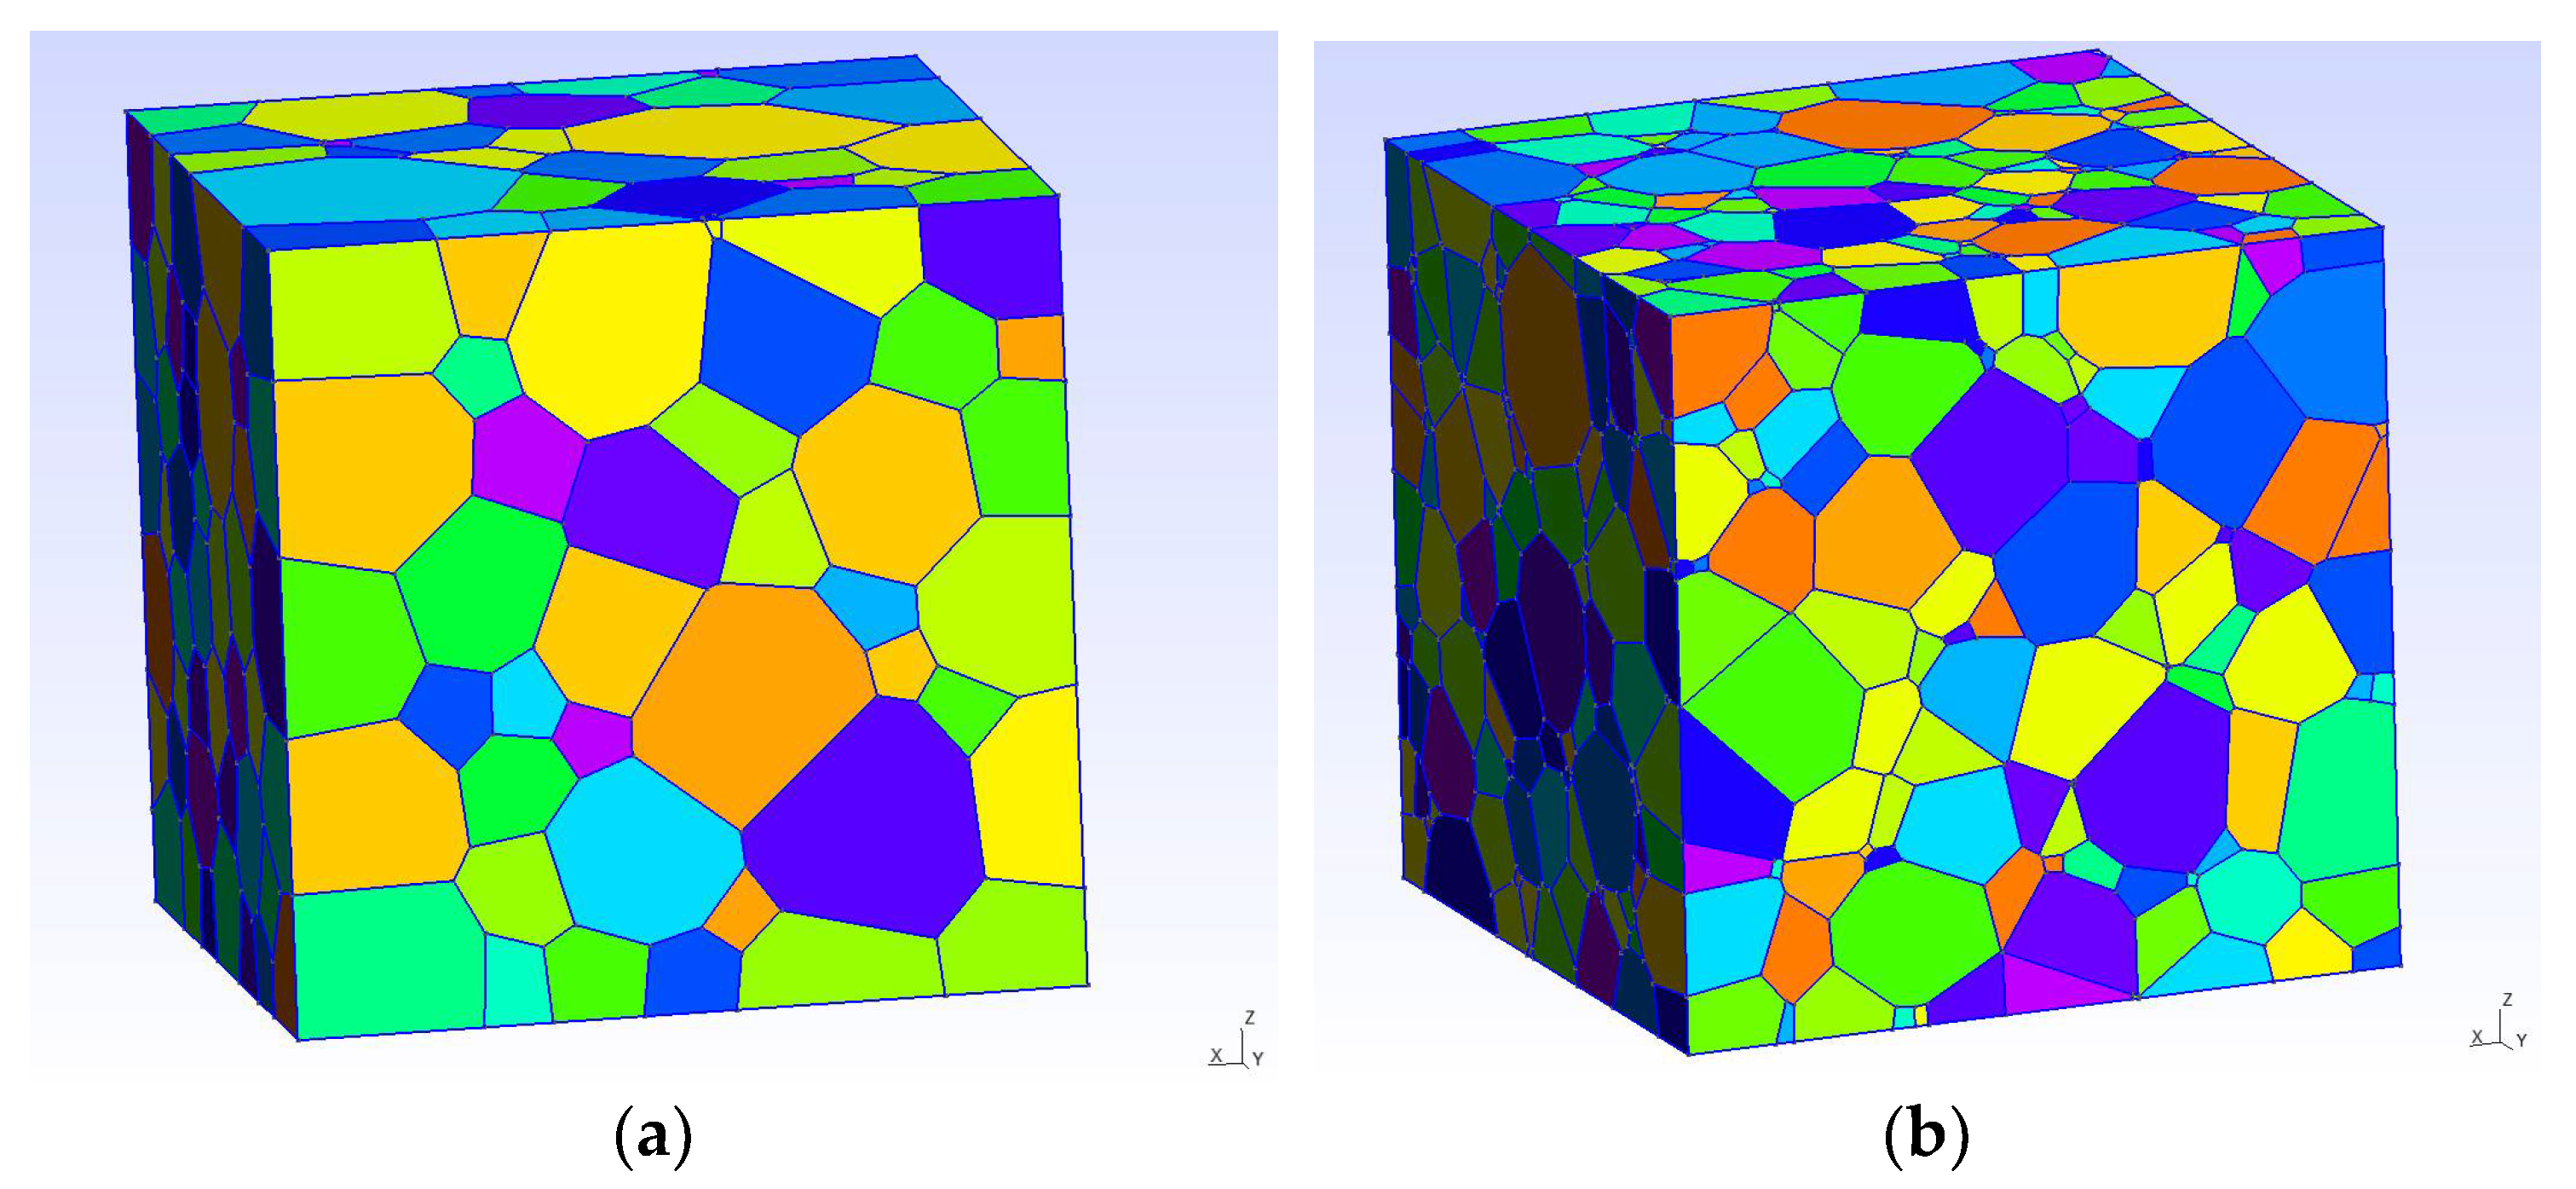
Figure 9 presents the polyhedral structures formed in Neper. These structures correspond to the instant of deformation
= 0.25 at which the stress tensor
reaches its maximum (
Figure 9a) and to the end of deformation
= 0.53 (
Figure 9b). It is interesting that at the instant of deformation
, both large initial grains and new grains with a small size appear. At the instant of deformation
, practically no large grains are kept.
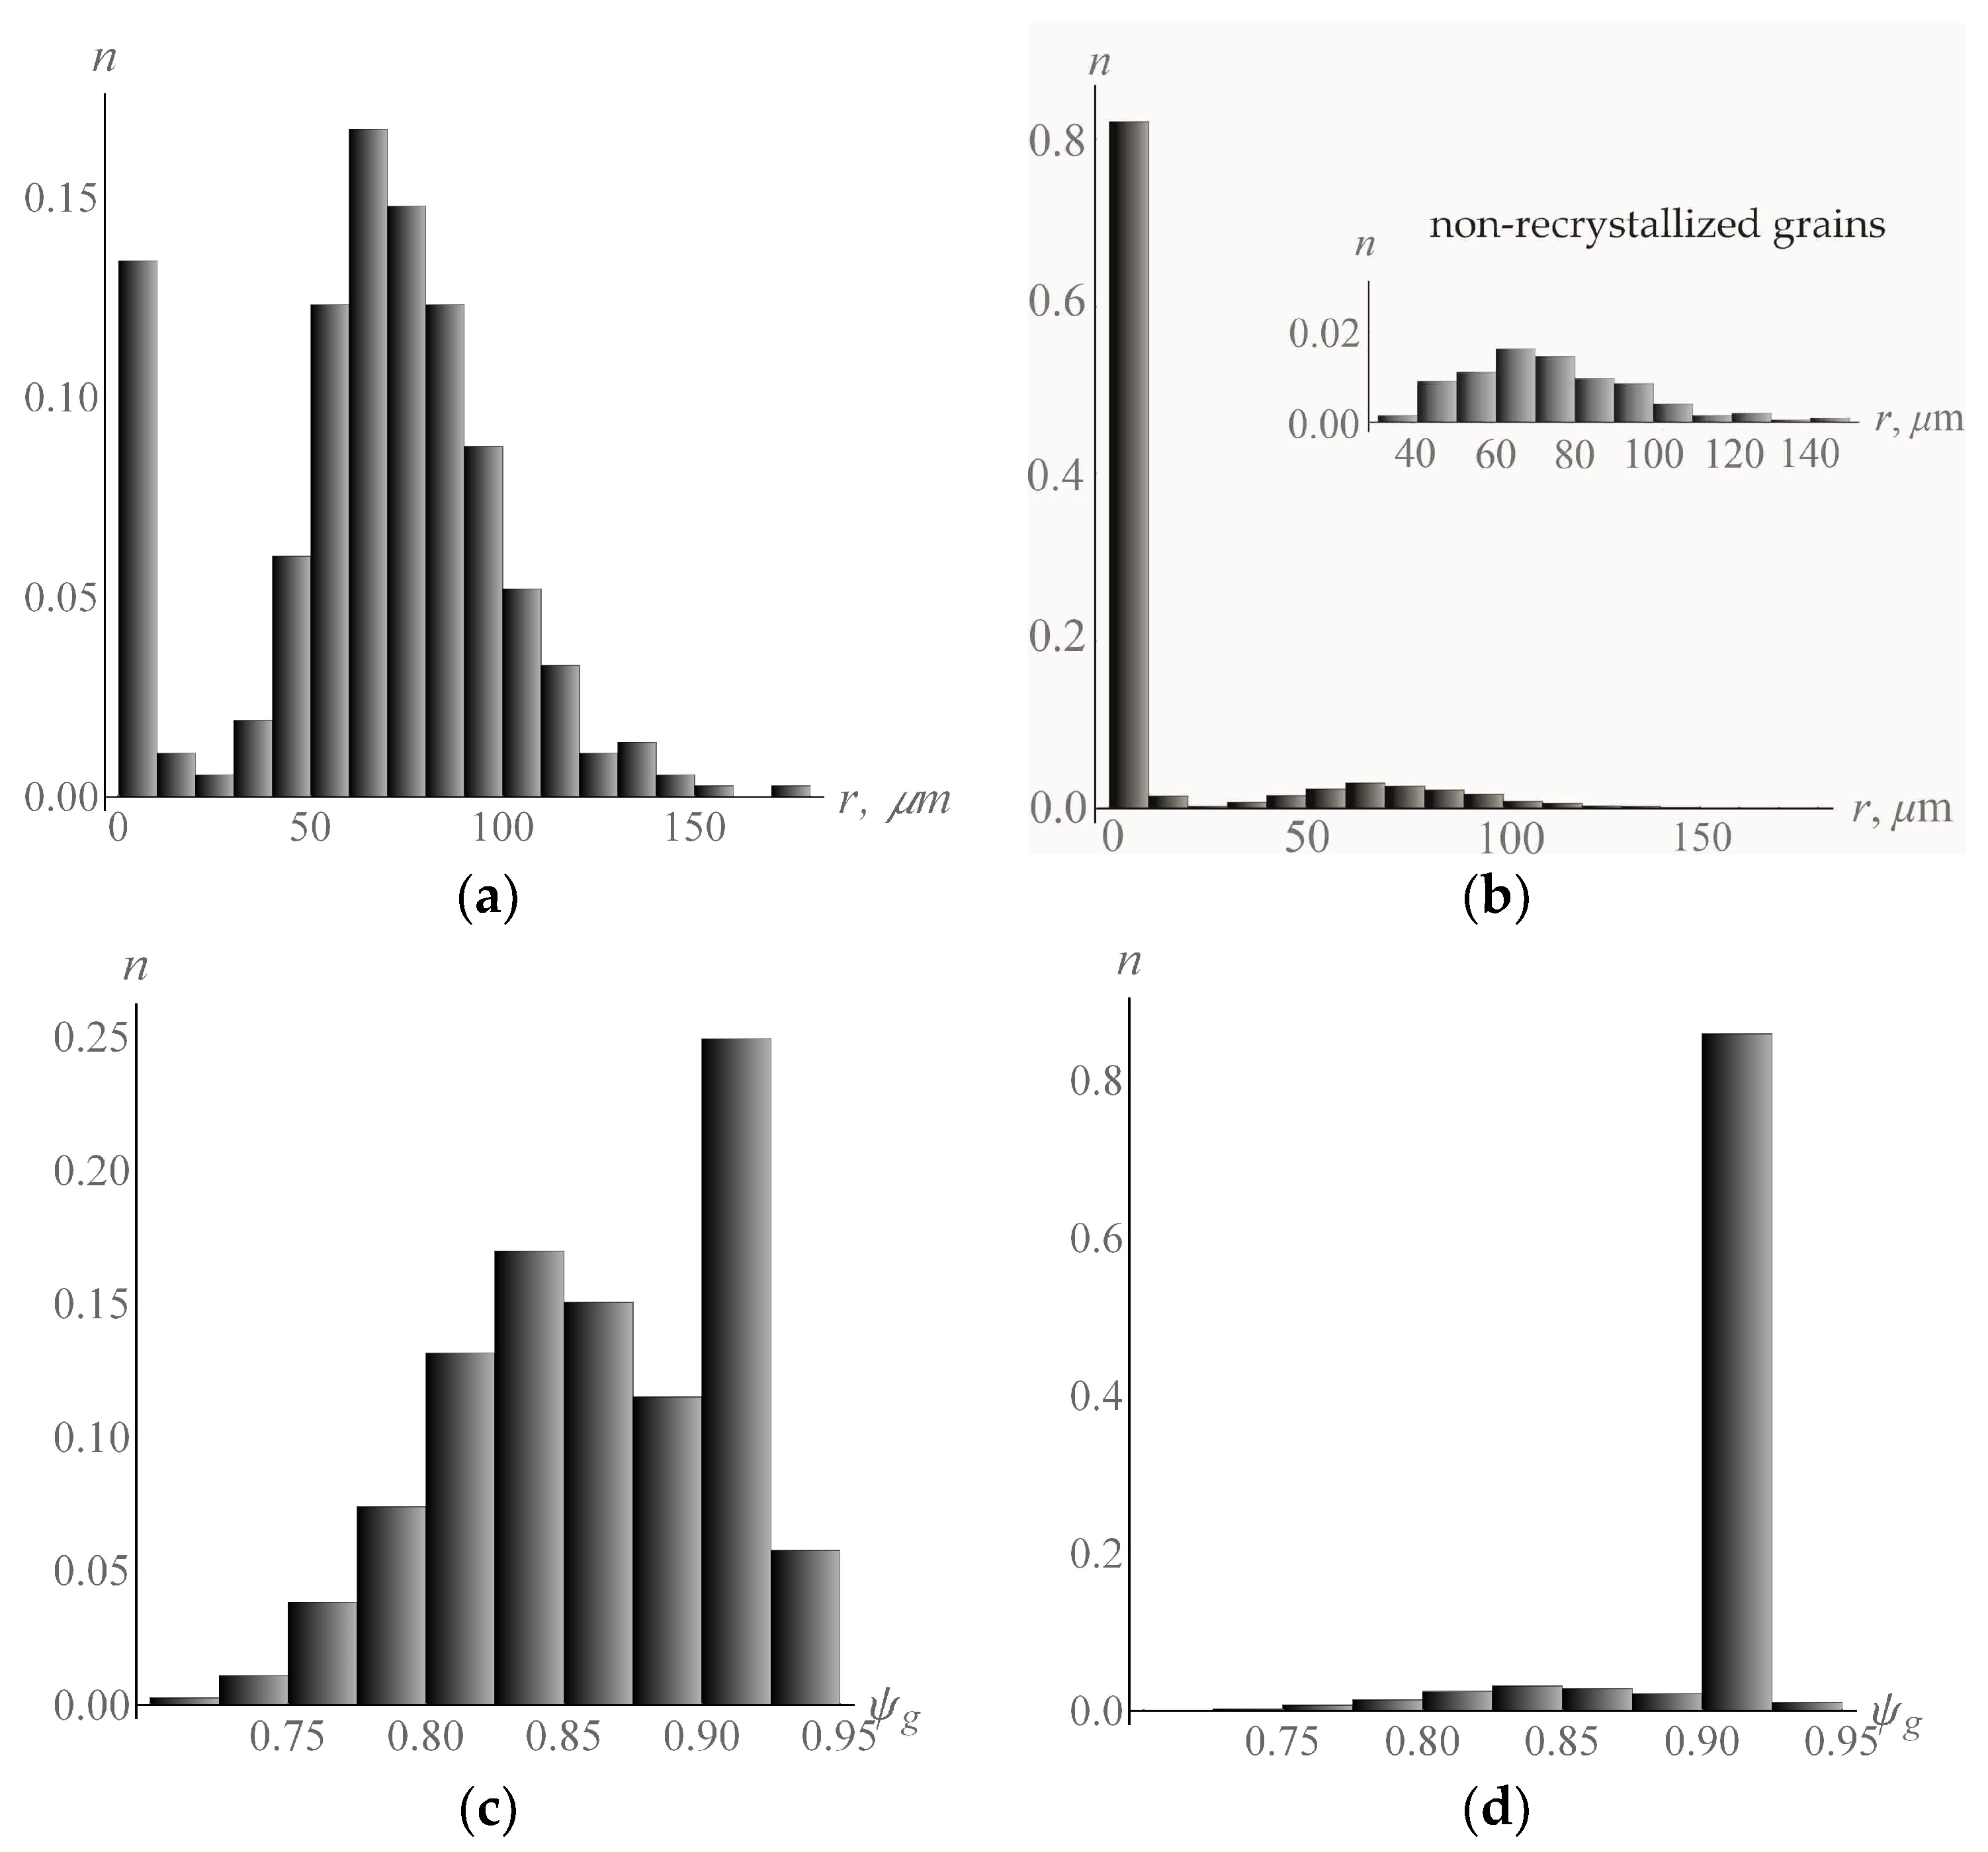
This is confirmed by the grain size distribution
(
Figure 10a,b) and sphericity
(
Figure 10c,d) histograms, plotted for two different instants of deformation
,
. For
, the distribution of grain sizes
and sphericity
is a bimodal distribution with two characteristic peaks that reflect the initial stage of DRX implementation. At the end of deformation
, the structure becomes fine-grained (
Figure 10b) and equiaxed (
Figure 10d) with an average grain size of about 14 μm. The grain size distribution (
Figure 10b) is characterized by the presence of a fraction (about 9%) of non-recrystallized grains with sizes that range from 30 µm to 150 µm. The sizes of non-recrystallized grains significantly exceed those of recrystallized grains, as evidenced by the data from
Figure 10a,b. The level of energy stored on defects in non-recrystallized grains is much higher as compared to recrystallized grains. Therefore, the current critical stresses caused by the interaction of mobile dislocations with forest dislocations (relation (8)) exhibit high values. On the other hand, in large non-recrystallized grains, the contribution of the grain size to strengthening due to the interaction of mobile dislocations with grain boundaries is smaller (relation (9)). During the recrystallization process, large initial grains are gradually replaced by less defective recrystallized grains of a smaller size, which causes the current critical stress values to reduce. Due to the competing processes of hardening and softening, the resistance to deformation becomes stationary. The original non-recrystallized grain boundaries are non-equilibrium (new recrystallized grains are formed on these boundaries), which promotes the subsequent absorption of non-recrystallized grains. Under further deformation and at increasing stored energy level in recrystallized grains, these grains may become absorbed because of the appearance of less defective grains, which is an indication of the cyclic nature of the process of intermittent dynamic recrystallization. Thus, the amount of recrystallized material should be determined for each cycle separately.


