Article

An Electrochemical Investigation of Methanol Oxidation on Thin Films of Nickel Oxide and Its Composites with Zirconium and Yttrium Oxides

1
Department of Chemistry, School of Natural Sciences, National University of Sciences and Technology (NUST), Islamabad 44000, Pakistan
2
Research Center for Advanced Materials Science (RCAMS), King Khalid University, Abha 61514, Saudi Arabia
3
Department of Chemistry, Faculty of Science, King Khalid University, Abha 61413, Saudi Arabia
4
Centre of Nanotechnology, King Abdulaziz University, Jeddah 21589, Saudi Arabia
5
Department of Physics, Faculty of Science, King Abdulaziz University, Jeddah 21589, Saudi Arabia
6
K. A. CARE Energy Research and Innovation Center, King Abdulaziz University, Jeddah 21589, Saudi Arabia
*
Author to whom correspondence should be addressed.
Crystals 2022, 12(4), 534; https://doi.org/10.3390/cryst12040534
Submission received: 26 February 2022 / Revised: 4 April 2022 / Accepted: 4 April 2022 / Published: 11 April 2022
(This article belongs to the Special Issue Advances in Thermoelectric Thin Films)

Abstract

:
The present work is focused on the fabrication of NiO-ZrO2/FTO and NiO-Y2O3/FTO thin films via a simple dip-coating method. The films are deposited from precursor solutions of Ni(CH3COO)2·2H2O, Zr(CH3COO)4, Y(CH3COO)3·H2O in methanol. The synthesized films, after proper characterization, are employed for electrochemical oxidation of methanol. The analytical techniques such as X-ray diffraction (XRD), Raman, and Infrared (IR) spectroscopy reveal the successful formation of crystalline thin films of mixed metal oxide without any additional impurities. Further, X-ray photoelectron spectroscopy (XPS) results, confirm the composition and oxidation state of all the elements present in thin films. The field emission scanning electron microscopy (FESEM) further aided to identify the uniformity and porous nature of composite thin films while the energy-dispersive X-ray spectroscopy (EDS) confirms the targeted elemental composition of the prepared thin films is in good agreement with precursors. The electrochemical oxidation of methanol results reveals that NiO-Y2O3/FTO and NiO-ZrO2/FTO thin films showed current densities of 6.2 mA/cm2 and 10 mA/cm2 at 0.65 V, respectively, against Ag/AgCl/3M KCl using 0.6 M methanol solution. Furthermore, Chronoamperometric (CA) results show good stability of NiO-ZrO2/FTO and NiO-Y2O3/FTO thin films with observed current decay of 10% and 6.8% of the initial current density, respectively. Moreover, the effect of scan rate and concentration of metals in a catalyst was also investigated. The Electrochemical impedance studies (EIS) further support electrochemical results, where the lower charge transfer resistance (Rct) values are recorded for composite thin films as compared to the pure metal oxide thin films (NiO/FTO, ZrO2/FTO, and Y2O3/FTO).

1. Introduction

The tremendous increase in the use of technology is highly dependent on energy utilization in the form of electricity. All electronic devices need a power source to be operated. Furthermore, fossil fuels are used as top sources of electric power generation, which adversely affect the environment [1,2,3,4,5,6,7]. Hence finding clean, renewable, efficient, and eco-friendly alternative sources to meet the rising energy demand is the current global concern [8,9,10]. In the last decade, direct methanol fuel cells, which use methanol as a fuel, have got popularity as an alternative source for electric power generation. The uprising direct methanol fuel cell (DMFC) technologies are associated with characteristics like low cost, eco-friendliness, portability, simple assembly, and ease of operation, respectively [11,12,13,14,15,16]. However, DMFCs still encounter challenges like methanol crossover, less long-term stability, and durability, difficulty in managing water and heat, and high manufacturing costs that have made their commercialization unfavourable. However, many researchers have suggested plenty of advanced routes that can overcome the barriers to the operation of methanol oxidation fuel cells [17,18].
The selection of the electro-catalyst greatly influences the performance of methanol fuel cells. The main contributors to the high cost of DMFC are expansive noble-metal-based electro-catalysts. Platinum-based electrocatalysts are still a popular class of catalyst that has been widely used in fuel cell applications [19,20,21,22,23]. The major drawbacks associated with these catalysts, high cost, CO-poisoning, and high activation over-potential make it necessary to investigate novel electrocatalysts with characteristic features like high catalytic activity, CO-poisoning resistivity, less cost, high stability, and durability [24,25]. Non-Noble, transition metal oxide-based electrocatalysts are promising alternates [24,26,27]. The catalysts such as NiOx, CoOx, CuOx, CrOx, ZnOx, MnOx, and FeOx, have shown improved reaction kinetics as well as strong anti-poisoning potential [28,29,30,31,32,33]. Apart from first-row transition metal oxides, zirconium and yttrium oxides are well reported for their catalytic activities. The yttrium stabilized zirconia is used in several heterogeneous catalytic reactions including oxidation of carbon monoxide (CO) [34,35]. Therefore, these materials can be the best candidate if employed for methanol oxidation, where the presence of yttria or zirconia can further reduce the possibility of CO contamination. Moreover, yttria is also reported for the catalytic decomposition of formic acid and formaldehyde [36].
Furthermore, the electrochemical activity is influenced by the synthesis of the catalyst material and the fabrication of the electrode. For deposition of metal oxide thin films, several techniques have been reported including spin coating [37], electrodeposition [38], chemical vapor deposition [10,39,40], and so on. While some studies have shown the use of a dip-coating approach in presence of simple, soluble precursor solutions. This technique is low cost with simple processing conditions [41,42]. Furthermore, the dip-coating method has advantages such as repeatability, homogeneity, safety, and purity at low temperatures. We picked the dip-coating method to fabricate electrocatalysts on the conductive substrate without the use of a binder or carbon content. This approach not only offers superior substrate adhesion but also facilitates the electrochemical reaction cost-effectively. The present work focused on the fabrication and investigation of non-Noble, transition metal oxide-based composite thin films formed via a simple dip-coating method for the efficient methanol oxidation reaction. It is also reported that the use of binary transition metal oxide electrocatalysts facilitates the efficient removal of the adsorbed carbonaceous intermediates (CO) through a bi-functional mechanism [43].
Acidic/basic electrolytes affect the oxidation of methanol. The current study was conducted using an alkaline electrolyte solution. It is reported that most electrocatalysts function better in alkaline media [32,44,45,46]. Alkaline media facilitate weak bonding of carbonaceous products to the electrode and hence enhanced catalytic performance while acidic media promote strong bonding of carbonaceous products to the electrode surface, which shifts the oxidation peak potential to a higher value and causes poisoning of the electrodes [47]. Furthermore, the hydroxyl ions in alkaline electrolyte solution get adsorbed on the catalytic surface and promote oxidation of methanol even at a lower potential. It is also reported that the kinetics of the cathode oxygen reduction reaction is well fitted in alkaline media [48,49,50]. Studies have proposed that the methanol cross-over issue is reduced in alkaline media compared to acidic media because the flow of anions is opposite in direction to that of proton flow, which results in reversed electro-osmotic drag and reducing methanol crossover [51,52].
Another main parameter that influences the catalytic behaviour is the type of support material used [53,54]. Different studies conducted using different support materials revealed that type of support influences properties like morphology, stability, porosity, surface area, CO-tolerance, and current density of the catalyst electrode [17]. The main drawback related to the widely used carbon-based support materials is their lower electrochemical stability, the carbon-support materials are also observed to undergo structural collapse during operating conditions [55]. Thus, the emphasis is on the use of inexpensive, transparent, conductive, non-carbon, highly efficient, and stable support materials as alternatives to carbon-based materials [54]. In the present study, fluorine-doped tin oxide (FTO) was used as a support material for the deposition of metal oxide thin films. The FTO showed enhanced stability, good interaction between the catalyst and support, and improved electrical conductance [56]. It is reported that the stable metal oxide support framework hinders the agglomeration of electrocatalyst nanoparticles and stabilizes it [57]. According to another study reported, heteroatom anions (e.g F in FTO) help in enhancing electrical conductivity and catalyst-support interactions. Additionally, electron transfer from FTO to catalyst occurs due to the spillover effect, which increases electron density on the catalytic surface [58,59].

2. Materials and Methods

The chemicals used in the fabrication of NiO-Y2O3/FTO and NiO-ZrO2/FTO composite thin films were purchased from Sigma Aldrich and were used as received. Deionized water was utilized throughout the experimental analysis. The FTO glass substrate sheets (surface resistivity∼8 Ω/sq) were cut into 1 cm × 2 cm (W × L) and washed before use.

2.1. Preparation of Precursor’s Solutions

To prepare 0.1 M of Nickel acetate, zirconium acetate, and yttrium acetate precursor solutions, 0.12 g of Ni(OAc)2·2H2O, 0.1 g of Zr(CH3COO)4, and 0.14 g of Y(CH3COO)3·H2O salts were dissolved in methanol, separately. The solutions were prepared by stirring at room temperature. A few drops of TFA (trifluoroacetic acid) were added to the yttrium acetate solution to completely solubilize it in methanol. Similarly, to fabricate 0.1:0.1 composite NiO-ZrO2 thin film, a solution from both the precursors was made by dissolving 0.12 g of Ni(OAc)2·2H2O and 0.1 g of Zr(CH3COO)4 salts in methanol upon stirring. Likewise, NiO-Y2O3 thin films were deposited from a precursor solution of 0.12 g of Ni(OAc)2·2H2O and 0.14 g of Y(CH3COO)3·H2O in methanol. For comparative study precursor solutions of different molarities and ratios as shown in Table 1 were also prepared via the same route.

2.2. Fabrication of NiO-ZrO2/FTO and NiO-Y2O3/FTO Thin Films

NiO-ZrO2 thin films were deposited on an FTO–glass substrate by a dip-coating method. FTO glass was cut into dimensions 1 × 2 cm2 (W × L). Before deposition FTO substrate was washed thoroughly with a mixture of acetone and ethanol solvents and sonicated for about 15 min. at room temperature using an ultrasonication water bath. After washing and drying at room temperature the FTO substrate was dipped in 0.1:0.1 M precursor solution of Ni–Zr mixture for 45 s and then dried on a hot plate for 10 min at 100 °C. After deposition of the first layer of thin film, the same procedure was repeated ten times to produce uniform and ultrathin films coated on FTO substrate. After deposition, the prepared films were calcined at 500 °C for 3 h in a muffle furnace. The same procedure was employed to fabricate nickel oxide and zirconium oxide thin films separately for comparison purposes. The NiO-Y2O3 thin films were also deposited on the FTO–glass substrate by the dip-coating method as explained above.

2.3. Characterization of NiO-ZrO2/FTO and NiO-Y2O3/FTO Thin Films

The topography of the prepared thin films was characterized by SEM (TESCAN) with magnification ranging up to 100,000×. For elemental mapping, EDS was conducted (Oxford Instrument INCAx-act PentaFET Precision). The crystallinity of the films was revealed via XRD (Bruker, D8 Advance, Ettlingen, Germany) with 2θ range from 10° to 90° and at 1.542 A° wavelengths of Cu-Kα radiations. X-ray photoelectron spectroscopy (XPS) (Versa probe II, ULVAC-PHI, Inc. Chanhassen, MN, USA) studies were conducted under an ultra-high vacuum (~10−10 bar). The synthesis of thin films was further confirmed by FTIR (Bruker, Alpha, platinum ATR) with a spectral range of 4000 to 500 cm−1 and Raman (Nikon, eclipse ci) spectroscopic analysis.

2.4. Electrochemical Oxidation of Methanol for As-Fabricated Metal Oxide Thin Films

Electrocatalytic behaviour of prepared thin films towards methanol oxidation was studied using Reference 3000 potentiostat/galvanostat/ZRA by Gamry consisting of three-electrode systems. The study was carried out in 0.5 M NaOH electrolyte solution at a scan rate of 100 mV/s, using Pt wire as a counter electrode, Ag/AgCl as a reference electrode, and prepared metal oxide composite thin film (1 × 1 cm2) as working electrode, providing a potential range of −0.5 to 2.0 V. All the three electrodes were dipped in the electrolyte solution and catalytic behaviour of fabricated thin films was investigated by recording voltammograms at 100 mV/s before and after addition of (0.2, 0.4, 0.6, 0.8, and 1 M) methanol to the reaction medium. Cyclic voltammetry (CV), electrochemical impedance spectroscopy (EIS), and chronoamperometry (CA) studies were performed to evaluate the efficiency of prepared metal oxide thin films for methanol oxidation. Furthermore, the effect of scan rate and concentration of metal oxide thin films on the methanol oxidation process was also studied using the same experimental parameters.

3. Results & Discussion

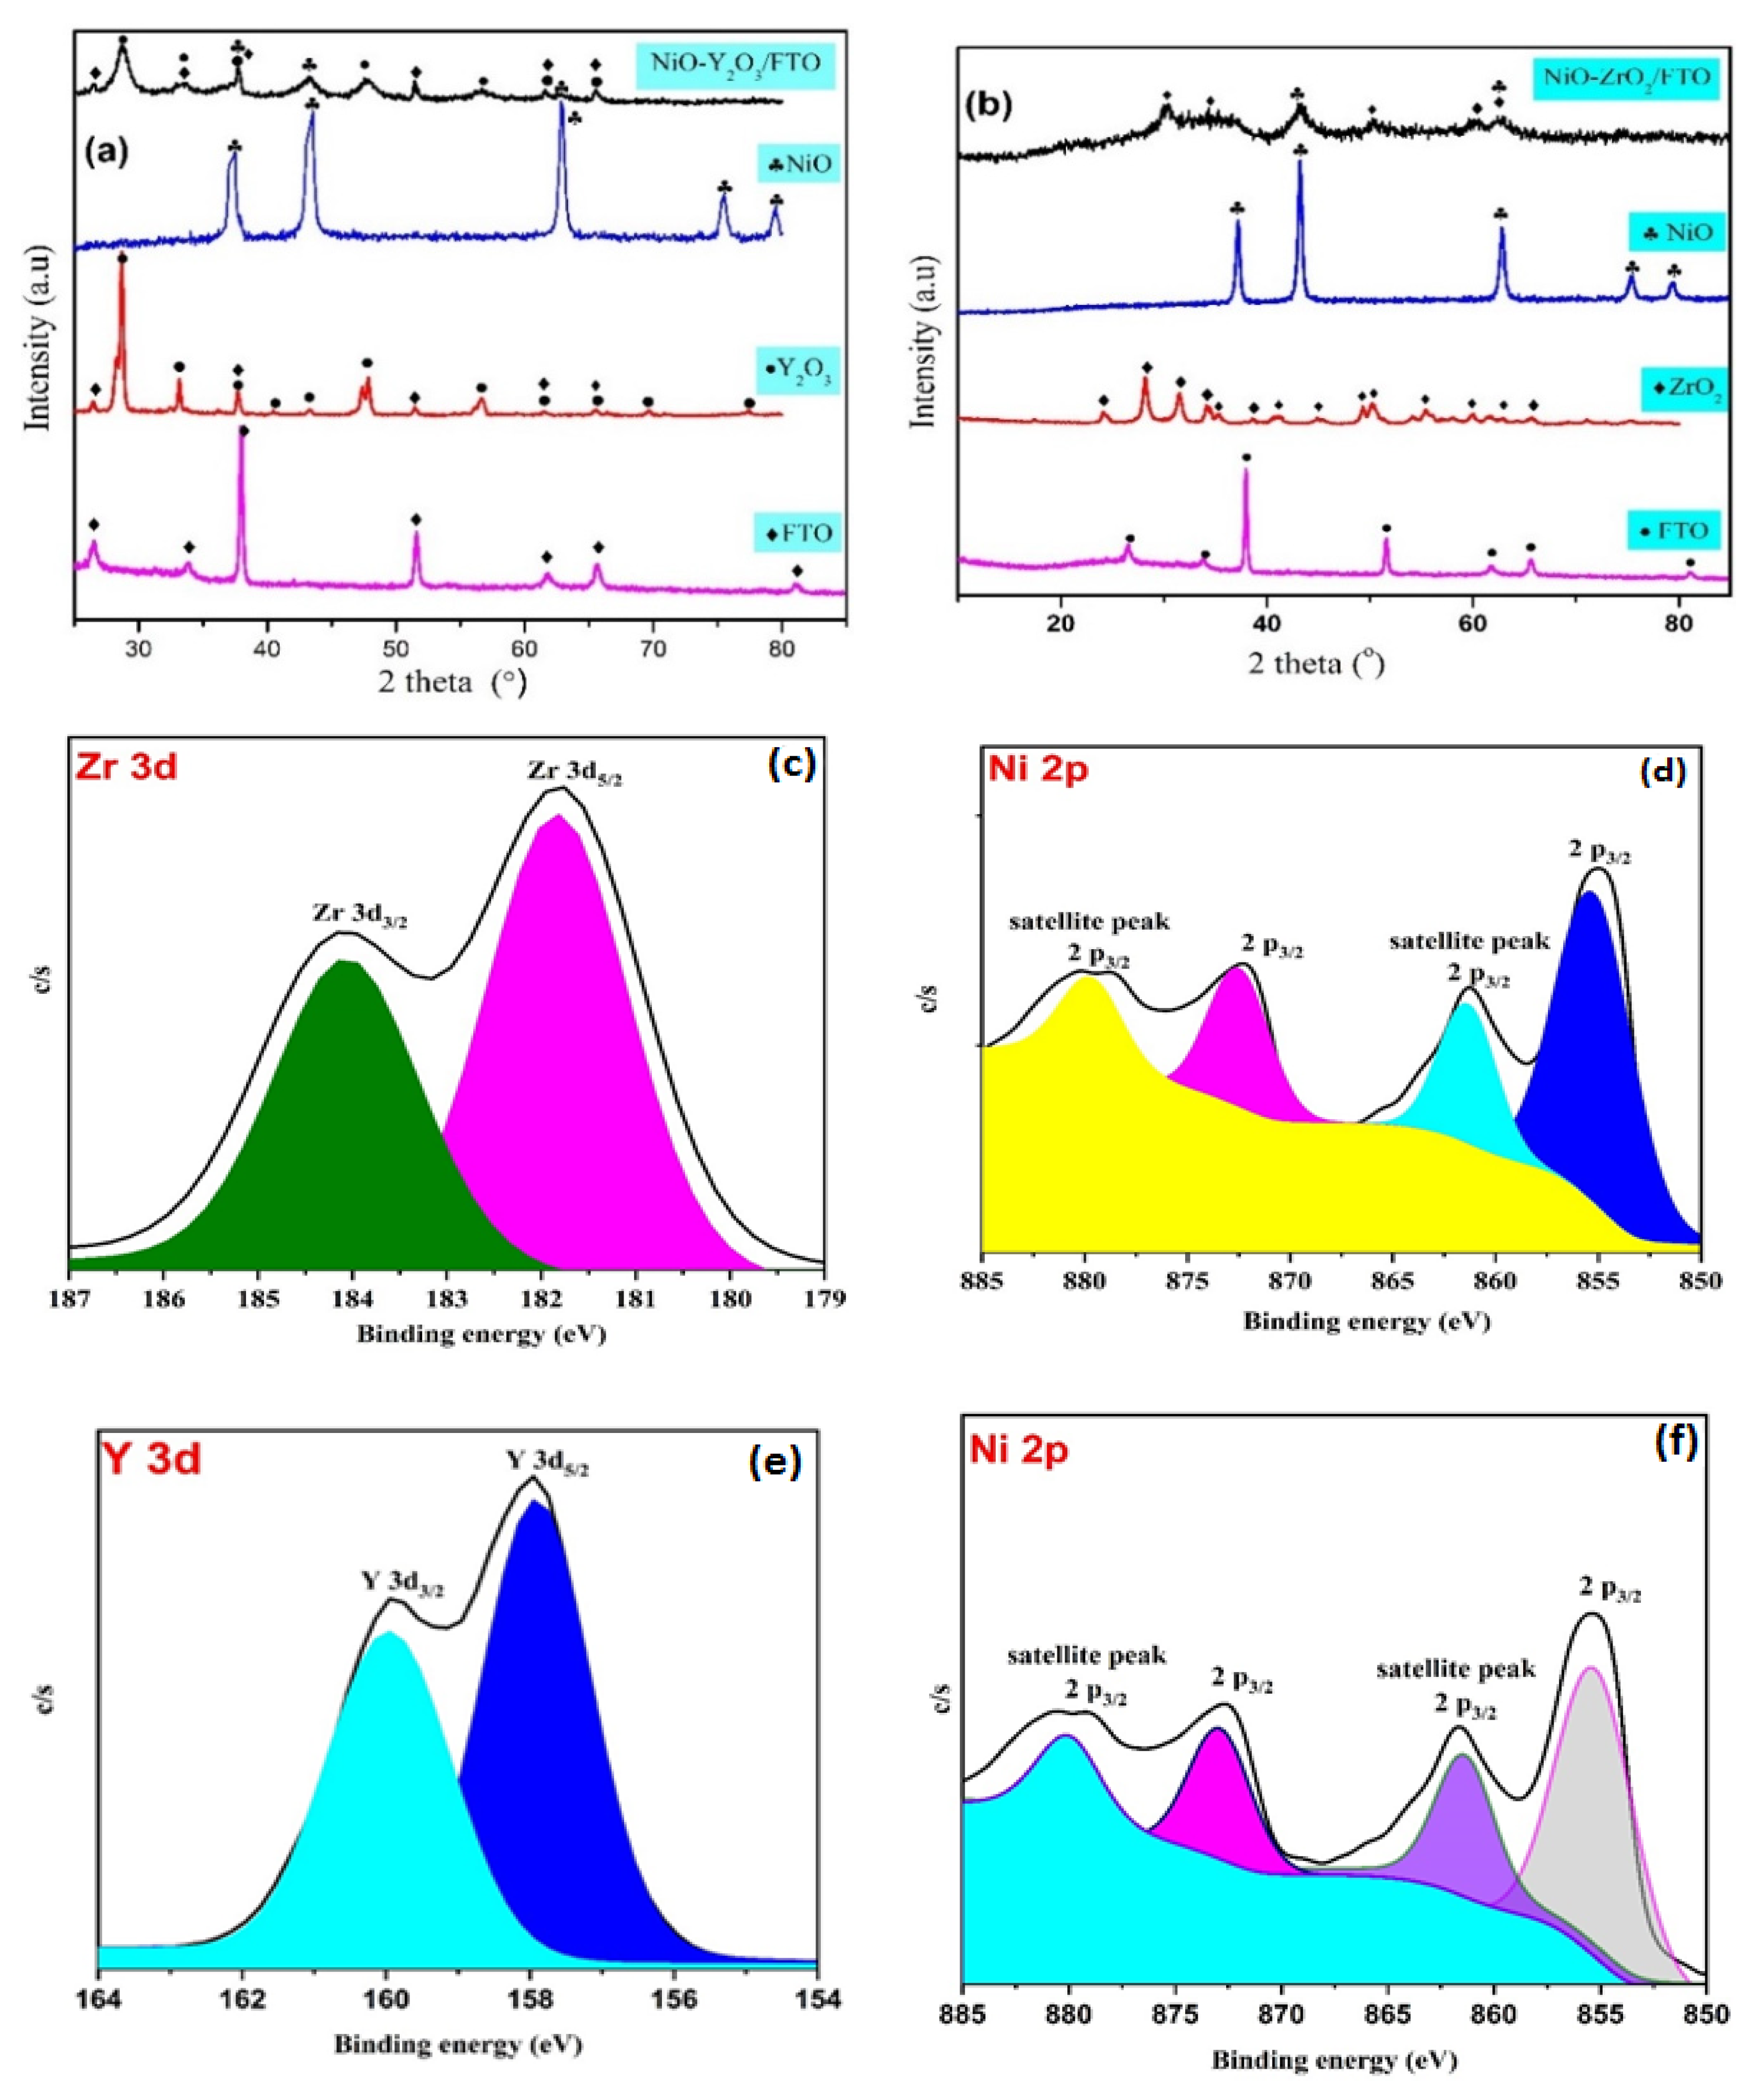
3.1. Powder X-ray Diffraction

XRD analysis was performed to confirm the formation of mixed metal oxide composite thin film. Figure 1a shows XRD peak patterns of NiO/FTO, Y2O3/FTO, and NiO-Y2O3/FTO thin film. The XRD spectrum of NiO/FTO shows major diffraction peaks at 2θ values of 37.2°, 43.3°, 62.8°, 75.4° and 79.3°, which correspond to the (111), (200), (220), (311) and (222) reflection planes, respectively. All of these peak values perfectly coincide with the standard values of the cubic crystalline structure of NiO (JCPDS 01-073-1519) [60]. The XRD pattern of Y2O3/FTO shows major diffraction peaks with 2θ values 28.8°, 33.1°, 37.6° 40.45°, 43.4°, 47.8°, 56.65°, 61.8° and 65.8°, which corresponds to (222), (400), (420), (332), (134), (440), (622), (543) and (642) reflection planes, respectively. The diffraction peaks of Y2O3/FTO thin film correspond well to the standard cubic structure (JCPDS 00-043-1036) [61]. Peaks at 26.5°, 33.8°, 37.9°, 51.5°, 61.6° and 65.5° in all the XRD patterns correspond to FTO with tetragonal structure (JCPDS 41-1445) [62]. The XRD spectrum of NiO-Y2O3/FTO thin film shows separate diffraction peaks of both cubic NiO and cubic Y2O3, which confirms the successful formation of mixed metal oxide thin film without additional impurities. Figure 1b shows the XRD pattern of pure NiO/FTO, ZrO2/FTO, and NiO-ZrO2/FTO thin films. The XRD spectrum of NiO/FTO shows major diffraction peaks with 2θ values of 37.2°, 43.3°, 62.8°, 75.4° and 79.3°, which correspond to the (111), (200), (220), (311) and (222) reflection planes, respectively. All of these peak values perfectly coincide with standard values of the cubic crystalline structure of NiO (JCPDS 01-073-1519) [60]. The XRD pattern of ZrO2/FTO shows prominent diffraction peaks with 2θ values and planes 24.0° (011), 28.2° (−111), 31.4° (111), 34.1° (200), 34.5° (020), 35.3° (002), 38.6° (120), 41.35° (−121), 44.9° (211), 49.3° (220), 50.2° (022), 54.1° (003), 55.4° (310), 58.0° (−222), 59.9° (131), 61.65° (311), 62.9° (113), 64.3° (230), 65.75° (023), 69.3° (321), 71.1° (−223) and 75.2° (140), respectively. All the peaks are in complete accordance with monoclinic ZrO2 according to JCPDS 00-037-1484. The XRD spectrum of NiO-ZrO2/FTO thin film showed separate diffraction peaks of both cubic NiO and monoclinic ZrO2, which confirms the successful formation of mixed metal oxide thin film without additional impurities.

3.2. X-ray Photoelectron Spectroscopy (XPS)

X-ray photoelectron spectroscopy (XPS) was conducted to further verify the elemental composition of the prepared thin films by investigating the binding energies for principal core levels of the elements involved. The NiO-ZrO2/FTO wide range survey scan is shown in Figure S1a revealed the presence of principle core level binding energies of the oxides (NiO, ZrO2, and F-SnO2), which successfully confirmed the formation of thin films. The Zr3d spectrum (Figure 1c) showed principle photoemission peaks at 181.7 eV and 184.0 eV attributed to Zr3d5/2 and Zr3d3/2, respectively, which perfectly resembles the standard monoclinic zirconia [63]. In Figure 1d strong peaks at binding energies of 855 eV and 861.2 eV correspond to Ni 2p3/2 and its satellite while peaks appeared at 872.8 eV and 880.0 eV correspond to 2p1/2 and its satellite, respectively. Satellite peaks originate from interactions of emitted core-shell photoelectrons with valence electrons [64]. While in Figure S1b the de-convoluted peaks at 530 eV are due to Zr–O and Ni–O bonds while peaks at 533.3 eV and 532.2 eV are due to absorbed water or other oxygen-containing species like OH on the surface of the thin film [65]. While performing XPS Carbon impurity (at 285.6 eV) always appears in the spectrum coming from the vacuum chamber (Survey scan).
Figure S1c. summarizes the principal peaks associated with the corresponding elements in NiO-Y2O3/FTO thin film. The presence of principle peaks of the expected elements (NiO, Y2O3, and F-SnO2) in the wide range spectrum of NiO-Y2O3/FTO thin film confirms its impurity-free formation. All the XPS results relate very well to XRD and EDS results. The high-resolution spectrum of Y3d in Figure 1e showed a doublet of de-convoluted peaks at 157.8 eV and 159.9 eV, which are attributed to Y3d5/2 and Y3d3/2, respectively. [66] In Figure 1f strong peaks at binding energies of 855.4 eV and 861.6 eV correspond to Ni 2p3/2 and its satellite while peaks appeared at 872.9 eV and 880.4 eV correspond to 2p1/2 and its satellite, respectively. In Figure S1d the de-convoluted peaks at 530.5 eV are due to Y–O and Ni–O bonds while peaks at 533.8 eV and 532.8 eV are due to absorbed water or other oxygen-containing species like OH on the surface of the thin film [65]. After comparing Zr3d spectrums of NiO-ZrO2/FTO and pure ZrO2/FTO, a small negative shift in binding energies of Zr3d5/2 and Zr3d3/2 was observed (Figure S1e). This shift in binding energies supports the synergism phenomenon via the electron transfer process in the prepared metal oxide composite thin film. The addition of NiO to ZrO2 changes the electronic environment of pure ZrO2, which ultimately causes a shift in the binding energies. Likewise, a very small shift in the binding energies of Y3d5/2 and y3d3/2 was observed due to electron transfer between NiO and Y2O3 in NiO-Y2O3/FTO thin film (Figure S1f). This phenomenon of synergism between metal oxides in the prepared thin films is responsible for higher currents observed with the oxidation of methanol.

3.3. Raman and FT-IR Spectroscopy

The formation of mixed metal oxide thin film was further confirmed by Raman spectroscopic analysis. Figure S2a shows Raman spectra of NiO-Y2O3/FTO thin film in comparison with pure NiO/FTO and Y2O3/FTO thin films. Samples of NiO/FTO showed the main vibrational band at 560 cm−1, which originates from a scattering of a first-order phonon (1P) and corresponds to LO vibrational mode.
The broadband that appeared at 1098 cm−1 originates from a scattering of a second-order phonon (2P), which corresponds to the 2LO vibrational mode. Pure Y2O3/FTO thin film showed main Raman peaks at 137 cm−1, 237 cm−1, 297 cm−1, 461 cm−1 (attributed to Fg vibrational mode) and 569 cm−1, which corresponds to Eg active vibrational mode. The Raman spectrum of NiO-Y2O3/FTO showed the characteristic bands of both NiO and Y2O3, which confirms the formation of mixed metal oxide thin film. Figure S2b shows Raman spectra of NiO-ZrO2/FTO thin film in comparison with pure NiO/FTO and ZrO2/FTO thin films. Pure ZrO2/FTO showed main peaks at 173 cm−1 (Bg), 324cm−1 (B1g), 462 cm−1 (Eg) and 603 cm−1 (B1g). Raman spectrum of NiO-ZrO2/FTO showed characteristic bands of both NiO and ZrO2, which confirms the formation of mixed metal oxide thin film.
FTIR spectra of NiO-Y2O3/FTO and NiO-ZrO2/FTO thin film show no characteristic peaks because the characteristic absorption bands for metal oxides usually appear in the range below 500 cm−1. The IR absorption band at 645 cm−1 is attributed to Sn–O bond vibration due to the FTO glass substrate. All the spectra reveal the formation of pure metal oxide thin films with no carbonaceous impurities present, as shown in Figure S2c.

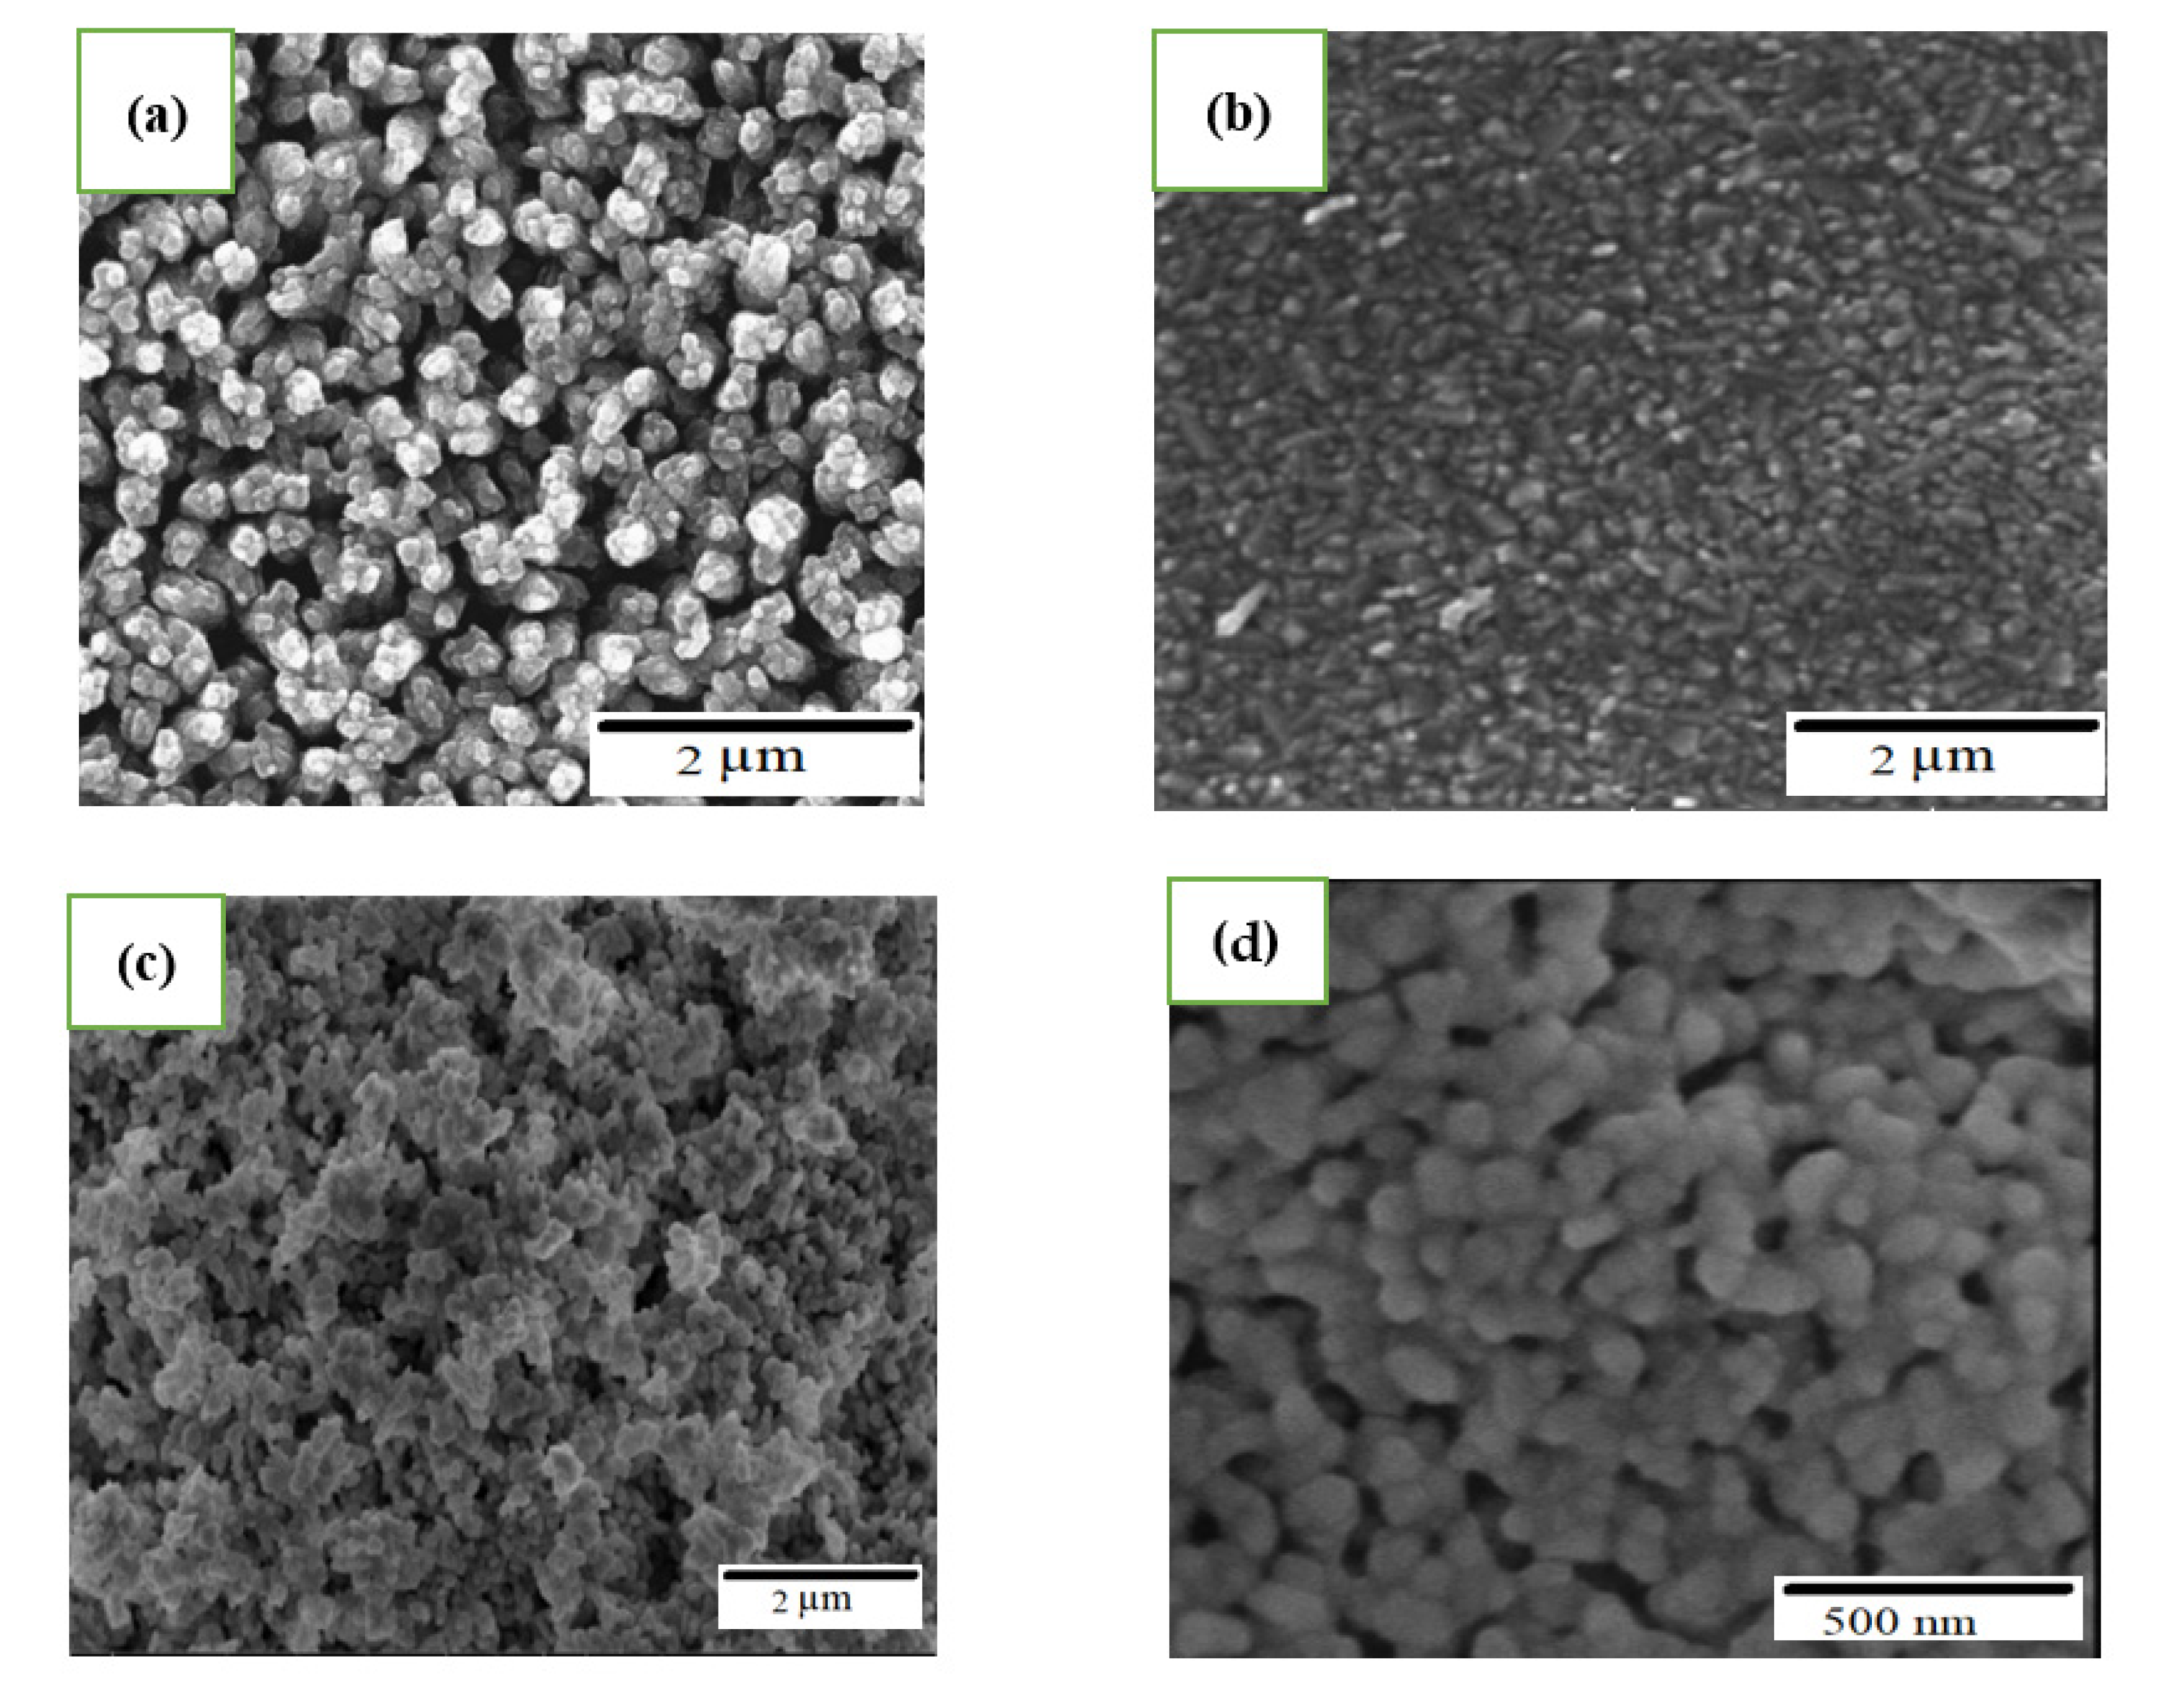
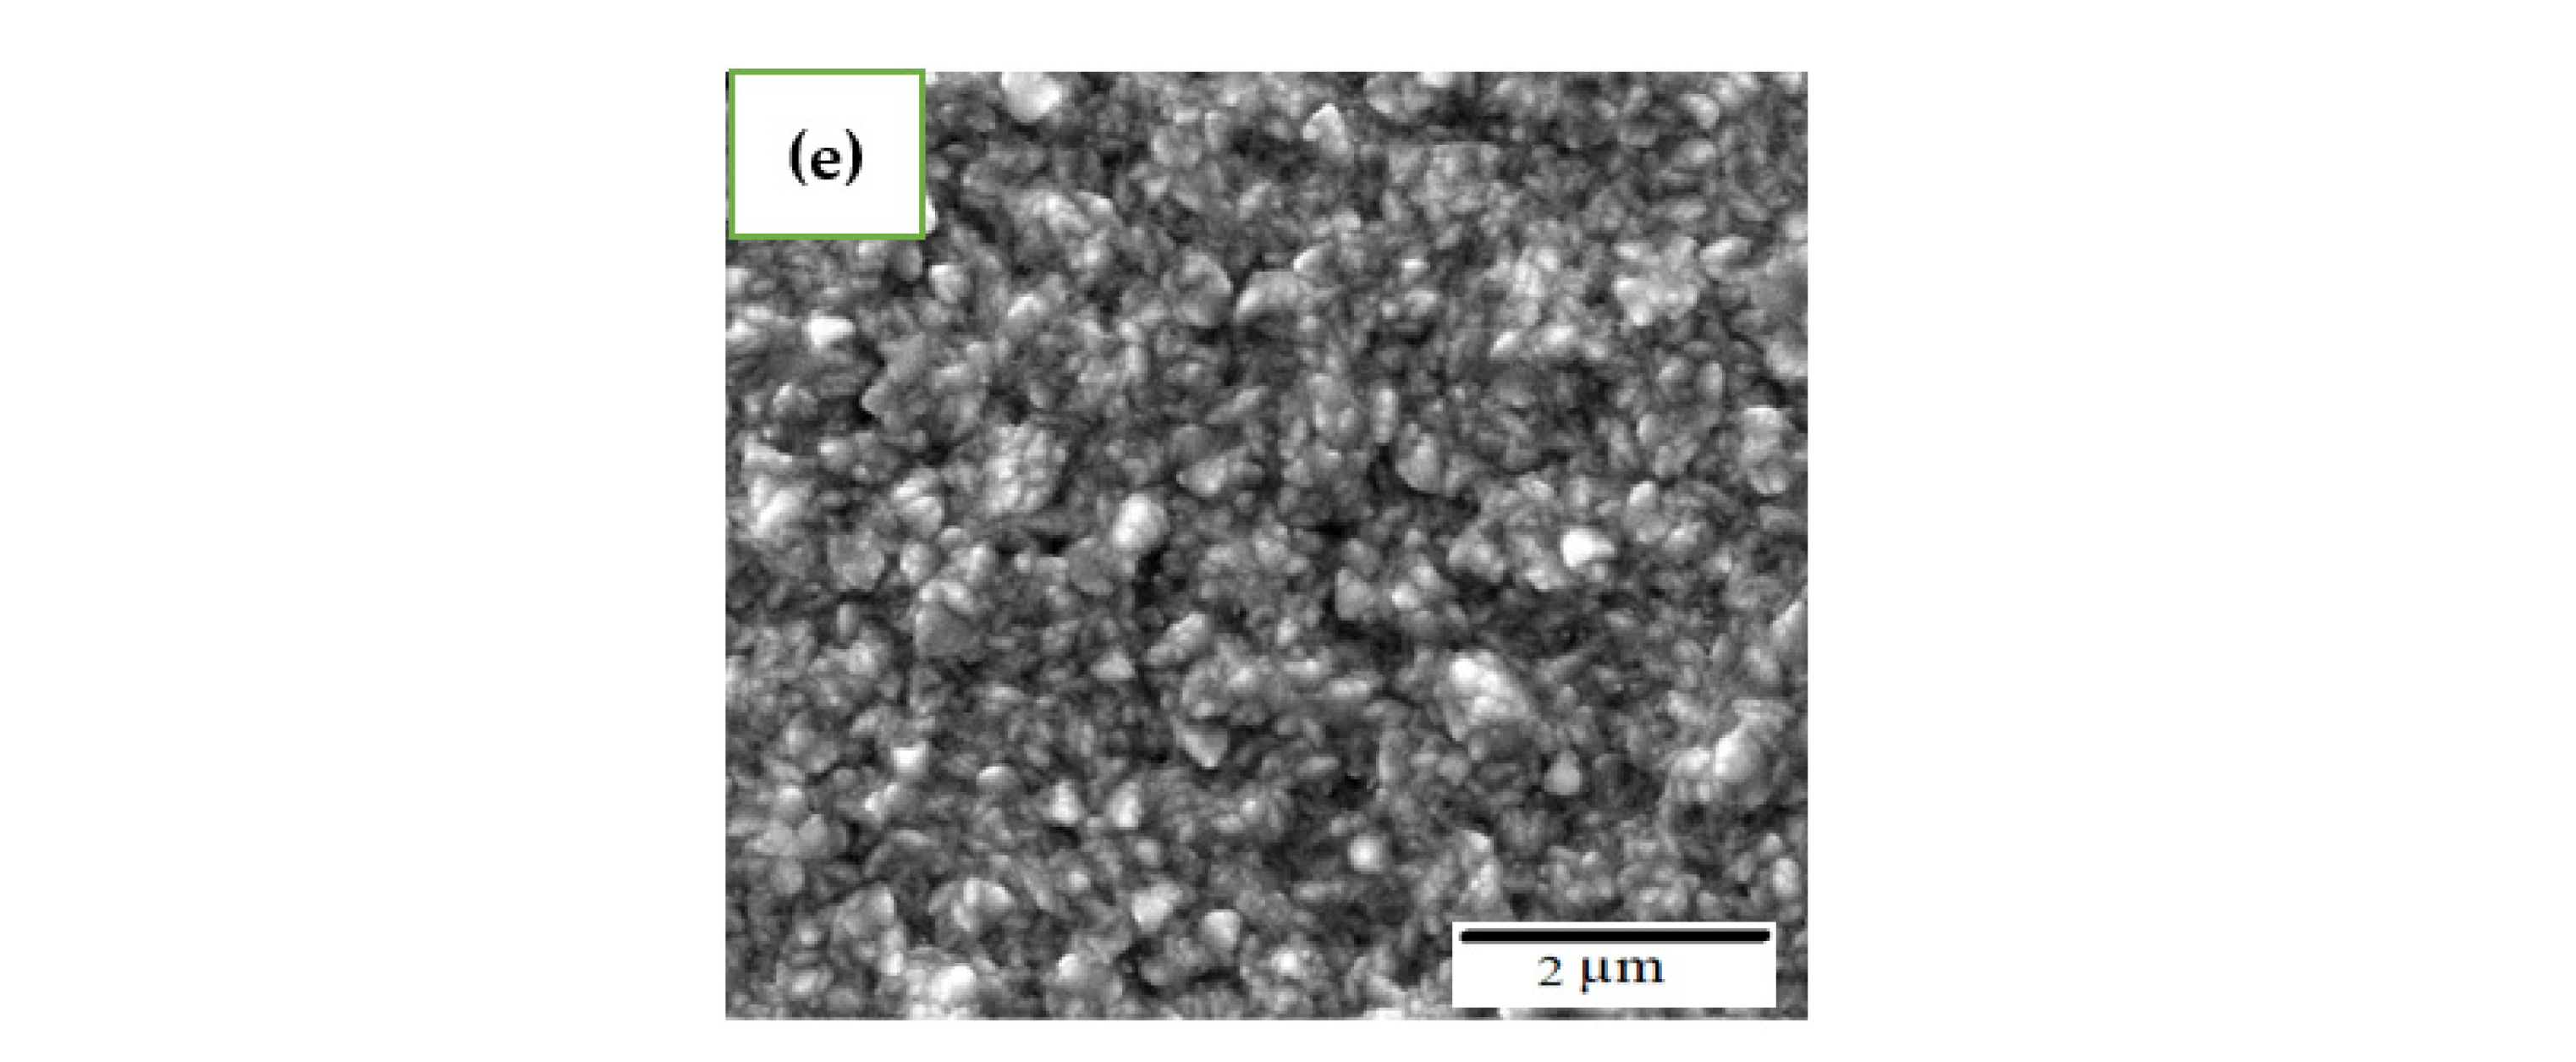
3.4. Surface Topography

The morphology and textural features of the prepared metal oxide thin films were analyzed via FESEM.
Figure 2a–c shows FESEM images of NiO/FTO, ZrO2/FTO, and NiO-ZrO2/FTO thin films, respectively. SEM images revealed that the prepared thin films constitute porous layers of well-interconnected uniformly distributed irregular-shaped stacks of particles. Figure 2d,e display FESEM images of Y2O3/FTO and NiO-Y2O3/FTO thin films, respectively. Samples of Y2O3 show a porous surface with uniformly distributed and well-interconnected irregular-shaped particles. FESEM images of NiO-Y2O3/FTO thin film revealed the formation of a smooth and uniform film, with improved connectivity as compared to individual NiO and Y2O3 films. The characteristic well-connected particles and porosity of the surfaces allow the methanol and electrolyte solution to diffuse to the deeper layers of the prepared catalyst, which ultimately boosts the MOR kinetics and efficiency.
The elemental composition and atomic distribution of the prepared thin films were confirmed by the EDS technique. Figure S3 the EDS spectra of NiO/FTO, ZrO2/FTO, Y2O3/FTO, NiO-ZrO2/FTO, and NiO-Y2O3/FTO thin films, which were taken after focusing on different areas of the films. The analysis confirms the successful formation of thin films by ensuring the presence of expected elements.

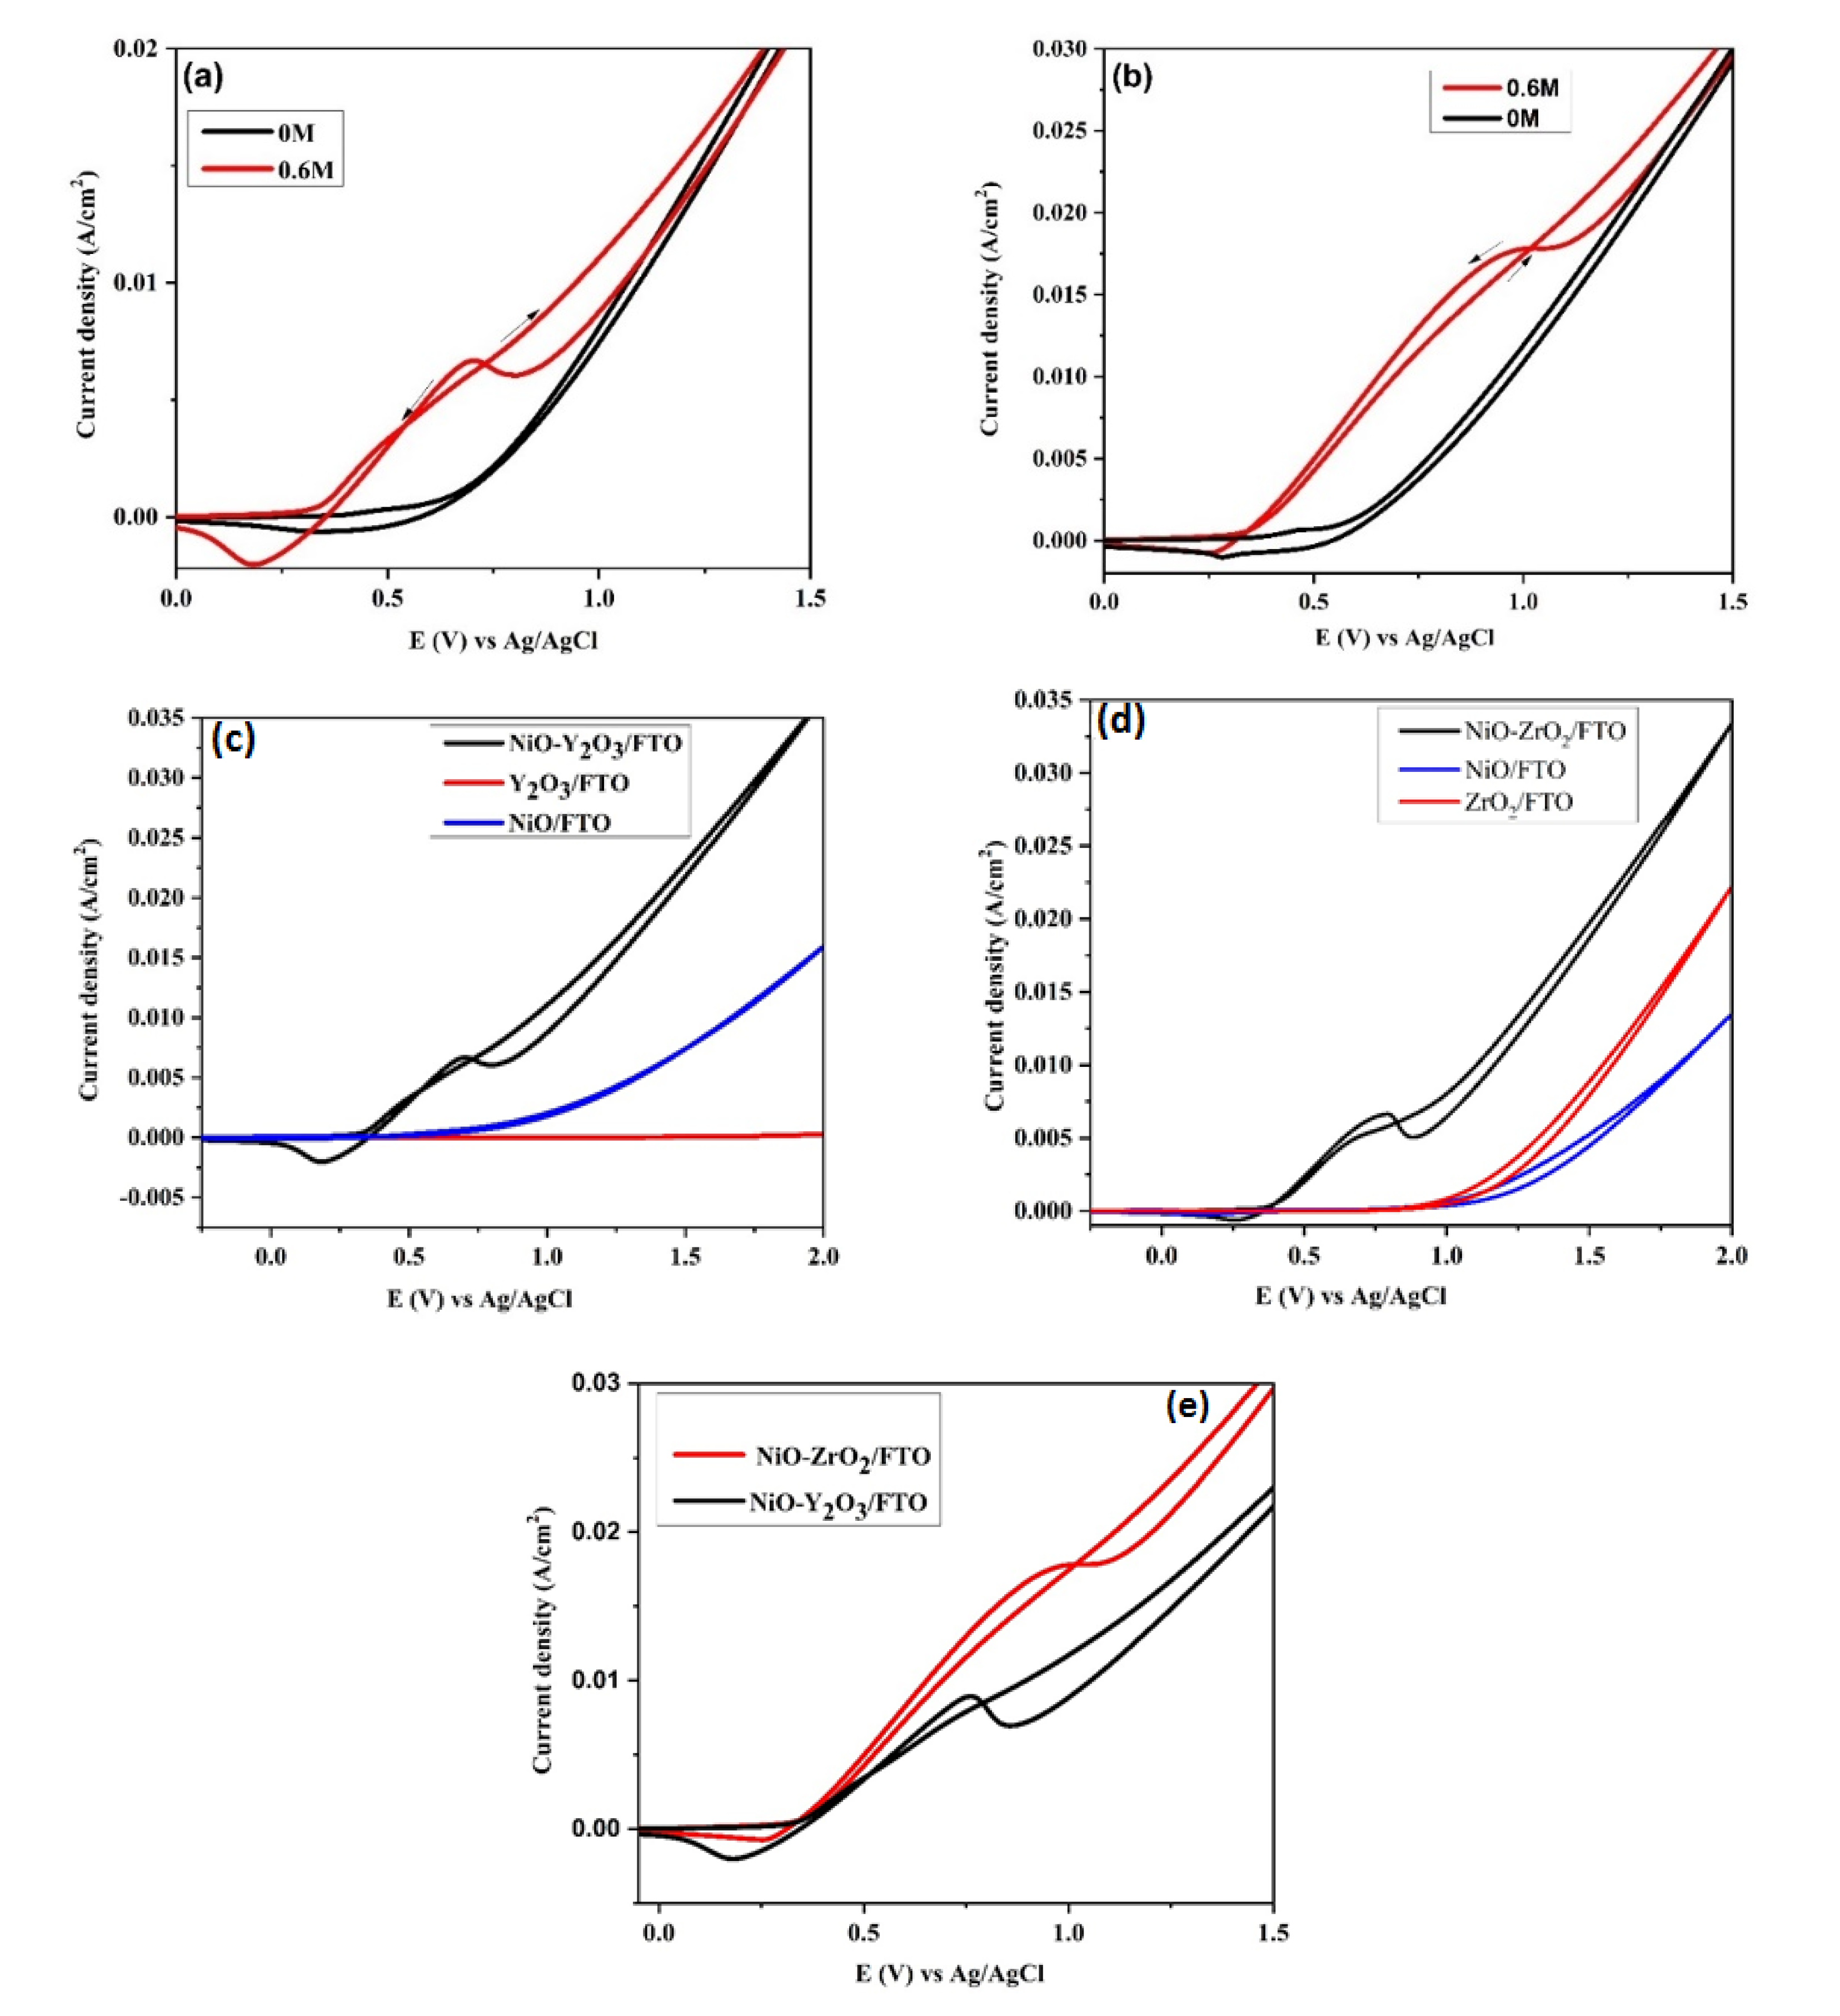
3.5. Electrochemical Oxidation of Methanol

Electrocatalytic performance, of prepared metal oxide thin films towards methanol oxidation, was carried out in 0.5 M NaOH electrolyte solution at a scan rate of 100 mV/s using Pt wire as a counter electrode, Ag/AgCl as reference electrode, and prepared metal oxide composite thin film as the working electrode. Figure 3a represents a cyclic voltammogram of synthesized NiO-Y2O3/FTO thin films recorded before and after the addition of 0.6 M methanol solution to the reaction medium. It can be seen that in the absence of methanol no prominent oxidation peaks are observed, only a small reduction peak at 0.34 V in the backward scan is observed, which is attributed to Ni(OH)2/NiOOH reduction reaction [67]. A prominent methanol oxidation peak at 0.65 V with a current density value of 6.2 mA/cm2 is observed with 0.6 M methanol solution at a scan rate of 100 mV/s. Figure 3b represents a cyclic voltammogram of synthesized NiO-ZrO2/FTO thin film recorded in the absence and presence of 0.6 M methanol solution. Here it is also observed that in the absence of methanol no prominent oxidation peaks are observed, only a small reduction peak due to Ni(OH)2/NiOOH reduction is observed at 0.28 V in the backward scan [67]. A prominent methanol oxidation peak at 0.65 V with a current density value of 10 mA/cm2 is observed with 0.6 M methanol solution. The appearance of an oxidation peak in the reverse scan reveals that methanol oxidation continues in the cathodic half-cycle as well. This behavior can be explained as the oxidation peak obtained in the anodic scan is due to the oxidation of freshly chemosorbed methanol to carbonaceous intermediate species parallel to oxidation of Ni2+ and Ni3+ species [67]. Oxidation of Ni2+ and Ni3+ species along with deposition of carbonaceous intermediates/products on working electrode (electrode poising) results in decreasing the availability of active sites for overall methanol oxidation. Thus, when the potential was swept cathodically methanol oxidation continues, and a maximum oxidation peak current is obtained associated with oxidation of carbonaceous species not completely oxidized in the anodic scan and availability of active sites for adsorption of methanol.
For comparative studies, cyclic voltammograms obtained with prepared composite metal oxide thin films were compared with pure NiO/FTO, Y2O3/FTO, and ZrO2/FTO thin films as shown in Figure 3c,d. No prominent oxidation peaks were observed with pure NiO/FTO and Y2O3/FTO and ZrO2/FTO thin films in the presence of methanol solution, which is attributed to the synergistic effect between metal oxides in mixed metal oxide thin films. The good interaction between the two metal oxides on the surface of thin film allows the oxides to exchange electrons through synergism, as a result enhancing the peak performance of the electrocatalyst and giving high current densities.
Similarly, the cyclic voltammograms of prepared NiO-Y2O3/FTO and NiO-ZrO2/FTO thin films using 0.6 M methanol solution were compared as depicted in Figure 3e, NiO-ZrO2/FTO thin film observed a current density of 10 mA/cm2 with onset potential at 0.33 V while NiO-Y2O3/FTO gave a current density value of 6.2 mA/cm2 with an onset potential of 0.33 V, respectively. To check the effect of FTO glass substrate, bare FTO glass substrate was run in the absence and presence of 0.6 M methanol, and it was found, that bare FTO glass is not active for methanol oxidation. In supplementary information, Figure S4a,b show the results of bare FTO in the presence/absence of methanol and comparison of FTO with composite oxides in presence of 0.6 M methanol, respectively.

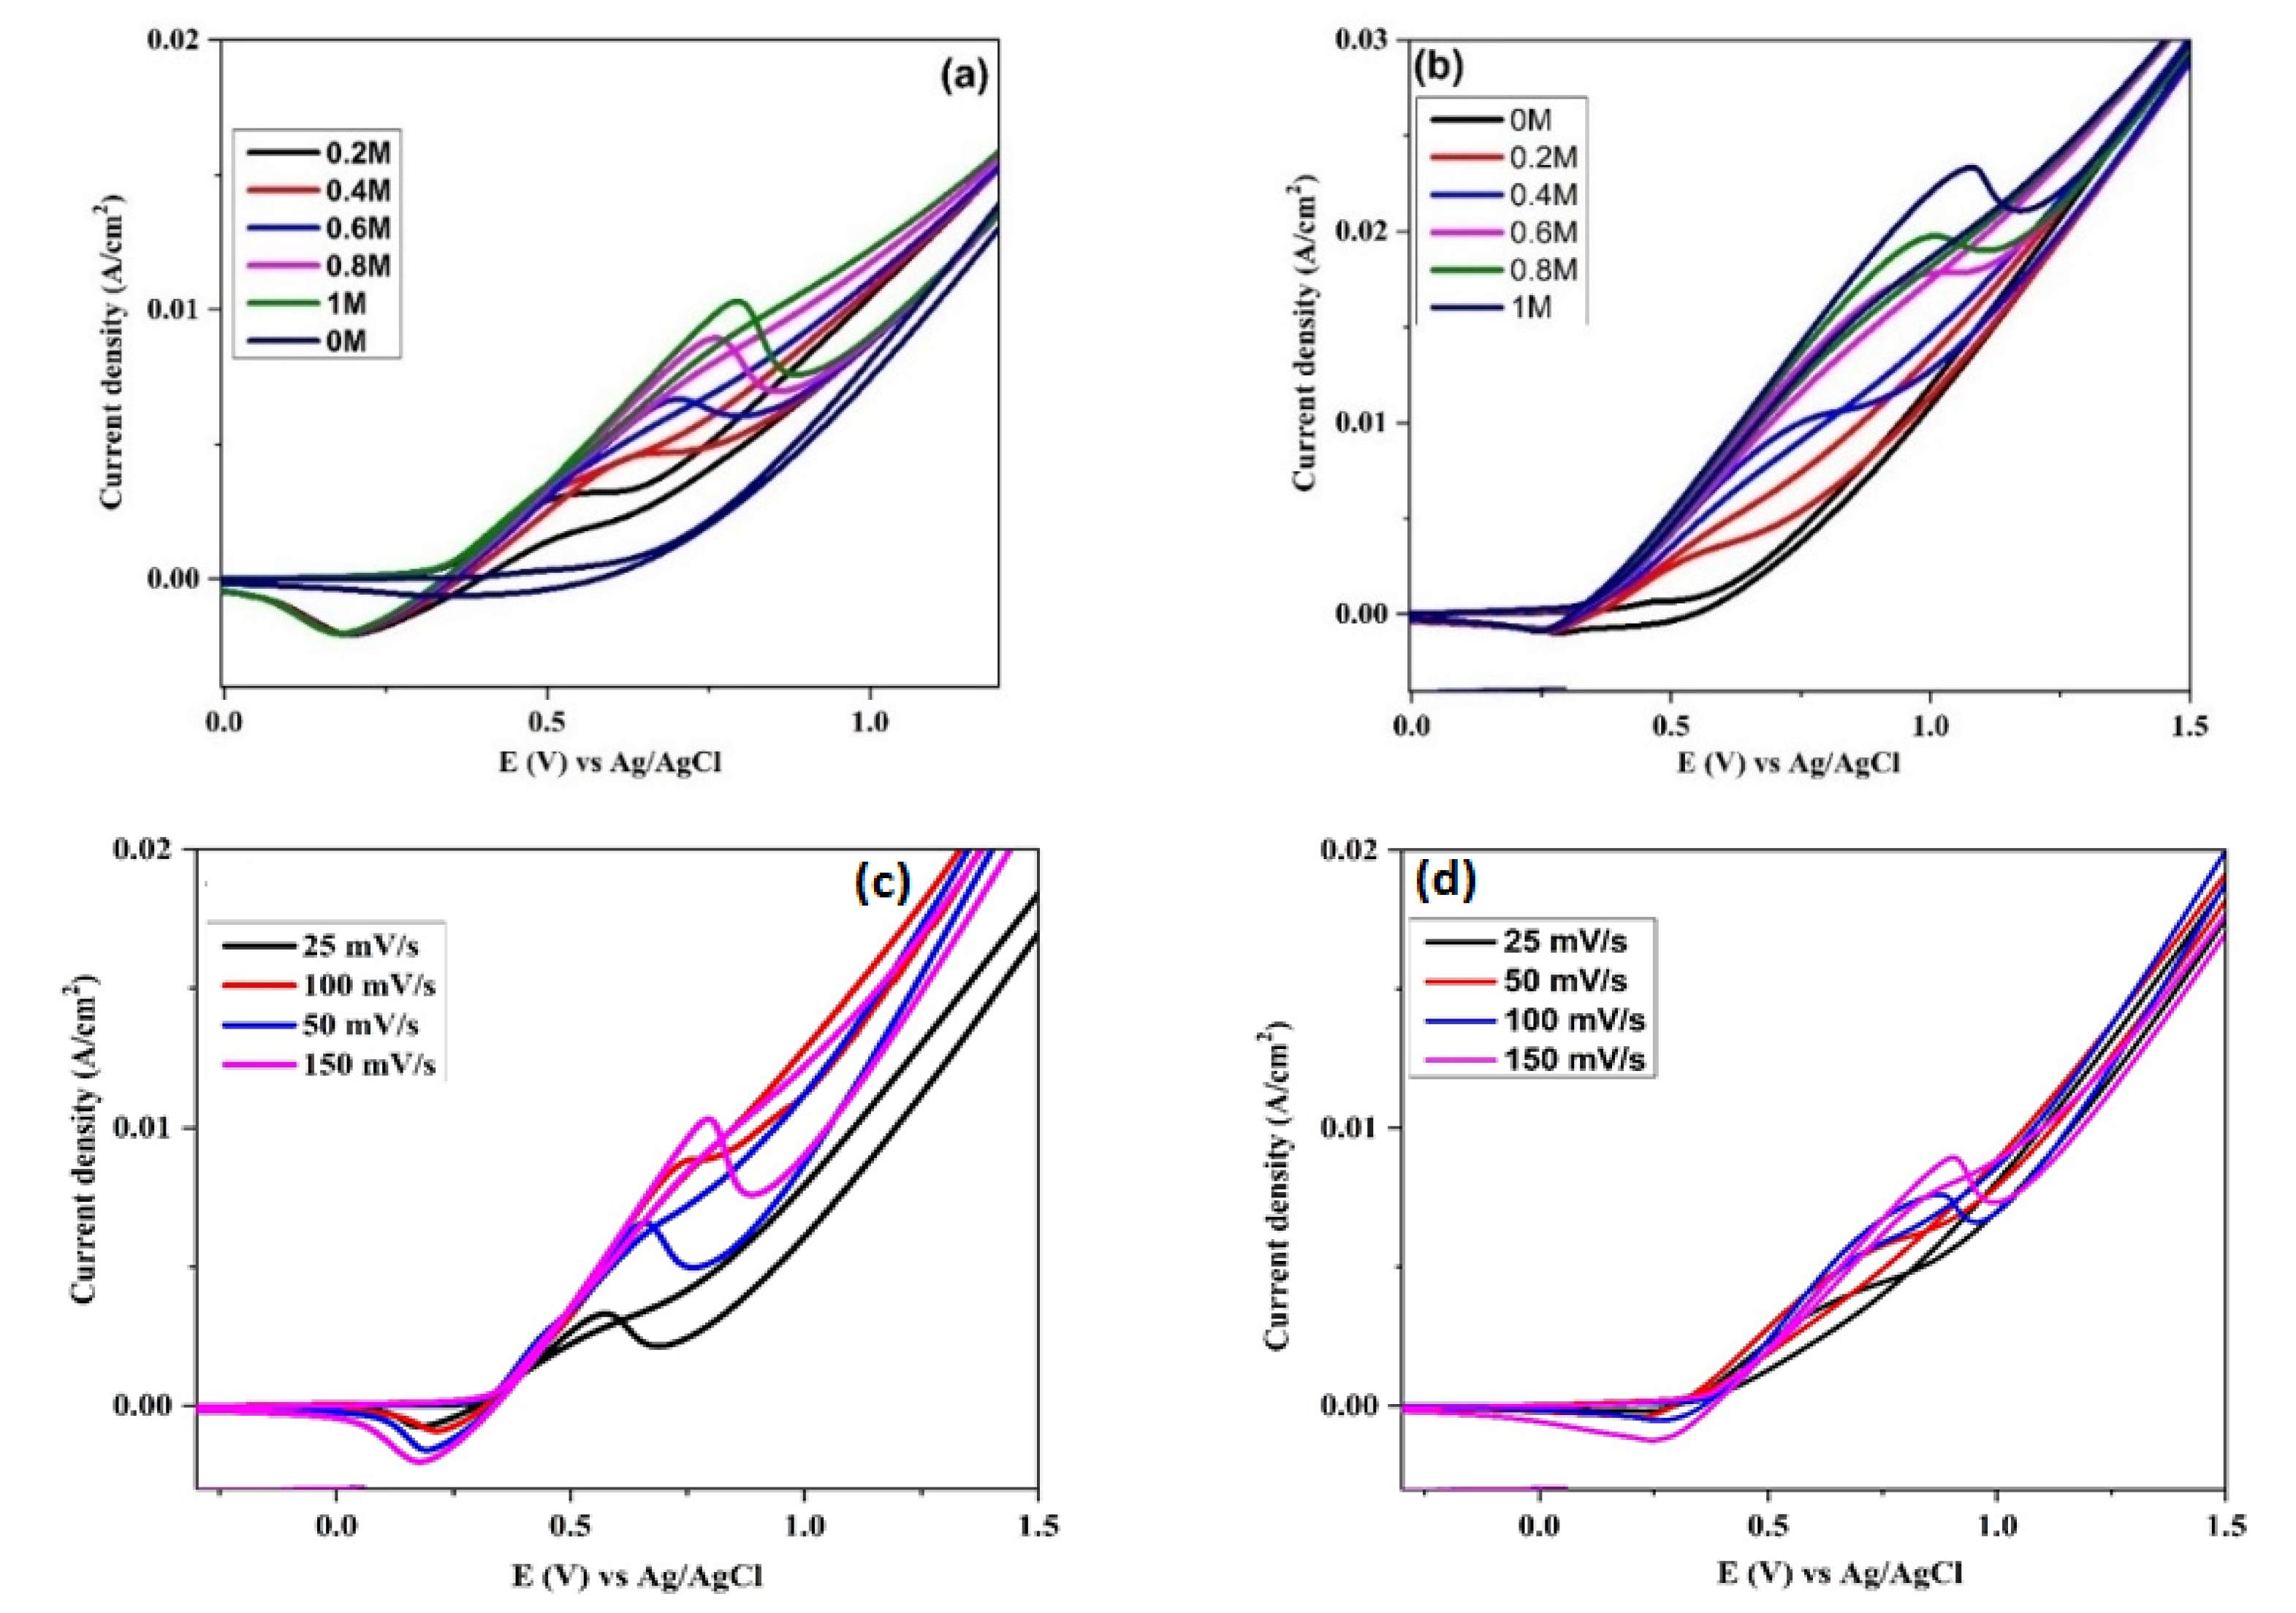
3.5.1. Effect of Methanol Concentration on the Electro-Catalytic Performance of Thin Films

The dependence of electrocatalytic behavior of synthesized metal oxide thin films on methanol concentration was also studied. Figure 4a,b display a cyclic voltammogram of NiO-Y2O3/FTO and NiO-ZrO2/FTO thin film, recorded in 0.5 M NaOH in the absence and presence of (0.2, 0.4, 0.6, 0.8, and 1 M) methanol solution. The current density for methanol oxidation steadily increases as methanol concentration increases, which means the current density of oxidation peaks depends on the bulk concentration of methanol. Additionally, methanol oxidation peaks shifted towards higher potential with increasing methanol concentration, which might be attributed to increased concentration of unoxidized carbonaceous products that need higher potential to be oxidized plus saturation of active sites, which leads to slowing down the oxidation process [67,68]. The current densities of NiO-Y2O3/FTO and NiO-ZrO2/FTO for different concentrations of methanol at specified onset potentials are presented in Table 2 and Table 3, respectively.

3.5.2. Effect of Scan Rate on the Electro-Catalytic Performance of Thin Films

The effect of different scan rates on the electrocatalytic performance of thin films was studied in 0.5 M NaOH electrolyte solution against Ag/AgCl reference electrode and Pt as counter electrode in the presence of 0.6 M methanol solution. Cyclic voltammograms of NiO-Y2O3/FTO and NiO-ZrO2/FTO thin films, as shown in Figure 4c,d, respectively, peak current density increases with an increase in the scan rate (from 25 mV/s to 150 mV/s), which underpins the fact that oxidation of methanol is diffusion-controlled process. An increase in scan rate increases the electron transfer process, which ultimately enhances the peak current density. Additionally, as can be seen in Figure 4c,d the oxidation peak slightly shifts towards positive potential with an increase in the scan rate, which is attributed to the Ohmic drop generated at high current density [67,69].

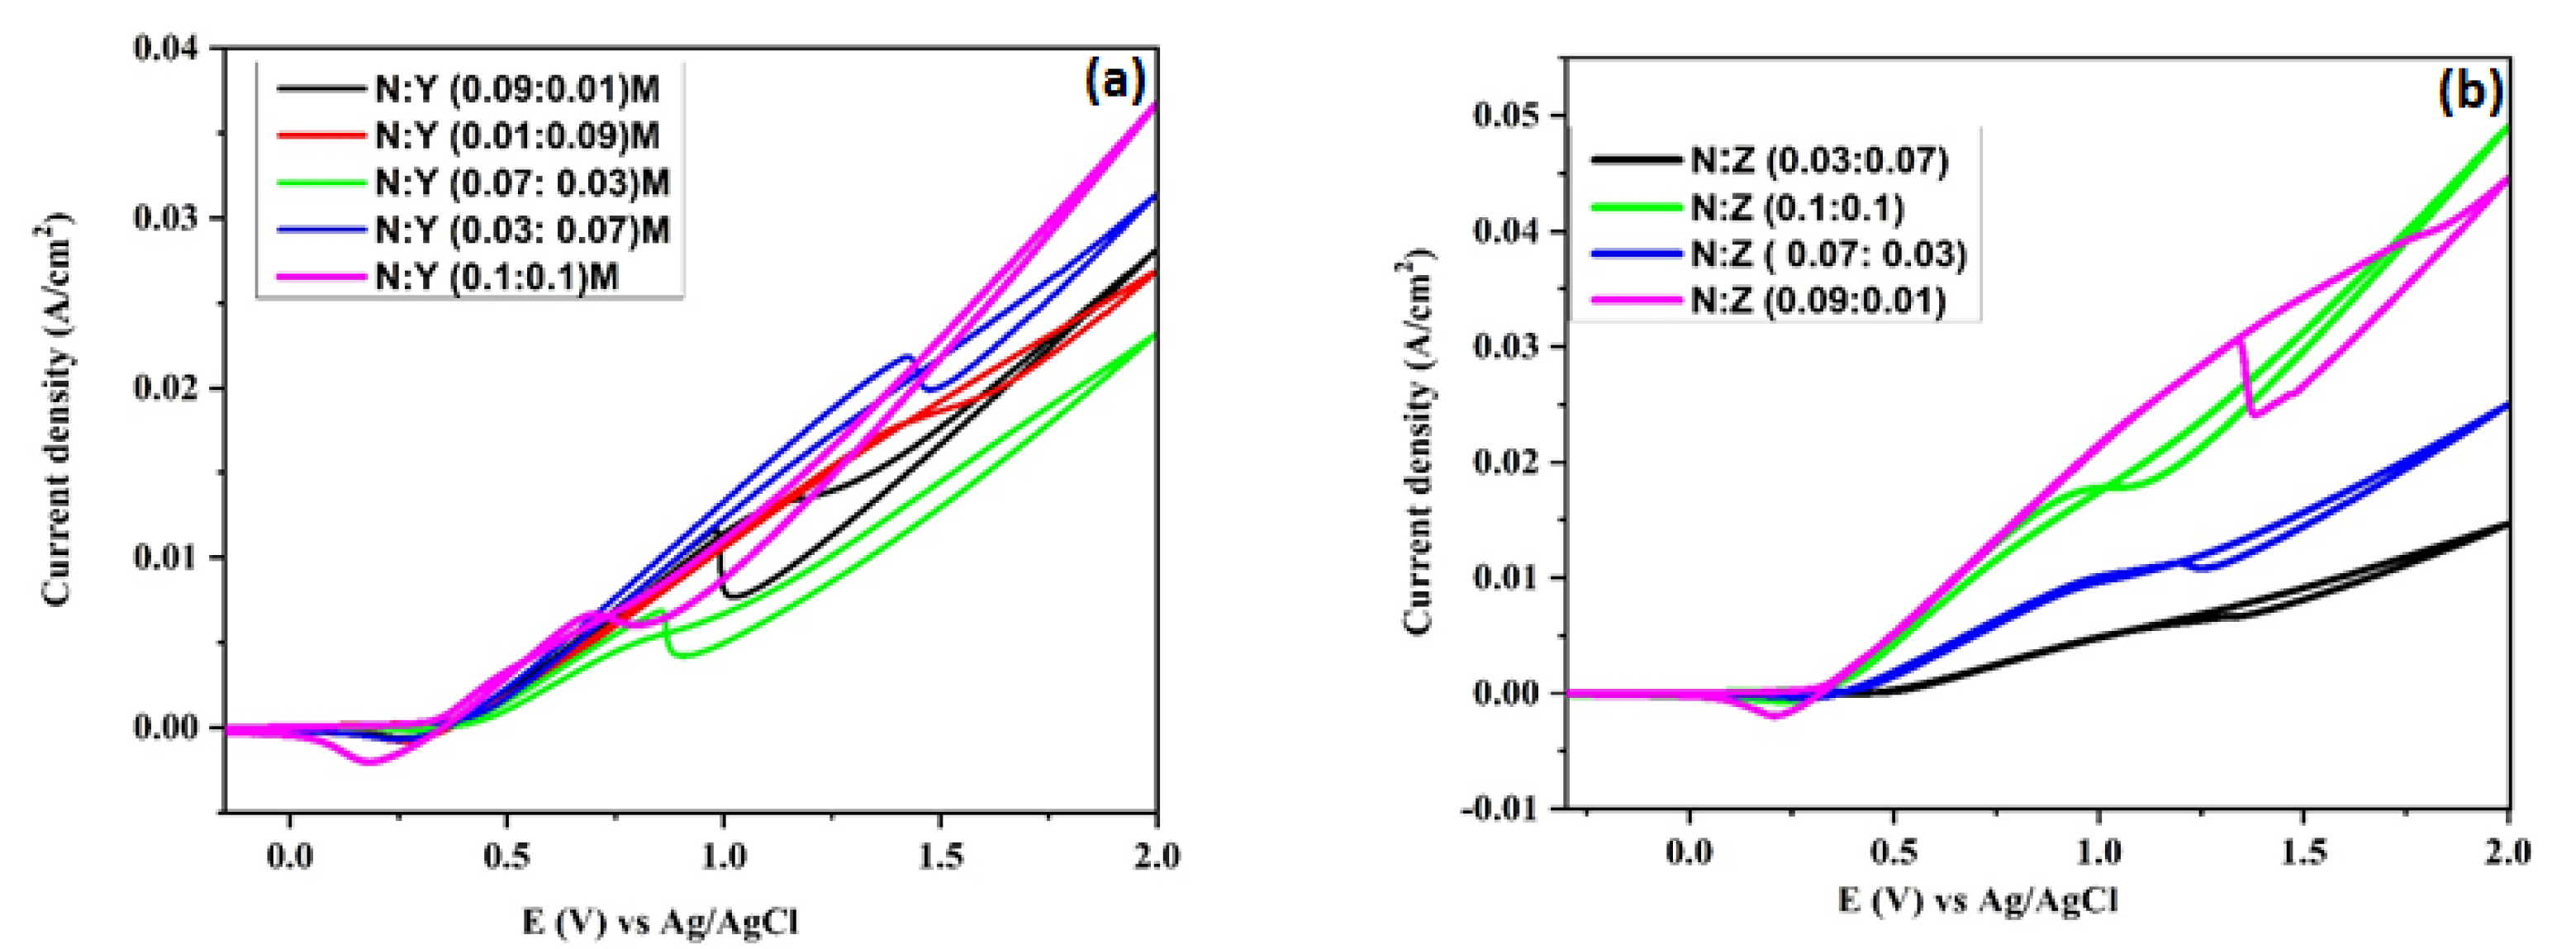
3.5.3. Effect of Catalyst Concentration on the Electrocatalytic Performance of Thin Films

To analyze the effect of the concentration of NiO and Y2O3 on the electrocatalytic performance of NiO-Y2O3/FTO, thin films were deposited from precursor solutions with different Ni:Y precursor concentrations (0.09:0.01, 0.07:0.03, 0.03:0.07, 0.01:0.09). Cyclic voltammograms of these thin films recorded with 0.5 M NaOH and 0.6 M methanol at a scan rate of 100 mv/s were compared with a thin film of Ni:Y (0.1:0.1) as shown in Figure 5a. Thin-film with 0.1:0.1 precursor concentration showed the best results with oxidation peak at the lowest onset potential as represented in Table 4.
Similarly, the effect of the concentration of NiO and ZrO2 on the electrocatalytic performance of NiO-ZrO2/FTO thin films was investigated. The precursor solutions with different Ni:Zr precursor concentrations (0.09:0.01, 0.07:0.03, 0.03:0.07). Cyclic voltammograms of these thin films recorded in 0.5 M NaOH electrolyte and 0.6 M methanol at a scan rate of 100 mv/s were compared with a thin film of Ni: Zr (0.1:0.1) as shown in Figure 5b. Thin-film with 0.1:0.1 precursor concentration showed the best results with oxidation peak at the lowest onset potential as represented by Table 5. It is assumed that when the ratio of precursors changes during film deposition, its morphology and thus interaction at heterojunction sites changes. Therefore, the observed changes can be caused not only by the difference in composition of the mixed oxide, but also by a different morphology, porosity, and electrochemically active surface of the films [70].

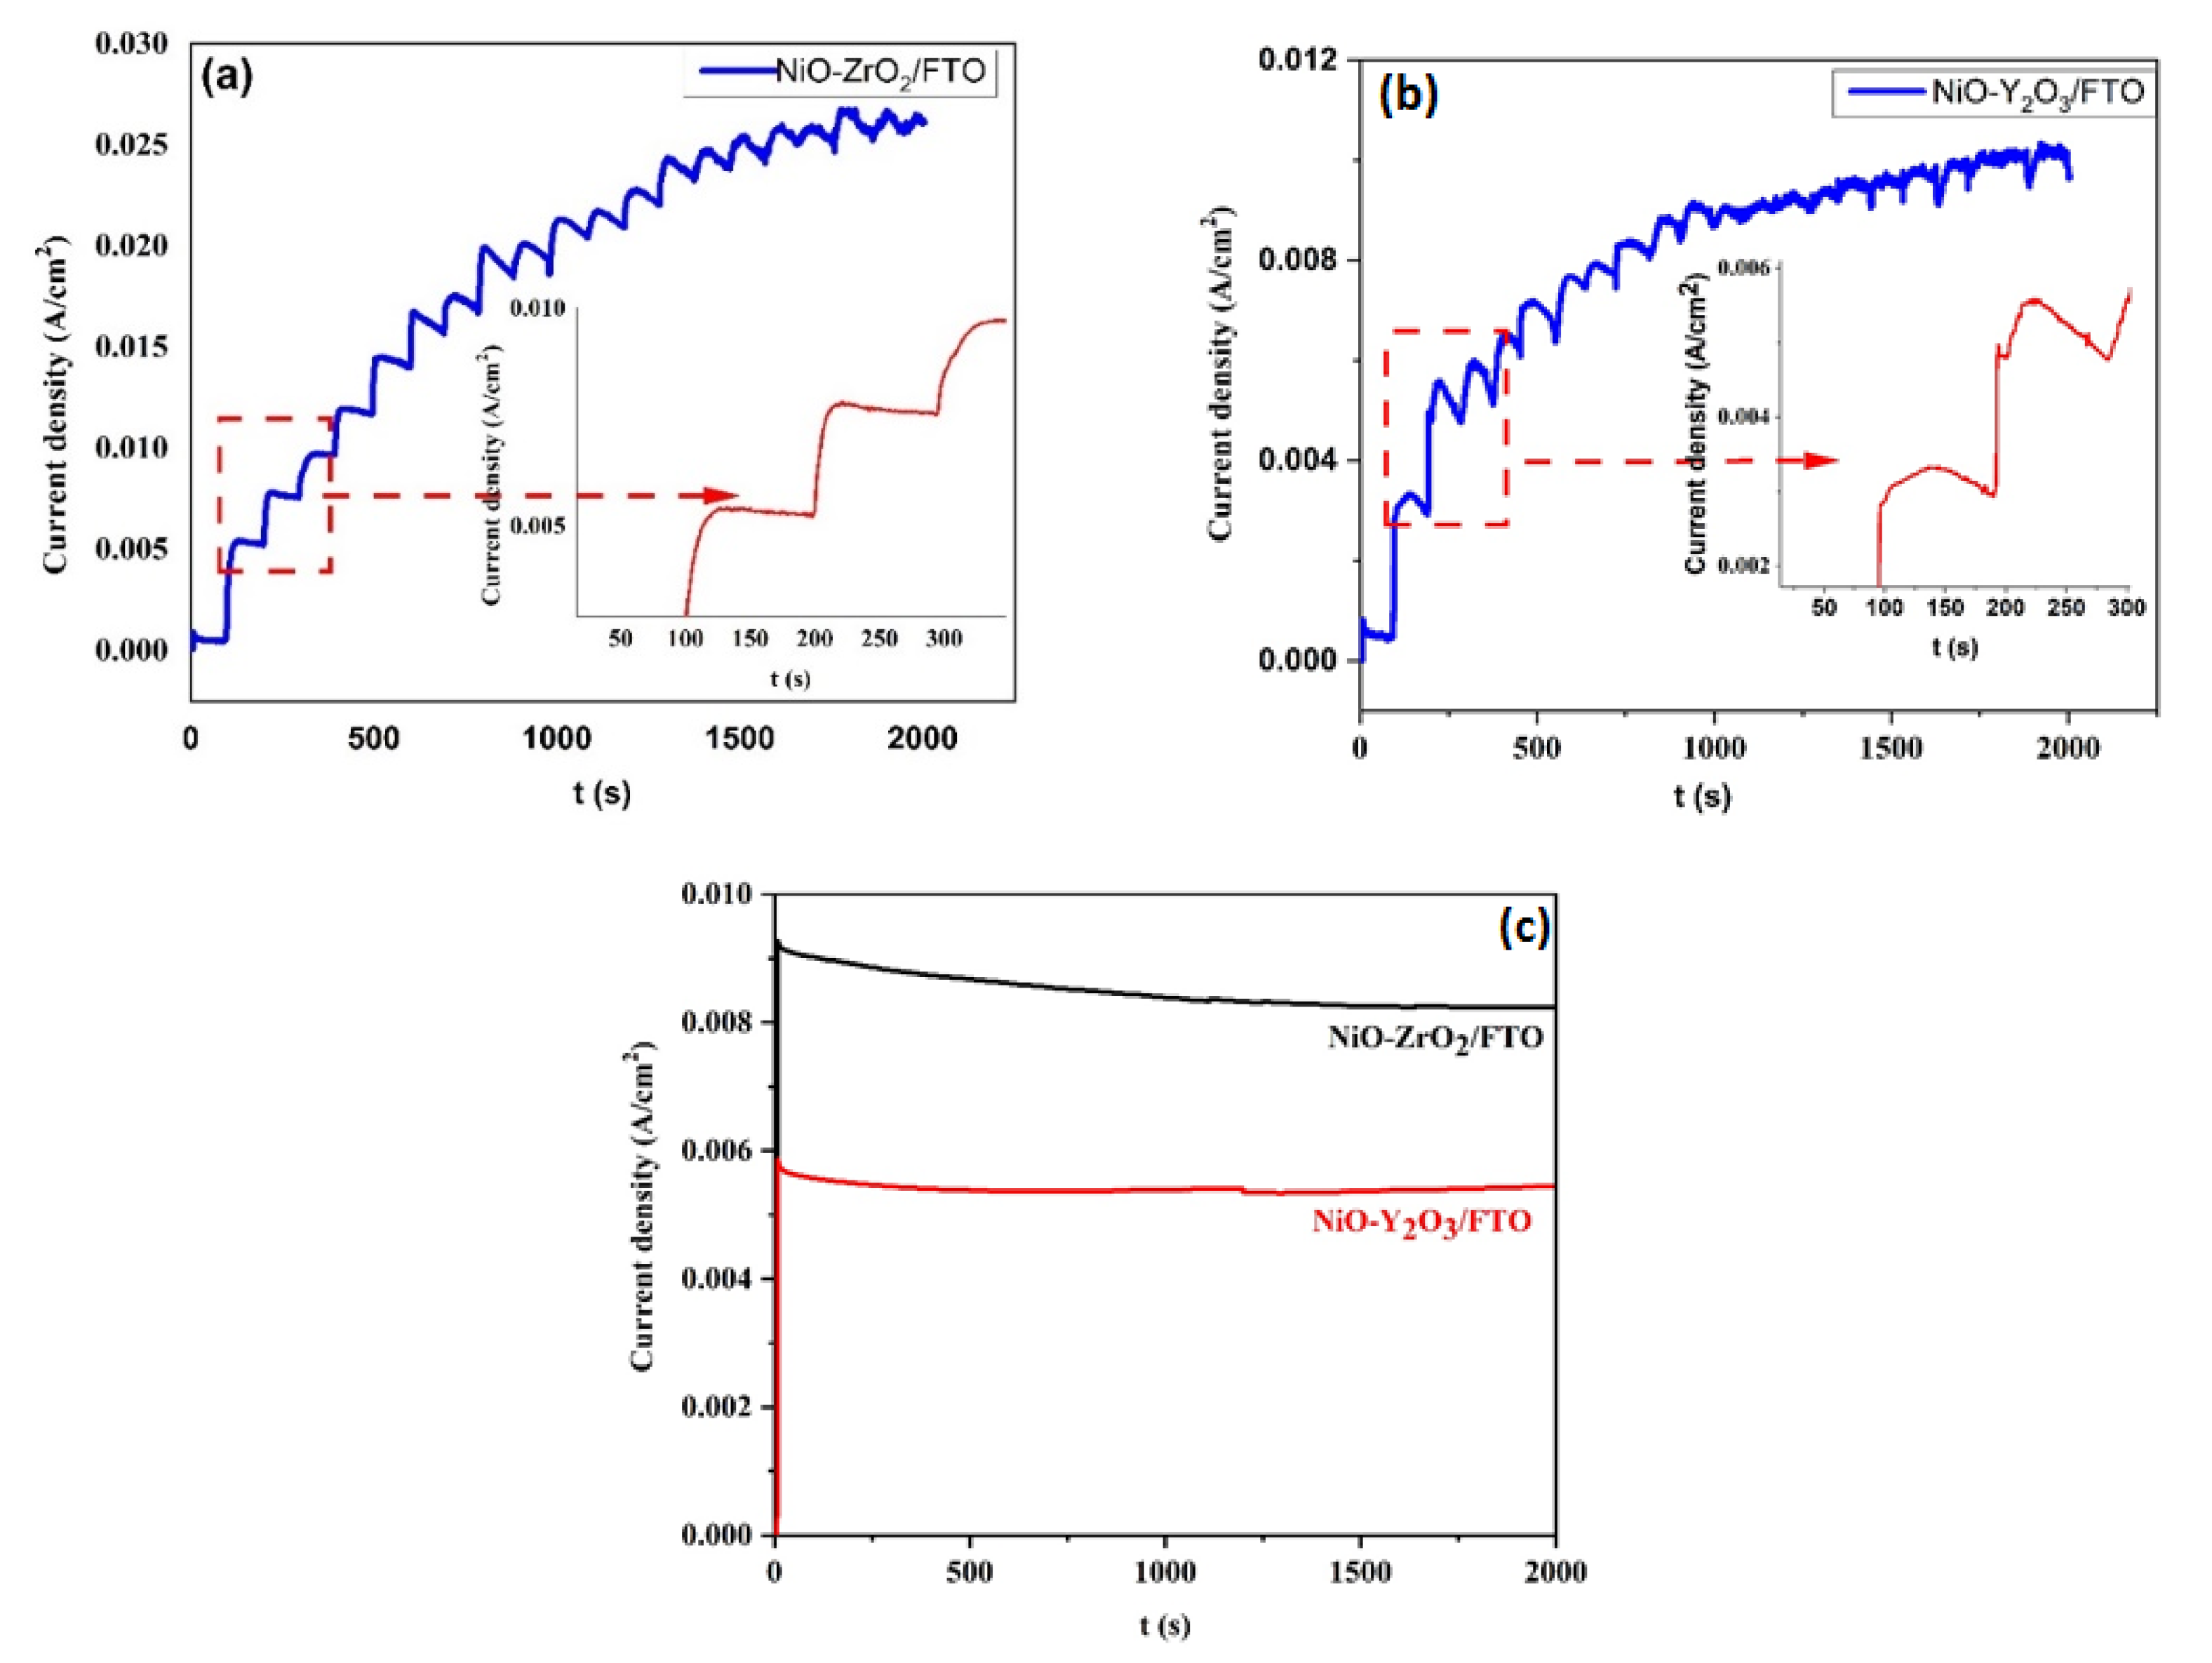
3.5.4. Chronoamperometry

The electrocatalytic oxidation of methanol by as-synthesized films (0.1:0.1 Ni:Y) was further studied via chronoamperometry. The analysis was performed for 2000 s with successive addition of 0.2 M methanol after every 90 s at an applied potential of 0.6 V. It was observed that the Current-time plot of NiO-ZrO2/FTO and NiO-Y2O3/FTO thin film shows an increase in current on each addition of methanol as shown in insets of Figure 6a and Figure 6b, respectively. The spikes in the inset of Figure 6b show rapid catalytic oxidation of methanol followed by a decrease in current due to a reduction of methanol concentration. This implies the efficient electrocatalytic activity of prepared thin film towards methanol oxidation.
The chronoamperogram shown in Figure 6c was recorded in the presence of 0.6 M methanol for 2000 s to determine the stability of NiO-ZrO2/FTO and NiO-Y2O3/FTO electrodes, respectively. It is observed that there is a decay of 10% and 6.8% of initial current density values. This decay may be due to the reduction of methanol concentration near the electrode surface with time or due to the accumulation of carbonaceous reaction intermediates like CO on the electrode surface [71,72,73]. A comparative study of the present work with published work has been summarised in Table 6. It is found that the current density produced by NiO-ZrO2 is close to the commercially available Pt/C [74]. However, due to the presence of ZrO2, the catalyst developed in the present study seems more stable toward CO poisoning [34,35] and, gives a steady current as shown in Figure 6c. Moreover, the commercially available Pt/C could produce a current of 9 mA·cm−2 using 5 M methanol, however, in the present study this much current is produced using 0.6 M methanol.

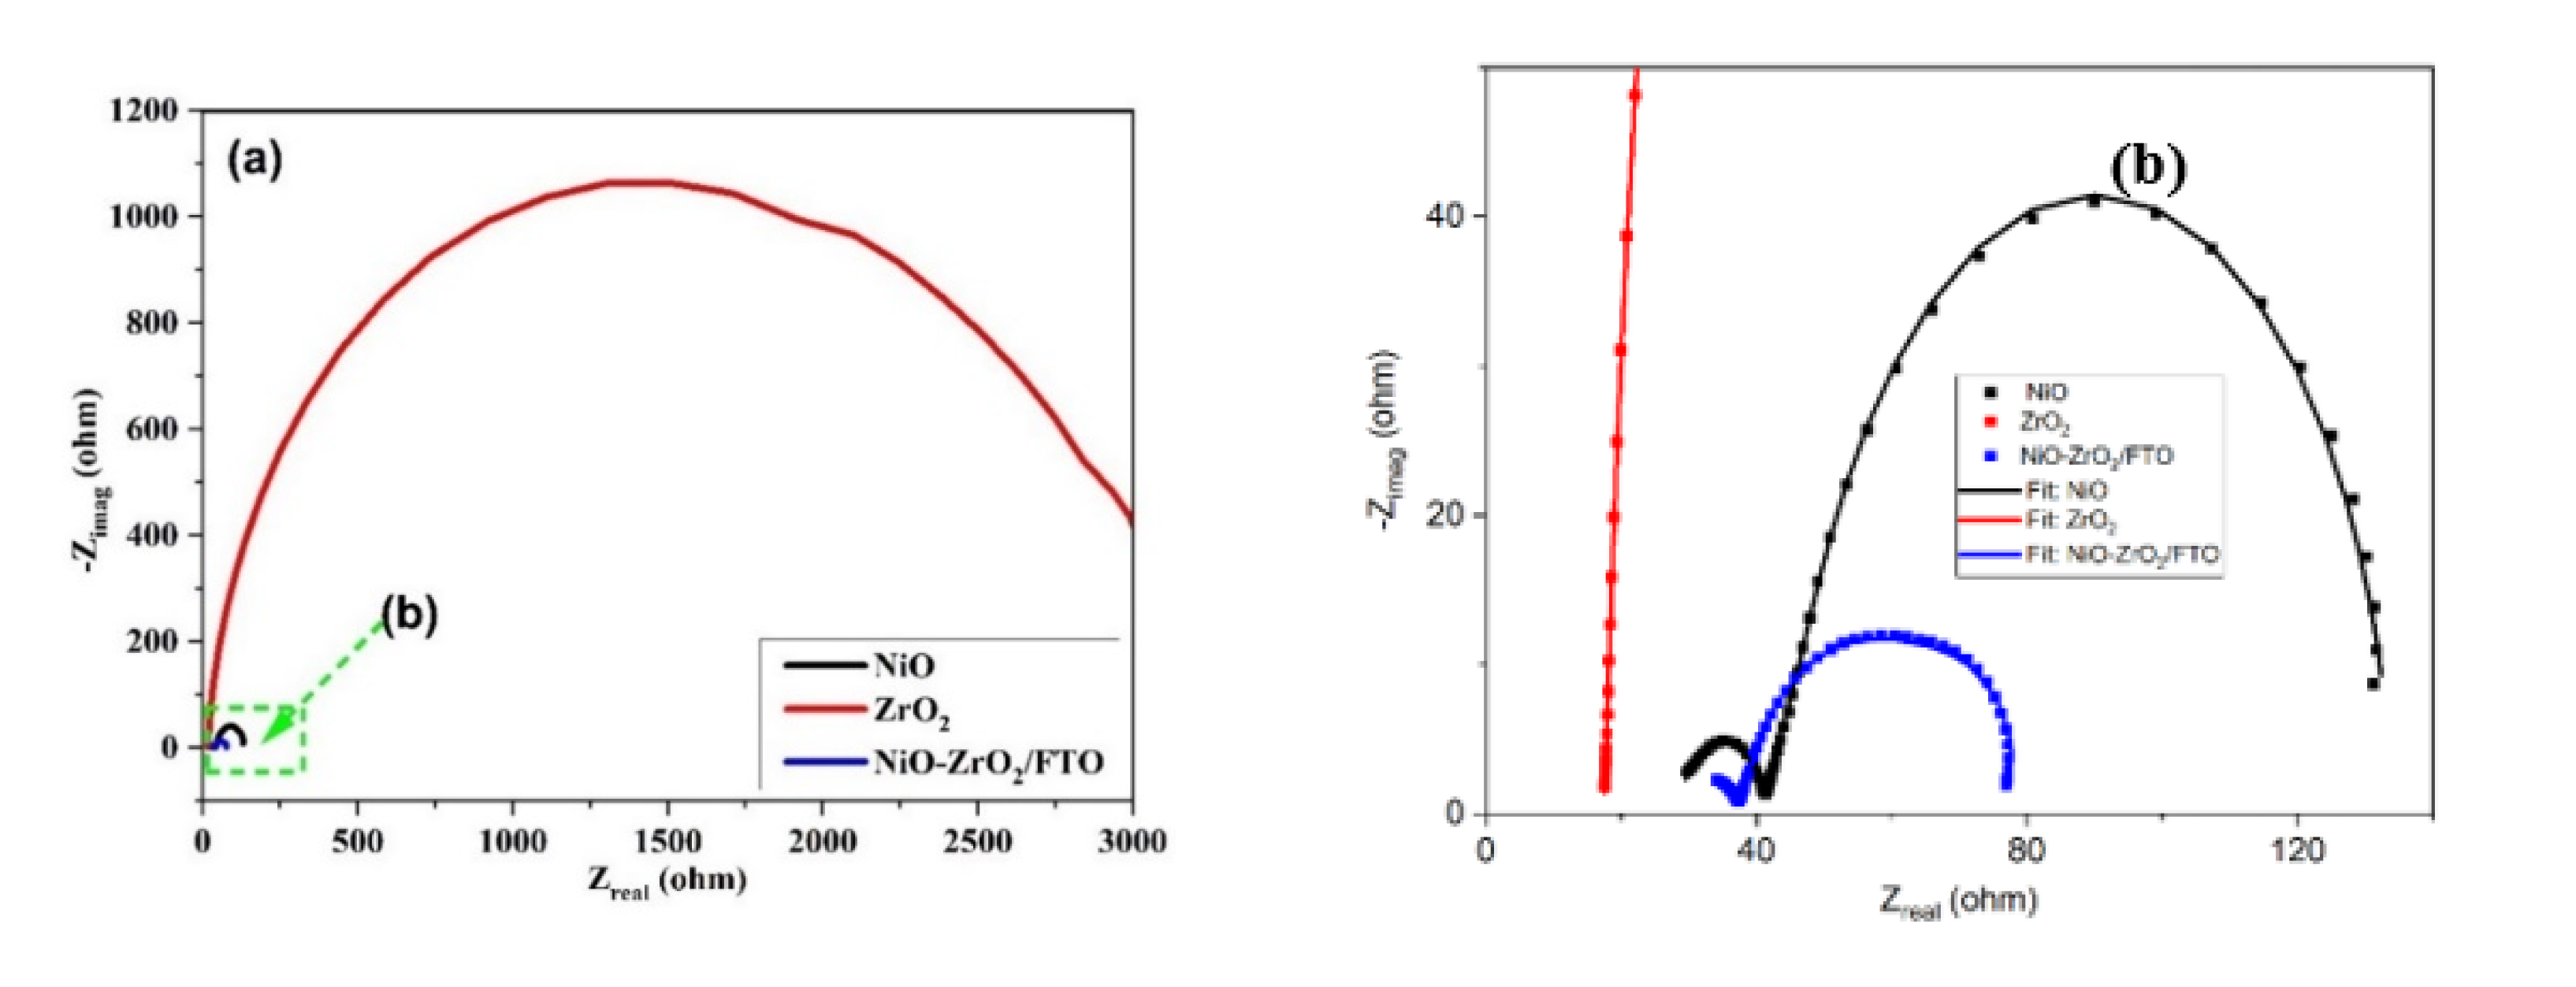
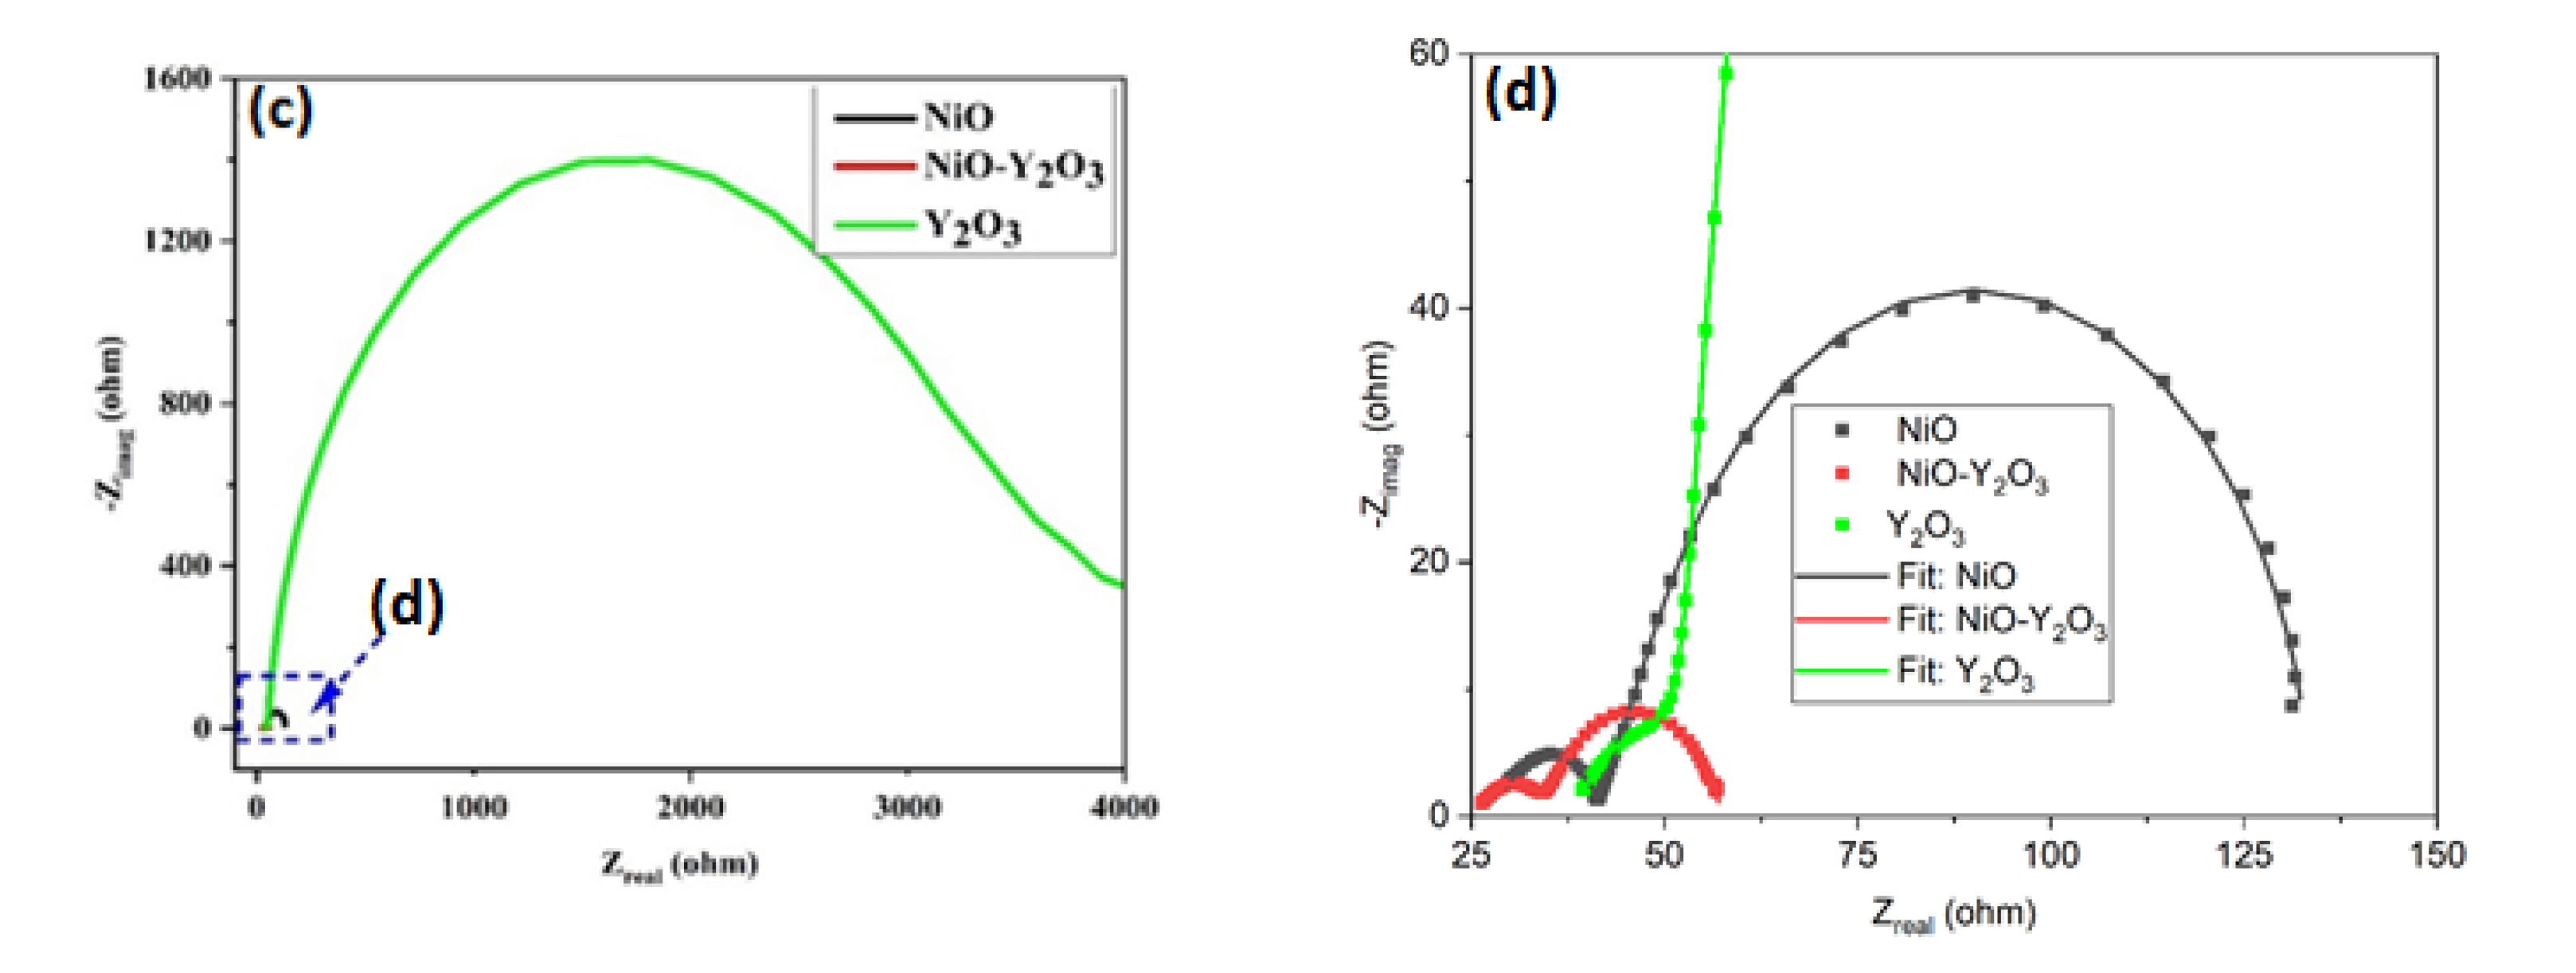
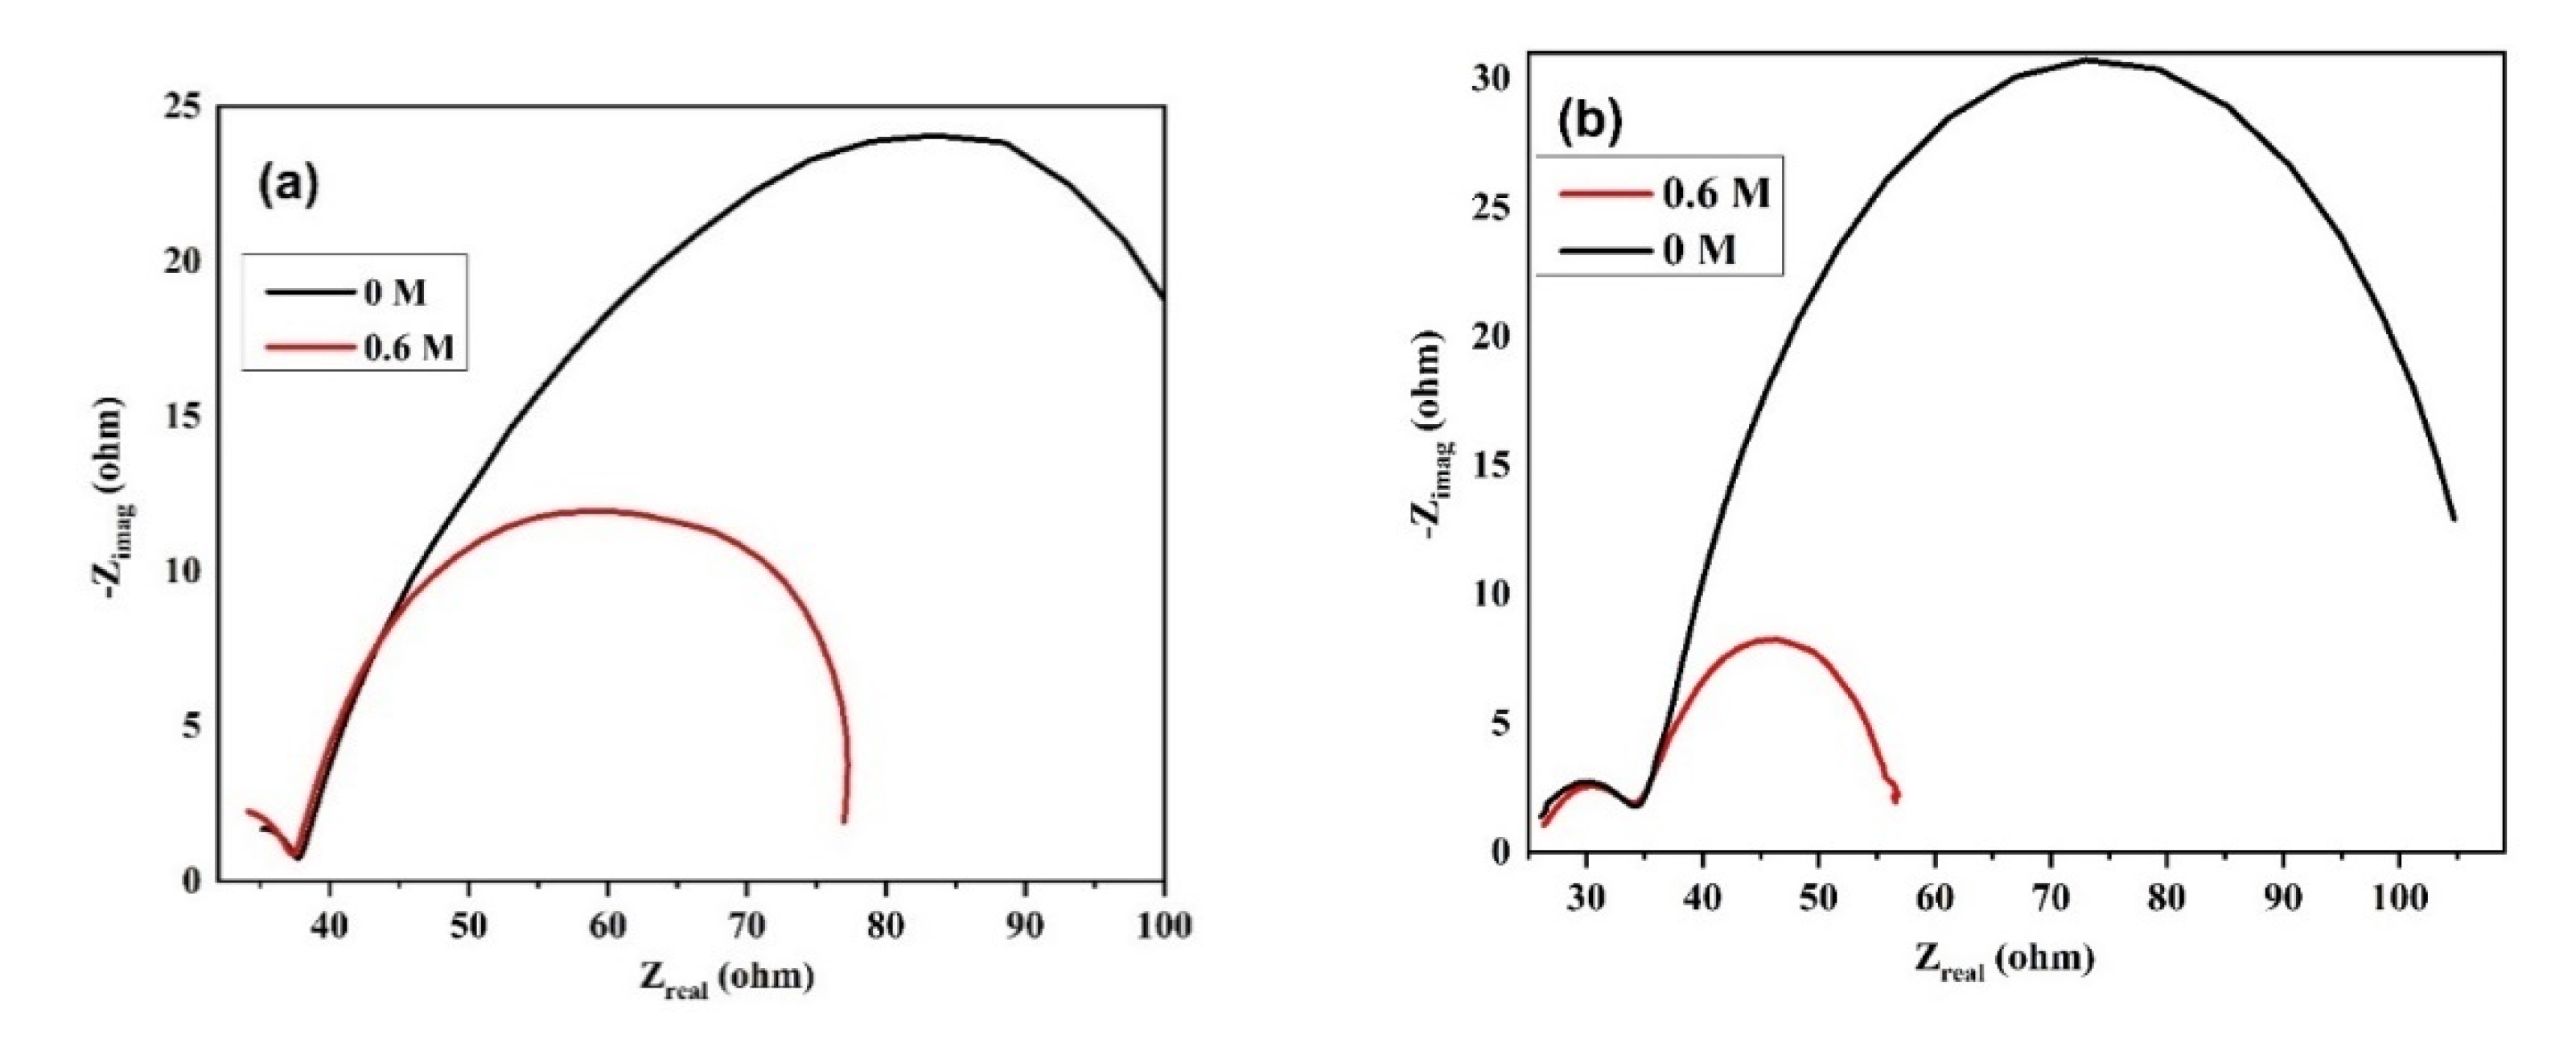
3.5.5. Electrochemical Impedance Study

Electrochemical impedance measurements were carried out, at a frequency range of 100,000 Hz to 0.1 Hz using a 1 cm2 area of film at an AC voltage of 10 mVrms, to evaluate the charge transfer dynamics on the prepared metal oxide thin films surfaces. For both the films analysis was carried out in the presence of 0.6 M methanol and 0.5 M NaOH electrolyte solution at a DC voltage of 0.6V while using Ag/AgCl as reference and Pt as the counter electrode. Figure 7a represents the Nyquist plot of NiO–ZrO2/FTO thin film in comparison to pure NiO and ZrO2. For a deep insight into the electrochemical behavior of the fabricated layers, an excellent fit with the experimental data was obtained with equivalent circuit models. The CPE model obtained for ZrO2 is given in Figure S5a. However, the model used for the rest of the films is available in Figure S5b.
As can be seen, mixed metal oxide thin films of NiO-ZrO2, exhibit the smallest semicircle with an Rct value of 34.14 Ω as compared to pure NiO and ZrO2 with Rct values of 88.42 Ω and 2779 Ω, respectively. Figure 7c represents the Nyquist plot of NiO-Y2O3/FTO thin film in comparison to pure NiO and Y2O3 thin films (CPE model fitting is available as Figure S5b). Figure 7c shows that the mixed metal oxide thin films exhibit the smallest semicircle with an Rct value of 22.8 Ω compared to pure NiO and Y2O3 with Rct values of 88.4 Ω and 3189 Ω, respectively. This decrease in charge transfer resistance of mixed metal oxide thin films is associated with an enhanced electron transfer process due to the synergistic effect and efficient oxidation of methanol [67,81].
Figure 8a represents the Nyquist plot of NiO-ZrO2/FTO thin film in the presence and absence of methanol. A semicircle with a smaller diameter and Rct value of 34.14 Ω is observed in the presence of 0.6 M methanol compared to a larger semicircle with an Rct value of 59.74 Ω recorded in the absence of methanol. Similarly, Figure 8b represents the Nyquist plot of NiO-Y2O3/FTO thin film in the presence and absence of methanol. A semicircle with a smaller diameter and Rct value of 22.8 Ω is observed in the presence of 0.6 M methanol compared to a larger semicircle with an Rct value of 66.64 Ω recorded in the absence of methanol. These results can be explained based on the fact that the presence of methanol enhances reaction kinetics and its oxidation leads to faster electron transport with the least resistance [82,83].

4. Conclusions

In summary, NiO-ZrO2/FTO and NiO-Y2O3/FTO thin films are fabricated via the facile dip-coating technique. The electro-catalysts were properly characterized by XRD, XPS, FESEM/EDX, Raman, and FTIR spectroscopy. Finally, the electrodes were tested for the oxidation of methanol. The NiO-Y2O3/FTO and NiO-ZrO2/FTO thin film showed current density values of (6.2 mA/cm2 vs. 0.65 V) and (10 mA/cm2 vs. 0.65 V) with 0.6 M methanol solution at a scan rate of 100 mV/s. The improved current of composite thin films as compared to individual components is attributed to the synergistic effect between metal oxides in the composite film. Chronoamperometric results showed the stability of NiO-ZrO2/FTO and NiO-Y2O3/FTO thin films with observed current decay of 10% and 6.8% of the initial current density values. This small loss in efficiency further suggests that ZrO2 and Y2O3 in junction with NiO reduce the possibility of CO poisoning that is commonly observed in commercially available electrodes. Electrochemical impedance studies further revealed the lower charge transfer resistance (Rct) values of metal oxide composite thin films compared to pure metal oxide thin films (NiO/FTO, ZrO2/FTO, and Y2O3/FTO), respectively. These mixed metal oxide thin films showed enhanced catalytic performance, high stability, and reusability, which make them the best alternatives for methanol oxidation reactions.

Supplementary Materials

The following supporting information can be downloaded at: https://www.mdpi.com/article/10.3390/cryst12040534/s1, Figure S1: (a) XPS survey scan of NiO-ZrO2/FTO (b) O1s for NiO-ZrO2/FTO (c) XPS survey scan of NiO-Y2O3/FTO thin film (d) O1s for NiO-Y2O3/FTO thin film, and (e–f) Zr3d and Y3d scans of pure oxide films with their respective composite thin films; Figure S2: Comparison of Raman spectra of (a) NiO- Y2O3/FTO and (b) NiO-ZrO2/FTO with pure NiO/FTO, Y2O3/FTO, and ZrO2/FTO thin films (c) FT-IR spectra of FTO, NiO/FTO, Y2O3/FTO, ZrO2/FTO, NiO-ZrO2/FTO, and NiO-Y2O3/FTO thin films; Figure S3: EDS spectra of (a) NiO/FTO (b) ZrO2/FTO (c) NiO-ZrO2/FTO (d) Y2O3/FTO and (e) NiO-Y2O3/FTO; Figure S4: Cyclic voltammetry of bare FTO in the presence and absence of methanol (a) and its comparison of methanol oxidation with NiO-ZrO2/FTO and NiO-Y2O3/FTO composite films (b); Figure S5: Equivalent circuit models obtained from an excellent fit with the experimental data of (a) ZrO2 and (b) NiO, NiO-ZrO2, Y2O3, and NiO-Y2O3 films.

Author Contributions

Conceptualization, M.A.M.; methodology, K.M. and M.A.M.; software, K.M. and A.J.; validation, M.A.M. and A.K.; formal analysis, J.I., M.A.M., A.J. and S.W.; investigation, K.M., M.A.M. and S.W.; data curation, K.M., M.I. and M.A.M.; writing—original draft preparation, K.M. and M.A.M.; writing—review and editing, M.A.M., J.I., A.K., A.J. and M.I.; supervision, M.A.M. All authors have read and agreed to the published version of the manuscript.

Funding

HEC (Pakistan), NRPU research grant #20-12197/NRPU/RGM/R&D/HEC/2020. King Khalid University through Research Center for Advanced Materials Science (RCAMS) under grant no: RCAMS/KKU/0010/21, and King Abdullah City for Atomic and Renewable Energy (K.A. CARE) under K.A. CARE, King Abdulaziz University Collaboration Program. The APC was funded by King Khalid University.

Data Availability Statement

Not applicable.

Acknowledgments

This work has been supported by HEC (Pakistan), NRPU research grant #20-12197/NRPU/RGM/R&D/HEC/2020. The author also acknowledges King Khalid University through Research Center for Advanced Materials Science (RCAMS) under grant no: RCAMS/KKU/0010/21, and the support provided by King Abdullah City for Atomic and Renewable Energy (K.A. CARE) under K.A. CARE, King Abdulaziz University Collaboration Program.

Conflicts of Interest

The authors declare no conflict of interest.

References

  1. OECD. Energy and Air Pollution: World Energy Outlook Special Report 2016; OECD: Paris, France, 2016. [Google Scholar]
  2. Lvovsky, K.; Hughes, G.; Maddison, D.; Ostro, B.; Pearce, D. Environmental Costs of Fossil Fuels: A Rapid Assessment Method with Application to Six Cities; World Bank Group: Washingtion, DC, USA, 2000. [Google Scholar]
  3. Hassan, A.; Ilyas, S.Z.; Jalil, A.; Ullah, Z. Monetization of the environmental damage caused by fossil fuels. Environ. Sci. Pollut. Res. 2021, 28, 21204–21211. [Google Scholar] [CrossRef] [PubMed]
  4. Outka, U. Environmental law and fossil fuels: Barriers to renewable energy. Vand. L. Rev. 2012, 65, 1679. [Google Scholar]
  5. Mansoor, M.A.; Munawar, K.; Lim, S.P.; Huang, N.M.; Mazhar, M.; Akhtar, M.J.; Siddique, M. Iron–manganese–titanium (1 : 1 : 2) oxide composite thin films for improved photocurrent efficiency. New J. Chem. 2017, 41, 7322–7330. [Google Scholar] [CrossRef]
  6. Ahmed, S.; Mansoor, M.A.; Basirun, W.J.; Sookhakian, M.; Huang, N.M.; Mun, L.K.; Söhnel, T.; Arifin, Z.; Mazhar, M. The synthesis and characterization of a hexanuclear copper–yttrium complex for deposition of semiconducting CuYO2–0.5Cu2O composite thin films. New J. Chem. 2015, 39, 1031–1037. [Google Scholar]
  7. Ahmed, S.; Mansoor, M.A.; Mazhar, M.; Sohnel, T.; Khaledi, H.; Basirun, W.J.; Arifin, Z.; Abubakar, S.; Muhammad, B. Semiconducting composite oxide Y2CuO4-5CuO thin films for investigation of photoelectrochemical properties. Dalton Trans. 2014, 43, 8523–8529. [Google Scholar] [CrossRef]
  8. Ebhota, W.S.; Jen, T.-C. Fossil fuels environmental challenges and the role of solar photovoltaic technology advances in fast tracking hybrid renewable energy system. Int. J. Precis. Eng. Manuf. -Green Technol. 2020, 7, 97–117. [Google Scholar] [CrossRef]
  9. Naeem, R.; Yahya, R.; Mansoor, M.A.; Teridi, M.A.M.; Sookhakian, M.; Mumtaz, A.; Mazhar, M. Photoelectrochemical water splitting over mesoporous CuPbI3 films prepared by electrophoretic technique. Mon. Chem. Chem. Mon. 2017, 148, 981–989. [Google Scholar] [CrossRef]
  10. Daraz, U.; Ansari, T.M.; Arain, S.A.; Mansoor, M.A.; Mazhar, M. Study of solvent effect on structural and photoconductive behavior of ternary chalcogenides InBiS3-In2S3-Bi2S3 composite thin films deposited via AACVD. Main Group Met. Chem. 2019, 42, 102–112. [Google Scholar] [CrossRef]
  11. Kamarudin, S.K.; Daud, W.R.W.; Ho, S.L.; Hasran, U.A. Overview on the challenges and developments of micro-direct methanol fuel cells (DMFC). J. Power Sources 2007, 163, 743–754. [Google Scholar] [CrossRef]
  12. Verma, L. Studies on methanol fuel cell. J. Power Sources 2000, 86, 464–468. [Google Scholar] [CrossRef]
  13. Joghee, P.; Malik, J.N.; Pylypenko, S.; O’Hayre, R. A review on direct methanol fuel cells–In the perspective of energy and sustainability. MRS Energy Sustain. 2015, 2, 1–31. [Google Scholar] [CrossRef] [Green Version]
  14. Wasmus, S.; Küver, A. Methanol oxidation and direct methanol fuel cells: A selective review. J. Electroanal. Chem. 1999, 461, 14–31. [Google Scholar] [CrossRef]
  15. Li, X.; Faghri, A. Review and advances of direct methanol fuel cells (DMFCs) part I: Design, fabrication, and testing with high concentration methanol solutions. J. Power Sources 2013, 226, 223–240. [Google Scholar] [CrossRef]
  16. Mehmood, A.; Scibioh, M.A.; Prabhuram, J.; An, M.-G.; Ha, H.Y. A review on durability issues and restoration techniques in long-term operations of direct methanol fuel cells. J. Power Sources 2015, 297, 224–241. [Google Scholar] [CrossRef]
  17. Yuda, A.; Ashok, A.; Kumar, A. A comprehensive and critical review on recent progress in anode catalyst for methanol oxidation reaction. Catal. Rev. 2020, 64, 126–228. [Google Scholar] [CrossRef]
  18. Ahmed, M.; Dincer, I. A review on methanol crossover in direct methanol fuel cells: Challenges and achievements. Int. J. Energy Res. 2011, 35, 1213–1228. [Google Scholar] [CrossRef]
  19. Pushkareva, I.V.; Pushkarev, A.S.; Kalinichenko, V.N.; Chumakov, R.G.; Soloviev, M.A.; Liang, Y.; Millet, P.; Grigoriev, S.A. Reduced graphene oxide-supported Pt-based catalysts for PEM fuel cells with enhanced activity and stability. Catalysts 2021, 11, 256. [Google Scholar] [CrossRef]
  20. Menshchikov, V.; Alekseenko, A.; Guterman, V.; Nechitailov, A.; Glebova, N.; Tomasov, A.; Spiridonova, O.; Belenov, S.; Zelenina, N.; Safronenko, O. Effective platinum-copper catalysts for methanol oxidation and oxygen reduction in proton-exchange membrane fuel cell. Nanomaterials 2020, 10, 742. [Google Scholar] [CrossRef] [Green Version]
  21. Shih, K.-Y.; Wei, J.-J.; Tsai, M.-C. One-Step Microwave-Assisted Synthesis of PtNiCo/rGO Electrocatalysts with High Electrochemical Performance for Direct Methanol Fuel Cells. Nanomaterials 2021, 11, 2206. [Google Scholar] [CrossRef]
  22. Kołczyk-Siedlecka, K.; Kutyła, D.; Skibińska, K.; Jędraczka, A.; Palczewska-Grela, J.; Żabiński, P. Well-Ordered 3D Printed Cu/Pd-Decorated Catalysts for the Methanol Electrooxidation in Alkaline Solutions. Technologies 2021, 9, 6. [Google Scholar] [CrossRef]
  23. Xiao, X.; Jung, E.; Yu, S.; Kim, H.; Kim, H.-K.; Lee, K.-Y.; Ahn, J.-P.; Lim, T.; Kim, J.; Yu, T. Facile aqueous–phase synthesis of pd–fept core–shell nanoparticles for methanol oxidation reaction. Catalysts 2021, 11, 130. [Google Scholar] [CrossRef]
  24. Karim, N.; Kamarudin, S. An overview on non-platinum cathode catalysts for direct methanol fuel cell. Appl. Energy 2013, 103, 212–220. [Google Scholar] [CrossRef]
  25. Park, G.-S.; Pak, C.; Chung, Y.-S.; Kim, J.-R.; Jeon, W.S.; Lee, Y.-H.; Kim, K.; Chang, H.; Seung, D. Decomposition of Pt–Ru anode catalysts in direct methanol fuel cells. J. Power Sources 2008, 176, 484–489. [Google Scholar] [CrossRef]
  26. Kakati, N.; Maiti, J.; Lee, S.H.; Jee, S.H.; Viswanathan, B.; Yoon, Y.S. Anode catalysts for direct methanol fuel cells in acidic media: Do we have any alternative for Pt or Pt–Ru? Chem. Rev. 2014, 114, 12397–12429. [Google Scholar] [CrossRef] [PubMed]
  27. Deshpande, K.; Mukasyan, A.; Varma, A. High throughput evaluation of perovskite-based anode catalysts for direct methanol fuel cells. J. Power Sources 2006, 158, 60–68. [Google Scholar] [CrossRef]
  28. Xu, C.; Tian, Z.; Shen, P.J.E.A. Oxide (CeO2, NiO, Co3O4 and Mn3O4)-promoted Pd/C electrocatalysts for alcohol electrooxidation in alkaline media. Electrochim. Acta 2008, 53, 2610–2618. [Google Scholar] [CrossRef]
  29. Roy, A.; Jadhav, H.S.; Cho, M.; Seo, J.G.; Chemistry, E. Electrochemical deposition of self-supported bifunctional copper oxide electrocatalyst for methanol oxidation and oxygen evolution reaction. J. Ind. Eng. Chem. 2019, 76, 515–523. [Google Scholar] [CrossRef]
  30. Pawar, S.; Pawar, B.; Inamdar, A.; Kim, J.; Jo, Y.; Cho, S.; Mali, S.; Hong, C.; Kwak, J.; Kim, H. In-situ synthesis of Cu (OH)2 and CuO nanowire electrocatalysts for methanol electro-oxidation. Mater. Lett. 2017, 187, 60–63. [Google Scholar] [CrossRef]
  31. Hassan, H.; Hamid, Z.A. Electrodeposited Ni–Cr2O3 nanocomposite anodes for ethanol electrooxidation. Int. J. Hydrog. Energy 2011, 36, 5117–5127. [Google Scholar] [CrossRef]
  32. Noor, T.; Pervaiz, S.; Iqbal, N.; Nasir, H.; Zaman, N.; Sharif, M.; Pervaiz, E. Nanocomposites of NiO/CuO based MOF with rGO: An efficient and robust electrocatalyst for methanol oxidation reaction in DMFC. Nanomaterials 2020, 10, 1601. [Google Scholar] [CrossRef]
  33. Liaqat, R.; Mansoor, M.A.; Iqbal, J.; Jilani, A.; Shakir, S.; Kalam, A.; Wageh, S. Fabrication of Metal (Cu and Cr) Incorporated Nickel Oxide Films for Electrochemical Oxidation of Methanol. Crystals 2021, 11, 1398. [Google Scholar] [CrossRef]
  34. Kogler, M.; Köck, E.-M.; Bielz, T.; Pfaller, K.; Klötzer, B.; Schmidmair, D.; Perfler, L.; Penner, S. Hydrogen Surface Reactions and Adsorption Studied on Y2O3, YSZ, and ZrO2. J. Phys. Chem. C Nanomater. Interfaces 2014, 118, 8435–8444. [Google Scholar] [CrossRef] [PubMed]
  35. Wang, Q.; Liu, Z.; An, S.; Wang, R.; Wang, Y.; Xu, T. Effect of CeO2-ZrO2 on Pt/C electrocatalysts for alcohols oxidation. J. Rare Earths 2016, 34, 276–282. [Google Scholar] [CrossRef]
  36. Hwang, A.; Bhan, A. Bifunctional Strategy Coupling Y2O3-Catalyzed Alkanal Decomposition with Methanol-to-Olefins Catalysis for Enhanced Lifetime. ACS Catal. 2017, 7, 4417–4422. [Google Scholar] [CrossRef]
  37. Jlassi, M.; Sta, I.; Hajji, M.; Ezzaouia, H.J.M.S. Optical and electrical properties of nickel oxide thin films synthesized by sol–gel spin coating. Mater. Sci. Semicond. Processing 2014, 21, 7–13. [Google Scholar] [CrossRef]
  38. Sun, S.; Xu, Z.J.J.E.A. Composition dependence of methanol oxidation activity in nickel–cobalt hydroxides and oxides: An optimization toward highly active electrodes. Electrochim. Acta 2015, 165, 56–66. [Google Scholar] [CrossRef]
  39. An, W.-J.; Thimsen, E.; Biswas, P. Aerosol-chemical vapor deposition method for synthesis of nanostructured metal oxide thin films with controlled morphology. J. Phys. Chem. Lett. 2010, 1, 249–253. [Google Scholar] [CrossRef]
  40. Munawar, K.; Mansoor, M.A.; Olmstead, M.M.; Yusof, F.B.; Misran, M.B.; Basirun, W.J.; Mazhar, M. Pyrochlore-structured Y2Ti2O7–2TiO2 composite thin films for photovoltaic applications. J. Aust. Ceram. Soc. 2019, 55, 921–932. [Google Scholar] [CrossRef]
  41. Amri, A.; Hasan, K.; Taha, H.; Rahman, M.M.; Herman, S.; Awaltanova, E.; Kabir, H.; Yin, C.-Y.; Ibrahim, K.; Bahri, S.J.C.I. Surface structural features and optical analysis of nanostructured Cu-oxide thin film coatings coated via the sol-gel dip coating method. Ceram. Int. 2019, 45, 12888–12894. [Google Scholar] [CrossRef]
  42. He, Z.-P.; Ji, Z.-G. Engineering. Effect of annealing temperature on the properties of nickel oxide thin films prepared by sol-gel dip coating. J. Mater. Sci. Eng. 2005, 2, 163–166. [Google Scholar]
  43. Alvarenga, G.M.; Villullas, H.M. Transition metal oxides in the electrocatalytic oxidation of methanol and ethanol on noble metal nanoparticles. Curr. Opin. Electrochem. 2017, 4, 39–44. [Google Scholar] [CrossRef]
  44. Chen, C.-S.; Pan, F.-M.; Yu, H.-J. Electrocatalytic activity of Pt nanoparticles on a karst-like Ni thin film toward methanol oxidation in alkaline solutions. Appl. Catal. B Environ. 2011, 104, 382–389. [Google Scholar] [CrossRef]
  45. Wang, Y.; Hu, J.; Zhai, C.; Gao, H.; Liu, Z.-Q.; Du, Y.; Zhu, M. CdS Quantum Dots Sensitized 2D La2Ti2O7 Nanosheets as Support for Visible Light-Assisted Electrocatalytic Methanol Oxidation in Alkaline Medium. Energy Technol. 2019, 7, 1800539. [Google Scholar] [CrossRef]
  46. Yusoff, N.; Kumar, S.V.; Rameshkumar, P.; Pandikumar, A.; Shahid, M.M.; Ab Rahman, M.; Huang, N.M. A facile preparation of titanium dioxide-iron oxide@ silicon dioxide incorporated reduced graphene oxide nanohybrid for electrooxidation of methanol in alkaline medium. Electrochim. Acta 2016, 192, 167–176. [Google Scholar] [CrossRef]
  47. Scott, K.; Yu, E.; Vlachogiannopoulos, G.; Shivare, M.; Duteanu, N. Performance of a direct methanol alkaline membrane fuel cell. J. Power Sources 2008, 175, 452–457. [Google Scholar] [CrossRef]
  48. Hosseini, M.G.; Abdolmaleki, M.; Ashrafpoor, S. Methanol electro-oxidation on a porous nanostructured Ni/Pd-Ni electrode in alkaline media. Chin. J. Catal. 2013, 34, 1712–1719. [Google Scholar] [CrossRef]
  49. Ogumi, Z.; Matsuoka, K.; Chiba, S.; Matsuoka, M.; Iriyama, Y.; Abe, T.; Inaba, M. Preliminary Study on Direct Alcohol Fuel Cells Employing Anion Exchange Membrane. Electrochemistry 2002, 70, 980–983. [Google Scholar] [CrossRef] [Green Version]
  50. Serov, A.; Kwak, C. Review of non-platinum anode catalysts for DMFC and PEMFC application. Appl. Catal. B Environ. 2009, 90, 313–320. [Google Scholar] [CrossRef]
  51. Yu, E.H.; Krewer, U.; Scott, K. Principles and materials aspects of direct alkaline alcohol fuel cells. Energies 2010, 3, 1499–1528. [Google Scholar] [CrossRef]
  52. Jayashree, R.S.; Egas, D.; Spendelow, J.S.; Natarajan, D.; Markoski, L.J.; Kenis, P.J. Air-breathing laminar flow-based direct methanol fuel cell with alkaline electrolyte. Electrochem. Solid State Lett. 2006, 9, A252. [Google Scholar] [CrossRef]
  53. Xu, M.; Lei, S.; Jin, C. Titanium dioxide as support material for Pt1Pd3 toward methanol oxidation. Int. J. Hydrog. Energy 2021, 46, 5390–5397. [Google Scholar] [CrossRef]
  54. Hu, Y.; Wu, P.; Yin, Y.; Zhang, H.; Cai, C. Effects of structure, composition, and carbon support properties on the electrocatalytic activity of Pt-Ni-graphene nanocatalysts for the methanol oxidation. Appl. Catal. B Environ. 2012, 111, 208–217. [Google Scholar] [CrossRef]
  55. Tang, J.; Liu, J.; Torad, N.L.; Kimura, T.; Yamauchi, Y. Tailored design of functional nanoporous carbon materials toward fuel cell applications. Nano Today 2014, 9, 305–323. [Google Scholar] [CrossRef]
  56. Choi, Y.; Lee, H.; Kumbhar, V.S.; Choi, Y.-W.; Kim, J.; Lee, K. Enhancement of photoelectrochemical properties with α–Fe2O3 on surface modified FTO substrates. Ceram. Int. 2020, 46, 20012–20019. [Google Scholar] [CrossRef]
  57. Ji, Y.; Cho, Y.I.; Jeon, Y.; Lee, C.; Park, D.-H.; Shul, Y.-G. Design of active Pt on TiO2 based nanofibrous cathode for superior PEMFC performance and durability at high temperature. Appl. Catal. B Environ. 2017, 204, 421–429. [Google Scholar] [CrossRef]
  58. Chhina, H. Oxidation resistant catalyst support for proton exchange membrane fuel cells; University of Toronto: Toronto, ON, Canada, 2009. [Google Scholar]
  59. Kim, J.M.; Lee, Y.J.; Kim, S.-H.; Chae, K.-H.; Yoon, K.R.; Lee, K.A.; Byeon, A.; Kang, Y.S.; Park, H.-Y.; Cho, M.K.; et al. High-performance corrosion-resistant fluorine-doped tin oxide as an alternative to carbon support in electrodes for PEM fuel cells. Nano Energy 2019, 65, 104008. [Google Scholar] [CrossRef]
  60. Ghalmi, Y.; Habelhames, F.; Sayah, A.; Bahloul, A.; Nessark, B.; Shalabi, M.; Nunzi, J.M. Capacitance performance of NiO thin films synthesized by direct and pulse potentiostatic methods. Ionics 2019, 25, 6025–6033. [Google Scholar] [CrossRef]
  61. Grier, D.; McCarthy, G. ICDD Grant-in-Aid; North Dakota State University: Fargo, ND, USA, 1991. [Google Scholar]
  62. Yang, H.; Li, C.; Tang, A. Synthesis and Characterization of Fluorine-Doped Tin Dioxide Nanocomposites. In Proceedings of the 8th Pacific Rim International Congress on Advanced Materials and Processing, Waikoloa, HI, USA, 4–9 August 2013; Springer: Cham, Switzerland, 2013; pp. 1507–1514. [Google Scholar]
  63. Lackner, P.; Zou, Z.; Mayr, S.; Diebold, U.; Schmid, M. Using photoelectron spectroscopy to observe oxygen spillover to zirconia. PCCP 2019, 21, 17613–17620. [Google Scholar] [CrossRef] [Green Version]
  64. Sakamoto, K.; Hayashi, F.; Sato, K.; Hirano, M.; Ohtsu, N. XPS spectral analysis for a multiple oxide comprising NiO, TiO2, and NiTiO3. Appl. Surf. Sci. 2020, 526, 146729. [Google Scholar] [CrossRef]
  65. Barreca, D.; Battiston, G.A.; Gerbasi, R.; Tondello, E.; Zanella, P. Zirconium dioxide thin films characterized by XPS. Surf. Sci. Spectra 2000, 7, 303–309. [Google Scholar] [CrossRef]
  66. Cole, K.M.; Kirk, D.W.; Thorpe, S.J. Surface Y2O3 layer formed on air exposed Y powder characterized by XPS. Surf. Sci. Spectra 2020, 27, 024010. [Google Scholar] [CrossRef]
  67. Danaee, I.; Jafarian, M.; Forouzandeh, F.; Gobal, F.; Mahjani, M. Electrocatalytic oxidation of methanol on Ni and NiCu alloy modified glassy carbon electrode. Int. J. Hydrog. Energy 2008, 33, 4367–4376. [Google Scholar] [CrossRef]
  68. Estudillo-Wong, L.A.; Vargas-Gómez, A.; Arce-Estrada, E.M.; Manzo-Robledo, A. TiO2/C composite as a support for Pd-nanoparticles toward the electrocatalytic oxidation of methanol in alkaline media. Electrochim. Acta 2013, 112, 164–170. [Google Scholar] [CrossRef]
  69. Xu, J.; Wang, P.; Yu, R.; Zheng, Z.; Shah, S.S.A.; Chen, C. A New Insight into the Effect of Scan Rate and Mass Transport from Pt Rotating Disk Electrode on the Electrochemical Oxidation Process of Methanol. Mater. Lett. 2019, 260, 126950. [Google Scholar] [CrossRef]
  70. Mansoor, M.A.; Ebadi, M.; Mazhar, M.; Huang, N.M.; Mun, L.K.; Misran, M.; Basirun, W.J. Cadmium-manganese oxide composite thin films: Synthesis, characterization and photoelectrochemical properties. Mater. Chem. Phys. 2017, 186, 286–294. [Google Scholar] [CrossRef]
  71. Jayaraman, S.; Jaramillo, T.F.; Baeck, S.-H.; McFarland, E.W. Synthesis and characterization of Pt− WO3 as methanol oxidation catalysts for fuel cells. J. Phys. Chem. B 2005, 109, 22958–22966. [Google Scholar] [CrossRef]
  72. Amin, R.; Hameed, R.A.; El-Khatib, K.; Youssef, M.E. Electrocatalytic activity of nanostructured Ni and Pd–Ni on Vulcan XC-72R carbon black for methanol oxidation in alkaline medium. Int. J. Hydrog. Energy 2014, 39, 2026–2041. [Google Scholar] [CrossRef]
  73. Zhang, L.; Xia, D. Electrocatalytic activity of ordered intermetallic PtSb for methanol electro-oxidation. Appl. Surf. Sci. 2006, 252, 2191–2195. [Google Scholar] [CrossRef]
  74. Baronia, R.; Goel, J.; Kaswan, J.; Shukla, A.; Singhal, S.K.; Singh, S.P. PtCo/rGO nano-anode catalyst: Enhanced power density with reduced methanol crossover in direct methanol fuel cell. Mater. Renew. Sustain. Energy 2018, 7, 27. [Google Scholar] [CrossRef] [Green Version]
  75. Tammam, R.; Fekry, A.; Saleh, M. Electrocatalytic oxidation of methanol on ordered binary catalyst of manganese and nickel oxide nanoparticles. Int. J. Hydrog. Energy 2014, 40, 275–283. [Google Scholar] [CrossRef]
  76. Araujo, R.B.; Martín-Yerga, D.; dos Santos, E.C.; Cornell, A.; Pettersson, L.G. Elucidating the role of Ni to enhance the methanol oxidation reaction on Pd electrocatalysts. Electrochim. Acta 2020, 360, 136954. [Google Scholar] [CrossRef]
  77. Ehsan, M.A.; Hakeem, A.S.; Khaledi, H.; Mazhar, M.; Shahid, M.M.; Pandikumar, A.; Huang, N.M. Fabrication of CuO–1.5ZrO2 composite thin film, from heteronuclear molecular complex and its electrocatalytic activity towards methanol oxidation. RSC Adv. 2015, 5, 103852–103862. [Google Scholar] [CrossRef]
  78. Özdokur, K.V.; Çırak, B.B.; Caglar, B.; Çırak, Ç.; Karadeniz, S.M.; Kılınç, T.; Erdoğan, Y.; Ekinci, A.E. Fabrication of TiO2/ZnO/Pt nanocomposite electrode with enhanced electrocatalytic activity for methanol oxidation. Vacuum 2018, 155, 242–248. [Google Scholar] [CrossRef]
  79. Zhai, C.; Sun, M.; Zhu, M.; Zhang, K.; Du, Y. Insights into photo-activated electrode for boosting electrocatalytic methanol oxidation based on ultrathin MoS2 nanosheets enwrapped CdS nanowires. Int. J. Hydrog. Energy 2017, 42, 5006–5015. [Google Scholar] [CrossRef]
  80. Wang, T.; Tang, J.; Wu, S.; Fan, X.; He, J. Preparation of ordered mesoporous WO3–TiO2 films and their performance as functional Pt supports for synergistic photo-electrocatalytic methanol oxidation. J. Power Sources 2014, 248, 510–516. [Google Scholar] [CrossRef]
  81. Chakraborty, D.; Chorkendorff, I.; Johannessen, T. Electrochemical impedance spectroscopy study of methanol oxidation on nanoparticulate PtRu direct methanol fuel cell anodes: Kinetics and performance evaluation. J. Power Sources 2006, 162, 1010–1022. [Google Scholar] [CrossRef]
  82. Jafarian, M.; Moghaddam, R.; Mahjani, M.; Gobal, F. Electro-catalytic oxidation of methanol on a Ni–Cu alloy in alkaline medium. J. Appl. Electrochem. 2006, 36, 913–918. [Google Scholar] [CrossRef]
  83. Hsing, I.-M.; Wang, X.; Leng, Y.-J. Electrochemical impedance studies of methanol electro-oxidation on Pt/C thin film electrode. J. Electrochem. Soc. 2002, 149, A615. [Google Scholar] [CrossRef]
Figure 1. (a) XRD pattern of a) NiO/FTO, Y2O3/FTO and NiO-Y2O3/FTO thin film and (b) NiO/FTO, ZrO2/FTO, and NiO-ZrO2/FTO thin film, (c,d) are narrow scans for Zr 3d and Ni 2p for NiO–ZrO2/FTO thin film and (e,f) are narrow scan for Y 3d and Ni 2p for NiO- Y2O3/FTO thin film.
Crystals 12 00534 g001
Figure 2. FESEM images of (a) NiO/FTO (b) ZrO2/FTO and (c) NiO-ZrO2/FTO (d) Y2O3/FTO (e) NiO- Y2O3/FTO.
Crystals 12 00534 g002aCrystals 12 00534 g002b
Figure 3. (a) Cyclic voltammogram of (a) NiO-Y2O3/FTO (b) NiO-ZrO2/FTO thin films in 0.5 M NaOH solution in absence and presence of 0.6 M methanol. Comparison of cyclic voltammogram of (c) NiO/FTO and Y2O3/FTO with NiO–Y2O3/FTO and (d) NiO/FTO and ZrO2/FTO with NiO-ZrO2/FTO thin films using 0.6 methanol, respectively. (e) Comparison of cyclic voltammogram of NiO-Y2O3/FTO and NiO-ZrO2/FTO thin film using 0.6 M at 100 mV/s.
Crystals 12 00534 g003
Figure 4. Cyclic voltammogram of (a) NiO-Y2O3/FTO and (b) NiO-ZrO2/FTO thin films in 0.5 M NaOH solution using 0, 0.2, 0.4, 0.6, 0.8 and 1 M methanol solution at scan rate of 100 mV/s. (c) cyclic voltammogram of NiO-Y2O3/FTO and (d) NiO-ZrO2/FTO thin films using 0.6 M methanol solution at scan rates of 25, 50, 100, and 150 mV/s.
Crystals 12 00534 g004
Figure 5. Cyclic voltammogram of (a) NiO-Y2O3/FTO (b) NiO-ZrO2/FTO thin films deposited from precursor solutions with different Ni: Y and Ni: Zr concentrations.
Crystals 12 00534 g005
Figure 6. Current-time plot of (a) NiO-ZrO2/FTO and (b) NiO-Y2O3/FTO thin film in 0.5 M NaOH electrolyte solution at the addition of 0.2 M methanol solution after every 90 s at an applied potential of 0.6 V. (c) Current-time plot of NiO-ZrO2/FTO and NiO-Y2O3/FTO thin film in 0.5 M NaOH and 0.6 M methanol solution at an applied potential of 0.6V.
Crystals 12 00534 g006
Figure 7. Nyquist plot of (a) NiO, ZrO2, and NiO-ZrO2/FTO (c) NiO, Y2O3, and NiO-Y2O3/FTO thin film in 0.5 M NaOH/0.6 M MeOH at 0.6 V. (b,d) shows zoomed panel of semicircles with circuit fitting in range of 0–150 Ω.
Crystals 12 00534 g007aCrystals 12 00534 g007b
Figure 8. Nyquist plot of (a) NiO-ZrO2/FTO and (b) NiO-Y2O3/FTO thin film in the absence and presence of 0.6 M methanol.
Crystals 12 00534 g008
Table 1. Thin films fabricated with different ratios of precursors.
NiO–ZrO2/FTONi:ZrNiO–Y2O3/FTONi:Y
0.09:0.010.09:0.01
0.07:0.030.01:0.09
0.03:0.070.07:0.03
0.1:0.10.03:0.07
0.1:0.1
Table 2. Current densities of NiO-Y2O3/FTO thin film for different concentrations of methanol at specified potentials.
Methanol ConcentrationCurrent Density at 0.65 (mA/cm2)Onset Potential (V)
0.2 M3.50.33
0.4 M4.80.33
0.6 M6.20.33
0.8 M7.00.33
1 M7.30.33
Table 3. Current densities of NiO-ZrO2/FTO for different concentrations of methanol at specified onset potentials.
Methanol ConcentrationCurrent Density at 0.65 (mA/cm2)Onset Potential (V)
0.2 M5.50.35
0.4 M8.10.35
0.6 M9.90.33
0.8 M10.40.33
1 M10.80.33
Table 4. Current density values of different Ni: Y concentration thin films at the specified potential.
N:YCurrent Density at 0.65V (mA/cm2)Onset Potential (V)
0.09:0.014.90.39
0.07:0.034.00.37
0.03:0.075.60.39
0.01:0.094.40.41
0.1:0.16.20.31
Table 5. Current density values of different Ni: Zr concentration thin films at the specified potential.
Ni:ZrCurrent Density at 0.65 (mA/cm2)Onset Potential (V)
0.09:0.019.80.33
0.07:0.034.80.39
0.03:0.071.50.56
0.1:0.110.10.31
Table 6. Comparison of performance of prepared thin films with literature.
Catalyst UsedFabrication MethodCurrent DensityRef.
GC/MnOx/NiOx compositeElectrodeposition550 µA·cm−2[75]
Pd3Ni and
Pd-Ni
NaBH4 reduction method1.31 mA·cm−2
1.88 mA·cm−2
[76]
CuO–1.5ZrO2 composite thin filmsAerosol-assisted chemical vapor
deposition (AACVD)
14 μA·cm−2[77]
FTO/TiO2/ZnO/PtDC Sputtering and electrodeposition0.0058 A·cm−2[78]
Pt-CdS
Pt-CdS/MoS2
Solvothermal method0.81 mA·cm−2
1.13 mA·cm−2
[79]
[79]
Pt-WO3-TiO2Pulse
Electrodeposition
2.2 mm−2[80]
rGO/TiO2-Fe2O3@SiO2 nanohybridHydrothermal2.45 mA·cm−2[46]
PtCo(1:9)/rGO
co-impregnation
reduction
48 mA·cm−2[74]
Pt/CCommercially
available
9 mA·cm−2[74]
PtRu/CCommercially available (low stability)52 mA·cm−2[74]
NiO-ZrO2/FTO
NiO-Y2O3/FTO
Dip coating10 mA·cm−2
6.2 mA·cm−2
Present work
Publisher’s Note: MDPI stays neutral with regard to jurisdictional claims in published maps and institutional affiliations.

