Article

Comparative Degradation Studies of Carmine Dye by Photocatalysis and Photoelectrochemical Oxidation Processes in the Presence of Graphene/N-Doped ZnO Nanostructures

1
Nanoscience Laboratory for Environmental and Biomedical Applications (NLEBA), Metallurgical Lab. 1, Nuclear Lab., Department of Physics, Faculty of Education, Ain Shams University, Roxy, Cairo 11757, Egypt
2
Department of Chemistry, Faculty of Education, Ain Shams University, Roxy, Cairo 11757, Egypt
3
Laboratory of Nano-Smart Materials for Science and Technology (LNSMST), Department of Physics, Faculty of Science, King Khalid University, P.O. Box 9004, Abha 61413, Saudi Arabia
4
Research Center for Advanced Materials Science (RCAMS), King Khalid University, P.O. Box 9004, Abha 61413, Saudi Arabia
5
Semiconductor Laboratory, Department of Physics, Faculty of Education, Ain Shams University, Roxy, Cairo 11757, Egypt
6
Materials Science and Nanotechnology Department, Faculty of Postgraduate Studies for Advanced Sciences, Beni-Suef University, Beni-Suef 62511, Egypt
7
Physics Department, Faculty of Science, Zagazig University, Zagazig 44519, Egypt
8
Department of Chemistry, Faculty of Science, King Khalid University, P.O. Box 9004, Abha 61413, Saudi Arabia
9
Nanotechnology Research Centre (NTRC), The British University in Egypt (B.U.E.), Suez Desert Road, El-Sherouk City 11837, Egypt
10
Molecular Spectroscopy and Modeling Unit, Spectroscopy Department, National Research Centre, 33 El-Bohouth St., Dokki, Giza 12622, Egypt
*
Author to whom correspondence should be addressed.
Crystals 2022, 12(4), 535; https://doi.org/10.3390/cryst12040535
Submission received: 20 February 2022 / Revised: 4 April 2022 / Accepted: 5 April 2022 / Published: 11 April 2022

Abstract

:
The goal of this study was to synthesize a UV-light-active ZnO photocatalyst by modifying it with nitrogen and graphene, then applying it to the degradation of carmine dye utilizing two promising technologies: photocatalysis and electrochemical oxidation (E.O.). Different techniques were used to analyze the prepared photocatalysts, such as Fourier transform infrared (FTIR), scanning electron microscopy (SEM), and X-ray diffraction (XRD). According to XRD measurements, the produced nanocomposite possesses a hexagonal wurtzite structure, indicating ZnO and markedly crystalline. For photocatalytic applications, the results revealed that the 0.001 g of G/N-doped ZnO catalyst achieved 66.76% degradation of carmine and kinetic degradation rates of 0.007 min−1 within 185 min by photocatalysis under UV light irradiation. In comparison, the same sample reached 100% degradation of carmine and kinetic degradation rates of 0.202 min−1 within 15 min using the electrochemical oxidation method. The improved photocatalytic activity of as-produced nanocomposites can be attributed to intermediate levels in the prohibited bandgap energy and the enhanced oxygen vacancies caused by nitrogen doping. The electrolyte (NaCl) on the degradation of the carmine dye was tested, and the findings indicated that the dye molecules were photodegraded by the 0.001 g of G/N-doped ZnO nanocomposite after a 15 min time interval. The data presented in this work for the carmine breakdown in water give intriguing contrasts between photocatalytic, indirect electrochemical oxidation, and photoelectrochemical oxidation. The action of chlorinated oxidative species, predominantly HClO, which were electrogenerated at the electrode surface due to the chloride ion’s oxidation in solution, induced indirect electrochemical oxidation degradation. This study also revealed that the modifications made to ZnO were beneficial by improving its photocatalytic activities under UV light, as well as a comparison of photocatalysis and electrochemical oxidation processes to determine which technique is best for treating carmine in effluents with high chloride ions.

1. Introduction

Wastewater from the textile industry often contains considerable volumes of non-biodegradable dyes [1]. Removing these dyes from industrial effluents is a severe environmental apprehension because most of these dyes are poisonous and carcinogenic [2]. Used in textile manufacturing, carmine is a popular dye. It is a blend of aluminum and the natural dye cochineal (carminic acid). As a red pigment, it’s one of the more fascinating and less expensive dyes on the market [3]. One of the Coccidia plants is used to produce carmine dye (E120). Carminic acid (7-α-D-glucopyra–nosyl–9,10-dihydro–3,5,6,8-tetrahydroxy–1-methyl–9,10-dioxo anthracene-carboxylic acid) is a hydroxyl anthraquinone compound with an aside-chain of a glucose sugar unit attached (Scheme 1). Carmine is a reddish dye used in textiles, food, and medicine as an antiviral and anticancer agent. To eliminate dyes from wastewater, various technologies have been used. Physical treatments are one of these approaches, but they are expensive since they move contaminants from a liquid to a solid phase, necessitating additional treatment. Other methods, such as incineration, are costly and, in most cases, result in the emission of pollutants and greenhouse gases into the atmosphere [4]. As a result, more cost-efficient and practical solutions to replace traditional water treatment processes are urgently needed. The development of photocatalytic oxidation [5,6] and electrochemical oxidation [7,8] technologies, which are considered to be more effective in the adaptation of organic pollutants to carbon dioxide and water [9], has resulted from efforts to solve the difficulties mentioned above.
These methods, on the other hand, come with some inherent limits. The photocatalytic oxidation approach, for example, is plagued by the rapid recombination of the photogenerated electrons and holes, which are responsible for the pollutant degradation process’s initiation [10]. Furthermore, because most of the photocatalysts utilized in this process have a large bandgap, the photocatalytic degradation of the pollutants occurs under ultraviolet (UV) light rather than the more abundant visible light [11,12]. As for the electrochemical oxidation method, the degradation of dye molecules requires the application of high current densities [13].
Due to applications in electrochemically assisted photocatalytic systems, semiconductor oxide has received attention as a catalyst in Advanced Oxidation Process (A.O.P.) technology [14,15]. Among several semiconductors investigated as catalysts in the literature, zinc oxide gained interest owing to its higher load carrier mobility, low toxicity, and thermal stability in various environments other than semiconductors such as titanium dioxide [16,17]. ZnO is an n-type semiconductor with gap energy between 3.2 and 3.4 eV [18,19] and is commonly defined as cubic or hexagonal in structure (wurtzite). The doping of ZnO with nitrogen, which has been examined since the radii of the N and O atoms are identical, is one of the probable methods to reduce electron and hole recombination rates [20] in general. Introducing nitrogen into the structure of ZnO results in the highest valence band elevation due to the formation of levels related to the hybridization of the 2p N orbital with the 2p O orbital, resulting in increased electron transport efficiency, the more significant response of spectrum, and enhanced photocatalytic activities. Moreover, nitrogen-doping provides ZnO’s more excellent chemical stability and decreases the recombination process [21].
If C- and N- are added to the ZnO structure, they can replace oxygen atoms because they are close together. This changes the Fermi level in energy gab, improving electronic characteristics and photocatalytic results, according to Yu et al. [22]. Gionco et al. [23] observed that nitrogen-doping ZnO enhanced photocatalytic performance for solutions containing phenol and 2,4-dichlorophenol due to changes in sample absorption at different N concentrations and the presence of localized states between the restricted band energy.
Graphene, a hexagonal lattice carbon material, has gained considerable interest in the industry and fundamental research [24]. Graphene is a zero Eg semiconductor with a high specific surface area, good interfacial contact with adsorbents, and increased mobility for electric electron-hole pairs [25]. As a result, the inclusion of graphene could significantly increase the specific surface area of N-doped ZnO nanoparticles, improving the photodegradation effectiveness of N-doped ZnO catalysts [26].
This study synthesized N-doped ZnO nanoparticles by adding glycine as a nitrogen agent. Additionally, graphene was added with different proportions to N-doped ZnO sample (0.001, 0.01, 0.1, 0.25, 0.5, 1 g). Using new G/N-doped ZnO nanocomposites as photocatalysts and electro and photoelectrochemical oxidation, the photocatalytic degradation of carmine, a water-based synthetic dye, was examined from 0 to 185 min. The comparison between the two methods was made to detect the most efficient method for dye degradation.

2. Experimental Details

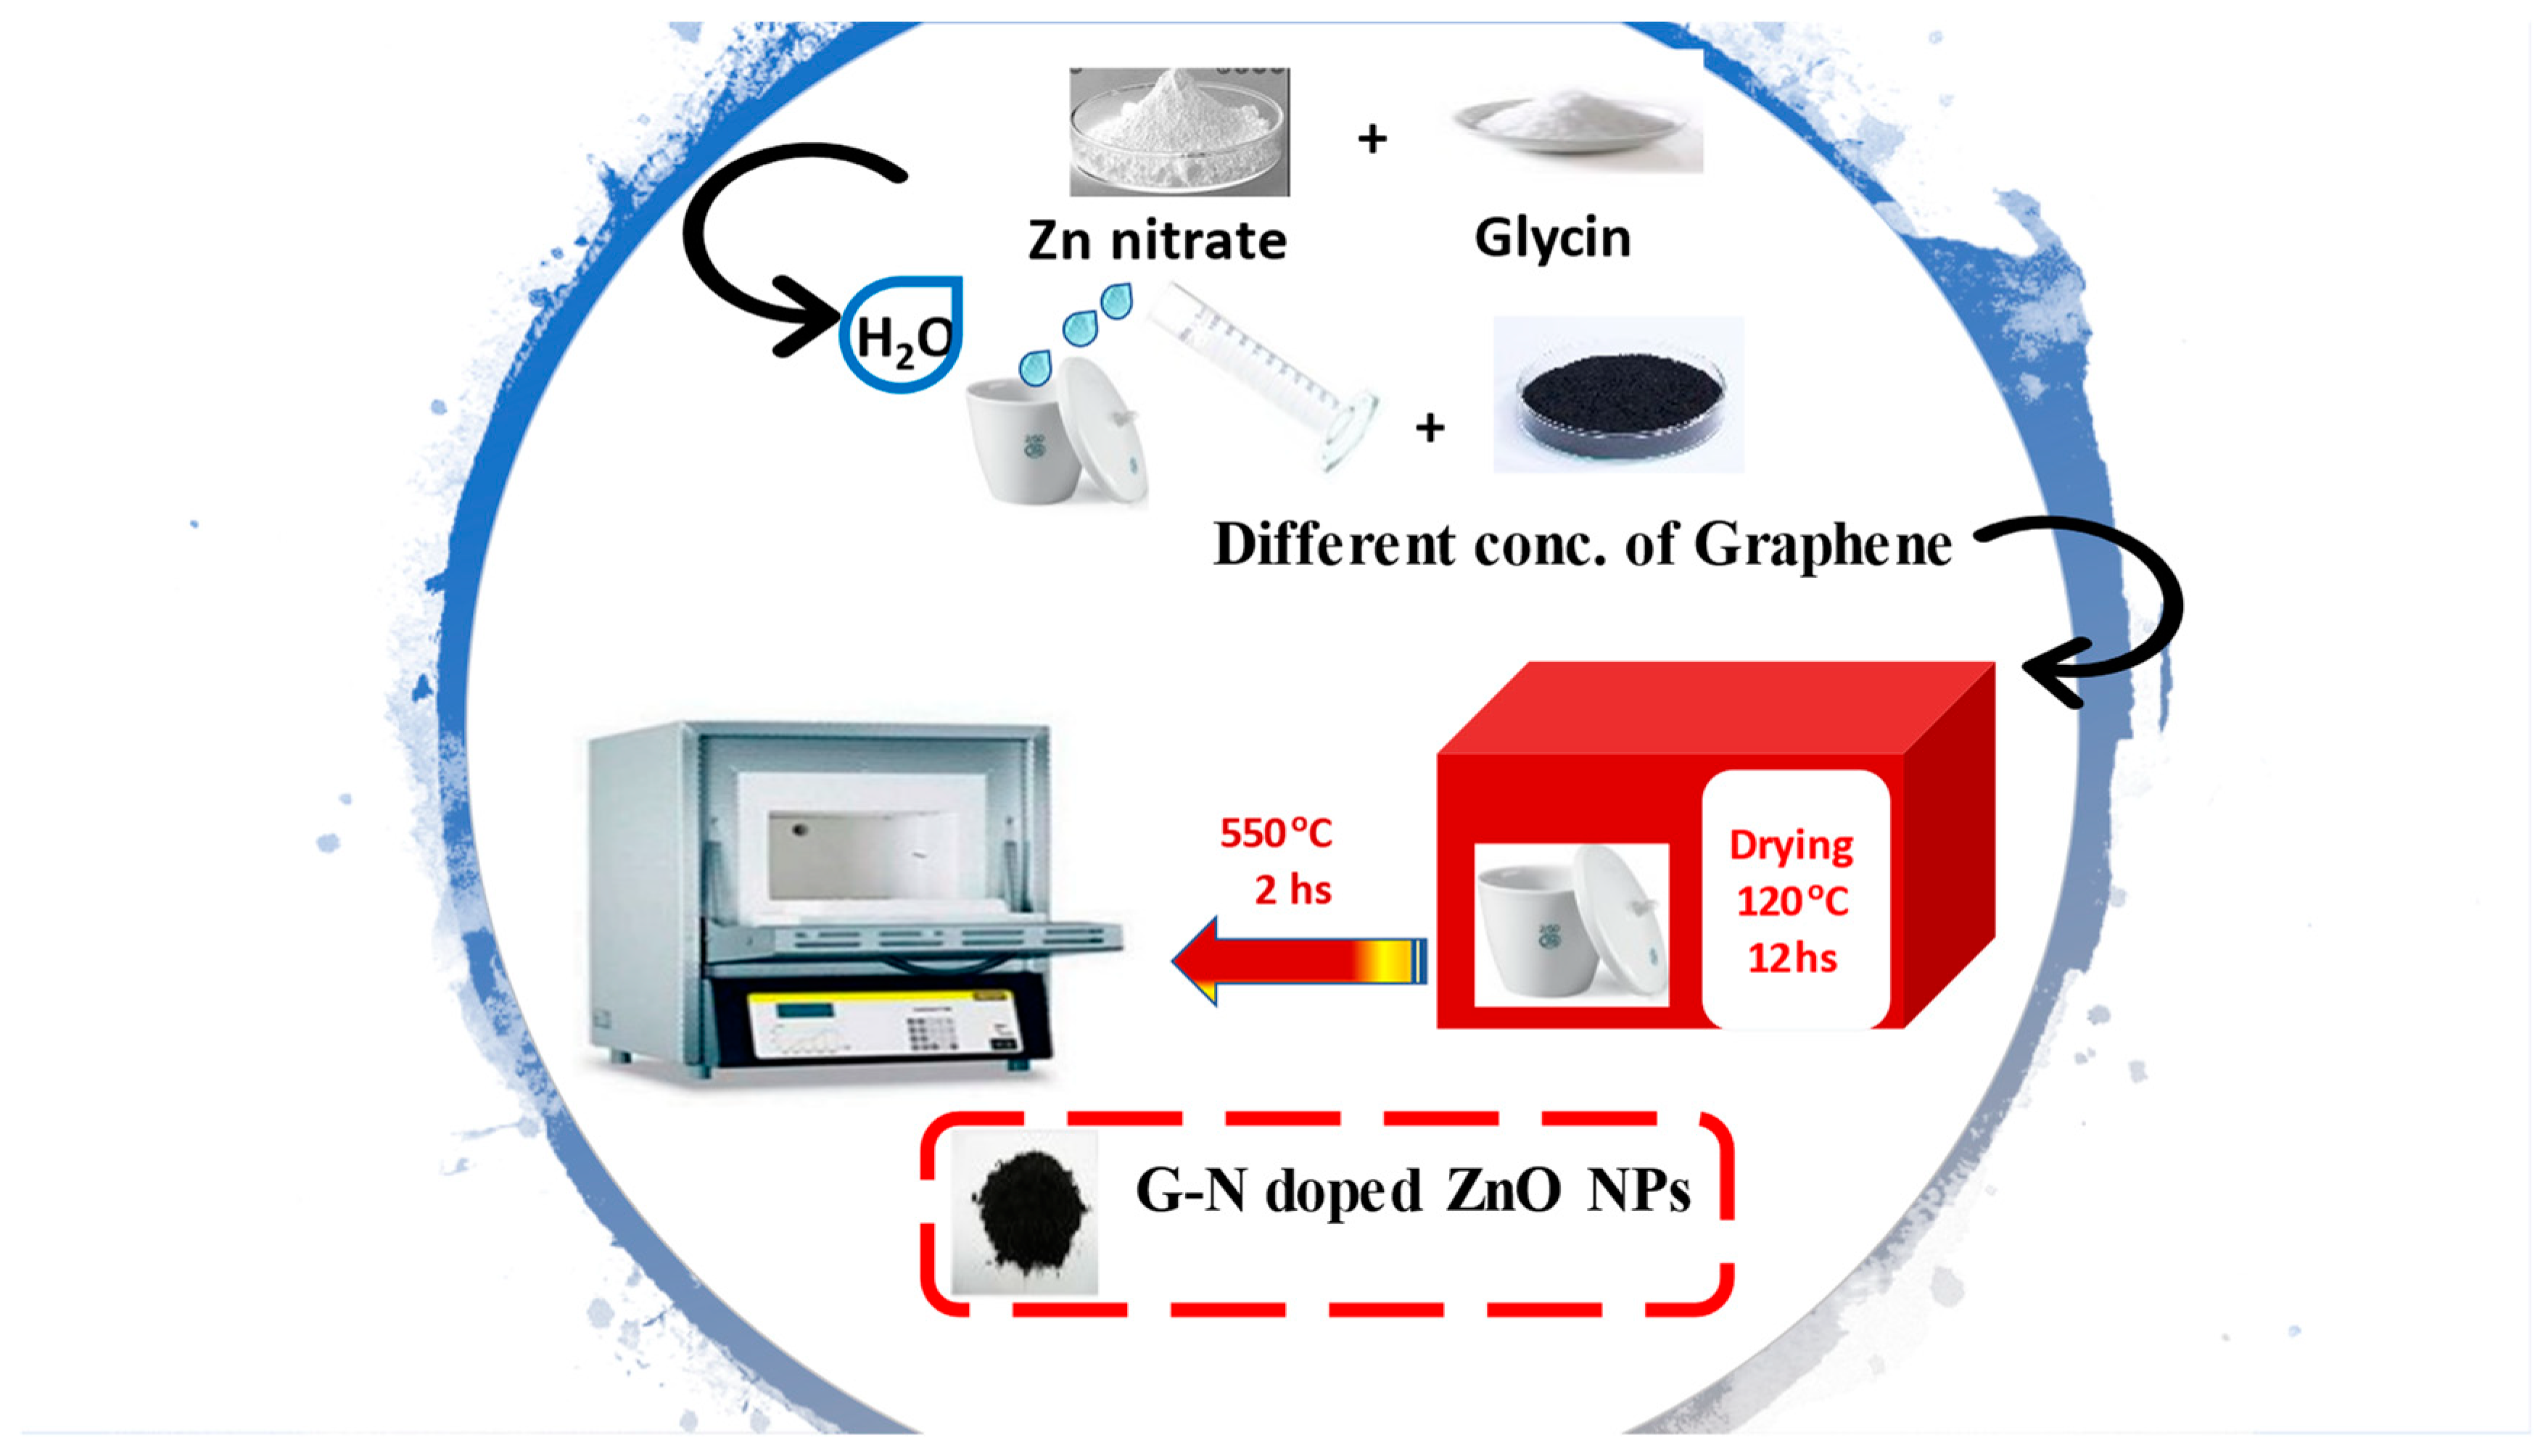
2.1. Synthesis of Nanostructured G/N-Doped ZnO

The combustion approach makes G/N-doped ZnO nanoparticles form in a porcelain crucible of capacity 100 mL. According to the Scheme 2, an 8 g zinc nitrate (Sigma-Aldrich company, Burlington, MA, USA) was dissolved in 30 mL of distilled water. Then, 10 g of glycine (capping agent) was added to the solution as mentioned above and stirred for 15 min at room temperature. After that, the same procedures were repeated with several graphene weights (0.001, 0.01, 0.1, 0.25, 0.5, 1) g to the above solution. The above mixed two soluble materials with/without graphene (i.e. The graphene was prepared in KKU campus under Code No.: IFP-KKU-2020/10) are subject to a dryer heat furnace working at 120 °C for 48 h to have the pure foamed gel of zinc hydroxide. Finally, the final dried gel was fired and calcined for 2 h at 550 °C to remove any residuals and convert the hydroxide form into oxide form. No further purification was performed after the calcination process.

2.2. Characterization Techniques and Devices

A Fourier transform infrared spectrometer (FT-IR) (Perkin Elmer/Germany) investigated functional groups on the synthesized photocatalyst. The Philips X-ray diffractometer PAN analytical X’Pert PRO, (Philips, Eindhoven, Netherlands) was used to examine the structural information of nanocomposites using CuKα monochromatic radiation (40 kV and 40 mA). The surface structure of G/N-doped ZnO nanocomposites has been studied by scanning electron microscopy (SEM), QUANTA FEG 250, USA (FEI, Hillsboro, OR, USA).

2.3. Degradation Studies

All prepared samples were subjected to photocatalytic degradation, electrocatalytic degradation, and photoelectrocatalytic degradation of carmine dye as follows:

2.3.1. In Situ Photocatalytic Degradation Studies

An in situ photocatalytic reactor was used to perform the carmine photocatalytic degradation reaction. The reactor contains one UV lamp (254 nm, 18 W). It was placed in a quartz cylindrical tube. There is air circulation to maintain the temperature constant during the reaction. The quartz cylindrical glass tube was immersed in a glass container containing 0.1 g of G/N-doped ZnO catalyst and 200 mL carmine (2.5 × 10⁻⁴ mol). Then, the mixture was stirred for 30 min in the dark before initiating photocatalysis under UV irradiation.

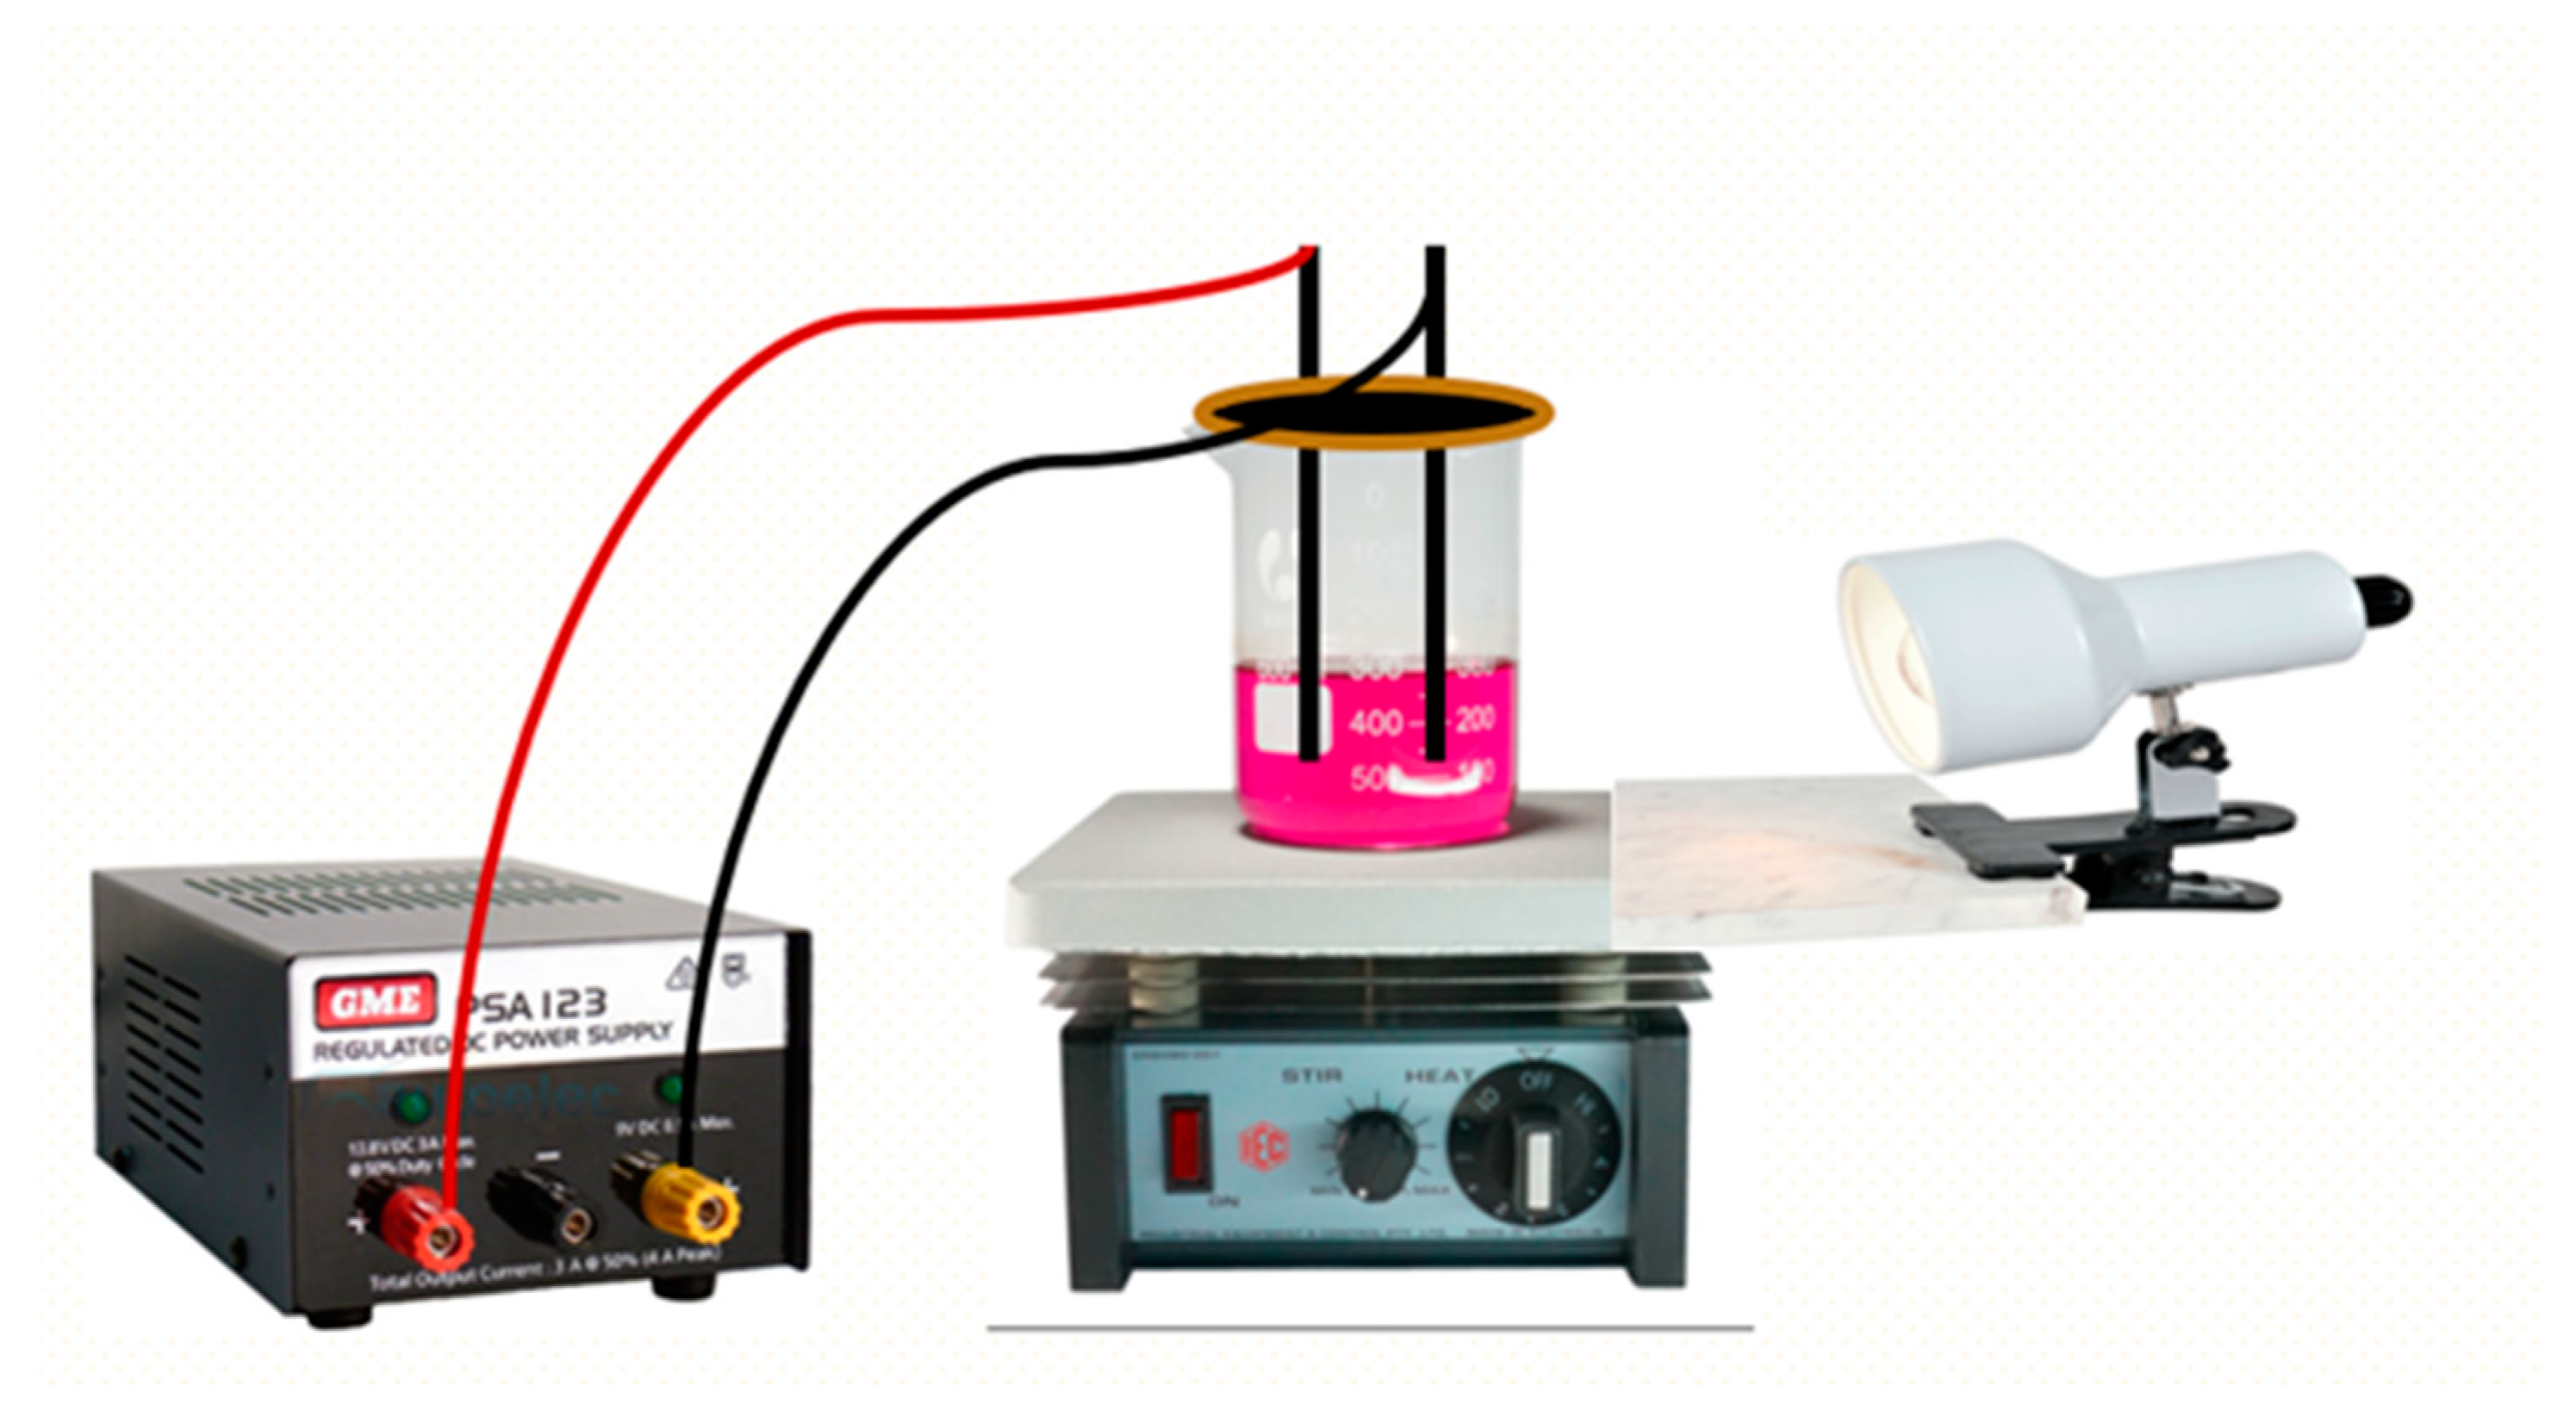
2.3.2. Electro- and Photoelectrochemical Degradation Experiment

The electrochemical anodization was performed in a two-electrode electrochemical cell with two electrodes composed of graphene and 0.01 g of G/N-doped ZnO catalyst added to 200 mL of an aqueous solution carmine (2.5 × 10⁻⁴ M) dye, followed by 10 mL of NaCl 1 M. The working electrode is made from 2 graphite rods. Each graphite rod of length 25 cm and a diameter of 1 cm was purchased from Germany. The distance between the two electrodes is 5 cm immersed in the dye solution, and the applied D.C. voltage = 10 V from the 6 A power supply (Phywe company, Göttingen, Germany).
For the photoelectrocatalytic experiment, the reaction vessel was subjected to UV irradiation of a Hyundai white L.E.D. Flood Light and its power equaled 50 W at a distance of 15 cm from the reactor in ambient conditions. As illustrated in Scheme 3, the spacing between electrodes was 2 cm. A UV–Vis spectrophotometer (LISCO-GmbH, Bargteheide, Germany) was used to evaluate 3 mL of photoelectrolysis response solution for maximum absorption peak spectra of carmine at a specific time interval.

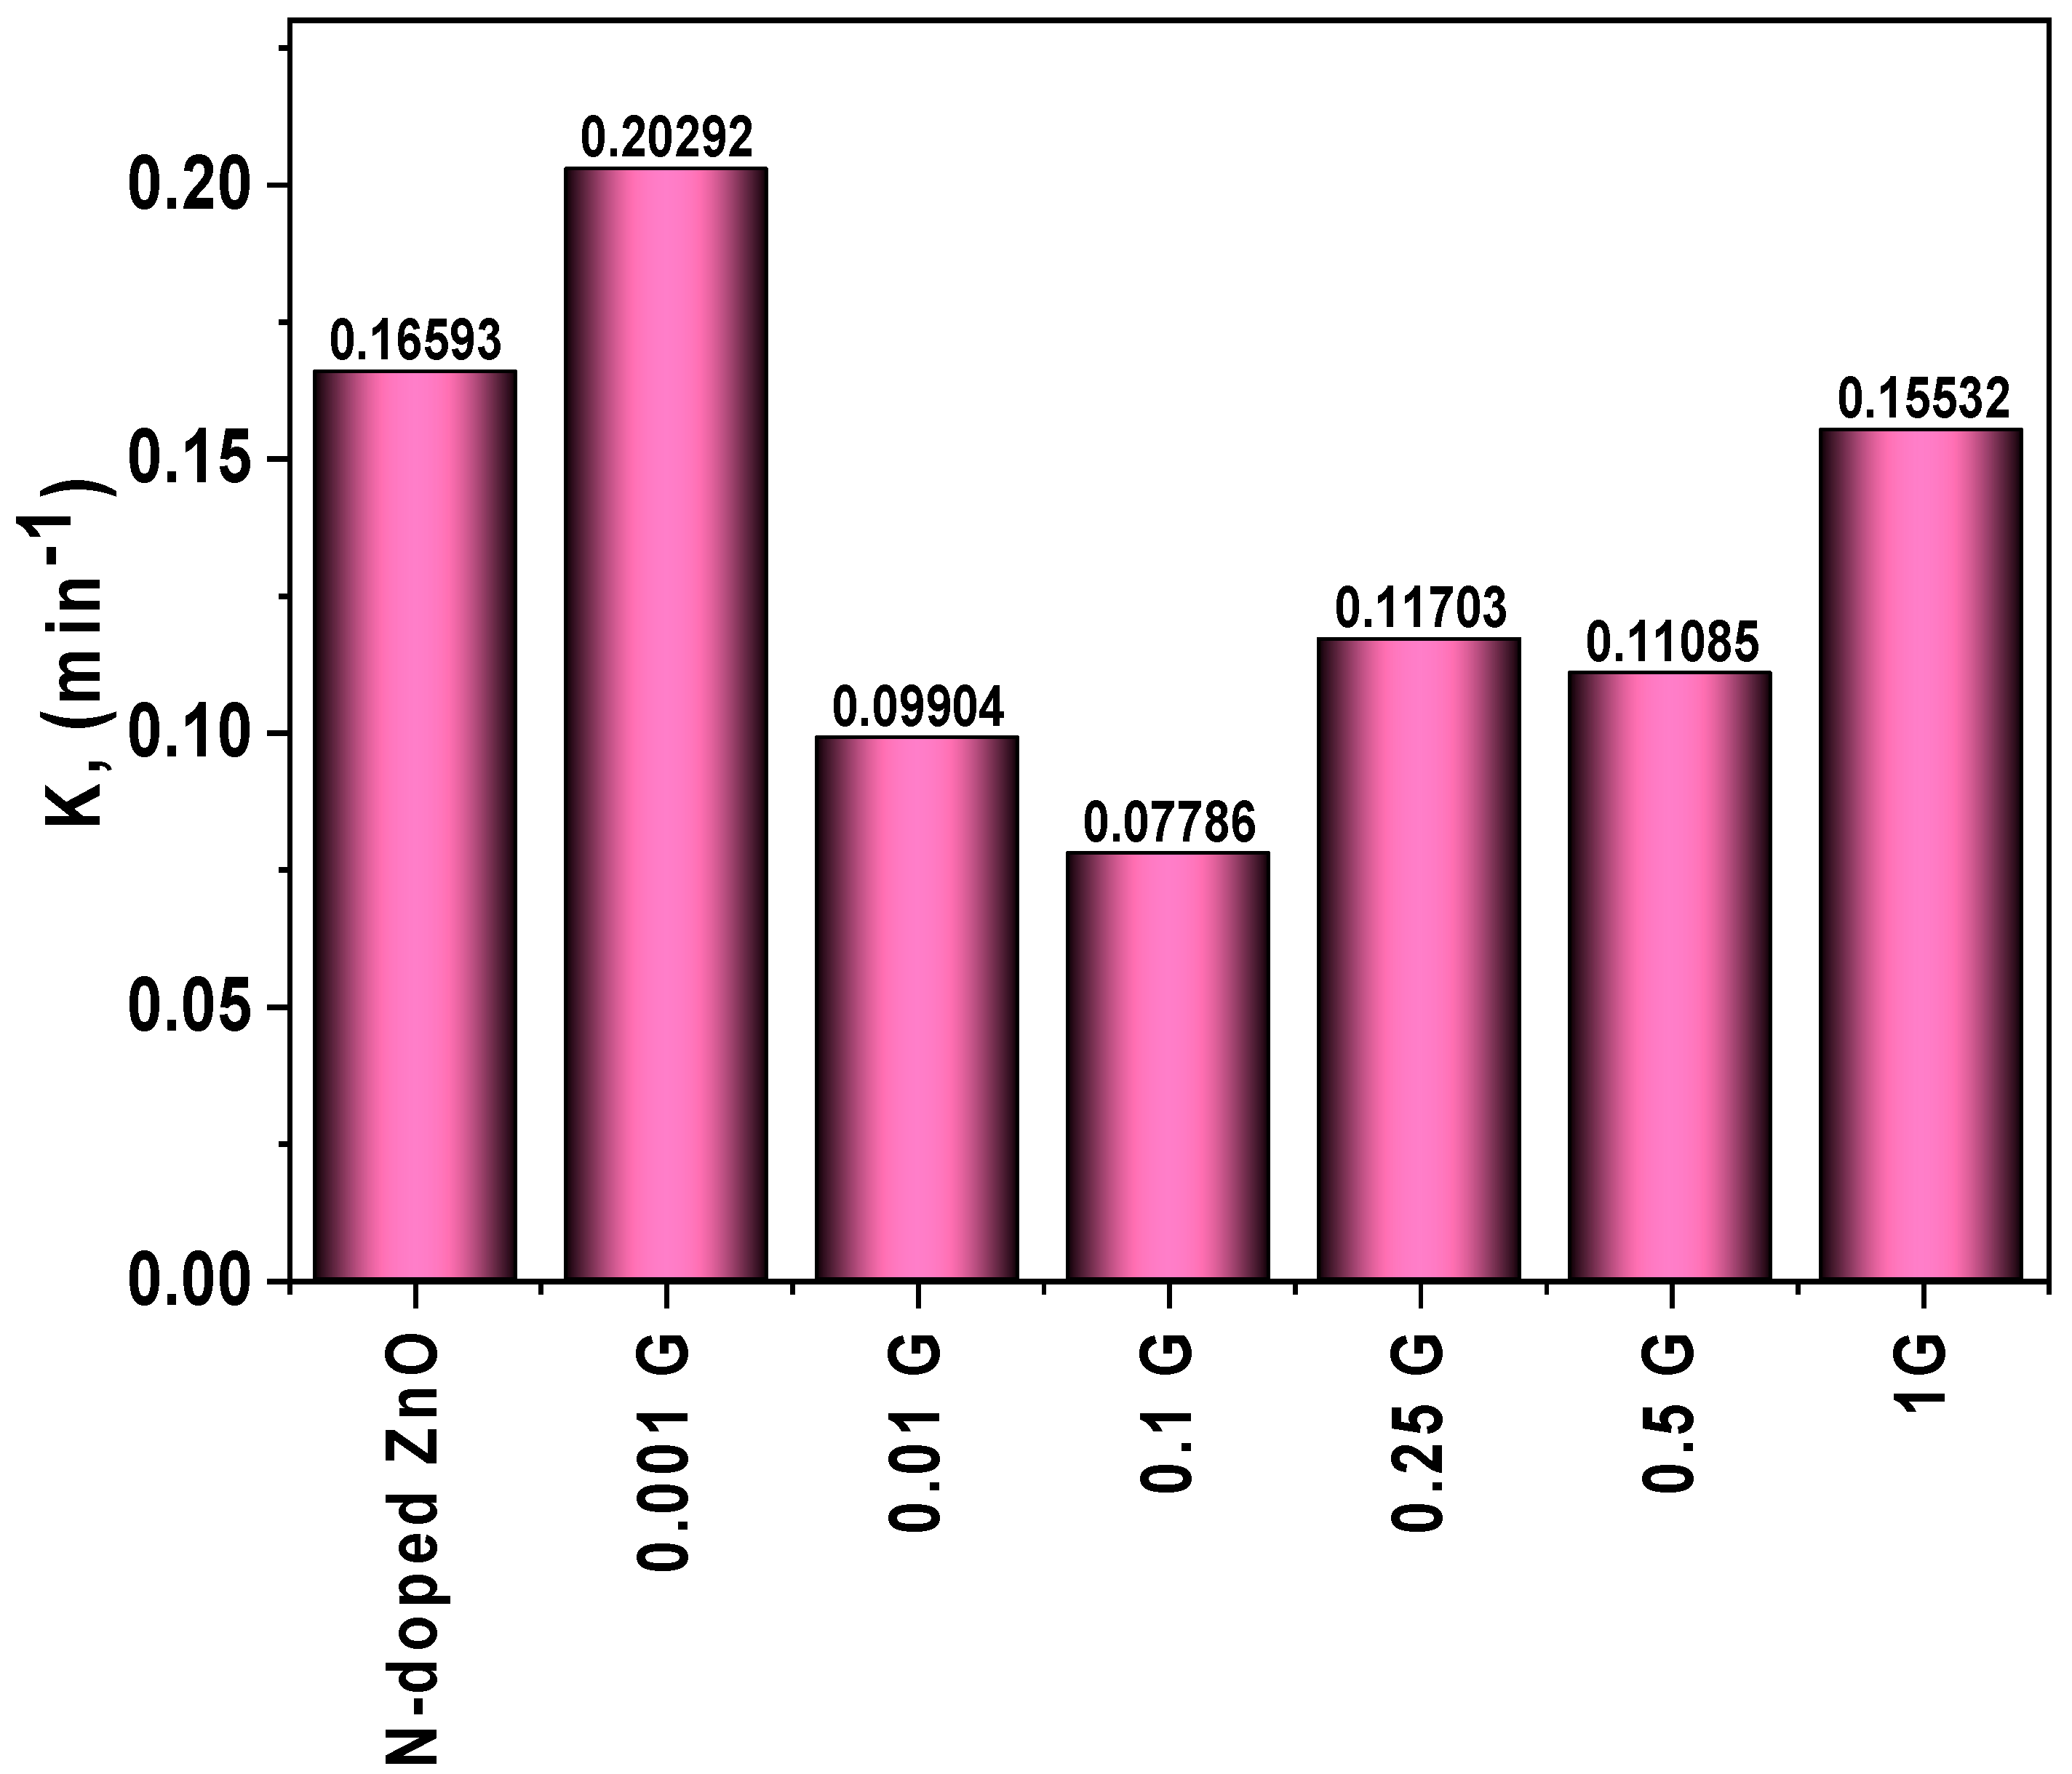
2.4. Kinetic Studies

Samples were withdrawn at 10 min intervals. The carmine peak absorption was measured at 518 nm, and the photocatalytic degradation efficiency (%) was calculated using the equation below [27]:
%   degradation = A o A A o × 100
where Ao represents the initial absorbance degradation, and A means the absorbance at any point during the degradation process. Then, the kinetic constant can be calculated as follows Equation (2):
l n ( A A o ) = K t
where K represents the kinetic constant (min−1).

3. Results and Discussion

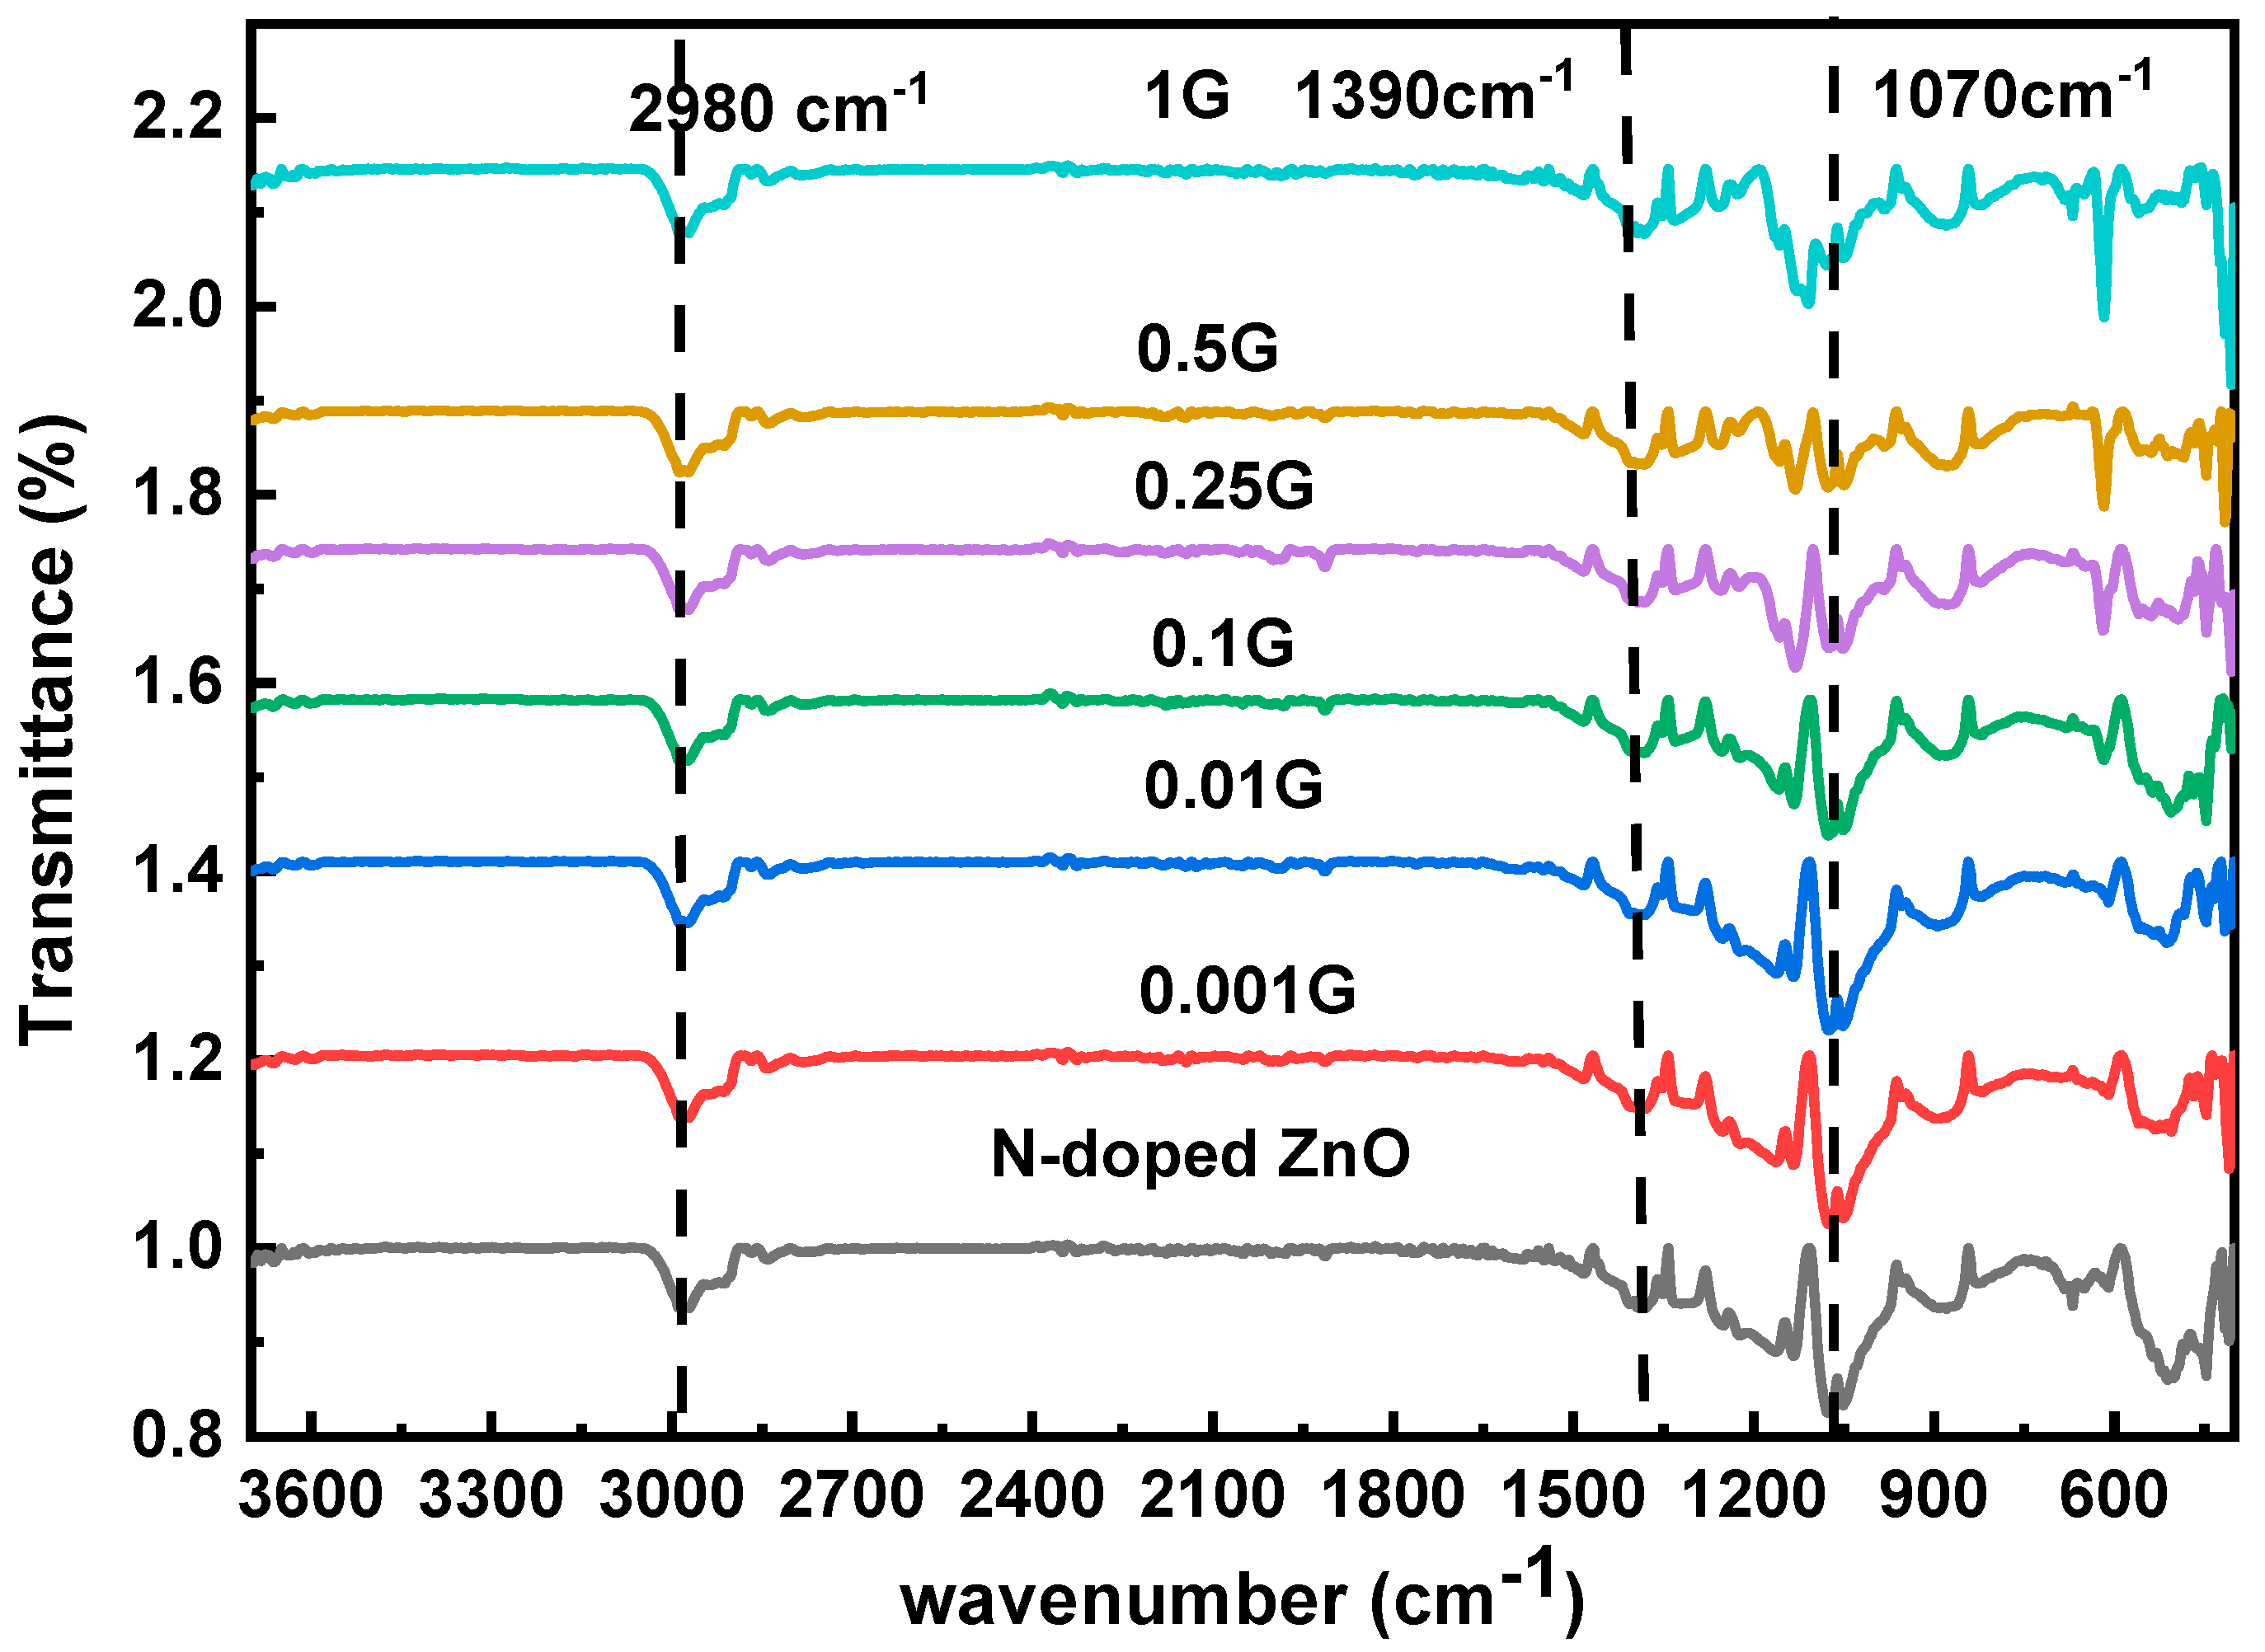
3.1. FT-IR Characterization

The information about a compound’s functional groups, molecular shape, and inter/intramolecular interactions is displayed in the FT-IR spectrum. Figure 1 shows the FT-IR spectra of as-prepared N-doped ZnO and G/N-doped ZnO nanocomposite, which were performed in the range of 400–4000 cm−1 wave number at room temperature. The stretching vibrations of carboxylic and acetate groups (asymmetrical and symmetrical) bonded to the ZnO are linked to the peaks found about 1390 cm−1 in the nanocomposite [28]. C–O, C=O, and C–H stretching vibrations in the atmospheric CO2 captivated by the nanocomposite substance resulted in smaller bands at 2980 cm−1 and 1070 cm−1, which is because of the presence of C–O, C=O, and C–H stretching vibrations [29].

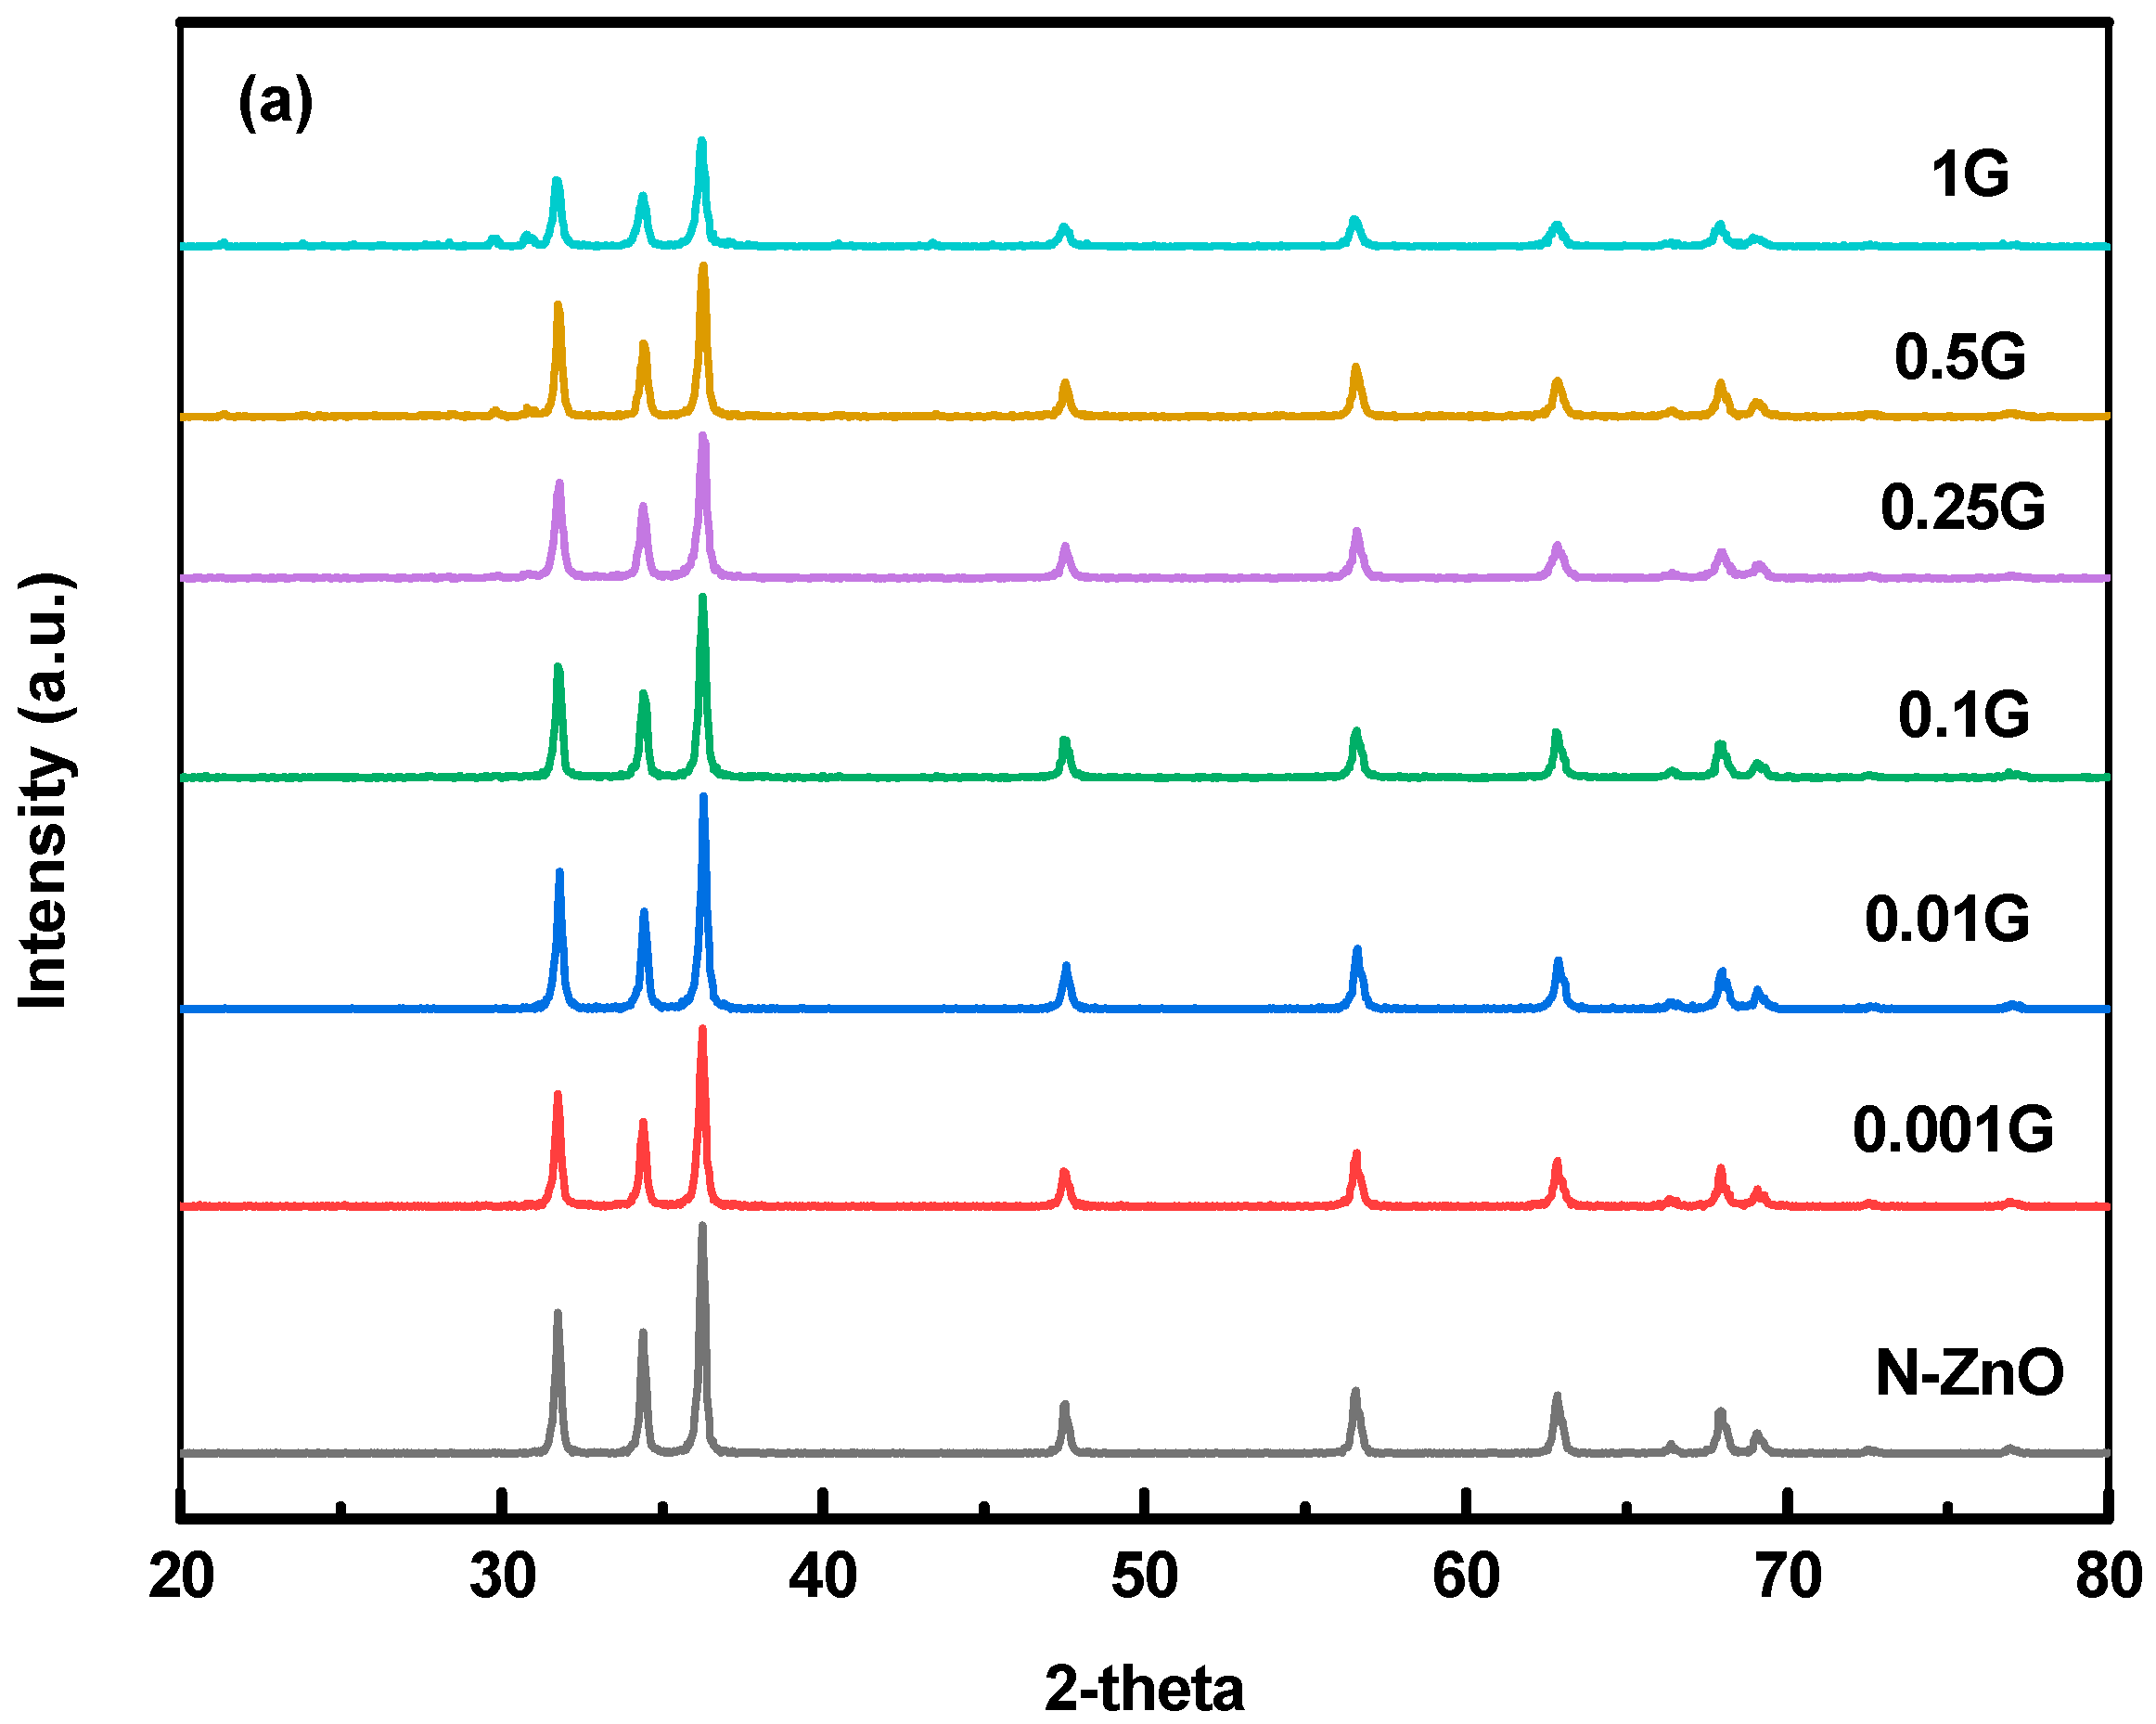
3.2. X-ray Diffraction Characterization

X-ray diffraction was used to examine the lattice structure and crystalline nature of the produced G/N-doped ZnO nanocomposite, as shown in Figure 2a. The strong diffraction peaks of the standard hexagonal wurtzite structure ZnO (JCPDS 00-001-1136) are coded as 31.69° (100), 34.35° (002), 36.24° (101), 47.54° (102), 56.65° (110), 62.77° (103), 67.95° (112), and 69.05° (201) [29,30]. As a result of the addition of nitrogen into ZnO, no new peaks were found, indicating that nitrogen doping did not modify the crystal structure of ZnO.
Due to the integration of graphene into N-doped ZnO, no new peaks were identified. M. Suresh et al. [29] investigated the XRD of G/N-doped ZnO and discovered hexagonal wurtzite ZnO structures with good crystallinity in the produced nanocomposite. N-ZnO nanoparticles’ diffraction peaks resemble those of hexagonal ZnO, according to Rowshon Kabir [31], indicating that the ZnO crystal has not undergone a phase transition due to the N atoms being doped. The following equations were used to compute the structural and microstructural parameters, and the results are shown in Table 1. Scherrer’s equation was used for estimations of crystallite size [32]:
D = 0.9 λ β   c o s θ = 0.9 λ 4 ε   s i n θ
where D is the crystallite size, the X-ray wavelength is λ, and the full width at half maximum (F.W.H.M.) is β. The average crystalline size for the prepared nanocomposite materials was 31.51–66.53 nm. After adding 0.001 G to N-doped ZnO, the crystalline diameters were reduced considerably, from 66.53 to 31.51 nm. This indicates that graphene significantly reduces the development of ZnO crystallites in G/N-doped ZnO nanocomposites. M. Suresh et al. [29] found that the D value of the RGO-N ZnO was 54 nm. The Stokes–Wilson equation was used to calculate the lattice strain generated by crystal imperfection and distortion in N-doped ZnO and G/N-doped ZnO.
ε = β c o t θ 4
The dislocation density refers to the amount of crystallographic defects or irregularity present in the crystal, significantly impacting the synthesized materials’ properties. The Williamson–Smallman relation was used to compute the dislocation density [33].
δ = 1 D 2

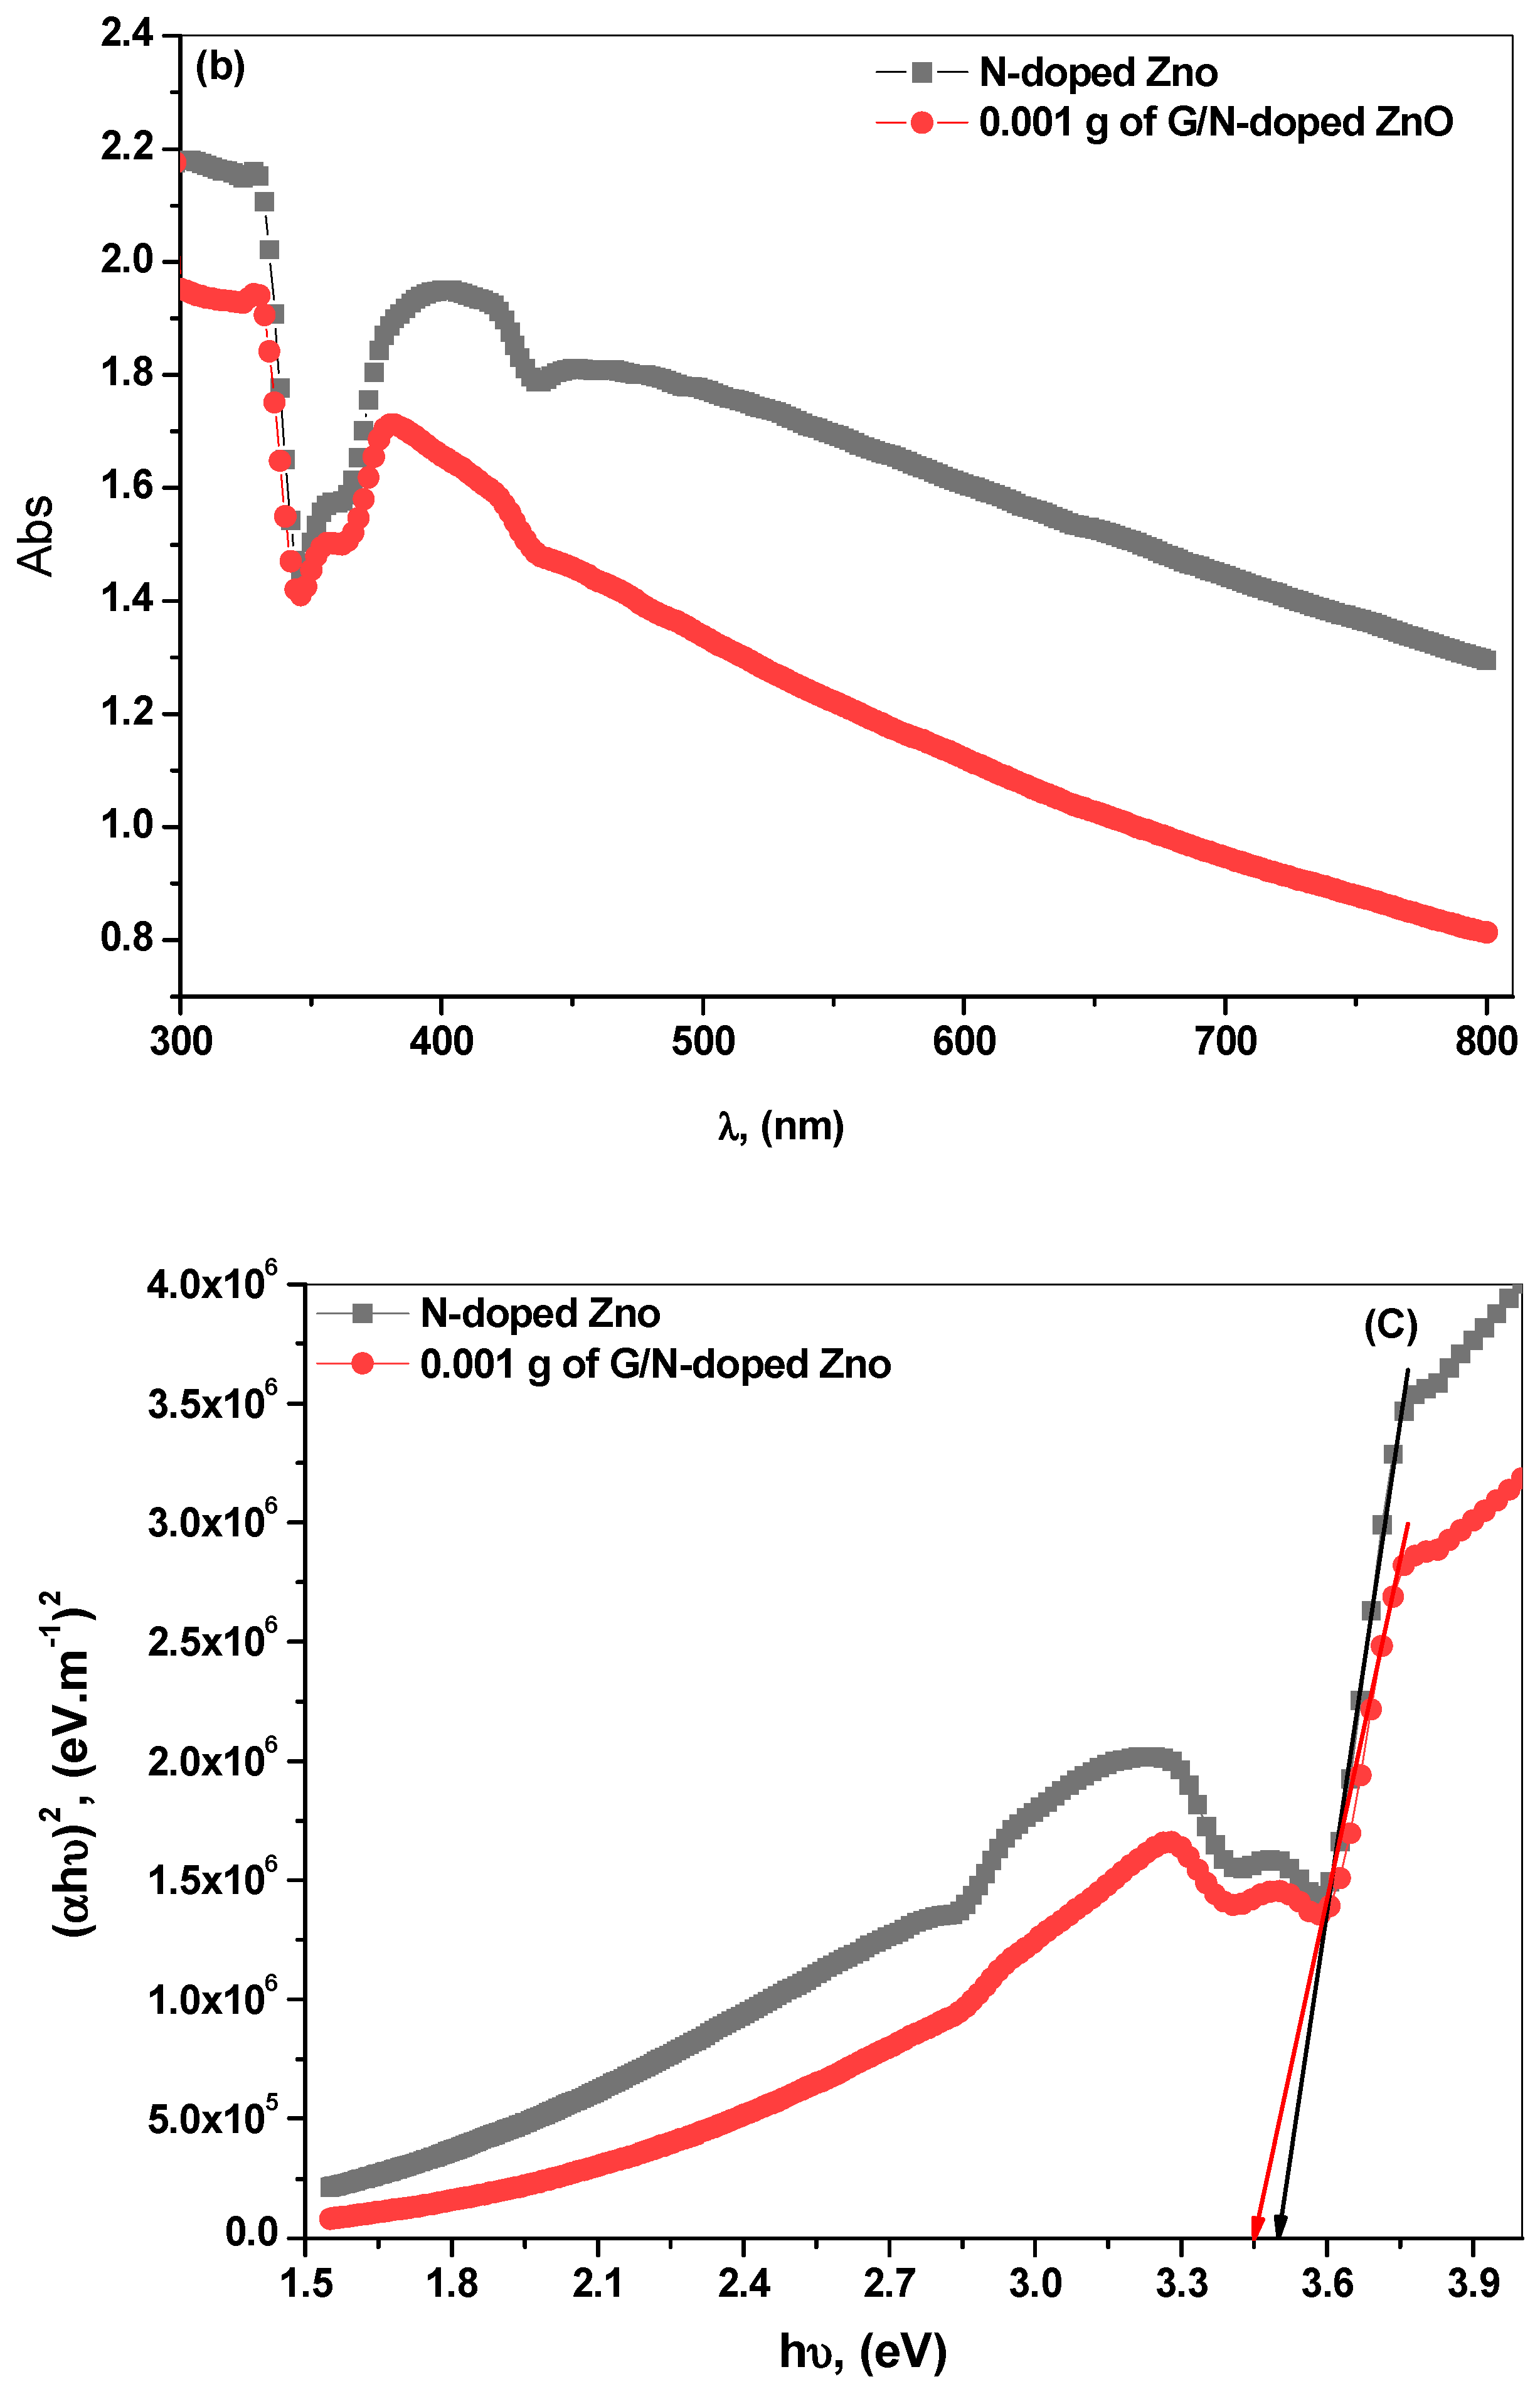
3.3. Optical Characterization

The optical property is one of the prime criteria for assessing the catalytic activity of the G/N-doped ZnO N.P.s. Figure 2b depicts the UV–vis diffuse reflectance spectra of N-doped ZnO and 0.001 G/N-doped ZnO nanocomposites. Obviously, both N-doped ZnO and 0.001 G/N-doped ZnO nanocomposites have the same absorption cutoff edge at 344 nm. The energy required for the electron transfer from the valance band to the conduction band is calculated from its bandgap energy which EBG = 1240/λmax calculates, and according to the direct bandgap rule [Tauc’s equation, (6)], the curve of (αhυ)^2 vs. was plotted and then extrapolated to the x-axis [29].
α h υ = A ( h υ E g ) m
where EBG is bandgap energy, λmax is maximum absorption wavelength, α is absorption coefficient, A is the constant related to the effective mass of the electrons, m = 1/2 (Direct allowed transition), m = 2 (Indirect allowed transition), h is Plank’s constant, and υ is Frequency.
Figure 2c depicts the variations of (αhυ)^2 with hυ of N-doped ZnO and 0.001 G/N-doped ZnO nanocomposites. The optical energy band gap (EBG) was estimated from the straight-line fit extrapolation of the plot to the intercept with axis at (αhυ)^2 = 0. The direct bandgap energy of N-doped ZnO is 3.499 eV, which decreases to 3.448 eV for 0.001 G/N-doped ZnO. Suresh et al. [29] found that the bandgap energy is 3.16 eV and 3.03 eV of N ZnO and 0.001 G/N-doped ZnO nanocomposites, respectively.

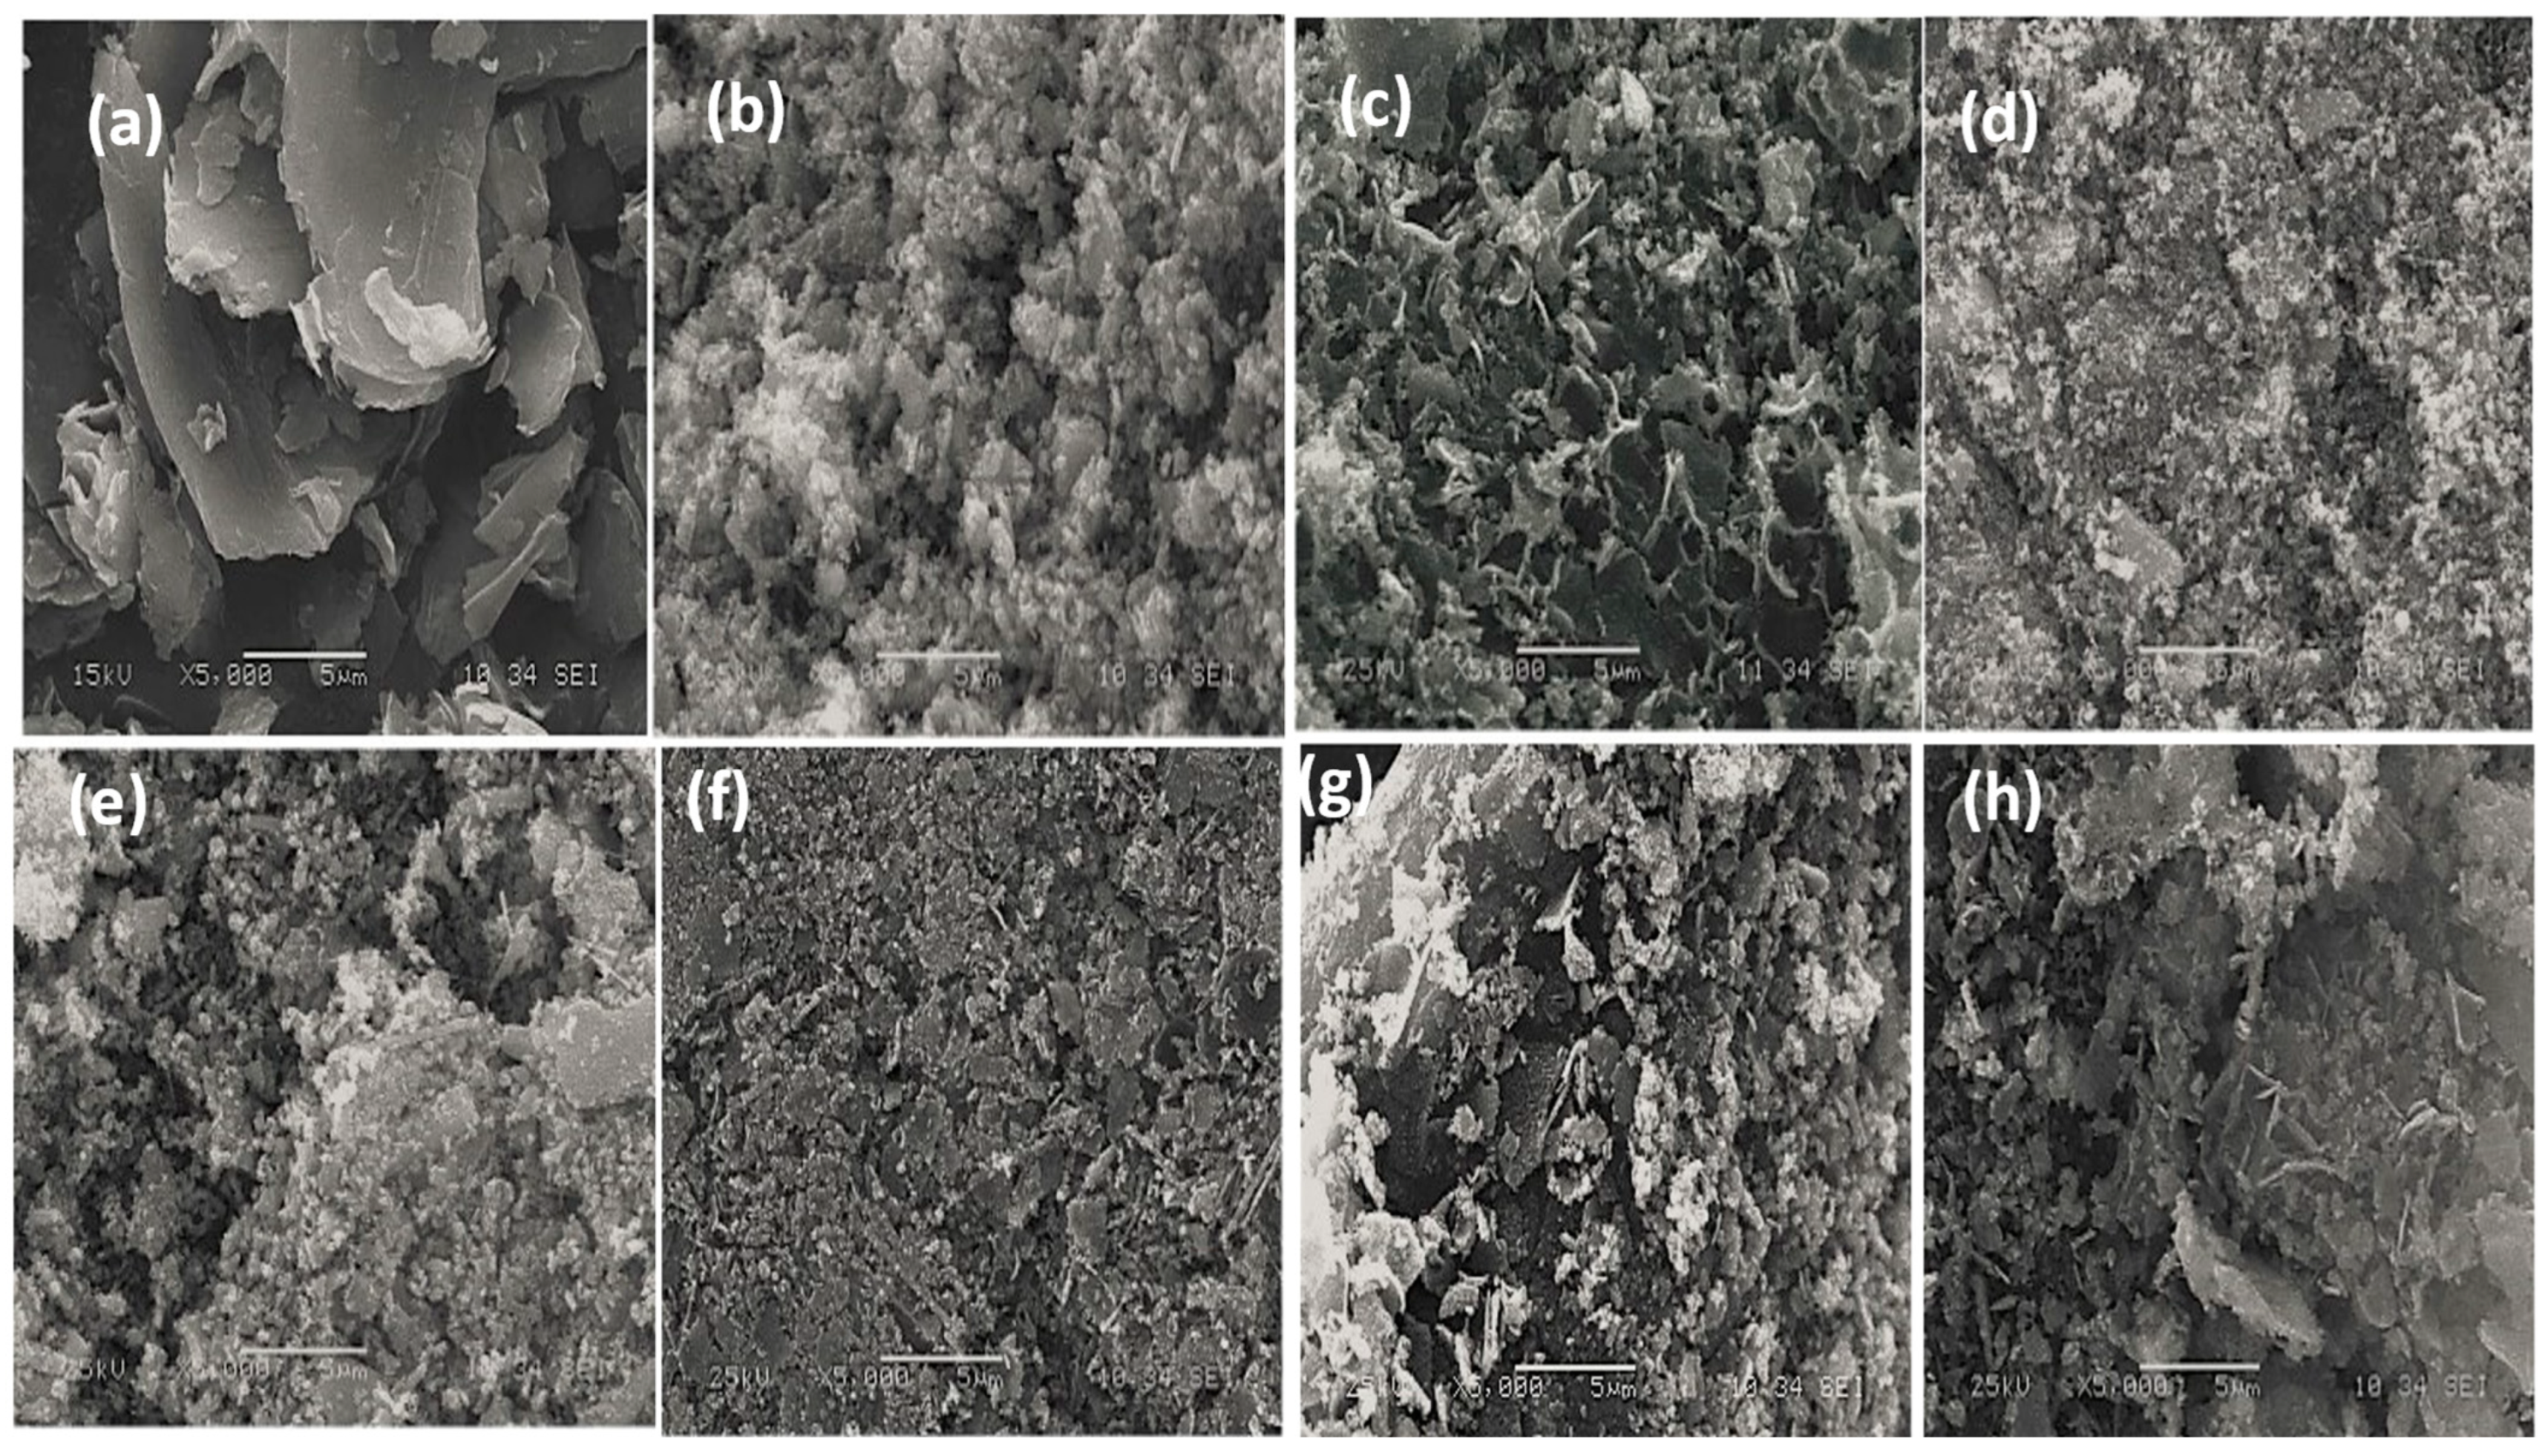
3.4. Morphology and Compositional Analysis

The surface morphology of the obtained G/N-doped ZnO nanocomposite material was examined using a scanning electron microscope (SEM) Figure 3a depicts a scanning electron microscopy image of graphene, suggested layered structure, and crumpled surface morphology. Meanwhile, the images in Figure 3b shows a scanning electron microscopy image of N-doped ZnO, exhibiting a high degree of N-doped ZnO nanoparticles [34]. Figure 3c–g shows images of G/N-doped ZnO, indicating the photocatalysts are decorated with graphene layers. The existence of graphene may enhance the surface area and thereby the photocatalytic efficiency of the synthesized nanocomposite. Graphene’s interaction with photocatalyst particles allows for dispersion and adherence of graphene layers to photocatalyst particles. It is reasonable to believe that such a structure would simplify moving excited electrons from the conduction band between photocatalyst particles and G layers [35]. Figure 3c 0.001 G/N-doped ZnO has the most significant contact surface with G, so this sample is the optimum photocatalyst.

3.5. Degradation of Carmine Dye Methods

The photocatalytic and electrochemical methods are considered more effective in altering organic pollutants to carbon dioxide and water. In this study, both the photocatalytic and indirect electrochemical oxidation methods were investigated and compared.

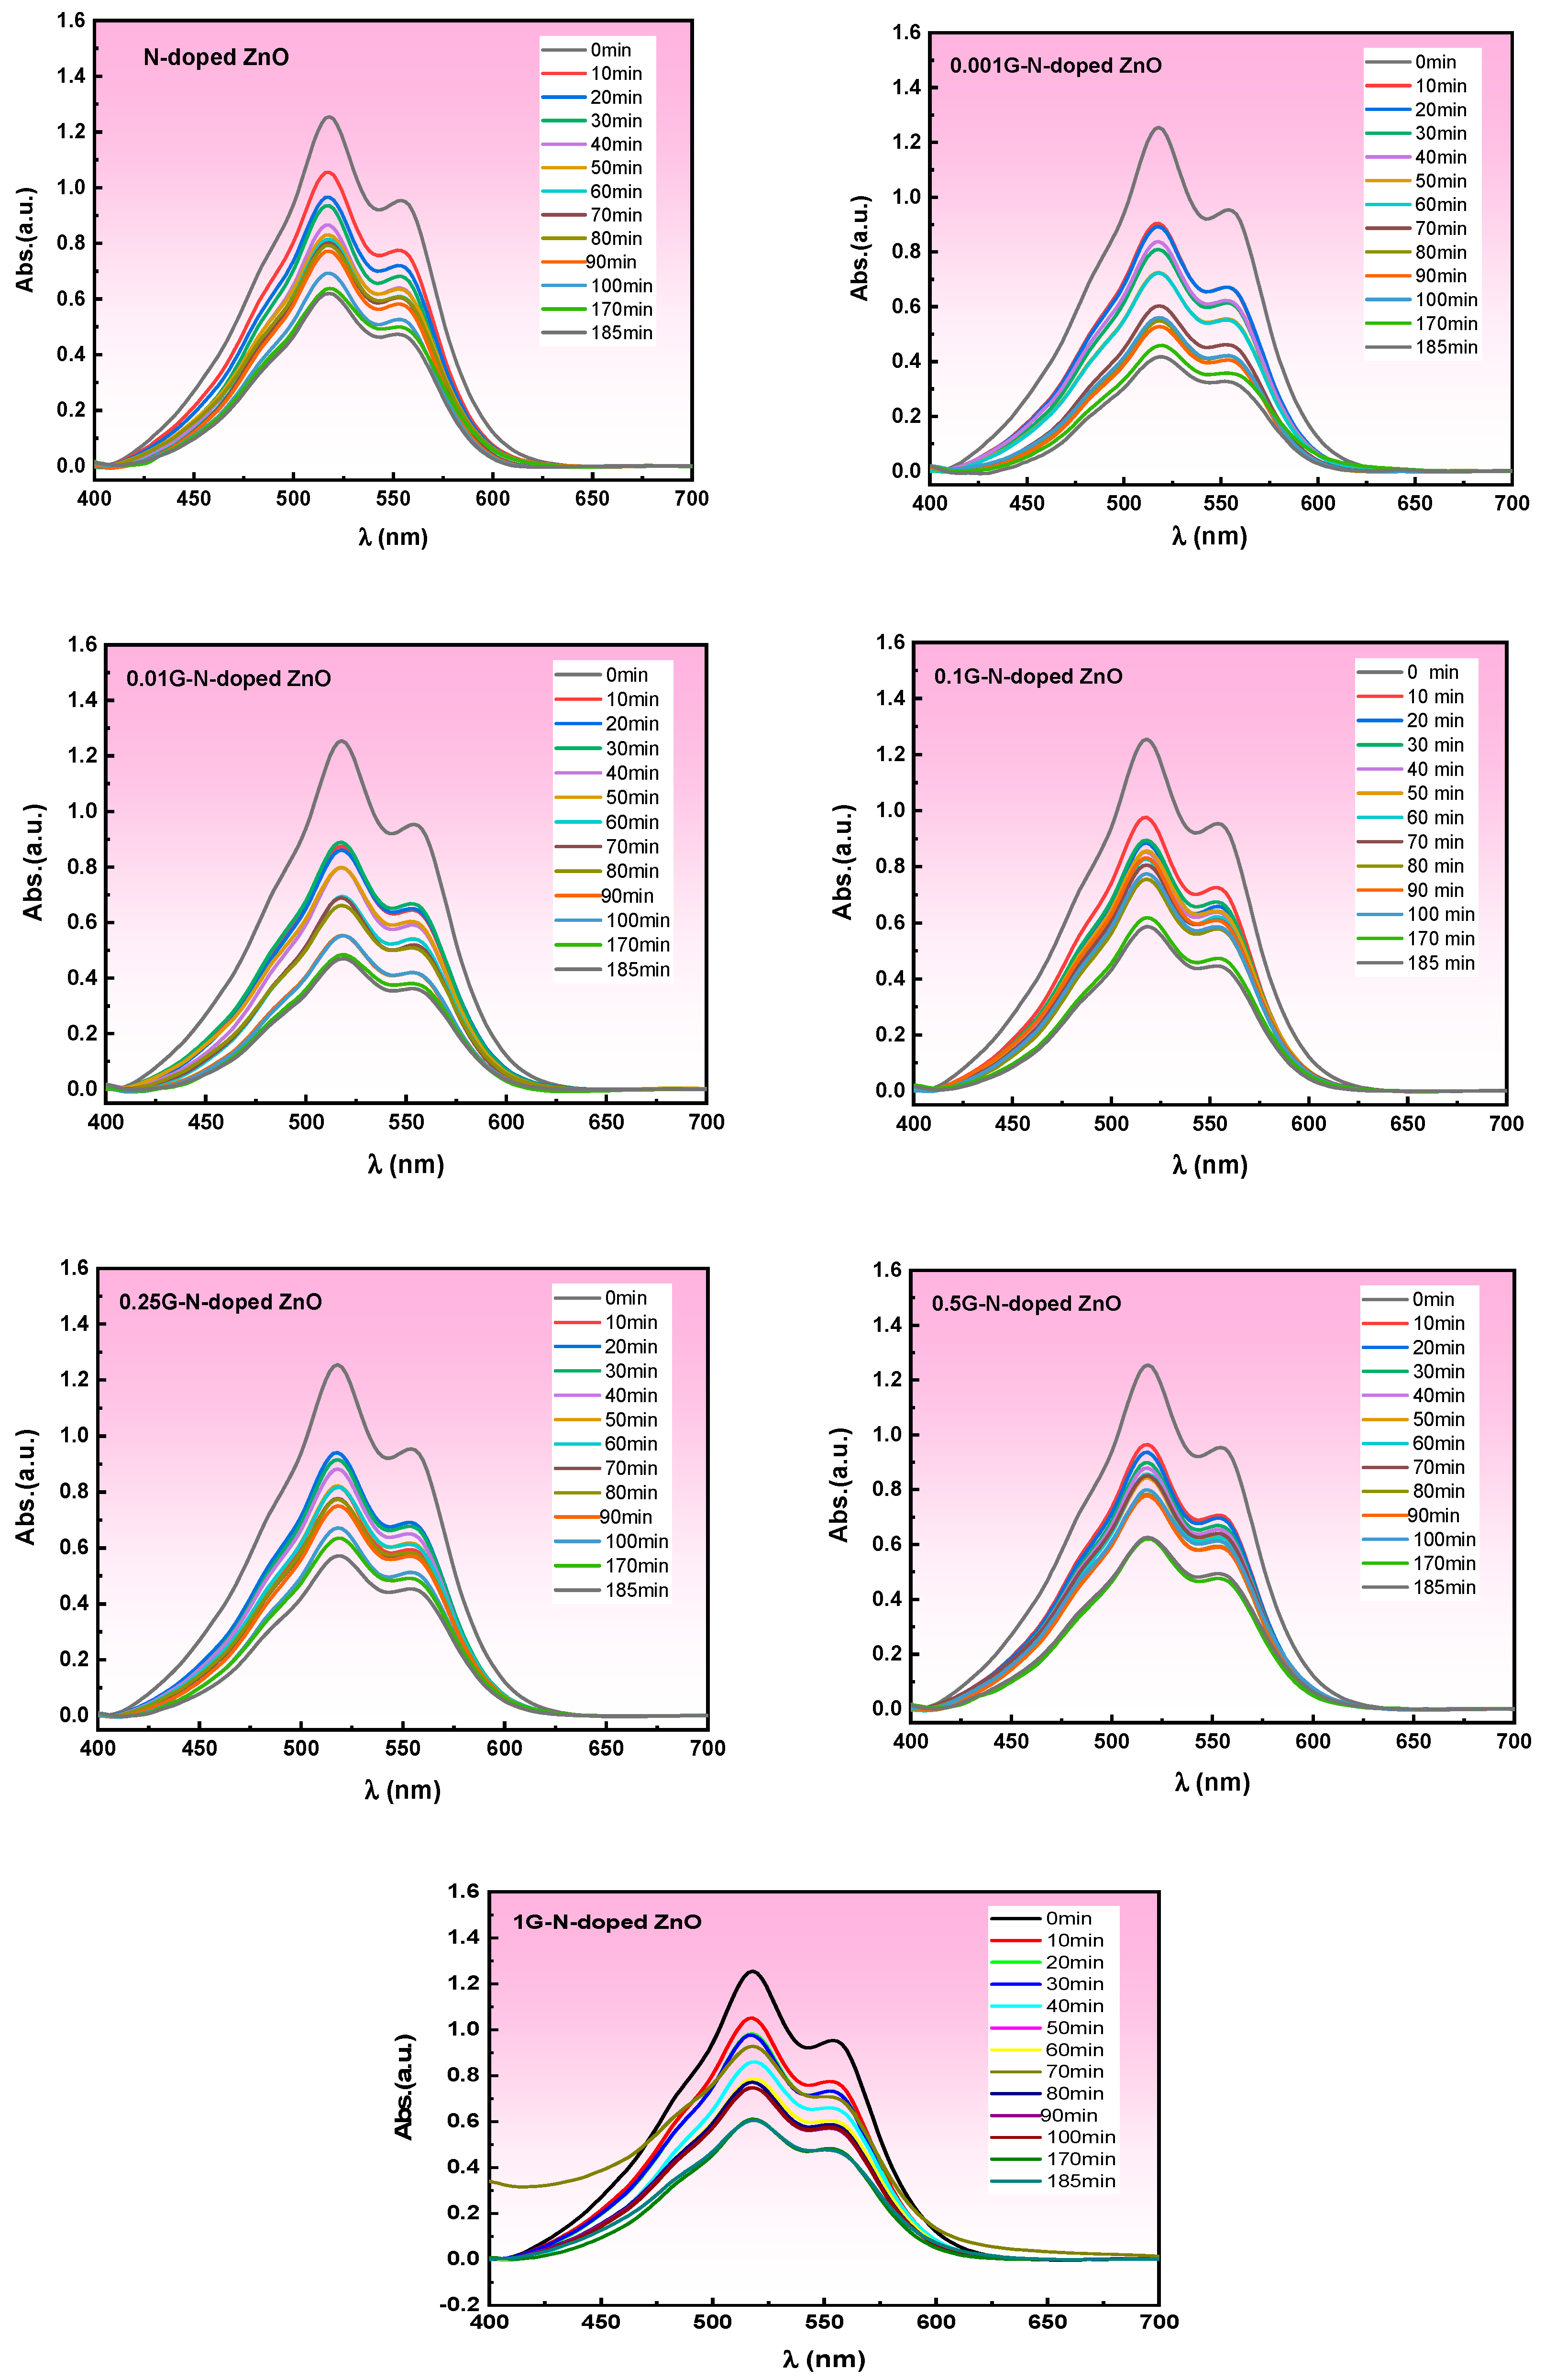
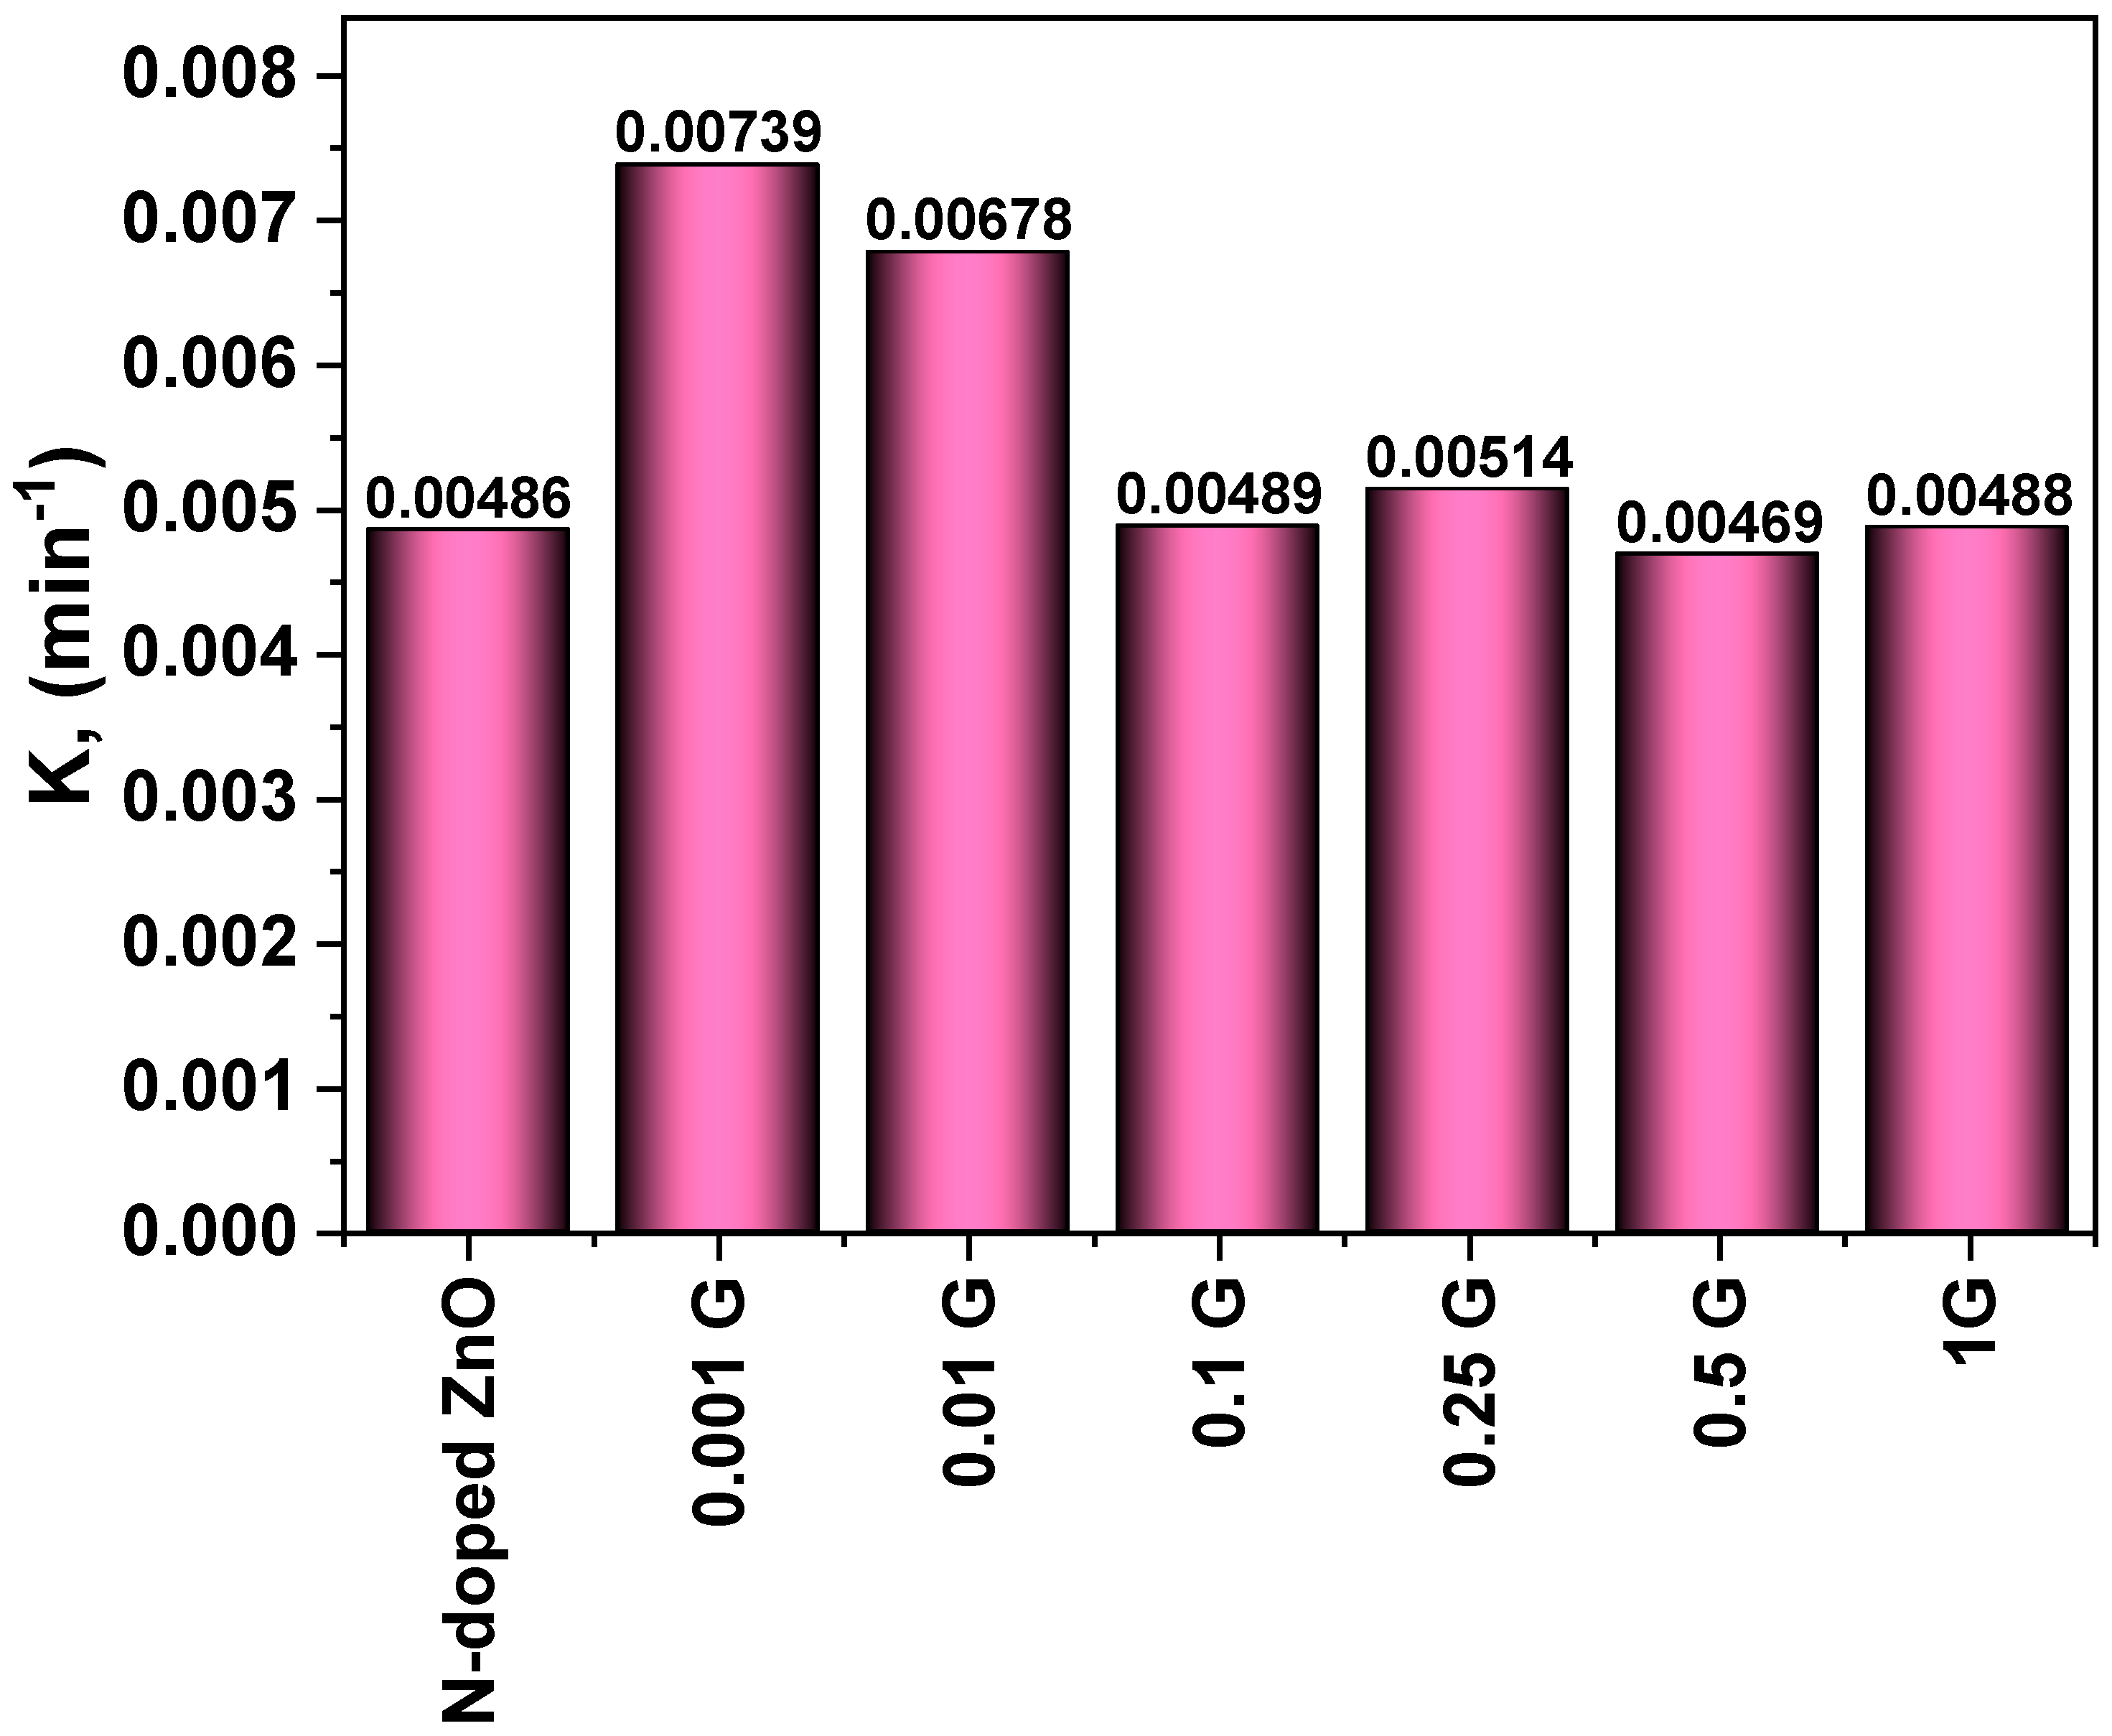
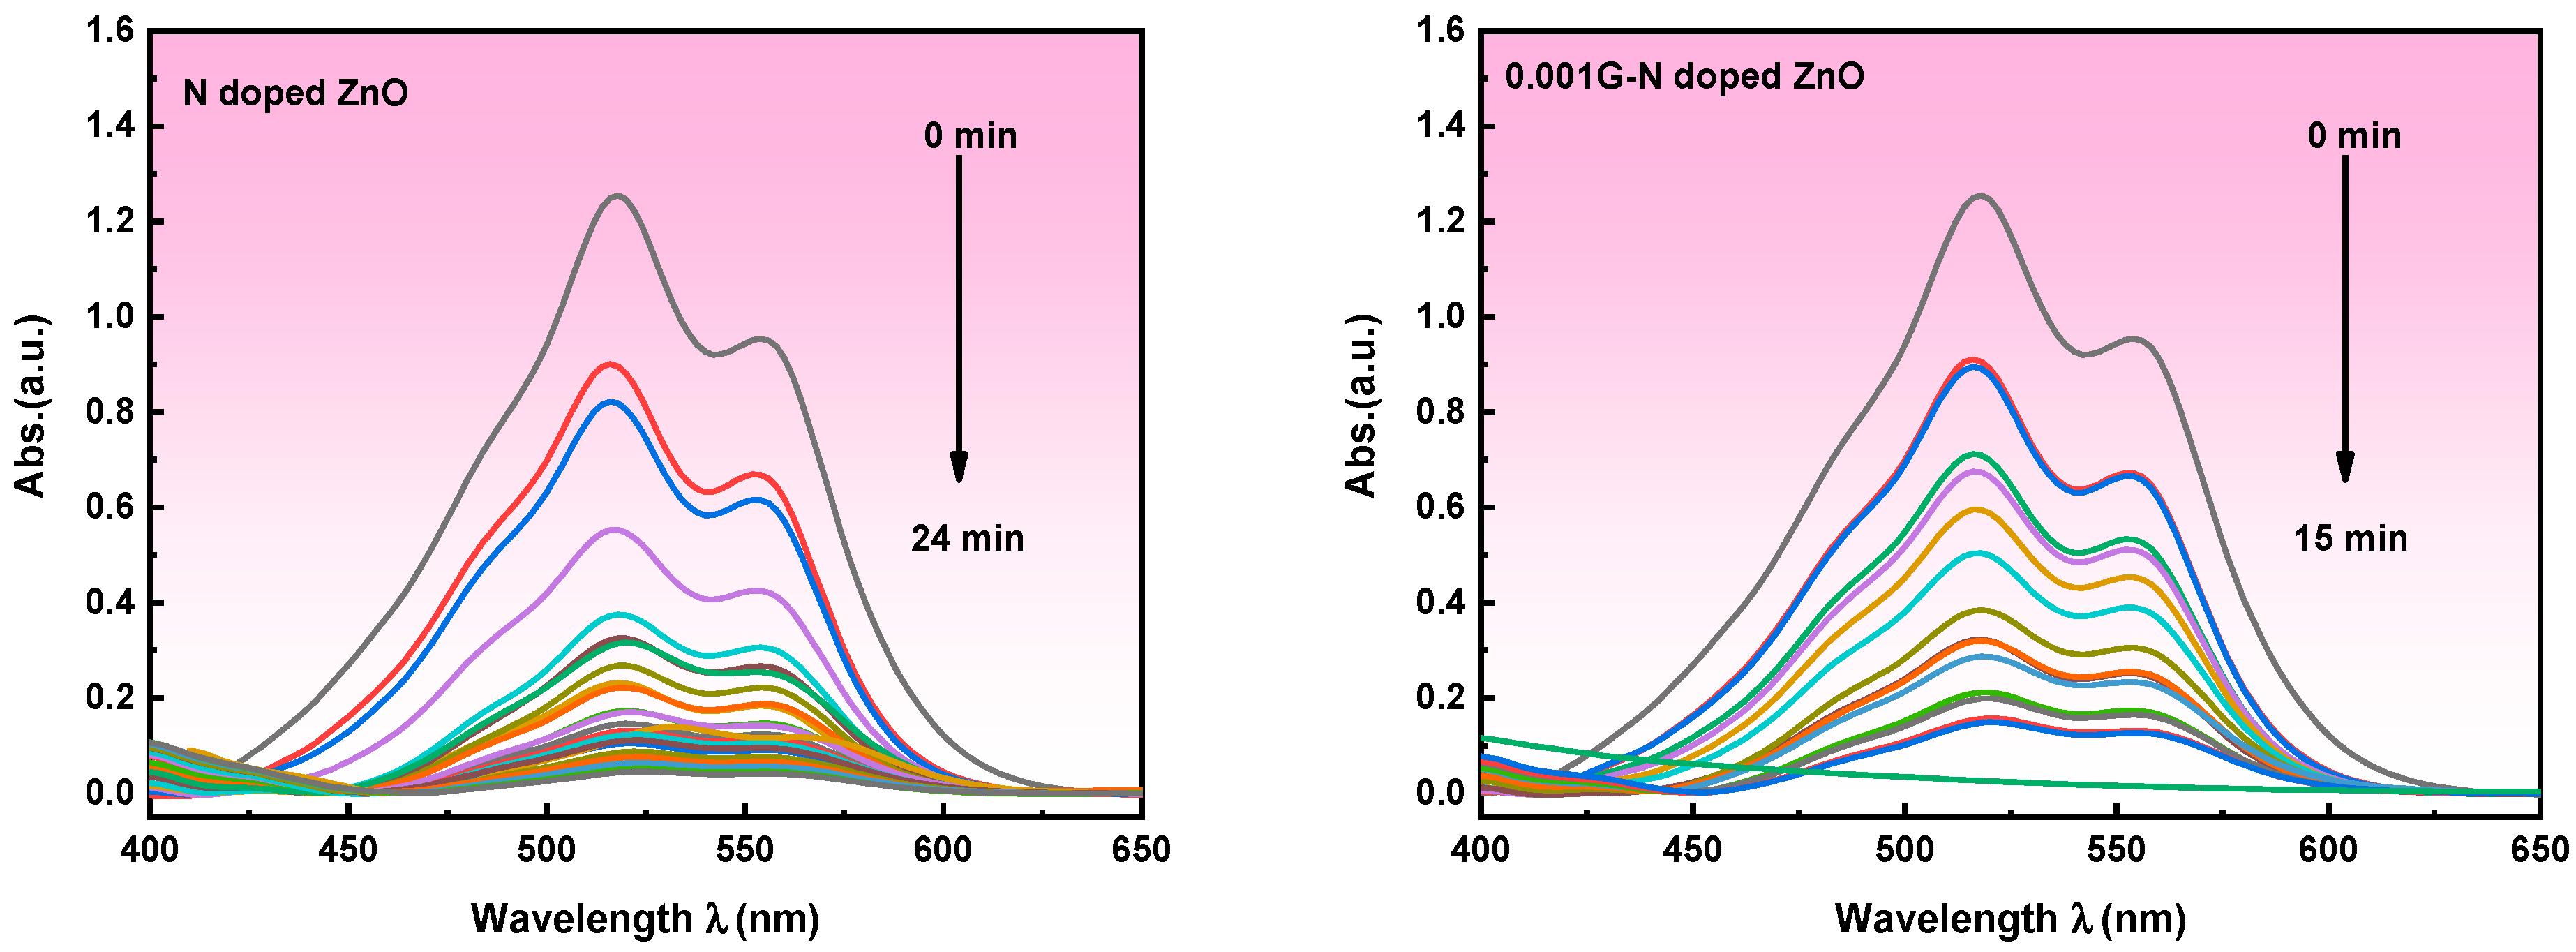
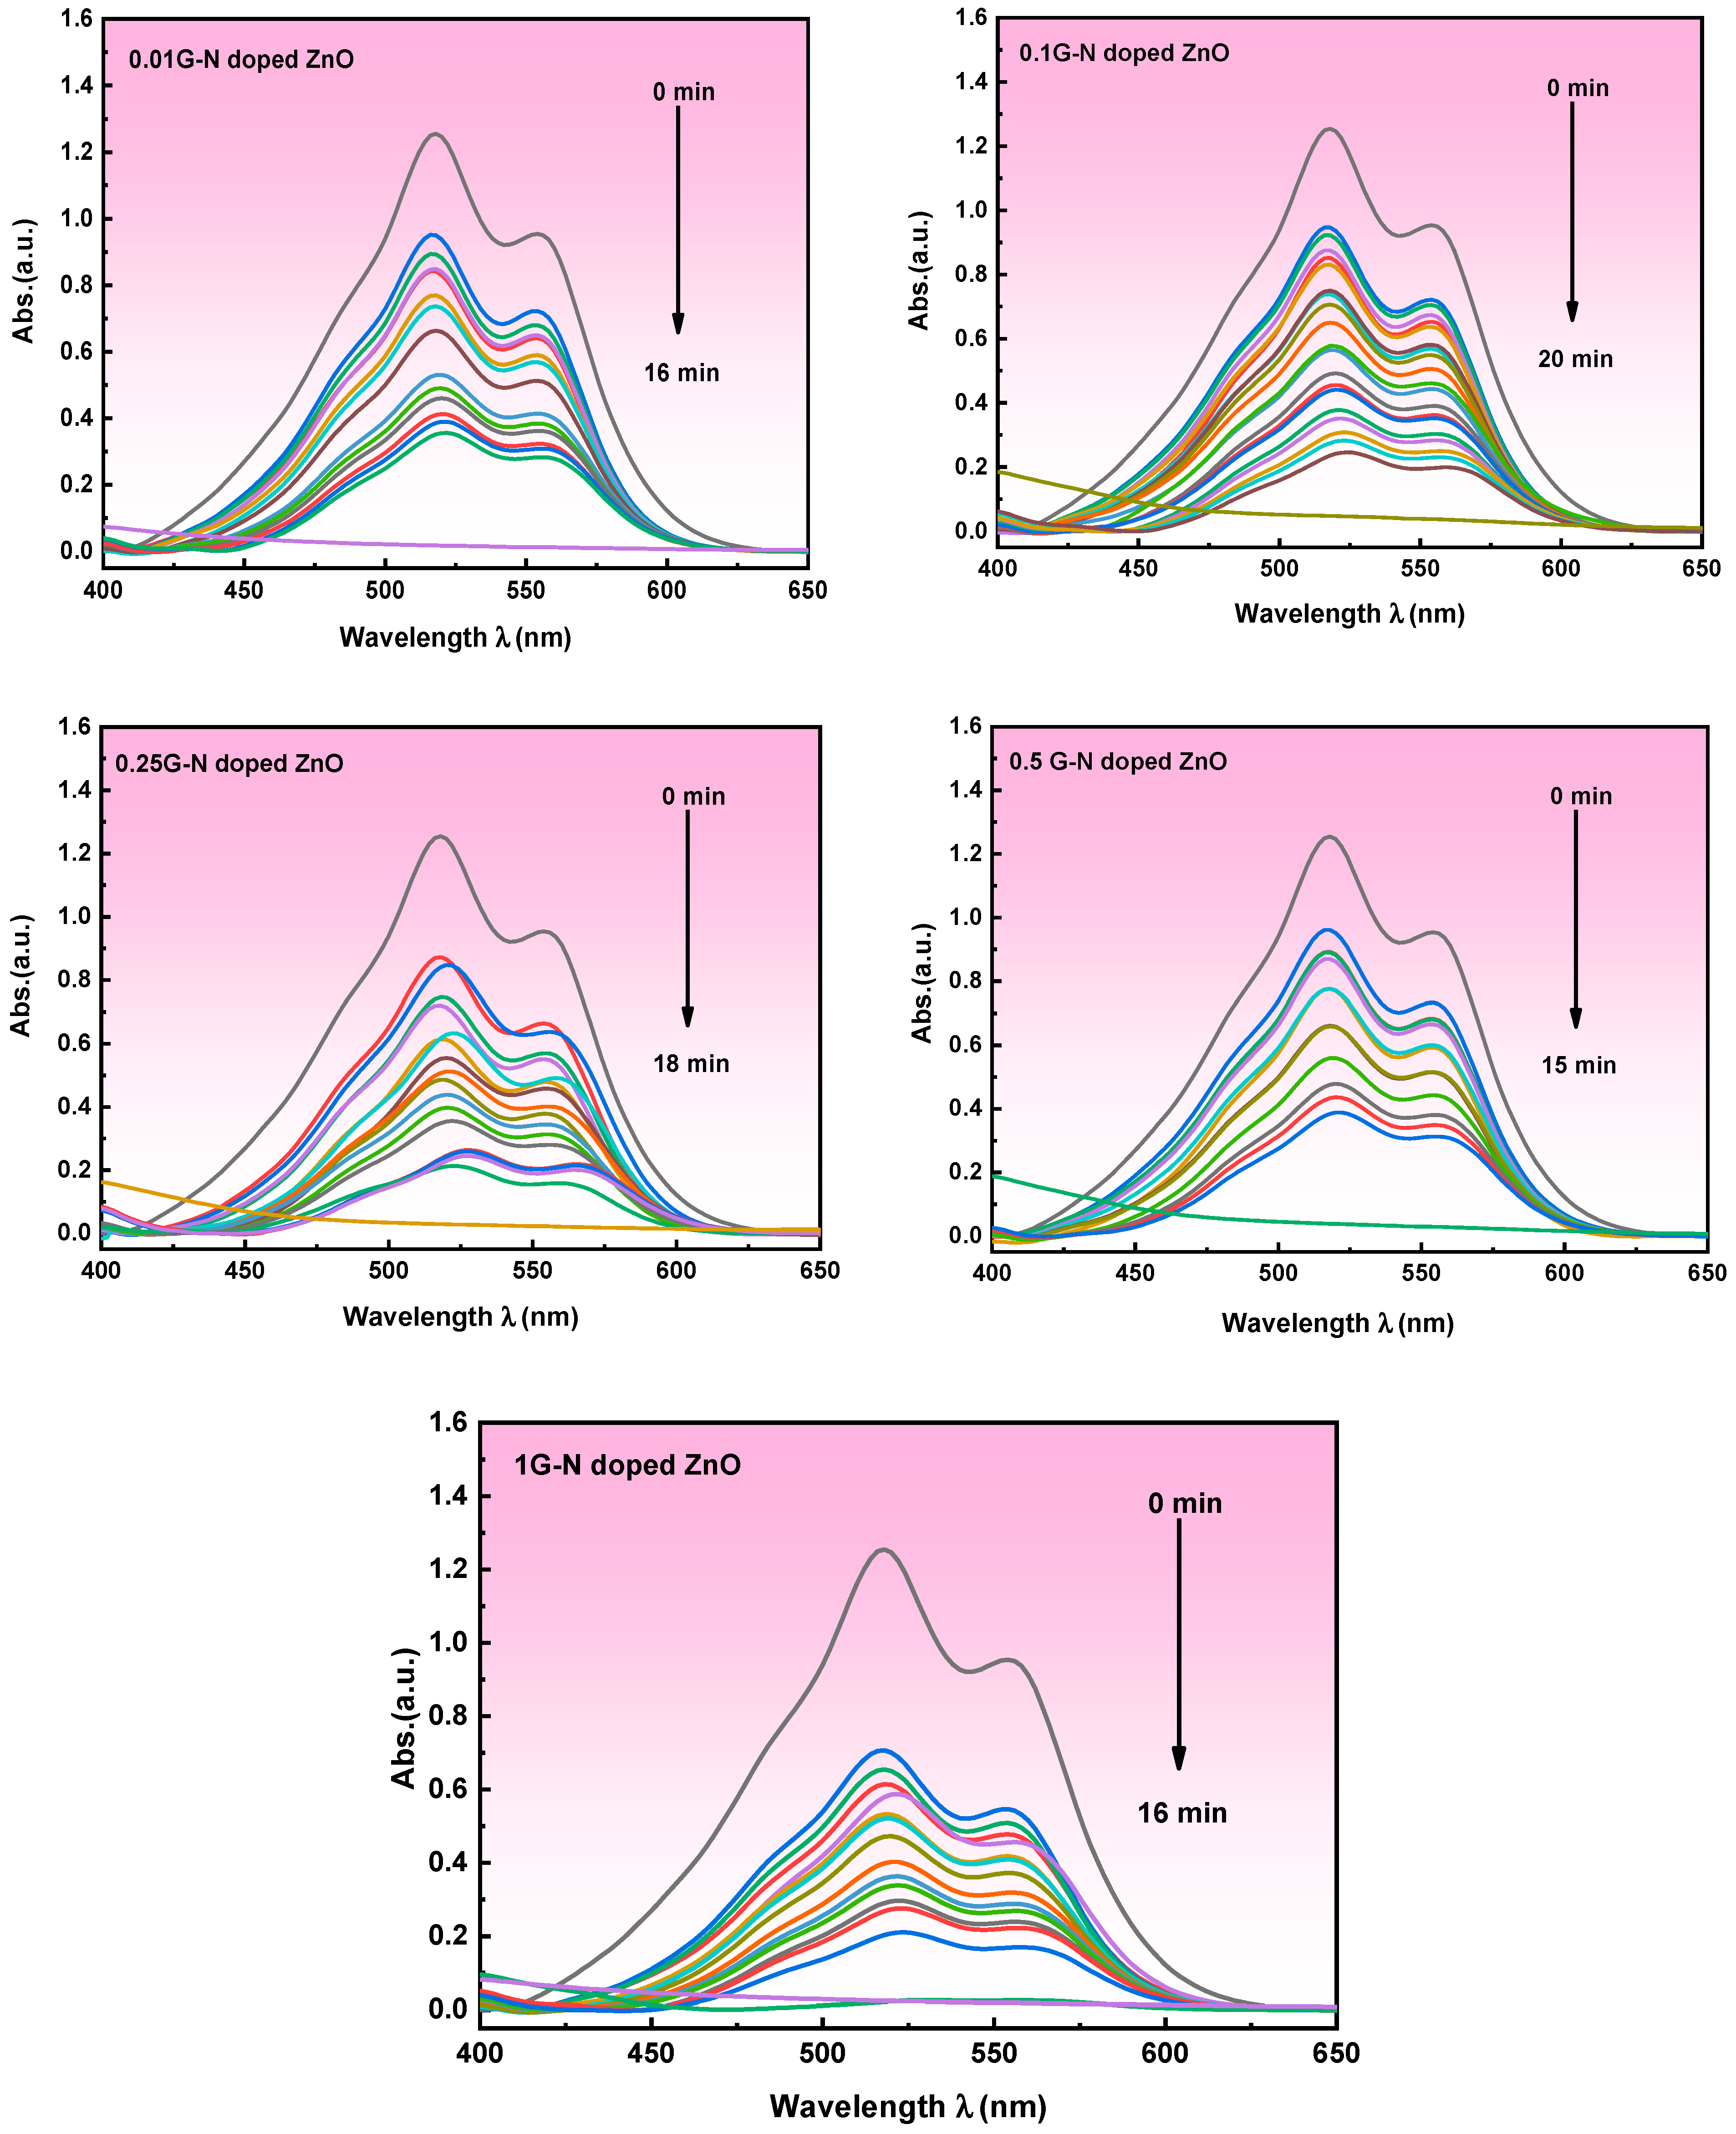
3.5.1. Photocatalytic Degradation of Carmine

Figure 4 depicts absorbance spectra of photocatalytic degradation of carmine dye (2.5 × 10⁻⁴ M) under U.V.C. light irradiation in situ by N-doped ZnO and G/N-doped ZnO with different concentrations of graphene. The plots showed zero-time irradiation produced the highest absorbance peak for the carmine solution at 518 nm, 1.255. It was evident that as the irradiation duration increases, the intensity of all samples decreases, resulting in more significant carmine dye degradation.
After a time interval of 185 min, the nanocomposite containing 0.001 g of G/N-doped ZnO showed the best photodegradation effectiveness for degrading carmine, with a photodegradation efficiency of 66.76%. This result was attributed to 0.001 g of the G/N-doped ZnO morphology in the S.E.M. image. The presence of graphene layers leads to increased catalyst surface area, so the photocatalytic efficiency is enhanced. Additionally, it was discovered that increasing the amount of G beyond this inhibited photocatalytic activity. Due to excess G in the system, which causes increased light irradiation absorption and scattering, similar results have been seen [36]. Because only a tiny amount of light irradiation goes through the reaction mixture, only a small number of active catalyst sites are activated for photodegradation due to the scattering effect. Figure 5 illustrates constant rate values (K) of the carmine dye photodegradation reaction in the presence of N-doped ZnO and N-doped ZnO with varying concentrations of G. It is clear that 0.001 g of G/N-doped ZnO is the optimum sample for carmine degradation with a rate constant of 0.007 min−1 (as shown in Table 2).
The photocatalytic effectiveness of the obtained G/N-doped ZnO for the breakdown of dye molecules is exceptional compared to photocatalysts composed of the nanomaterials already reported (Table 3). For the RGO-N-ZnO catalyst irradiated with visible light, M. Suresh et al. [29] recorded a 98.5% degradation for M.B. dye (10 ppm) at 120 min. Nitrogen doping increased the photocatalytic activity of pure ZnO. According to H. Sudrajat et al. [37], 10 mg/L M.B. could be degraded in 2 h under 11.3 Klux visible light irradiation at pH = 7 by 2 g/L N-ZnO. Eswaran et al. [27] used a hydrothermal approach to make nitrogen-doped zinc oxide nanoparticles with a cabbage-like morphology (N-ZnONCBs). The N-ZnONCB catalyst showed improved photodegradation efficiency (98.6% and 96.2%) using UV and visible light sources.
Atul B et al. [38] prepared N-doped ZnO nanoparticles using the microemulsion meth, and the sample showed complete degradation of M.G. solution in 90 min. According to Rowshon Kabir et al. [31], photocatalytic degradation percentages for 5 and 10 mg/L M.B. dye solution with 7 wt% N/ZnO are 93.70% and 98.11%, respectively. N-ZnO immobilized G.O. nanosheets with various G.O. weight percentages, C.N. Peter et al. [39]. The improved photocatalytic performance of the N-ZnO-GO composites in the visible range can be attributed to the combined actions of nitrogen and G.O. on ZnO nanoparticles. K. Huang et al. [36] synthesized N-doped ZnO photocatalyst using the mechanochemical technique and demonstrated excellent photocatalytic activity for the degradation of M.B. when exposed to visible light. Under visible light, the MO dye was degraded by the N–ZnO N.P.s after about 100 min, according to Shibin Sun [30]. Nathir A et al. [34] noticed that catalytic activity of 84% was achieved in the presence of 3.125% GO-ZnO as a catalyst under sunlight irradiation after an irradiation time of 90 min. Moreover, adding Ag into GO−ZnO leads to complete degradation of M.B. after sunlight irradiation for 40 min.

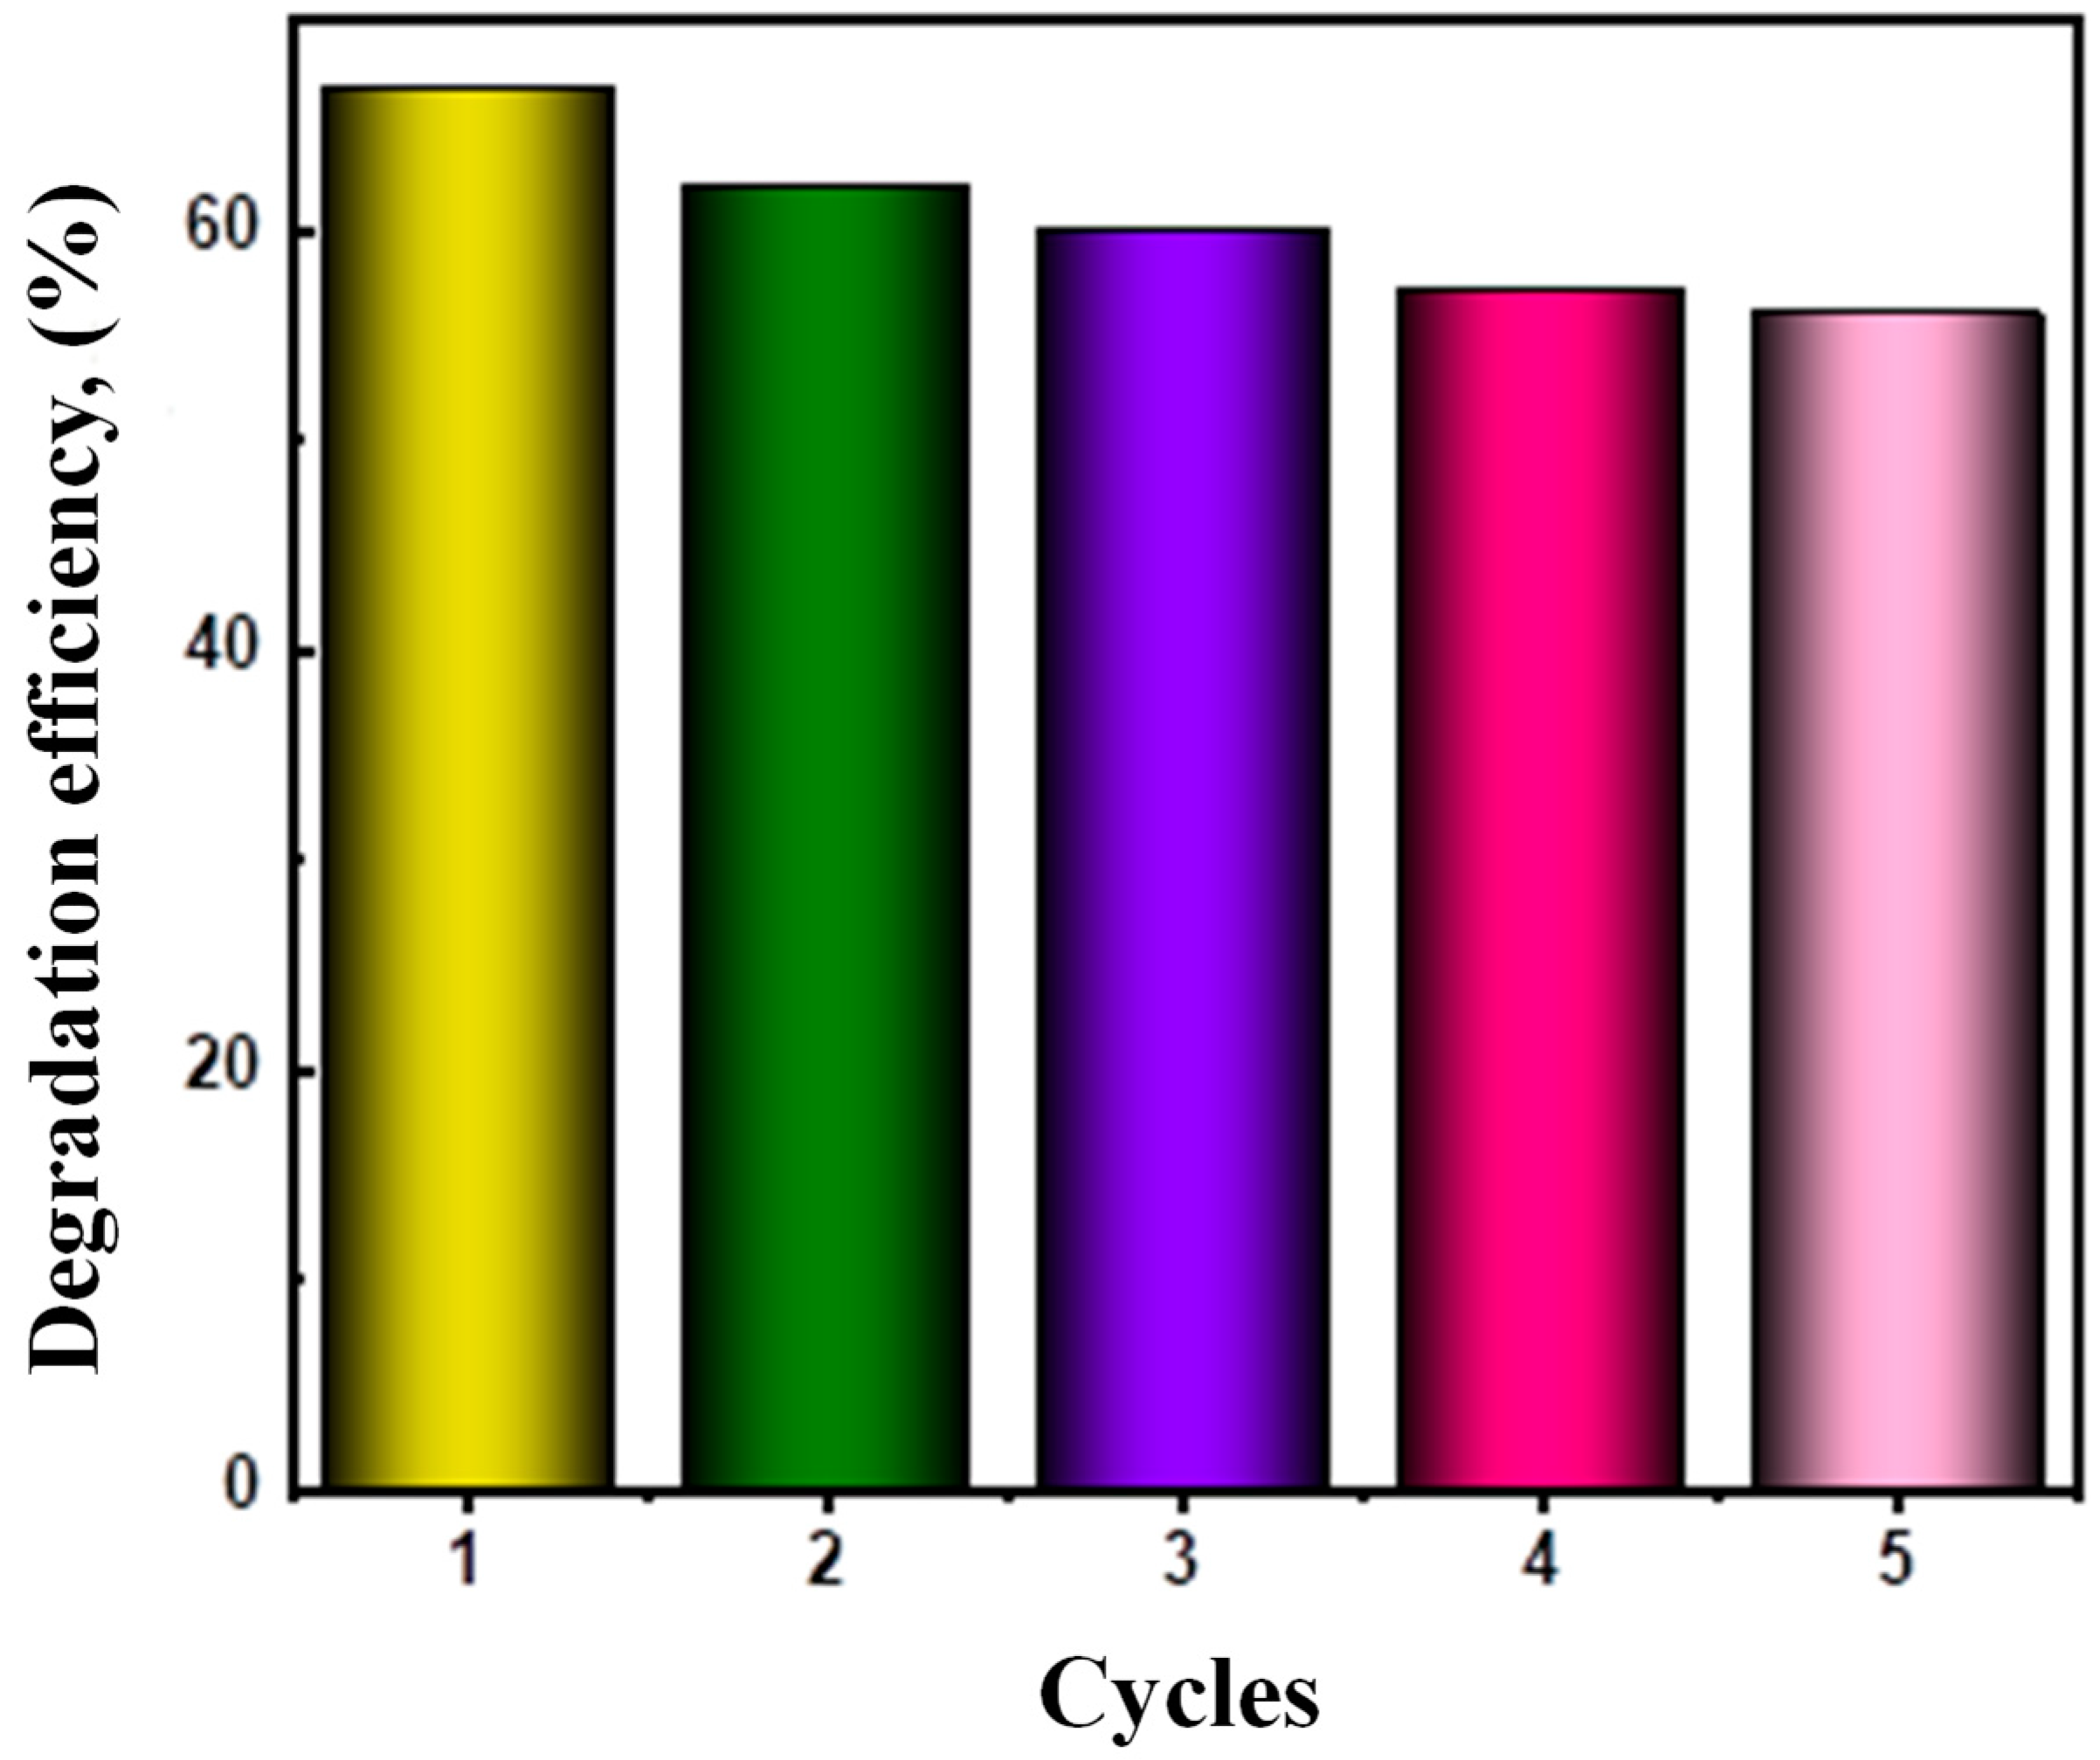
Reusability and Stability

In practical applications, the photostability of a photocatalyst is an essential feature. The synthesized G/N-doped ZnO photocatalyst was exposed to five photocatalytic trial runs to determine its photostability by adding the reused photocatalyst to new carmine solutions under the same experimental conditions. The photocatalyst was reused after centrifugation without regeneration. Figure 6 depicts the recycling of 0.001 G/N-doped ZnO nanostructures. It was found that, in five successive experimental runs, photocatalyst activity reached 60% of carmine degradation, which promotes the prepared samples for its photocatalytic performance in environmental treatment.

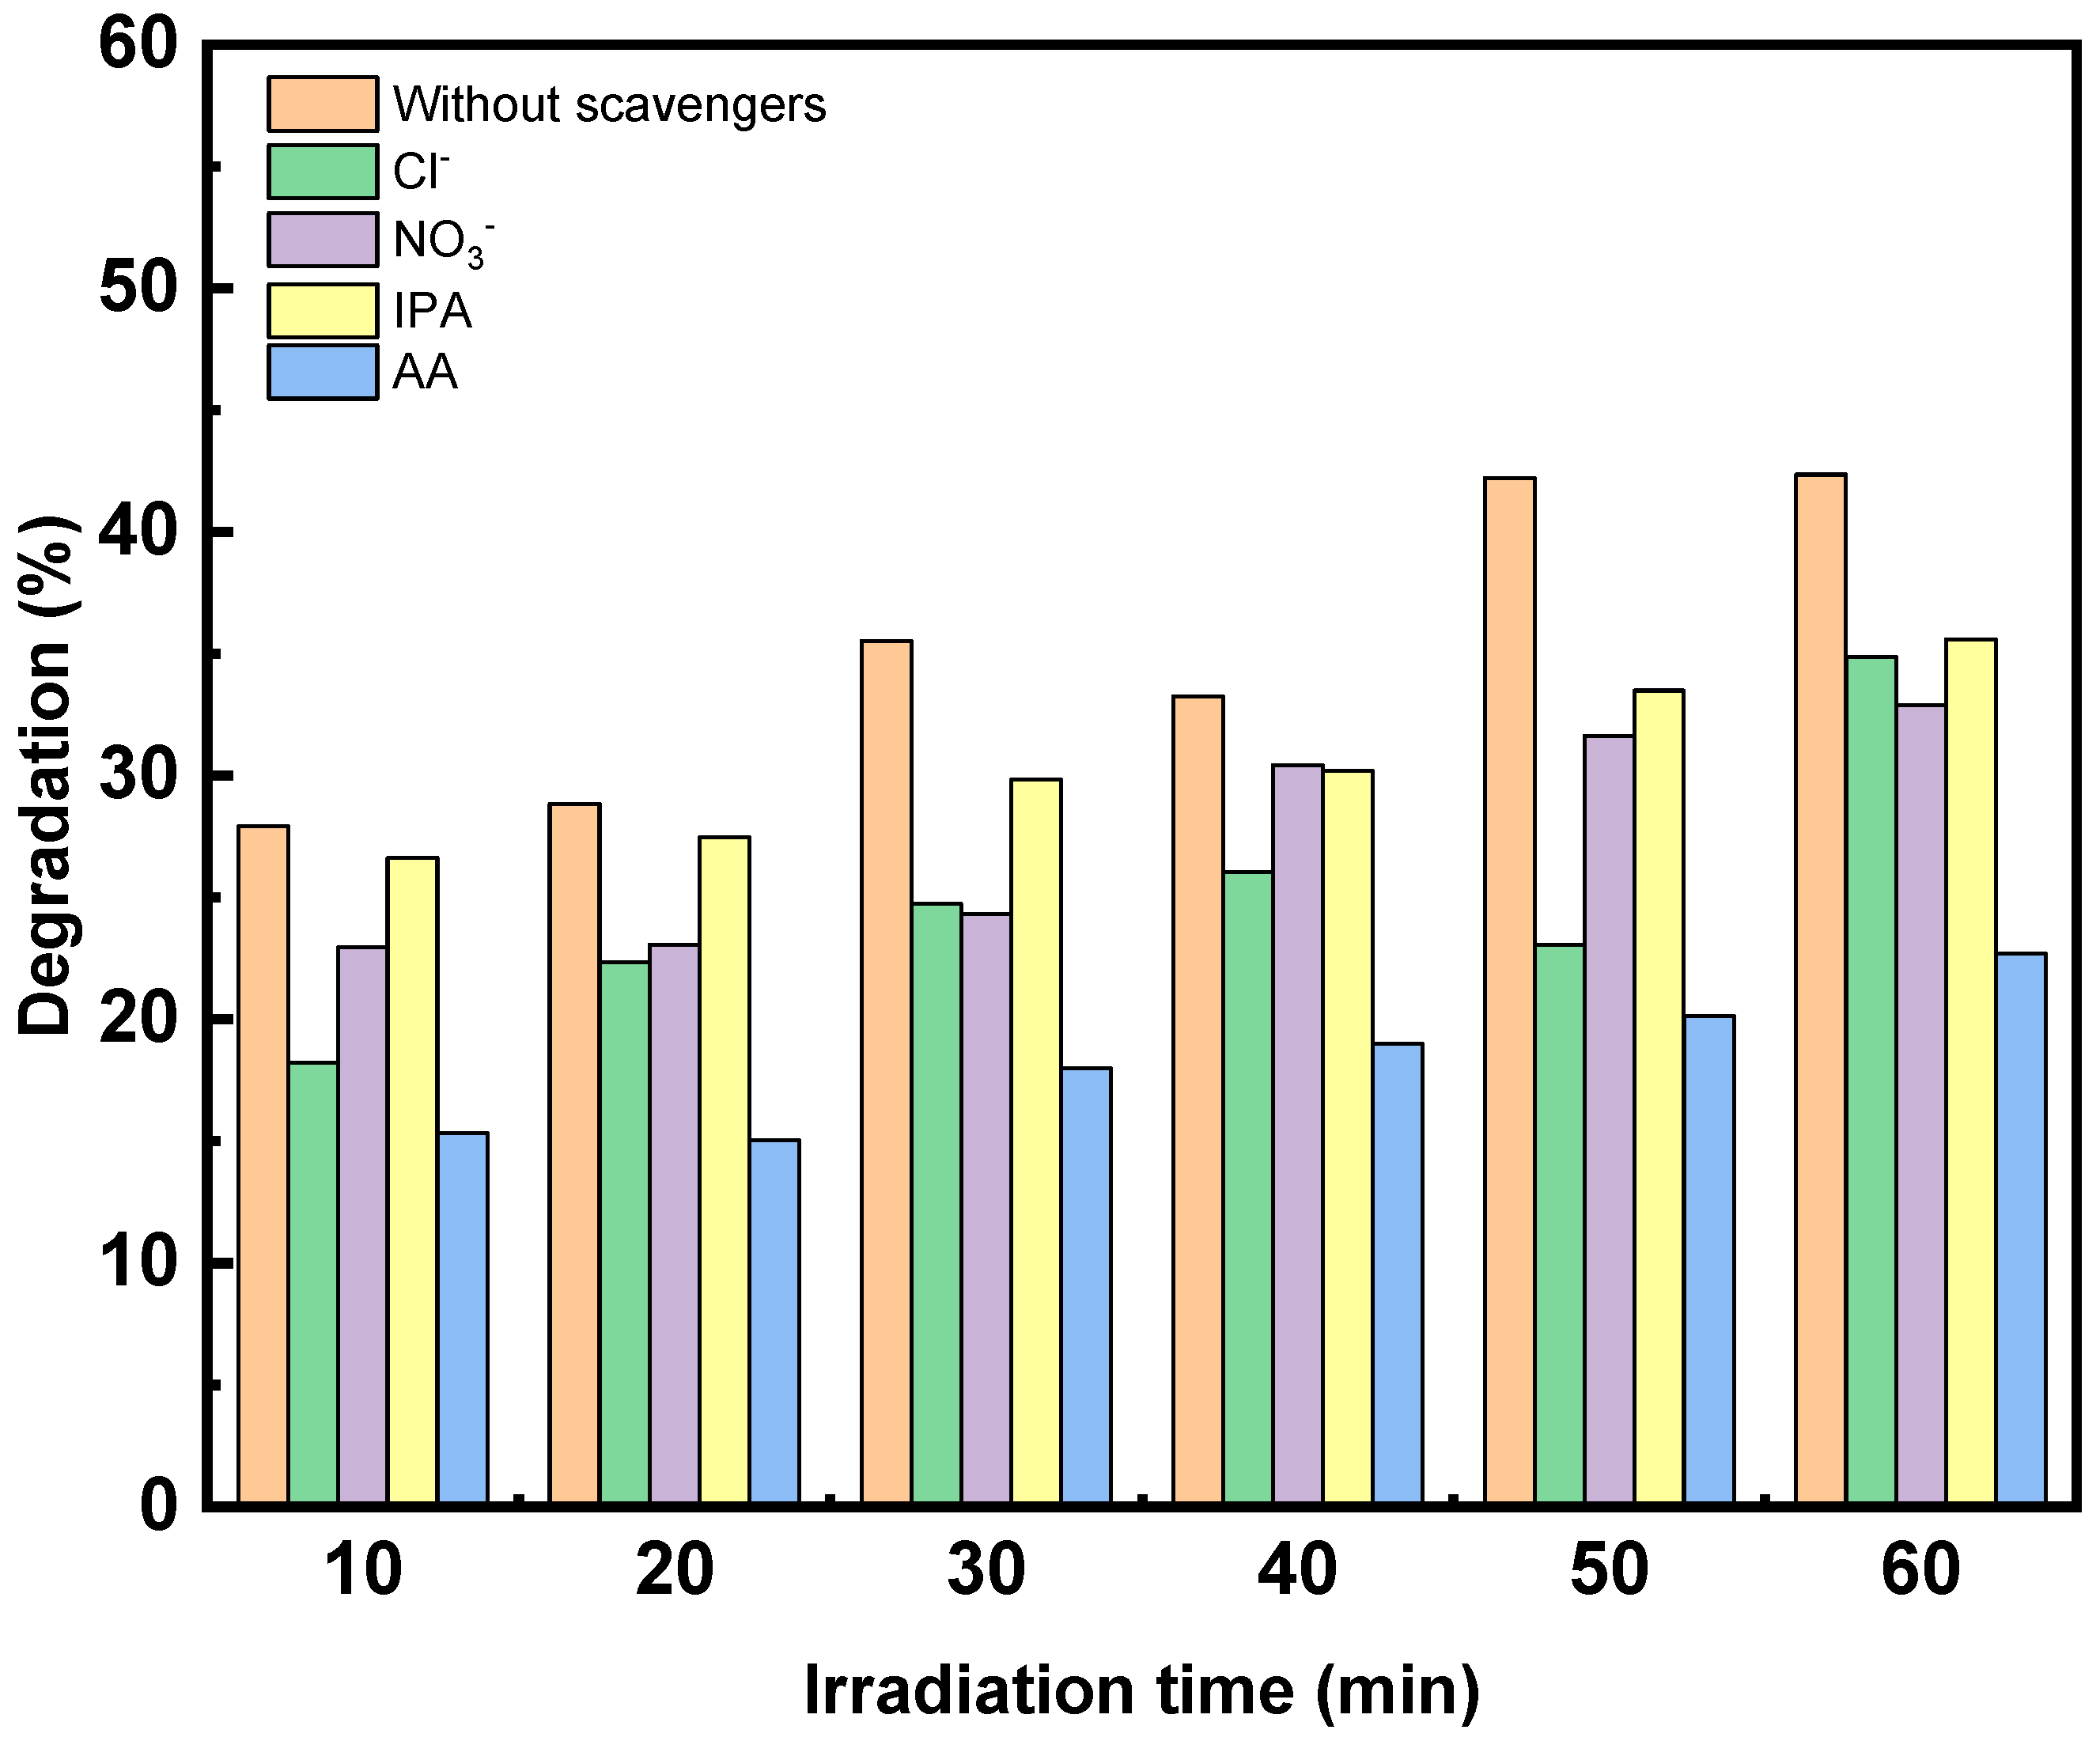
Influence of Radicals Scavengers on the Photocatalytic Activity

The reactive species trapping experiments are required to identify the mechanism of high photocatalytic activity of the G/N-doped ZnO catalyst. Figure 6 depicts the influence of radicals’ scavengers on the percentage of degradation of carmine dye in the presence of 0.001 g of G/N-doped ZnO under UV light irradiation. The scavengers applied such as NaCl for h + , NaNO3 for e , I.P.A. for OH [40], and ascorbic acid for O 2 . The results in Figure 7 show carmine contaminant destruction of about 34.8, 32.8, 35.5, and 22.70%, applying NaCl, NaNO3, I.P.A., and ascorbic acid scavengers. The O 2 is most effective in removing pollutants.

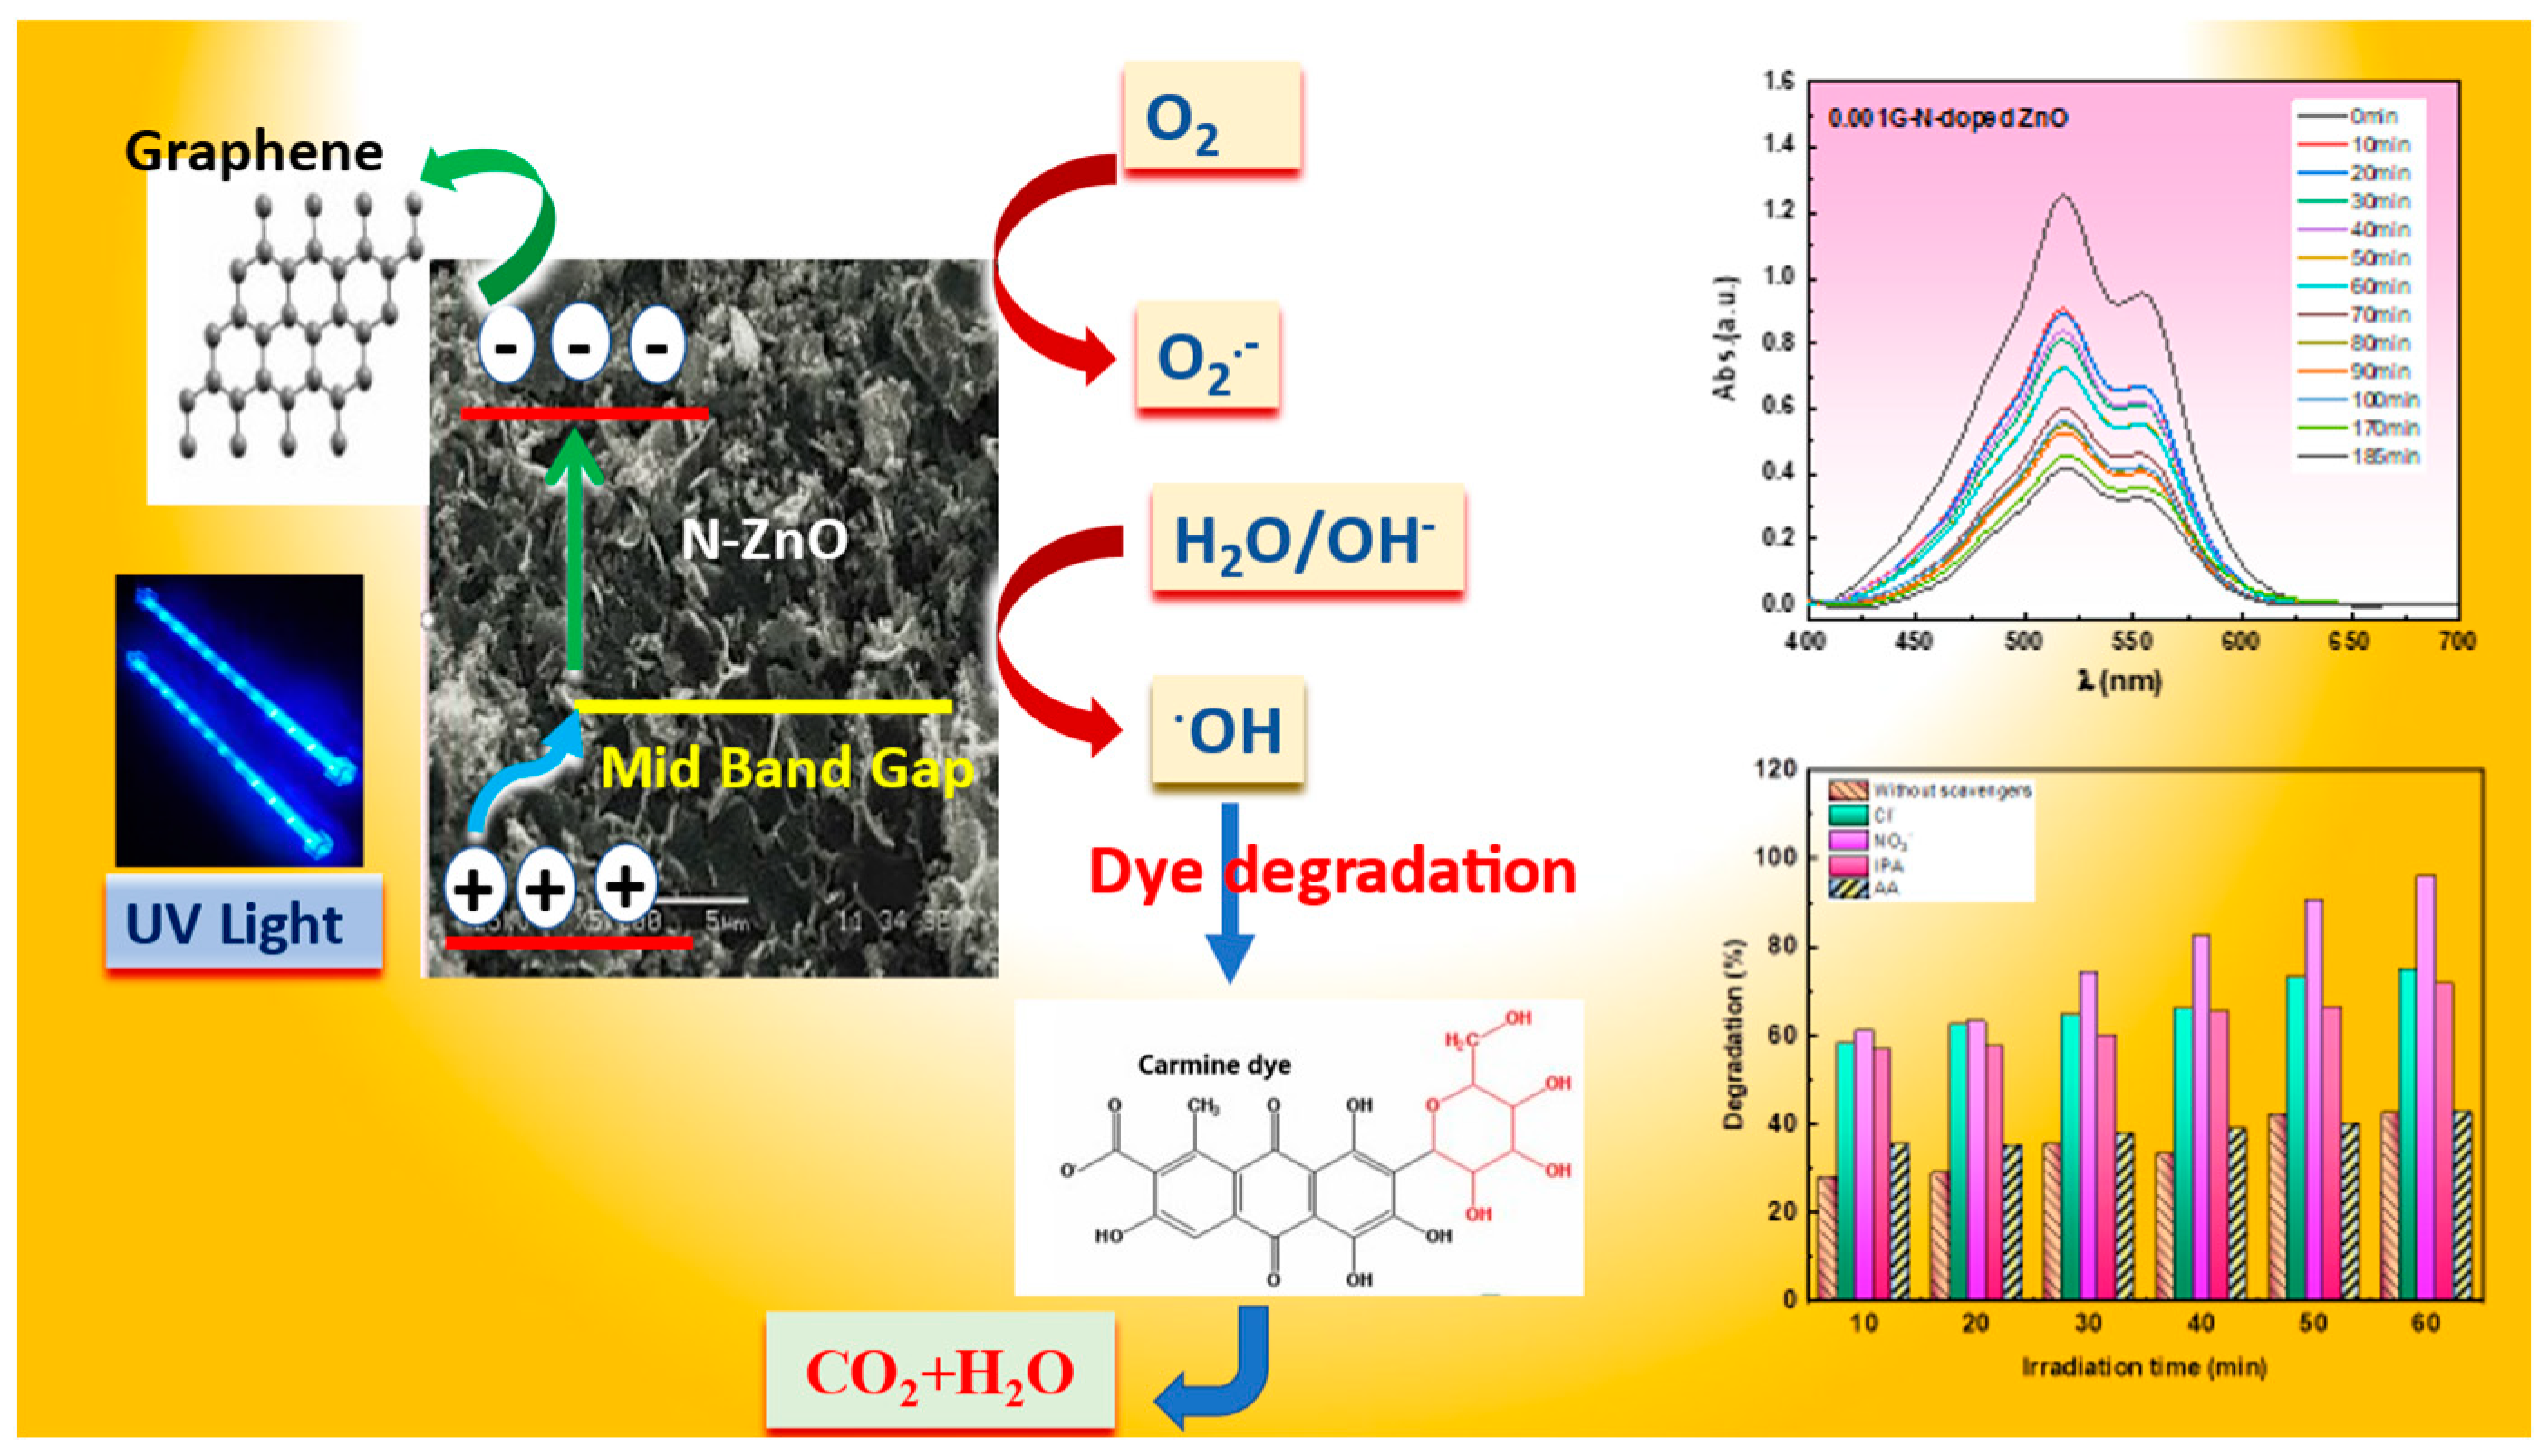
Mechanism of the Photocatalyst of Carmine Dye Degradation

The produced photocatalyst’s mechanism has been clarified and is depicted in Scheme 4.
When photons are exposed to light, electrons in the valance band are driven to the conduction band (C.B.), having left holes with a positive charge in the valance band (V.B.) [41]. The bandgap energy of the prepared G/N-doped ZnO is lowered due to the existence of mid-band gap levels produced by the 2p orbitals of N. Because the bandgap energy is lower, the excited electrons in the C.B. could recombine with the holes in the V.B. However, in the current system, the C.B. excited electrons are easily transported to the G due to G. This inhibits electron-hole recombination and ensures effective charge separation. As a result, the V.B. holes are now permitted to react with water molecules, constantly generating O.H. radicals in the reaction system. When photoexcited electrons combine with oxygen, superoxide radical anions occur in the reaction media, producing hydroxyl radicals. The hydroxyl radicals had are tremendously powerful oxidizing agents that can oxidize and degrade organic compounds in the solution. The presence of organic moieties is steadily degraded due to the continual generation of radicals in the reaction media. The dye molecules are first split into smaller molecules, subsequently fully oxidized, yielding carbon dioxide and water as the final products. Equations (7)–(12) represent the reactions included in the degradation process:
N ZnO   nanocomposites + h υ e C B + h V B +
e C B + Graphene Graphene ( e C B )
Graphene ( e C B ) + O 2 O 2
O 2 + H + OOH + OH
h V B + + H 2 O OH + H +
carmine   dye + OH CO 2 + H 2 O

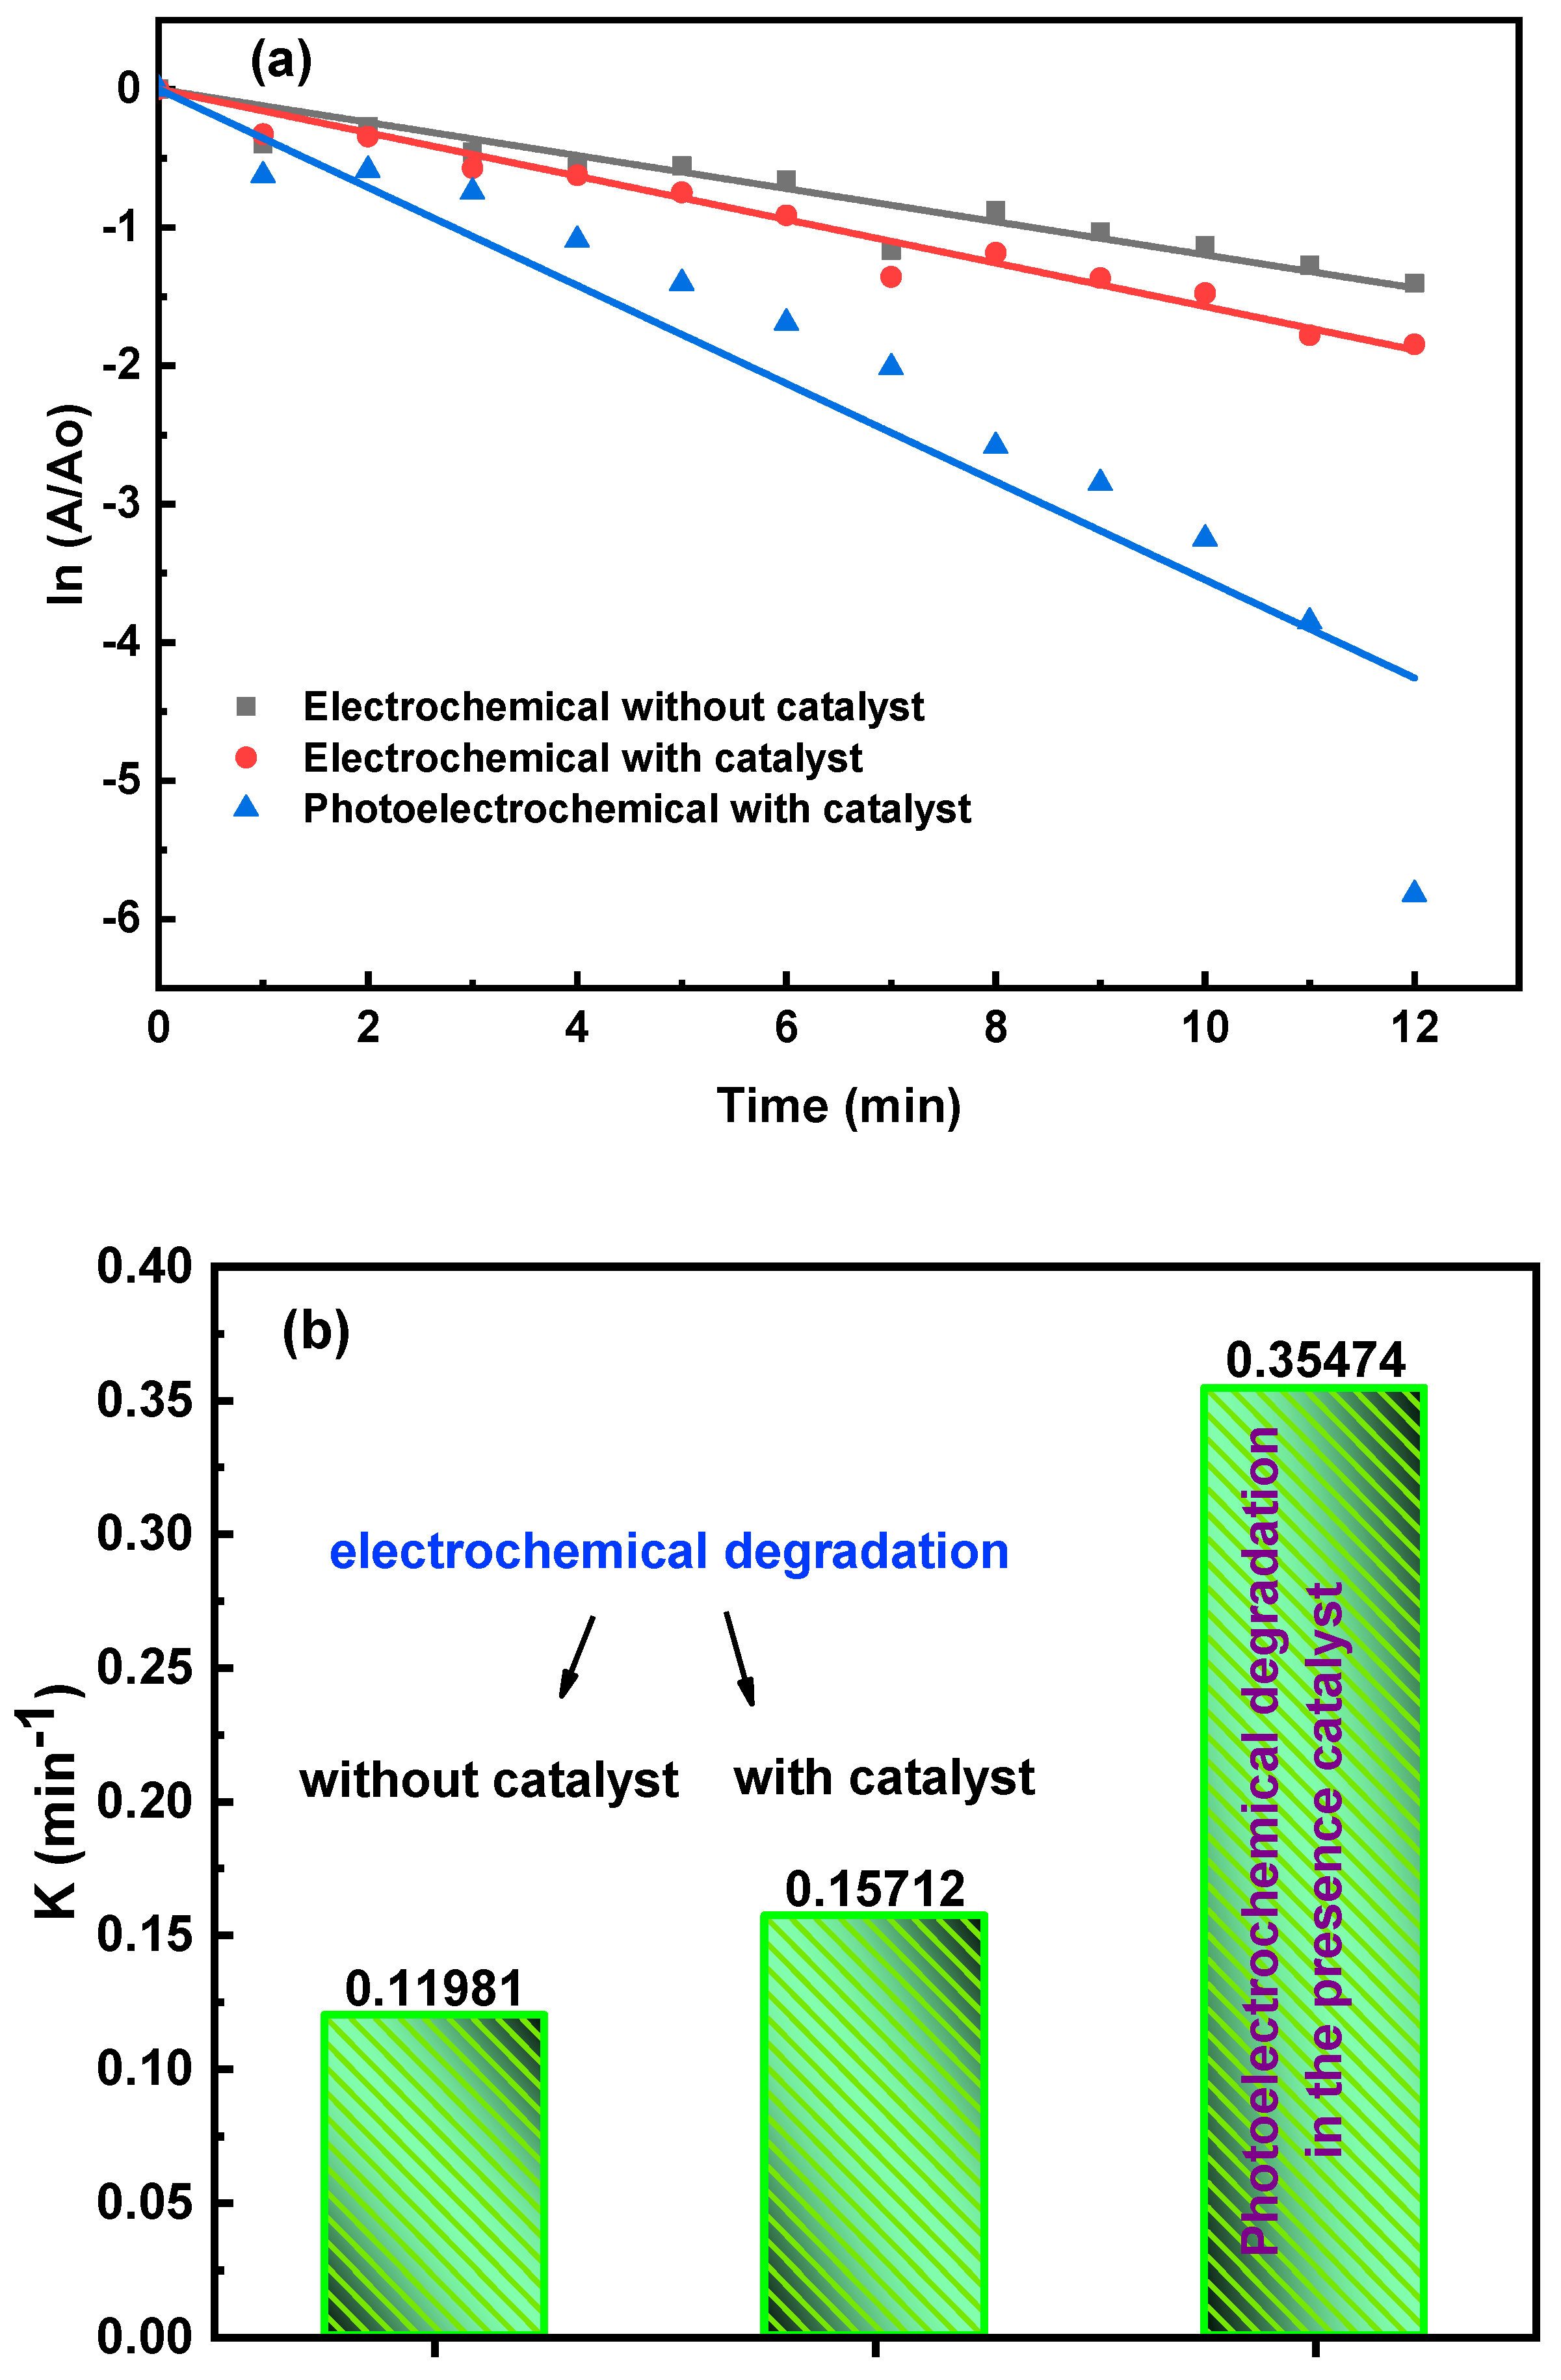
3.5.2. Indirect Electrochemical Degradation of Carmine Dye

Electrochemical treatment has garnered greater attention in recent years because of its unique qualities, such as adaptability, energy efficiency, automation, and cost-effectiveness [41]. The main reagent in electrochemical procedures is the electron, sometimes known as the “Clean Reagent”, which degrades all organics in the effluent without producing any secondary pollutants or by-products/sludge. The type of electrochemical oxidation is applied in this study was indirect electro-oxidation. In the presence of N-doped ZnO and G/N-doped ZnO with varying concentrations of graphene, the absorbance spectra of indirect electrochemical degradation of carmine dye are shown in Figure 8. It can be seen in Figure 8 that the peak intensity of carmine dye progressively drops as time passes, eventually reaching near zero for all samples at different times. This means that no by-products were formed during the degradation of the carmine dye.
Figure 9 illustrates the rate constant values (K) of the carmine dye indirect electrochemical degradation reaction in the presence of N-doped ZnO and N-doped ZnO with varying concentrations of G after 15 min. It is clear that 0.001 g of G/N-doped ZnO is the optimum sample for carmine degradation with degradation efficiency (100%) and rate constant (0.2029 min−1), then electro degradation decreases (as shown in Table 2).

Mechanism of Indirect Electrochemical Oxidation of Carmine Dye Degradation

In the electrochemical oxidation of wastewater, a sophisticated process, the electron transfer reaction is linked with a dissociative chemisorption stage. On anodes with high electrocatalytic activity, oxidation occurs directly on the electrode surface; on metal oxide electrodes, oxidation occurs via a surface mediator on the anodic surface, where products are continuously generated (indirect electrolysis). Indirect electro-oxidation uses sodium or potassium chloride salts to increase the conductivity of wastewater and generate hypochlorite ions [42]. The anodic oxidation of chloride ions to produce chlorine has the following formula:
2 Cl Cl 2 + 2 e
The liberated chlorine forms hypochlorous acid
Cl 2 + H 2 O H + + Cl + HOCl
and further dissociates to give the hypochlorite ion.
HOCl H + + OCl
The generated hypochlorite ions act as the main oxidizing agent in the pollutant degradation, where the role of hypochlorite in the electrochemical treatment of dye effluent via chlorine generation is:
dye + OCl Cl + CO 2   + H 2 O

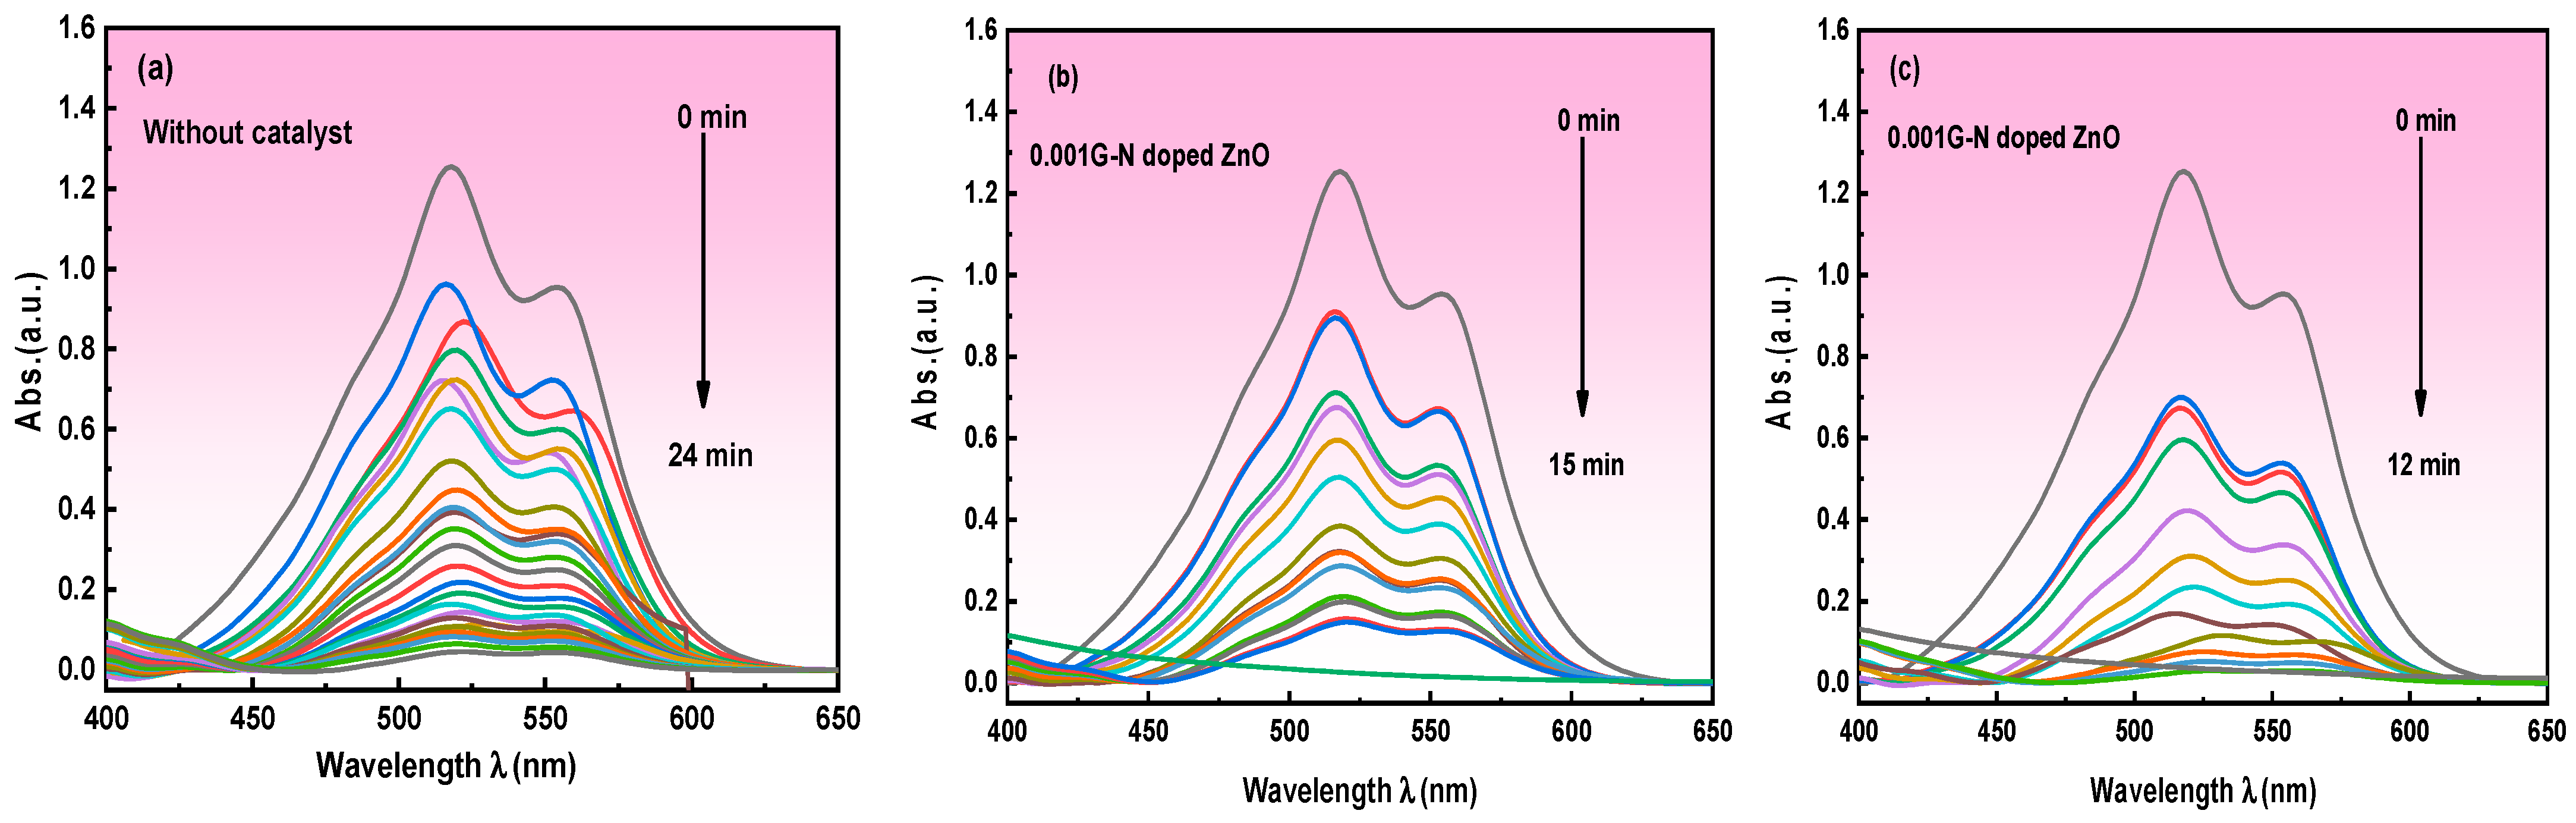
3.5.3. Photoelectrochemical Degradation (P.E.C.) of Carmine Dye

Organic dyes can be effectively degraded by photoelectrochemical degradation. The efficiency of the photoelectrochemical degradation process is determined by the electrode potential and preparation conditions of the semiconductors involved and the choice of appropriate supporting electrolyte and pH values [43]. Figure 10 depicts the electrocatalytic performance (a) in the absence of a catalyst, (b) in the presence of a catalyst (0.001 g of G/N-doped ZnO nanocomposite), and (c) the photoelectrocatalytic performance in the presence of 0.001 g of G/N-doped ZnO of carmine dye under an irradiating 50-watt UV lamp at a constant voltage of 10 V. From Figure 10c, it was evaluated that the carmine dye was completely degraded with irradiation time at 12 min. This result revealed that electrons generated by the excitation of 0.001 of G/N-doped ZnO with a faster flow rate; thus, the photodegradation of carmine occurred.
According to the experimental data, the presence of electrolytes does not affect the photocatalytic efficiency of the G/N-doped ZnO nanocomposite for the degradation of the dye. As a result, even if industrial effluents contain significant levels of electrolytes, the produced nanocomposite photocatalyst might be used to treat them.
Figure 11 reveals (a) kinetic plots and (b) the rate constants (K) of the electrochemical degradation reaction of carmine in the absence of the catalyst, in the presence of 0.001 g of G/N-doped ZnO, and the photoelectrochemical degradation reaction of carmine in the presence of 0.001 g of G/N-doped ZnO nanocomposite. The results showed that the photoelectrochemical degradation of carmine by the 0.001 g of G/N-doped ZnO was the fastest kinetics with a rate constant of 0.3547 min−1, which is more than three times the rate constant for the electrochemical degradation of carmine in the presence of the same catalyst (K = 0.15712 min−1). Meanwhile, the electrochemical degradation of carmine in the absence of the catalyst has a lower value of the rate constant (0.1198 min−1).

Mechanism of Photoelectrochemical Oxidation of Carmine Dye Degradation

The following describes the photoelectrochemical degradation process: 0.001 g of the G/N-doped ZnO nanocomposite under UV–visible light acts as a catalyst to produce electron–hole pairs. Under the influence of an applied electric field, photogenerated holes in the valence band of semiconductor nanoparticles move through interconnected semiconductor particles to the semiconductor particle–solution interface to oxidize Cl ions. The Cl and Cl2•− radicals formed can contribute to the decomposition of dye molecules adsorbing in the solution or on the surface of the electrode. At the same time, photogenerated electrons in the conduction band migrate through linked semiconductor particles to the substrate, where they are extracted as anodic photocurrents [43].
The following is the mechanistic approach for the degradation of carmine dye on 0.001 g of the G/N-doped ZnO nanocomposite [43].
G / N   doped   ZnO   nanocomposites + h υ + e C B + h V B +
h V B + ( holes   in   space   charge   layer ) h s + ( trapped   holes   at   catalyst   surface )
h s + + OH a d OH a d + H +
h s + + Cl a d Cl a d
Cl a d + Cl a d Cl 2   a d
h s + + dye Products
OH a d + dye Products
Cl 2   a d + dye Products
Orange II dye degradation by photoelectrochemistry is quick and more effective than photocatalytic degradation using nanostructured WO3 film electrodes, according to Jin Luo et al. [43], and the degradation rate of orange II dye in solution with Cl ions is more than in other forms of media. The generation of extra reactive species such OCl from the electrolyte in the presence of ZnO was hypothesized as the reason for the faster rate of electro-oxidation of methylene blue over the materials compared to photo-oxidation. According to Allami et al. [44], the improved photoelectrochemical performance of ZnO films produced in a nitrogen atmosphere as an electrode could result from higher mobility of the majority of charge carriers and decreased electron/hole (e/h+) pair recombination.

4. Conclusions

The combustion method was used to synthesize novel G/N-doped ZnO nanocomposites successfully. XRD, FT-IR, and SEM analyses were used to characterize the G/N-doped ZnO nanocomposite. The prepared nanocomposite had high crystalline hexagonal wurtzite ZnO structures according to XRD results, and this finding was further validated by FTIR. The presence of graphene may increase the surface area of the 0.001 g of G/N-doped ZnO nanocomposites, increasing its photocatalytic effectiveness. Under UV light irradiation, the photocatalytic activity of the produced G/N-doped ZnO nanocomposites photocatalyst for carmine dye degradation was investigated. Under UV light irradiation by 0.001 g of G/N-doped ZnO nanocomposites, a maximum of 66.76% degradation of carmine dye was observed at 185 min. The higher photocatalytic performance of as-generated nanocomposites can be connected to the development of intermediate levels in the prohibited bandgap energy and the increased oxygen vacancies due to nitrogen doping. The results provided in this paper offer interesting comparisons between photocatalytic, indirect electrochemical oxidation, and photoelectrochemical oxidation. It has been concluded that photoelectrochemical carmine dye degradation is faster and more effective than photocatalytic carmine dye degradation.

Author Contributions

Conceptualization, F.E.-S., M.S.A.H. and I.S.Y.; methodology, T.H.A., A.I. and H.Y.Z. formal analysis, M.S.A.-w., Y.K. and T.E.A.; investigation, M.A.I. and I.S.Y.; writing—original draft preparation, F.E.-S., M.S.A.H. and M.S.A.-w.; writing—review and editing, I.S.Y. and M.A.I.; visualization, H.Y.Z., M.S.A.-w. and T.E.A.; funding acquisition, I.S.Y. and H.Y.Z. All authors have read and agreed to the published version of the manuscript.

Funding

The authors express their appreciation to the Deputyship for Research and Innovation, Ministry of Education, in Saudi Arabia, for funding this research work through the project number: (IFP-KKU-2020/10).

Institutional Review Board Statement

Not applicable.

Informed Consent Statement

Not applicable.

Data Availability Statement

Data are contained within the article.

Conflicts of Interest

The authors declare no conflict of interest.

References

  1. Barka, N.; Assabbane, A.; Nounah, A.; Ichou, Y.A. Photocatalytic degradation of indigo carmine in aqueous solution by TiO2-coated non-woven fibres. J. Hazard. Mater. 2008, 152, 1054–1059. [Google Scholar] [CrossRef]
  2. Rauf, M.A.; Ashraf, S.S. Fundamental principles and application of heterogeneous photocatalytic degradation of dyes in solution. J. Chem. Eng. 2009, 151, 10–18. [Google Scholar] [CrossRef]
  3. Dapson, R.W. The history, chemistry and modes of action of carmine and related dyes. Biotech. Histochem. 2007, 82, 173–187. [Google Scholar] [CrossRef]
  4. Kapałka, A.; Fóti, G.; Comninellis, C. Basic principles of the electrochemical mineralization of organic pollutants for wastewater treatment. In Electrochemistry for the Environment; Springer: Berlin, Germany, 2010. [Google Scholar] [CrossRef]
  5. Muruganandham, M.; Swaminathan, M. Photochemical oxidation of reactive azo dye with UV-H2O2 process. Dyes Pigment. 2004, 62, 269–275. [Google Scholar] [CrossRef]
  6. Akpan, U.G.; Hameed, B.H. Parameters affecting the photocatalytic degradation of dyes using TiO2-based photocatalysts: A review. J. Hazard. Mater. 2009, 170, 520–529. [Google Scholar] [CrossRef]
  7. Zhou, M.; He, J. Degradation of cationic red X-GRL by electrochemical oxidation on modified PbO2 electrode. J. Hazard. Mater. 2008, 153, 357–363. [Google Scholar] [CrossRef]
  8. Fukunaga, M.T.; Guimarães, J.R.; Bertazzoli, R. Kinetics of the oxidation of formaldehyde in a flow electrochemical reactor with TiO2/RuO2 anode. J. Chem. Eng. 2008, 136, 236–241. [Google Scholar] [CrossRef]
  9. Harikishore, M.; Sandhyarani, M.; Venkateswarlu, K.; Nellaippan, T.A.; Rameshbabu, N. Effect of Ag Doping on Antibacterial and Photocatalytic Activity of Nanocrystalline TiO2. Procedia Mater. Sci. 2014, 6, 557–566. [Google Scholar] [CrossRef] [Green Version]
  10. Li, X.; Pletcher, D.; Walsh, F.C. Electrodeposited lead dioxide coatings. Chem. Soc. Rev. 2011, 40, 3879–3894. [Google Scholar] [CrossRef] [Green Version]
  11. Hassanvand, A.; Sohrabi, M.; Royaee, S.J.; Jafarikajour, M. Preparation and characterization of nitrogen doped TiO2 nanoparticles as an effective catalyst in photodegradation of phenol under visible light. In Advanced Materials Research; Scientific.Net: Baech, Switzerland, 2014. [Google Scholar] [CrossRef]
  12. Casbeer, E.; Sharma, V.K.; Li, X.Z. Synthesis and photocatalytic activity of ferrites under visible light: A review. Sep. Purif. Technol. 2012, 87, 1–14. [Google Scholar] [CrossRef]
  13. Janssen, L.J.J.; Koene, L. The role of electrochemistry and electrochemical technology in environmental protection. J. Chem. Eng. 2002, 85, 137–146. [Google Scholar] [CrossRef]
  14. Kant, R.; Dwivedi, C.; Pathak, S.; Dutta, V. Fabrication of ZnO nanostructures using Al doped ZnO (AZO) templates for application in photoelectrochemical water splitting. Appl. Surf. Sci. 2018, 447, 200–212. [Google Scholar] [CrossRef]
  15. Hussain, S.; Steter, J.R.; Gul, S.; Motheo, A.J. Photo-assisted electrochemical degradation of sulfamethoxazole using a Ti/Ru0.3Ti0.7O2 anode: Mechanistic and kinetic features of the process. J. Environ. Manag. 2017, 201, 153–162. [Google Scholar] [CrossRef]
  16. Sharma, V.; Prasad, M.; Ilaiyaraja, P.; Sudakar, C.; Jadkar, S. Electrodeposition of highly porous ZnO nanostructures with hydrothermal amination for efficient photoelectrochemical activity. Int. J. Hydrogen Energy 2019, 44, 11459–11471. [Google Scholar] [CrossRef]
  17. Salem, M.; Massoudi, I.; Akir, S.; Litaiem, Y.; Gaidi, M.; Khirouni, K. Photoelectrochemical and opto-electronic properties tuning of ZnO films: Effect of Cu doping content. J. Alloys Compd. 2017, 722, 313–320. [Google Scholar] [CrossRef]
  18. Qin, R.; Meng, F.; Khan, M.W.; Yu, B.; Li, H.; Fan, Z.; Gong, J. Fabrication and enhanced photocatalytic property of TiO2 -ZnO composite photocatalysts. Mater. Lett. 2019, 240, 84–87. [Google Scholar] [CrossRef]
  19. Mao, Y.; Li, Y.; Zou, Y.; Shen, X.; Zhu, L.; Liao, G. Solvothermal synthesis and photocatalytic properties of ZnO micro/nanostructures. Ceram. Int. 2019, 45, 1724–1729. [Google Scholar] [CrossRef]
  20. Qi, K.; Cheng, B.; Yu, J.; Ho, W. Review on the improvement of the photocatalytic and antibacterial activities of ZnO. J. Alloys Compd. 2017, 727, 792–820. [Google Scholar] [CrossRef]
  21. Reis, R.Y.N.; Lima, A.E.B.; Costa, M.J.S.; Cruz-Filho, J.F.; Moura, J.P.C.; Santos, R.S.; Luz, G.E. Enhanced photoelectrocatalytic performance of ZnO films doped with N2 by a facile electrochemical method. Surf. Interfaces 2020, 21, 100675. [Google Scholar] [CrossRef]
  22. Yu, W.; Zhang, J.; Peng, T. New insight into the enhanced photocatalytic activity of N-, C- and S-doped ZnO photocatalysts. Appl. Catal. B Environ. 2016, 181, 220–227. [Google Scholar] [CrossRef]
  23. Gionco, C.; Fabbri, D.; Calza, P.; Paganini, M.C. Synthesis, Characterization, and Photocatalytic Tests of N-Doped Zinc Oxide: A New Interesting Photocatalyst. J. Nanomat. 2016, 2016, 4129864. [Google Scholar] [CrossRef] [Green Version]
  24. Papageorgiou, D.G.; Kinloch, I.A.; Young, R.J. Mechanical properties of Graphene and graphene-based nanocomposites progress in materials science mechanical properties of graphene and graphene-based nanocomposites. Prog. Mater. Sci. 2017, 90, 75–127. [Google Scholar] [CrossRef]
  25. Choi, W.; Lahiri, I.; Seelaboyina, R.; Kang, Y.S. Synthesis of Graphene and its applications: A review. Crit. Rev. Solid State Mater. Sci. 2010, 35, 52–71. [Google Scholar] [CrossRef]
  26. Chen, C.S.; Cao, S.Y.; Zeng, B.; Ning, X.T.; Liu, T.G.; Chen, X.H.; Xiao, Y.; Yu, W.W. Synthesis and photocatalytic property of graphene/multi-walled carbon nanotube/ZnO nanocrystalline aggregates hybrids by spray drying method. Funct. Mater. Lett. 2014, 7, 2014. [Google Scholar] [CrossRef]
  27. Prabakaran, E.; Pillay, K. Synthesis of N-doped ZnO nanoparticles with cabbage morphology as a catalyst for the efficient photocatalytic degradation of methylene blue under U.V. and visible light. RSC Adv. 2019, 9, 7509–7535. [Google Scholar] [CrossRef] [Green Version]
  28. Segala, K.; Dutra, R.L.; Franco, C.v.; Pereira, A.S.; Trindade, T. In situ and Ex situ preparations of ZnO/poly-{trans- [RuCl 2(vpy)4]/styrene} nanocomposites. J. Braz. Chem. Soc. 2010, 21, 2010. [Google Scholar] [CrossRef] [Green Version]
  29. Suresh, M.; Sivasamy, A. Fabrication of graphene nanosheets decorated by nitrogen-doped ZnO nanoparticles with enhanced visible photocatalytic activity for the degradation of Methylene Blue dye. J. Mol. Liq. 2020, 317, 114112. [Google Scholar] [CrossRef]
  30. Sun, S.; Chang, X.; Li, X.; Li, Z. Synthesis of N-doped ZnO nanoparticles with improved photocatalytical activity. Ceram. Int. 2013, 39, 5197–5203. [Google Scholar] [CrossRef]
  31. Kabir, R.; Saifullah, M.A.K.; Ahmed, A.Z.; Masum, S.M.; Molla, M.A.I. Synthesis of n-doped zno nanocomposites for sunlight photocatalytic degradation of textile dye pollutants. J. Compos. Sci. 2020, 4, 49. [Google Scholar] [CrossRef]
  32. Hamdy, M.S.; Chandekar, K.v.; Shkir, M.; AlFaify, S.; Ibrahim, E.H.; Ahmad, Z.; Kilany, M.; Al-Shehri, B.M.; Al-Namshah, K.S. Novel Mg@ZnO nanoparticles synthesized by facile one-step combustion route for anti-microbial, cytotoxicity and photocatalysis applications. J. Nanostruct. Chem. 2021, 11, 147–163. [Google Scholar] [CrossRef]
  33. Elias, M.; Uddin, M.N.; Saha, J.K.; Hossain, M.A.; Sarker, D.R.; Akter, S.; Siddiquey, I.A.; Uddin, J. A highly efficient and stable photocatalyst; N-doped ZnO/C.N.T. composite thin film synthesized via simple sol-gel drop coating method. Molecules 2021, 26, 1470. [Google Scholar] [CrossRef] [PubMed]
  34. Al-Rawashdeh, N.A.F.; Allabadi, O.; Aljarrah, M.T. Photocatalytic activity of graphene oxide/zinc oxide nanocomposites with embedded metal nanoparticles for the degradation of organic dyes. ACS Omega 2020, 5, 28046–28055. [Google Scholar] [CrossRef] [PubMed]
  35. Ng, Y.H.; Iwase, A.; Bell, N.J.; Kudo, A.; Amal, R. Semiconductor/reduced graphene oxide nanocomposites derived from photocatalytic reactions. Catal. Today 2011, 164, 353–357. [Google Scholar] [CrossRef]
  36. Huang, K.; Li, Y.H.; Lin, S.; Liang, C.; Wang, H.; Ye, C.X.; Wang, Y.J.; Zhang, R.; Fan, D.Y.; Yang, H.J.; et al. A facile route to reduced graphene oxide-zinc oxide nanorod composites with enhanced photocatalytic activity. Powder Technol. 2014, 257, 113–119. [Google Scholar] [CrossRef]
  37. Sudrajat, H.; Babel, S. Photocatalytic Degradation of Methylene Blue Using Visible Light Active N-Doped ZnO. Adv. Mater. Res. 2015, 1101, 299–302. [Google Scholar] [CrossRef]
  38. Lavand, A.B.; Malghe, Y.S. Synthesis, characterization and visible light photocatalytic activity of nitrogen-doped zinc oxide nanospheres. Asian Ceram. Soci. 2015, 3, 305–310. [Google Scholar] [CrossRef] [Green Version]
  39. Peter, C.N.; Anku, W.W.; Sharma, R.; Joshi, G.M.; Shukla, S.K.; Govender, P.P. N-doped ZnO/graphene oxide: A photostable photocatalyst for improved mineralization and photodegradation of organic dye under visible light. Ionics 2019, 25, 327–339. [Google Scholar] [CrossRef]
  40. Modwi, A.; ben Aissa, M.A.; Taha, K.K.; Khezami, L.; El Ghoul, J.; Al-Ayed, A.S.; Bououdina, M. Fabrication of (Y2O3)n–ZnO nanocomposites by high-energy milling as potential photocatalysts. J. Mater. Sci. Mater Elect. 2021, 32, 3415–3430. [Google Scholar] [CrossRef]
  41. Morsi, M.S.; Al-Sarawy, A.A.; El-Dein, W.A.S. Electrochemical degradation of some organic dyes by electrochemical oxidation on a pb/pbo2 electrode. Desalin. Water Treat. 2011, 26, 301–308. [Google Scholar] [CrossRef] [Green Version]
  42. King, F. Environmental Electrochemistry: Fundamentals and Applications in Pollution Abatement. J. Environ. Qual. 1998, 27, 1550. [Google Scholar] [CrossRef]
  43. Luo, J.; Yartym, J.; Hepel, M. Photoelectrochemical Degradation of Orange II Textile Dye on Nanostructured WO3 Film Electrodes. J. New Mater. Electrochem. Syst. 2002, 5, 315–322. [Google Scholar]
  44. Allami, S.; Abid Ali, Z.D.; Li, Y.; Hamody, H.; Jawad, B.H.; Liu, L.; Li, T. Photoelectrochemical performance of N-doped ZnO branched nanowire photoanodes. Heliyon 2017, 3, e00423. [Google Scholar] [CrossRef] [PubMed]
Scheme 1. Chemical structure of the carmine dye.
Crystals 12 00535 sch001
Scheme 2. Schematic diagram of the synthesis of G/N-doped ZnO nanocomposites.
Crystals 12 00535 sch002
Scheme 3. Schematic diagram of the photoelectron-reactor.
Crystals 12 00535 sch003
Figure 1. FT-IR spectra of the N-doped ZnO and G/N-doped ZnO nanoparticles with different concentrations of graphene.
Crystals 12 00535 g001
Figure 2. (a) XRD patterns of the N-doped ZnO and G/N-doped ZnO nanoparticles with different concentrations of graphene, (b) UV–visible absorbance spectrum of N-doped ZnO and 0.001 G/N-doped ZnO nanoparticles, and (c) band gap of N-doped ZnO and 0.001 G/N-doped ZnO nanoparticles.
Crystals 12 00535 g002aCrystals 12 00535 g002b
Figure 3. (a) S.E.M. image of graphene; (bh) S.E.M. images of pure N-doped ZnO and six different concentrations of G/N-doped ZnO.
Crystals 12 00535 g003
Figure 4. Absorbance spectra of photocatalytic degradation of carmine dye under U.V.C. irradiation in situ with N-doped ZnO and G/N-doped ZnO with different concentrations of graphene.
Crystals 12 00535 g004
Figure 5. Rate constant values of carmine dye in situ with pure N-doped ZnO and six different concentrations of graphene using the photocatalytic degradation method.
Crystals 12 00535 g005
Figure 6. Recycling of 0.001 G/N-doped ZnO nanostructured.
Crystals 12 00535 g006
Figure 7. The degradation efficiency of trapping experiments of active species for the carmine photocatalytic reaction using 0.001 g of G/N-doped ZnO under UV light irradiation using 200 mM of scavengers.
Crystals 12 00535 g007
Scheme 4. Schematic mechanism of the photodegradation process of carmine dye by 0.001 g of the G/N-doped ZnO catalyst under UV illumination.
Crystals 12 00535 sch004
Figure 8. UV–Vis absorbance spectra of indirect electrochemical degradation of carmine dye in the presence of N-doped ZnO and G/N-doped ZnO with different concentrations of graphene.
Crystals 12 00535 g008aCrystals 12 00535 g008b
Figure 9. Rate constant values of carmine dye in the presence of N-doped ZnO and G/N-doped ZnO with different concentrations of graphene after an interval time of 15 min using the indirect electrochemical degradation method.
Crystals 12 00535 g009
Figure 10. UV–Vis absorbance spectra of (a) indirect electrochemical without catalysts; (b) indirect electrochemical in the presence of the catalyst (0.001 g of G/N-doped ZnO); (c) photoelectrochemical degradation of carmine dye in the presence of a catalyst (0.001 g of G/N-doped ZnO).
Crystals 12 00535 g010
Figure 11. (a) Kinetic plots and (b) rate constant values of the electrochemical degradation reaction of carmine in the absence of the catalyst, in the presence of 0.001 g of G/N-doped ZnO, and photoelectrochemical degradation reaction of carmine in the presence of 0.001 g of G/N-doped ZnO nanocomposite after a time interval of 15 min.
Crystals 12 00535 g011
Table 1. The computed mean values of the grain size (D), dislocation (δ), and strain (ε) from the XRD spectra for all prepared G/N-doped ZnO nanocomposites.
SamplesMean Values of the Grain Size (nm)Mean Values of Dislocation
Density, (nm)2
Mean Values of
Lattice Strain
G/N-doped ZnO66.532.259 × 10−45.210 × 10⁻⁴
0.001 g of G/N-doped ZnO31.511.007 × 10−31.100 × 10⁻³
0.01 g of G/N-doped ZnO58.333.181 × 10−46.105 × 10⁻⁴
0.1 g of G/N-doped ZnO45.545.450 × 10−47.938 × 10⁻⁴
0.25 g of G/N-doped ZnO43.136.613 × 10−48.580 × 10⁻⁴
0.5 g of G/N-doped ZnO44.035.518 × 10−48.058 × 10⁻⁴
1 g of G/N-doped ZnO38.908.986 × 10−49.876 × 10⁻⁴
Table 2. Rate constants (min−1) and degradation (%) for all photodegradation reactions under various conditions.
SamplesCarmine Dye (185 min)
Photocatalysis
In Situ
Carmine Dye (15 min)
Electrocatalysis
K min−1Degradation (%)K min−1Degradation (%)
G/N-doped ZnO0.0048650.600.1659374.96
0.001 g of G/N-doped ZnO0.0073966.760.20292100
0.01 g of G/N-doped ZnO0.0067862.520.0990471.99
0.1 g of G/N-doped ZnO0.0048953.230.0778670.20
0.25 g of G/N-doped ZnO0.0051454.410.1170383.40
0.5 g of G/N-doped ZnO0.0046950.110.1108596.92
1 g of G/N-doped ZnO0.0048851.740.1553298.27
Photocatalytic activity of G/N-doped ZnO nanostructures incomparable with the previous work.
Table 3. Comparison of photocatalytic degradation of carmine and different dyes in the presence of N-doped ZnO with other previous work samples.
PhotocatalystMethod of
Preparation
Organic
Solution
Irradiation Time, (min)SourceType of Treatment% DegradationK,
(min−1)
Refs.
G/N-doped ZnOCombustion methodCarmine dye185UV lightPhotocatalysis66.76%0.0022Present work
G/N-doped ZnOCombustion methodCarmine dye15-EO100%-------Present work
RGO-N-ZnO nanocompositeHydrothermal methodMB120Visible lightPhotocatalysis98.5%-------[29]
N-ZnO NPsMechanochemical methodM.B.-Visible lightPhotocatalysis98%-------[38]
N-ZnO N.C.B.sHydrothermal methodM.B.-UV light
–visible light
Photocatalysis99.6%0.0579–
0.0585
[27]
N-ZnO NPsMicroemulsion methodMG90visible lightPhotocatalysis100%-------[39]
7 wt% of N-ZnO NPsMechanochemical
method
M.B.-sunlightPhotocatalysis98.11%-------[31]
N-ZnO-GOWet chemical methodB.G.90Visible lightPhotocatalysis--------------[40]
N-ZnOSolvent-free mechanochemical methodM.B.-Visible lightPhotocatalysis100%-------[41]
N-ZnOSimple vacuum atmosphere methodMO100Visible lightPhotocatalysis100%-------[30]
GO-ZnOSimple one-pot methodMB90Sunlightphotocatalysis84%-------[34]
GO-ZnO-AgSimple one-pot methodMB40Sun
light
Photocatalysis100%0.1112[34]
Publisher’s Note: MDPI stays neutral with regard to jurisdictional claims in published maps and institutional affiliations.

