Article

Water Molecules in Channels of Natural Emeralds from Dayakou (China) and Colombia: Spectroscopic, Chemical and Crystal Structural Investigations

1
School of Gemology, China University of Geosciences Beijing, Beijing 100083, China
2
State Key Laboratory of Geological Processes and Mineral Resources, China University of Geosciences Beijing, Beijing 100083, China
*
Author to whom correspondence should be addressed.
Crystals 2022, 12(3), 331; https://doi.org/10.3390/cryst12030331
Submission received: 9 December 2021 / Revised: 21 February 2022 / Accepted: 23 February 2022 / Published: 27 February 2022
(This article belongs to the Special Issue Gem Crystals)

Abstract

:
H2O molecules in emerald channels have been extensively discussed over the past half century. Recent studies paid attention to their classification and coordination, but have mostly focused on the type related to Na+. There are few works on the other types, and the related infrared (IR) absorption bands are rather controversial. This paper investigated natural emeralds from China and Colombia by means of micro-Fourier transform infrared (μ-FTIR) spectroscopy, micro-confocal Raman spectroscopy, and laser ablation-inductively coupled plasma mass spectrometry (LA-ICP-MS). The results suggested that doubly (IId) and singly (IIs) coordinated H2O molecules were incorporated in natural emerald channels. Type IId H2O predominated in those emeralds with relatively low alkali content. As the alkali content increased, the proportion of type IIs H2O rose, stemming from the decrease of the H2OII/Na+ apfu ratio. Moreover, IR bands of H2O corresponding to Li+ and Cs+ were tentatively ascribed here. IR bands for D2O and HDO in Colombian sample were observed in the range of 2600–2850 cm−1 and preliminarily assigned, which might be a potential tool for emerald origin determination. Our work expanded the existing classification of water molecules in emerald channels and redefined the controversial IR absorption bands.

1. Introduction

An emerald is the green gem variety of the mineral beryl with a general formula of Be3Al2Si6O18. The charming color is due to trace amounts of Cr and/or V in the crystal structure. Beryl crystallizes in the space group P6/mcc. Its crystal structure is characterized by the six-membered rings comprised of six [SiO4] tetrahedras, which are linked together by Al3+ at octahedral (O) site and Be2+ at tetrahedral (T2) site. These six-membered rings stack along the c-axis, forming large channels that are not identical in diameter. As shown in Figure 1, the cavities of channel are approximately 5.1 Å in diameter, while the “bottlenecks” are 2.8 Å, and the distance between adjacent cavities is about 4.6 Å [1,2]. There are two types of structural positions in the uneven channels: twelve-coordinated 2a position (0 0 1/4) in the center of cavity and eight-coordinated 2b position (0 0 0) in the center of “bottleneck”. Large-sized channels are sufficient to incorporate alkali metal cations (Na+, K+, Li+, Rb+, Cs+), transition metal ions (such as Fe2+, Fe3+), Ca2+, REE3+, NH4+, F, Cl and neutral molecules (H2O and CO2), as well as noble gases, such as argon, helium, xenon, and neon [1,2,3,4,5,6,7,8,9,10,11,12,13,14]. The discourse about the positions of these cations and molecules in channel has raged unabated for over half a century [1,2,3,5,10,15]. To date, it has commonly been assumed that the large cations and molecules, such as K+, Cs+, Rb+, NH4+, H2O, and CO2, occupy the 2a site, whereas the smaller Na+, Li+, Ca2+, Fe2+, Fe3+ and REE3+ are likely to reside in the narrower 2b site.
H2O molecules in emerald channels were preliminarily classified as two types: Type I and II, and commonly recognized by infrared (IR) and Raman spectroscopies [1,11,15,16,17,18,19]. Both types of H2O have three vibrational modes, which are symmetric stretching (ν1), antisymmetric stretching (ν3), and bending (ν2) modes. Type I H2O exists at 2a site with the twofold axis perpendicular to c-axis (Figure 1a). Type II H2O exists near an alkali ion (Figure 1b,c), and its orientation is changed from perpendicular to parallel to c-axis due to the electrostatic attraction between the charged cation and the oxygen of H2O molecule. Recently, there have been some more detailed studies on the subtypes of type II H2O. For example, [4] firstly proposed singly (IIs) and doubly (IId) coordinated type II water molecules related to Na on the basis of the IR bands of ν1 and ν2 modes. This classification was further updated by [20,21,22]. Since Na+ is the dominant alkali ions in the channel of natural emerald and the other cations such as Li+ and Cs+ are comparably subordinate, the coordination of H2O molecules with Li+ or Cs+ has not been carried out yet.
Infrared spectroscopy is a widely used method to characterize the vibrational frequencies of water molecules in the emerald channel. The difference in frequencies between type I and type II H2O might be due to the coupling cations [4,8]. Furthermore, the difference in bond lengths between Na+ and oxygen atoms of water molecules results in the different IR absorption bands of type IIs and IId H2O. Extensive research has recorded the IR bands corresponding to the three vibration modes of type I, IIs and IId H2O [1,2,4,7,9,11,14,16,17,18,19,20,21,22,23,24,25,26,27,28,29,30,31,32,33,34,35]. However, there are currently no consensuses on the ν1 band of type I H2O and the ν3 band of type IIs H2O. Additionally, the IR bands of H2O related to Li+ or Cs+ have not been determined.
Aside from OH groups, vibration of OD groups in natural emeralds from Brazil and Colombia was firstly observed by [29]. Additionally, then [35] reported two bands at 2640 and 2671 cm1 [14] synthesized a unique type of H2O, D2O, and HDO bearing beryl, and put forward the assignments of corresponding IR bands [31] synthesized D2O-containing beryl crystals, investigated the distribution of type I and type II D2O in the channel, and concluded the coordination of Li+ with two type II D2O molecules based on the calculated contents. Currently, –OD related IR bands in the range of 2600–2800 cm−1 tend to be a potential tool for emerald origin determination since its common occurrence in emeralds from a few deposits such as Colombia. However, a systematic investigation on D2O and HDO molecules in natural emeralds is still lacking.
This paper investigates the chemical composition and spectroscopy of natural emeralds from Dayakou (China), and explores the coordination of alkali ions with H2O in the channel. We here aim to expand the existing classification of channel water, to redefine the controversial IR absorption bands, and to quantitatively express the relationship between type II H2O and Na content. We also investigate the spectroscopy of emerald from Colombia to systematically assign the IR absorption bands of D2O and HDO in natural emerald.

2. Materials and Methods

2.1. Materials

Fifteen rough emeralds from Dayakou (China) and one emerald crystal from Colombia (col-022) were collected for this study (Figure 2). Dayakou samples consist of crystal fractions and euhedral columnar single crystals. Sized from 2 to 13 mm, these crystals are translucent to opaque and their colors cover various shades of green. All the Dayakou emeralds were cut into thin sections parallel to c-axis with the thickness of 1 mm and polished with double parallel sides. The Colombian sample is a polished crystal cut parallel to the c axis with a weight of 0.82 ct.

2.2. Methods

2.2.1. Micro-Fourier Transform Infrared (μ-FTIR) Spectroscopy

Unpolarized μ-FTIR spectra in the range of 600–6000 cm−1 were measured at room temperature using a Bruker LUMOS FTIR spectrometer equipped with a MCT (mercury–cadmium–telluride) detector cooled at 77 K, housed at the Gem Research Center, the School of Gemology, China University of Geosciences, Beijing (CUGB). Due to the limitation of transparency of crystal, the reflectance mode was used for Dayakou samples, while transmission mode for Colombia sample to measure a FTIR spectrum in range of 400–4000 cm−1. The spectral resolution was 2 cm−1, and each spectrum was averaged from 512 scans. All the measurements were conducted with same crystal orientation. Peak analysis was performed using an Origin 2018 professional software package, and the peaks were fitted using Gauss–Lorentz function.

2.2.2. Micro-Confocal Raman Spectroscopy

Raman spectra of Dayakou emerald sections were collected at room temperature using Horiba HR Evolution micro-confocal Raman spectrometer at the Gem Research Center, the School of Gemology, CUGB. The system was equipped with 50× magnification objectives and a Peltier-cooled Si-based CCD detector. The Raman spectra (100–4000 cm−1) were recorded using 532 nm solid stage laser with the resolution of 4 cm−1. The grating, acquisition time, and accumulation were 600 slots/mm, 3 s, and 1, respectively. Data analysis was performed using Labspec6 and Origin 2018 professional software, and the peaks were fitted using the Gauss–Lorentz function.

2.2.3. Laser Ablation-Inductively Coupled Plasma Mass Spectrometry (LA-ICP-MS)

In situ chemical composition measurements were carried out in the same area where the spectroscopic measurements were performed using a Thermo X-Series ICP-MS fitted with a J-100 343 nm femto-second laser ablation system, housed at the National Research Center for Geoanalysis (CAGS). The parameter settings are the same as those of [36]. The radiofrequency power of ICP-MS was 1300 W. Helium gas carrying the ablated sample aerosol from the chamber was mixed with argon gas and nitrogen as an additional diatomic gas to enhance sensitivity. A baffled-type smoothing device in front of the ICP-MS was used to reduce fluctuation effects induced by laser-ablation pulses and to improve the analytic quality. Samples were ablated for 60 s at a repetition rate of 8 Hz at 8 J/cm2, and ablation pits were ~50 μm in diameter. Each analysis incorporated an approximate 20 s background acquisition (gas blank) followed by 50 s data acquisition from the sample. Every twelve analyses were followed by a calibration process with two analyses of NIST 610 and one analysis of NIST 612 in order to correct the time-dependent drift of sensitivity and mass discrimination. All elemental concentrations were calculated by applying 29Si as an internal standard. Data reduction was carried out with the commercial software ICPMSDataCal 10.8, and the analytical procedures and calibration methods were similar to those described by [37]. The precision and accuracy are about 10% rel. at ppm level.

3. Results

3.1. Chemical Analyses of Dayakou (China) Emerald

The results of the concentrations of alkali elements in Dayakou emeralds are presented in Table 1. The results suggest that the total concentration of alkali elements in Dayakou emerald ranges from 7164 to 14,685 ppm, with the Na concentration from 5612 to 11,864 ppm, the Li concentration from 278 to 654 ppm, and the Cs concentration from 771 to 3123 ppm. The content of Rb is generally below 40 ppm. Although the average Cs content of Dayakou samples is the highest ever reported among that of worldwide emeralds [36,38], the calculated Cs+ atoms per formula unit (apfu) are negligible. The main alkali ions in channel are Na+ (0.131–0.287 apfu) and Li+ (0.022–0.051 apfu). The proportions are in the order: Na+ (79.66–89.30%) > Li+ (7.93–18.96%) > Cs+ (1.34–4.45%). The water content (0.634–0.806 apfu) was calculated using the equation relating Na+ to H2O molecules, which was proposed by [39]. In Table 1, the sample YEW-33 shows the lowest content of alkali elements, whereas samples YEW-22 and YEW-19 display relatively high alkali contents.

3.2. Micro-Confocal Raman Spectra of Channel Water Molecules

In the region of 3500–3700 cm−1, the Raman shifts of ν1 modes of type I and II H2O can be observed at 3605 cm−1 (P1) and 3596 cm−1 (P2), respectively. Three distinct spectral patterns of channel water molecules in Dayakou emeralds are displayed in Figure 3. These are: “alkali-poor” (Figure 3a), “medium alkali” (Figure 3b), and “alkali-rich” (Figure 3c) patterns, among which the “alkali-rich” pattern is most common.
The waterfall plots of Raman spectra of all Dayakou samples (Figure 3d) suggest that there is no absolute negative correlation between P1 and P2. The intensity of P1 even rises simultaneously with P2, indicating that the overall content of channel water increases. After peak fitting, the intensity, full width at half maxima (FWHM) and peak area of P1 and P2 were collected. As shown in Table 2, the peak intensity ratio of P2 to P1 ranges from 0.40 to 1.99. The FWHM of P1 is in the range of 9.3–14.8 cm−1, while that of P2 in 3.5–7.2 cm−1. In addition, the peak area of P2 (8912–34,385 cm−1) is much larger than P1 (4413–12,981 cm−1) and the ratios are generally greater than 1, revealing the content of type II water precedes type I water.

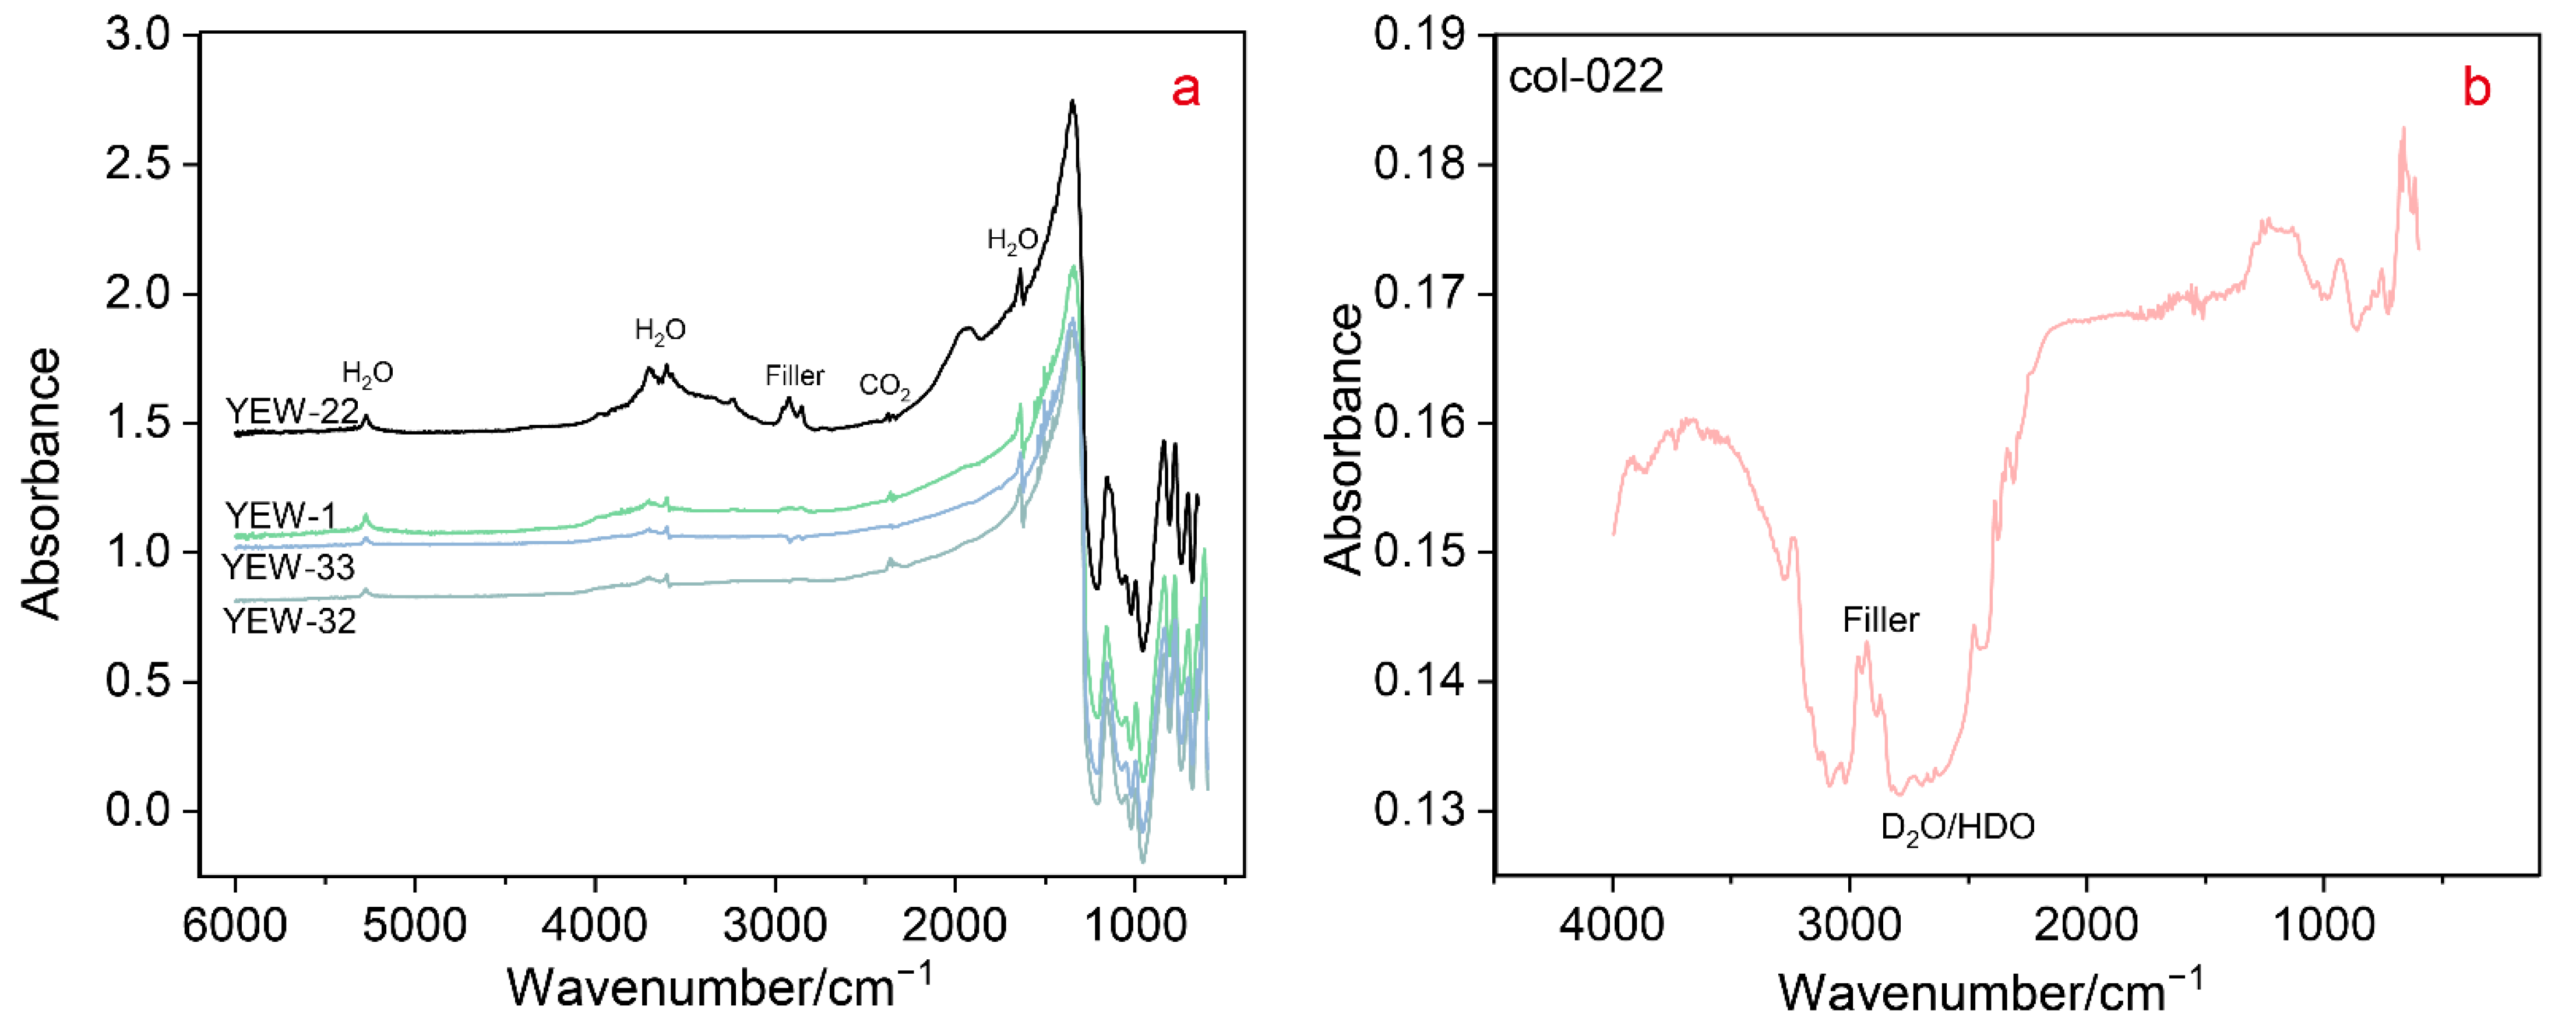
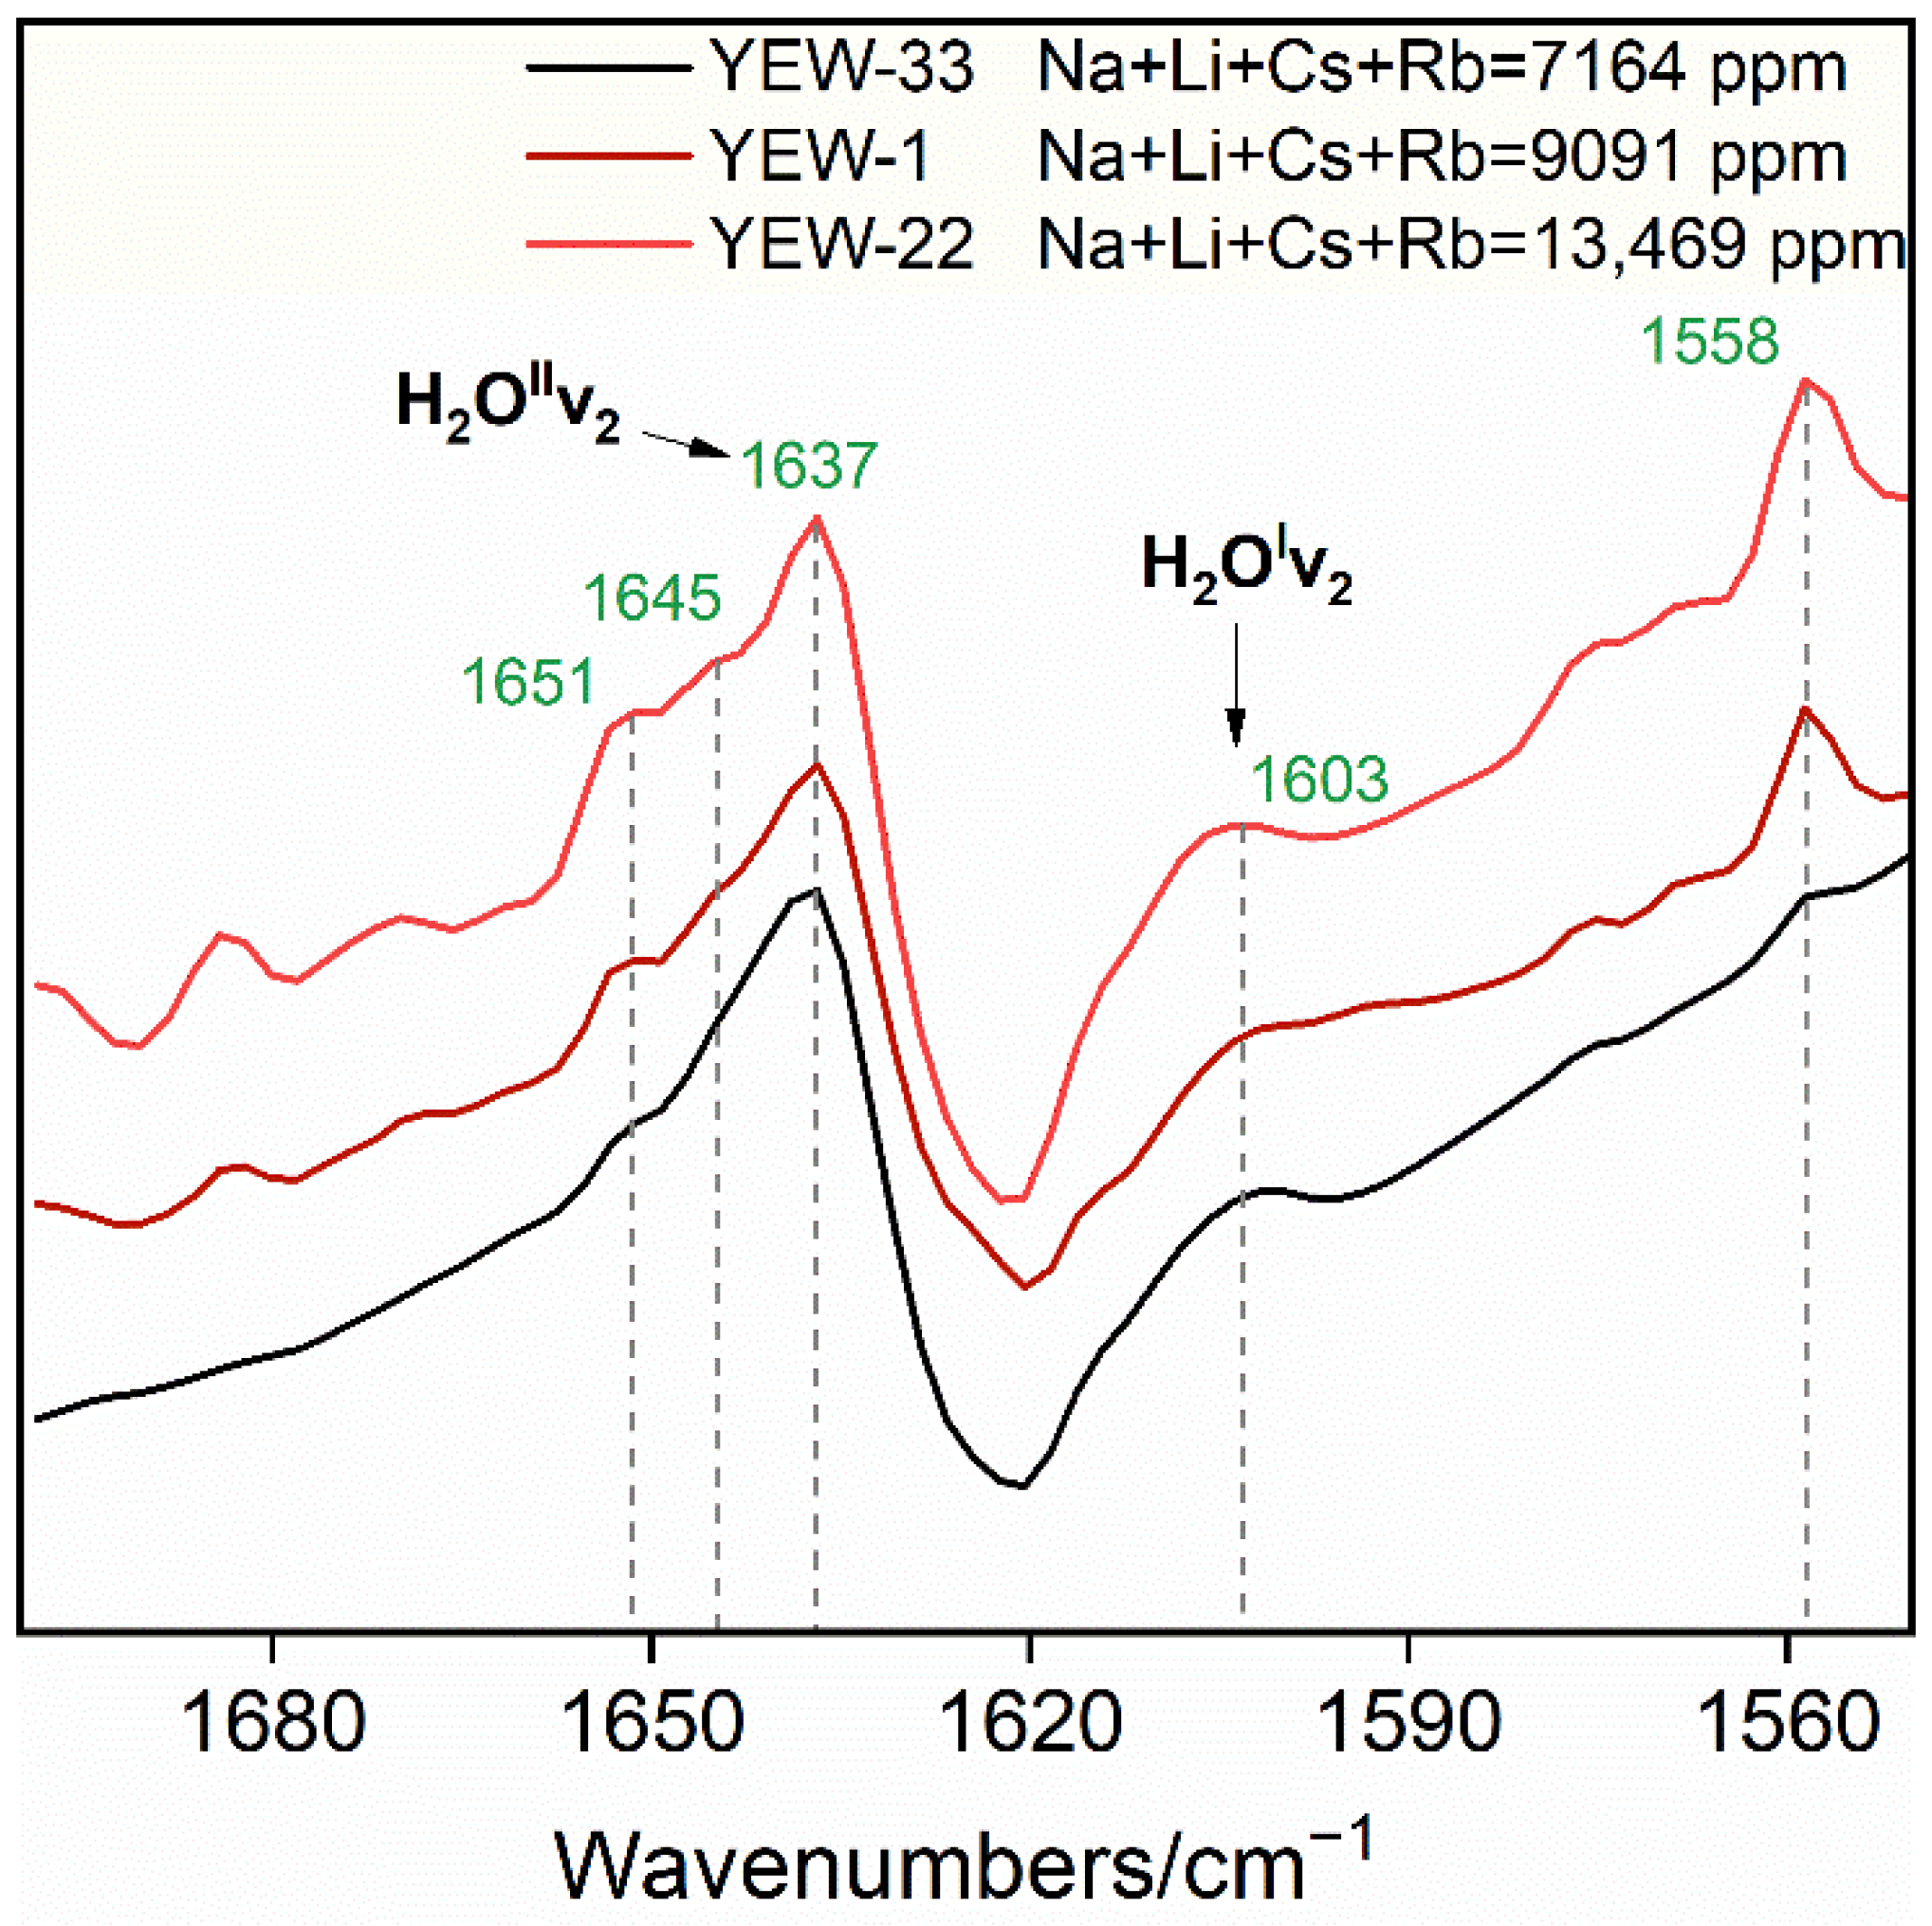
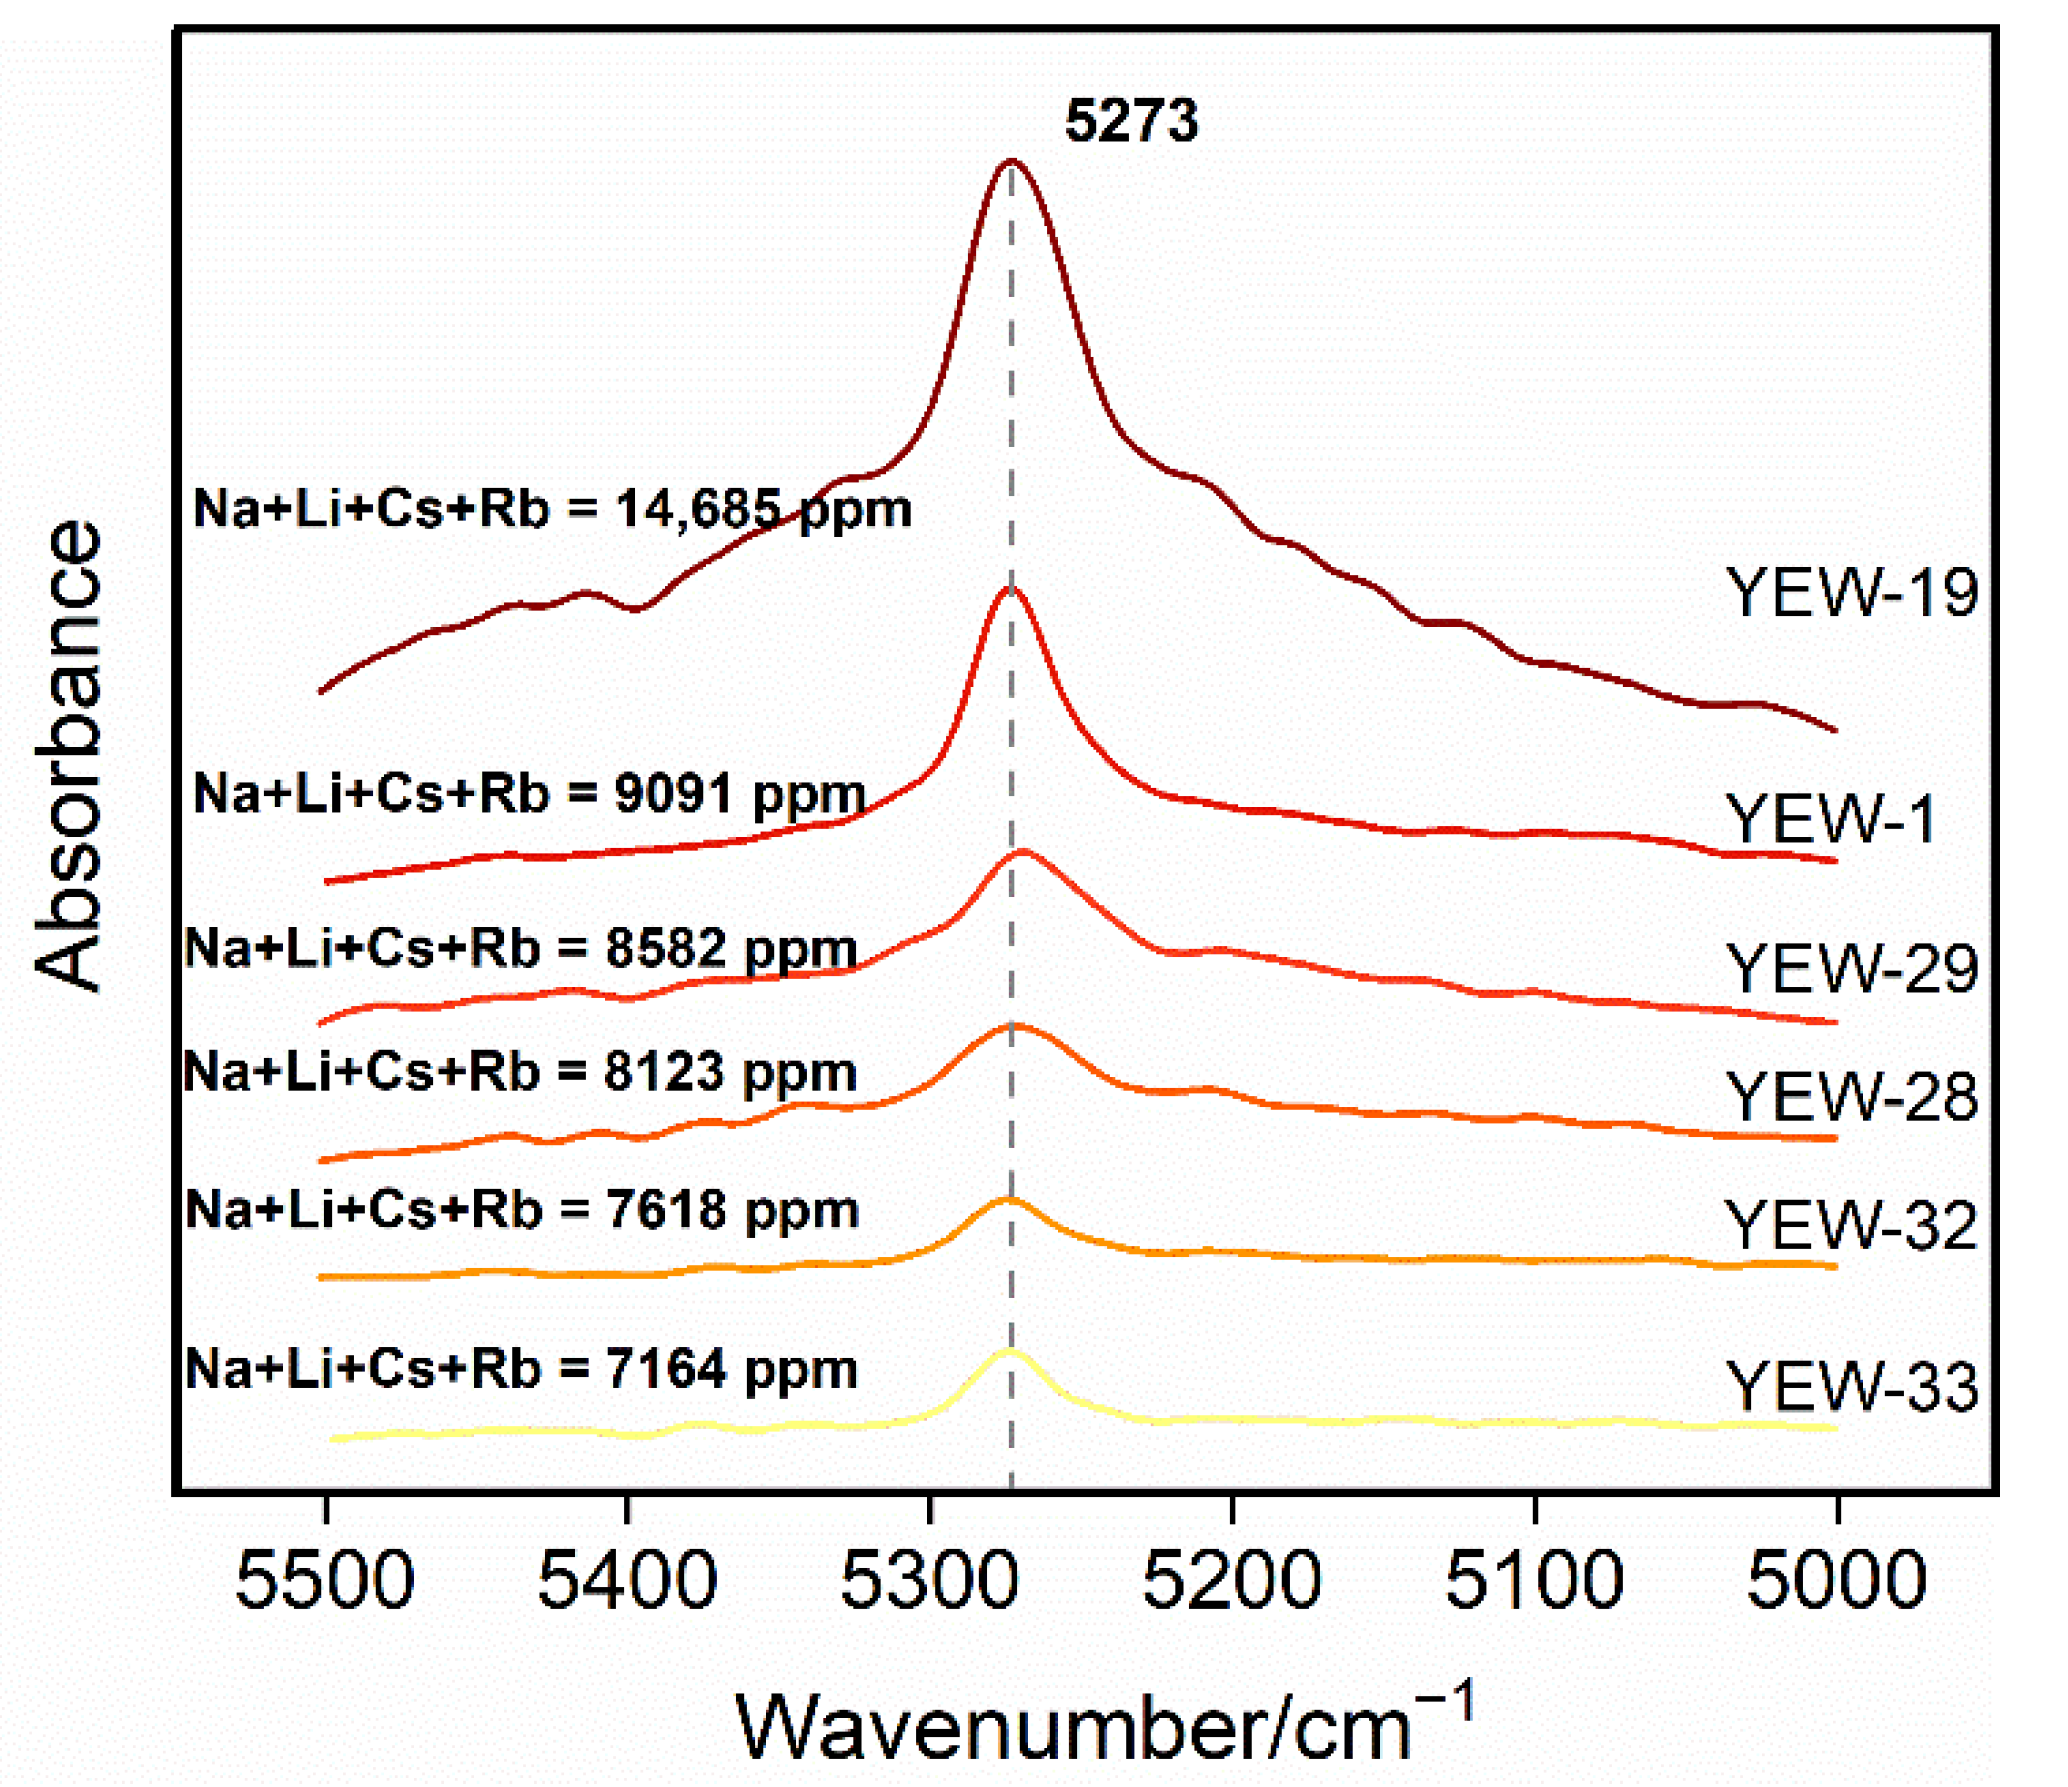
3.3. μ-FTIR Spectra of H2O in Dayakou Samples

The infrared spectra of Dayakou and Colombian samples are displayed in Figure 4, and the specific infrared absorption bands are presented in Table 3. It can be found that the IR bands of natural emeralds slightly shift to higher wavenumbers than those of beryls. In this work, IR bands caused by different modes of H2O molecular vibration were observed in three regions: (1) 1500–1700 cm−12); (2) 3500–3800 cm−11 and ν3); and (3) 5000–5500 cm−1 (combination mode). To shorten the expression, an abbreviation like H2OIν1 is used to symbolize the ν1 mode of type I H2O.
As shown in Figure 5, IR bands at 1603 and 1637 cm−1 can be ascribed to H2OIν2 and H2OIIν2, respectively. Besides, the 1558 cm−1 and 1651 cm−1 bands commonly appear in all Dayakou samples, while the 1645 cm−1 band is more obvious in samples with high alkali content. These bands were referred to as the ν2-related modes of type I water [25].
Figure 6 displays the IR bands of four representative Dayakou samples in the region of 3500–3800 cm−1. The most significant absorption at ~3603 cm−1 and ~3704 cm−1 could be assigned to H2OIIν1 and H2OIν3, respectively. In Figure 6d, two bands related to H2OIIν1 at 3593 and 3604 cm−1 could be observed after peak fitting. Bands in 3650–3690 cm−1 are mainly caused by H2OIIν3, which include the 3661/3663 cm−1 and 3675/3676 cm−1 bands in low alkali content samples (Figure 6a,b), and the 3650, 3666 and 3683 cm−1 bands in medium and high alkali content samples (Figure 6c,d). The assignments of these bands and the weak band at ~3633 cm−1 are discussed in a later section.
IR band at 5273 cm−1 is likely to be the combined frequency of ν2 and ν3 modes. As shown in Figure 7, there is a significant positive correlation between the alkali content and the peak intensity. In previous studies, the 5273 cm−1 band was commonly ascribed to type I H2O according to the orientation of measurement [14,23,29], but occasionally related to type II H2O [24,34]. Since the obvious positive correlation observed in Figure 7, this band is assigned to H2OIIν23 here.

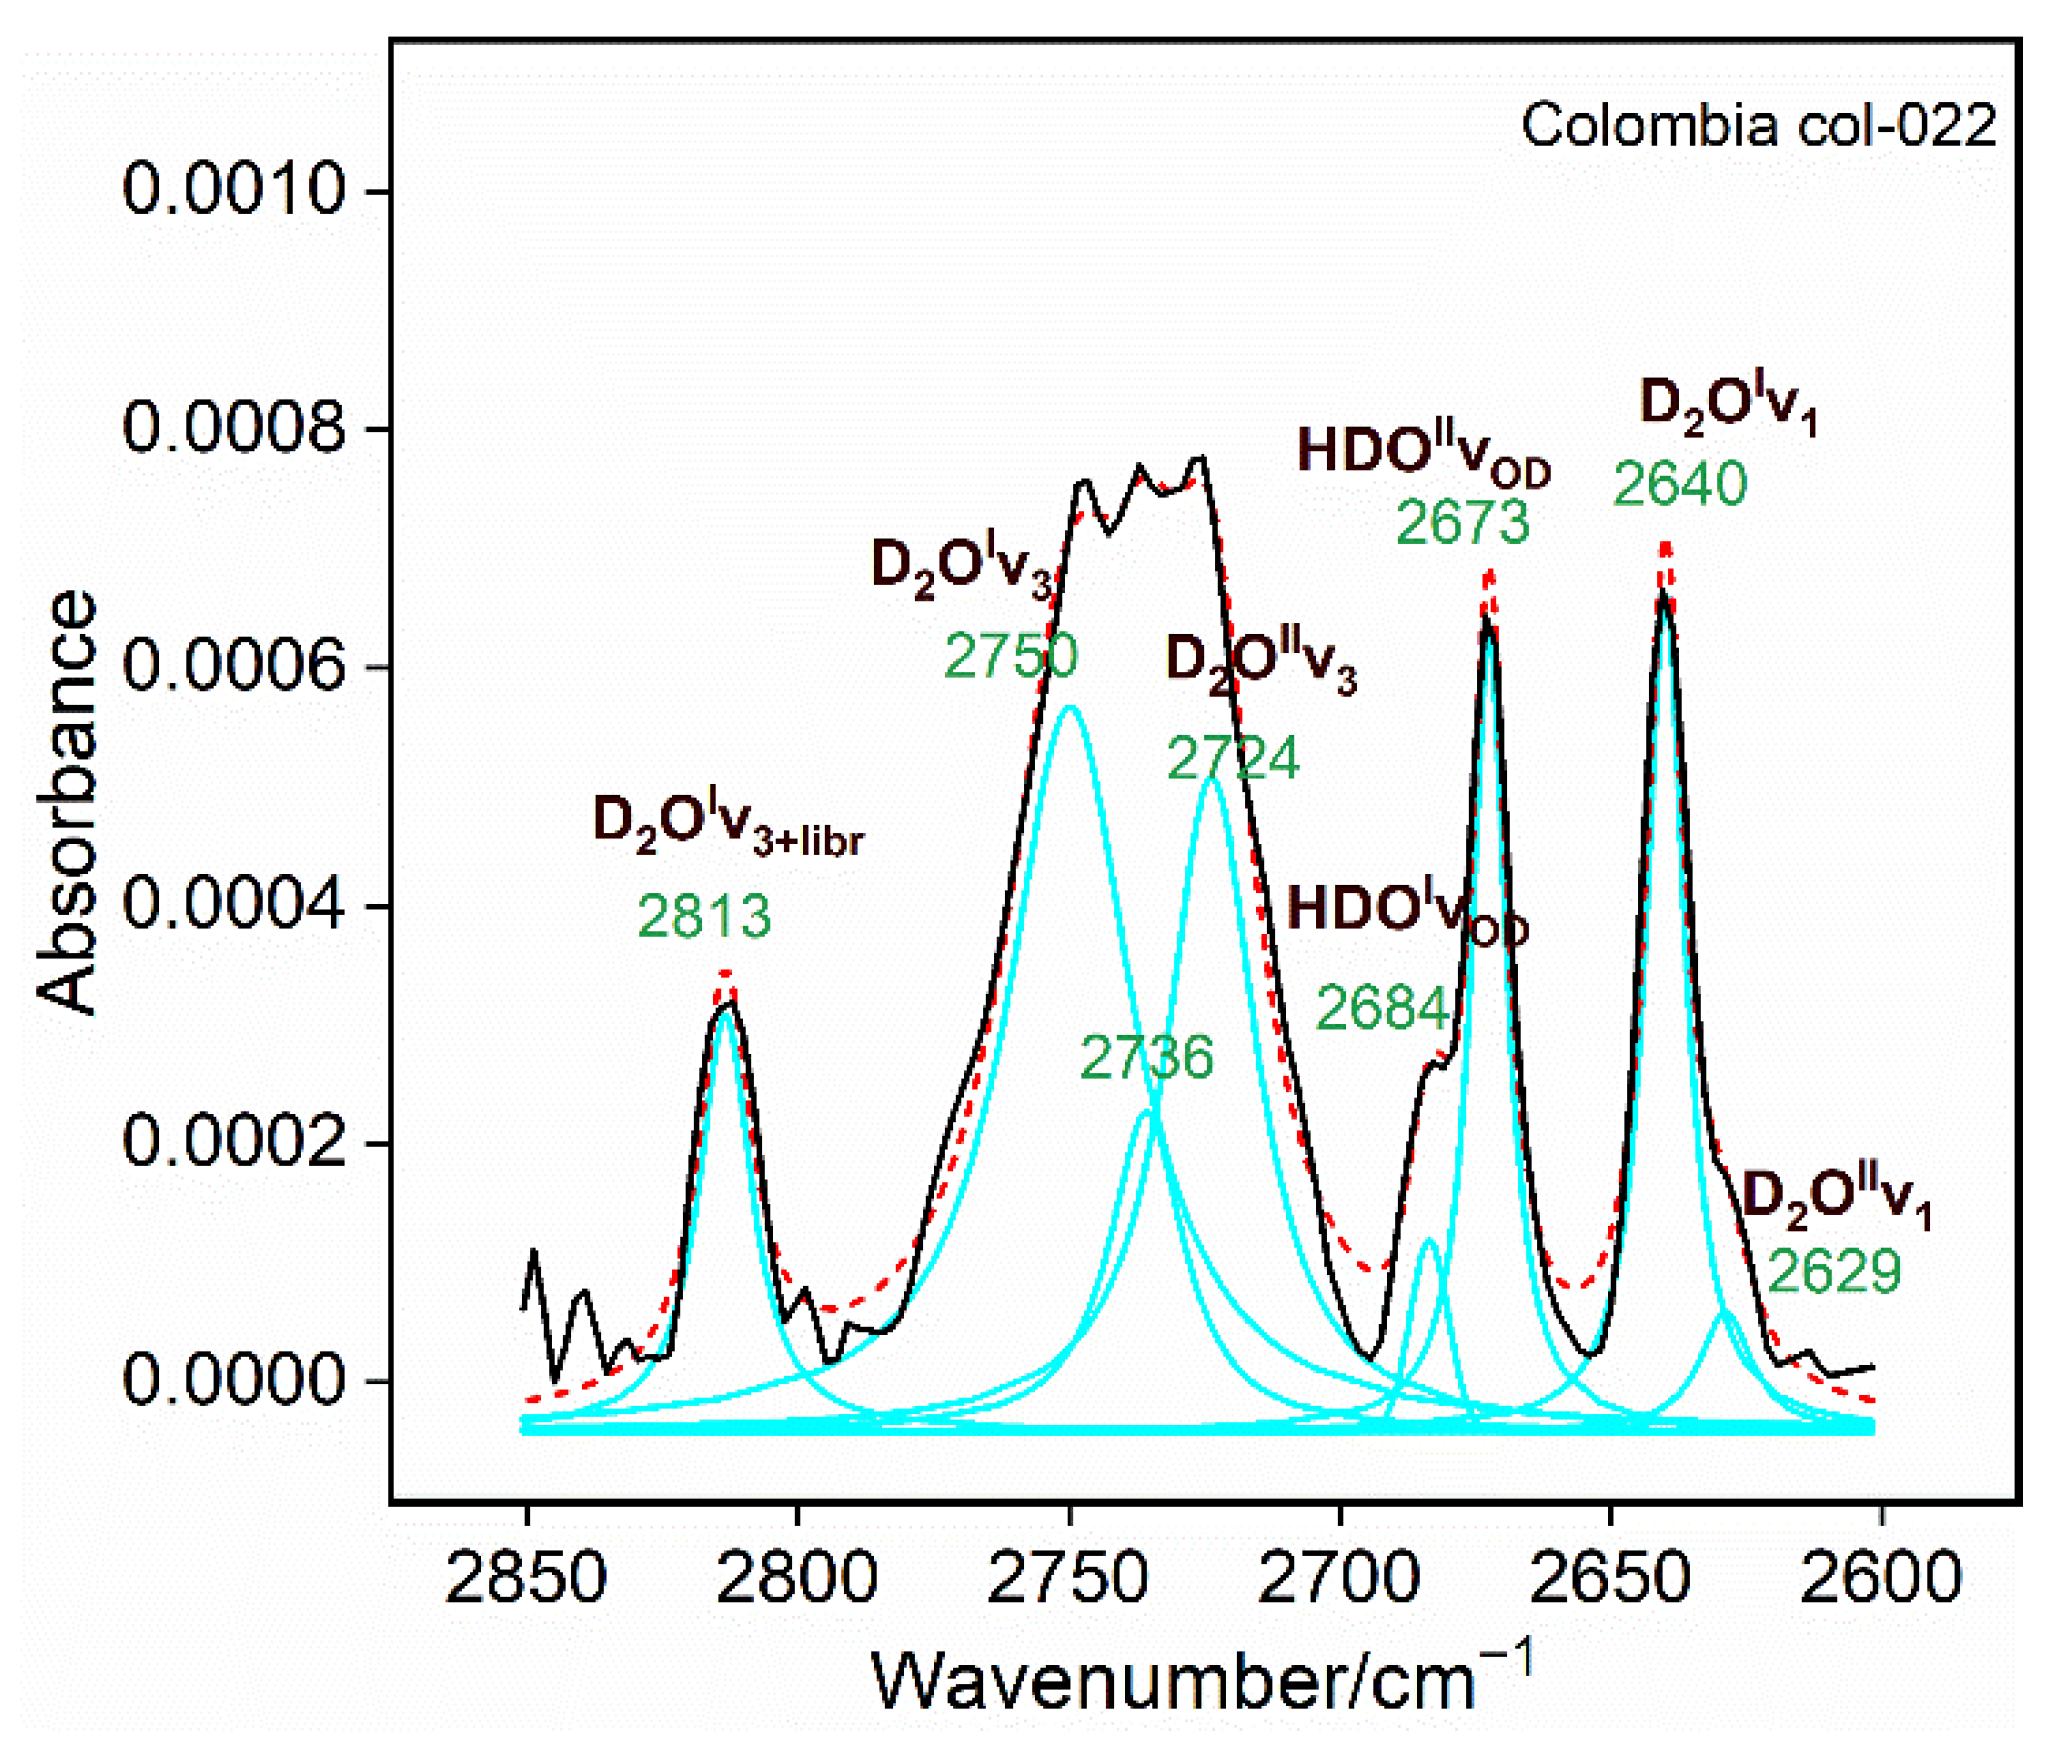
3.4. μ-FTIR Spectra of D2O and HDO in Colombian Sample

Figure 8 illustrates the IR spectra of D2O and HDO molecules in Colombian emerald sample. In Figure 8, a series of intense IR bands of sample col-022 locate at 2640, 2673, ~2740 and 2813 cm−1. After peak fitting, the intense shoulder absorption band at ~2740 cm−1 is split into three bands located at 2724, 2736, and 2750 cm−1. Additionally, weak bands at 2629 and 2684 cm−1 are separated.

4. Discussion

It is a widely held view that type I H2O predominate in alkali-poor emeralds with the frequencies of 1599–1607 cm−1 for H2OIν2 and 3690–3700 cm−1 for H2OIν3. In this work, the bands corresponding to these two vibrations are at ~1603 cm−1 and ~3704 cm−1 (Figure 9a). What is controversial is the H2OIν1 related band, which was generally reported in the range of 3602–3610 cm1 [14,21,23,25,30] and occasionally observed at 3630–3635 cm−1 [16,22] and 3647–3650 cm−1 [22,32]. Additionally, 3602–3610 cm−1 is thought to be a reliable range for the frequency of H2OIν1 band, but this band is not determined in our work as a result of overlapping the strong H2OIIν1 absorption.
Two subtypes of type II H2O proposed by Fukuda and Shinoda [4] were also supported by our results. Among the alkali ions of Dayakou samples, the proportion of Na+ exceeds 80%, which indicates that the type II H2O related to Na is dominant. In samples YEW-33 and YEW-32 with relatively low Na content, IR bands corresponding to H2OIIν3 locate at 3661 and 3663 cm−1 (Figure 6a,b). Furthermore, in samples YEW-1 and YEW-22 with higher Na content, aside from the above peaks, an obvious band at 3650/3652 cm−1 can be observed (Figure 6c,d). In Figure 6d, two types of H2OIIν1 band are observed at 3593 and 3604 cm−1. These results suggest that type IId (Figure 9b) and IIs H2O (Figure 9c) molecules also exist in natural emerald channels, and are controlled by the content of sodium. Their IR absorption features are distinguished by the correlation between bond length of Na-O and vibration frequency of H2O molecules. As shown in Figure 9b, the doubly coordinated Na+ is shared by two hydroxyl oxygen (WO). The bond valence and length are 0.14 vu and 2.483 Å, whereas those of singly coordinated Na+ are 0.28 vu and 2.227 Å, respectively [3,22]. With the increasing number of coordinated water molecules, the bond length of Na+WO rise together with the H–O–H angle [4,21]. Accordingly, both the frequencies of ν1 and ν3 stretching modes of type IId H2O shift to higher wavenumbers, which suggesting that the bands at ~3603 and ~3661 cm−1 are likely to be assigned to H2OIIdν1 and H2OIIdν3, respectively. This is consistent with the results of [21,22]. The ~3593 cm−1 band is related to H2OIIsν1, and the controversial ~3651 cm−1 band should be ascribed to H2OIIsν3 rather than H2OIν1 based on the almost constant frequency difference between ν1 and ν3 modes.
Figure 6a, b indicate that type II water mainly exists as type IId with the ν3 band at ~3661 cm−1 in the channels of emeralds with low sodium content. The emergence of the ~3651 cm−1 band in the IR spectra of relatively high sodium content samples suggests that the H2OII/Na+ apfu ratio drops below 2 as a consequence of the increase of Na content, implicating a higher proportion of type IIs H2O.
Figure 3a–c reveal that the Raman spectrum patterns of the channel water molecules in emeralds are controlled by the alkali content, especially the dominant Na content. At present, many researchers quantitatively linked alkali cations with water, and various empirical equations using Na content to evaluate the total channel water content have been proposed [39,40,41], and the preferred equations are:
0.6097 Na2O (wt.%) + 1.6290 = H2O (wt.%)
Na+ + 0.5 = H2O (apfu)
However, what is noteworthy is that only type II H2O is directly related to alkali elements, especially Na. Additionally, the content of type I water is not constant as shown in Figure 3d. Thus, it is more accurate to use the Na+ apfu and peak area of P2 Raman peak to explore the quantitative relationship between alkali content and type II water. The data was fitted to a trendline which can be described with the equation:
Na+ = −0.2190 + 0.0471 ln (PA3596 − 7286)
Shown in Figure 10 as a black solid line. The fitted curve shows the logarithmic relationship between type II water and the Na content, indicating a positive but not linear correlation. The curve slope suggests that the type II water content increases uniformly with the Na content. A possible explanation is that the proportion of type IIs H2O rises with the increase of Na+ apfu, which means that more [Na(H2O)]+ complexes are formed with the same number of water molecules. The specific theory of how the Na content controls the proportion of type IIs and IId H2O demands further study.
Water molecules related to Li+ and Cs+ were once defined as type III H2O by [16]. Li+ and Cs+ therein were set at position 2a while OH at position 2b. The symmetry axis of Cs(OH) was perpendicular to the c-axis. This configuration is questionable, because the bond length between the eight-coordinated Li+ and ring oxygen (RO) was calculated to be 2.397 Å [3], which is even shorter than Na+RO (2.568 Å) and also less than the average 2b–O distance with the value of 2.480 Å. Therefore, Li+ should occupy the 2b position in the channel rather than the 2a position where Cs+ locates.
The chemical analyses of Dayakou samples show the proportion of Li+ among the channel alkali ions ranges from 7.57–17.03%, indicating high possibility of the presence of [Li(H2O)n]+ complex in which the H2O molecules are defined as Li-related type II (H2OII-Li) here (Figure 11a). According to the calculated frequencies of OH vibration of the [M(H2O)]+ complexes by [8] and the variation of the bond strength of M+–O, the frequencies of ν1 and ν3 stretching modes of type II-Li should be lower than that of type II-Na. Accordingly, we attempt to assign the weak ~3633 cm−1 band to H2OII-Liν3. This band was occasionally assigned to H2OIν1 in previous work [16,22], because both H2OIν1 and H2OII-Liν3 are IR active when the electric vector (E) is perpendicular to the c-axis. However, in the results of samples BLS and DUV measured by [22], the bands at ~3650, ~3637 and ~3605 cm−1 were simultaneously detected under E⊥c, which supports that these three bands should be ascribed to different vibration modes and is also the evidence of our assignments.
Research on the coordination of Cs+ with H2O in natural emerald is limited as a result of the negligible Cs content. It is possible to hypothesize a configuration of type III H2O that the Cs+ at position 2a coordinates with OH at position 2b (Figure 11b). The proportion of Cs+ among the alkali ions in Dayakou emerald channels ranges from 1.63–4.24%, indicating possible Cs(OH) complexes. According to the relationship between frequencies of OH vibration and the bond length of M+–O [8], the ~3675 cm−1 band of higher wavenumber than the frequency of H2OIIdν3 is tentatively assigned to the OH vibration of Cs (OH).
OD vibrations of D2O and HDO molecules in natural emeralds were once reported [29,35], but not systematically assigned. According to IR absorption features of free D2O and HDO molecules [42] and the H2O, D2O, and HDO bearing beryl [14], two principles of the assignment of OD vibration are obeyed in this work: (1) the D2O-related vibrational features are similar to those of H2O molecules; (2) the vibrations of OD group in HDO molecule is independent without intramolecular OD–OD coupling. Additionally, the OD vibration bands are consequently assumed to be about halfway between frequencies of the ν1 and ν3 modes of D2O [14,29]. Hence, the systematic assignments of IR bands of Colombian emerald are as follows: ν1 and ν3 bands of type I D2O at 2640 and 2750 cm−1; ν1 and ν3 bands of type II D2O at 2629 and 2724/2736 cm−1; νOD of type I and type II HDO at 2684 and 2673 cm−1, respectively. A satellite at 2813 cm−1 with a separation of approximately 63 cm−1 from the D2O I ν3 mode is ascribed to the combination band related to the libration mode. The coordination of D2O and HDO in the channel of emerald is similar to H2O (Figure 12).

5. Conclusions

  • Two subtypes (IId and IIs) of type II H2O were detected in Dayakou emerald. IR absorption bands related to ν1 and ν3 modes of H2OIId are determined to locate at ~3603 and ~3661 cm−1, respectively, while those of H2OIIs at ~3593 and 3651 cm−1, respectively. Type IId H2O predominates in those emeralds with relatively low alkali content. As the alkali content increases, the proportion of type IIs H2O rises as a result of the decrease of the H2OII/Na+ apfu ratio. The equation (3) derived from Na+ apfu and peak area of the 3596 cm−1 Raman peak is used to express the relationship between the Na content and type II H2O.
  • H2O corresponding to Li+ is defined as type II-Li H2O, of which the ν3 mode frequency is ascertained to be ~3633 cm−1. A tentative assignment of ~3675 cm−1 band is the OH vibration of Cs(OH) which is classified as type III H2O here.
  • IR absorption bands for D2O and HDO molecules in Colombian emerald are observed in the range of 2600–2850 cm−1 and preliminarily assigned.

Author Contributions

Conceptualization: B.X., Y.-Y.Z. and X.-Y.Y.; formal analysis: Y.-Y.Z. and J.-X.W.; funding acquisition: B.X. and X.-Y.Y.; investigation: Y.-Y.Z., H.-S.G. and Z.-Y.L.; methodology: Y.-Y.Z., L.-J.Q. and L.-Y.C.; supervision: B.X. and X.-Y.Y.; writing—original draft: Y.-Y.Z., T.-Y.Z. and M.-K.W.; writing—review and editing: Y.-Y.Z. and X.-Y.Y. All authors have read and agreed to the published version of the manuscript.

Funding

This research was funded by the project from China Geological Survey, grant number DD20190379-88, and 2021 Graduate Innovation Fund Project of China University of Geosciences, Beijing, grant number ZD2021YC038.

Institutional Review Board Statement

Not applicable.

Informed Consent Statement

Not applicable.

Data Availability Statement

The data presented in this study are available in the article.

Acknowledgments

We extend our heartfelt gratitude to the Laboratory of the Jewelry College, China University of Geosciences, Beijing, for their support. We also thank Chao Li for the support of LA-ICP-MS analysis.

Conflicts of Interest

The authors declare no conflict of interest.

References

  1. Charoy, B.; de Donato, P.; Barres, O.; Pinto-Coelho, C. Channel occupancy in an alkali-poor beryl from Serra Branca (Goias, Brazil): Spectroscopic characterization. Am. Mineral. 1996, 81, 395–403. [Google Scholar] [CrossRef]
  2. Wood, D.L.; Nassau, K. Infrared Spectra of Foreign Molecules in Beryl. J. Chem. Phys. 1967, 47, 2220–2228. [Google Scholar] [CrossRef]
  3. Bačík, P.; Fridrichová, J. The Site Occupancy Assessment in Beryl Based on Bond-Length Constraints. Minerals 2019, 9, 641. [Google Scholar] [CrossRef] [Green Version]
  4. Fukuda, J.; Shinoda, K. Coordination of water molecules with Na+ cations in a beryl channel as determined by polarized IR spectroscopy. Phys. Chem. Miner. 2008, 35, 347–357. [Google Scholar] [CrossRef]
  5. Andersson, L.O. The positions of H+, Li+ and Na+ impurities in beryl. Phys. Chem. Miner. 2006, 33, 403–416. [Google Scholar] [CrossRef]
  6. Mashkovtsev, R.I.; Thomas, V.G. Nitrogen atoms encased in cavities within the beryl structure as candidates for qubits. J. Appl. Magn. Reson. 2005, 28, 401–409. [Google Scholar] [CrossRef]
  7. Mashkovtsev, R.I.; Smirnov, S.Z. The nature of channel constituents in hydrothermal synthetic emerald. J. Gemmol. 2004, 29, 215–227. [Google Scholar] [CrossRef]
  8. Lee, H.M.; Tarakeshwar, P.; Park, J.; Kolaski, M.R.; Yoon, Y.J.; Yi, H.B.; Kim, W.Y.; Kim, K.S. Insights into the structures, energetics, and vibrations of monovalent cation-(Water)(1-6) clusters. J. Phys. Chem. A 2004, 108, 2949–2958. [Google Scholar] [CrossRef]
  9. Mashkovtsev, R.I.; Solntsev, V.P. Channel constituents in synthetic beryl: Ammonium. Phys. Chem. Miner. 2002, 29, 65–71. [Google Scholar] [CrossRef]
  10. Aurisicchio, C.; Fioravanti, G.; Grubessi, O.; Zanazzi, P.F. Reappraisal of the crystal chemistry of beryl. Am. Mineral. 1988, 73, 826–837. [Google Scholar]
  11. Wood, D.L.; Nassau, K. Characterization of Beryl and Emerald by Visible and Infrared Absorption Spectroscopy. Am. Mineral. 1968, 53, 777–800. [Google Scholar]
  12. Zimmermann, J.L.; Giuliani, G.; Cheilletz, A.; Arboleda, C. Mineralogical Significance of Fluids in Channels of Colombian Emeralds: A Mass-Spectrometric Study. Int. Geol. Rev. 1997, 39, 425–437. [Google Scholar] [CrossRef]
  13. Giuliani, G.; Groat, L.A.; Marshall, D.; Fallick, A.E.; Branquet, Y. Emerald Deposits: A Review and Enhanced Classification. Minerals 2019, 9, 105. [Google Scholar] [CrossRef] [Green Version]
  14. Mashkovtsev, R.I.; Thomas, V.G.; Fursenko, D.A.; Zhukova, E.S.; Uskov, V.V.; Gorshunov, B.P. FTIR spectroscopy of D2O and HDO molecules in the c-axis channels of synthetic beryl. Am. Mineral. 2016, 101, 175–180. [Google Scholar] [CrossRef]
  15. Goldman, S.D.; Rossman, G.R.; Parkin, K.M. Channel constituents in beryl. Phys. Chem. Miner. 1978, 3, 225–235. [Google Scholar] [CrossRef]
  16. Łodziński, M.; Sitarz, M.; Stec, K.; Kozanecki, M.; Fojud, Z.; Jurga, S. ICP, IR, Raman, NMR investigations of beryls from pegmatites of the Sudety Mts. J. Mol. Struct. 2005, 744–747, 1005–1015. [Google Scholar] [CrossRef]
  17. Aurisicchio, C.; Grubessi, O.; Zecchini, P. Infrared-Spectroscopy and Crystal-Chemistry of the Beryl Group. Can. Miner. 1994, 32, 55–68. [Google Scholar]
  18. Mashkovtsev, R.I.; Lebedev, A.S. Infrared spectroscopy of water in beryl. J. Struct. Chem. 1993, 33, 930–933. [Google Scholar] [CrossRef]
  19. Kolesov, B.A.; Geiger, C.A. The orientation and vibrational states of H2O in synthetic alkali-free beryl. Phys. Chem. Miner. 2000, 27, 557–564. [Google Scholar] [CrossRef]
  20. Fukuda, J.; Shinoda, K.; Nakashima, S.; Miyoshi, N.; Aikawa, N. Polarized infrared spectroscopic study of diffusion of water molecules along structure channels in beryl. Am. Mineral. 2009, 94, 981–985. [Google Scholar] [CrossRef]
  21. Della Ventura, G.; Radica, F.; Bellatreccia, F.; Freda, C.; Cestelli Guidi, M. Speciation and diffusion profiles of H2O in water-poor beryl: Comparison with cordierite. Phys. Chem. Miner. 2015, 42, 735–745. [Google Scholar] [CrossRef]
  22. Fridrichová, J.; Bačík, P.; Bizovská, V.; Libowitzky, E.; Škoda, R.; Uher, P.; Ozdín, D.; Števko, M. Spectroscopic and bond-topological investigation of interstitial volatiles in beryl from Slovakia. Phys. Chem. Miner. 2016, 43, 419–437. [Google Scholar] [CrossRef]
  23. Taran, M.N.; Dyar, M.D.; Khomenko, V.M. Spectroscopic study of synthetic hydrothermal Fe3+-bearing beryl. Phys. Chem. Miner. 2017, 45, 489–496. [Google Scholar] [CrossRef]
  24. Yu, X.-Y.; Hu, D.-Y.; Niu, X.-W.; Kang, W.-R. Infrared Spectroscopic Characteristics and Ionic Occupations in Crystalline Tunneling System of Yellow Beryl. Jom 2017, 69, 704–712. [Google Scholar] [CrossRef]
  25. Fukuda, J.; Shinoda, K. Water molecules in beryl and cordierite: High-temperature vibrational behavior, dehydration, and coordination to cations. Phys. Chem. Miner. 2011, 38, 469–481. [Google Scholar] [CrossRef]
  26. Makreski, P.; Jovanovski, G. Minerals from Macedonia XXIII. Spectroscopic and structural characterization of schorl and beryl cyclosilicates. Spectrochim. Acta A Mol. Biomol. Spectrosc. 2009, 73, 460–467. [Google Scholar] [CrossRef]
  27. Kolesov, B. Vibrational states of H2O in beryl: Physical aspects. Phys. Chem. Miner. 2008, 35, 271–278. [Google Scholar] [CrossRef]
  28. Bellatreccia, F.; Della Ventura, G.; Piccinini, M.; Grubessi, O. Single-crystal polarised-light FTIR study of an historical synthetic water-poor emerald. Neues Jahrb. Mineral.-Abh. 2008, 185, 11–16. [Google Scholar] [CrossRef]
  29. de Donato, P.; Cheilletz, A.; Barres, O.; Yvon, J. Infrared spectroscopy of OD vibrators in minerals at natural dilution: Hydroxyl groups in talc and kaolinite, and structural water in beryl and emerald. Appl. Spectrosc. 2004, 58, 521–527. [Google Scholar] [CrossRef]
  30. Wang, P.; Gray, T.P.; Li, Z.; Anderson, E.J.D.; Allaz, J.; Smyth, J.R.; Koenig, A.E.; Qi, L.; Zhou, Y.; Raschke, M.B. Mineralogical classification and crystal water characterisation of beryl from the W–Sn–Be occurrence of Xuebaoding, Sichuan province, western China. Mineral. Mag. 2021, 85, 172–188. [Google Scholar] [CrossRef]
  31. Belyanchikov, M.A.; Abramov, P.A.; Ragozin, A.L.; Fursenko, D.A.; Gorshunov, B.P.; Thomas, V.G. Distribution of D2O Molecules of First and Second Types in Hydrothermally Grown Beryl Crystals. Cryst. Growth Des. 2021, 21, 2283–2291. [Google Scholar] [CrossRef]
  32. Branca, C.; Arcovito, A.; Cosio, E.; Interdonato, M.; Sabatino, G.; Wanderlingh, U.; D’Angelo, G. Combining Fourier transform infrared and Raman spectroscopies with Gaussian deconvolution: An improved approach for the characterization of emeralds. J. Raman Spectrosc. 2019, 51, 693–701. [Google Scholar] [CrossRef]
  33. Adams, D.M.; Gardnet, I.R. Single-crystal vibrational spectra of beryl and dioptase. J. Chem. Soc. 1974, 1, 1502–1505. [Google Scholar] [CrossRef]
  34. Guo, H.-S.; Yu, X.-Y.; Zheng, Y.-Y.; Sun, Z.-L.; Ng, M.F.-Y. Inclusion and Trace Element Characteristics of Emeralds from Swat Valley, Pakistan. Gems Gemol. 2020, 56, 336–355. [Google Scholar] [CrossRef]
  35. Zwaan, J.C.; Kanis, J.; Neto, M.T.O.C.; Häger, T.; Jacob, D.E. Emeralds from the Fazenda Bonfim Region, Rio Grande do Norte, Brazil. Gems Gemol. 2012, 48, 2–17. [Google Scholar] [CrossRef]
  36. Zheng, Y.-Y.; Yu, X.-Y.; Guo, H.-S. Major and Trace Element Geochemistry of Dayakou Vanadium-Dominant Emerald from Malipo (Yunnan, China): Genetic Model and Geographic Origin Determination. Minerals 2019, 9, 777. [Google Scholar] [CrossRef] [Green Version]
  37. Liu, Y.-S.; Hu, Z.-C.; Gao, S.; Günther, D.; Xu, J.; Gao, C.-G.; Chen, H.-H. In situ analysis of major and trace elements of anhydrous minerals by LA-ICP-MS without applying an internal standard. Chem. Geol. 2008, 257, 34–43. [Google Scholar] [CrossRef]
  38. Yu, X.-Y.; Long, Z.-Y.; Zhang, Y.; Qin, L.-J.; Zhang, C.; Xie, Z.-R.; Wu, Y.-R.; Yan, Y.; Wu, M.-K.; Wan, J.-X. Overview of Gemstone Resources in China. Crystals 2021, 11, 1189. [Google Scholar] [CrossRef]
  39. Henry, R.E.; Groat, L.A.; Evans, R.J.; Cempírek, J.; Škoda, R. A Crystallographically Supported Equation for Calculating Water in Emerald from the Sodium Content. Can. Mineral. 2021, 59, 337–354. [Google Scholar] [CrossRef]
  40. Groat, L.A.; Giuliani, G.; Marshall, D.D.; Turner, D. Emerald deposits and occurrences: A review. Ore Geol. Rev. 2008, 34, 87–112. [Google Scholar] [CrossRef]
  41. Marshall, D.; Downes, P.; Ellis, S.; Greene, R.; Loughrey, L.; Jones, P. Pressure–Temperature–Fluid Constraints for the Poona Emerald Deposits, Western Australia: Fluid Inclusion and Stable Isotope Studies. Minerals 2016, 6, 130. [Google Scholar] [CrossRef] [Green Version]
  42. Shi, S.-P.; Zhang, Q.; Zhang, L.; Wang, R.; Zhu, Z.-H.; Jiang, G.; Fu, Y.-B. Geometrical structures, vibrational frequencies, force constants and dissociation energies of isotopic water molecules (H2O, HDO, D2O, HTO, DTO, and T2O) under dipole electric field. Chin. Phys. B 2011, 20, 174–181. [Google Scholar] [CrossRef]
Figure 1. Channel configurations of type I H2O (a), type IIs H2O (b), and type IId H2O (c). Modified after [2,16,22].
Crystals 12 00331 g001
Figure 2. Fifteen rough emeralds from Dayakou (China) and one emerald crystal from Colombia (col-022).
Crystals 12 00331 g002
Figure 3. Raman spectra of Dayakou emeralds. (a) “Alkali-poor” pattern of sample YEW-33 shows that the 3605 cm−1 peak (P1) is more intense than the 3596 cm−1 peak (P2). (b) “Medium alkali” pattern of YEW-29 shows the similar intensity of both peaks. (c) “Alkali-rich” pattern of YEW-22 shows that the intensity of P2 exceeds that of P1. (d) Waterfall plots of the Raman spectra of all Dayakou samples.
Crystals 12 00331 g003
Figure 4. (a) IR spectra of Dayakou samples in the range of 6000–600 cm−1; (b) IR spectrum of Colombian sample in the region of 4000–400 cm−1.
Crystals 12 00331 g004
Figure 5. IR spectra of Dayakou samples with different contents of alkali elements in the region of 1550–1700 cm−1.
Crystals 12 00331 g005
Figure 6. IR spectra of four representative Dayakou samples in the region of 3500–3800 cm−1. (a) and (b): IR spectra “alkali-poor” samples (YEW-33 and YEW-32); (c): IR spectrum of YEW-1 with medium alkali content; (d): IR spectrum of “alkali-rich” sample (YEW-22); experimental spectrum = black solid line, fitted peaks = cyan solid line, cumulative fit = red dash line.
Crystals 12 00331 g006
Figure 7. Comparisons between IR spectra of Dayakou samples with distinct alkali contents.
Crystals 12 00331 g007
Figure 8. IR spectra of D2O and HDO molecules in Colombian sample in the region of 2600–2850 cm−1. Experimental spectrum = black solid line, fitted peaks = cyan solid line, cumulative fit = red dash line.
Crystals 12 00331 g008
Figure 9. Configurations and IR absorption features of type I (a), type IId (b), and type IIs (c) H2O molecules in natural emeralds. * = IR bands determined by previous works in Table 3.
Crystals 12 00331 g009
Figure 10. Logarithmic relationship between PA3596 (cm−1) and Na+ (apfu). PA3596 = peak area of 3596 cm−1 band, apfu = atoms per formula unit, fitted curve = black solid line.
Crystals 12 00331 g010
Figure 11. IR absorption features and possible configurations of type II-Li (a) and type III (b) H2O molecules in natural emeralds.
Crystals 12 00331 g011
Figure 12. Configurations and IR absorption features of D2O (a) and HDO (b) molecules in Colombian emerald.
Crystals 12 00331 g012
Table 1. Concentrations of alkali elements (in ppm), major elements (oxide, in wt.%), and H2O (apfu) in Dayakou emeralds.
Sample No.YEW-1YEW-5YEW-6YEW-10YEW-11YEW-12YEW-14YEW-19YEW-22YEW-24YEW-25YEW-28YEW-29YEW-32YEW-33
SiO2 (wt.%)64.8565.3965.8364.0565.4565.0666.3364.8666.9365.2565.5166.5967.0566.4666.98
BeO (wt.%)14.2314.0813.9013.7913.7014.1613.2514.1812.8614.3714.4213.7513.8914.1213.88
Al2O3 (wt.%)18.1315.3815.9016.0416.3316.7616.6716.4515.8615.7515.7416.8815.9617.0616.56
Li (ppm)445303343438373507569379654345290311278343294
Na (ppm)7648897510,40910,09910,33911,112791611,86410,548997710,8146274640257485612
K (ppm)bdlbdlbdlbdlbdlbdlbdlbdlbdlbdlbdlbdlbdlbdlbdl
Rb (ppm)8.033.025.423.237.316.414.025.213.924.221.922.923.723.016.4
Cs (ppm)9902508194417983123104477124172254210119041515187815041242
Alkali elements total
(ppm)
909111,81912,72112,35813,87212,679927014,68513,46912,44813,0298123858276187164
Li+(apfu)0.0360.0240.0270.0360.0300.0400.0450.0300.0510.0270.0230.0240.0220.0270.023
Na+0.1850.2150.2480.2470.2480.2680.1870.2870.2470.2400.2590.1480.1500.1360.131
Rb+0.0000.0000.0000.0000.0000.0000.0000.0000.0000.0000.0000.0000.0000.0000.000
Cs+0.0040.0100.0080.0080.0130.0040.0030.0100.0090.0090.0080.0060.0080.0060.005
H2O *0.6930.7260.7630.7620.7620.7850.6950.8060.7620.7540.7750.6520.6540.6380.634
Alkali ions total0.2250.2500.2830.2910.2900.3130.2350.3270.3070.2760.2900.1780.1790.1690.159
Na+/Alkali ions82.27%86.12%87.56%85.09%85.28%85.64%79.66%87.60%80.47%86.83%89.30%82.85%83.63%80.38%82.46%
Li+/Alkali ions15.87%9.63%9.55%12.23%10.19%12.94%18.96%9.26%16.53%9.95%7.93%13.60%12.05%15.89%14.31%
Cs+/Alkali ions1.84%4.16%2.83%2.62%4.45%1.39%1.34%3.09%2.97%3.16%2.72%3.46%4.24%3.64%3.16%
Note: Compositions were recalculated on the basis of Si = 6. Apfu = atoms per formula unit. bdl = below detection limit. * Calculated using [1.1061 * Na+ (apfu) + 0.4884 = H2O (apfu)] proposed by [39].
Table 2. Raman peak information of water molecule in Dayakou emeralds.
Sample No.YEW-1YEW-5YEW-6YEW-10YEW-11YEW-12YEW-14YEW-19YEW-22YEW-24YEW-25YEW-28YEW-33Range
PI (a.u.)3596 cm−1206311086878659421176239813481300158776919801725767–2061
3605 cm−111131648136616991814144611122061184918601408802767687–2398
3596 cm−1/3605 cm−10.541.491.991.961.931.230.461.531.421.171.830.400.440.40–1.99
FWHM (cm−1)3596 cm−111.713.214.89.314.513.29.514.214.714.814.611.410.49.3–14.8
3605 cm−14.76.74.95.54.84.93.56.76.96.37.24.73.83.5–7.2
3596 cm−1/3605 cm−12.471.973.011.673.002.692.712.102.142.372.022.442.771.67–3.01
PA (cm−1)3596 cm−116,82927,99523,47820,46331,30522,47513,74734,38531,87133,38523,950973289128912–34,385
3605 cm−112,76396684413626759527529890111,85211,66712,981721712,11268964413–12,981
3596 cm−1/3605 cm−11.322.905.323.275.262.991.542.902.732.573.320.801.290.80–5.32
Note: PI = peak intensity, FWHM = full width at half maxima, PA = peak area.
Table 3. Assignments of the IR absorption bands (cm−1) of H2O, HDO, and D2O molecules in beryls and emeralds.
This Work
(cm−1, Unpolarized)
Refs. [1,2,4,7,9,11,14,16,17,18,19,20,21,22,23,24,25,26,27,28,29,30,31,32,33,34,35]
(cm−1)
AssignmentsPolarization
Relative to c Axis
DayakouColombia
7143/7144H2OI1 + ν3)/HDOIOH
7044/7102H2OII (ν1 + ν3)unpolarized
5297D2OI1 + ν3)
5273 5274/5276H2OI or H2OII2 + ν3)?
5038HDOI (d + νOH)
4076HDOI (d + νOD)
3825/3979/4057/4060H2OII3 + νlibr)
3914D2OI2 + ν3)
3747/3850/3863/3880H2OI or H2OII3 + νlibr)?
3703–3705 3690/3693/3696–3700H2OI3)
3674/3683 3653/3660/3661/
3666//3670/3671
H2OII3) (unclassified)
3661/3666 3661/3662/3664/3665H2OIId3)
3650–3652 3643/3651H2OIIs3)
3655HDOIOH)
3636HDOIIOH)
3628/3634/3637 3602–3610
3630–3635
3647/3649/3650
H2OI1)
3587–3599H2OII1) (unclassified)
3602–3604 3596/3597/3600/3602H2OIId1)
3593 3586–3589H2OIIs1)
3222/3230/3236H2OII (2ν2) or [Fe2(OH)4]2+
3019/2956D2OI3 + νlibr)
28132876D2OII3 + νlibr)
27502745D2OI3)
2724/27362728/2729D2OII3)
26842687HDOIOD)
26732673/2675/2676HDOIIOD)
26402635D2OI1)
26292631/2634/2641D2OII1)
1637 1622/1623/1630/
1631/1633/1637
H2OII2) (unclassified)
1619/1620/1627/1628H2OIId2)
1631/1633/1637/1638H2OIIs2)
1603
[1558, 1651]
1599–1607 [1546, 1645]H2OI2)
Publisher’s Note: MDPI stays neutral with regard to jurisdictional claims in published maps and institutional affiliations.

