1. Introduction
Opals are naturally occurring hydrous silica materials (SiO
2·nH
2O) exhibiting different degrees of crystallinity and crystal structure. [
1,
2]. Fire opal is an attractive variety characterized by its intense red-orange-yellow body color and is mainly produced in Mexico. The discovery of hydrophane opal sparked the industry’s interest. Ethiopian opal’s hydrophane nature renders it susceptible to a variety of treatments, including dyeing. Dyed opals with more believable colors have gradually entered the jewelry market and may pose new identification challenges. Several purple opals, with relatively high transparency, reported to be natural gems from Mexico were proved to have undergone a dyeing treatment [
3]. The dyeing treatment to produce the fake body-color, e.g., orange, blue, and black, was confirmed by soaking the samples in water and making the water change color [
4,
5]. The previous literature has primarily focused on the water immersion test, which may cause irreversible damage to the samples [
3,
4,
5,
6]. Very little is published on the non-destructive testing of dyed fire opals and their comparison to the natural samples with similar color saturation.
In this study, we compared the appearance, gemological properties, and other analytical results of the dyed material to natural opals with similar colors from Mexico and Ethiopia. The aim of this paper is to provide new reference data and methodological support for the non-destructive testing of natural and dyed fire opals.
2. Materials and Methods
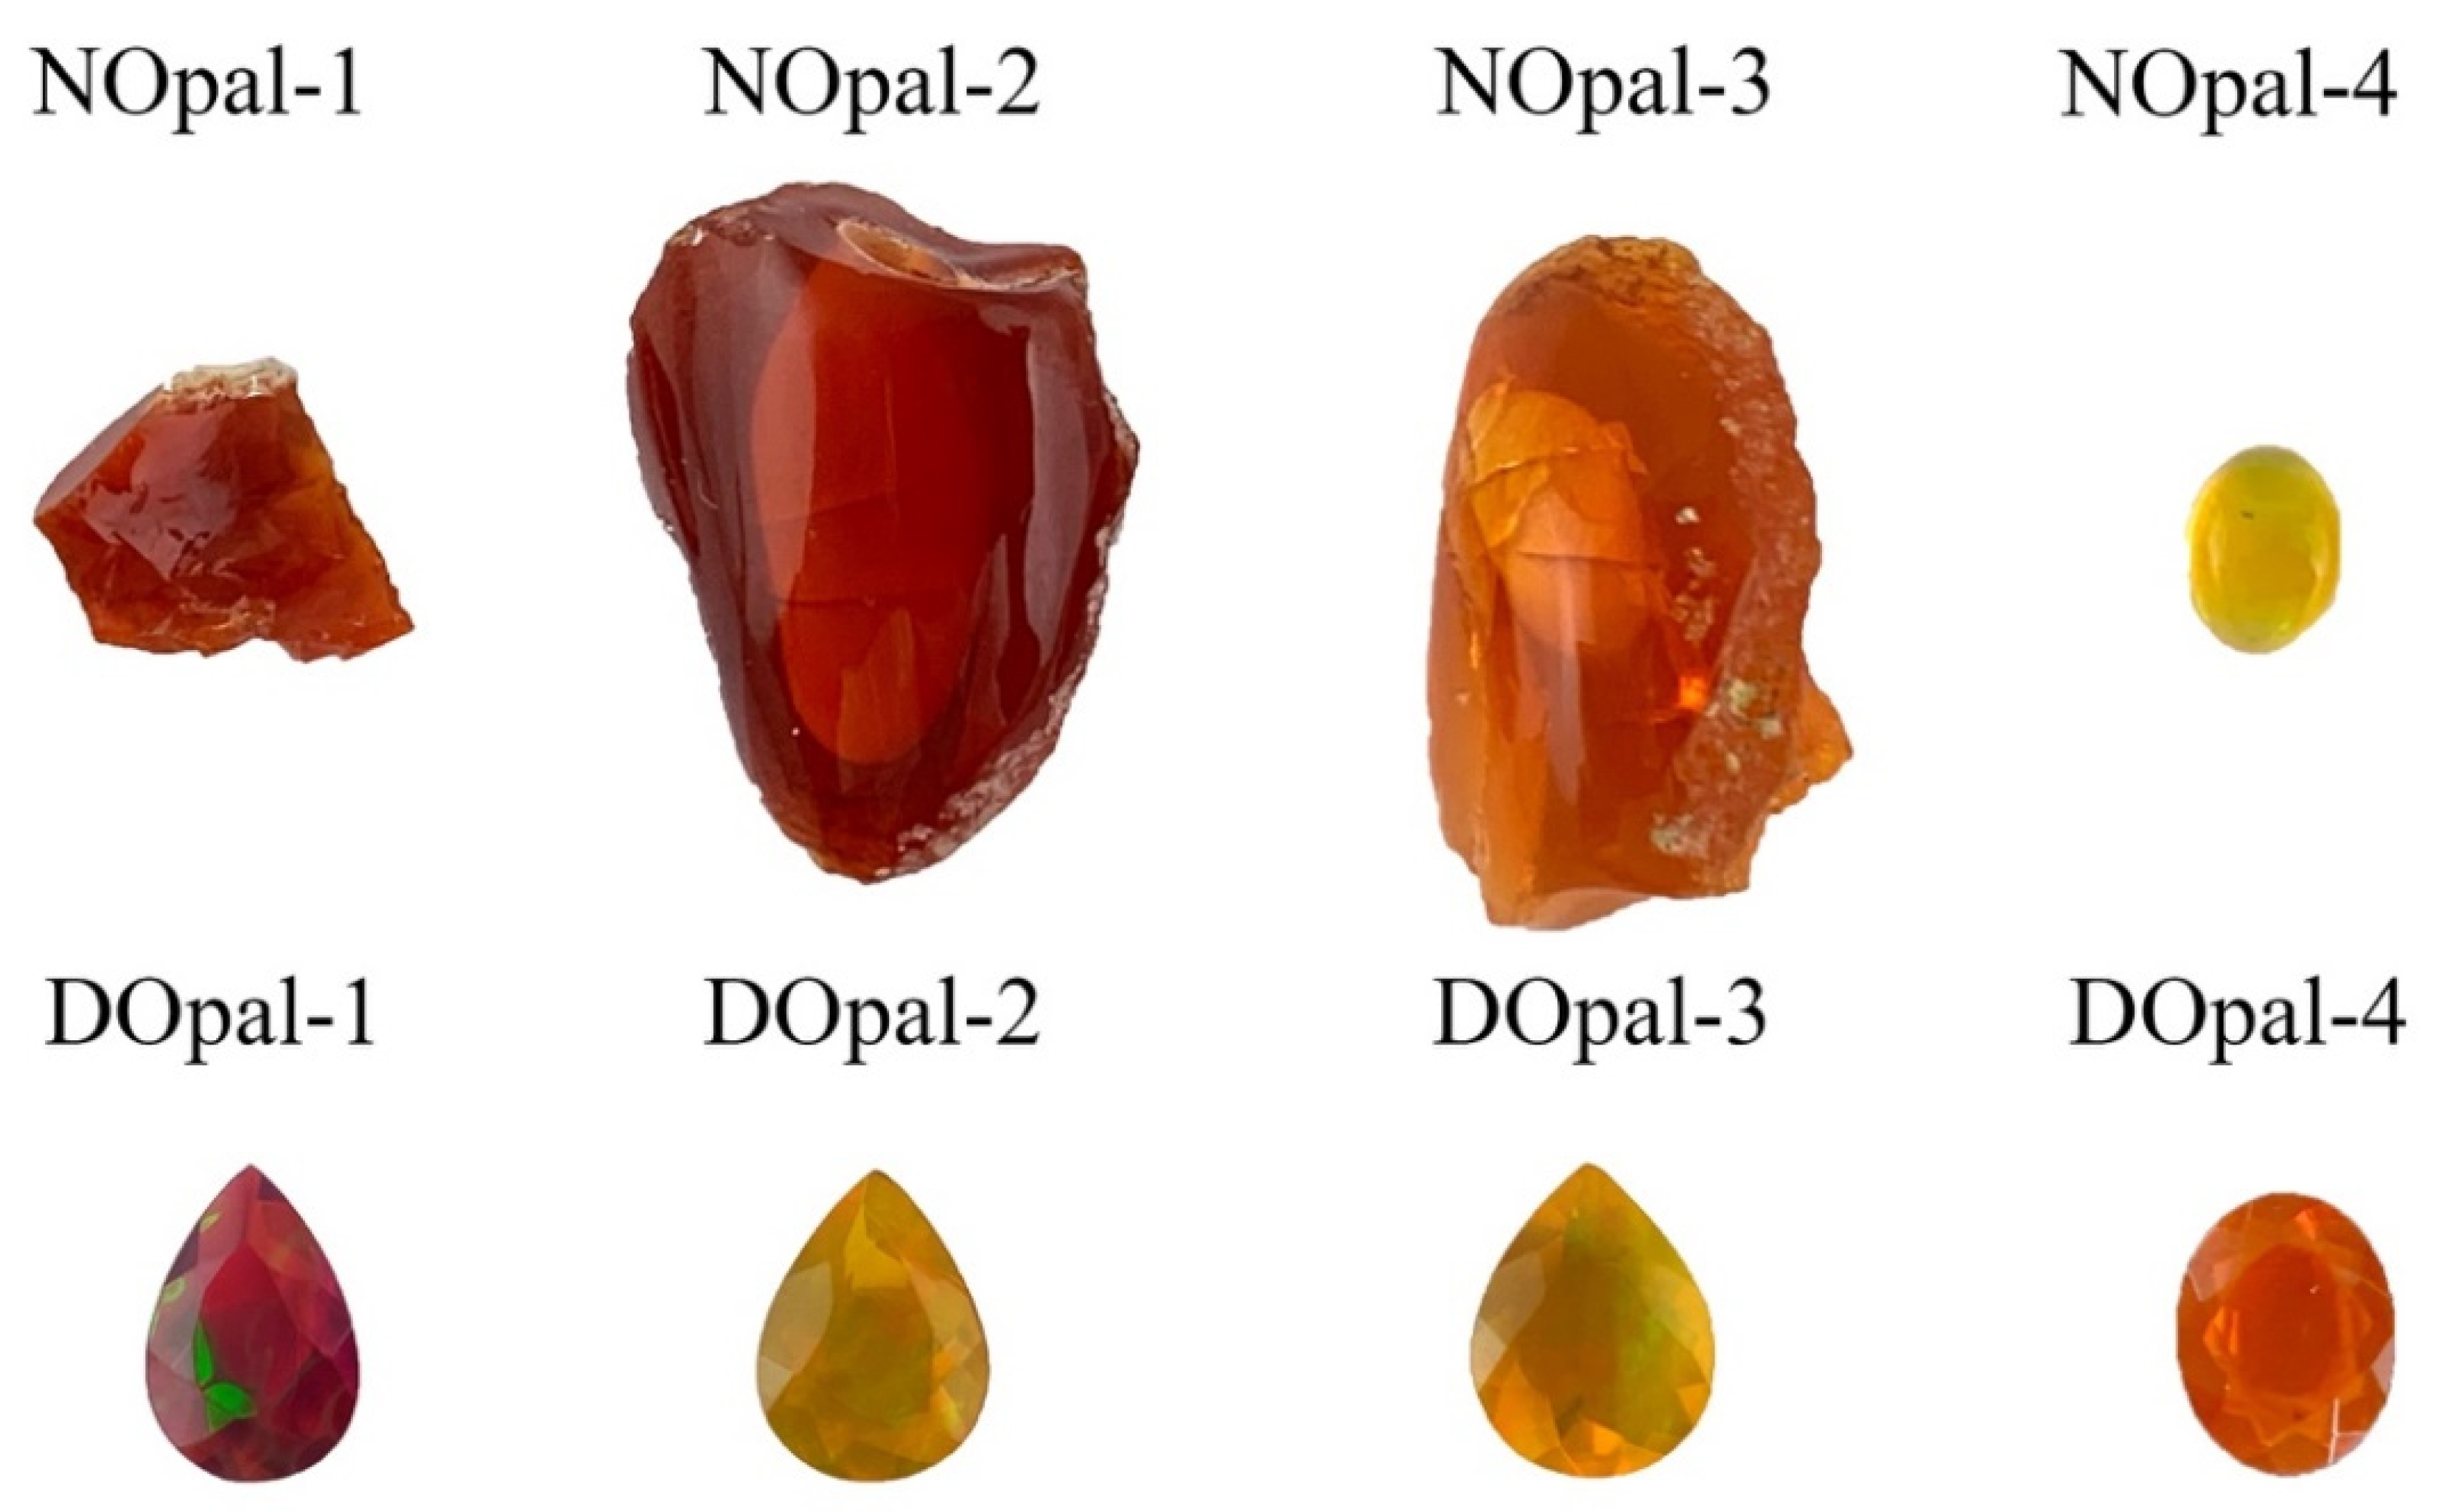
Three natural rough, one natural cabochon, and four dyed faceted fire opals, ranging from 0.49 to 18.01 ct and obtained from trusted gem dealers, were analyzed for the study (
Figure 1). Three of the natural samples with red and orange body color were fire opals from Mexico (NOpal-1–NOpal-3); one sample with yellow body color was a hydrophane opal from Ethiopia (NOpal-4). Several samples (NOpal-4, DOpal-1–DOpal-3) also displayed a distinct play of color phenomena. The analyzed opals presented a luster from greasy to vitreous, and the diaphaneity varies from transparent to translucent.
Standard gemological characterization of all the samples was determined with a GIC refractometer and a long-wave (365 nm) and short-wave (254 nm) UV lamp. The specific gravity (SG) was obtained via the hydrostatic weighing method. Internal features were observed with a VHX-2000 super depth-of-field microscope (max. magnification 200×).
Fourier transform infrared (FTIR) spectroscopy was performed on a Thermo Scientific Nicolet iS50 FTIR spectrometer (Thermo Fisher Scientific, Waltham, MA, USA). Diffuse reflectance spectra (samples measured from 400 to 2000 cm−1) were obtained via the Pike UpIR™ (upward-looking diffuse reflectance accessory) in atmosphere. Transmission mode spectra were recorded in the 2000–6000 cm−1 range. All the spectra were collected at 8 cm−1 resolution and with 32 scans.
All the samples were also tested with a Renishaw inVia Raman microscope, under the following instrumental conditions: 532 nm and 785 nm lasers, gratings of 1800 and 1200, spectral resolution 1 cm−1, test range of 100–2000 cm−1.
A QSpec Gem-3000 spectrophotometer was used to obtain ultraviolet-visible near-infrared (UV-Vis-NIR) absorption spectra at room temperature, under the following instrumental conditions: 150 ms integration time, 8 average number, 2 nm smoothing width, 400–1000 nm wavelength collection.
X-ray fluorescence spectra were collected using a Thermo Scientific ARL Quant’X energy-dispersive X-ray fluorescence spectrometer with Mid Za testing conditions, including 16 keV operating voltage, 1.98 mA working current, 100 s, a vacuum environment, and Pd filter.
A laser ablation-plasma mass spectrometer (LA-ICP-MS) was used to analyze the chemical composition of the samples, under the following instrumental conditions: laser ablation system: NWR-213. ICP-MS mass spectrometer: PerkinElmer 350 D, laser spot beam diameter 44 μm, energy 60%, frequency 10 Hz, single-point acquisition time 40 s. The standards were NIST SRM 610 and NIST SRM 612.
3. Results and Discussion
3.1. Gemological Properties
All the samples showed yellow to red body color with moderate to high saturation. The refractive index (RI) measurements of the eight samples were between 1.40 and 1.43 (
Table 1). Due to the hygroscopicity of the hydrophane opal [
4,
6,
7], we soaked the hydrostatically measured hydrophane before letting the stones soak completely immersed in water. All the natural samples showed no response to long-wave UV radiation, while the dyed samples showed a weak to moderate whitish-yellow luminescence under long-wave UV radiation (
Figure 2).
Ultra-depth microphotographs revealed the even color distribution of all the natural opals, although color bands are also observed (
Figure 3). Dyed samples displayed distinct color concentrations along the edges of the stones (
Figure 4b). Subtle color concentrations and irregular color patches were also seen in some samples (
Figure 4c,d).
3.2. FTIR Spectroscopy
In a recent spectroscopic test of opals, three major silicon-oxygen fingerprint bands in the 450–500, 780–820, and 1000–1300 cm
−1 regions have been identified that are common to all types of opal [
8,
9,
10]. The three bands may be split into transverse optical (TO) and longitudinal optical (LO) components [
11,
12,
13]. TO/LO phonons create oscillating dipole moments with different oscillation directions. The direction of TO phonons is perpendicular to the phonon propagation direction, whereas the dipole moment for LO phonons oscillates in the propagation direction. LO-TO splitting is created by the diverged energies of the LO and TO phonons, caused by long-range electrostatic interactions. This is called the Berreman effect for thin films and has been observed for bulk silica glasses [
14,
15]. In this study, TO
1 /LO
1, TO
2 /LO
2, and TO
3 /LO
3 are used to assign the three bands described above. It is worth mentioning that a shoulder at approximately 1250 cm
−1 is presumably due to either the LO
3 bands or a mixed LO–TO mode with dominant LO
3 character [
8,
9,
11,
12].
FTIR diffuse reflectance spectra were collected in the low-frequency region of 400–2000 cm
−1 (
Figure 5), characterized by the three strong peaks typical of framework silicates (Si-O-Si bending) [
10,
16,
17,
18], with the main peaks in the range of 1099–1115 cm
−1 (
Table 2). According to previous studies [
8,
9,
19,
20,
21], the infrared spectra may also be instrumental in classification and provenance. The frequencies of the band near 790 cm
−1 are related to the degree of crystallinity, which is always at higher frequencies in opal-A (non-crystalline opal, 796–800 cm
−1) and opal-C (793–794 cm
−1) compared to those of opal-CT (micro-crystalline opal, 788–792 cm
−1) [
21]. The band at 470 cm
−1 shifted toward lower values from opal-C (475–481 cm
−1) to opal-A (466–472 cm
−1), through opal-CT (472–477 cm
−1) [
21], as shown in
Table 3. The results showed that all the analyzed opals are CT-type, i.e., semi-crystalline, with variable contents of α-cristobalite and α-tridymite.
The strongest absorption peaks of the dyed fire opals were all located near 1099 cm
−1, accompanied by a shoulder near 1241 cm
−1, which confirmed the hydrophane nature of the dyed materials [
4]. The natural yellow opal from Ethiopia showed the same features. In contrast, the strongest absorption peaks of natural fire opals from Mexico were shifted toward around 1115 cm
−1, with a shoulder near 1255 cm
−1. According to previous studies [
4,
22,
23,
24], the diameter of silica spheres in Ethiopian opal is in the range of 20–70 nm (mostly 30 nm), which is smaller than that of opals with a play-of-color from other origins, such as Australia, usually containing spheres with a diameter of between 150 and 300 nm. Additionally, the arrangement of spheres is irregular. Regular arrangements can only appear within a certain range, showing a regular ladder-shaped lamellar structure. There are filamentary and mesh-like gaps with varying intervals in the lamellar structure. The spheres can also agglomerate tightly in a small area, and there are more gaps between irregular agglomerates, which are random and irregular [
22]. This structure creates larger vacancies between spheres, allowing the dyeing materials to enter the structure easily. Owing to the greater porosity and, therefore, the stronger absorption, hydrophane opals are preferred for carrying out the dyeing treatment.
The transmitted infrared spectra showed no significant difference between natural and dyed opals (
Figure 6), with a weak peak around 5600 cm
−1, a strong band centered at about 5200 cm
−1 due to structural water, and a weak absorption near 4500 cm
−1 caused by the combination bending and stretching of OH in silanol groups (ν
B(SiOH) + ν
S(OH)) [
10,
15,
19] (
Table 2).
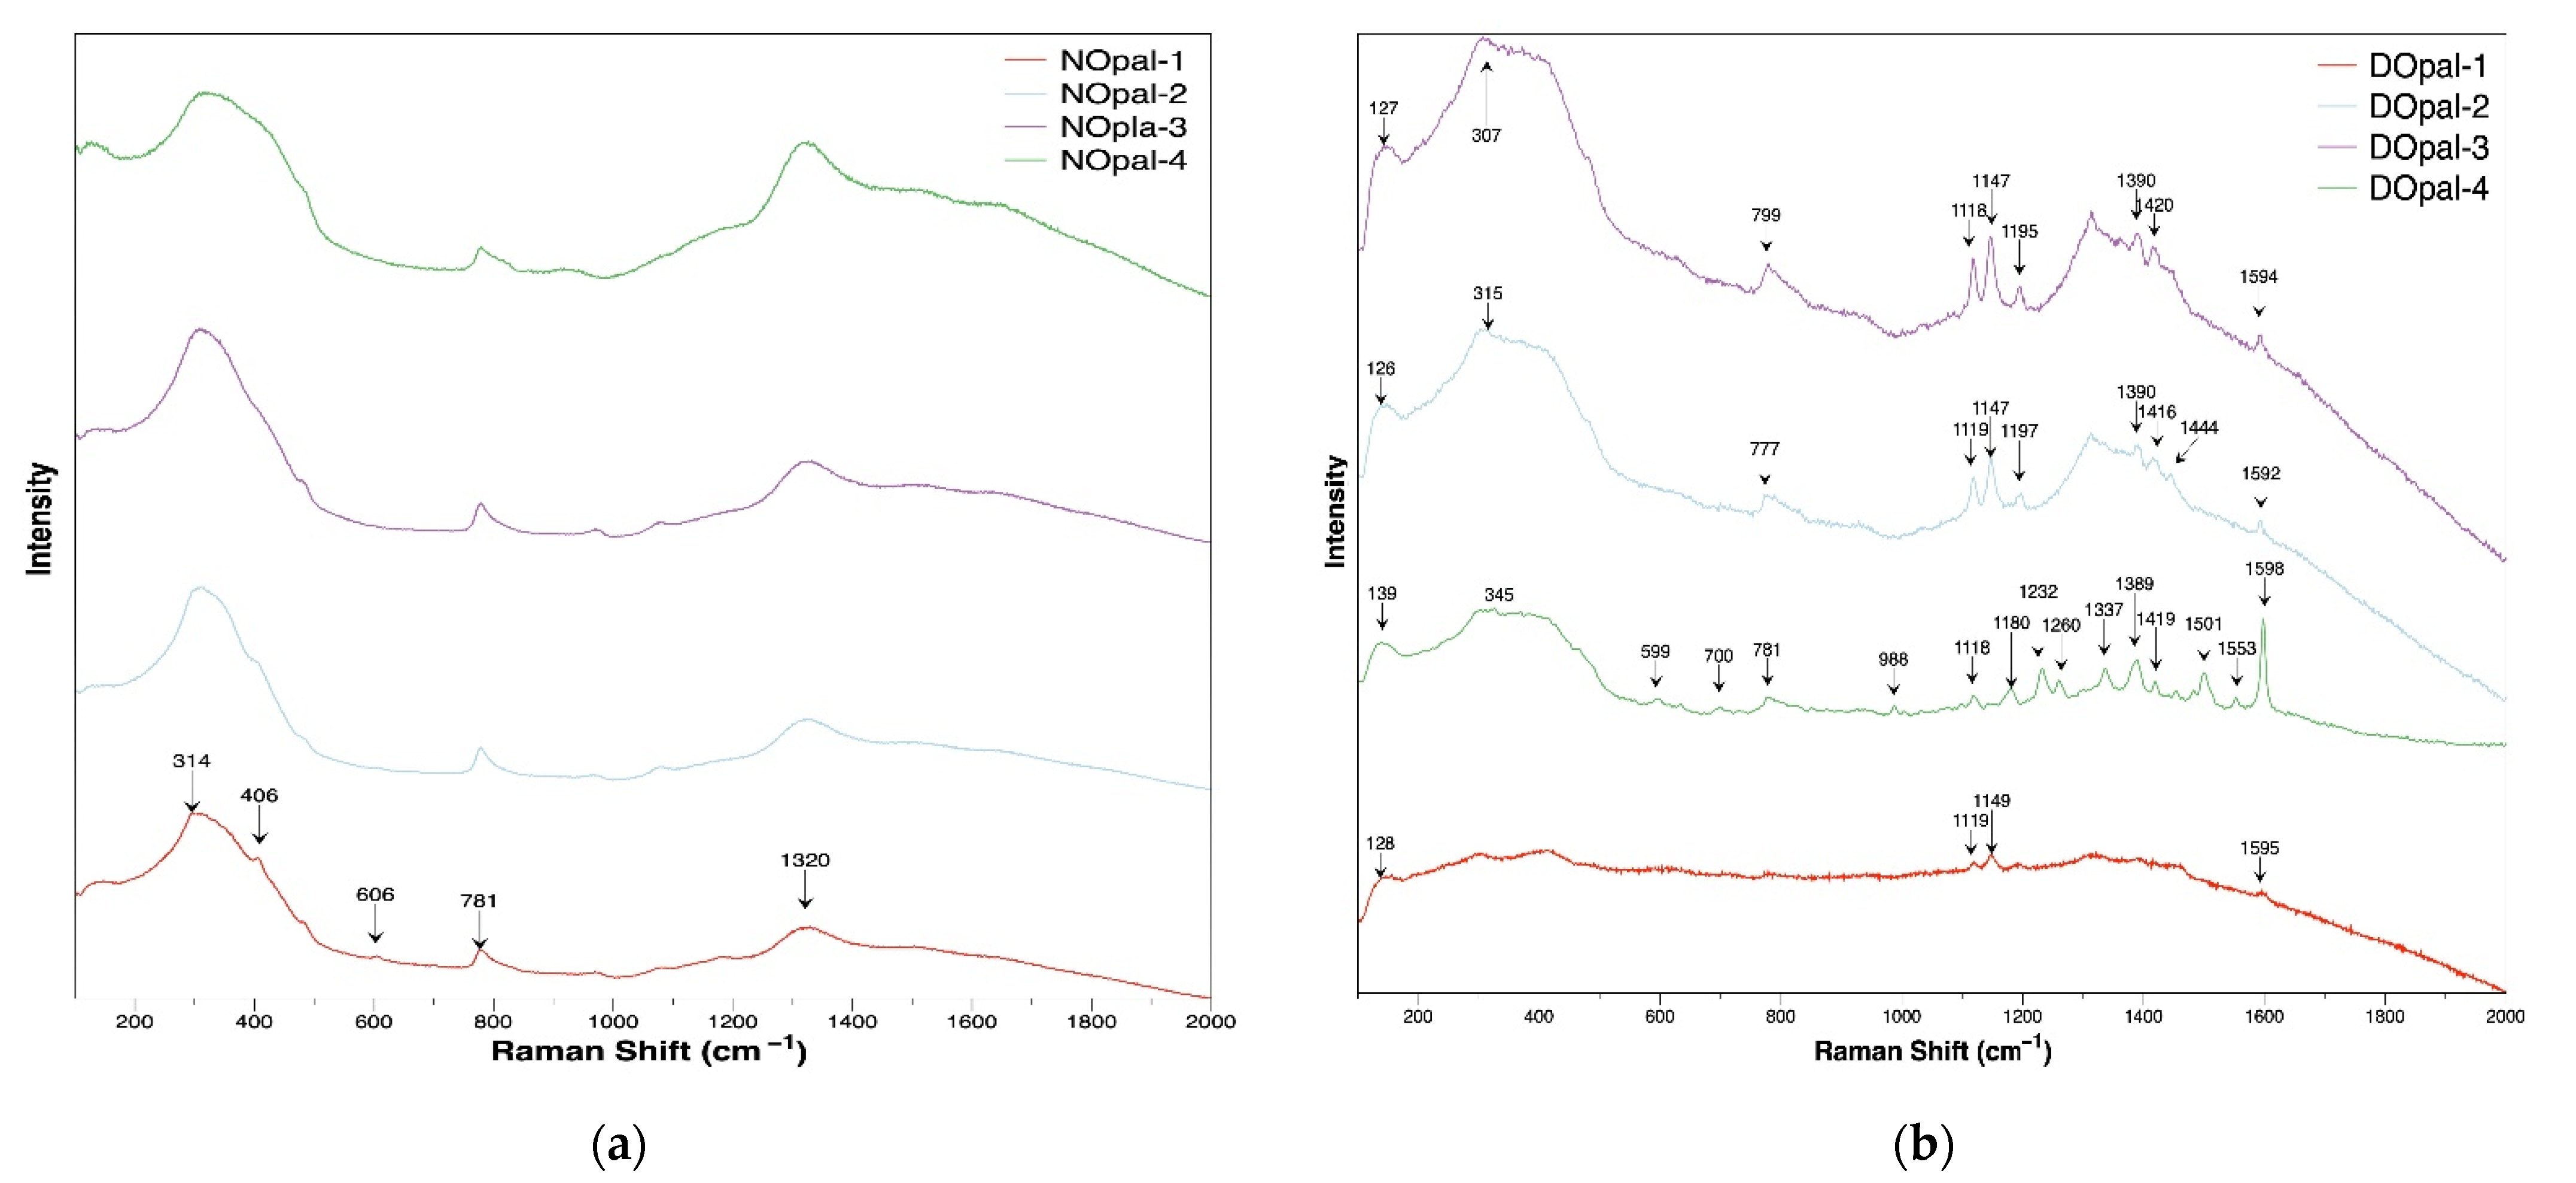
3.3. Raman Spectroscopy
All the opals exhibited strong Raman signals in the range of 100–2000 cm
−1, which is typical of framework silicates (
Figure 7 and
Figure 8) [
8,
9]. These broad bands also indicated that the more crystalline samples are significantly disordered (
Table 4). The major absorptions of opal and silica occurred predominantly in the region of 200–500 cm
−1, showing broad bands with varying degrees of fine detail for opal-A and opal-CT [
8,
9]. According to the literature [
20], the position of the maximum peak of the most intense band in this range is a key factor in distinguishing opal-A and opal-CT. For opal-A, the broad band is centered at around 430 cm
−1, while opal-CT presented a maximum at around 320–330 cm
−1 [
20], which is attributed to the superposition of a typical maximum of disordered tridymite modifications and cristobalite [
25]. Opal-C showed relatively sharp peaks, similar to those for α–cristobalite [
26]. In our study, the maximum in this range is located at around 330 ± 10 cm
−1; thus, the samples we studied are all opal-CT.
Raman analysis also showed a series of characteristic peaks at 222 cm
−1, 295 cm
−1, 606 cm
−1, 660 cm
−1, and 1315 cm
−1 (
Figure 7a), which are in agreement with that of hematite, according to the RRUFF online database [
27]. This result confirmed that the color of natural fire opal is caused by inclusions of iron oxides and hydroxides [
28,
29], e.g., hematite. However, when using a 532 nm source, the dyed fire opal with a similar color saturation had a poor unidentifiable signal and a strong fluorescent background (
Figure 7b). Several characteristic peaks at around 1118 cm
−1, 1180 cm
−1, and 1595 cm
−1 are observed in the spectra with the laser at 785 nm and can be attributed to the external organic dyeing materials (
Figure 8b).
3.4. UV-Vis Spectroscopy
UV-Vis spectroscopy of the natural samples revealed a steep drop-down curve toward the red region, with the inflection point having a blue shift as the body color changes from red and orange to yellow (
Figure 9a). The inflection points of natural red and yellow fire opals are located at around 540 ± 10 nm and 480 nm, respectively, which is consistent with those of hematite and goethite, as confirmed by previous research [
31,
32]. Thus, these two minerals are the coloration agents of natural fire opals of corresponding colors. For natural orange fire opal, this position shifts to approximately 520 nm, which is between the positions of the former two. It is worth mentioning that there is a weak crystal-field band centered at 850 nm in the natural red fire opal, which can be assigned to
6A
1→
4T
1, the transition of hematite [
32,
33]. However, the spectra of dyed red opal showed an inflection point located at around 575 nm and no 850 nm band, due to the absence of hematite. In addition, when changing the testing position, several troughs in slightly different positions were found, perhaps due to the play-of-color phenomenon. The inflection points of dyed yellow and orange fire opals are located at about 500 nm and 540 nm, respectively. Meanwhile, we speculated that the slightly changed hue may be the result of the subtle change in position of the inflection; however, we cannot determine the specific values of the range in this study. At present, the results show that the differences between UV-Vis spectra could not assist in detecting the dyeing treatment in yellow and orange samples.
Previous studies [
34,
35] proposed that the iron mineral contents can be determined by calculating their first-order derivative of the spectral curves. The first derivatives of the spectral curve are an excellent qualitative indicator for distinguishing hematite from other hydrated iron oxides. Hematite always shows a single peak in its first derivative curve at 575 ± 10 nm. Hydrated iron oxide spectra are more variable, with several peaks in their first derivative curves at a wavelength shorter than that of the hematite peak. Goethite shows its primary first derivative peak at 535 nm, with a secondary peak at 435 nm.
To further distinguish natural from dyed samples, we calculated the first derivative of the spectral curves (
Figure 10). To reduce the interference of the troughs produced by the play-of-color phenomenon and to minimize the effect on the slope of the first derivative of the spectral curves, we used the Zap function in Renishaw Wire 4.1 software to process the data for DOpal-1 and DOpal-2. The processed data were presented as DOpal-1* and DOpal-2* (
Figure 9b,c). The processed spectrum of the natural red fire opal revealed a single peak at approximately 580–585 nm (
Figure 10a), indicating the existence of hematite [
34]. However, the main peak at about 604 nm (
Figure 10b), which is explicitly not that of hematite, and a secondary peak at 478 nm were observed in the dyed red opal. The spectroscopy of natural yellow fire opal exhibited the main peak at around 525 nm, with a 430 nm sub-peak (
Figure 10a), which is an indication of goethite. Thus, the natural yellow color is caused by the goethite, whereas the peaks that shifted to 539 nm and 481 nm are fingerprints of the dyed yellow sample (
Figure 10a). The first-order derivative spectrum of the natural orange fire opal showed a single peak at 560 nm, and it is assumed that its color may be caused by a mixture of iron oxides and hydroxides, or be influenced by other iron-containing minerals, resulting in a large change in the position of the inflection point and the slope in the UV-vis absorption spectrum. Unfortunately, we have not yet been able to identify their coloring agents effectively by first-order derivatives. The spectroscopy of dyed orange opal is more similar to its natural one. Hence, the first derivatives of the spectral curves can help to distinguish hematite and goethite and to analyze the color origin of natural fire opals, especially the red and yellow ones. The natural and dyed orange samples failed to be distinguishable by this method, due to the complexity of the combinations of iron oxides.
3.5. Chemistry
3.5.1. Energy-Dispersive X-ray Fluorescence Spectroscopy
The Mid Za testing condition of the energy-dispersive X-ray fluorescence spectrometer (EDXRF) was used to test and analyze the Fe content in eight samples. This testing condition is better for the excitation of the element Fe, while it is not the best testing condition to excite the element Si.
Results revealed that the characteristic Ka and Kb peaks of elemental Fe were clearly observed (
Figure 11a), and the Fe contents were positively correlated with the color saturation, which provided important evidence as to the color origin of natural opals. Based on this, the dispersed particles of iron oxides and hydroxides are the main cause of the color in natural fire opals. However, the color of dyed opals was produced by the external dyes; thus, only an extremely weak Ka peak and no Kb peak were exhibited (
Figure 11b). Besides this finding, the obvious characteristic Ka peaks of the elements K and Ca in all the dyed samples indicated their origin to be from Ethiopia [
36,
37]. Previous studies have proved that Ethiopian hydrophane opal is so porous that it will absorb dyeing materials to produce various colors [
3,
4,
5,
6].
To further quantify the difference in iron content between natural and dyed fire opals, Si was selected as the calibration element due to its rather stable content in all samples, regardless of color hues and saturations. The count ratio of Fe/Si of all the samples was further calculated, to compare the Fe relative contents and to distinguish whether the color is caused by the natural iron oxides and hydroxides or by external materials.
The Fe/Si count ratios are calculated as follows: the count rates of Si and Fe are determined based on their Ka region of interest (ROI), and the count ratio values of Fe/Si are obtained via calculation. Generally, Si is selected in the range of 1.56–1.98 keV, whereas Fe is in the 6.16–6.66 keV range.
As shown in
Table 5, the Fe/Si count ratios in natural fire opal ranged from 0.35 to 1.11, while the Fe/Si count ratios in dyed fire opal with similar color saturation were in the range of 0.019–0.052. It is clear that the Fe content in dyed fire opal is much lower than that in natural fire opal, with similar color saturation (
Figure 12).
3.5.2. LA-ICP-MS
Further chemical analyses by LA-ICP-MS confirmed this result (
Table 6.). The iron content in dyed opals (2–48 ppm) is dramatically lower than that of natural samples (361–1648 ppm), proving that the color of dyed stones is not attributed to the iron oxides and hydroxides. The high contents of Na, Mg, Al, K, Ca, and Zr are a good indicator of their origin being from Ethiopia, where many hydrophane deposits are known [
7,
37].
4. Conclusions
The results presented in this study indicate that the combination of color distribution, FTIR spectroscopy, Raman spectroscopy, UV-Vis spectroscopy, and chemistry provide strong proof when distinguishing between natural and dyed fire opal samples. The color of natural fire opals is uniform, while color concentrations are easily observed in dyed samples. The main infrared peak of dyed opals is located at around 1099 cm−1, with a small shoulder at about 1241 cm−1, indicating the hydrophane nature of all the dyed materials. The Raman spectra of natural samples revealed the characteristic peaks of iron oxides and hydroxides, while only those peaks due to external materials appeared in the treated samples. The first derivatives of UV-Vis spectral curves confirmed the absence of hematite or goethite in the dyed opals and confirmed that their color is unrelated to these minerals. Furthermore, the obvious difference in the count ratio of Fe/Si and the Fe content in the natural and dyed samples with similar color saturation provided strong proof as to their different color origins.
Author Contributions
Conceptualization, J.W. and H.M.; data curation, J.W. and P.N.; formal analysis, J.W.; funding acquisition, H.M. and H.L.; investigation, J.W., H.M. and Y.M.; methodology, J.W. and H.M.; software, J.W.; supervision, H.M., H.L. and Y.M.; validation, J.W., H.M., N.T. and H.L.; visualization, J.W. and P.N.; writing—original draft, J.W.; writing—review and editing, J.W. and H.M. All authors have read and agreed to the published version of the manuscript.
Funding
National Gemstone Testing Center Shenzhen Laboratory.
Institutional Review Board Statement
Not applicable.
Informed Consent Statement
Not applicable.
Data Availability Statement
Not applicable.
Acknowledgments
The authors wish to express their great appreciation to Sun Xueying for her help in providing academic advice.
Conflicts of Interest
The authors declare no conflict of interest.
References
- Webster, R. Gems: Their Sources, Description and Identification; Archon Books: Hamdem, CT, USA, 1975. [Google Scholar]
- Leechman, F. The Opal Book; Lansdowne Press: Sydney, Australia, 1984. [Google Scholar]
- Renfro, N.; McClure, S.F. Dyed Purple Hydrophane Opal. Gems Gemol. 2011, 47, 260–270. [Google Scholar] [CrossRef]
- Yu, F.; Fan, G.Z.; Weng, S.F.; Liu, Y.; Sun, M.; Xu, Y.J. A Study of Dyed opals from Ethioipa. Acta Petrol. Mineral. 2014, 33, 123–139. [Google Scholar]
- Larry, T.-A. Water Immersion Revealing Dye in Fire Opal. Gems Gemol. 2013, 49, 185–186. [Google Scholar]
- Zhou, J.N.; Yin, Z.W. Microstructure and Play-of-Colour of Ethiopian Opal. J. Gems Gemmol. 2018, 20, 18–27. [Google Scholar]
- Rondeau, B.; Fritsch, E.; Mazzero, F.; Gauthier, J.-P.; Cenki-Tok, B.; Bekele, E.; Gaillou, E. Play-of-Color Opal from Wegel Tenollo Province, Ethiopia. Gems Gemol. 2011, 47, 90–105. [Google Scholar]
- Curtis, N.J.; Gascooke, J.R.; Pring, A. Silicon-Oxygen Region Infrared and Raman Analysis of Opals: The Effect of Sample Preparation and Measurement Type. Minerals 2021, 11, 173. [Google Scholar] [CrossRef]
- Curtis, N.J.; Gascooke, J.R.; Johnston, M.R.; Pring, A. A review of the classification of opals with reference to recent new localities. Minerals 2019, 9, 299. [Google Scholar] [CrossRef] [Green Version]
- Li, J.; Liu, X.W.; Wang, Y.; Fan, C.X.; Ye, H.; Cheng, Y.F.; Liu, D.Z. Infrared Spectral Features of SiO2 with Different Crystallinity and their Implications. Infrared 2010, 31, 31–35. [Google Scholar]
- Almeida, R.M. Detection of LO modes in glass by infrared reflection spectroscopy at oblique incidence. Phys. Rev. B 1992, 45, 161–170. [Google Scholar] [CrossRef]
- Durman, R.; Favre, P.; Jayasooriya, U.A.; Kettle, S.F.A. Longitudinal optical-transverse optical (L.O.-T.O.) splitting on internal modes in the Raman spectra of noncentric crystals. J. Crystallogr. Spectrosc. Res. 1987, 17, 431–484. [Google Scholar] [CrossRef]
- Armanda, P.; Hermet, P.; Bantignies, J.-L.; Haidoux, A.; Maurin, D.; Ménaert, B.; Peña, A.; Papet, P. Optical properties in the infrared range of the birefringent α-GeO2 single crystal. Mater. Res. Bull. 2020, 129, 110881. [Google Scholar] [CrossRef]
- Harbecke, B.; Heinz, B.; Grosse, P. Optical properties of thin films and the Berreman effect. Appl. Phys. A 1985, 38, 263–267. [Google Scholar] [CrossRef]
- Innocenzi, P. Infrared spectroscopy of sol–gel derived silica-based films: A spectra-microstructure overview. J. Non-Cryst. Solids 2003, 316, 309–319. [Google Scholar]
- Farmer, V.C. The Infrared Spectra of Minerals; Mineralogical Society: London, UK, 1974; p. 539. [Google Scholar]
- Langer, K.; Flörke, O.W. Near Infrared Absorption Spectra (4000–9000 cm−1) of Opals and the Role of “Water” in these SiO2 nH2O minerals. Fortschr. Miner. 1974, 52, 17–51. [Google Scholar]
- Davis, K.M.; Tomozawa, M. An infrared spectroscopic study of water-related species in silica glasses. J. Non-Cryst. Solids 1996, 201, 177–198. [Google Scholar] [CrossRef]
- Plyusnina, I.I. Infrared Spectra of Opals. Sov. Phys. Dokl. 1979, 24, 332–333. [Google Scholar]
- Sodo, A.; Casanova Municchia, A.; Barucca, S.; Bellatreccia, F.; Della Ventura, G.; Butini, F.; Ricci, M.A. Raman, FT-IR and XRD investigation of natural opals. J. Raman Spectrosc. 2016, 47, 377–486. [Google Scholar] [CrossRef]
- Adamo, I.; Ghisoli, C.; Caucia, F. A contribution to the Study of FTIR Spectra of Opals. Neues Jahrb. Mineral.-Abh. 2010, 187, 63–68. [Google Scholar] [CrossRef]
- Luo, J.; Liu, X.F.; Yang, X.X. Comparative Analysis of the Characteristics of Australian Opal and Ethiopian Opal. Superhard Mater. Eng. 2016, 28, 50–57. [Google Scholar]
- Fritsch, E.; Gaillou, E.; Rondeau, B.; Barreau, A.; Albertini, D.; Ostroumov, M. The nanostructure of fire opal. J. Non-Cryst. Solids 2006, 352, 3957–3960. [Google Scholar] [CrossRef]
- Yan, J.; Hu, X.C.; Fang, B.; Tao, J.B.; Peng, Q.J.; Zhang, J. Study on the Mineralogical and Optical Characteristics of Blue Opal from Lishui Investigated by XRF-SEM-XRD-FTIR. Rock Miner. Anal. 2014, 33, 795–801. [Google Scholar]
- Ostrooumov, M. A Raman, infrared and XRD analysis of the instability in volcanic opals from Mexico. Spectrochim. Acta Part A 2007, 68, 1070–1076. [Google Scholar] [CrossRef]
- Bates, J.B. Raman spectra of α and β cristobalite. J. Chem. Phys. 1972, 57, 4042–4047. [Google Scholar] [CrossRef]
- RRUFF. Hematite R050300. Available online: Rruff.info/R050300 (accessed on 21 December 2021).
- Pan, X. The Study on Color Genesis of Fire Opal. China Gems Jades 2020, 157, 72–77. [Google Scholar]
- Simoni, M.; Caucia, F.; Adamo, I.; Galinetto, P. New Occurrence of Fire Opal from Bemia. Madagascar. Gems Gemol. 2010, 46, 114–121. [Google Scholar] [CrossRef]
- Zu, E.D.; Chen, D.P.; Zhang, P.X. Identification of B Jade by Raman Spectroscopy. Spectrosc. Spectral Anal. 2003, 23, 64–66. [Google Scholar]
- Sherman, D.M.; Waite, T.D. Electronic spectra of Fe3+ oxides and oxide hydroxides in the near IR to near UV. Am. Mineral. 1985, 70, 1262–1269. [Google Scholar]
- Torrent, J.; Barrón, V. Diffuse Reflectance Spectroscopy of Iron Oxides. Encycl. Surf. Colloid Sci. 2002, 1, 1438–1446. [Google Scholar]
- Morris, R.V.; Lauer, H.V., Jr.; Lawson, C.A.; Gibson, E.K., Jr.; Nace, G.A.; Stewart, C. Spectral and other physicochemical properties of submicron powders of hematite (α-Fe2O3), maghemite (γ-Fe2O3), magnetite (Fe3O4), goethite (α-FeOOH), and lepidocrocite (γ-FeOOH). J. Geophys. Res. 1985, 90, 3126–3144. [Google Scholar] [CrossRef]
- Barranco, F.T.; Balsam, W.L.; Deaton, B.C. Quantitative Reassessment of Brick Red Lutites: Evidence from Reflectance SpectroPhotometry. Mar. Geol. 1989, 89, 299–314. [Google Scholar] [CrossRef]
- Bou-Orm, N.; AlRomaithi, A.A.; Elrmeithi, M.; Ali, F.M.; Nazzal, Y.; Howari, F.M.; Al Aydaroos, F. Advantages of first-derivative reflectance spectroscopy in the VNIR-SWIR for the quantification of olivine and hematite. Planet. Space Sci. 2020, 188, 104957. [Google Scholar] [CrossRef]
- Zhong, Y.Y. The Gemological and Mineralogical Characteristics of Opal from Different Origins. China Gems Jades 2020, 157, 36–43. [Google Scholar]
- Ren, H.Z.; Li, L.P. Chemistry of Opal from Ethiopia. J. Gems Gemmol. 2015, 17, 23–28. [Google Scholar]
Figure 1.
Shown here are four natural samples, ranging from 0.49 to 18.01 ct, and four dyed samples weighing 0.56–1.26 ct.
Figure 1.
Shown here are four natural samples, ranging from 0.49 to 18.01 ct, and four dyed samples weighing 0.56–1.26 ct.
Figure 2.
Natural and dyed fire opal under natural light (up) and long-wave UV light (down). From left to right: natural and dyed red fire opal, natural and dyed orange fire opal, natural and dyed yellow fire opal. Natural samples showed no response to the long-wave UV light, while dyed samples showed weak to strong fluorescence.
Figure 3.
Digital micrographs of sample NOpal-2 and NOpal-3. (a–c) Even color distribution; (d) Color bands.
Figure 3.
Digital micrographs of sample NOpal-2 and NOpal-3. (a–c) Even color distribution; (d) Color bands.
Figure 4.
Digital micrographs of sample DOpal-1 and DOpal-2. (a) An irregular color distribution; (b) A distinct color concentration along the edge of the stone; (c,d) Subtle color concentrations and irregular color patches.
Figure 4.
Digital micrographs of sample DOpal-1 and DOpal-2. (a) An irregular color distribution; (b) A distinct color concentration along the edge of the stone; (c,d) Subtle color concentrations and irregular color patches.
Figure 5.
Mid-infrared spectra of samples.
Figure 5.
Mid-infrared spectra of samples.
Figure 6.
Mid-infrared spectra of samples (transmission method): (a) natural opals; (b) dyed opals.
Figure 6.
Mid-infrared spectra of samples (transmission method): (a) natural opals; (b) dyed opals.
Figure 7.
Raman spectra of samples with a 532 nm laser: (a) natural opals; (b) dyed opals.
Figure 7.
Raman spectra of samples with a 532 nm laser: (a) natural opals; (b) dyed opals.
Figure 8.
Raman spectra of samples at 785 nm laser: (a) natural opals; (b) dyed opals.
Figure 8.
Raman spectra of samples at 785 nm laser: (a) natural opals; (b) dyed opals.
Figure 9.
UV-VIS absorption spectra: (a) natural opals; (b–d) dyed opals. (The spectra DOpal-1* and DOpal-2* are presented using the processed data).
Figure 9.
UV-VIS absorption spectra: (a) natural opals; (b–d) dyed opals. (The spectra DOpal-1* and DOpal-2* are presented using the processed data).
Figure 10.
First derivative of the UV-VIS absorption spectra: (a) natural opals; (b) dyed opals. (The spectra DOpal-1* and DOpal-2* are the first-order derivative spectra derived from the processed data of DOpal-1 and DOpal-2).
Figure 10.
First derivative of the UV-VIS absorption spectra: (a) natural opals; (b) dyed opals. (The spectra DOpal-1* and DOpal-2* are the first-order derivative spectra derived from the processed data of DOpal-1 and DOpal-2).
Figure 11.
EDXRF spectrum of samples: (a) natural opals; (b) dyed opals.
Figure 11.
EDXRF spectrum of samples: (a) natural opals; (b) dyed opals.
Figure 12.
Fe/Si count ratio of the opal samples: there is a wide difference (more than 15-fold) in the Fe content between natural (mean value 0.43) and treated samples (mean value 0.0285).
Figure 12.
Fe/Si count ratio of the opal samples: there is a wide difference (more than 15-fold) in the Fe content between natural (mean value 0.43) and treated samples (mean value 0.0285).
Table 1.
Descriptions of gemological properties.
Table 1.
Descriptions of gemological properties.
| Sample | Treatment | Body Color | Weight/ct | Origin | Diaphaneity | RI | SG | Fluorescence |
|---|
| NOpal-1 | Natural | Red | 1.44 | Mexico | Transparent | 1.43 | 1.99 | Inert |
| NOpal-2 | Red | 18.01 | Mexico | Transparent | 1.42 | 1.78 | Inert |
| NOpal-3 | Orange | 13.38 | Mexico | Transparent | 1.42 | 1.85 | Inert |
| NOpal-4 | Yellow | 0.49 | Ethiopia | Transparent | 1.40 | 2.00 | Inert |
| DOpal-1 | Dyed | Red | 0.56 | Ethiopia | Transparent to Translucent | 1.41 | 1.78 | Yellow; strong |
| DOpal-2 | Yellow | 1.08 | Ethiopia | Transparent to Translucent | 1.42 | 1.88 | Yellow; weak–moderate |
| DOpal-3 | Yellow | 0.89 | Ethiopia | Transparent to Translucent | 1.41 | 1.89 | Yellow; weak–moderate |
| DOpal-4 | Orange | 1.26 | Ethiopia | Transparent to Translucent | 1.41 | 1.82 | Yellow; strong |
Table 2.
Assignments of the infrared absorption of opal [
8,
9,
15,
16,
17,
18,
21].
Table 2.
Assignments of the infrared absorption of opal [
8,
9,
15,
16,
17,
18,
21].
| Frequency (cm−1) | Assignment |
|---|
| 450–490 | TO1; Si-O-Si rock |
| 500–510 | LO1; Si-O-Si rock |
| 780–800 | TO2; Si-O-Si symmetric stretch |
| 810–820 | LO2; Si-O-Si symmetric stretch |
| 1000–1200 | TO3; Si-O-Si antisymmetric stretch |
| 1240–1250 | LO3; Si-O-Si antisymmetric stretch |
| 4500 | combination bending and stretching of OH in silanol groups |
| 5200 | structural water |
| 5600 | structural water |
Table 3.
Summary of infrared frequency variations in different opal types [
8,
9,
20,
21].
Table 3.
Summary of infrared frequency variations in different opal types [
8,
9,
20,
21].
| Opal Type | Infrared Frequencies (cm−1) |
|---|
| 400–500 | 500–600 | 600–700 | 700–800 |
|---|
| Opal-A | 466–472 | 530 ± 20 | — | 796–800 |
| Opal-CT | 472–477 | — | — | 788–792 |
| Opal-C | 475–481 | — | 630 ± 20 | 793–794 |
Table 4.
Assignments of the Raman shifts of opal [
20,
25,
27,
28,
29,
30].
Table 4.
Assignments of the Raman shifts of opal [
20,
25,
27,
28,
29,
30].
| Frequency (cm−1) | Assignment |
|---|
| 222 | α-Fe2O3 |
| 295 | α-Fe2O3 |
| 330 | O-Si-O deformation vibration |
| 408 | Si-O-Si bending vibration |
| 606 | α-Fe2O3 |
| 660 | α-Fe2O3 |
| 778 | Si-O-Si symmetrical stretching vibration |
| 966 | Si-O stretching vibration |
| 1074 | Si-O-Si antisymmetric stretching vibration |
| 1118 | benzene ring C-C stretching vibration |
| 1180 | benzene ring C-H in-plane bending vibration |
| 1315 | α-Fe2O3 |
| 1595 | benzene ring C-C stretching vibration |
Table 5.
Count ratio of Fe/Si in samples.
Table 5.
Count ratio of Fe/Si in samples.
| Sample Number | Si Count Ratio | Fe Count Ratio | Fe/Si Count Ratio |
|---|
| NOpal-1 | 19,256 | 19,501 | 1.013 |
| 19,006 | 21,041 | 1.107 |
| 18,221 | 18,850 | 1.035 |
| NOpal-2 | 19,670 | 8437 | 0.429 |
| 19,119 | 8280 | 0.433 |
| 18,540 | 8062 | 0.435 |
| NOpal-3 | 18,951 | 7474 | 0.394 |
| 18,768 | 7340 | 0.391 |
| 19,058 | 7932 | 0.416 |
| NOpal-4 | 11,789 | 4258 | 0.361 |
| 10,705 | 4037 | 0.377 |
| 12,730 | 5476 | 0.430 |
| DOpal-1 | 16,148 | 835 | 0.052 |
| 15,250 | 697 | 0.046 |
| 16,863 | 861 | 0.051 |
| DOpal-2 | 15,647 | 589 | 0.038 |
| 14,041 | 422 | 0.030 |
| 12,478 | 440 | 0.035 |
| DOpal-3 | 17,586 | 374 | 0.021 |
| 14,661 | 290 | 0.020 |
| 16,325 | 317 | 0.019 |
| DOpal-4 | 16,111 | 350 | 0.022 |
| 16,122 | 440 | 0.027 |
| 15,921 | 403 | 0.025 |
Table 6.
Chemical composition (ppm) of six opal samples, as obtained by LA-ICP-MS.
Table 6.
Chemical composition (ppm) of six opal samples, as obtained by LA-ICP-MS.
| Element (ppm) | Na | Mg | Al | K | Ca | Fe | Zr | Cs |
|---|
| NOpal-1 | 1 | 278 | 139 | 2474 | 644 | 416 | 1648 | 29 | 0.6 |
| 2 | 281 | 141 | 2491 | 657 | 309 | 1613 | 29 | 0.6 |
| 3 | 285 | 137 | 2505 | 658 | 341 | 1357 | 29 | 0.6 |
| NOpal-2 | 1 | 791 | 2 | 1691 | 301 | 189 | 358 | 6 | 0.8 |
| 2 | 819 | 2 | 1715 | 310 | 232 | 372 | 7 | 0.8 |
| 3 | 825 | 3 | 1718 | 310 | 215 | 361 | 7 | 0.8 |
| NOpal-3 | 1 | 602 | 3 | 1656 | 455 | 101 | 452 | 20 | 1.6 |
| 2 | 558 | 3 | 1529 | 421 | 72 | 421 | 20 | 1.5 |
| 3 | 542 | 2 | 1431 | 410 | 96 | 410 | 19 | 1.4 |
| DOpal-1 | 1 | 1807 | 675 | 18,755 | 7527 | 8039 | 21 | 184 | 4.2 |
| 2 | 1705 | 663 | 18,385 | 7729 | 7873 | 48 | 185 | 4.0 |
| 3 | 1698 | 667 | 18,392 | 7878 | 7737 | 11 | 211 | 4.0 |
| DOpal-2 | 1 | 1402 | 666 | 18,174 | 8439 | 8219 | 22 | 179 | 3.7 |
| 2 | 1399 | 673 | 18,161 | 8157 | 8268 | 7 | 164 | 3.6 |
| 3 | 1416 | 678 | 18,366 | 8323 | 8117 | 27 | 174 | 3.7 |
| DOpal-3 | 1 | 4437 | 129 | 22,416 | 9113 | 7744 | 13 | 44 | 4.1 |
| 2 | 4699 | 133 | 22,306 | 8791 | 7686 | 3 | 45 | 4.3 |
| 3 | 4735 | 139 | 22,674 | 8855 | 7921 | 2 | 48 | 4.3 |
| Publisher’s Note: MDPI stays neutral with regard to jurisdictional claims in published maps and institutional affiliations. |
© 2022 by the authors. Licensee MDPI, Basel, Switzerland. This article is an open access article distributed under the terms and conditions of the Creative Commons Attribution (CC BY) license (https://creativecommons.org/licenses/by/4.0/).


