Article

MATLAB Simulation-Based Theoretical Study for Detection of a Wide Range of Pathogens Using 1D Defective Photonic Structure

1
TH-PPM Group, Physics Department, Faculty of Sciences, Beni-Suef University, Beni Suef 62111, Egypt
2
Department of Physics and Material Science and Engineering, Jaypee Institute of Information Technology, Noida 201304, India
3
Department of Physics, Faculty of Applied Science, Umm Al-Qura University, Mecca 24381, Saudi Arabia
4
Faculty of Technology and Education, Beni-Suef University, Beni Suef 62111, Egypt
*
Author to whom correspondence should be addressed.
Crystals 2022, 12(2), 220; https://doi.org/10.3390/cryst12020220
Submission received: 1 December 2021 / Revised: 15 January 2022 / Accepted: 27 January 2022 / Published: 2 February 2022
(This article belongs to the Special Issue Recent Advances in Photonic Crystal and Optical Devices)

Abstract

:
The present 1D photonic biosensor is composed of two sub-PhCs of alternate layers made of GaP and SiO2. The period number of each PhC has been fixed to 3. Both these PhCs are joined together through a cavity region of air in which different analytes are to be filled one by one under the scope of this study. The theoretical findings of this work have been formulated with the help of the well-known transfer matrix method. Moreover, all the computations pertaining to this work have been carried out with the help of MATLAB software. The effect of change in cavity thickness and angle of incidence corresponding to a TE wave on the transmittance of the structure (AB)ND(AB)N has been studied theoretically which in turn determines the performance of the proposed biosensor. Various parameters, such as sensitivity (S), signal to noise ratio (SNR), figure of merit (FOM), resolution (RS), detection limit (LOD), quality factor (Q) and dynamic range (DR) have been theoretically calculated to evaluate the performance of the proposed design in true sense. The sensitivity of this structure varies between the highest and lowest values of 337.3626 nm/RIU and 333.0882 nm/RIU corresponding to water samples containing Pseudomonas aeruginosa cells and Bacillus anthracia cells, respectively, under normal incidence condition with a cavity thickness of 2.0 µm. The resolution (in nm) and LOD (in RIU) values of the proposed design are small enough and are significant for our structure. This study may also be helpful for distinguishing various microbiological samples under investigation and find suitable applications for discriminating bacterial cells from spores.

1. Introduction

In the recent years, a lot of attention has been paid to ensure food and drinking water safety worldwide. Pathogenic microbes are effortlessly surviving in food and drinking water which may create several health-related problems, such as hepatitis A & E, cholera, and cryptosporidiosis [1,2]. The consumption of contaminated food and/or drinking water [1,2] may cause severe kinds of gastrointestinal tract infections in the human body. Pathogens in humans are classified in two categories by health professionals, such as gram-positive and gram-negative bacteria [3]. The main role of these bacteria is to grow clusters and chains of Staphylococcus aureus and Streptococcus haemolyticus cells, respectively. Staphylococcus aureus cells are the root cause of mild- to life-threatening diseases, such as myositis and necrotizing fasciitis. Some inflammatory diseases, which include skin infections, pneumonia, endocarditis, etc., are due to Staphylococcus aureus cells. It can also create a toxic shock syndrome as well as the scalded skin syndrome. On the other hand, Streptococcus haemolyticus cells are responsible for urinary and biliary tract infections, endocarditis, puerperal fever, and many more [4,5]. The Staphylococcusaureus cells may develop antibiotic-resistant strains called methicillin-resistant which is a major challenge for the experts who are working in the field of clinical medicine worldwide. Although virologists are working hard to develop a vaccine which could prevent humans from Streptococcusaureus infections, but no such vaccine has been approved so far [6]. Usually, Escherichia coli cells may be easily localized themselves near the colon of newly born human infants within a few hours [7,8]. Though, it is a well-known fact for decades that Escherichia coli cells and their human hosts may simultaneously survive in good health due to the mutual benefits of each other [9]. Moreover, wound infections due to Enterococcus faecalis cells are affecting hospitalized patients between 7% and 15% globally depending upon the hygiene conditions of the surroundings. The treatment is very difficult because Enterococcus faecalis cells develop resistance against a large range of antibiotics [10]. Nevertheless, Bacillus anthracis cells are responsible for resilient and deadly infections, such as anthrax which is also a kind of bacterial pathogen [11,12,13]. These pathogens may also become the root cause of developing spores in the human body [12,13,14]. At present, several phenotypic and molecular methods are being used for detection and identification of these pathogenic bacteria [8,9,10]. However, most of these methods of pathogenic bacteria detection are costly, time-consuming, cumbersome and have poor accuracy [10]. Moreover, the accuracy of results is dependent on the laboratory setup which requires sophisticated technological equipment to execute investigations. The plasmonic biosensing devices based on colorimetric analysis may be one of useful technologies for rapid and advanced sensing of biological samples [15]. On the other hand, photonic biosensing techniques are advantageous due to accuracy, consistency of results, rapid response and relatively lower cost [14,15,16]. The protein sensing and detection application of 1D defective photonic crystal (DPhC) has been explored by El-Aziz et al. keeping tissue building and repairing characteristics of the protein in mind [17]. Biosensing application of 1D defective quinary PhC capable of detecting cancerous blood cells in human body has been studied by Ashour et al. [18]. An analytical approach demonstrating a novel chemical sensor by using 1D DPhC has been proposed by Adl et al. The geometry of this chemical sensor is based on total internal reflection in which a cavity has been created at the end of the structure [19].
In the recent years, photonic biosensing technology-based optical sensing has emerged as a hot research field for design and development of diversified ranges of bio-photonic sensors which have tremendous applications in agricultural, biochemical, environmental, medical and defense sectors [20,21,22,23]. One example is a high-performance photonic biosensor capable of detecting water-borne bacteria of sensitivity which varies between 474.2 nm/RIU to 483.6 nm/RIU that has been theoretically examined by Aly and his coworker [2]. In addition, there are very useful data are published in reference [24]. This structure can be fabricated by depositing forty alternate layers of Si and TiO2 materials with an air cavity of width 112 nm only in the middle of the structure. The cavity of air has been used to examine various water-borne bacteria samples. These samples may be transported to the cavity region with the help of a microfluidic channel which is one of the essential parts of the biosensor. Moreover, the order of the quality factor, figure of merit and limit of detection values of proposed design are 104, 104 and 10−6, respectively.
Motivated by the abovementioned excellent sensing capabilities of photonic biosensors, in this paper, we have explored one of the possible ways by which a 1D photonic crystal (PhC) with defect can be efficiently used to detect bacterial cells and spores in different samples under investigation. Additionally, we note that the earlier structure suggested by Arafa et al. for detecting various water-borne bacteria in reference [2] has two limitations: (1) this design comprises forty alternate layers of Si and TiO2 materials on glass substrate with an air cavity of width 112 nm at the middle of the structure, and (2) the cavity, which will be used for investigating various water-borne bacteria samples, is very narrow; so, it is difficult to transport the corresponding analytes into the cavity region with the help of a microfluidic channel due to the larger size of bacteria which is in the µm-range [16]. In the present research work, we have given our efforts to overcome the limitations associated with our previous work by proposing the present structure consisting of only 12 alternate layers of GaP and SiO2 on the glass substrate with a wider air cavity of thickness 2.0 µm at middle of the design so that the analytes can be easily infiltrate into the cavity region through the microfluidic channel. The proposed structure works on the principle of detecting a very minute change in refractive index of several pathogen samples containing different bacterial cells and spores due to their shapes, sizes and concentrations. This minute change in refractive index results in the corresponding change in the position of the defect mode inside the photonic band gap of the structure. The comparison amongst the positions of the defect modes corresponding to a change in refractive index of various bacterial samples can be used to extract information pertaining to the pathogens. To the best of our information, such a 1D defective PhC effectively capable of detecting a large range of bacterial samples has not been reported yet. The manuscript has been organized as follows: the structural design and theoretical formulation of the problem have been briefly discussed in Section 2. The results and discussion of the proposed work are given in Section 3. Conclusion has been presented in Section 4.

2. Computational Model and Design Methodology

We first discuss the design architecture of the 1D photonic biosensor capable of sensing various types of bacterial cells and spores as presented in Figure 1. In this design, two identical 1D binary PhCs have been clubbed together through a defect layer of material D, to form a biosensor design (AB)ND(AB)N. The letters A, B and D of this design are being used to represent the layers made of GaP, SiO2 and air, respectively. The period number is represented by the letter N. All the layers of the proposed biosensing structure are been fabricated on a glass substrate of refractive index nS. The whole structure is surrounded by air. We have assumed that the plane electromagnetic wave is impinging the structure at an angle of incidence αo with respect to normal from air (Figure 1).
The interaction between the plane electromagnetic wave and the structure is described by well-known transfer matrix [16,17,18,19,20,21,22,23] as
L = ( L 11 L 12 L 21 L 22 ) = ( l 1 l 2 ) N ( l 3 ) ( l 1 l 2 ) N
Here, L 11 ,   L 12 ,   L 21   a n d   L 22 are the elements of the transfer matrix. N is the period number of the structure. The characteristic matrix representing the material layers A, B and D are denoted by l1, l2 and l3, respectively, and is defined as
l z = ( c o s γ z i / q z s i n γ z i q z s i n γ z i / q z s i n γ z )
Here, the index z = A ,   B ,   D denotes different material layers of the structure. For TE polarized wave, the value of qz is given by q z = n z c o s γ z . Here, γ z is the phase difference at each layer which is defined as
γ z = 2 π n z d z c o s α z λ
In this equation, nz, dz and αz are the refractive index, thickness and ray angle inside each layer.
The transmission coefficient t of the proposed structure is given by
t = 2 q 0 ( L 11 + L 12 q S ) q 0 + ( L 21 + L 22 q S )
where the values of q 0 = n 0 cos α 0   and   q S = n S cos α S are associated with incident and exit media of the structure respectively corresponding to the TE polarized wave. The transmittance (T) of the proposed biosensing structure is given by
T = q s q o | t | 2
The performance and efficiency of the photonic biosensor can be assessed by various parameters, such as the sensitivity (S), signal to noise ratio (SNR), figure of merit (FOM), resolution (RS), detection limit (LOD), quality factor (Q) and dynamic range (DR) [16,17,18,19,20]. These parameters are very essential and helpful for quantitative examination of the performance of any photonic biosensing design. The sensitivity is defined as the change in the position of the defect mode inside PBG (ΔλR) due to a change in the refractive index of the bacteria sample (Δnbacteria) under investigation as defined in Equation (6)
S = Δ λ R Δ n b a c t e r i a
The signal to noise ratio is another major parameter which evaluates the biosensor performance. It is essential to design a biosensor with small FWHM to get larger value of SNR. The SNR value can be obtained with the help of the following relation
SNR = Δ λ R FWHM
The FOM determines the ability of any photonic biosensor to determine very little changes in the position of the defect mode inside PBG and is directly proportional to the sensitivity. It is defined as
FOM = S FWHM
The small change in the central wavelength of defect mode determines the resolution of the biosensor and is defined as
RS = 2 ( FWHM ) 3 ( SNR ) 1 4
The smallest refractive index change which could be measured by any biosensing configuration is defined in terms of LOD as defined below
LOD = λ R 20   SQ
Here, Q is the quality factor which determines the ability of the biosensor having a narrow bandwidth, which is obtained as
Q = λ R FWHM
The range of bacteria samples, which can produce reliable bacteria sample perturbations by the biosensor configuration, is defined in terms of dynamic range and is given by
DR = λ R FWHM

3. Results and Discussion

In the present research work, two identical binary 1D PhCs (AB)N have been clubbed together through a defect layer of air as shown in Figure 1. Both the binary PhCs are made up of alternating layers of GaP and SiO2 of period number N = 3. These materials have been chosen due to their negligible extinction coefficient in the region of investigation 625 nm to 730 nm. Moreover, the refractive index variation of GaP and SiO2 is very small and can be ignored in the wavelength range 625 nm to 730 nm. The thicknesses of layers along with period number of binary PhCs have been selected in such a way to get wider PBG with a reduced structure size. The refractive indices and thicknesses of layers GaP and SiO2 are selected as n1 = 3.36, n2 = 1.44, d1 = 260 nm and d2 = 110 nm, respectively. The thickness of the defect layer of air has been initially taken as d3 = 0.5 µm in which various samples containing bacterial cells and spores under investigation have to be poured one by one. The physical dimension of the cavity region has been taken in micro meter keeping the size of the bacteria cell into consideration. The entire work has been carried out in the visible region of the electromagnetic spectrum which varies between 620 nm to 750 nm. The whole structure is assumed to be fabricated over a substrate of glass of refractive index ns = 1.52. The ambient medium of the proposed design is air of refractive index n0 = 1.0.
The proposed photonic biosensor works on the principle of existence of a defect mode inside the photonic band gap. The break in periodicity of the structure results a defect mode inside the PBG due to disturbance in the translational symmetry. This phenomenon is similar to the presence of impurity modes in the doped semiconductor. The working of the design is initiated by loading the air cavity with various samples containing different bacterial cells and spores one by one as per the data given in reference [24]. It contains refractive indices of several bacteria samples under consideration which have been arranged in descending order of their refractive indices. The proposed design is capable to observe the minute change in refractive index of different bacterial cells (Δn) of 0.0060. The change in the size, shape, concentration and chemical composition of bacteria in different samples results the corresponding change in their refractive indices which in turn reflect the positional change in the defect mode inside the photonic band gap. In order to understand the significance as well as importance of our design, one has to compare the numerical value of sensitivity with the corresponding change in the refractive index of a bacterial sample. The performance of the proposed structure has been examined first by observing the effect of change for the angle of incidence of electromagnetic waves from 0° to 10°, 30° and 40° corresponding to a TE wave only, when the thickness of the cavity layer has been fixed to 0.5 µm. Second, the thickness of the cavity layer has been changed from 0.5 µm to 2.0 µm in steps of 0.5 µm at α0 = 0° on the transmission spectra of the structure as discussed below.

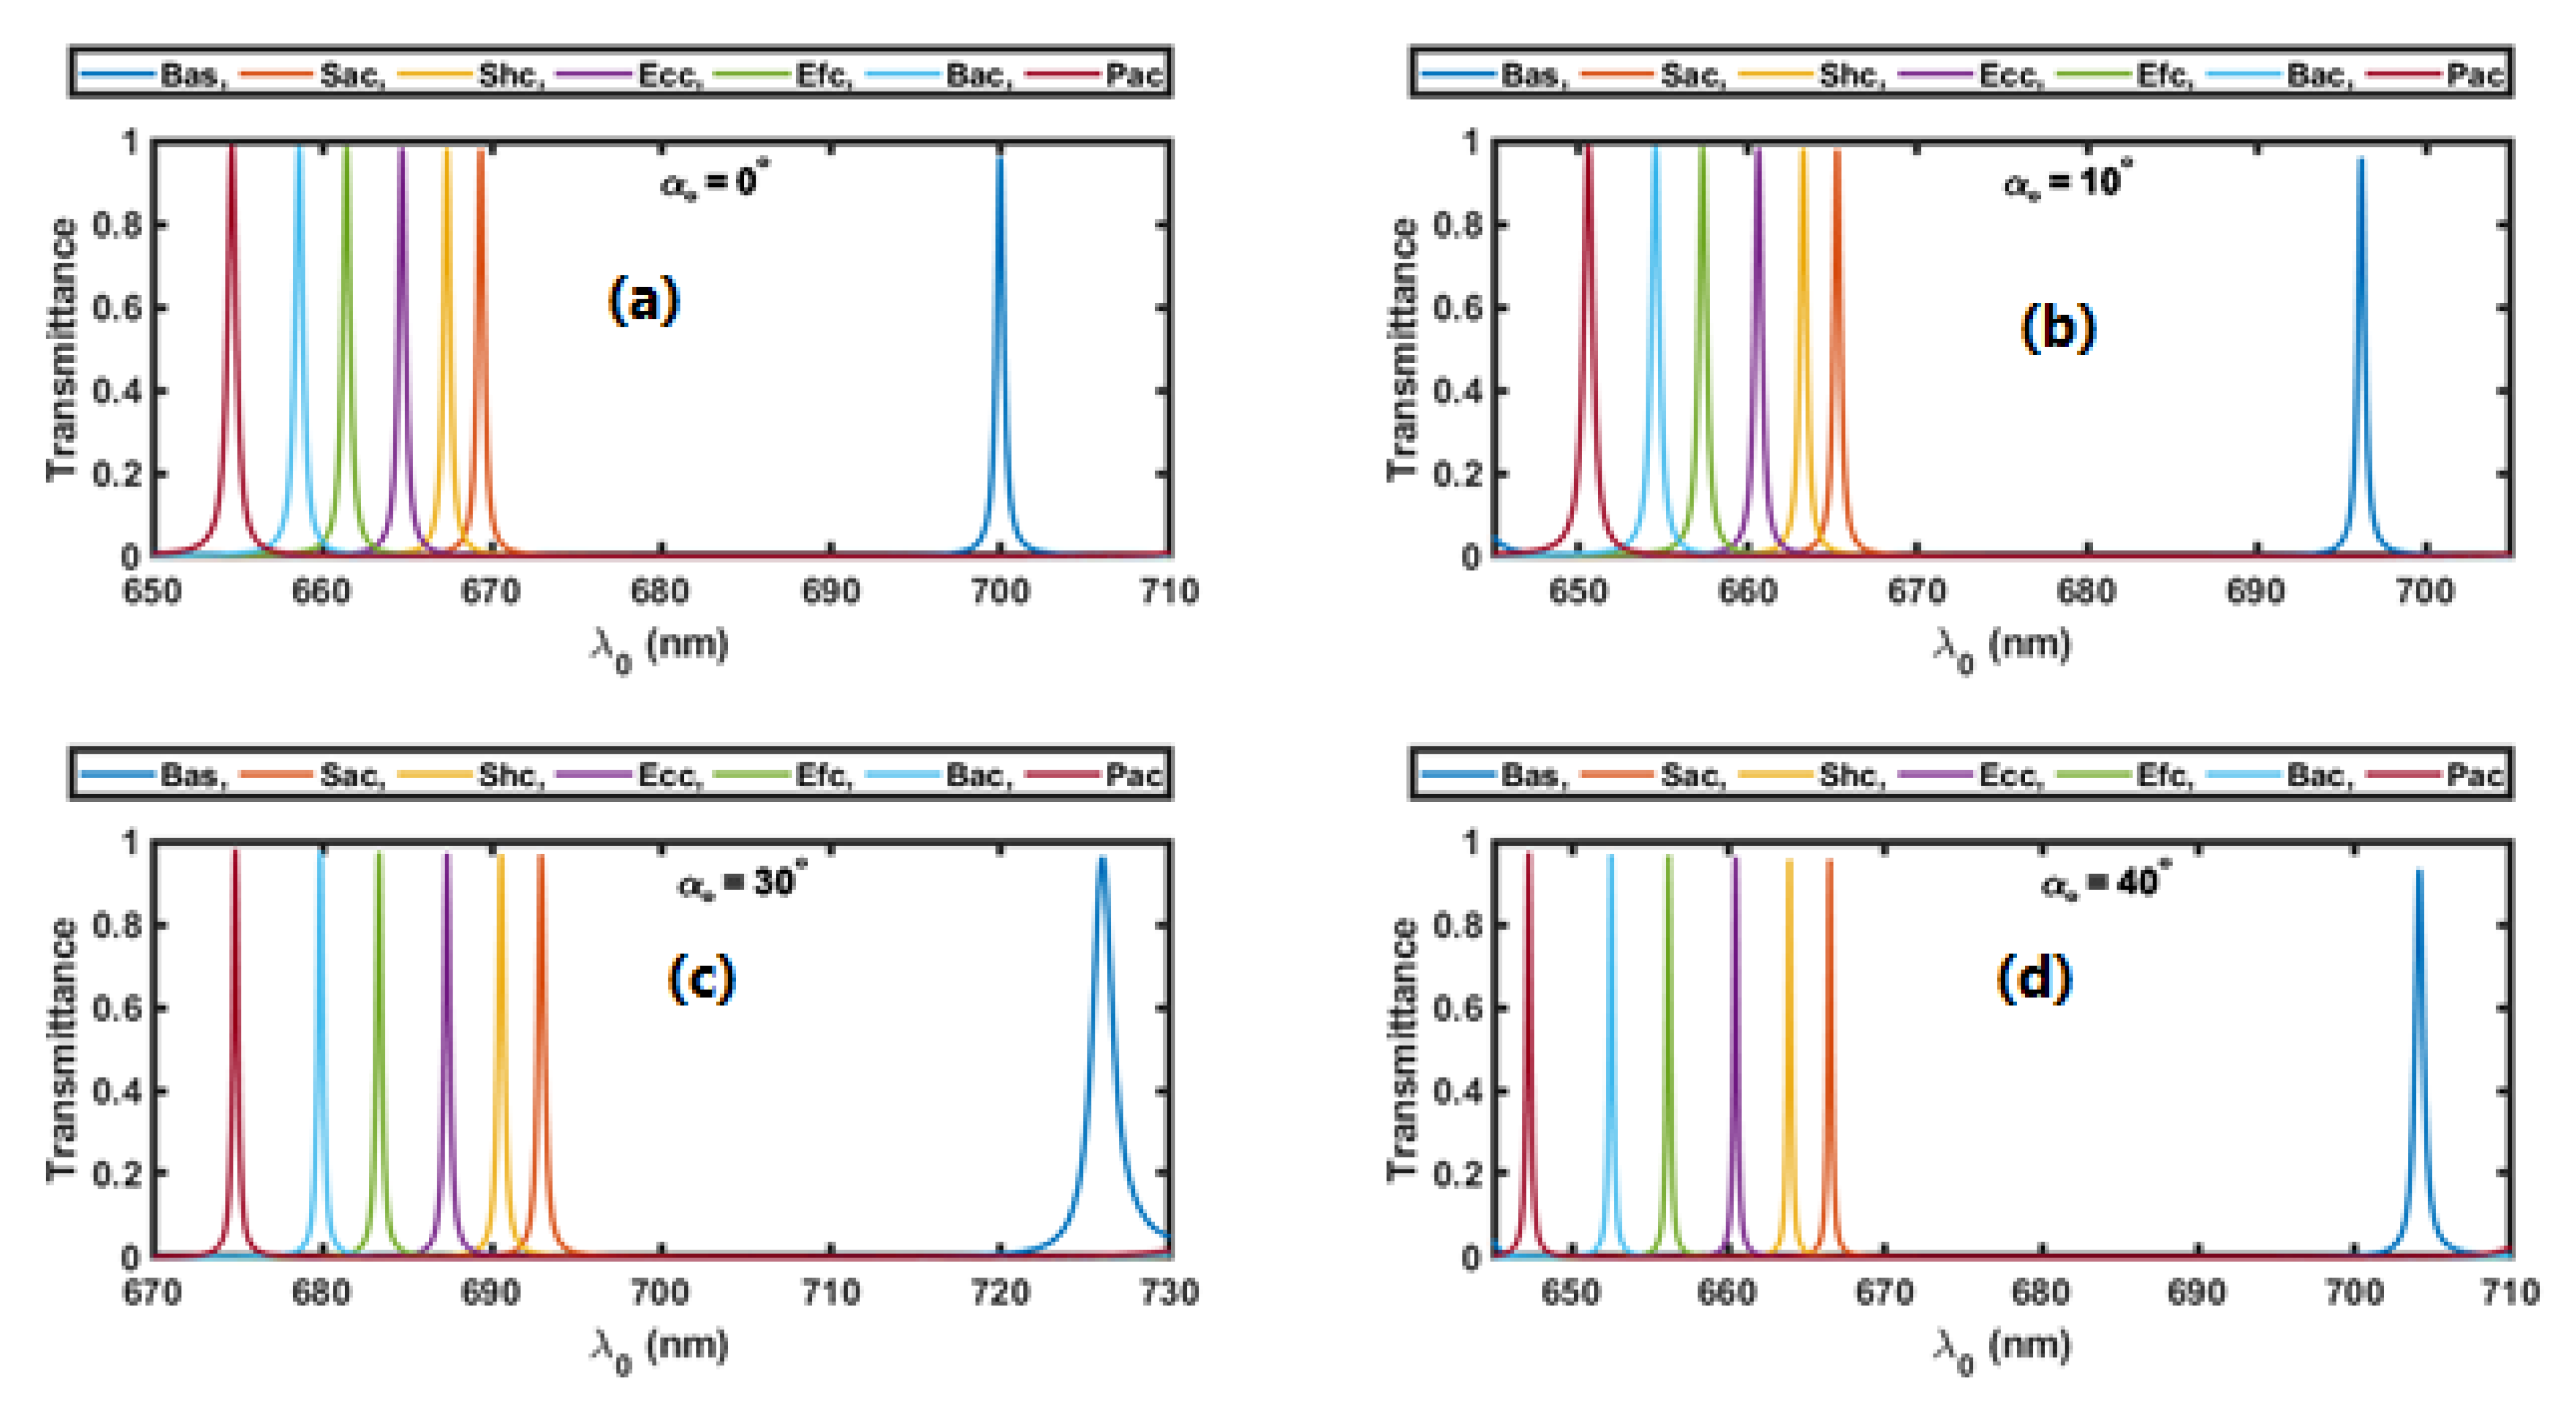
3.1. Effect of Variation in the Angle of Incidence on the Performance of the Biosensor

For this purpose, the thickness of the defect layer of the biosensor has been fixed to 0.5 µm and the incident angle has been varied from 0° to 10°, 30° and 40° corresponding to a TE wave only. Under these circumstances, the transmission spectrum has been plotted in Figure 2a–d corresponding to incident angles 0°, 10°, 30° and 40°, respectively, when the cavity has been loaded with different samples, containing bacillus anthracis spore, staphylococcus aureus cell, streptococcus haemolyticus cell, Escherichia coli cell, enterococcus faecalis cell, bacillus anthracis cell and pseudomonas aeruginosa cell separately. The transmission spectra of Figure 2a show that as the cavity region has been infiltrated separately with various water samples containing Bacillus anthracis spore to Pseudomonas aeruginosa cells. In accordance to the published date reference [24], the defect mode starts to shift towards the higher wavelength side. The intensity of each defect mode is almost unity which is enough and easily detected by the transducer of the proposed photonic biosensor design. This shifting of the defect mode inside the PBG is due to the increase in the refractive index of various samples containing bacterial cells and spores. Moreover, the full width half maximum of all defect modes varies between 0.4 nm to 0.5 nm which is also one of the essential requirements for any good quality photonic biosensing design. The increase in the angle of incidence from 0° to 10° results in the movement of defect modes towards the lower wavelength side with very minute fall in their intensity as seen in Figure 2a,b respectively. The FWHM of theses defect modes is almost constant. The further increase in the angle of incidence from 10° to 30° results in the shifting of the defect modes toward the higher wavelength side, as shown in Figure 2c. The FWHM of the defect mode located at the higher side of the spectrum increases whereas the FWHM of the defect modes located at the lower side of the spectrum reduces. The intensity of each defect mode also reduces from 99.12% to 94.86%, as shown in Figure 2c. At α0 = 40°, the movement of the defect modes inside the PBG is towards the lower wavelength side with improved FWHM, as shown in Figure 2d. The intensity variation is between 92.86% to 95.85%, as evident in Figure 2d. The increase in the angle of incidence also reduces the intensity of each defect mode marginally without influencing the sensing capabilities of the design.

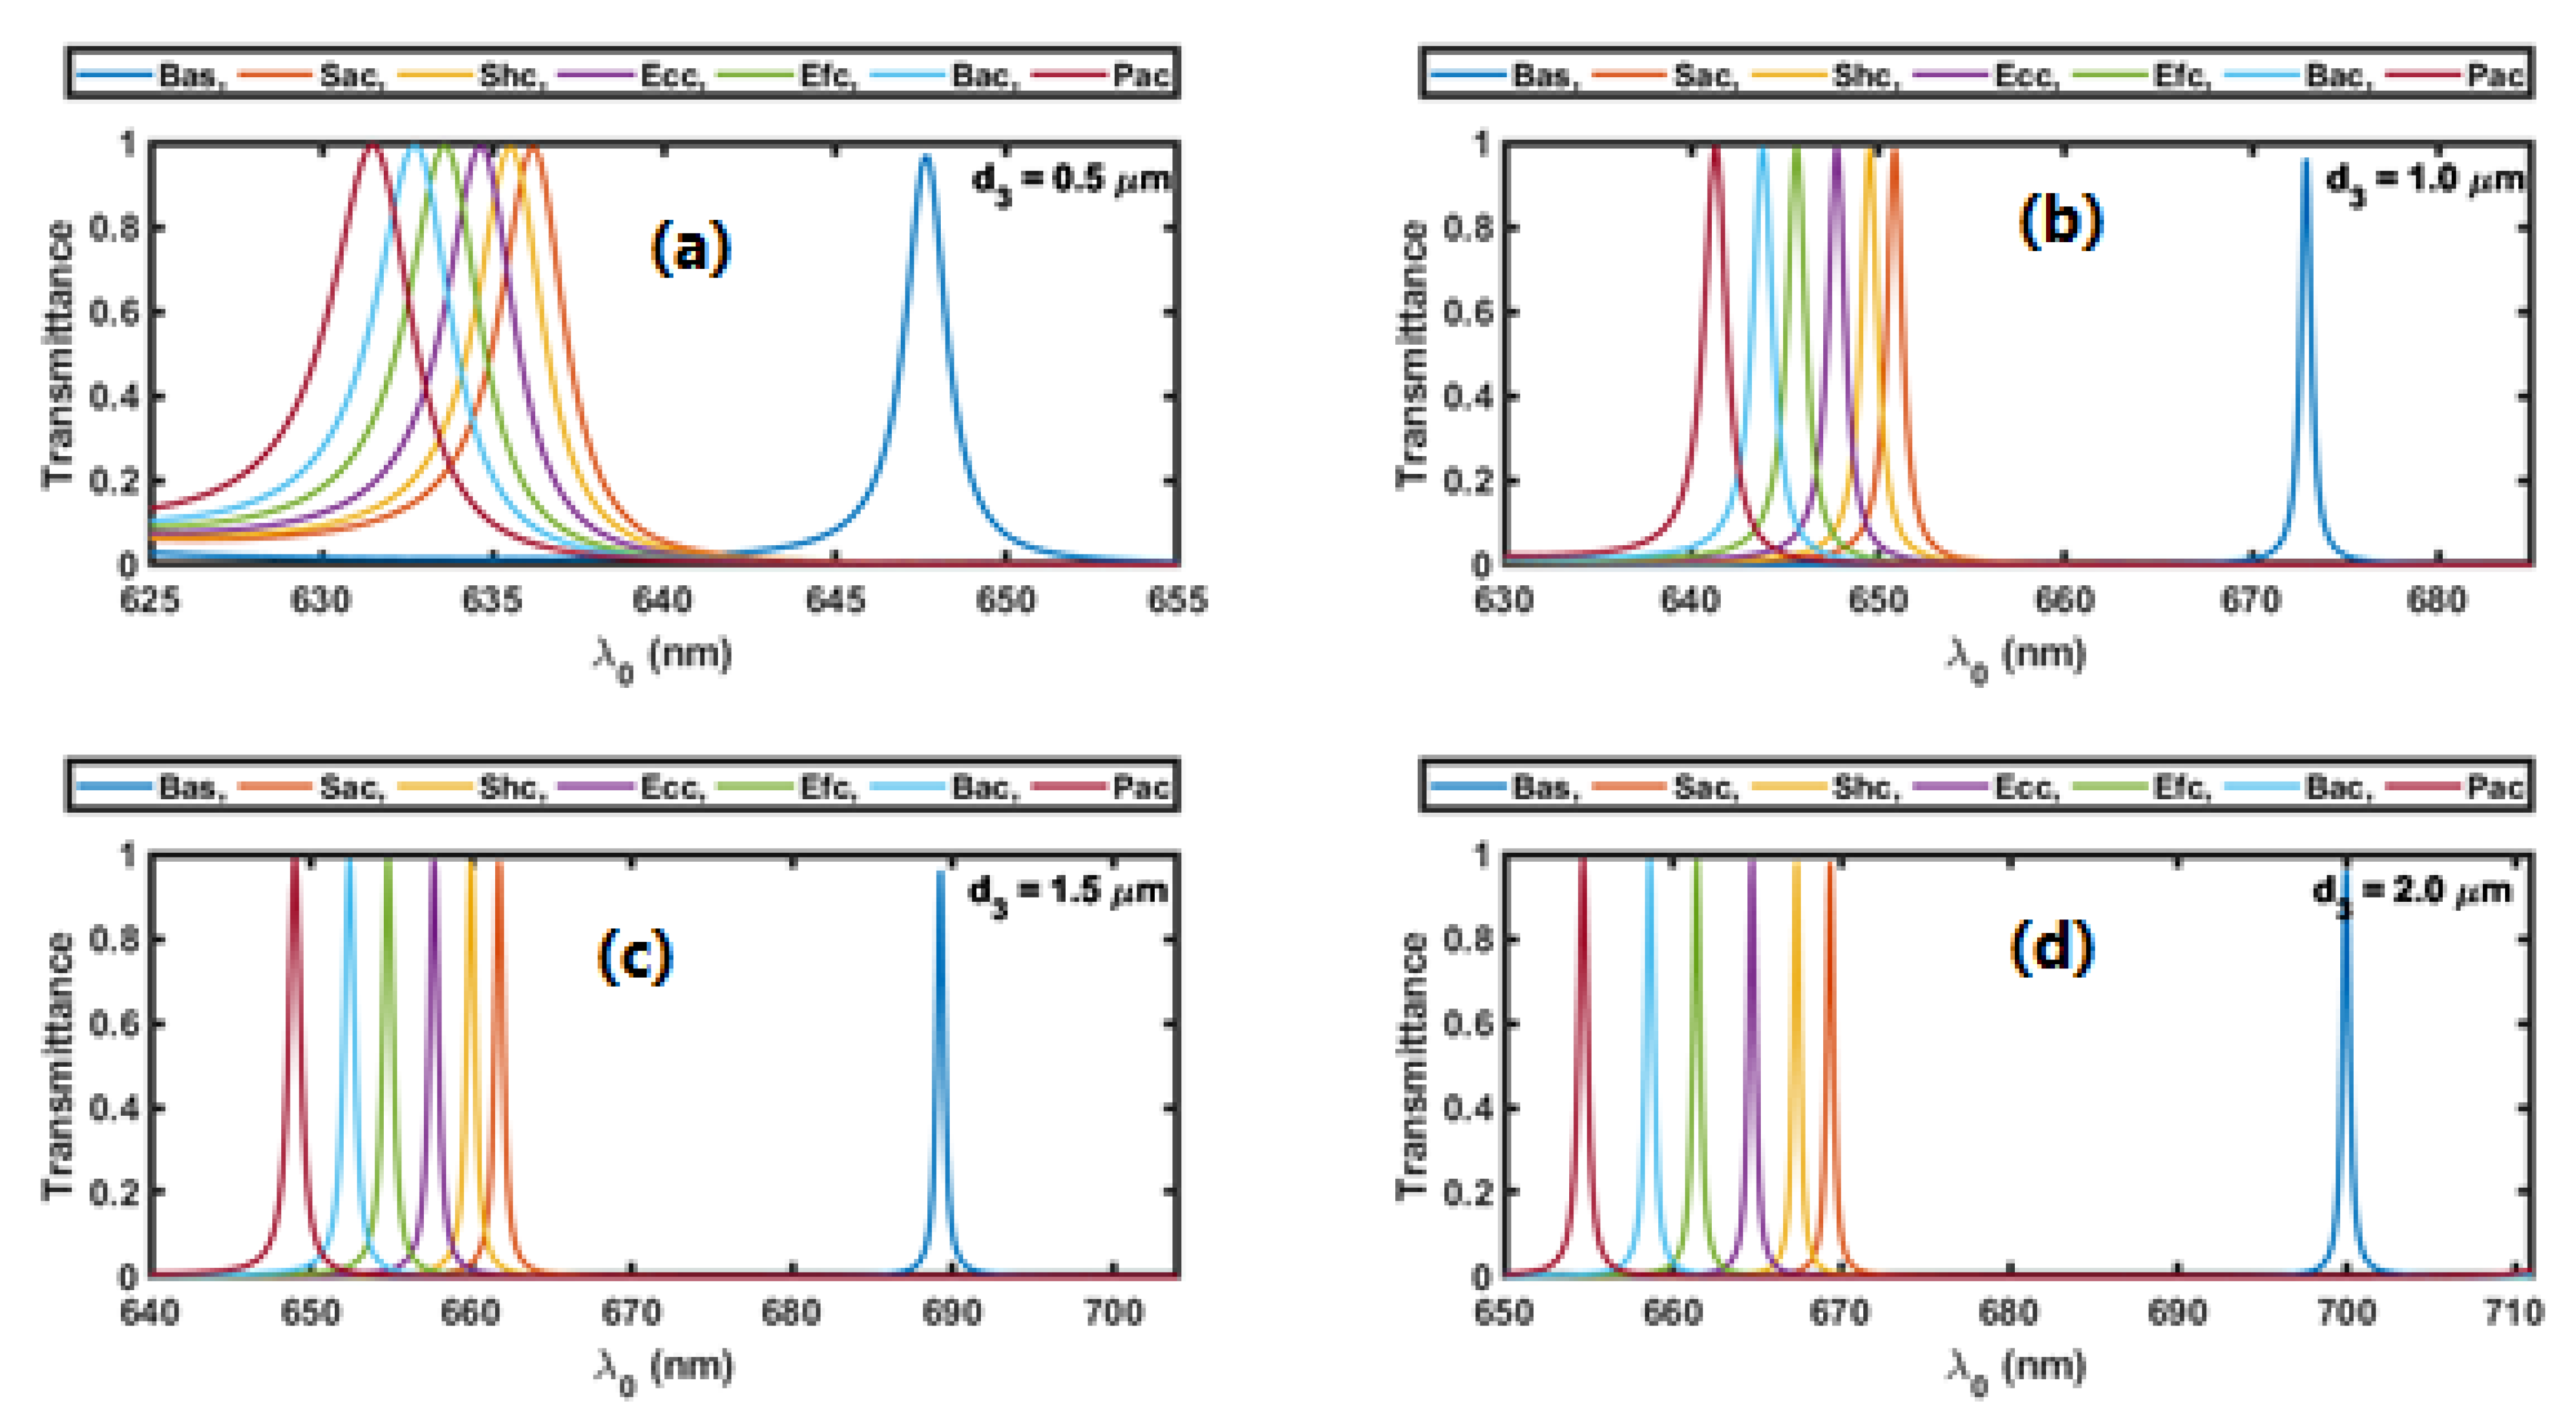
3.2. Effect of Change in the Thickness of Cavity Region on the Performance of the Biosensor

Next, we examine how the change in thickness of cavity region influences the performance of the proposed photonic biosensor under normal incidence condition. For this reason, we have chosen the thickness of the cavity region as 0.5 µm, 1.0 µm, 1.5 µm and 2.0 µm. The transmission spectra of the proposed design corresponding to a cavity region of thicknesses 0.5 µm, 1.0 µm, 1.5 µm and 2.0 µm are being plotted in Figure 3a–d, respectively, at normal incidence. Transmission spectra of Figure 3 show that, due to increase in thickness of cavity region under normal incidence condition corresponding to various samples whose refractive index vary from lower to higher value in accordance with refractive indices which is published in reference [24], the distinct and distinguishable defect modes inside the PBG start to switch their position toward the higher wavelength side. Moreover, their FWHM gradually reduces and becomes minimum at a cavity layer of thickness 2.0 µm. The minimum value of FWHM is always required for a high performing photonic biosensor. There is one more common observation that, at a particular thickness of the defect layer region, the FWHM of all defect modes corresponding to various bacterial cells are constant. Thus, the comparison of findings between Section 3.1 and Section 3.2 shows that by varying the angle of incidence at fixed cavity length, one cannot only tune the defect mode position inside PBG towards the lower wavelength side, but also improve its FWHM depending upon various bacterial samples under investigation. Moreover, structures of different cavity length at normal incidence can be used to retain the position of the defect mode inside the PBG by shifting them towards the higher wavelength side.

3.3. Analysis of Proposed Structure under Optimum Conditions

Analysis of the results as discussed above is helpful to identify the optimized cavity length d3 = 2.0 µm at α0 = 0° under which the proposed device works efficiently. Here, it is important to note that, in this study, other structural parameters have been fixed to get a wider PBG which is important for investigating a large number of bacterial samples of different refractive indices. Table 1 shows that the numerically calculated various parameters S, SNR, FOM, RS, Q, LOD and DR which are very helpful for evaluating the performance of the proposed photonic structure based on the refractive index sensing technology. This table shows the sensitivity variation of the proposed structure between 333 nm/RIU to 337 nm/RIU under the influence of various bacterial samples. The average sensitivity value of the proposed work is 335.72 nm/RIU, which is quite good in contrast to many biosensing reports as mentioned in Table 2. Additionally, our structure possesses a high value of signal-to-noise ratio, figure of merit, quality factor and dynamic ratio. The average values of signal-to-noise ratio, figure of merit, quality factor and dynamic ratio of our structure are 81.38, 727.226 and 1430.24, respectively. Moreover, our design has considerably low values of resolution and limit of detection, both are also essential requirements for identifying the smallest change in the refractive index of a bacterial sample under investigation. The average value of RS and LOD of our design has 0.104667 and 6.948 × 10⁻⁵ RIU, respectively.

4. Conclusions

In conclusion, we have theoretically examined the performance of the proposed 1D photonic biosensor capable of investigating selected bacterial and spore samples as an analyte. The transfer matrix formulation has been used with the help of MATLAB simulations to carry out these findings under normal and oblique incidence corresponding to the TE wave only. In this study, we have chosen the structural parameters of 1D PC (AB)N to get a wider photonic band gap extending from 625 nm to 730 nm in the visible region of the electromagnetic spectrum. The performance of the proposed design has been studied under the influence of various thicknesses as well as angle of the incidences to get optimized values for both cavity thickness and angle of incidence. We have tuned the parameters in such a way to get optimized performance of the structure under normal incidence because in such photonic biosensors of nanometer size it is not easy to retune the angle of incidence to get an efficient performance. The optimized value of cavity thickness is 2.0 µm corresponding to which the average sensitivity of the design is 335.7264 nm/RIU. The sensitivity of any photonic biosensor having this value is enough for sensing bacterial samples of fractional refractive index change (Δn) 0.0060. The proposed structure has high average values of quality factor, FOM and signal-to-noise ratio as 1430.24, 727.226 and 81.38, respectively. Moreover, this structure also possesses low average values of resolution and LOD as 0.104667 and 6.9486 × 10⁻⁵. These are amongst the most important parameters that must be taken into consideration for designing of any photonic bio-sensor. Thus, we have proposed a very simple, efficient, cost effective and highly sensitivity 1D photonic biosensing design which can be realized easily by presently available fabrication techniques for identifying selected bacterial cell and spores in water samples to be investigated. Moreover, the proposed structure may also be used for sensing samples of refractive index variation between 1.4160 to 1.5070.

Author Contributions

Conceptualization, A.H.A.; Data duration, Z.S.M., M.A.M. and A.F.A.; Formal analysis, S.K.A., M.A.M. and Z.S.M.; Investigation, A.H.A.,S.K.A., M.A.M. and A.F.A.; Methodology, A.F.A., M.A.M. and Z.S.M.; Project administration, A.H.A.; Resources, Z.S.M., A.F.A. and M.A.M.; Software, A.F.A.; Supervision, A.H.A.; Writing—original draft, S.K.A.; Writing—review & editing, A.H.A. and S.K.A. All authors have read and agreed to the published version of the manuscript.

Funding

This research received no external funding.

Institutional Review Board Statement

Not applicable.

Informed Consent Statement

Not applicable.

Data Availability Statement

Not applicable.

Conflicts of Interest

The authors declare no conflict of interest.

References

  1. Painam, B.; Kaler, R.S.; Kumar, M. Active layer identification of photonic crystal waveguide biosensor chip for the detection of Escherichia coli. Opt. Eng. 2016, 55, 077105. [Google Scholar] [CrossRef]
  2. Shalaby, A.S.; Alamri, S.; Mohamed, D.; Aly, A.H.; Awasthi, S.K.; Matar, Z.S.; Tamam, M.T. Theoretical study of one-dimensional defect photonic crystal as a high-performance sensor for water-borne bacteria. Opt. Quan. Elec. 2021, 53, 660. [Google Scholar] [CrossRef]
  3. Prochnow, A.M.; Clauson, M.; Hong, J.; Murphy, A.B. Gram positive and Gram negative bacteria differ in their sensitivity to cold plasma. Sci. Rep. 2016, 6, 38610. [Google Scholar] [CrossRef] [Green Version]
  4. Bröker, B.M.; Mrochen, D.; Péton, V. The T Cell Response to Staphylococcus aureus. Pathogens 2016, 5, 31. [Google Scholar] [CrossRef]
  5. Fiedler, T.; Köller, T.; Kreikemeyer, B. Streptococcus pyogenes biofilms—Formation, biology, and clinical relevance. Front. Cell. Infect. Microbiol. 2015, 5, 1. [Google Scholar] [CrossRef] [Green Version]
  6. Rohde, M.; Habil, R.N.; Cleary, P.P. Adhesion and invasion of Streptococcus pathogens into host cells and clinical relevance of intracellular streptococci. Streptococcus Pathog. 2016, 1–39. [Google Scholar]
  7. Kaper, J.B.; Nataro, P.J.; Mobley, H.T.L. Pathogenic Escierichia Coli. Nat. Rev. Microbiol. 2004, 2, 124. [Google Scholar] [CrossRef]
  8. Hao, J.-J.; Xie, X.; Gu, K.-D.; Du, W.C.; Liu, Y.-J.; Yang, H.-W. Research on photonic crystal-based biosensor for detection of Escherichia coli colony. Plasmonics 2019, 14, 1919–1928. [Google Scholar] [CrossRef]
  9. Rosano, G.L.; Ceccarelli, E.A. Recombinant protein expression in Escherichia coli: Advances and challenges. Front. Microbiol. 2014, 5, 1. [Google Scholar] [CrossRef] [Green Version]
  10. Rôças, I.N.; Siqueira, J.F.; Santos, K.R.N. Association of Enterococcus faecalis With Different Forms of Periradicular Diseases. J. Endod. 2004, 30, 315–320. [Google Scholar] [CrossRef]
  11. Fouet, A.; Mesnage, S. Bacillus anthracis cell envelope components. Curr. Top. Microbiol. Immunol. 2002, 271, 87–113. [Google Scholar] [PubMed]
  12. Chevalier, S.; Bouffartigues, E.; Bodilis, J.; Maillot, O.; Lesouhaitier, O.; Feuilloley, M.G.J.; Orange, N.; Dufour, A.; Cornelis, P. Structure, function and regulation of Pseudomonas aeruginosa porins. FEMS Microbiol. Rev. 2017, 41, 698–722. [Google Scholar] [CrossRef] [PubMed]
  13. Driks, A. The Bacillus anthracis spore. Mol. Asp. Med. 2009, 30, 368–373. [Google Scholar] [CrossRef] [PubMed]
  14. Sudro, S.; Carpignano, F.; Strambini, L.M.; Merlo, S.; Barillaro, G. Capillarity-driven (self-powered) one-dimensional photonic crystals for refractometry and (bio) sensing applications. RSC Adv. 2014, 4, 51935–51941. [Google Scholar]
  15. Mauriz, E. Clinical Applications of Visual Plasmonic Colorimetric Sensing. Sensors 2020, 20, 6214. [Google Scholar] [CrossRef] [PubMed]
  16. Mejia-Salazar, J.R.; Cruz, K.R.; Vasques, E.M.M.; de Oliveira, O.N., Jr. Microfluidic Point-of-care devices: New Trends and Future Prospects for eHealth Diagnostics. Sensors 2020, 20, 1951. [Google Scholar] [CrossRef] [Green Version]
  17. El-Aziz, O.A.A.; Elsayed, H.A.; Sayed, M.I. One-dimensional defective photonic crystals for the sensing and detection of protein. Appl. Opt. 2019, 58, 8309–8315. [Google Scholar] [CrossRef]
  18. Ashour, H.S.; Abohassan, K.M.; Abadla, M.M. Defective 1D Quinary Photonic Crystal Sensors for the Detection of Cancerous Blood Cells. Opt. Eng. 2021, 6, 127106. [Google Scholar] [CrossRef]
  19. Adl, H.P.; Bayat, F.; Ghorani, N.; Ahmadi-Kandjani, S.; Tajalli, H. A Defective 1-D Photonic Crystal-Based Chemical Sensor in Total Internal Reflection Geometry. IEEE Sens. J. 2017, 17, 4046–4051. [Google Scholar]
  20. Zaky, Z.A.; Aly, A.H. Gyroidal graphene/porous silicon array for exciting optical Tamm state as optical sensor. Sci Rep. 2021, 11, 19389. [Google Scholar] [CrossRef]
  21. Aly, A.H.; Awasthi, S.K.; Mohamed, D.; Matar, Z.S.; Al-Dossari, M.; Amin, A.F. Study on A one-dimensional defective photonic crystal suitable for Organic compound sensing applications. RSC Adv. 2021, 11, 32973–32980. [Google Scholar] [CrossRef]
  22. Aly, A.H.; Mohamed, D.; Zaky, Z.A.; Matar, Z.S.; El-Gawaad, N.S.; Abd Shalaby, A.S.; Tayeboun, F.; Mohaseb, M. Novel biosensor detection of tuberculosis based on photonic band gap materials. Mater. Res. 2021, 24, 1–7. [Google Scholar] [CrossRef]
  23. Gandhi, S.; Awasthi, S.K.; Aly, A.H. Biophotonic sensor design using a 1D defective annular photonic crystal for the detection of creatinine concentration in blood serum. RSC Adv. 2021, 11, 26655–26665. [Google Scholar] [CrossRef]
  24. Hart, S.J.; Terray, A.; Kuhn, L.K.; Arnold, J.; Leski, T.A. Optical Chromatography for biological separation. Conf. Pap. Proc. SPIE-Int. Soc. Opt. Eng. 2004, 5514, 35–47. [Google Scholar]
  25. Klimov, V.V.; Pavlov, A.A.; Treshin, I.V.; Zabkov, I.V. Fano resonances in a photonic crystal covered with a perforated gold film and its application to bio-sensing. J. Phys. D Appl. Phys. 2017, 50, 285101. [Google Scholar] [CrossRef]
  26. El-Khozondar, H.J.; Mahalakshmi, P.; El-Khozondar, R.J.; Ramanujam, N.R.; Amirie, I.S.; Yupapin, P. Design of one dimensional refractive index sensor using ternary photonic crystal waveguide for plasma blood samples applications. Phys. E Low-Dimens. Syst. Nanostruct. 2019, 111, 29–36. [Google Scholar] [CrossRef]
  27. Ramanujam, N.R.; Amiri, I.S.; Taya, S.A.; Olyaee, S.; Udiyakumar, R.; Pasumpon, A.; Wilson Joseph, K.S.; Mahalakshmi Yupapin, P.P. Enhanced sensitivity of cancer cell using one dimensional nano composite material coated photonic crystal. Microsyst. Technol. 2019, 25, 189–196. [Google Scholar] [CrossRef]
  28. Ramanujam, N.R.; JEl-Khozondar, H.A.; Dhasarathan, V.; Tayae, S.A.; Aly, A.H. Design of one dimensional defect based photonic crystal by composited superconducting material for bio sensing applications. Phys. B Condens. Matter 2019, 572, 42–55. [Google Scholar] [CrossRef]
  29. Lheureux, G.; Monavarian, M.; Anderson, R.; DeCrescent, R.A.; Bellessa, J.; Synmonds, C.; Schuller, J.A.; Speck, J.; Nakamura, S.; DenBaars, S.P. Tamm plasmons in metal/nanoporous GaN distributed Bragg reflector cavities for active and passive optoelectronics. Opt. Exp. 2020, 28, 17934–17943. [Google Scholar] [CrossRef]
Figure 1. Schematic view of 1D defective PhC consisting of two 1D binary PhCs of period number 3 which are associated together through a bacterial cell of thickness d3.
Crystals 12 00220 g001
Figure 2. Transmission spectra of 1D defective PhC (AB)3D(AB)3 when the cavity is loaded with seven different samples containing bacterial cells, such as Staphylococcus aureus, Streptococcus haemolyticus, Escherichiacoli, Enterococcus faecalis, Bacillus anthracis, Pseudomonas aeruginosa and Bacillus anthracis spore with a cavity of thickness 0.5 µm and incident angle α0 as (a) 0°, (b) 10°, (c) 30° and (d) 40°.
Crystals 12 00220 g002
Figure 3. Transmission spectra of 1D defective PhC (AB)3D(AB)3 when the cavity is loaded with seven different samples containing bacterial cells, such as Staphylococcus aureus, Streptococcus haemolyticus, Escherichiacoli, Enterococcus faecalis, Bacillus anthracis, Pseudomonas aeruginosa and Bacillus anthracis spore under normal incidence with a cavity of thickness as (a) 0.5 µm, (b) 1.0 µm, (c) 1.5 µm and (d) 2.0 µm.
Crystals 12 00220 g003
Table 1. The performance evaluation table of the proposed photonic biosensor on the basis of S, SNR, FOM, RS, Q, LOD and DR under different bacterial samples.
RI of Bacteria Samples
(RIU)
λR (nm)FWHM (nm)S (nm/RIU)SNRFOMRS (nm)QLOD (RIU)DR
1.507700.00.5337.3626 1400.00 989.9495
1.416669.30.5337.113461.40674.72530.1190791338.607.41042 × 10−5946.5331
1.410667.30.5336.190565.40674.22680.1172151334.607.4159 × 10−5943.7047
1.402664.70.4335.652288.25840.47620.0870041661.755.94901 × 10−51050.983
1.392661.40.5334.951577.20671.30430.1124541322.807.44819 × 10−5935.3609
1.3834658.60.5333.088282.80669.90290.1105021317.207.46377 × 10−5931.4011
1.371654.70.4337.3626113.25832.72060.0817451636.756.00442 × 10−51035.172
Table 2. Comparison between the performance of proposed design with other similar findings based on refractive index sensing technology on the basis of numeric values of sensitivity, quality factor and figure of merit.
YearS (nm/RIU)Q-FactorFOM (RIU)Frequency RangeReference
2017173 × 1042.23 × 102Visible to NIR[25]
201925.75–51.49Not mentionedNot mentionedNIR[26]
201932–43.13Not mentionedNot mentionedNIR[27]
201953.0–90.9Not mentionedNot mentionedNIR[28]
2020103 × 10215.1Visible[29]
202171–75Not mentioned Not mentionedNIR[16]
This work333–3371.3 × 103 to 1.7 × 10³ 6.7 × 10² to 8.5 × 10²Visible
Publisher’s Note: MDPI stays neutral with regard to jurisdictional claims in published maps and institutional affiliations.

