Article

Numerical Investigation of Heat/Flow Transfer and Thermal Stress in an Anode-Supported Planar SOFC

1
Marine Engineering Institute, Jimei University, Xiamen 361021, China
2
Fujian Provincial Key Laboratory of Naval Architecture and Ocean Engineering, Xiamen 361021, China
3
Faculty of Maritime and Transportation, Ningbo University, Ningbo 315832, China
4
Marine Engineering College, Dalian Maritime University, Dalian 116026, China
*
Authors to whom correspondence should be addressed.
Crystals 2022, 12(12), 1697; https://doi.org/10.3390/cryst12121697
Submission received: 4 November 2022 / Revised: 19 November 2022 / Accepted: 21 November 2022 / Published: 23 November 2022
(This article belongs to the Special Issue Advances in Solid Oxide Fuel Cells 2022)

Abstract

:
To elucidate the thermofluid reacting environment and thermal stress inside a solid oxide fuel cell (SOFC), a three-dimensional SOFC model is implemented by using the finite element method in the commercial software COMSOL Multiphysics®, which contains both a geometric model of the full-cell structure and a mathematical model. The mathematical model describes heat and mass transfer, electrochemical reactions, internal reforming reactions, and mechanical behaviors that occur within the cell. A parameter study is performed focusing on the inlet fuel composition, where humidified hydrogen and methane syngas (the steam-to-carbon ratio is 3) as well as the local distribution of temperature, velocity, gas concentrations, and thermal stress are predicted and presented. The simulated results show that the fuel inlet composition has a significant effect on the temperature and gas concentration distributions. The high-temperature zone of the hydrogen-fueled SOFC is located at the central part of units 5, 6, and 7, and the maximum value is about 44 K higher than that of methane syngas-fueled SOFC. The methane-reforming and electrochemical reactions in the anode active layer result in a significant concentration gradient between the anode support layer and the active layer of the methane syngas-fueled SOFC. It is also found that the thermal stress distributions of different fuel inlet compositions are rather different. The maximum stress variation gradient between electrode layers of hydrogen SOFC is larger (44.2 MPa) than that of methanol syngas SOFC (14.1 MPa), but the remaining components have a more uniform stress distribution. In addition, the electrode layer of each fuel SOFC produces a significant stress gradient in the y-axis direction, and stress extremes appear in the corner regions where adjacent assembly components are in contact.

1. Introduction

Fuel cells are power-generation devices that directly convert chemical energy into electrical energy at high efficiency through electrochemical oxidation reactions. Solid oxide fuel cells (SOFCs) are potential candidates for large-scale stationary and co-power generation due to low noise, better fuel impurity tolerance, and flexibility [1,2]. SOFCs are categorized into two major types, which are planar and tubular configurations. The planar SOFCs have the specific advantages of manufacturing considerations and higher power density, but they require high matching of the thermomechanical properties and sealing between the component materials [3]. Several variations of the planar SOFC designs are possible, such as electrode-supported SOFCs, electrolyte-supported SOFCs, and symmetrical SOFCs [4,5]. Symmetrical SOFCs can improve compatibility between cell components and simplify cell configuration. However, the further development of electrode materials and novel structures is still the key to the practical use of symmetrical SOFCs [4]. The anode-supported SOFCs can effectively reduce ohm loss, thereby reducing the operating temperature of the SOFC, and the thickened anode can realize the function of internal reforming [6].
However, the reaction mechanisms and transport processes that take place in the micro/nanoporous electrode pores and TPBs (TPBs are thin boundaries between the electrode and electrolyte micrograins surrounded by gaseous phases that fill the pores) inside SOFCs are extremely complex [7,8]. In addition, the thermal stress caused by the mismatch of coefficients of thermal expansion between materials and the uneven temperature distribution can easily lead to cracks in the electrode layer or seal failure [9,10,11]. It is difficult to make real-time measurements of complex transport phenomena and related physical quantities inside SOFCs. With the development of computers and commercial software, the reliability and accuracy of numerical simulations have been improved and verified. Numerical simulations have gradually become an important approach to studying SOFCs [12,13,14,15]. Lee et al. [8] established a three-dimensional single-channel numerical model with hydrogen as the fuel to study the thermal-fluid reacting environment and local thermodynamic state in SOFCs. The results showed that high fuel utilization induces a narrow and nonuniform reaction zone near the fuel inlet and substantial species concentration gradients along the cell. Ong et al. [16] established a one-dimensional MEA (membrane electrode assembly) model and demonstrated that part of the CO also participates in the electrochemical reaction due to the equilibrium limitations of water–gas shift reaction (WGSR) under high-temperature conditions. Xie et al. [17] investigated the methane-reforming mechanism and multitransport processes by the finite element method. Numerical results showed that the reaction processes in the anode of direct methane-fueled SOFC are more sluggish than the oxygen reduction process in the cathode, which is the opposite case of the hydrogen-fueled SOFC. It is noted that the reaction rate mismatch between the endothermic methane steam-reforming reaction (MSR) and the exothermic electrochemical reaction tends to cause a temperature gradient [7]. As researched by Tseronis et al. [18], the cooling effect of the methane steam-reforming reaction leads to a significant local temperature drop near the anode inlet and a large temperature difference inside the SOFC. The uneven temperature will cause thermal stress, even the proper materials are chosen at the operating temperature, as reported by Chiang et al. [19]. Many researchers have used a linear intrinsic structure model to describe the relationship between stress and strain inside the cell, which assumes that the components of the cell undergo elastic deformation and that the mechanical theory is following Hooke’s law [20,21,22]. Xu et al. [23] numerically examined the thermal stress of anode-supported planar SOFCs fueled by methane syngas. The results show that due to the endothermic MSR in the porous nickel-based anode, there is a significant temperature gradient between the anode support layer and the anode active layer, resulting in a sudden stress change between the electrode layers. Additional stress from the final arrangement and fixation of the cells in the SOFC stack is probably one of the causes for crack of the cell.
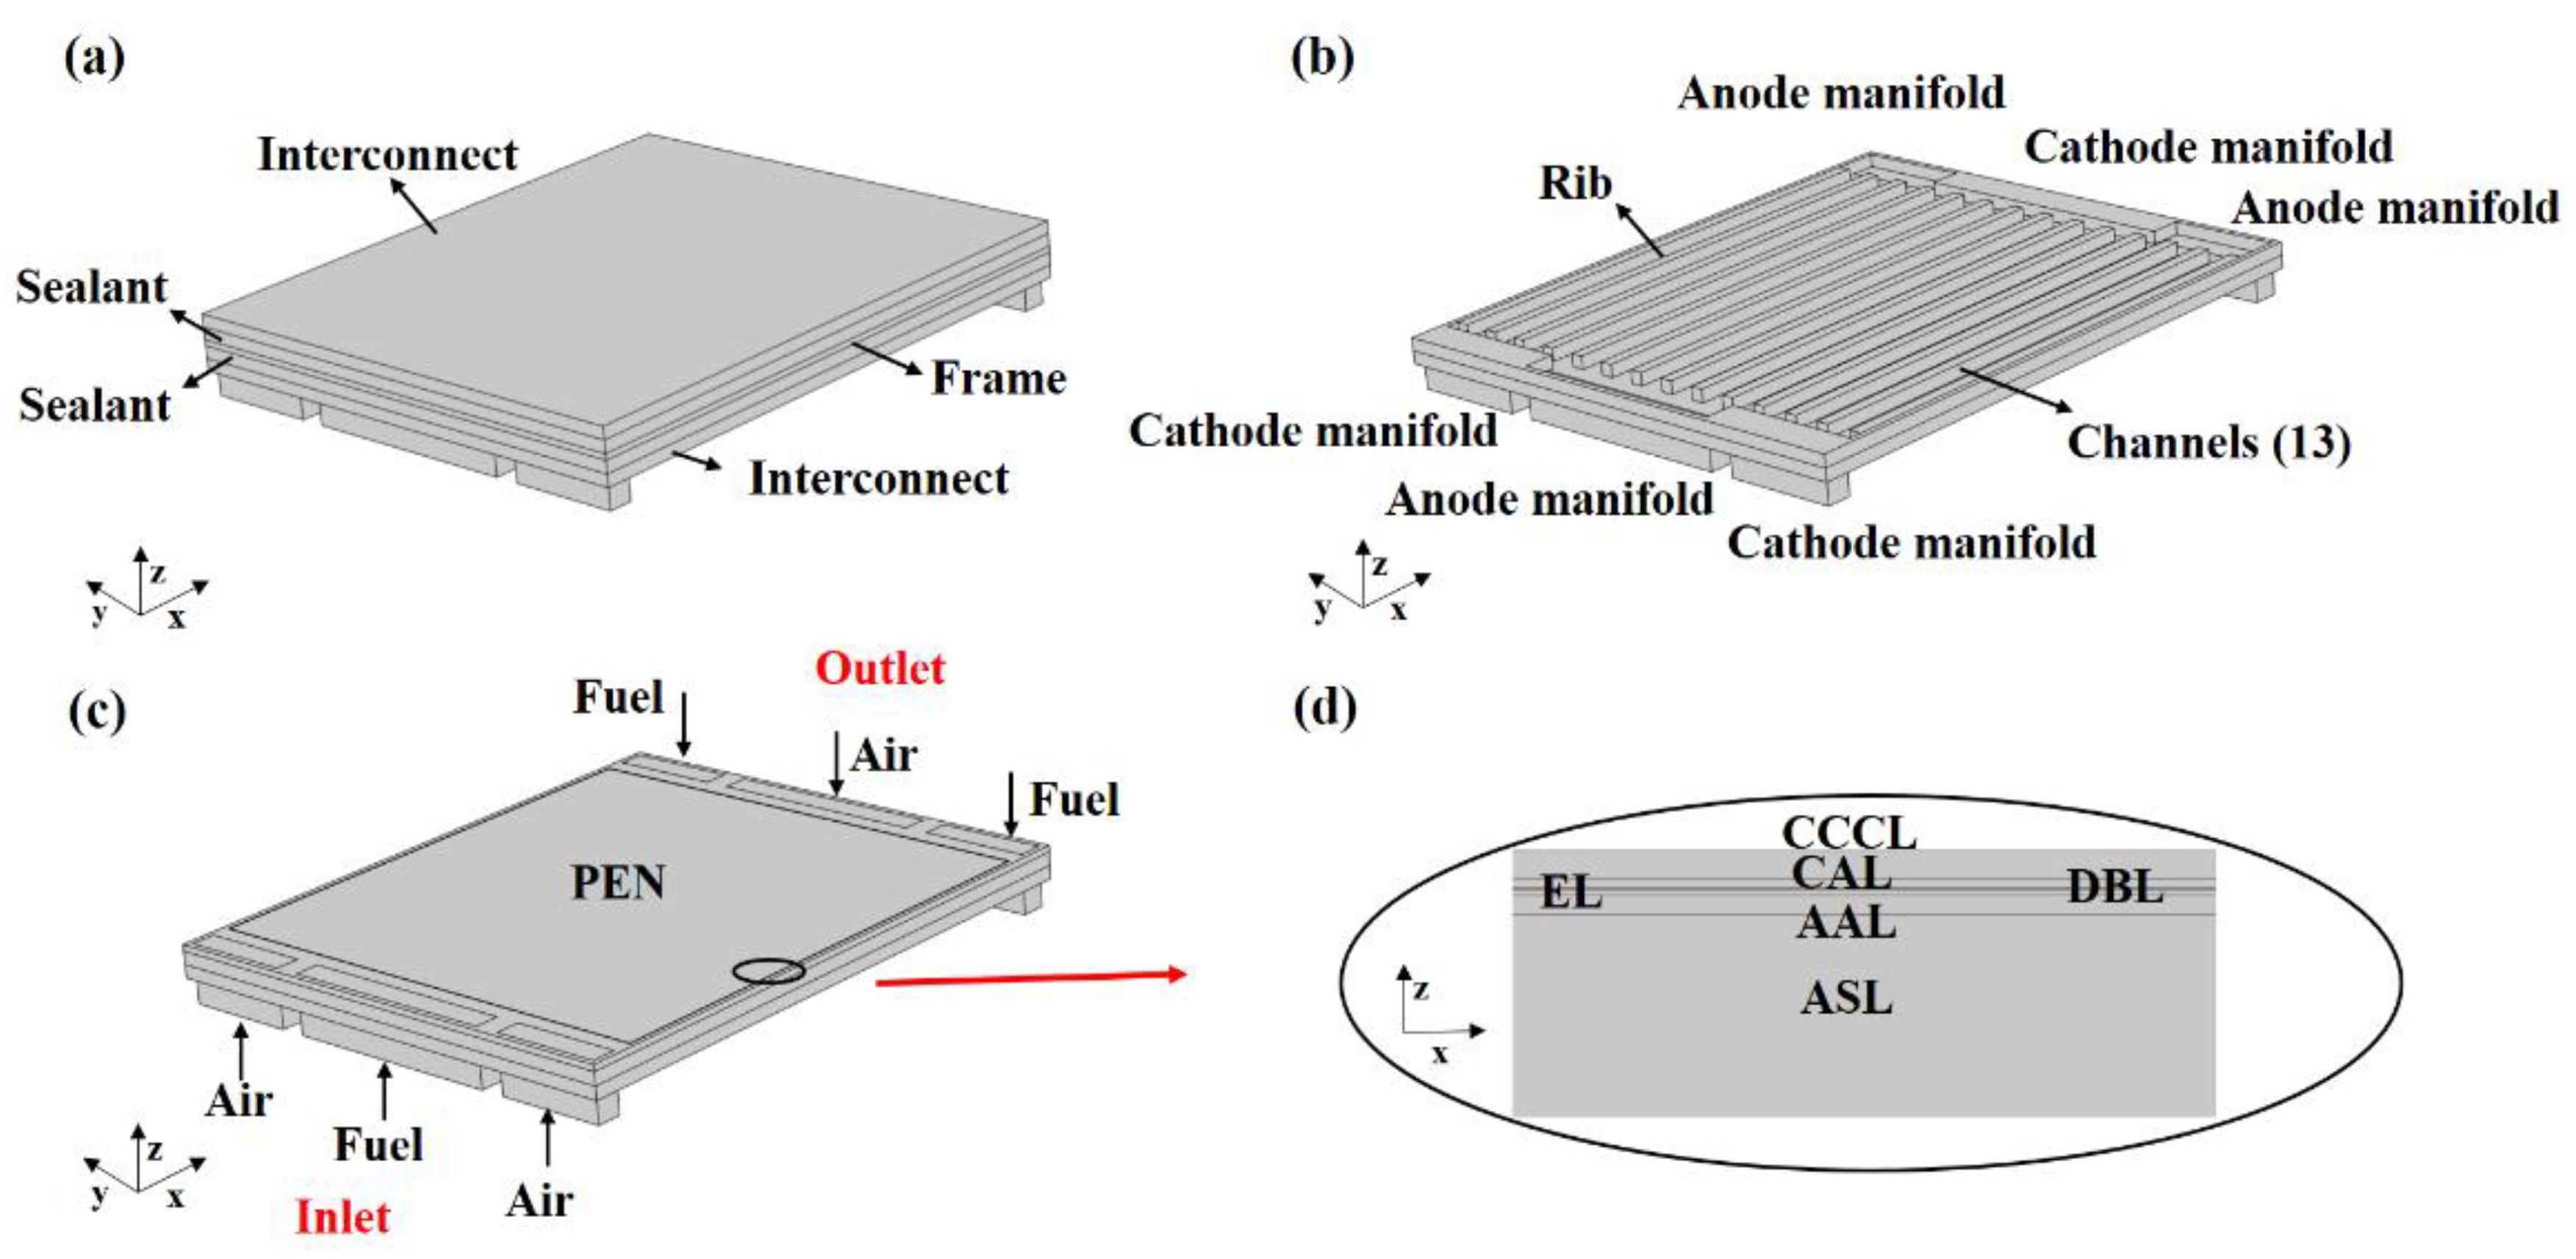
From the literature research above, it is clear that the complex reforming reaction system inside the porous nickel-based anode of hydrocarbon-fueled SOFCs leads to a different internal transport mechanism, as well as thermal stress distribution from that of hydrogen-fueled SOFCs. Furthermore, many scholars have studied only a single-channel unit (periodic unit consisting of PEN, channels, and interconnect) as the object due to the limitations of previous methods. Based on the previous research, a comprehensive thermo–electro–chemo–mechanical coupled three-dimensional model (including a frame, sealant, interconnect, and manifold) has been applied to elucidate the thermofluid reacting environment and thermal stress inside the SOFCs when fueled with hydrogen and methane syngas.

2. Model Development

The following assumptions are adopted in this model:
(1)
The SOFC is running in a steady state.
(2)
All gas species are deemed as ideal gases, and gas flow is assumed to be laminar flow.
(3)
The reaction active sites are uniformly distributed in the electrodes, and the ionic and electronic conductors are continuous and homogeneous.
(4)
Cells, frames, interconnectors, etc., are considered as isotropic materials and satisfy the isotropic Hooke’s law.
(5)
Ignoring the redox reaction of Ni-NiO.

2.1. Internal Reforming Reaction Mechanism

The anode channel is fueled with methane fuel, and the methane steam-reforming (MSR) and water–gas shift reaction (WGSR) will occur in the porous nickel-based anode [7,24,25]. MSR is shown in Equation (1), and WGSR is shown in Equation (2).
CH 4 + H 2 O CO + 3 H 2   Δ H 298 K 0 = 206 . 2   kJ / mol
CO + H 2 O CO 2 + H 2   Δ H 298 K 0 = 41 . 2   kJ / mol
Haberman et al. [26] refined the Langmuir–Hinshelwood kinetic model on the Ni/YSZ catalysts based on the Arrhenius equation, which is generally used to calculate the reaction rates of MSR and WGSR, and was also used in this study. The equations for reaction rates are shown in Table 1.

2.2. Transfer Process and Governing Equations

The transfer processes that take place inside SOFCs include the transfer of gas mass, momentum, energy, and charges [2,5,8].

2.2.1. Mass Transfer

The mass transfer process inside the SOFC refers to the transfer of gas species in the manifold, the channel, and the porous electrode. The gas species transfer in the manifold and gas channel is mainly by convection, while the transfer in the porous electrode is mainly by permeative flow and is influenced by the pore size and particle scale of the porous electrode. The diffusion behavior of gas species in porous media is mainly described by the Fick Model (FM), Stefan–Maxwell Model (SMM), and Dusty Gas Model (DGM) [5].
The FM assumes that gas molecules always diffuse from the region of high concentration to the region of low concentration and that the diffusion rate is proportional to the concentration gradient. The extended FM integrates the molecular diffusion flow of the Fick model with the viscous flow calculated by Darcy’s law. The mass diffusion flux of the extended Fick model can be calculated by Equation (3) [5].
J i = ε τ 2 ( ρ g D i , g m Y i + K μ g ρ g Y i p )
where ε is the porosity of the porous electrode, τ is the tortuosity, ρg is the gas density, Di,gm is the gas diffusion coefficient, μg is the gas viscosity, and Yi is the mass fraction of species i. Considering the interaction between the gases and the effect of the porous medium structure on the gas species, the effective mass diffusion coefficient of species i in the gas mixture can be calculated by Equation (4).
D i , e f f = ε τ ( D i , g m D i , k ) ( D i , g m + D i , k )
where Di,k is the Knudsen diffusion coefficient. SMM can accurately describe the diffusion process of the multicomponent and concentrated mixtures in free space or porous media with large pore size, but it is not suitable for describing the frequent collisions that occur between fluid molecules and solid surfaces in porous media, while DGM is based on the Stefan–Maxwell equation, which further considers the interaction between molecules and pores walls by introducing the Knudsen diffusion term [8].
The mass conservation for the gas species within the SOFC can be described by Equation (5).
( ε ρ e f f U ) = S m
where ρeff is the average density of the gas mixture, U is the velocity vector, and Sm is the total mass source term.

2.2.2. Momentum Transfer

The momentum transfer process refers to the transfer of momentum (product of mass and velocity) from the high-velocity fluid layer to the low-velocity fluid layer or wall boundary layer when there is a relative motion between the fluid and the adjacent fluid layer or the wall of the pipe. The momentum transfer process of the gas species inside the SOFC can be described by the Navier–Stokes (N-S) equation [5], as shown in Equation (6).
( ε ρ e f f U U ) = ε P + ( ε μ e f f U ) + S d

2.2.3. Energy Transfer

The energy transfer processes inside the SOFC mainly include heat transfer between the solid and gas phases, enthalpy changes caused by the diffusion of gas species, and the heat release from the electrochemical reaction [8]. Heat transfer is mainly classified as heat conduction, heat convection, and heat radiation.
Heat conduction refers to the transfer of energy from higher-energy molecules to lower-energy molecules through collisions when there is a temperature gradient in a static medium, and the energy flow density of heat conduction can be calculated by Equation (7).
Q c o n d u c t = k d T d x
Heat convection refers to the heat exchange generated by the superposition of the random motion of molecules and the macroscopic motion of the fluid when the temperature between the fluid and the interface is different, and the energy flow density of heat convection can be calculated by Equation (8).
Q c o n v e c t = h ( T w a l l T )
Heat radiation refers to the emission of energy caused by a change in the position of the arrangement of electrons in the molecules or atoms that make up a substance at a certain temperature. Heat radiation transfers energy through electromagnetic waves, and the energy flow density of heat radiation can be calculated by Equation (9).
Q r a d = ξ σ T T w a l l 4 α T σ T T s 4
where ξ is the emissivity, σT is the Stefan–Boltzmann constant, aT is the absorptivity, Twall is the surface temperature of the research object, Ts is the ambient temperature.
In this study, considering heat conduction, heat convection, and heat radiation, the energy transfer inside SOFCs is described by the local thermal equilibrium method, and the energy conservation can be described by Equation (10).
( ρ e f f U T ) = ( k e f f T i = 1 n m i H i ) + S T
where miHi is the enthalpy change caused by the mass diffusion of species i, ST is the heat source term, Cp,eff is the effective specific heat capacity, and keff is the effective thermal conductivity.

2.2.4. Charge Transfer

The charge transfer process inside the SOFC mainly includes the transfer of electrons in the conductor and the transfer of oxygen ions in the electrolyte material. The electron and ion conservation can be described by Equations (11) and (12), respectively.
( σ e l e c , e f f ϕ e ) = A V e × i
( σ i o n , e f f ϕ i ) = A V e × i
where σelec,eff and σion,eff are the electrical conductivity and ionic conductivity, respectively; i is the activation current density; and Ave is the specific surface area.

2.3. Electrochemical Reaction Mechanism

Considering the various polarization losses that occur under operating conditions, the actual operating voltage Vcell of SOFCs can be calculated by Equation (13).
V c e l l = E N e r n s t η a c t η c o n c η o h m
where ηact is the activation overpotential; ηconc is the concentration overpotential; ηohm is the ohmic overpotential. The concentration overpotential ηconc,a/c and ohmic overpotential ηohm can be calculated by Equations (14)–(16), respectively [4].
η c o n c , a = R T 2 F l n ( y H 2 b u l k y H 2 O T P B y H 2 T P B y H 2 O b u l k ) + R T 2 F l n ( y C O b u l k y C O 2 T P B y C O T P B y C O 2 b u l k )
η c o n c , c = R T 4 F l n ( y O 2 T P B y O 2 b u l k )
η o h m = j i δ j σ j
where ybulk and yTPB are the molar fraction of gas species in the channels and electrode active layer, respectively; δj is the thickness of each electrode layer; and σj is the conductivity of each electrode layer.
The Butler–Volmer equation is used to describe the relationship between the activation overpotential and the current [7], which is expressed as:
i = i 0 { e x p ( α a n F η a c t R T ) e x p ( ( 1 α a ) n F η a c t R T ) }
where i is the current density, i0 is the exchange current density per active surface area (A/m2), aa is the electron transfer coefficient, and n is the number of electrons transferred by 1 mole of fuel oxidation.
The activation overpotential can be expressed as:
η a c t = Φ s Φ l Φ e q
where Φ s and Φ l are the potentials of electron and ionic, respectively; Φ e q is the equilibrium potential.

2.4. Thermal Stress Model

Under high-temperature operating conditions, the thermal stresses inside the SOFC are mainly caused by the mismatch of the thermodynamic parameters of the component materials, the uneven distribution of the internal temperature field, and the applied loads [12]. The thermal stress model assumes that all components of the SOFC undergo elastic deformation when subjected to thermal loads, and mechanical theory conforms to Hooke’s Law [20,21,22,23]. The total strain consists of initial strain, elastic strain, and thermal strain, which can be calculated by Equation (19).
ξ = ξ e l + ξ t h + ξ 0
Thermal strain can be calculated by Equation (20).
ξ t h = α ( T T r e f )
where α is the thermal expansion coefficient of the material; Tref is the free stress temperature, which is usually determined by the preparing and processing of the material [23].
The stress–strain relationship of elastic material under thermal loading can be calculated by Equation (21).
σ = D ( ξ ξ t h ξ 0 ) + σ 0 = D ( ξ α ( T T r e f ) ) + σ 0
where σ is the stress, D is the elasticity matrix, σ0 is the initial stress, T is the physical temperature for calculating the thermal stress, and Tref is the reference temperature for the free stress. The Tref in the operating condition is usually assumed to be the temperature (1073 K) of NiO reduction to Ni in the porous anode, because Frandsen et al. [11] found that the creep effect generated during the reduction process leads to the internal stress being relaxed to zero in a short time.
The physical parameters of the dual-phase composite (nickel–yttria-stabilized zirconia, ASL; nickel–yttria-stabilized zirconia, AAL; La0.6Sr0.4Co0.2Fe0.8O3-δ-Ce0.8Gd0.2O2, CAL) are calculated based on the Chin–Lung Hsieh calculation model [27]. The thermal expansion coefficient of the dual-phase composite varies with the content of Ni and LSCF [10]. The higher thermal expansion coefficient will lead to the increase in stress on the electrode material, thus affecting the stability of the thermal–mechanical properties of SOFC.

2.5. Geometric Model

To elucidate the heat and mass transfer processes of SOFC and examine the thermal stress distribution, a planar configuration including PEN (positive/electrolyte/negative), manifold, interconnect, sealant, and the frame was considered. The schematic of the assembly system is shown in Figure 1a. To illustrate the flow of gas clearly, the geometry of channels (CH) is given in Figure 2b. The co-flow arrangement is shown in Figure 1c. The PEN consists of an anode support layer (ASL), an anode active layer (AAL), an electrolyte layer (EL), a diffusion barrier layer (DBL), a cathode active layer (CAL), and a cathode current collect layer (CCCL), as shown in Figure 1d. As the anode-supported SOFC is symmetric, only the left half of the SOFC is included in this simulation (6.5 channels), as shown in Figure 2. The geometry model was established according to the structural dimensions and material parameters of the 4 cm × 4 cm (≥0.7 W/cm2) anode-supported SOFC manufactured by Ningbo SOFC-Man Energy Technology Co., Ltd (Ningbo, China). The geometrical parameters of the computational domain are shown in Table 2.

2.6. Boundary Conditions and Physical Properties

The boundary conditions and relevant physical properties of the multiphysics coupling model are determined based on the actual operating conditions of SOFCs and the stack design. The SOFC interconnects and ribs are Crofer 22 APU stainless steel, and the chemical composition of Crofer 22 APU stainless steel is shown in Table 3. The sealing material is Flexitallic 866. The PEN is composed of an anode (nickel–yttria-stabilized zirconia, ASL; nickel–yttria-stabilized zirconia, AAL), an electrolyte (yttria-stabilized zirconia, EL), a diffusion barrier layer (Ce0.8Gd0.2O2, DBL), a cathode (La0.6Sr0.4Co0.2Fe0.8O3-δ-Ce0.8Gd0.2O2, CAL; La0.6Sr0.4Co0.2Fe0.8O3-δ, CCCL). The physical properties of each component are shown in Table 4, and parameters for the thermal stress analysis of a SOFC are shown in Table 5. Since each channel inside the SOFC is a periodic unit, this study divides the SOFC into 6.5 units, each of which includes gas channels, interconnects, ribs, and the corresponding PEN, with the unit closest to the edge of the SOFC being defined as unit 1 and so on thereafter. Considering that the simulated SOFC is located in the middle of the stack, the top and bottom surfaces of the SOFC are set as adiabatic boundaries, and the other surfaces are natural convection and radiant heat transfer with the environment (convective heat transfer coefficient and emissivity coefficient are 2 W∙m−2∙K−1 and 0.3, respectively [9]). The fuel includes hydrogen fuel (molar fraction: 99%H2, 1%H2O) and methane syngas fuel (molar fraction: 10%H2, 67.5%H2O, 22.5%CH4, the steam-to-carbon ratio is 3). Setting the steam-to-carbon ratio to 3 can effectively suppress coking [2]. The inlet gas flow rate of the anode manifold and cathode manifold is 6.68 × 10⁻⁶ m3·s−1 and 1.67 × 10⁻⁵ m3·s−1, respectively. Detailed major boundary conditions and input parameters of the SOFC model are summarized in Table 6.

3. Solution Methodology and Model Validation

The SOFC model outlined above is implemented by using the finite element method in the commercial software COMSOL Multiphysics®. The finite element method is a method of solving problems by discretizing a continuous solution domain into a set of combinations of units, which has the characteristics of high applicability and is widely used to solve problems with strong coupling of multiphysics. The model was validated by comparing with experimental results in our previous work [6].

4. Results and Discussion

The temperature distributions inside SOFCs are shown in Figure 3. As expected, the temperature profiles of the different fuels are rather different. It is found in Figure 3a (hydrogen fuel) that the high-temperature zone (1117 K) of the PEN is mainly concentrated in the central region of units 5, 6, and 7, and then gradually decreases from this region towards the surrounding walls. The first reason is that the initial molar concentration of H2 and O2 is larger, and the electrochemical reaction gradually increases along the x-axis, releasing a large amount of heat in the central region, and then the concentration of the gas species decreases and the electrochemical reaction weakens. The second reason is that there is a significant temperature difference between the inside of the cell and the outside environment, resulting in heat being radiated from the outside wall through electromagnetic waves, while the outside ambient air also takes away some of the heat through thermal convection. As for the methane syngas fuel (Figure 3b), the temperature in the latter part of units 5, 6, and 7 is the lowest (1032 K), and then gradually increases from this region toward the surrounding walls. The low temperature occurs because the initial molar concentration of H2 is small, the initial concentration of CH4 and H2O is large, and the heat absorbed by the endothermic MSR reaction is greater than that released by electrochemical reactions. The gradual increase in temperature toward the surrounding walls is due to the absorption of energy radiated from outside by the outside walls and the partial heat brought by the thermal convection of outside air. From Figure 3a, it also found that the temperature distribution trend of each layer along the x-axis is almost the same, and the same trend is also found from Figure 3b. The temperature difference is mainly due to the different thermal conductivities as well as the thickness of each component. In addition, since no chemical reactions occur in the manifold and only the diffusion of gas species is involved, the manifold temperature changes are small.
The velocity distributions inside SOFCs are shown in Figure 4. It is found that the velocity field distributions are the same for different fuels. The velocity field distribution is influenced by various factors, such as the temperature difference between the channel wall and the gas inside the channel, the concentration variation of the gas species (mass diffusion of gas species and the participation of gas species in electrochemical and chemical reactions), the gas mass flow rate, etc. It can be seen that in the y-z plane x = 0.024 m; the velocity in the center of the channel is greater than that near the wall. This is due to the viscosity factor of the fluid itself, which causes the flow of gas species to form a boundary layer at the wall of the channel. It can be seen also that the velocity in the cathode channel is larger than that in the anode channel. This is because enhancing the thermal convection effect of the manifold and channels by increasing the airflow is usually used as the main way to cool the SOFC while providing enough air to ensure the reduction reaction rate so that the reduction reaction occurs fully, so the air flow rate is generally much higher than the fuel gas flow rate and the air velocity on the cathode side is higher than the fuel velocity on the anode side. In addition, the transfer of gas species in porous media follows Darcy’s law, which relies mainly on the pressure drop caused by additional resistance to percolation and is influenced by the pore size and particle scale of porous electrodes, while the transfer of gas components in SOFC manifolds and gas channels is mainly by convection, so the velocity gradient in gas channels is significantly larger than that in porous media. It is found that the average velocity of channels 4 and 5 is significantly higher than that of channels 1, 2, 6, and 7, and the average velocity of anode channel 4 (1.35 m·s
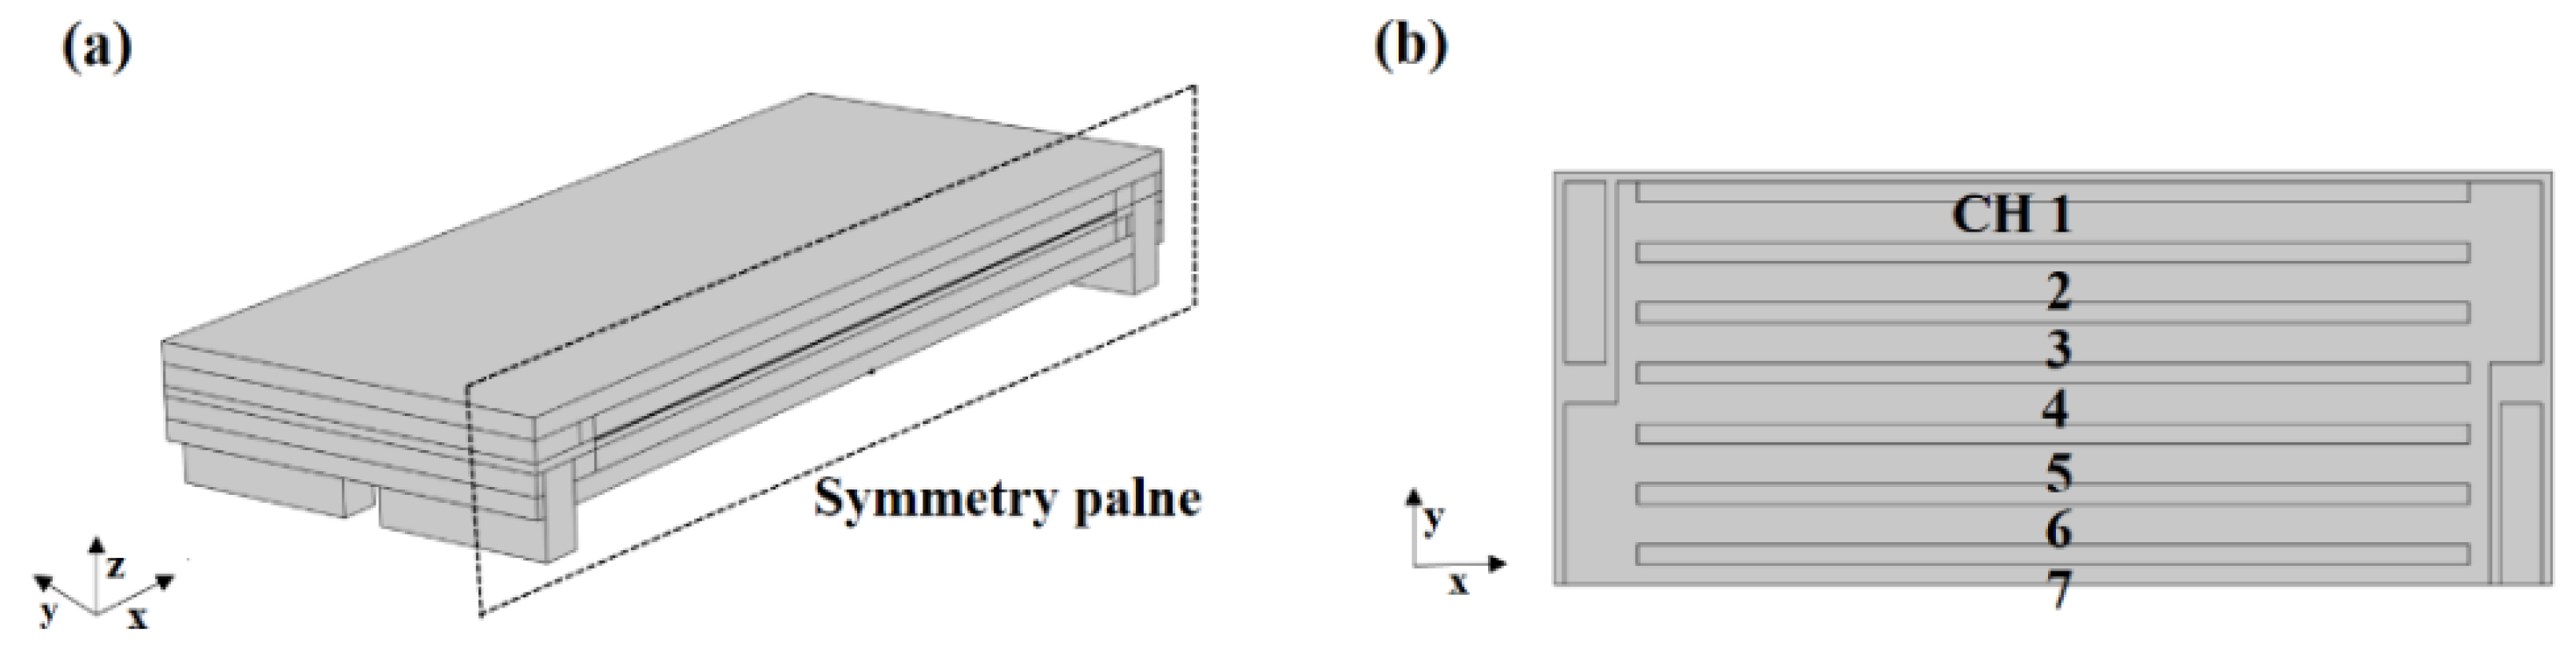
−1) is the highest, and channel 1 is the slowest. As can be seen in Figure 2b, the inlet/outlet of channels 4 and 5 are closer to the inlet/outlet of the anode manifold, and the fuel in channels 4 and 5 can come up and flow directly from the inlet manifold to the outlet manifold, while the flow to channels 1 and 2 requires a longer diffusion path and slows down the velocity.
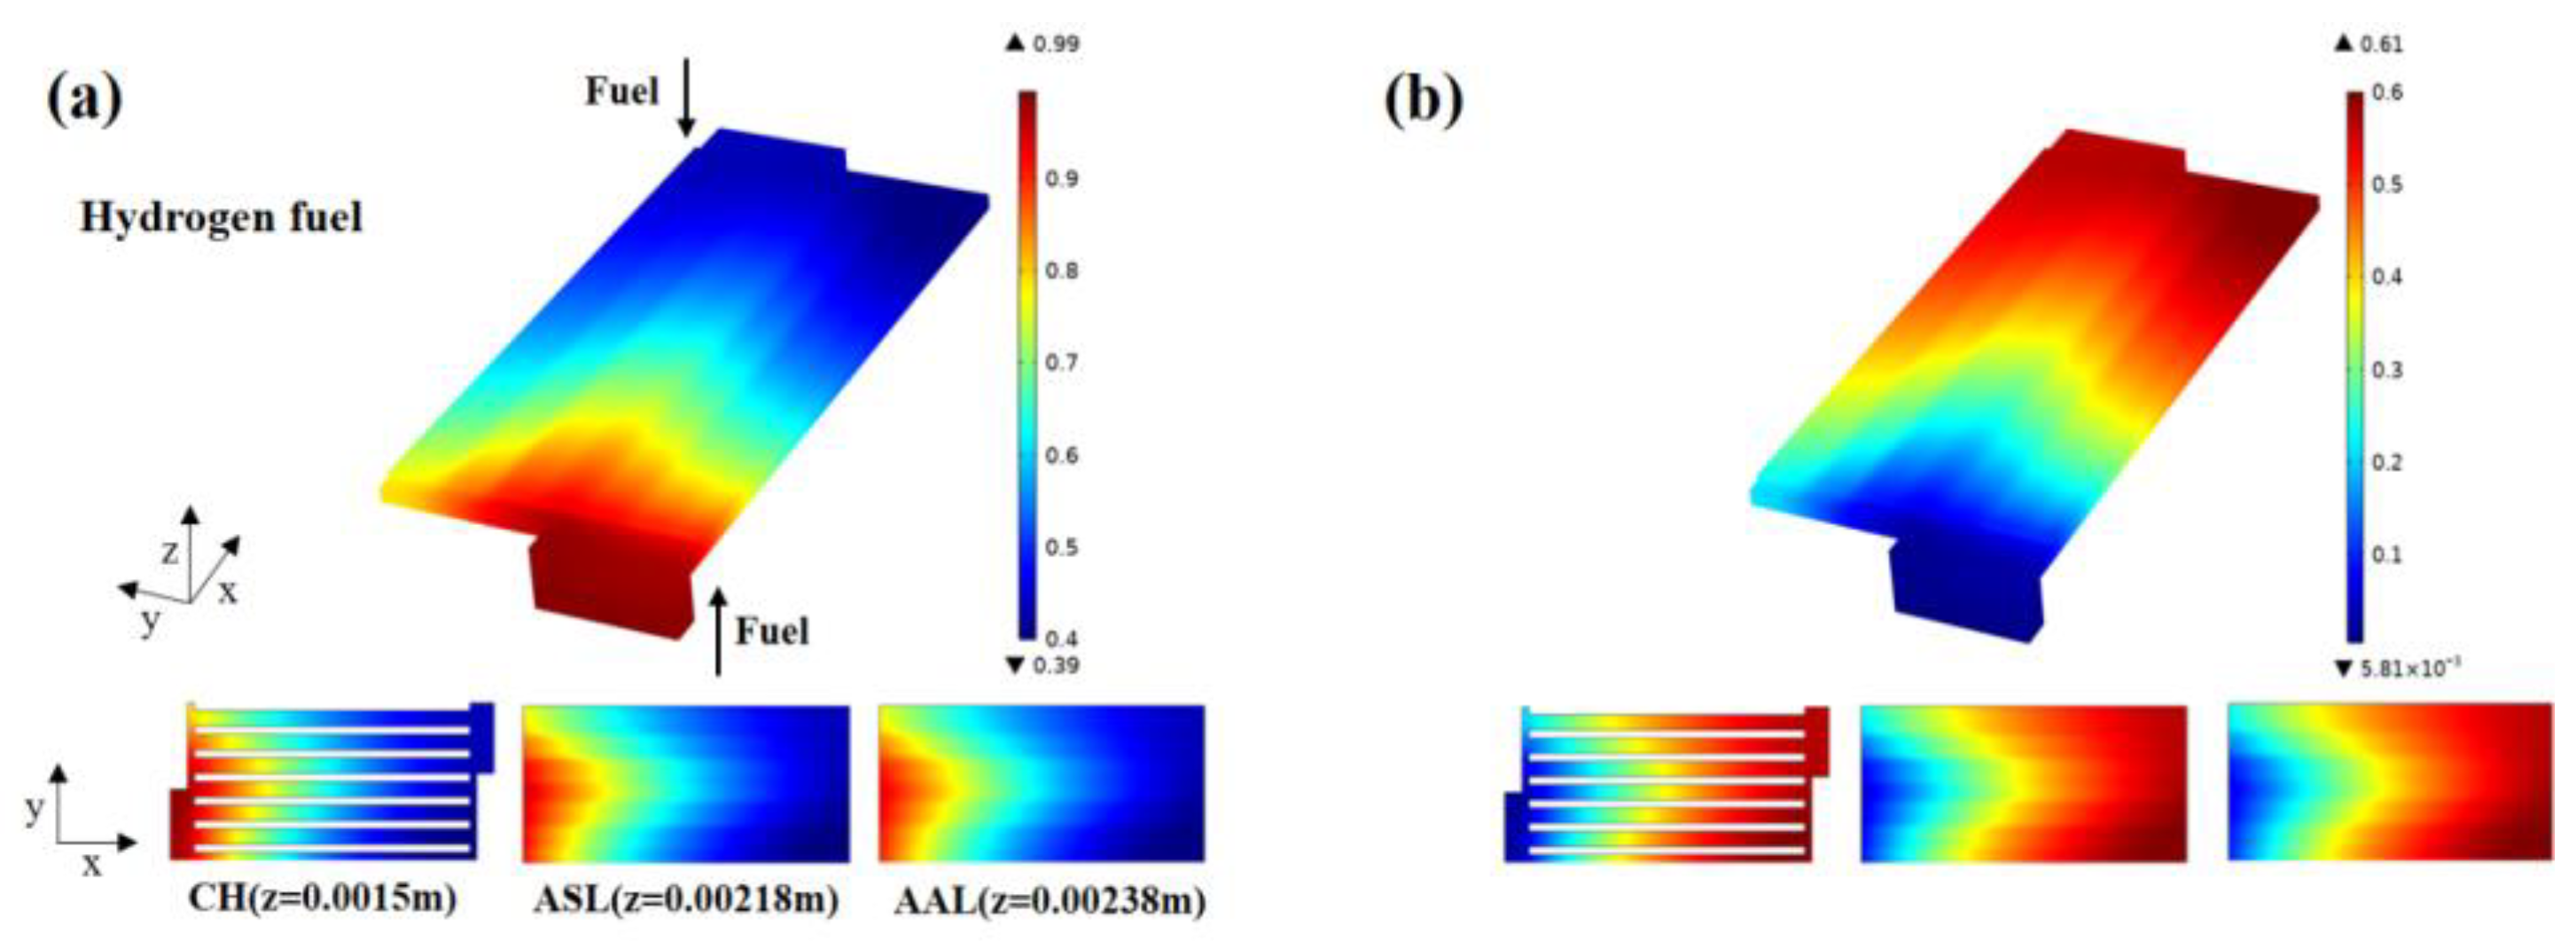
The molar fractions inside the hydrogen-fueled SOFC are shown in Figure 5. The general trend of the molar fraction of H2 decreases gradually along the fuel flow direction (x-direction), while the molar fraction of H2O increases gradually. This is due to the H2-H2O electrochemical reaction that takes place in the anode active layer, in which there is a depletion of H2 and a production of H2O. It can be seen that in the channels (x-y plane, z = 0.0015 m), the molar fraction of H2 in channels 1 and 2 is significantly smaller than that in the central region of the cell. This is consistent with the velocity field analysis above, where H2 comes up from the anode manifold and diffuses to the edge channels, requiring a longer transport path. Also from the middle section of the anode active layer (x-y plane, z = 0.00238 m) in Figure 5b, it can be found that the higher molar fraction region of H2O is located at the latter part of units 6 and 7. This is because the temperature in this region is higher and the charge exchange process is stronger, which drives the acceleration of the electrochemical reaction and consumes more hydrogen to generate water, while the region is also a marginal region where the generated water is difficult to transfer out. The molar fractions inside the methane syngas-fueled SOFC are shown in Figure 6. As can be seen from Figure 6, the molar fraction distributions of H2 and H2O in the methane syngas-fueled SOFC change significantly from the anode support layer to the active layer compared to the hydrogen-fueled SOFC. This is due to the simultaneous electrochemical reactions of methane reforming and H2-H2O in the anode activation layer. CH4 is the main reactant of the reforming reaction on the anode side, and the continuous reforming reaction causes the molar fraction of CH4 to gradually decrease along the direction of gas flow (positive direction of the x-axis). CO2 is the dual product of the water vapor conversion reaction and CO-CO2 electrochemical reaction, and will gradually accumulate along the direction of the main flow channel as the above reaction proceeds. When the gas flow rate is low, most of the reactants (H2, CO) are consumed in the TPB of anode active layer, resulting in low molar fractions of H2 and CO in the anode active layer. If the gas flow rate is too large, only some of the methane is reformed, resulting in a higher methane molar fraction in the anode support layer. Combining Figure 5 and Figure 6 for analysis, it found that the uneven distribution of gas components is mainly concentrated in the electrode area corresponding to the channels and the ribs.
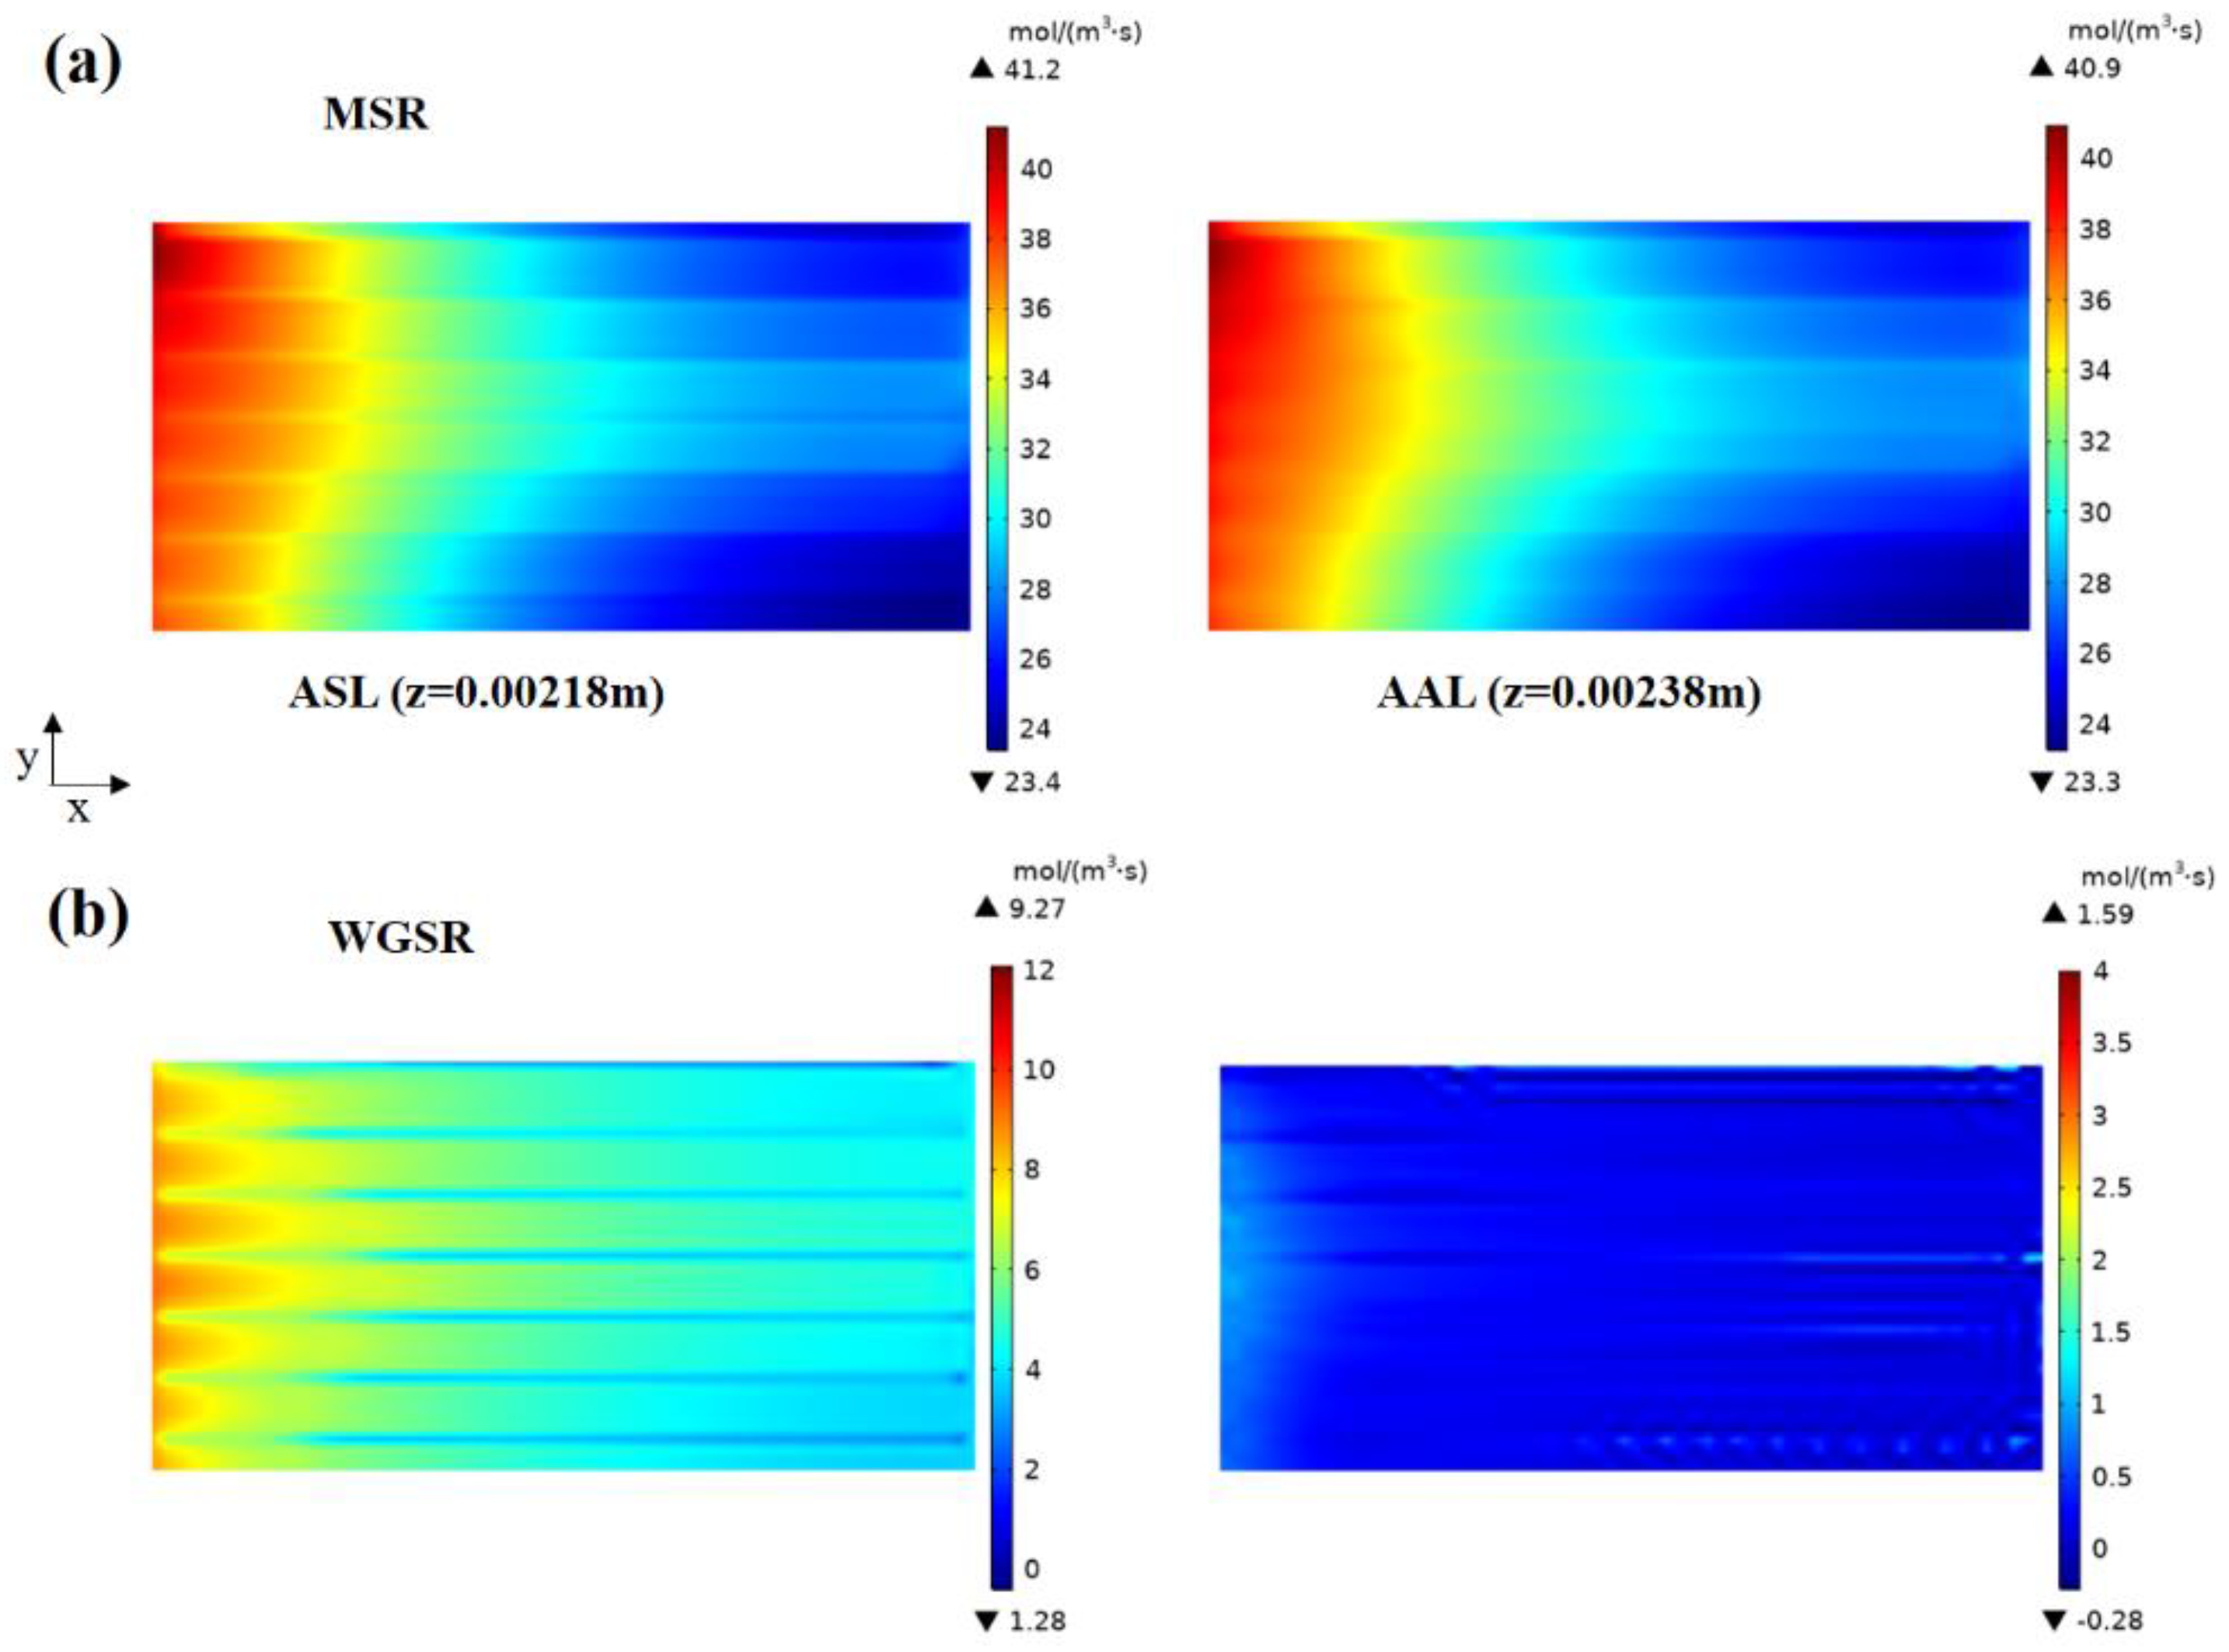
The reaction rate of methane syngas-fueled SOFC in the anode layer is shown in Figure 7. In Figure 7a (MSR), it is clear that the general trend of the MSR reaction rate decreases gradually along the fuel flow direction (x-direction), and the maximum value of the MSR reaction rate appears in the first half of unit 1 and the minimum value appears in the latter part of unit 7. The reaction rate is mainly influenced by the supply of reactants involved in the reaction and the amount of heat required for the reaction. From the temperature field distribution above, it is clear that the temperature of unit 1 near the wall is higher, coupled with the larger initial molar fraction of H2O and CH4 at the entrance of unit 1, so the reaction rate in this region is higher. This is because the MSR near the gas channel inlet is strong and provides a large amount of CO for the WGSR reaction, so the WGSR reaction rate in this region is large and then decreases gradually along the gas flow direction. It can also be seen that the reaction rate of WGSR becomes negative from the anode support layer (x-y plane, z = 0.00218m) to the anode active layer (x-y plane, z = 0.00238 m). The first reason is that the permeability of the anode active layer is smaller than that of the anode support layer (the relevant physical parameters of the solid structure are in Table 3). The second reason is that the CO-CO2 electrochemical reaction in the anode active layer also consumes a large amount of CO continuously, prompting the WGSR at this place to carry out the inverse reaction to reach the equilibrium, and the reaction rate of the WGSR becomes negative.
The first principal stress is normally the maximum stress normal to a plane, which may reduce thermal cracks in the ceramic cell. Therefore, this study focuses on comparing the first principal stresses, with positive and negative values representing tensile and compressive stresses, respectively [23].
The first principal stress in the middle section of each electrode layer of the PEN is shown in Figure 8. The maximum values of the first principal stresses (comparing the magnitude of the stress extremes, positive and negative only represent the direction) for the anode support layer, electrolyte layer, diffusion barrier layer, and cathode current collection layer fueled by hydrogen are 13.60 MPa, 57.80 MPa, 15.50 MPa, and 2.89 MPa, respectively. The maximum values of the first principal stresses fueled by methane are 7.7 MPa, 20.9 MPa, 6.8 MPa, and 4.76 MPa, respectively. It can be found that the maximum stress variation gradient between electrode layers is larger for hydrogen SOFCs (44.2 MPa) than for methanol syngas SOFCs (14.1 MPa). It can also be seen that the maximum value of the first principal stress in the electrolyte is much higher than that in the anode and cathode. This is because the electrolyte layer has the lowest coefficient of thermal expansion and the highest Young’s modulus of all components (the thermomechanical parameters of each component in Table 5) and is susceptible to mechanical constraints from adjacent components. It is found in Figure 8a (hydrogen fuel) that the stress distribution trends of the anode support layer, electrolyte layer, and barrier layer are the same, with larger stress values in the center region of unit 1 and smaller stress values in the inlet and outlet side of unit 1. As for the methane syngas fuel (Figure 2b), it is revealed that each electrode layer is subjected to both tensile and compressive stresses. Combining Figure 8a,b for analysis, it found that there is a significant stress gradient in the y-axis direction in the anode support layer and the cathode current density collection layer. This is because the positive corresponding electrode part of the ribs is constrained by the fixed stress of the ribs as well as the upper and lower connectors, while the gas channel cannot provide support. The first principal stress of assembly components is shown in Figure 9. As expected, the thermal stress distribution of different fuels is rather different. It is noted that the remaining components of the methane syngas-fueled SOFC have a greater range of stress variation than the hydrogen-fueled SOFC, and the stress extremes occur in the edge regions where the adjacent assembly components are in contact. It is found, in Figure 9 (interconnect), that the higher stress zone located at the lower interconnect near the anode manifold inlet is subject to tensile stress, while the methane syngas-fueled SOFC is mainly subject to compressive stress in this region. It is also found that the sealant was subjected to the lowest stress value of all components in Figure 9 (sealant). In addition, the interconnect and the metal frame are subjected to both tensile and compressive stresses, which may lead to delamination or severe deformation, resulting in gas leakage and other conditions. In this case, it can be improved by increasing the external load of the stack or by finding a more compatible sealing material.

5. Conclusions

A comprehensive thermo–electro–chemo–mechanical coupled three-dimensional model was applied to investigate the heat/flow transfer and thermal stress in an anode-supported planar SOFC. The distributions of temperature, velocity, molar fractions of species, reaction rate, and stress under typical operating conditions (1023 K−1123 K) with different fuel inlet compositions were analyzed in detail.
The fuel inlet composition has a significant effect on heat and mass transfer. The high temperature zone of the hydrogen-fueled SOFC is located at the central part of units 5, 6, and 7, and the maximum value is about 44 K higher than that of methane syngas-fueled SOFC. The methane-reforming and electrochemical reactions in the anode active layer result in a significant concentration gradient between the anode support layer and the active layer of the methane syngas-fueled SOFC.
The thermal stress distribution of different fuel inlet compositions is rather different. The maximum stress variation gradient between electrode layers is larger for hydrogen SOFCs (44.2 MPa) than for methanol syngas SOFCs (14.1 MPa), but the remaining components have a more uniform stress distribution. In addition, the electrode layer of each fuel SOFC produces a significant stress gradient in the y-axis direction, and stress extremes appear in the corner regions where adjacent assembly components are in contact.

Author Contributions

Conceptualization, W.C., Z.Y. and Z.Z.; methodology, W.C.; software, W.C. and Z.Z.; validation, W.C., Z.Y. and Z.Z.; formal analysis, W.C., Z.Z. and J.Y.; investigation, W.C. and Z.Z.; resources, W.Y. and Z.Y.; data curation, W.C. and Y.P.; writing—original draft preparation, W.C., Z.Z. and J.Y.; writing—review and editing, W.C., Z.Z., S.L. and J.Y.; visualization, W.C. and Z.Z.; supervision, W.C. and Z.Z.; project administration, W.Y. and Z.Y.; funding acquisition, W.Y., Z.Y. and Q.Z. All authors have read and agreed to the published version of the manuscript.

Funding

This research was supported by National Natural Science Foundation of China (51979121, 52171308), and Natural Science Foundation of Fujian Province (2020J02041, 2021J01846, 2021H0021, 2022J01807), Xiamen Municipal Bureau of Sciences & Technology (3502Z20226011).

Institutional Review Board Statement

Not applicable.

Informed Consent Statement

Not applicable.

Data Availability Statement

Not applicable.

Conflicts of Interest

The authors declare no conflict of interest.

References

  1. Guo, M.T.; Lin, Z.J. Long-term evolution of mechanical performance of solid oxide fuel cell stack and the underlying mechanism. Int. J. Hydrogen Energy 2021, 46, 23293–24304. [Google Scholar] [CrossRef]
  2. Wu, Y.; Shi, Y.; Cai, N.; Ni, M. Thermal Modeling and Management of Solid Oxide Fuel Cells Operating with Internally Reformed Methane. J. Therm. Sci. 2018, 27, 203–212. [Google Scholar] [CrossRef]
  3. Serincan, M.F.; Pasaogullari, U.; Sammes, N.M. Thermal stresses in an operating micro-tubular solid oxide fuel cell. J. Power Sources 2010, 195, 4905–4914. [Google Scholar] [CrossRef]
  4. Zamudio-García, J.; Caizán-Juanarena, L.; Porras-Vázquez, J.M.; Losilla, E.R.; Marrero-López, D. A review on recent advances and trends in symmetrical electrodes for solid oxide cells. J. Power Sources 2022, 520, 230852. [Google Scholar] [CrossRef]
  5. Zhang, Z.G.; Yue, D.T.; Yang, G.G.; He, C.R.; Ye, S.; Wang, W.G.; Yuan, J.L. Three-dimensional CFD modeling of transport phenomena in multi-channel anode-supported planar SOFCs. Int. J. Heat Mass Transf. 2015, 84, 942–954. [Google Scholar] [CrossRef]
  6. Faheem, H.H.; Abbas, S.Z.; Tabish, A.N.; Fan, L.; Maqbool, F. A review on mathematical modelling of Direct Internal Reforming-Solid Oxide Fuel Cells. J. Power Sources 2022, 520, 230857. [Google Scholar] [CrossRef]
  7. Cai, W.; Zheng, Q.; Yu, W.; Yin, Z.; Yuan, J.; Zhang, Z.; Pei, Y. Effects of Methane Pre-Reforming Percentage and Flow Arrangement on the Distribution of Temperature and Thermal Stress in Solid Oxide Fuel Cell. Crystals 2022, 12, 953. [Google Scholar] [CrossRef]
  8. Lee, S.; Kim, H.; Yoon, K.J.; Son, J.-W.; Lee, J.-H.; Kim, B.-K.; Choi, W.; Hong, J. The effect of fuel utilization on heat and mass transfer within solid oxide fuel cells examined by three-dimensional numerical simulations. Int. J. Heat Mass Transf. 2016, 97, 77–93. [Google Scholar] [CrossRef]
  9. Zheng, J.; Xiao, L.; Wu, M.; Lang, S.; Zhang, Z.; Chen, M.; Yuan, J. Numerical Analysis of Thermal Stress for a Stack of Planar Solid Oxide Fuel Cells. Energies 2022, 15, 343. [Google Scholar] [CrossRef]
  10. Xie, J.M.; Wang, F.H. Thermal stress analysis of solid oxide fuel cell with anode functional layer. J. Inorg. Mater. 2017, 32, 400–406. [Google Scholar] [CrossRef]
  11. Frandsen, H.; Makowska, M.; Greco, F.; Chatzichristodoulou, C.; Ni, D.; Curran, D.; Strobl, M.; Kuhn, L.; Hendriksen, P. Accelerated creep in solid oxide fuel cell anode supports during reduction. J. Power Sources 2016, 323, 78–89. [Google Scholar] [CrossRef] [Green Version]
  12. Jiang, C.; Gu, Y.; Guan, W.; Zheng, J.; Ni, M.; Zhong, Z. 3D thermo-electro-chemo-mechanical coupled modeling of solid oxide fuel cell with double-sided cathodes. Int. J. Hydrogen Energy 2020, 45, 904–915. [Google Scholar]
  13. Xu, Q.; Xia, L.; He, Q.; Guo, Z.; Ni, M. Thermo-electrochemical modelling of high temperature methanol-fueled solid oxide fuel cells. Appl. Energy 2021, 291, 116832. [Google Scholar] [CrossRef]
  14. Luo, Y.; Liao, S.; Chen, S.; Fang, H.; Zhong, F.; Lin, L.; Zhou, C.; Chen, C.; Cai, G.; Au, C.-T.; et al. Optimized coupling of ammonia decomposition and electrochemical oxidation in a tubular direct ammonia solid oxide fuel cell for high-efficiency power generation. Appl. Energy 2022, 307, 118158. [Google Scholar] [CrossRef]
  15. Luo, Y.; Shi, Y.X.; Liao, S.T.; Chen, C.Q.; Zhan, Y.Y.; Au, C.-T.; Jiang, L. Coupling ammonia catalytic decomposition and electrochemical oxidation for solid oxide fuel cells: A model based on elementary reaction kinetics. J. Power Sources 2019, 423, 125–136. [Google Scholar] [CrossRef]
  16. Ong, K.M.; Lee, W.Y.; Hanna, J.; Ghoniem, A.F. Isolating the impact of CO concentration in syngas mixtures on SOFC performance via internal reforming and direct oxidation. Int. J. Hydrogen Energy 2016, 41, 9035–9047. [Google Scholar] [CrossRef]
  17. Xie, Y.Y.; Ding, H.P.; Xue, X.J. Direct methane fueled solid oxide fuel cell model with detailed reforming reactions. Chem. Eng. J. 2013, 228, 917–924. [Google Scholar] [CrossRef]
  18. Tseronis, K.; Fragkopoulos, I.; Bonis, I.; Theodoropoulos, C. Detailed Multi-dimensional Modeling of Direct Internal Reforming Solid Oxide Fuel Cells. Fuel Cells 2016, 16, 294–312. [Google Scholar]
  19. Chiang, L.-K.; Liu, H.-C.; Shiu, Y.-H.; Lee, C.-H.; Lee, R.-Y. Thermal stress and thermo-electrochemical analysis of a planar anode-supported solid oxide fuel cell: Effects of anode porosity. J. Power Sources 2010, 195, 1895–1904. [Google Scholar] [CrossRef]
  20. Awrejcewicz, J.; Krysko, A.V.; Krylova, E.Y.; Yaroshenko, T.Y.; Zhigalov, M.; Krysko, V. Analysis of flexible elastic–plastic plates/shells behavior under coupled mechanical/thermal fields and one-sided corrosion wear. Int. J. Non-Linear Mech. 2020, 118, 103302. [Google Scholar] [CrossRef]
  21. Clague, R.; Marquis, A.J.; Brandon, N.P. Finite element and analytical stress analysis of a solid oxide fuel cell. J. Power Sources 2012, 210, 224–232. [Google Scholar] [CrossRef]
  22. Fang, X.; Lin, Z. Numerical study on the mechanical stress and mechanical failure of planar solid oxide fuel cell. Appl. Energy 2018, 229, 63–68. [Google Scholar] [CrossRef]
  23. Xu, M.; Li, T.; Yang, M.; Andersson, M. Solid oxide fuel cell interconnect design optimization considering the thermal stresses. Sci. Bull. 2016, 61, 1333–1344. [Google Scholar] [CrossRef] [Green Version]
  24. Thattai, A.T.; Van Biert, L.; Aravind, P.V. On direct internal methane steam reforming kinetics in operating solid oxide fuel cells with nickel-ceria anodes. J. Power Sources 2017, 370, 71–86. [Google Scholar] [CrossRef]
  25. Xu, H.R.; Chen, B.; Tan, P.; Zhang, Y.; He, Q.; Wu, Z.; Ni, M. The thermal effects of all porous solid oxide fuel cells. J. Power Sources 2019, 440, 227102. [Google Scholar] [CrossRef]
  26. Haberman, B.A.; Young, J.B. Three-dimensional simulation of chemically reacting gas flows in the porous support structure of an integrated-planar solid oxide fuel cell. Int. J. Heat Mass Transf. 2004, 47, 3617–3629. [Google Scholar] [CrossRef]
  27. Hsieh, C.L.; Tuan, W.H. Elastic and thermal expansion behavior of two-phase composites. Mater. Sci. Eng. A 2006, 425, 349–360. [Google Scholar] [CrossRef]
  28. Chiu, Y.-T.; Lin, C.-K. Effects of Nb and W additions on high-temperature creep properties of ferritic stainless steels for solid oxide fuel cell interconnect. J. Power Sources 2012, 198, 149–157. [Google Scholar] [CrossRef]
Figure 1. Geometry of anode-supported planar SOFC: (a) schematic of assembly system, (b) gas channel, (c) co-flow arrangement, (d) components of PEN.
Crystals 12 01697 g001
Figure 2. The schematic illustration for: (a) the computational domain; (b) the channel units.
Crystals 12 01697 g002
Figure 3. Temperature (K) distributions inside SOFC for: (a) hydrogen fuel; (b) methane syngas fuel.
Crystals 12 01697 g003
Figure 4. Velocity(m·s−1 ) distributions inside SOFC for: (a) hydrogen fuel; (b) methane syngas fuel.
Crystals 12 01697 g004
Figure 5. Molar fractions of hydrogen SOFC for: (a) H2; (b) H2O.
Crystals 12 01697 g005
Figure 6. Molar fractions of methane syngas SOFC for: (a) H2; (b) H2O; (c) CH4; (d) CO.
Crystals 12 01697 g006
Figure 7. Reaction rate(mol·m−3·s−1) distributions in anode layer for methane syngas fuel for: (a) MSR, (b) WGSR.
Crystals 12 01697 g007
Figure 8. Thermal stress in the middle section of each electrode layer of the PEN for: (a) hydrogen fuel; (b) methane syngas fuel.
Crystals 12 01697 g008
Figure 9. Thermal stress of the assembly components for: (a) hydrogen fuel; (b) methane syngas fuel.
Crystals 12 01697 g009
Table 1. Equations for reaction rates [26].
Reaction RateExpression
Methane steam-reforming reaction rate R r = k r f ( p C H 4 p H 2 O p C O ( p H 2 ) 3 K p r )   ( mol m 3 s 1 )
k r f = 2395 exp ( 231266 R T )   ( mol m 3 Pa 2 s 1 )
K p r = 1.0267 × 10 10 × exp ( 0.2513 Z 4 + 0.3665 Z 3 + 0.5810 Z 2 27.134 Z + 3.2777 )   ( Pa 2 )
  Z = 1000 T ( K ) 1
Water–gas shift reaction rate R s = k s f ( p H 2 O p C O p H 2 p C O 2 K p s )   ( mol m 3 s 1 )
k s f = 0.0171 exp ( 103191 R T )   ( mol m 3 Pa 2 s 1 )
K p s = exp ( 0.2935 Z 3 + 0.6351 Z 2 + 4.1788 Z + 0.3169 )   Z = 1000 T ( K ) 1
Rr is the methane steam-reforming reaction rate, Rs is the water–gas shift reaction rate, krf and ksf are the forward-catalyzed reaction rate constants, Kpr and Kps are the equilibrium constants.
Table 2. Geometrical parameters of simulation domain.
ParametersValues (m)ParametersValues (m)
Length/width of anode-supported SOFC (x/y-axis)4 × 10−2/2 × 10−2Length/width of manifold cross section (x/y-axis)2 × 10−3/9 × 10−3
Thickness of interconnect (z-axis)1 × 10⁻³Thickness of ASL (y-axis)3.65 × 10⁻⁴
Thickness of sealant (z-axis)1 × 10⁻³Thickness of AAL (z-axis)3.5 × 10⁻⁵
Thickness of frame (z-axis)4.8 × 10⁻⁴Thickness of EL (z-axis)1 × 10⁻⁵
Height/width of channel (z/y-axis)1 × 10−3/2 × 10−3Thickness of DBL (z-axis)3 × 10⁻⁶ m
Height/width of rib (z/y-axis)1 × 10−3/1 × 10−3Thickness of CAL (z-axis)1.7 × 10⁻⁵ m
Height of manifold (z-axis)2 × 10⁻³Thickness of CCCL (z-axis)5 × 10⁻⁵ m
Table 3. Chemical composition of Crofer 22 APU stainless steel tested (wt%) [28].
FeCCrMnSiTiCuSPAlLa
Crofer 22 APUBal.0.00322.710.440.020.070.01<0.0020.0040.010.09
Table 4. Properties for different components of the SOFC [8].
ASLAALELDBLCALCCCLInterconnectSeal
Thermal conductivity k (W·m−1·K−1)66222244.50.064
Porosity ε0.380.2 0.270.27
Volume fraction of electronic conductor in the composite θ0.40.4 0.5
Tortuosity τ513.3 3.53.5
Permeability β (m2)5.4 × 10−153 × 10−16 9 × 10−169 × 10−16
Active surface area-to-volume ratio Ave (m−1)1.08 × 1051.3 × 105 2.44 × 1062.44 × 106
Table 5. Parameters for the thermal stress analysis of an SOFC [10,12].
TNiNiOYSZLSCFGDCInterconnectSeal
Young’s modulus E (GPa)1073 K0.25901851090600.019
Poisson’s ratio v1073 K0.30.340.3130.320.320.30
Coefficient of thermal expansion α (10−6K−1)1073 K16.213.010.52612.6315.515.5
Table 6. Major boundary conditions and input parameters of SOFC model.
Boundary ConditionsTemperature/KSpeciesIonsElectrons
Anode manifold inletSccm: 4001073FuelNoneNone
Cathode manifold inletSccm: 10001073YO2 = 0.233, YN2 = 0.727NoneNone
Top of upper interconnectWallAdiabatic NoneNone0 V
Bottom of lower interconnectWallAdiabatic NoneNone0.7 V
Both sides of the cellWallAdiabatic NoneNoneNone
Anode channel outletPout = Patm = 1 atmConvection Convection NoneNone
Cathode channel outletPout = Patm = 1 atmConvection Convection NoneNone
Publisher’s Note: MDPI stays neutral with regard to jurisdictional claims in published maps and institutional affiliations.

