Article

Effects of Processing Strategies and La + Sm Co-Doping on the Thermoelectric Performance of A-Site-Deficient SrTiO3-δ Ceramics

1
Department of Ceramic and Glass Technology, Akanu Ibiam Federal Polytechnic, Unwana 490101, Ebonyi State, Nigeria
2
School of Engineering and the Built Environment, Edinburgh Napier University, Edinburgh EH10 5DT, UK
3
Department of Chemistry, Kentucky Wesleyan College, Owensboro, KY 42301, USA
4
Functional Materials and Devices Group, Department of Materials Science and Engineering, University of Sheffield, Sheffield S1 3JD, UK
*
Author to whom correspondence should be addressed.
Crystals 2022, 12(11), 1622; https://doi.org/10.3390/cryst12111622
Submission received: 27 September 2022 / Revised: 2 November 2022 / Accepted: 7 November 2022 / Published: 12 November 2022
(This article belongs to the Special Issue Thermoelectric Semiconductor Materials and Devices)

Abstract

:
The effect of calcining in either air (VSTO-A) or 5% H2/N2 (VSTO-H) on the thermoelectric performance of La and Sm co-doped A-site-deficient Sr1-3x/2Lax/2Smx/2TiO3-δ ceramics is reported. All calcined powders were sintered 6 h in 5% H2/N2 at 1773 K to ≥96% relative density. All peaks in X-ray diffraction patterns indexed as a cubic perovskite phase. Scanning electron microscopy revealed grain sizes ~14 and ~10 μm for VSTO-A and VSTO-H ceramics, respectively. x = 0.30 showed the lowest k (2.99 W/m.K at 973 K) for VSTO-A, whereas x = 0.20 had the lowest (2.67 W/m.K at 973 K) for the VSTO-H ceramics. x = 0.30 VSTO-A showed a thermoelectric figure of merit, ZT = 0.25 (at 973 K), whereas the maximum ZT = 0.30 (at 973 K) was achieved for x = 0.20 VSTO-H ceramics, demonstrating that thermoelectric properties are optimized when all processing is carried out in 5% H2/N2.

1. Introduction

Many thermoelectric materials are being explored for power generation applications, such as GeTe [1], PbTe [2], half Heuslers [3], Bi2Te3 [4], and silicides [5]. These non-oxide materials are the most researched thermoelectric materials because they possess improved thermoelectric, intrinsic small phonon group velocity and low thermal conductivity k required to optimize the figure of merit, ZT [6]. However, most non-oxide materials, e.g., Bi2Te3, Sb2Te3, SiGe, and PbTe are toxic, scarce, and costly, and many have low operational temperature range; hence, they exhibit restricted applications [7]. Studies have shown that oxides are viable alternatives in surmounting some of the challenges associated with non-oxides [8,9]. Promising among these oxide materials are p-type layered cobaltates such as NaCo2O4, (Sr,Ca)3Co4O9, Bi2-xPbxCo2O8 (0 ≤ x ≤ 0.4), Tl0.4[Sr0.9O]1.12CoO2, and [Pb0.7Hg0.4Sr1.9Co0.2][CoO2]1.8, whose ZT values range between 0.8 and 1.0 from 800 to 1000 K [10]. In contrast, n-type have low ZT values compared to p-type oxides, with some of the best properties demonstrated by Al-Ga co-doped ZnO (0.47 at 1000 K and 0.65 at 1247 K, respectively) [11,12] and 10 mol% La and 10 mol% Nb co-doped SrTiO3 and (ZT ≥ 0.60 at 1000–1100 K) [13].
Reduced rare earth (RE)-doped SrTiO3-δ ceramics have also shown promising thermoelectric properties and have been extensively studied with different dopants and doping mechanisms, various processing conditions, the integration of graphene or graphene oxide or metals [14,15,16,17,18,19] and the intentional creation of secondary phases [20] to improve the thermoelectric properties. Incorporation of graphene in oxide thermoelectrics is also a novel approach in achieving high ZT. Lin et al. [14] used this strategy by incorporating graphene in La-doped SrTiO3. They achieved a maximum ZT value of 0.42 at room temperature for the composite with 0.6 wt.% graphene. Recently, an optimum ZT~1.42 (at 1050 K) was reported for Nb-doped SrTiO3 with an incorporation of 0.5 wt.% natural graphite [19]. No doubt, this approach has opened up a new window for the fabrication of high-temperature thermoelectric generators.
The A-site vacancy effect has been studied in depth in our previous work [21] in which La-doped A-site-deficient Sr1-3x/2LaxTiO3 ceramics were processed in 5% H2/N2 reduced atmosphere, and a ZT = 0.41 (at 973 K) for x = 0.15 was achieved. Generally, introduction of cation vacancies in A- and/or B-site and doping with rare earth or transition metal cations followed by processing in a reduced atmosphere is a promising route to optimise thermoelectric properties [22]. In this study, the synergistic effects of the presence of Sr-(A-site) vacancies and processing conditions on the thermoelectric performance of Sr1-3x/2Lax/2Smx/2TiO3-δ (0.05 ≤ x ≤ 0.30) ceramics calcined in air (VSTO-A) and 5% H2/N2 (VSTO-H), with both sintered in reducing atmosphere, are examined.

2. Materials and Methods

A solid-state reaction (SSR) method was applied to synthesize A-site-deficient Sr1-3x/2Lax/2Smx/2TiO3 (x = 0.05, 0.10 0.15, 0.20, 0.30) powders. SrCO3 (99.9% purity) was dried at 180 °C overnight, and La2O3, Sm2O3, and TiO2 (99.9% purity) were heated at 900 °C for 6 h to remove OH- ions before weighing to ensure the correct stoichiometry. After drying, they were batched and mixed via ball milling (driver roller speed = 300 rpm) in isopropanol with yttria-stabilized zirconia (YSZ) milling media for 24 h. The obtained slurry was then dried at 80 °C and sieved using a 250 μm mesh. The dry mixture was calcined at 1573 K in air (VSTO-A) or in 5% H2/N2 mixed gas (VSTO-H) for 6 h and later re-milled using a ball mill at driver roller speed of 300 rpm. Particle size analysis (PSA) of the milled powders was performed using a Mastersizer 3000 Laser Particle Size Analyzer (Malvern Instruments Limited, UK). Finally, the calcined powders were pressed into pellets (20 mm in diameter and 2 mm thick) using a uniaxial press at 32 MPa for ~60 s. They were then sintering in flowing 5% H2/N2 gas at 1773 K for 6 h.
The experimental density of the ceramics was determined by the Archimedes’ method using an electronic digital density balance (Mettler-Toledo AG Balance, Columbus, OH, USA). Thermogravimetric analysis (TGA) was performed using a Perkin Elmer Pyris 1 TGA Analyzer in air with a 5 °C/min heating rate up to 1000 °C followed by a 5 °C/min cooling rate to room temperature. The phase purity and lattice parameters of the ceramics were characterised by powder X-ray diffraction (XRD) with Cu Kα radiation (λ = 1.5406 Å) using a D2 phase diffractometer. Samples for scanning electron microscopy (Philips XL 30 S-FEG, Amsterdam, The Netherlands) were polished to a mirror finish, thermally etched, and carbon coated using an Edwards vacuum carbon coater (Edwards High Vacuum Ltd, England). After carbon coating of the samples, microstructural examination was performed using XL 30 S-FEG (Philips/FEI) at an accelerating voltage of 5–20 kV. The grain size in the microstructures was calculated using the line-intercept method [23,24].
The electrical conductivity (σ) and Seebeck coefficient (S) were simultaneously measured on ~15 mm × 2.5 mm × 3.5 mm bar samples as a function of temperature from 573–973 K in an Ar atmosphere using the four-probe method on a Netzsch SBA 458 Nemesis system. Thermal conductivity (k) of the ceramics was determined from experimental density, with specific heat and thermal diffusivity measured in a nitrogen atmosphere by the laser flash method (Anter Flashline TM 3000 Thermal Properties Analyzer)

3. Results and Discussion

3.1. Particle Size

The particle size distribution analysis of the calcined, doped SrTiO3 powders after ball milling (before sintering) is presented in Table 1. All milled powders showed d50 (median) particle sizes of 5.2 and 3.6 μm for VSTO-A and VSTO-H ceramics, respectively. Due to the same ball-milling parameters, calcination at the same temperature in 5% H2/N2 gas may be advantageous for achieving a lower average particle size for sintering.

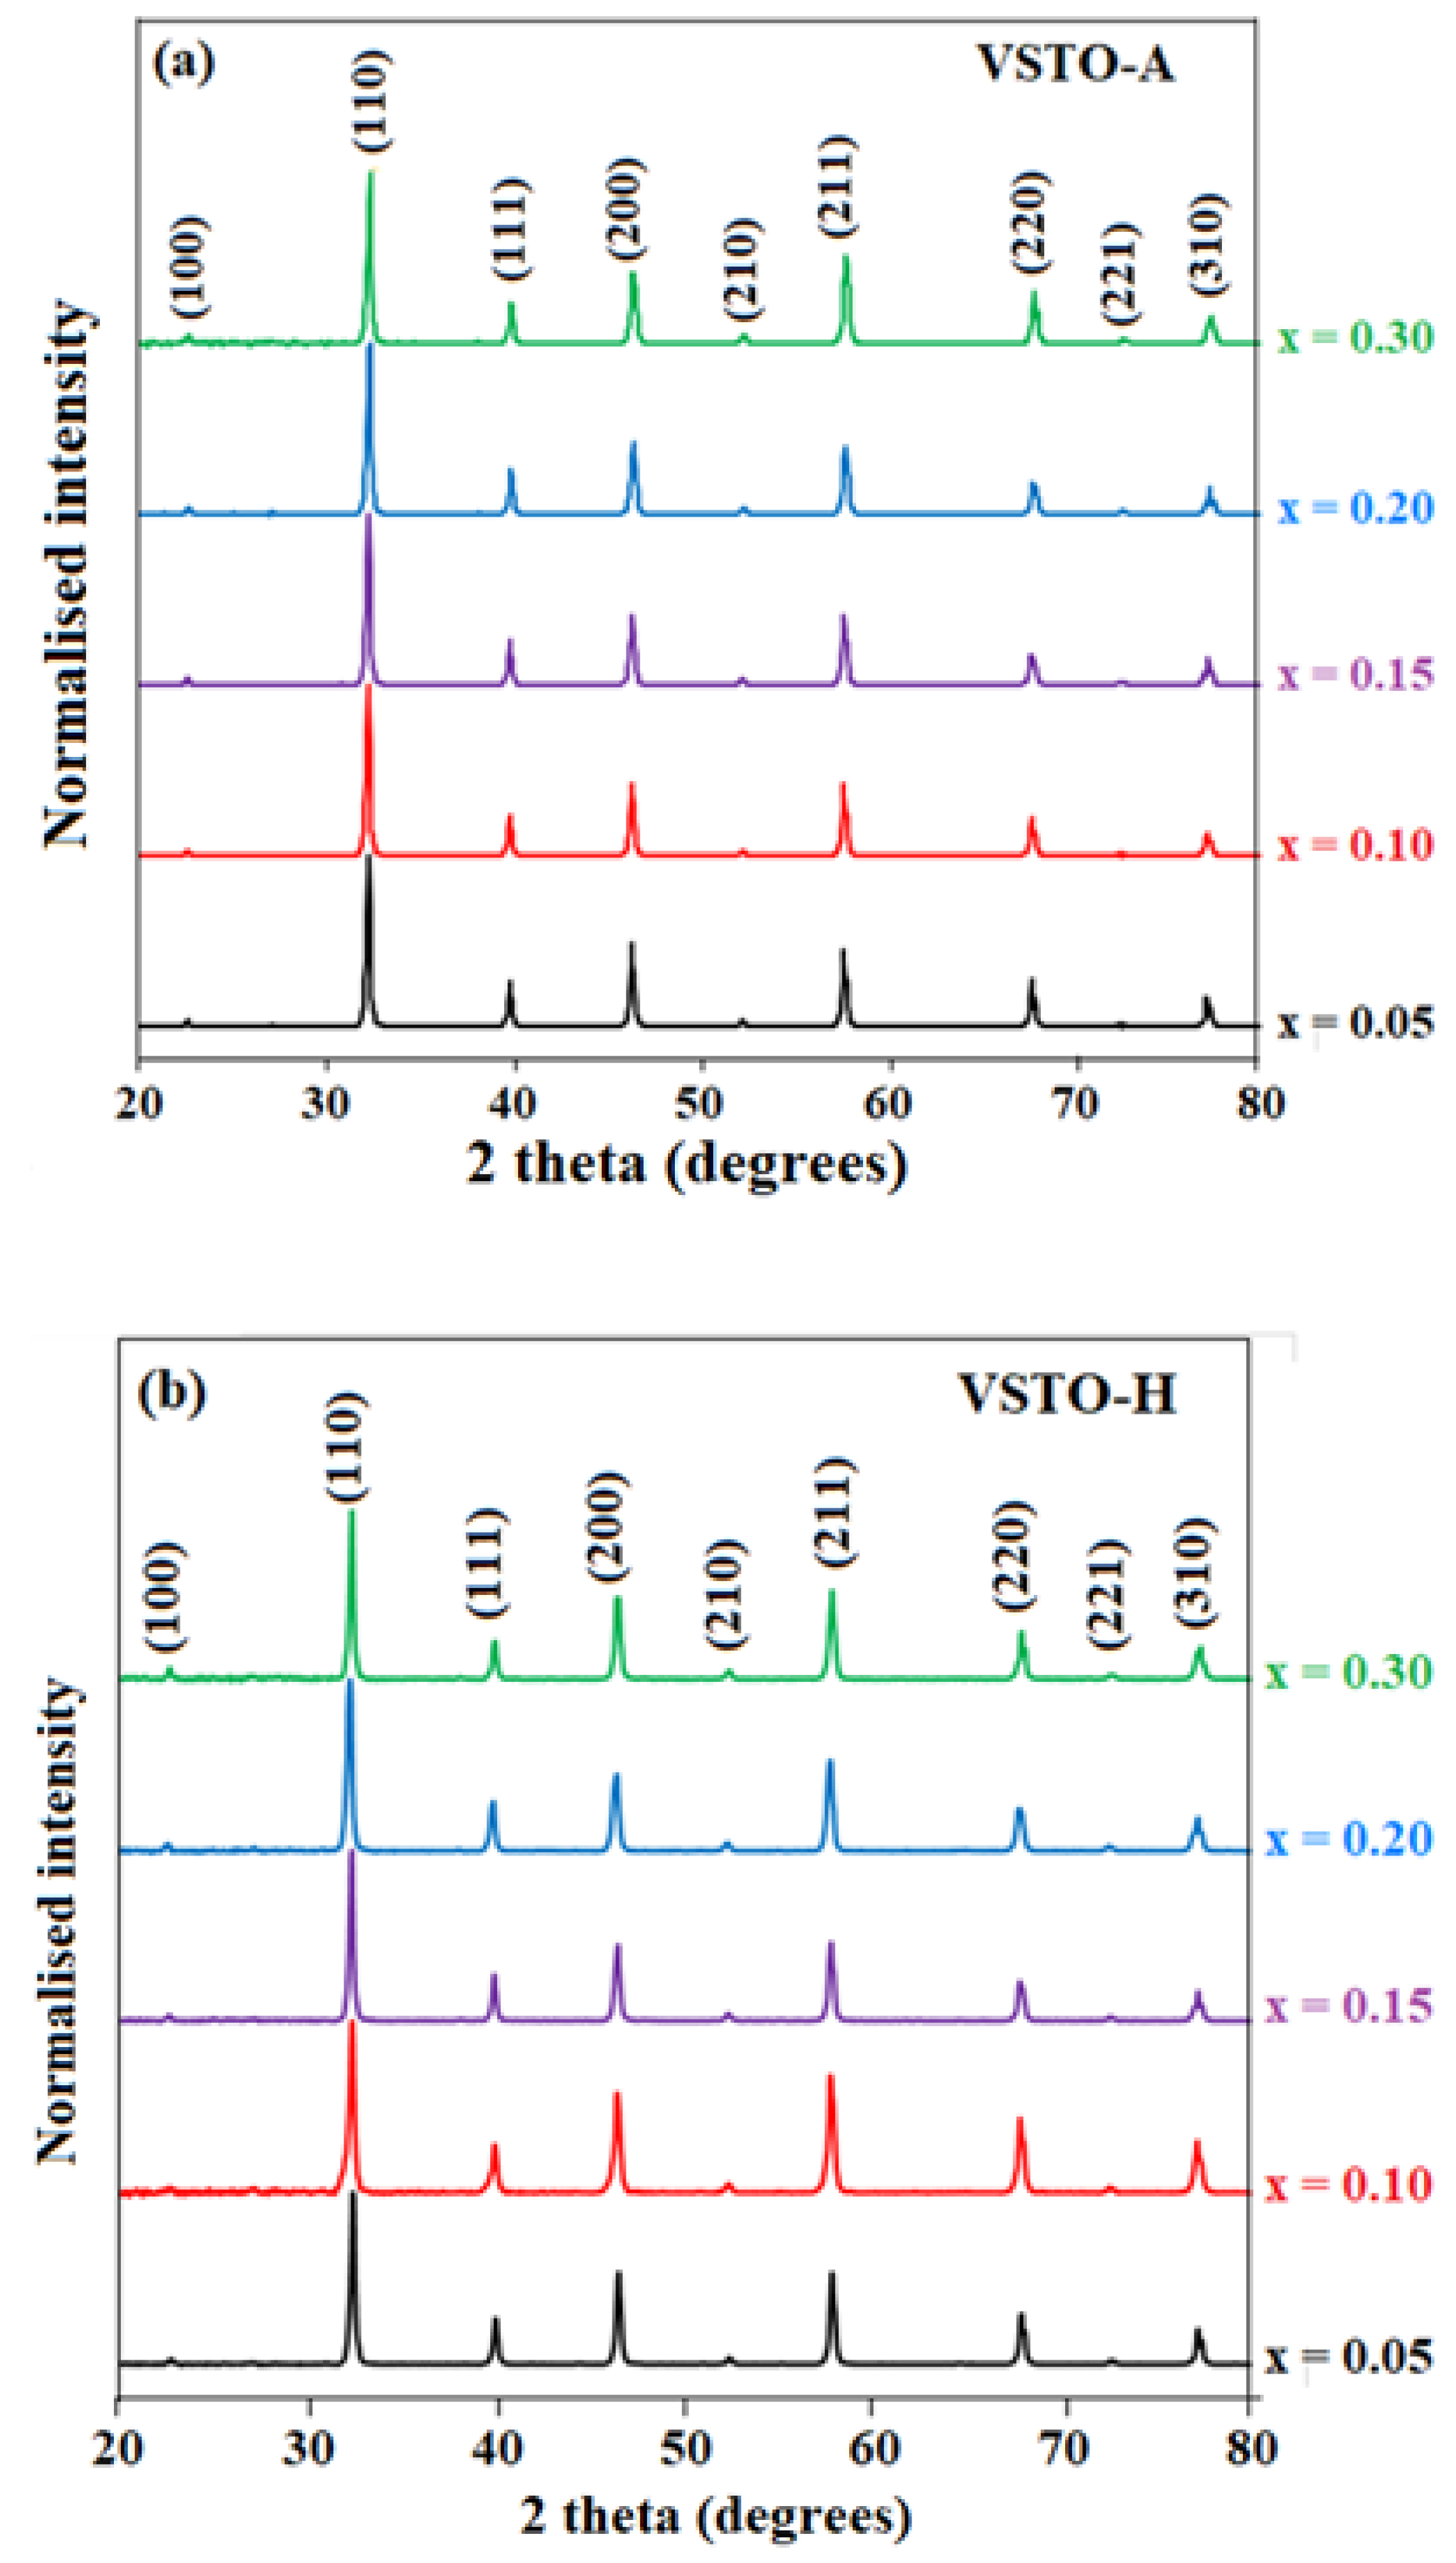
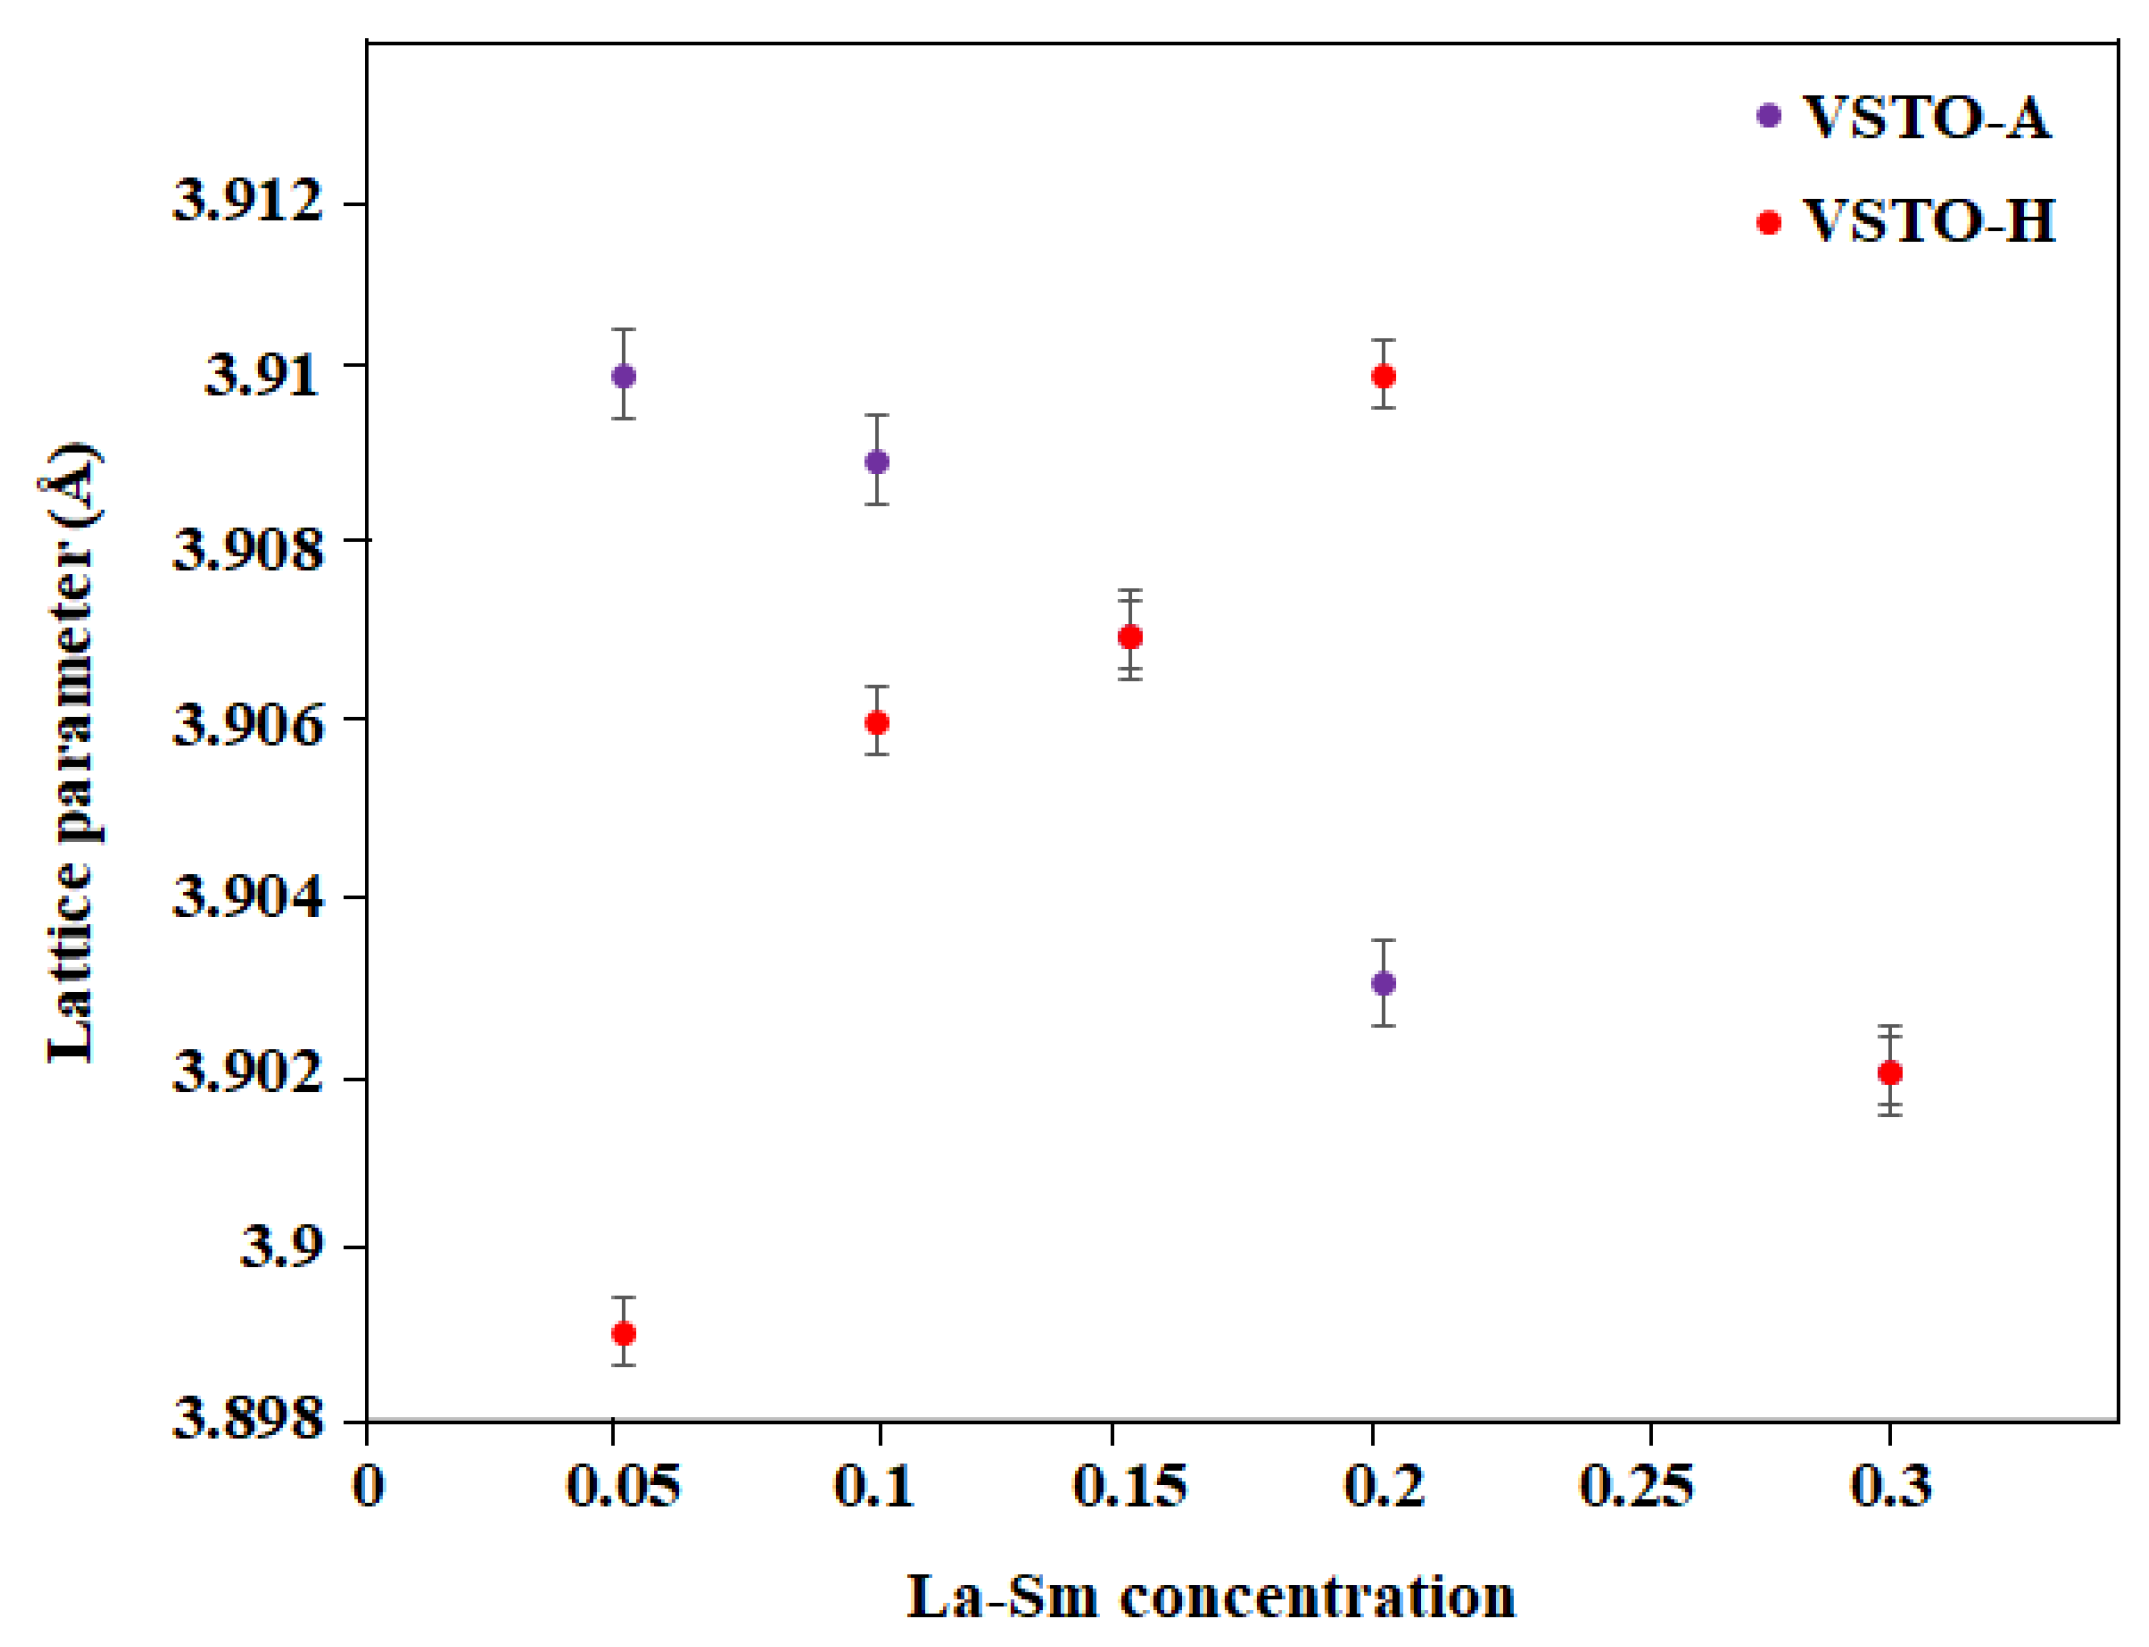
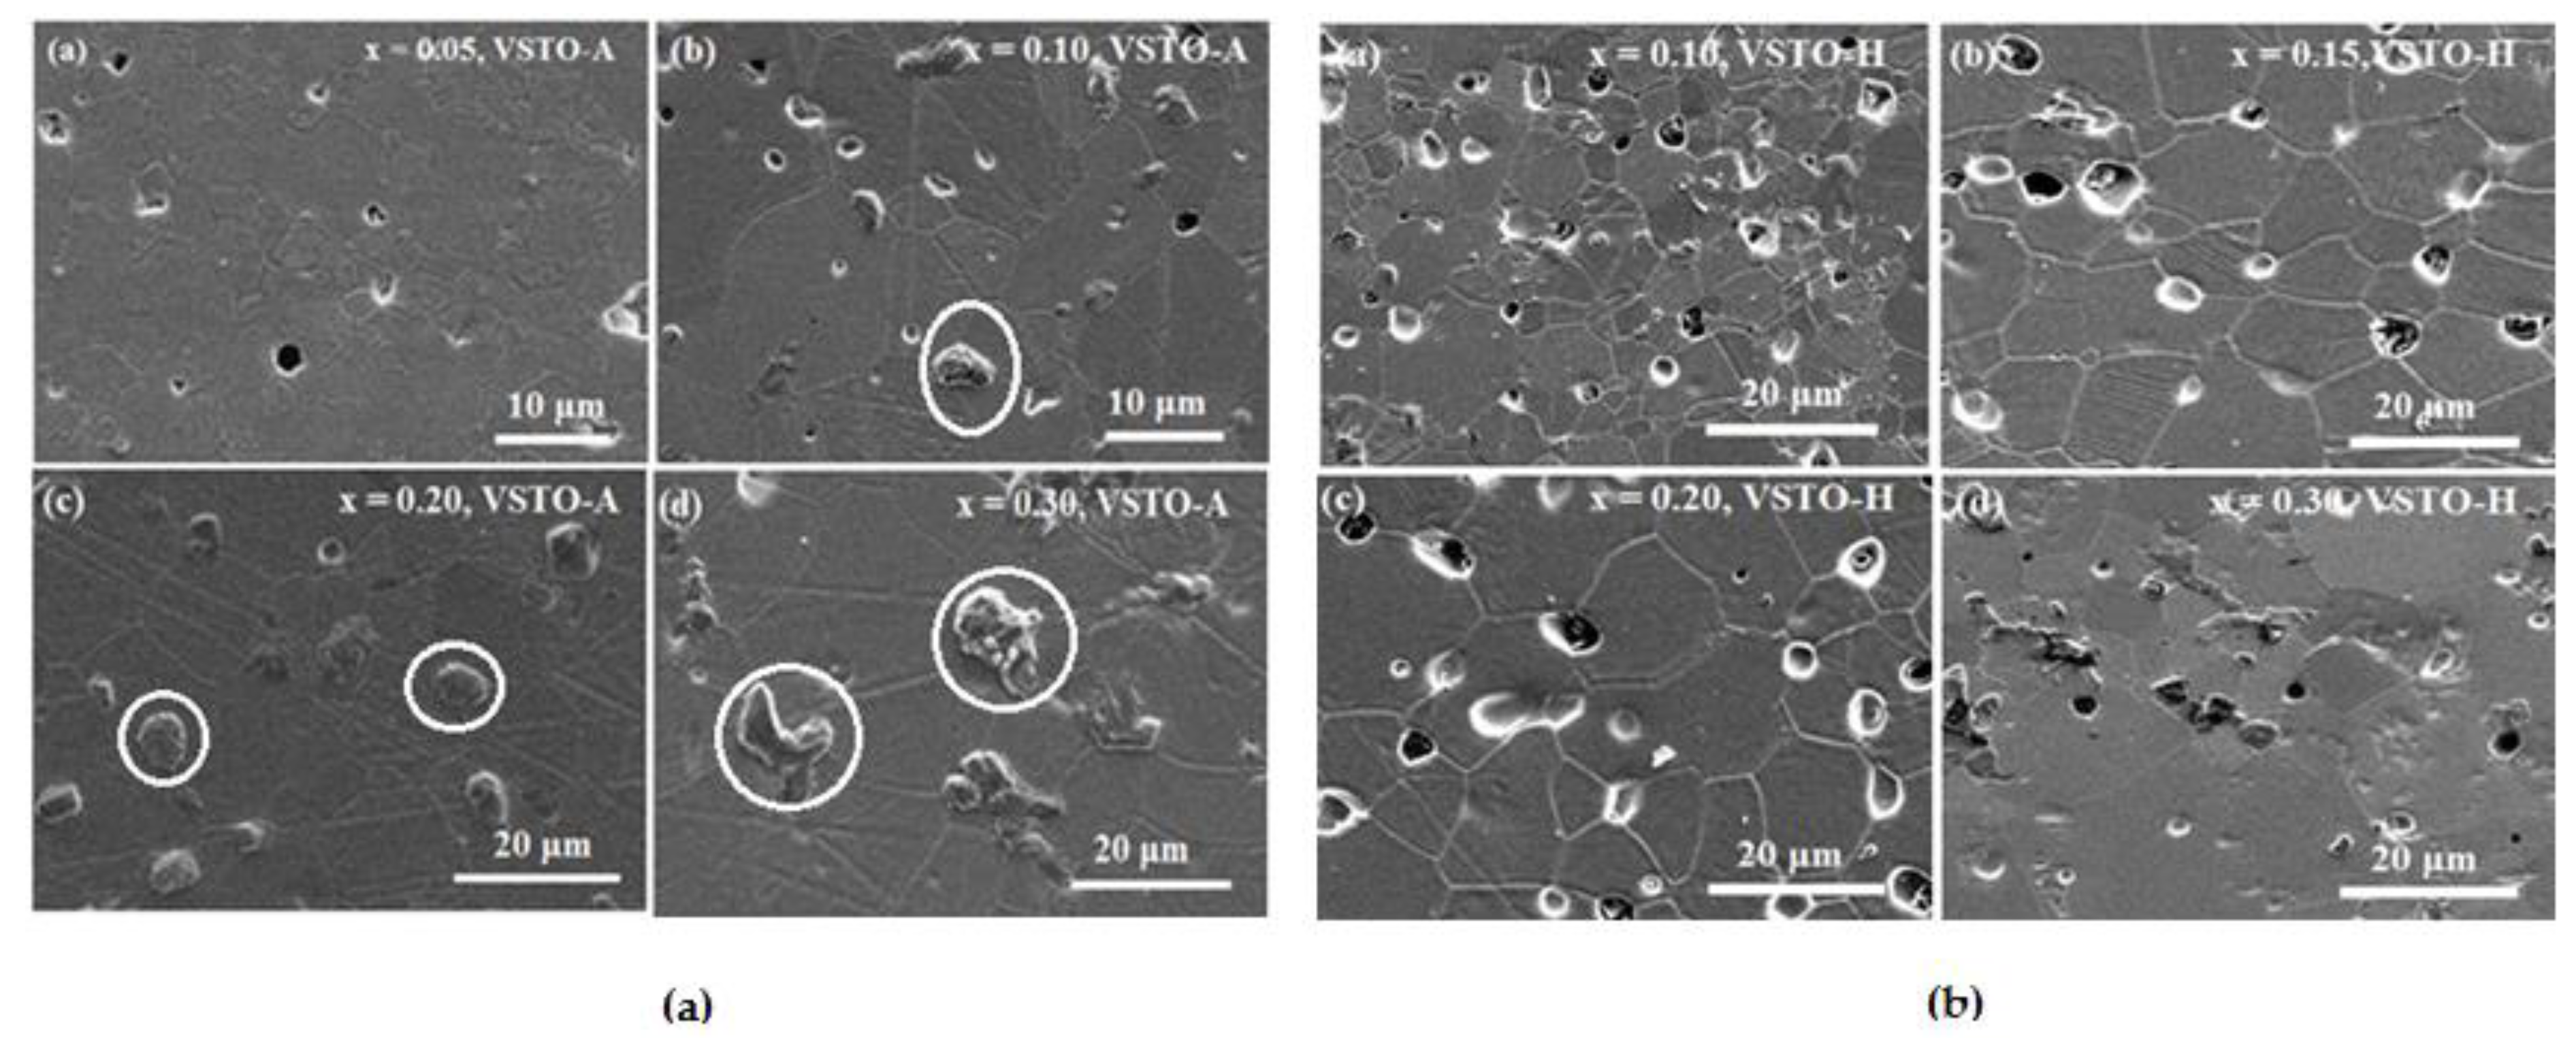
3.2. Crystal and Grain Structure

XRD patterns for the crushed VSTO-A and VSTO-H ceramics are shown in Figure 1. All samples were single phase and indexed to the SrTiO3 cubic perovskite structure with space group Pm-3m (PDF# 04-002-6890). The calculated lattice parameters and relative densities are shown in Table 2. The dopant (La + Sm) concentration dependence of the lattice parameters of VSTO-A and VSTO-H ceramics is presented in Figure 2. The density of all ceramics was measured by the Archimedes’ method, and all samples have a relative density of ≥96% (Table 2).
The lattice parameters of VSTO-A ceramics decrease with increasing La + Sm concentrations. The lattice parameters of VSTO-A ceramics contract from 3.910 Å for x = 0.05 to a minimum value of 3.902 Å for x = 0.30, as shown in Figure 2. The shrinkage in lattice parameter is attributed to the smaller ionic radii of La3+ and Sm3+ (La3+ = 1. 36 Å; Sm3+ = 1.24 Å in Coordination Number, CN 12) compared to that of Sr2+ (1.44 Å in CN 12) [21,25,26]. In contrast, the lattice parameters of VSTO-H ceramics for x = 0.05 to 0.20 increase with increasing La + Sm doping concentration, from 3.899 to 3.910 Å, before decreasing to 3.902 Å for x = 0.30. The lattice parameter increase may be due to a decrease in Coulombic Force in the lattice by the formation of oxygen vacancies accompanied by partial reduction of Ti4+ ions (0.605 Å for CN = 6) to the larger ionic radius Ti3+ ion (0.67 Å for CN = 6) [27]. The decrease in lattice parameter at high doping level (x = 0.30) may relate to exceeding the solid solution limit. However, due to the low volume fraction of secondary phase, which is difficult to detect by XRD, the results are inconclusive.
Scanning electron microscopy (SEM) micrographs of thermal etched surfaces for VSTO-A and VSTO-H ceramics are shown in Figure 3. All images revealed homogenous and dense microstructures, which agree with the high relative density of ≥96% for the ceramics, as shown in Table 1. The average grain size of VSTO-A ceramics increased with increasing the dopant concentration from 5.1 μm for x = 0.05 to a maximum value of 15.3 μm for x = 0.30 ceramics. VSTO-H ceramics showed a similar trend to VSTO-A ceramics, but the grain sizes were smaller, especially at high x values, with x = 0.30 ceramics exhibiting a maximum size of 11.2 μm. The small average grain size exhibited by VSTO-H ceramics compared to that of VSTO-A agrees with the particle size distribution (PSD) results reported in Table 2 for powders used for VSTO-A and VSTO-H ceramics. Thus, processing in a strongly reducing atmosphere (both for calcination and sintering) of vacancy co-doped Sr1-3x/2Lax/2Smx/2TiO3-δ ceramics contributes to smaller powder particle and ceramic grain sizes. This is in agreement with a study by Srivastava et al. [28] in which La-Nb co-doped SrTiO3 ceramics sintered in air showed a grain size of ~13 μm and 7–10 μm when sintered in a reducing atmosphere. Hence, the application of highly reducing conditions (5% H2/N2) in both calcination and sintering is suggested to cause removal of a greater amount of oxygen, thereby generating a higher concentration of oxygen vacancies in the perovskite lattice. Although reduced grain size may contribute to a slight decrease in electrical conductivity, it shortens the mean free path (MFP) of the phonons, and more grain boundaries act as effective scattering centres, reducing k [29] with a consequent increase in ZT [30,31].
VSTO-A microstructures featured noticeable secondary phases (labelled with white circles), Figure 3a. The source of these features could not be ascertained but are assumed to be secondary phase(s) undetected by XRD due to their low volume fraction. The secondary phases are more noticeable in x = 0.30 and may contribute to the low k observed in x = 0.30 ceramics (VSTO-A, see later).

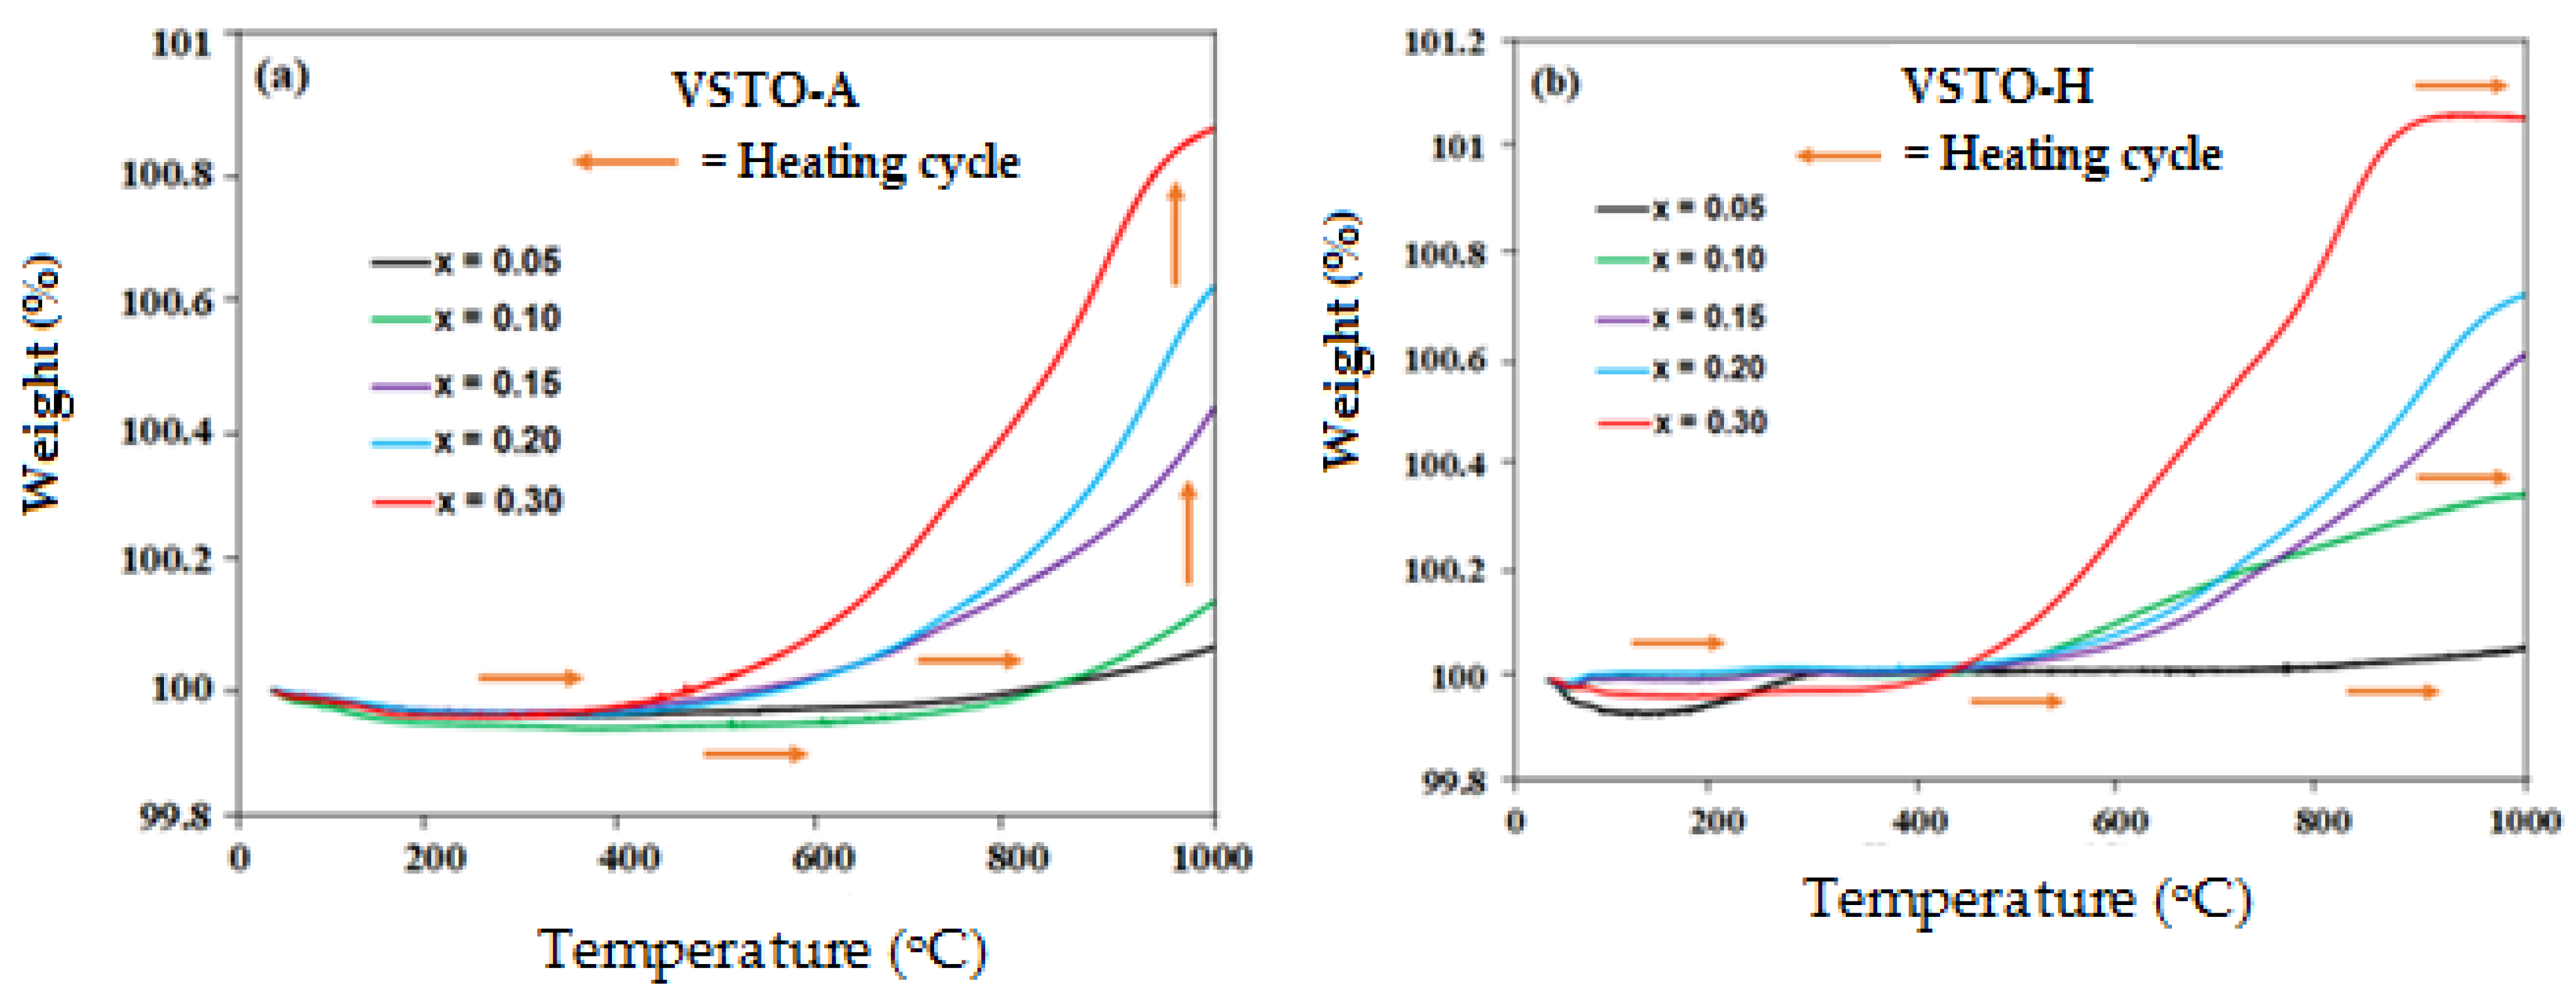
3.3. Thermogravimetric Analysis

With increasing La + Sm concentration, the onset temperature for oxidation of the ceramics decreased with x, but oxygen uptake increased (Figure 4). x = 0.05 showed little oxidation in air up to 1000 °C. The colour of VSTO-A ceramics after TGA remained black for x = 0.05 and 0.10, whereas ceramics of x = 0.15 and 0.20 and x = 0.30 were brown and white, respectively. For VSTO-H ceramics, x = 0.05 remained black; however, x = 0.10, 0.15, 0.20, and 0.30 turned white after TGA. A black appearance signifies stability of the ceramics at high temperature, whereas white indicates significant oxidation has occurred. Variation in weight (and therefore oxidation) was larger for VSTO-H ceramics than VSTO-A ceramics (Figure 4) and is consistent with a higher level of reduction in VSTO-H due to the processing conditions. All ceramics (VSTO-A and VSTO-H) sintered in a reducing atmosphere were stable in air and resistant to oxidation until ~400 °C.

3.4. Thermoelectric Properties

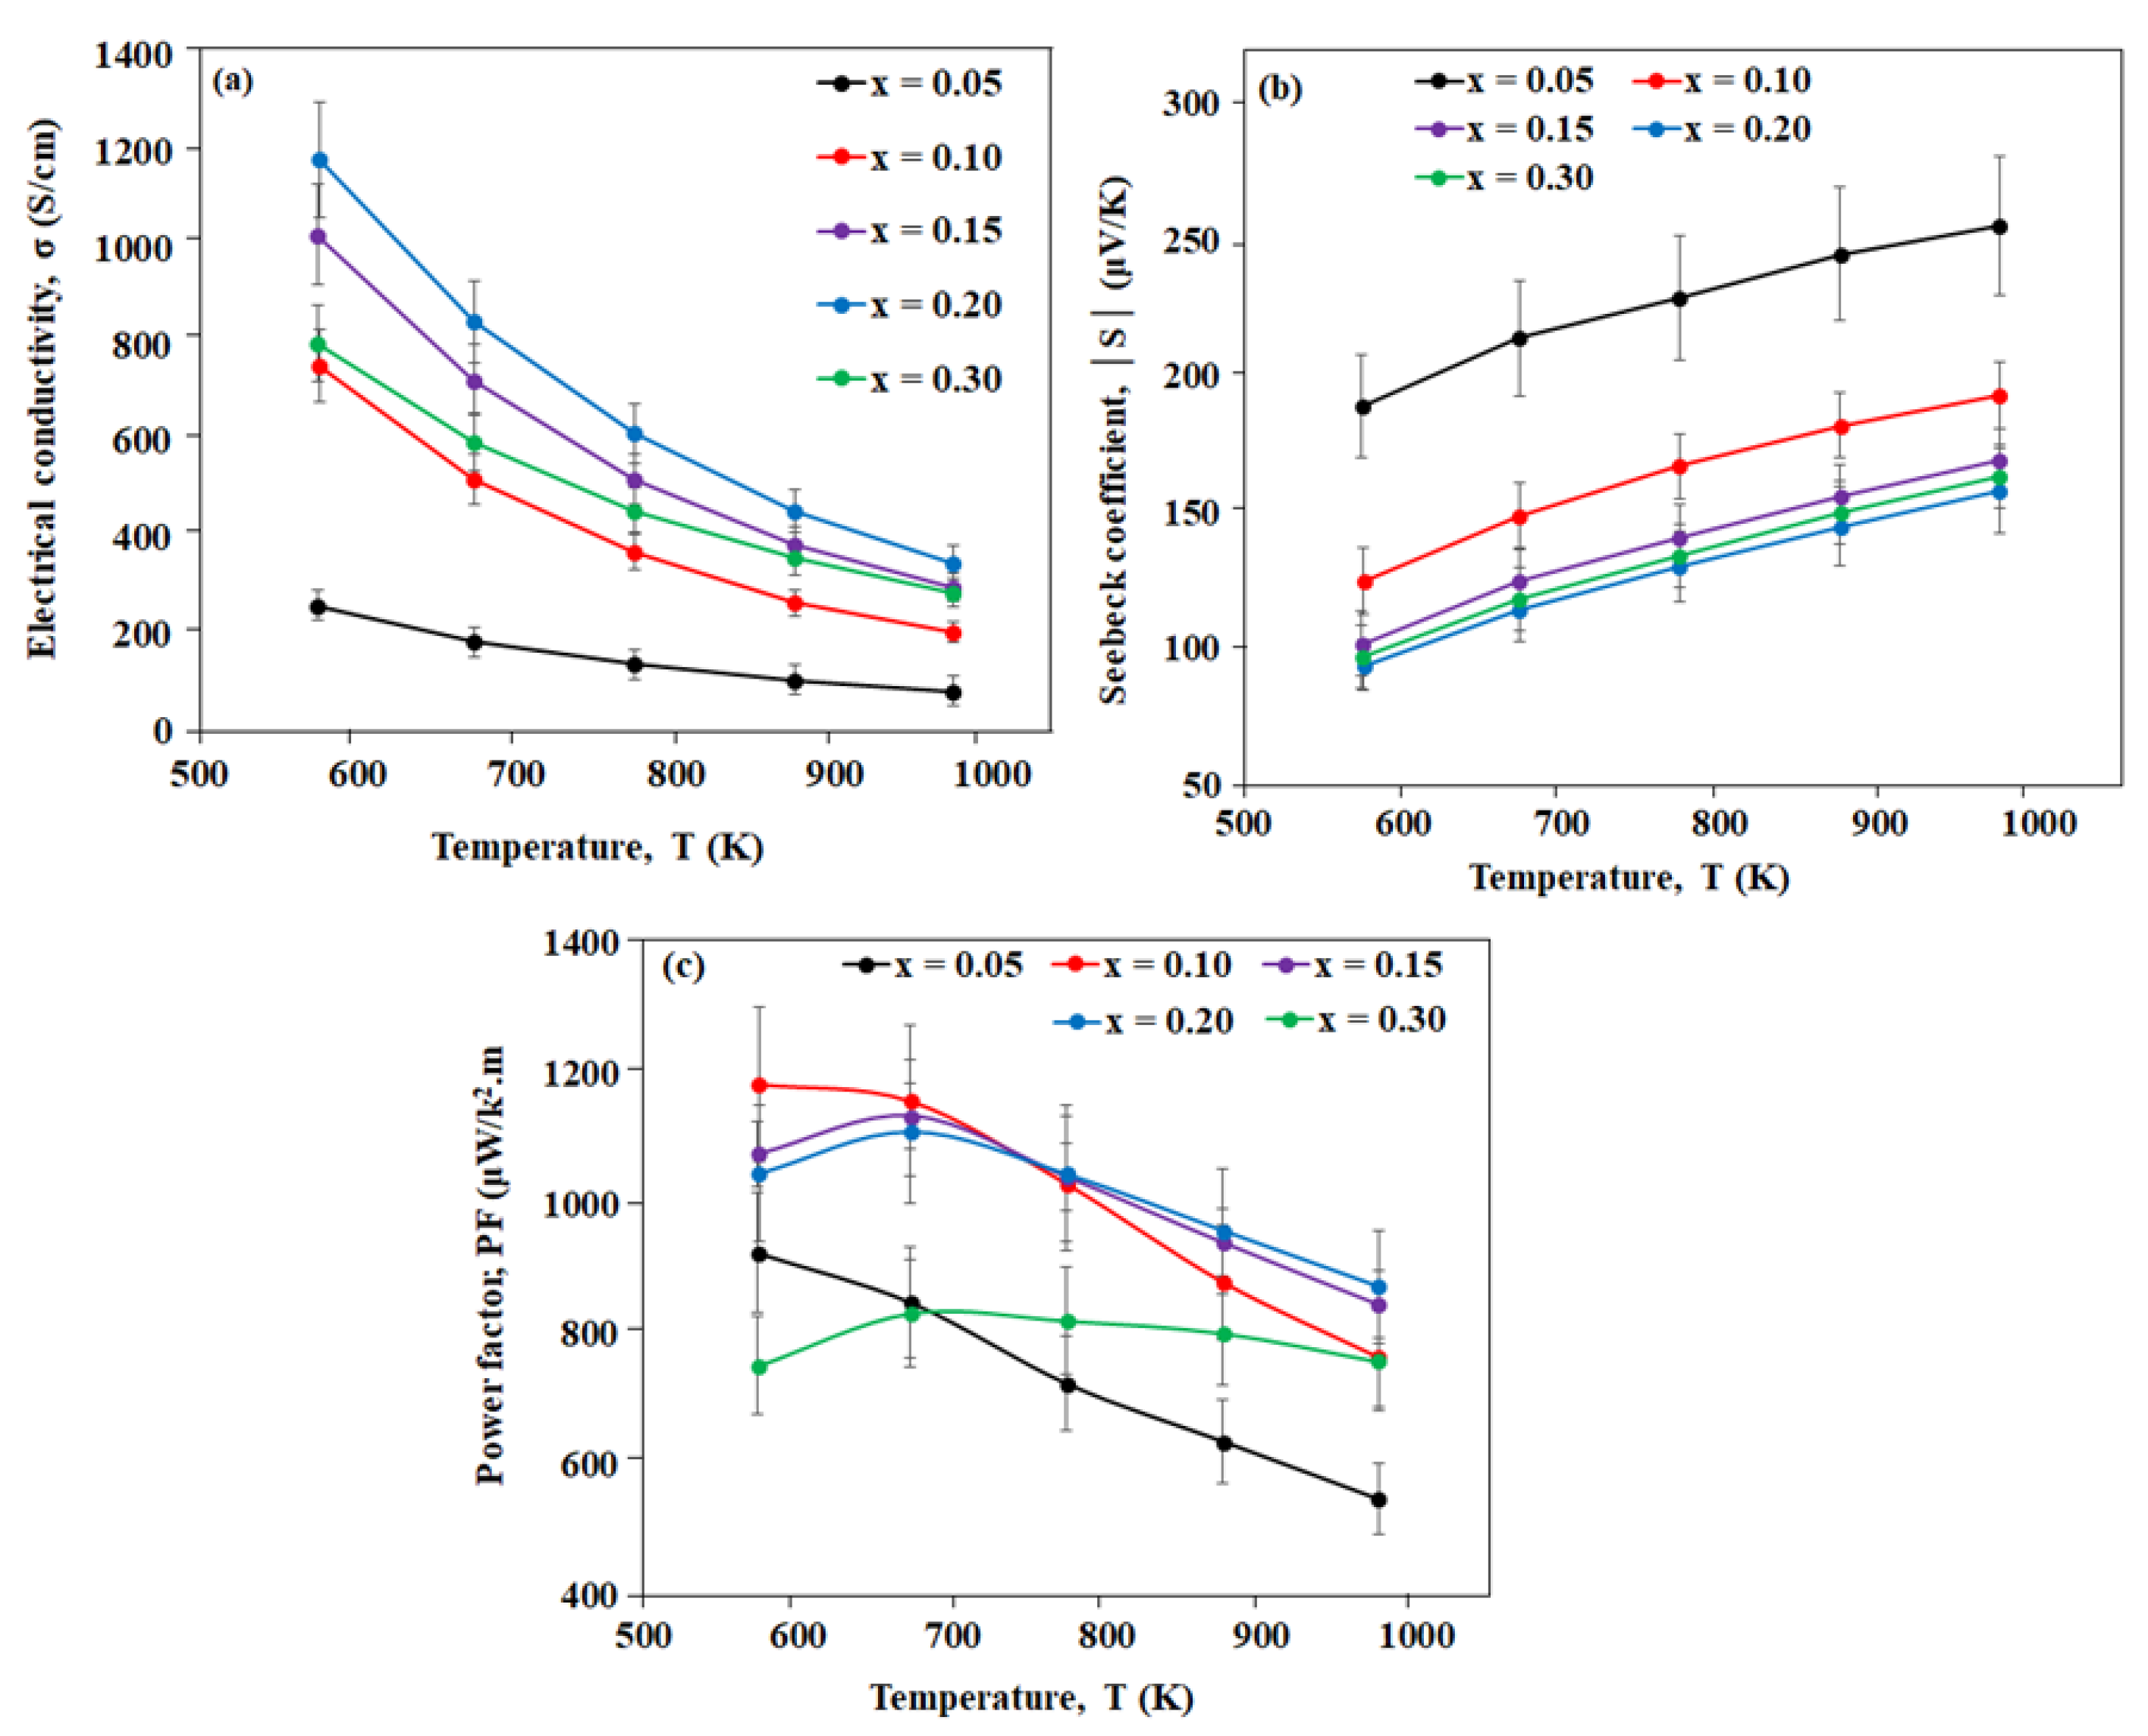
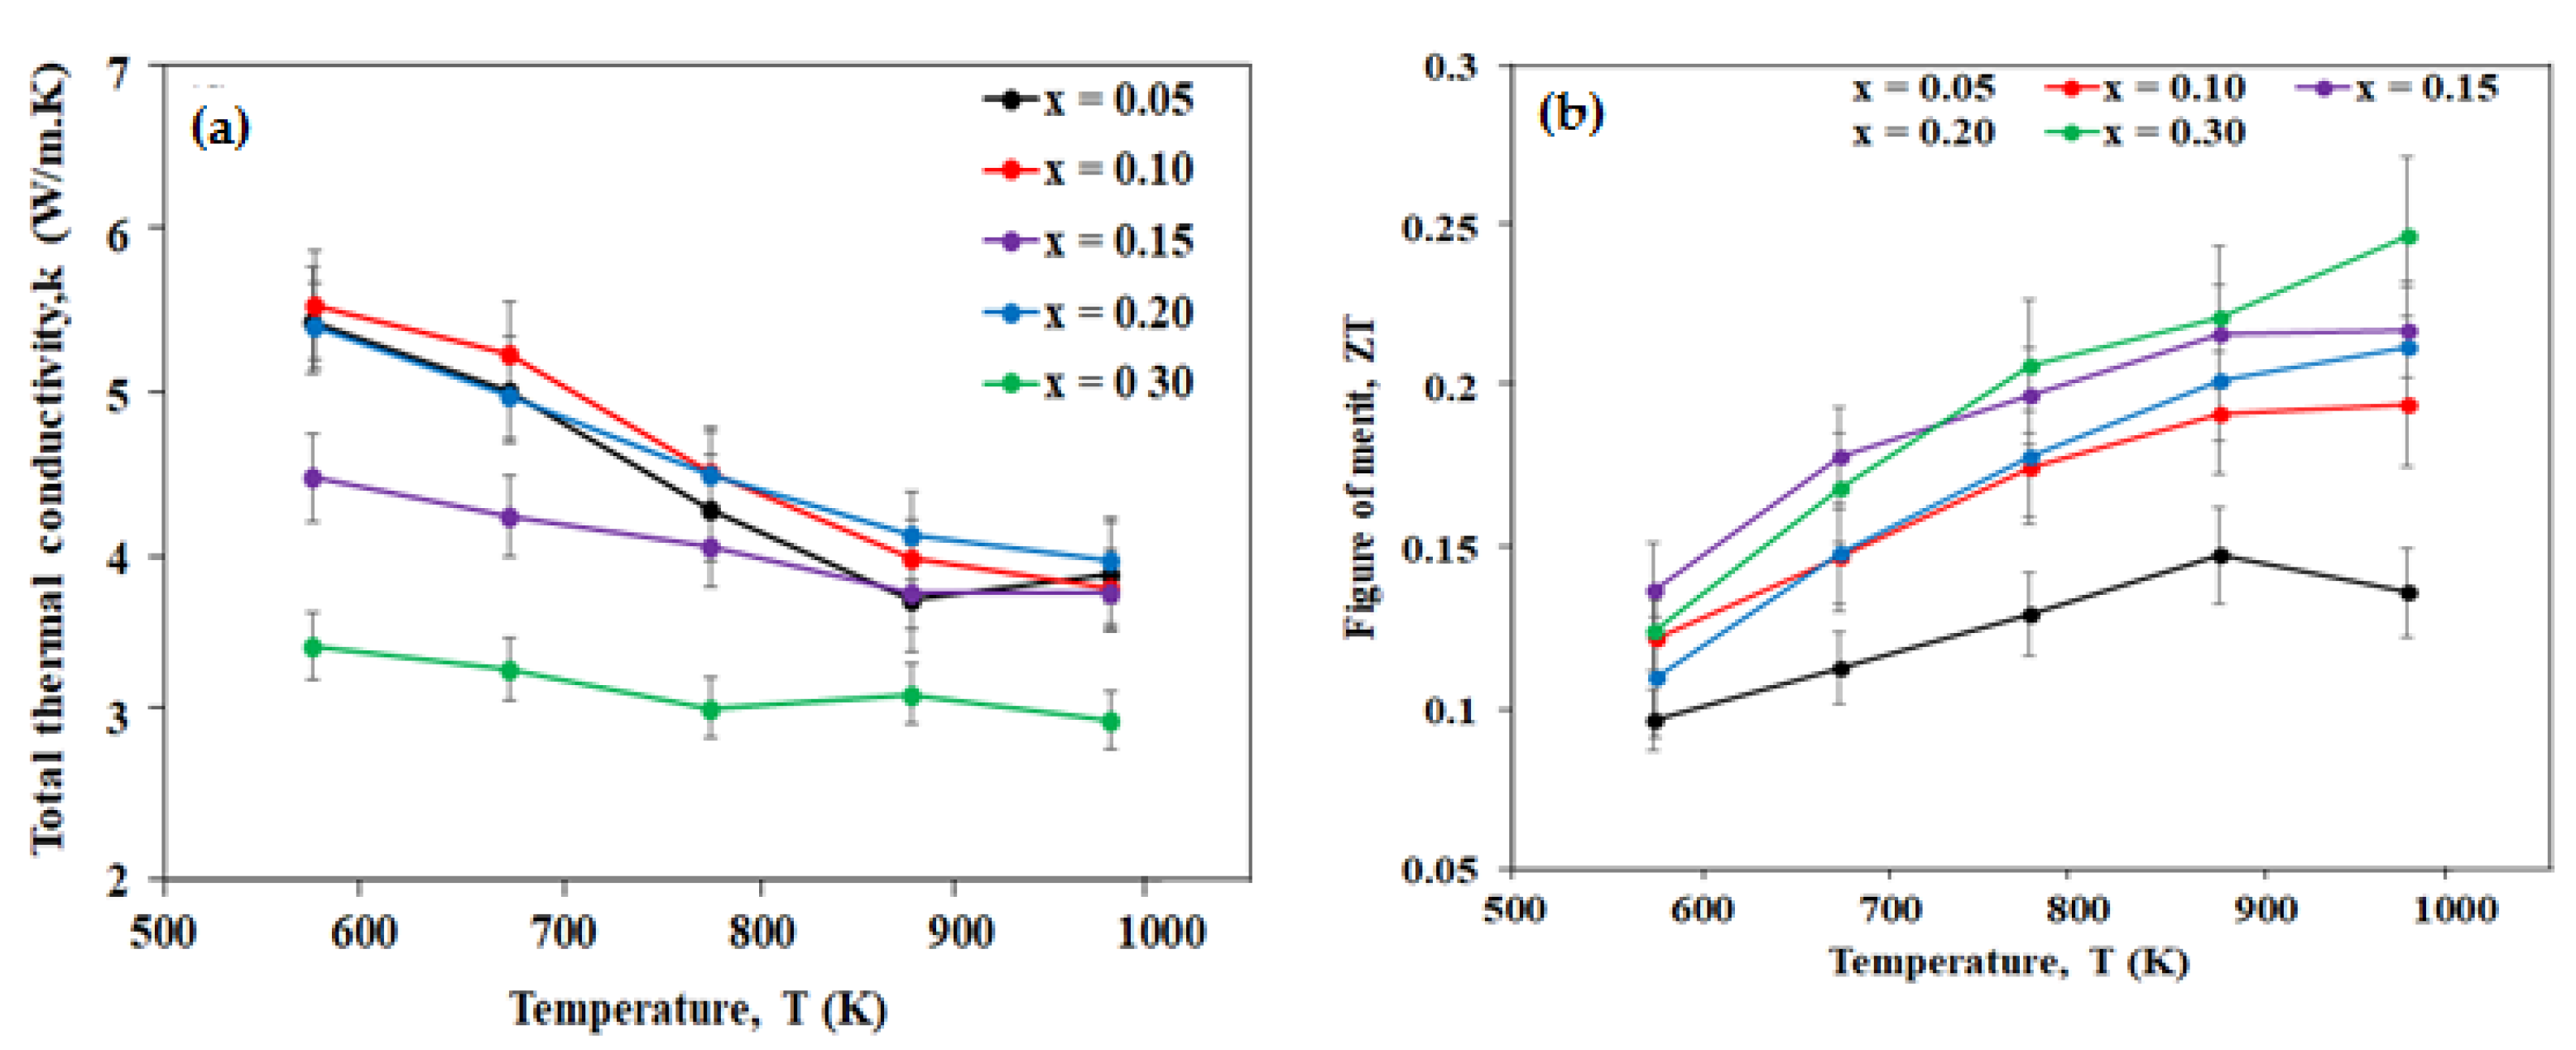
3.4.1. VSTO-A Ceramics

The temperature dependence of the electrical conductivity, σ, for VSTO-A ceramics is shown in Figure 5a. σ of all VSTO-A ceramics decreases with increasing temperature over the measured temperature range, which confirms metallic behaviour. σ for x = 0.05, 0.10, 0.15, and 0.20 ceramics increases with increasing La + Sm concentration, showing the dependence of σ on carrier concentration and mobility [32]. At x = 0.30, the electrical conductivity decreased. This drop maybe related to secondary features observed in the SEM images and associated with the solid solution limit being exceeded or possibly a structural phase transition as a result of rotation of O-octahedra observed in RE-doped SrTiO3 [21,33]. The highest σ obtained was 1184 S/cm at 573 K for x = 0.20. VSTO-A ceramics of higher concentrations (x ≥ 0.15) showed enhanced σ when compared to that of Sr0.9Nd0.1TiO3 with B2O3 and ZrO2 additions [34] and La-Nb co-doped SrTiO3 ceramics [13] in the same temperature range (573–973 K). The σ results show that A-site vacancies have a greater effect on conductivity than electronic compensation in La and Sm co-doped SrTiO3max = 942 S/cm at 573 K for x = 0.15) [35]. This may relate to greater oxide ion diffusion rates through the vacated A-site, which permits a greater volume of reduced material (and therefore higher Ti3+ content) throughout the ceramic.
Seebeck coefficients of all VSTO-A ceramics are negative, indicating n-type behaviour, and confirm the electrons associated with mixed Ti3+(d1)-Ti4+(d0) are the dominant charge carriers. The absolute coefficient, |S|, for all compositions (Figure 5b) increases linearly with increasing temperature, showing metallic-type behaviour [25,26]. |S| values decrease with increasing La + Sm concentration, which is consistent with an increase in σ, as shown in Figure 5a.|S| of all samples at high temperature (973 K) fall within the range of 158–255 μV/K, and these values exceed the minimum values of Seebeck coefficients (150–250 μV/K) suggested for a good TE material [36].
The temperature dependence of the power factor, PF, for the VSTO-A ceramics is presented in Figure 5c. x ≥ 0.15 ceramics displayed a peak in behaviour between 573 and 673 K (Figure 5c), suggesting a semiconductor-like mechanism. Above 673 K, the power factors decreased with increasing temperature. For x ≤ 0.10, the PF decreases over the measured temperature range, and a maximum PF value of ~1185 μW/K2 was obtained for x = 0.10 at 573 K. This high PF could be attributed to an optimised |S| (125–193 μV/K), which is higher than the |S| values of all other compositions except x = 0.05. However, at high temperatures, PF of x = 0.10 decreased, possibly due to the lower σ (Figure 5a). The PF results obtained in this study are in agreement with most results in the literature for electron La-Yb [26] and La-Dy [37] co-doped SrTiO3 ceramics but higher than the reported values for Nb-doped Sr0.95La0.05TiO3 ceramics at high temperatures (≥973 K) [38].
The temperature dependence of the total thermal conductivity (k) of VSTO-A ceramics is shown in Figure 6a. x = 0.30 ceramics exhibited the lowest k range (3.46–2.99 W/m.K with increasing temperature) over the measured temperature range, which suggests typical thermal conduction behaviour for a semiconductor [25] and control of lattice thermal conductivity kL [26]. The low k values obtained for x = 0.30 could be attributed to the high concentration of secondary phases in the microstructure, which affected the thermal transport. Usually, a reduction of k in doped SrTiO3-δ ceramics is ascribed to formation of oxygen vacancies in perovskites, preceded by sintering in a reducing atmosphere [33]. An increase in La + Sm concentration results in decreasing kL, which indicates increasing lattice defects and shortening of the mean free path (MFP) of the phonons [21]. At the maximum temperature (973 K), the electronic contribution to the total thermal conductivity was estimated at an average of 0.0024 W/m using a Lorentz number (10−8 WΩK−2) for a non-degenerated semiconductor. This result shows the reduction in k mainly originates from the lattice vibrations (phonons); hence, kL plays a dominant role in k. Thus, there is insignificant difference between the values of k and that of kL.
The thermoelectric figure of merit, ZT, of all compositions generally increases with increasing temperature over the entire measured temperature range, as shown in Figure 6b. ZT for x = 0.20–0.30 increases over the measured temperature range, whereas ZT for x ≤ 0.15 ceramics drops at 873 K. x = 0.30 ceramics recorded the highest ZT value of 0.25 at 973 K. The low k values observed for x = 0.30 ceramics result in higher ZT values, especially at high temperatures (773–973 K) despite its lower PF value.

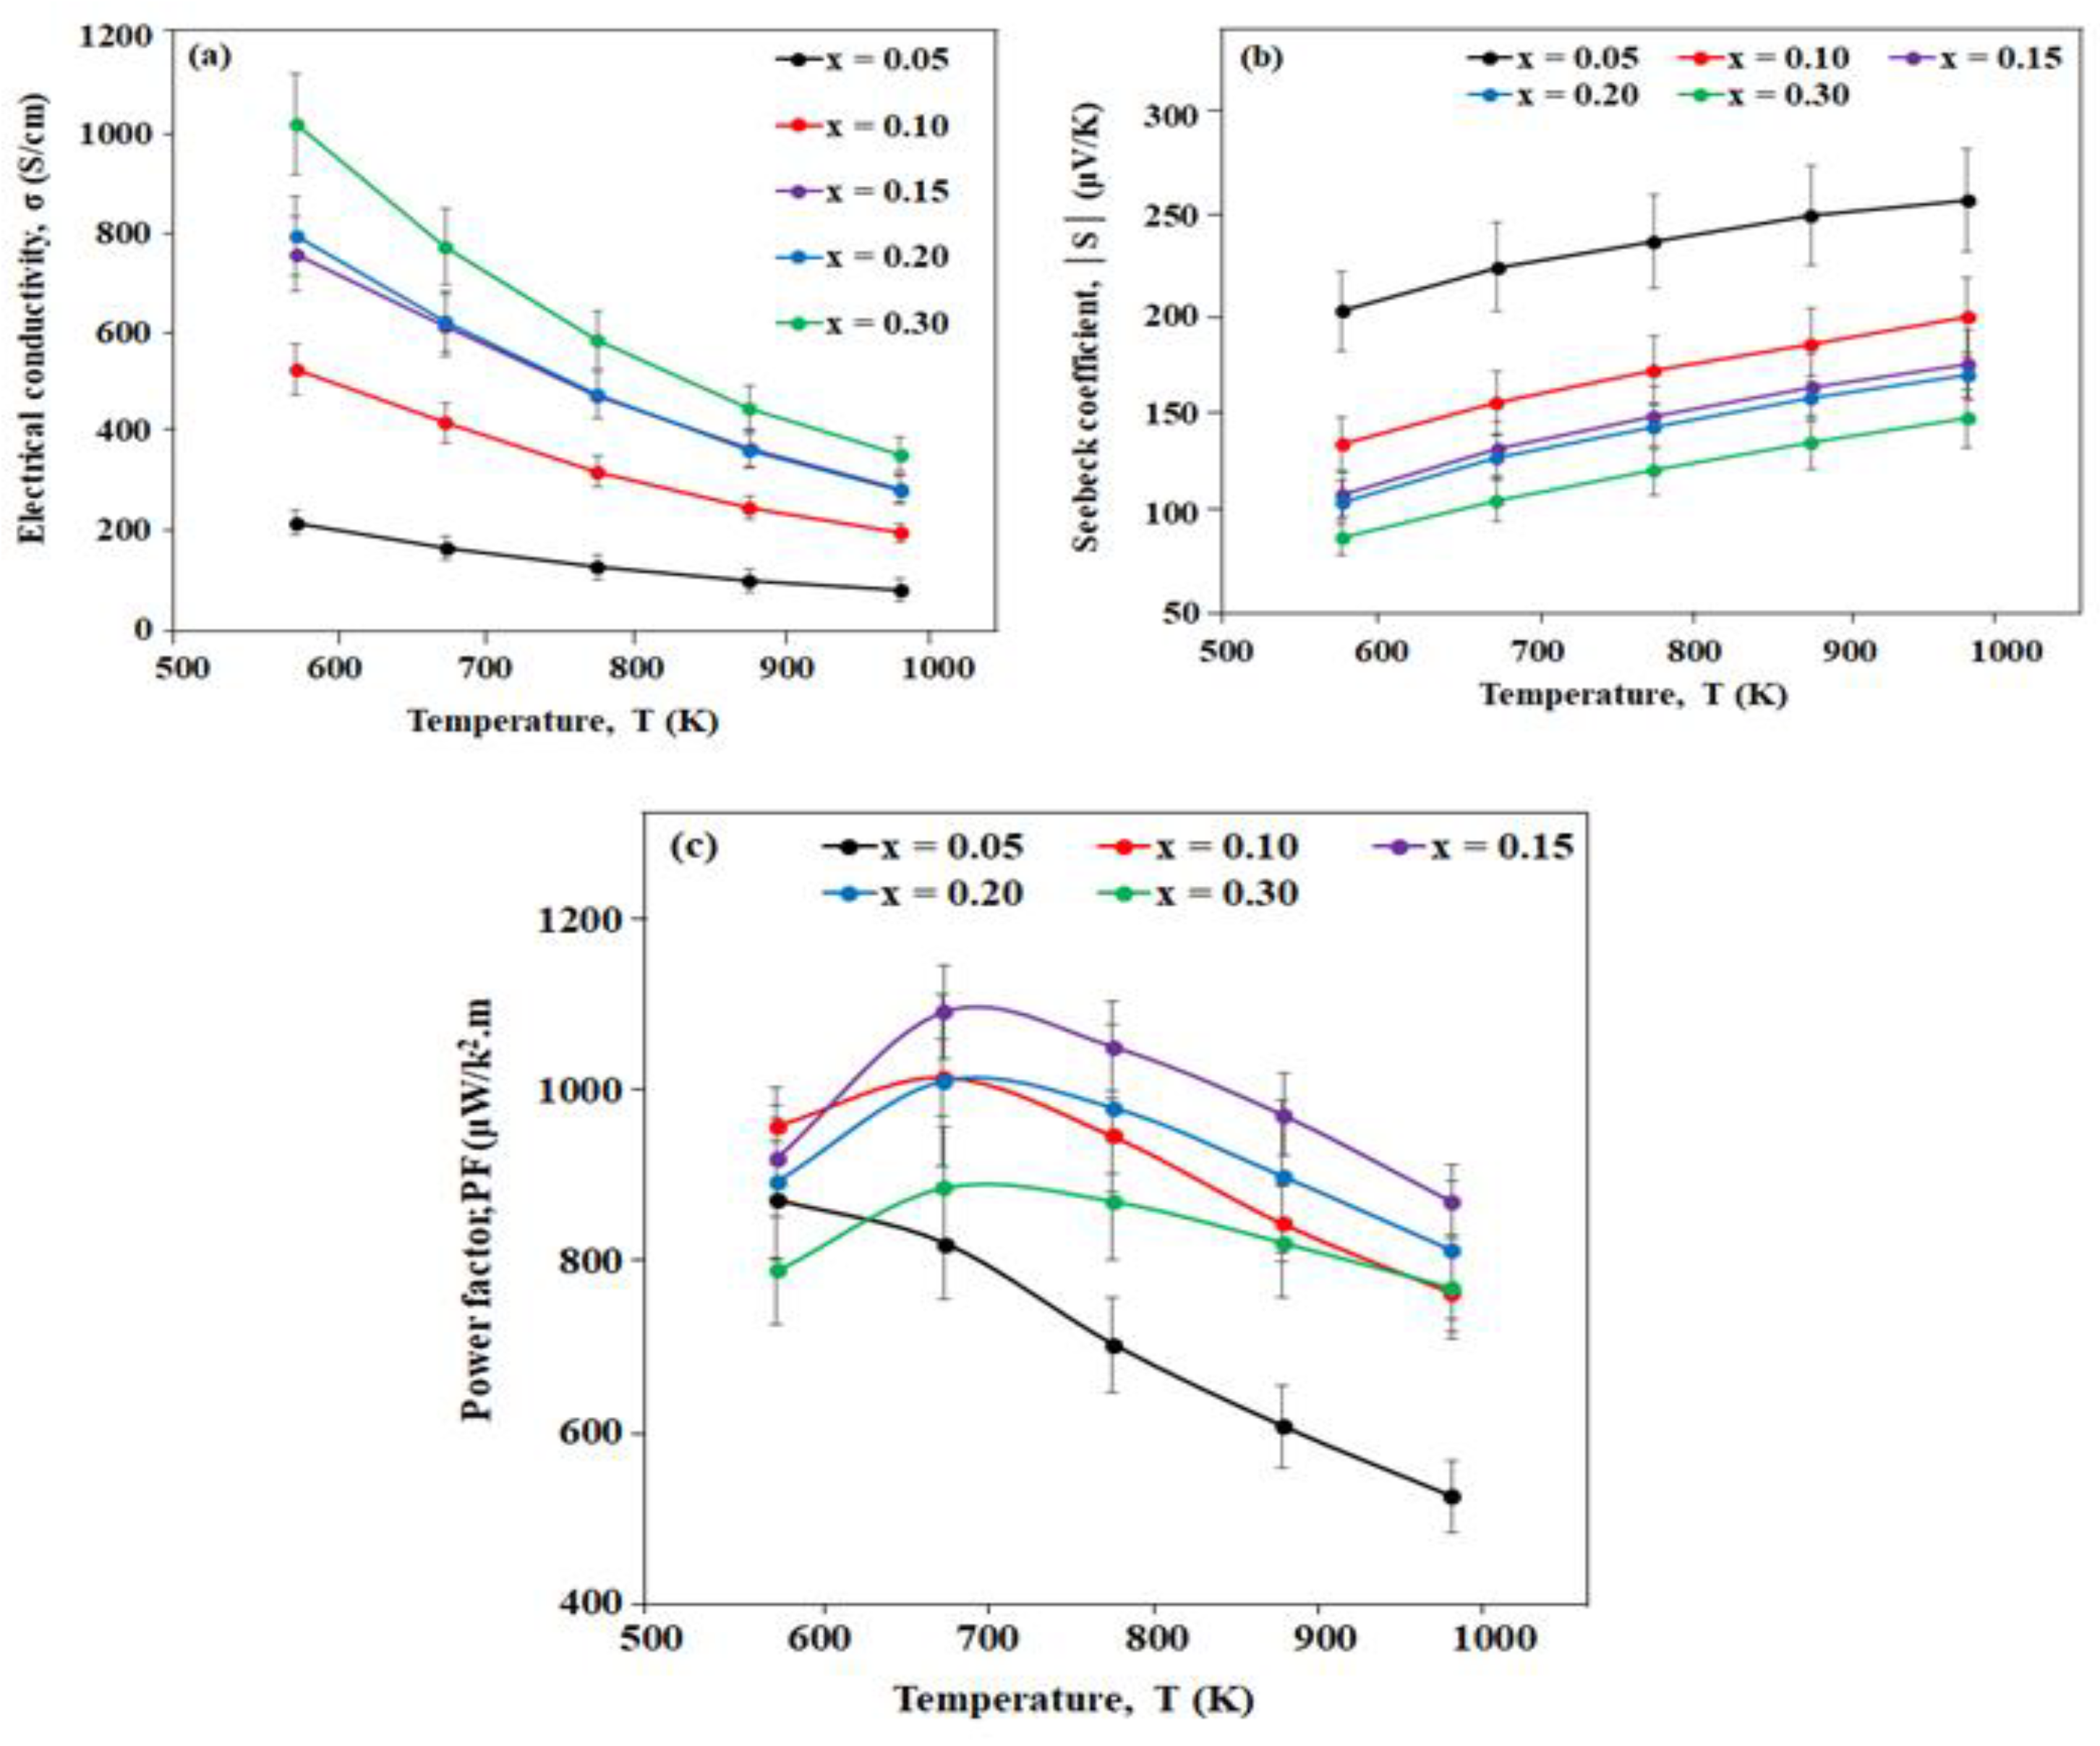
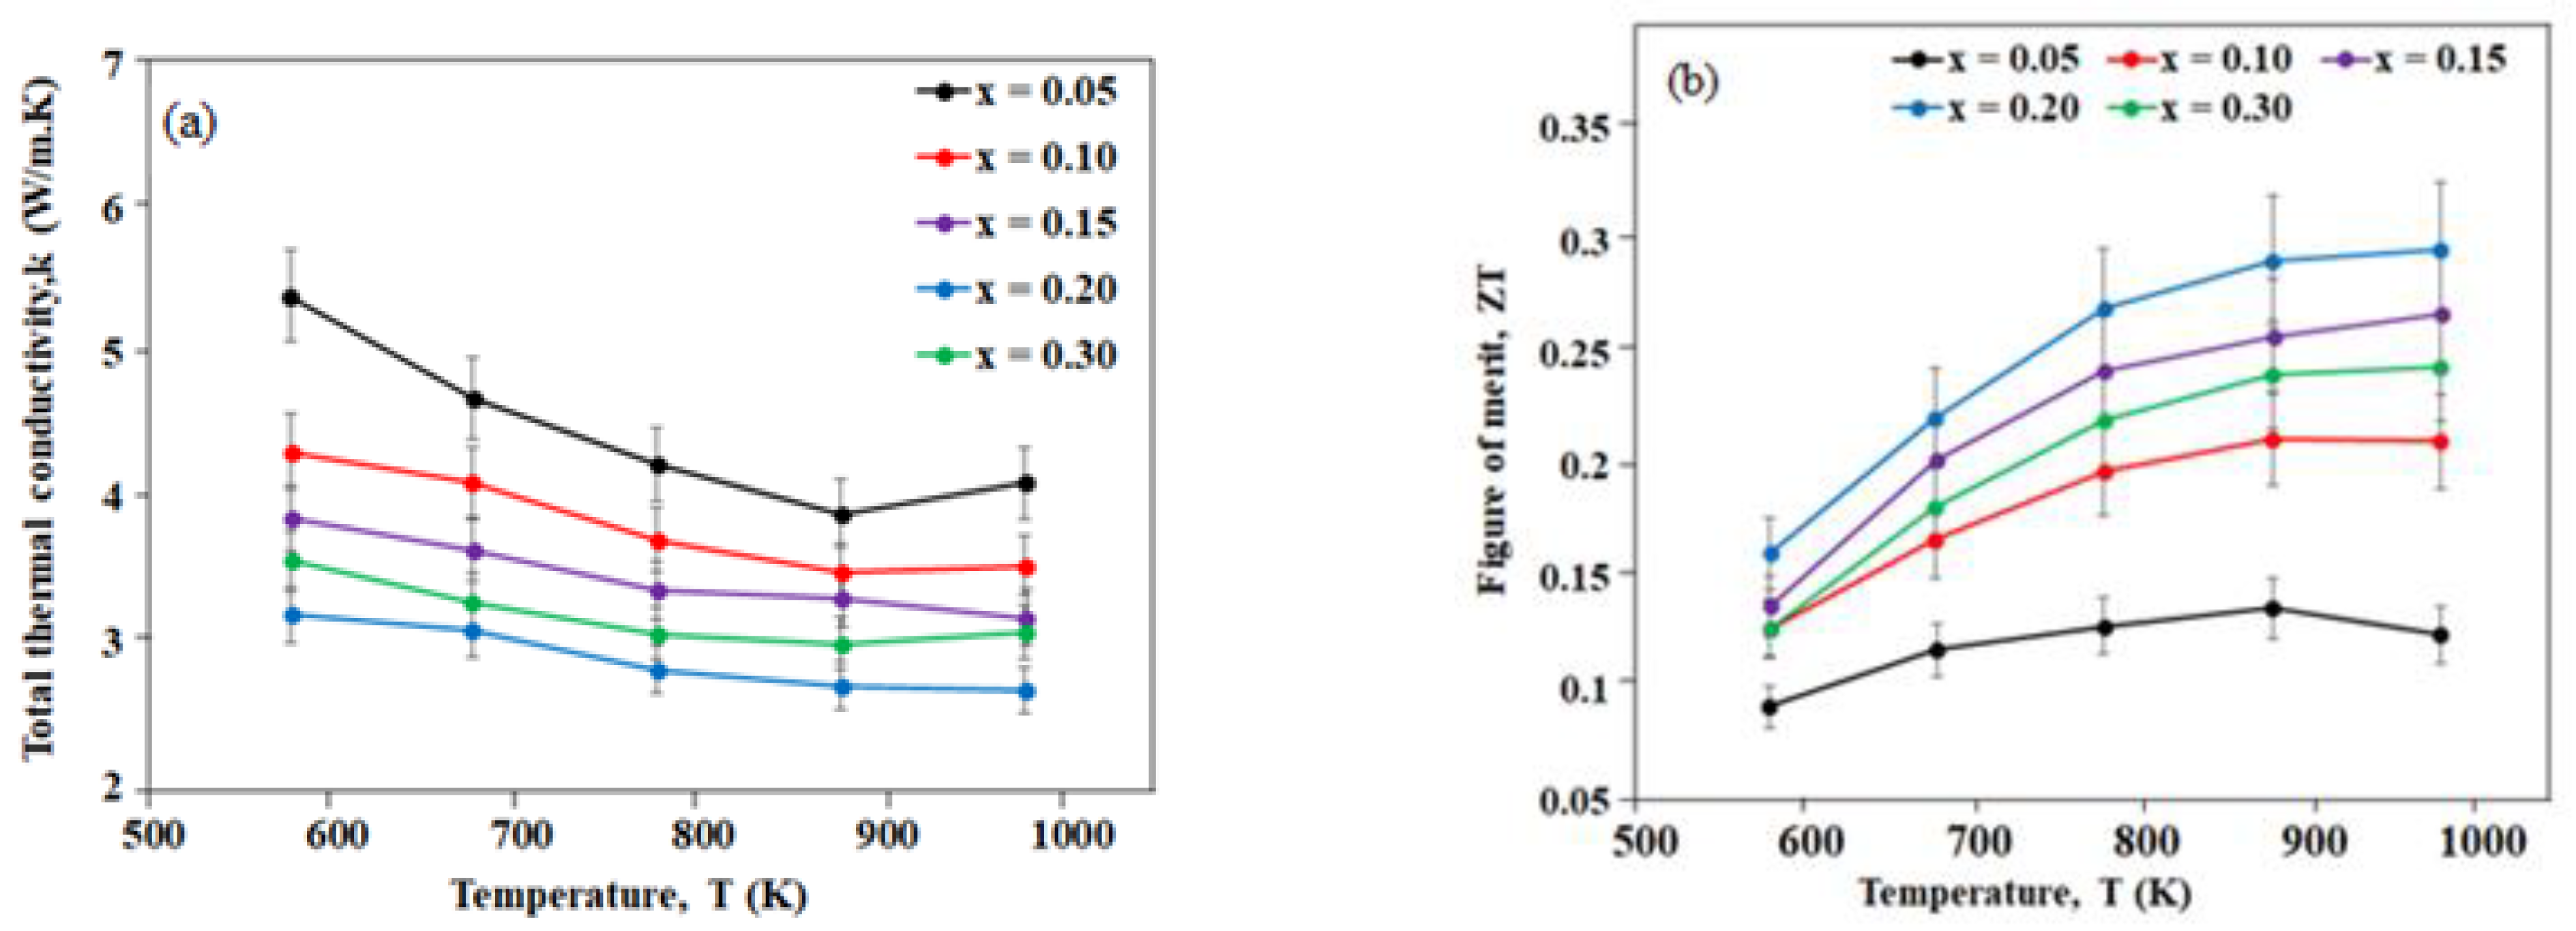
3.4.2. VSTO-H Ceramics

The temperature dependence of σ for VSTO-H ceramics is shown in Figure 7a. The decrease of σ for all samples with increasing temperature is consistent with metallic conduction. σ increases with increasing La + Sm concentration, and a maximum value of 1023 S/cm at 573 K was obtained for x = 0.30. It is noteworthy that the processing atmosphere, either in air or 5% H2/N2, has no significant effect on σ of VSTO-A and VSTO-H ceramics at higher temperatures but modifies the behaviour at lower temperatures. For example, in x = 0.15 ceramics, VSTO-A and VSTO-H showed σ values of 1029 and 758 S/cm, respectively at the lowest measured temperature (573 K). At the highest measured temperature (973 K), VSTO-A exhibited σ of 298 S/cm, and VSTO-H showed σ = 284 S/cm. This strongly suggests the bulk conductivity is the same for a given dopant level irrespective of processing atmosphere, whereas grain boundaries or electrical heterogeneities are responsible for the variations in lower temperature conductivity. Generally, the processing atmosphere showed little or no disparity on the electrical transport properties (σ, S, PF) of VSTO-A or VSTO-H ceramics. For example, x = 0.15 at 973 K showed PF values of 873 and 870 μW/K2.m for VSTO-A and VSTO-H ceramics, respectively (Figure 5c and Figure 7c).
The effect of processing atmosphere was clearly observed in the thermal transport properties of the ceramics. The lowest k (2.67 W/m.K) at 973 K was observed in x = 0.20 (Figure 8a), which is ~11% lower than the lowest k (2.99 W/m.K at 973 K) obtained in VSTO-A ceramics. The k value range (3.25–2.67 W/m.K) observed in VSTO-H ceramics is comparable to the lowest k values of most doped SrTiO3-δ ceramics prepared via conventional methods [7,33]. This significant reduction in k as shown in VSTO-H compositions confirms that strongly reducing conditions are efficient in achieving low thermal conductivity in SSR-synthesized Sr1-3x/2Lax/2Smx/2TiO3-δ ceramics.
The overall effect of the electrical and thermal transport properties on the thermoelectric performance of VSTO-H ceramics is shown by the temperature dependence of ZT (Figure 8b). ZT of x ≥ 0.15 ceramics increases with increasing dopant concentration. In contrast, ZT of x ≤ 0.10 ceramics increases within the temperature range 573–873 K but decreases at high temperatures (973 K). x = 0.20 possesses the highest ZT over the entire measured temperature range, reaching a maximum value of 0.30 at 973 K.

4. Conclusions

A-site-deficient Sr1-3x/2Lax/2Smx/2TiO3-δ (x = 0.05, 0.10, 0.15, 0.20, and 0.30) ceramics were successfully prepared by the solid-state reaction method. A portion were calcined in air (VSTO-A), whilst the remainder was calcined in 5% H2/N2 (VSTO-H), and both were sintered in 5% H2/N2 flowing gas at 1773 K for 6 h. Generally, Sr vacancies, La + Sm co-doping, and a highly reducing atmosphere decreased the thermal conductivity, with Sr1-3x/2Lax/2Smx/2TiO3-δ VSTO-H achieving 3.25–2.67 W/m.K over the entire measured temperature range. All ceramics (VSTO-A and VSTO-H) were resistant to oxidation in air up to ~400 °C.
In VSTO-A ceramics, x = 0.30 achieved a maximum ZT value of 0.25 at 973 K, and an improved ZT = 0.30 at 973 K was obtained for x = 0.20 VSTO-H ceramics. The higher ZT value achieved in VSTO-H ceramics reflects a balance between reduced k and good metallic σ behaviour without compromising the power factor. The application of a strongly reducing atmosphere in the processing of the ceramics (both in calcination and sintering, as seen for VSTO-H ceramics) provided a promising route to further enhance the thermoelectric properties of titanate-based ceramics.

Author Contributions

Conceptualization, A.C.I. and I.M.R.; methodology, A.C.I.; software, A.C.I.; validation, A.C.I., Z.L., W.L.S., D.C.S. and I.M.R.; formal analysis, A.C.I.; investigation, A.C.I.; resources, A.C.I.; data curation, A.C.I.; writing—original draft preparation, A.C.I.; writing—review and editing, D.C.S. and I.M.R.; visualization, A.C.I.; supervision, Z.L., W.L.S., D.C.S. and I.M.R.; project administration, I.M.R. and D.C.S.; funding acquisition, A.C.I. All authors have read and agreed to the published version of the manuscript.

Funding

This research was funded by Tertiary Education Trustfund (TETFUND) Nigeria and Engineering and Physical Sciences Research Council Grant, grant number EP/L017563/1.

Institutional Review Board Statement

Not applicable.

Informed Consent Statement

Not applicable.

Data Availability Statement

Not applicable.

Acknowledgments

The authors also acknowledge the characterisation carried out at the Functional Materials and Devices Laboratory and the Sorby Centre, Department of Materials Science and Engineering, The University of Sheffield, UK.

Conflicts of Interest

The authors declare no conflict of interest.

References

  1. Jiang, B.; Wang, W.; Liu, S.; Wang, Y.; Wang, C.; Chen, Y.; Xie, L.; Huang, M.; He, J. High figure-of-merit and power generation in high-entropy GeTe-based thermoelectrics. Science 2022, 377, 208–213. [Google Scholar] [CrossRef] [PubMed]
  2. Liu, H.T.; Sun, Q.; Zhong, Y.; Deng, Q.; Gan, L.; Lv, F.L.; Shi, X.; Chen, Z.; Ang, R. High-performance in n-type PbTe-based thermoelectric materials achieved by synergistically dynamic doping and energy filtering. Nano Energy 2022, 91, 106706. [Google Scholar] [CrossRef]
  3. Zilber, T.; Cohen, S.; Fuks, D.; Gelbstein, Y. TiNiSn half-Heusler crystals grown from metallic flux for thermoelectric applications. J. Alloys Compd. 2019, 781, 1132–1138. [Google Scholar] [CrossRef]
  4. Meroz, O.; Gelbstein, Y. Thermoelectric Bi2Te3-xSex alloys for efficient thermal to electrical energy conversion. Phys. Chem. Chem. Phys. 2018, 20, 4092–4099. [Google Scholar] [CrossRef] [PubMed]
  5. Qiu, P.; Cheng, J.; Chai, J.; Du, X.; Xia, X.; Ming, C.; Zhu, C.; Yang, J.; Sun, Y.; Xu, F.; et al. Exceptionally Heavy Doping Boosts the Performance of Iron Silicide for Refractory Thermoelectrics. Adv. Energy Mater. 2022, 12, 2200247. [Google Scholar] [CrossRef]
  6. Tian, Z.; Lee, S.; Chen, G. A Comprehensive Review of Heat Transfer in Thermoelectric Materials and Devices. Annu. Rev. Heat Transf. 2014, 17, 425–483. [Google Scholar] [CrossRef] [Green Version]
  7. Liu, J.; Wang, C.L.; Li, Y.; Su, W.B.; Zhu, Y.H.; Li, J.C.; Mei, L.M. Influence of rare earth doping on thermoelectric properties of SrTiO3 ceramics. J. Appl. Phys. 2013, 114, 223714. [Google Scholar] [CrossRef]
  8. Sun, R.R.; Qin, X.Y.; Li, L.L.; Li, D.; Wang, N.N.; Zhang, J.; Wang, Q.Q. Transport and thermoelectric properties of Sr3(Ti0.95R0.05)2O7 (R = Ta, Nb, W) oxides. J. Appl. Phys. 2012, 112, 124904. [Google Scholar] [CrossRef]
  9. Koumoto, K.; Terasaki, I. Complex Oxide Materials for Thermoelectric Applications. MRS Bull. 2006, 31, 206–210. [Google Scholar] [CrossRef]
  10. Lu, Z. La Doped SrTiO3 Based Oxide Thermoelectrics; University of Sheffield: Sheffield, UK, 2016. [Google Scholar]
  11. Košir, M.; Podlogar, M.; Daneu, N.; Rečnik, A.; Guilmeau, E.; Bernik, S. Phase formation, microstructure development and thermoelectric properties of (ZnO)kIn2O3 ceramics. J. Eur. Ceram. Soc. 2017, 37, 2833–2842. [Google Scholar] [CrossRef]
  12. Ohtaki, M.; Araki, K.; Yamamoto, K. High thermoelectric performance of dually doped ZnO ceramics. J. Electron. Mater. 2009, 38, 1234–1238. [Google Scholar] [CrossRef]
  13. Wang, J.; Zhang, B.Y.; Kang, H.J.; Li, Y.; Yaer, X.; Li, J.F.; Tan, Q.; Zhang, S.; Fan, G.; Liu, C.; et al. Record high thermoelectric performance in bulk SrTiO3 via nano-scale modulation doping. Nano Energy 2017, 35, 387–395. [Google Scholar] [CrossRef]
  14. Lin, Y.; Norman, C.; Srivastava, D.; Azough, F.; Wang, L.; Robbins, M.; Simpson, K.; Freer, R.; Kinloch, I.A. Thermoelectric Power Generation from Lanthanum Strontium Titanium Oxide at Room Temperature through the Addition of Graphene. ACS Appl. Mater. Interfaces 2015, 7, 15898–15908. [Google Scholar] [CrossRef] [PubMed]
  15. Okhay, O.; Zlotnik, S.; Xie, W.; Orlinski, K.; Gallo, M.J.H.; Otero-Irurueta, G.; Fernandes, A.J.S.; Pawlak, D.A.; Weidenkaff, A.; Tkachb, A. Thermoelectric performance of Nb-doped SrTiO3 enhanced by reduced graphene oxide and Sr deficiency cooperation. Carbon N. Y. 2018, 143, 215–222. [Google Scholar] [CrossRef]
  16. Zheng, G.H.; Dai, Z.X.; Li, H.B.; Wang, H.Q.; Li, Y.Q.; Xu, X.F.; Huang, B.T.; Ma, Y.Q.; Li, G. Improving the Thermoelectric Properties of Sr0.9La0.1TiO3 by Ag Addition. J. Low Temp. Phys. 2014, 174, 128–135. [Google Scholar] [CrossRef]
  17. Hanbo, L.; Ganhong, Z.; Zhenxiang, D.; Zhenheng, Y.; Haiqiu, W.; Yongqing, M. Thermoelectric properties of Sr0.9La0.1TiO3 and Sr2.7La0.3Ti2O7 with 15% Ag addition. J. Rare Earths 2014, 32, 314–319. [Google Scholar] [CrossRef]
  18. Srivastava, D.; Norman, C.; Azough, F.; Schäfer, M.C.; Guilmeau, E.; Freer, R. Improving the thermoelectric properties of SrTiO3-based ceramics with metallic inclusions. J. Alloys Compd. 2018, 731, 723–730. [Google Scholar] [CrossRef]
  19. Acharya, M.; Jana, S.S.; Ranjan, M.; Maiti, T. High performance (ZT > 1) n-type oxide thermoelectric composites from earth abundant materials. Nano Energy 2021, 84, 105905. [Google Scholar] [CrossRef]
  20. Qin, M.; Gao, F.; Wang, A.M.; Zhang, C.; Zhang, Q.; Wang, L. Fabrication and High-Temperature Thermoelectric Properties of Ti-Doped Sr0.9La0.1TiO3 Ceramics. Ceram. Int. 2016, 42, 16644–16649. [Google Scholar] [CrossRef]
  21. Lu, Z.; Zhang, H.; Lei, W.; Sinclair, D.C.; Reaney, I.M. High-Figure-of-Merit Thermoelectric La-Doped A-Site-Deficient SrTiO3 Ceramics. Chem. Mater. 2016, 28, 925–935. [Google Scholar] [CrossRef]
  22. Kovalevsky, A.V.; Aguirre, M.H.; Populoh, S.; Patrício, S.G.; Ferreira, N.M.; Mikhalev, S.M.; Fagg, D.P.; Weidenkaff, A.; Frade, J.R. Designing strontium titanate-based thermoelectrics: Insight into defect chemistry mechanisms. J. Mater. Chem. A 2017, 5, 3909–3922. [Google Scholar] [CrossRef]
  23. Mendelson, M.I. Average Grain Size in Polycrystalline Ceramics. J. Am. Ceram. Soc. 1969, 52, 443–446. [Google Scholar] [CrossRef]
  24. Shannon, R.D. Revised Effective Ionic Radii and Systematic Studies of Interatomie Distances in Halides and Chaleogenides. Acta Cryst. A 1976, 32, 751–767. [Google Scholar] [CrossRef]
  25. Wang, H.C.; Wang, C.L.; Su, W.B.; Liu, J.; Sun, Y.; Peng, H.; Mei, L.M. Doping effect of La and Dy on the thermoelectric properties of SrTiO3. J. Am. Ceram. Soc. 2011, 94, 838–842. [Google Scholar] [CrossRef]
  26. Wang, H.; Wang, C. Thermoelectric properties of Yb-doped La0.1Sr0.9TiO3 ceramics at high temperature. Ceram. Int. 2013, 39, 941–946. [Google Scholar] [CrossRef]
  27. Neagu, D.; Irvine, J.T.S. Structure and Properties of La0.4 Sr0. 4TiO3 Ceramics for Use as Anode Materials in Solid Oxide Fuel Cells. Chem. Mater. 2010, 22, 5042–5053. [Google Scholar] [CrossRef]
  28. Srivastava, D.; Norman, C.; Azough, F.; Schäfer, M.C.; Guilmeau, E.; Kepaptsoglou, D.; Ramasse, Q.M.; Nicotra, G.; Freer, R. Tuning the Thermoelectric Properties of A-site Deficient SrTiO3 Ceramics by Vacancies and Carrier Concentration. Phys. Chem. Chem. Phys. 2016, 18, 26475–26486. [Google Scholar] [CrossRef] [Green Version]
  29. Boston, R.; Schmidt, W.L.; Lewin, G.D.; Iyasara, A.C.; Lu, Z.; Zhang, H.; Sinclair, D.C.; Reaney, I.M. Protocols for the fabrication, characterization, and optimization of n-type thermoelectric ceramic oxides. Chem. Mater. 2017, 29, 265–280. [Google Scholar] [CrossRef] [Green Version]
  30. Kieslich, G.; Cerretti, G.; Veremchuk, I.; Hermann, R.P.; Panthöfer, M.; Grin, J.; Tremel, W. A chemists view: Metal oxides with adaptive structures for thermoelectric applications. Phys. Status Solidi Appl. Mater. Sci. 2016, 213, 808–823. [Google Scholar] [CrossRef]
  31. Zheng, G.H.; Dai, Z.X.; Dong, Y.Q.; Zan, F.L.; Zou, D.; Ma, Y.Q.; Li, G. Low thermal conductivity for Sr1−x LaxTiO3. Mater. Res. Innov. 2012, 16, 438–441. [Google Scholar] [CrossRef]
  32. Snyder, G.J.; Toberer, E.S. Complex thermoelectric materials. Nat. Mater. 2008, 7, 105–114. [Google Scholar] [CrossRef] [PubMed] [Green Version]
  33. Kovalevsky, A.V.; Yaremchenko, A.A.; Populoh, S.; Thiel, P.; Fagg, D.P.; Weidenkaff, A.; Frade, J.R. Towards a high thermoelectric performance in rare-earth substituted SrTiO3: Effects provided by strongly-reducing sintering conditions. Phys. Chem. Chem. Phys. 2014, 16, 26946–26954. [Google Scholar] [CrossRef]
  34. Ekren, D.; Azough, F.; Gholinia, A.; Day, S.J.; Hernandez-Maldonado, D.; Kepaptsoglou, D.M.; Ramasse, Q.M.; Freer, R. Enhancing the thermoelectric power factor of Sr0.9Nd0.1TiO3 through control of the nanostructure and microstructure. J. Mater. Chem. A 2018, 6, 24928–24939. [Google Scholar] [CrossRef] [Green Version]
  35. Iyasara, A.C.; Schmidt, W.L.; Boston, R.; Sinclair, D.C.; Reaney, I.M. La and Sm Co-doped SrTiO3-δ Thermoelectric Ceramics. Mater. Today Proc. 2017, 4, 12360–12367. [Google Scholar] [CrossRef]
  36. Dehkordi, A.M. An Experimental Investigation towards Improvement of Thermoelectric Properties of Strontium Titanate Ceramics. Ph.D. Thesis, Clemson University, Clemson, SC, USA, 2014. [Google Scholar]
  37. Wang, H.C.; Wang, C.L.; Su, W.B.; Liu, J.; Zhao, Y.; Peng, H.; Zhang, J.L.; Zhao, M.L.; Li, J.C.; Yin, N.; et al. Enhancement of thermoelectric figure of merit by doping Dy in La0.1 Sr0.9TiO3 ceramic. Mater. Res. Bull. 2010, 45, 809–812. [Google Scholar] [CrossRef]
  38. Wang, H.C.; Wang, C.L.; Su, W.B.; Liu, J.; Peng, H.; Zhang, J.L.; Zhao, M.L.; Li, J.C.; Yin, N.; Mei, M.L. Substitution effect on the thermoelectric properties of reduced Nb-doped Sr0.95La0.05TiO3 ceramics. J. Alloys Compd. 2009, 486, 693–696. [Google Scholar] [CrossRef]
Figure 1. XRD patterns for (a) VSTO-A and (b) VSTO-H ceramics.
Crystals 12 01622 g001
Figure 2. Dopant (La + Sm) concentration dependence of lattice parameters for VSTO-A and VSTO-H ceramics.
Crystals 12 01622 g002
Figure 3. SEM micrographs for (a) VSTO-A and (b) VSTO-H ceramics.
Crystals 12 01622 g003
Figure 4. Thermogravimetric analysis showing the oxidation in air up to 1000 °C for (a) VSTO-A and (b) VSTO-H ceramics.
Crystals 12 01622 g004
Figure 5. Temperature dependence of (a) electrical conductivity, σ; (b) Seebeck coefficient, |S|; and (c) power factor, PF, for VSTO-A ceramics.
Crystals 12 01622 g005
Figure 6. Temperature dependence of (a) total thermal conductivity, k, and (b) thermoelectric figure of merit, ZT, for VSTO-A ceramics.
Crystals 12 01622 g006
Figure 7. Temperature dependence of (a) electrical conductivity, σ; (b) Seebeck coefficient, |S|; and (c) power factor, PF, for VSTO-H ceramics.
Crystals 12 01622 g007
Figure 8. Temperature dependence of (a) total thermal conductivity, k, and (b) thermoelectric figure of merit, ZT, for VSTO-H ceramics.
Crystals 12 01622 g008
Table 1. Particle size analysis of calcined La + Sm co-doped SrTiO3 powders after 24 h ball milling.
CompositionxParticle Diameter (μm)
d10d50d90
Sr1-3x/2Lax/2TiO3
(VSTO-A)
0.052.24.912.4
0.102.45.09.8
0.152.75.610.7
0.202.96.011.5
0.302.04.310.4
Sr1-3x/2Lax/2TiO3
(VSTO-H)
0.051.63.67.8
0.101.02.411.9
0.151.63.37.6
0.202.14.710.8
0.301.83.99.8
Table 2. Lattice parameters, cell volumes, and relative densities for (a) VSTO-A and (b) VSTO-H ceramics.
CompositionLattice Parameter (Å)Cell Volume (Å3)Relative Density (%)
(a)
0.053.9159.77698.4
0.103.90959.73698.9
0.153.90759.63998.2
0.203.90359.45698.4
0.303.90259.4198.9
(b)
0.053.89959.27398.1
0.103.90659.59396.1
0.153.90759.63999.1
0.203.9159.77698.7
0.303.90259.4198.2
Publisher’s Note: MDPI stays neutral with regard to jurisdictional claims in published maps and institutional affiliations.

