Article

Radiation Response Properties of Tb-Doped MgGa2O4 Single Crystals

1
Division of Materials Science, Nara Institute of Science and Technology (NAIST), Ikoma 630-0192, Japan
2
Department of Chemical Engineering, National Institute of Technology, Nara College, Nara 639-1080, Japan
*
Author to whom correspondence should be addressed.
Crystals 2022, 12(11), 1620; https://doi.org/10.3390/cryst12111620
Submission received: 22 October 2022 / Revised: 8 November 2022 / Accepted: 10 November 2022 / Published: 12 November 2022
(This article belongs to the Special Issue Recent Developments of Inorganic Crystalline Materials)

Abstract

:
Tb-doped MgGa2O4 single crystals (0.3, 1, 3, and 5%) were synthesized by the floating zone method. The synthesized crystals had a single phase of MgGa2O4 confirmed by X-ray diffraction and high transparency in the visible wavelength. Tb3+ acted as a luminescence center in both photoluminescence (PL) and thermally stimulated luminescence (TSL) processes. In the TSL dose response functions, the minimum detectable dose of the crystals was 0.01 mGy, which was comparable with some commercial dosimetric materials. In the X-ray imaging test taken based on TSL, the spatial resolution of the 1% Tb-doped crystal was estimated to be 8.90 LP/mm (56.2 μm).

1. Introduction

Dosimetric materials are a kind of phosphors for ionizing radiation detection, which have the function of storing absorbed radiation energy via the carrier trapping phenomenon. When ionizing radiation is absorbed by dosimetric material, numerous electrons and holes (carriers) are generated. The carriers are temporally stored at trapping centers and have a metastable state. Then, they are released by receiving external stimulation, for example, heat or light. After the re-excitation of carriers from trapped states, they recombine at the luminescence center with emitting photons; the emission due to heat or light stimulation is called thermally or optically stimulated luminescence (TSL or OSL), respectively [1]. Because the luminescence intensity is proportional to the absorbed dose, TSL and OSL can derive the total amount and distribution of the absorbed dose and are applied to a wide range of applications, including personal and environmental dosimetry [2], radiation therapy [3,4], and medical imaging [5]. The main required properties for dosimetric materials are high luminescence intensity, low fading, high thermal and chemical stability, and wide dynamic range. Until now, many dosimetric materials such as C-doped Al2O3 [6], Tb-doped Mg2SiO4 [7], Cu-doped Li2B4O7 [2], Tm-doped CaF2 [8], and Eu-doped BaFBr [9] have been investigated and commercialized. However, no dosimetric material meets all of the above requirements; therefore, there is still a need to develop novel and effective dosimetric materials.
Although many dosimetric materials have been developed as opaque ceramics or powder form [5,10,11,12,13,14], a single crystal is advantageous in terms of luminescence intensity. A single crystal has higher transparency than ceramics or powder, and emitted photons can be obtained from not only the surface but also from inside the material. Therefore, more luminescence can reach a readout photodetector. On the other hand, fewer defects can be a disadvantage since it means a lower concentration of trapping centers. To use the advantage and solve the disadvantage, spinel-type crystalline materials are attractive. Spinel-type materials, which have a chemical formula of AB2O4, are basically composed of tetrahedral A2+ ions and octahedral B3+ ions. However, a part of A2+ and B3+ ions are swapped due to cation inversion, and intrinsic antisite defects are generated [15,16,17,18]. The antisite defects are useful for trapping centers, and AB2O4 single crystals are expected to have both high transparency and high concentration of trapping centers. Up to now, we have reported that some MgAl2O4 single crystals doped with rare earths, including Tb, showed good dosimetric properties [19,20,21,22]. Analogically, MgGa2O4, which also has a spinel-type structure, may also exhibit good dosimetric properties. Additionally, in radiation-induced luminescence, luminescence efficiency is inversely proportional to the band gap energy (Eg) of the host material [23]. Therefore, MgGa2O4 (Eg = 4.9 eV), which has smaller Eg than MgAl2O4 (Eg = 7.8 eV), is expected to have higher luminescence efficiency than MgAl2O4 in terms of Eg [24,25]. However, as far as we know, the dosimetric properties of MgGa2O4 have been investigated only in ceramic form, and research into their dosimetric properties has been limited to a few studies, such as TSL glow curves at certain doses [26,27]. In this study, we synthesized MgGa2O4 single crystals doped with various concentrations of Tb and investigated the photoluminescence and dosimetric properties.

2. Experimental Methods

Tb-doped MgGa2O4 single crystals were synthesized by the floating zone (FZ) method. The raw materials were MgO (4N, High Purity Chemicals, Saitama, Japan), Ga2O3 (4N, Furuuchi Chemical, Tokyo, Japan), and Tb4O7 (4N, Furuuchi Chemical, Tokyo, Japan) powders. Tb concentrations were 0.3, 1, 3, and 5% in molar ratios. To compensate for the evaporation of Ga2O3, 30% excess Ga2O3 was added. This experimental condition was tested by different excess amounts of Ga2O3 from 5 to 40%. The crystals were grown in air atmosphere by using FZ furnace (Canon Machinery Inc., FZD0192, Shiga, Japan) under conditions of 5 mm/h and 10 rpm for pull-down and rotation rate, respectively. Other operations were performed according to a previous study [28].
A part of obtained crystalline rod was cut and polished for measurement. The portions with few cracks were selected by visual inspection and cut manually. A polishing machine (Buehler, MetaServ 250, Lake Bluff, USA) was used for mechanical polishing. Other remaining parts were crushed into powder for X-ray diffraction (XRD) measurement. An X-ray diffractometer (Rigaku, MiniFlex600, Tokyo, Japan) was used to analyze the XRD patterns. A spectrophotometer (Shimadzu, SolidSpec-3700, Kyoto, Japan) was utilized for diffuse transmittance spectrum measurements.
The PL excitation and emission spectra were investigated by a spectrofluorometer (JASCO, FP-8600, Tokyo, Japan), and PL quantum yields were acquired using Quantaurus-QY (Hamamatsu Photonics, C11347, Shizuoka, Japan). The shortest excitation wavelength of Quantaurus-QY was 250 nm. The PL decay curves, as well as decay time constants, were evaluated by Quantaurus-τ (Hamamatsu Photonics, C11367, Shizuoka, Japan).
In this study, TSL properties were measured as dosimetric properties. As a radiation source, an X-ray generator (Spellman, XRB80P&N200X4550, Hauppauge, USA) was utilized. The measurements were taken immediately after irradiation. The TSL glow curves were studied by a TSL reader (NanoGray Inc., TL-2000, Osaka, Japan) at 1 °C/s in the temperature range of 50–490 °C [29]. The TSL reader was equipped with an optical shortcut filter that cuts photons longer than 520 nm to eliminate signals due to thermal radiation. TSL spectra were measured by using a CCD-based spectrometer (Ocean Optics, QE Pro, Orland, USA) under heating by an electric heater (Sakaguchi E.H Voc, SCR-SHQ-A, Tokyo, Japan) [30]. The TSL dose response functions were obtained from the peak height at 90 °C of the TSL glow curves at each irradiation dose. The irradiation dose range was from 0.01 mGy to 1 Gy, which was calibrated by ionization chamber.
The X-ray imaging test was carried out by our original setup [31]. Pb-based square wave chart (DIAGNOMATIC, Pro-Res RF BarType7, Okszow, Poland) was used as an imaging object. The tested line patterns were 4.50, 6.30, and 8.90 LP/mm (spatial resolution of 111.1, 79.3, and 56.2 μm, respectively). The crystals were irradiated by 10 Gy X-ray through the imaging object and then heated on hot plate (As One, CHO-170AF, Osaka, Japan) at approximately 300 °C. The emission was read by a CCD camera (Bitran Corp., BK-54DUV, Saitama, Japan) located 40 cm away from the heater and the sample.

3. Results and Discussion

Figure 1 shows the photograph of the crystals under room light (bottom) and 254 nm UV light (top). All the crystals were visibly transparent and colorless, although some small cracks were observed. Under 254 nm UV light, all the crystals exhibited green luminescence. Figure 2 depicts the XRD patterns of the crystals. The diffraction patterns of all the crystals corresponded to the reference pattern of MgGa2O4 (COD 9006817) and indicated that obtained crystals had a single phase of MgGa2O4. Since no peak shift was observed within the accuracy of our XRD apparatus, Tb would be doped into interstitial [32].
Figure 3 displays the diffuse transmittance spectra of the crystals. All the crystals showed absorption at a wavelength shorter than 250 nm and a high transmittance of approximately 80% in the range of 300 to 850 nm. The variation in the transmittance in each crystal may be due to cracks inside the crystals. Absorption at wavelengths shorter than 250 nm was considered due to the overlap of the band gap of the host material and 4f-5d transitions of Tb3+ [24,33,34,35,36,37].
Figure 4 presents the PL excitation (dashed line) and emission (solid line) spectra of the crystals. When the monitoring wavelength was set to 550 nm, an excitation peak was observed at around 230 nm. Since the wavelength of the excitation peak was shorter than the absorption edge observed in Figure 3, the excitation peak might be independent of the absorption edge. Referring to previous studies, the origin of the excitation peak was ascribed to the 4f-5d transitions of Tb3+ [35,36,37]. Under excitation at 230 nm, all the crystals exhibited sharp luminescence lines at 380, 420, 440, 460, 470, 490, 550, 590, and 620 nm. According to previous reports, these peaks were attributed to the 4f-4f transitions of Tb3+ [19,38,39,40,41]. The 0.3 and 1% Tb-doped crystals showed a broad emission band around 440 nm as well. The broad emission band was considered due to the oxygen and cation vacancies of the host material [42,43]. The PL QYs of the crystals upon 250 nm excitation are summarized in Table 1. The highest QY was obtained from the 3% Tb-doped crystal among the present crystals, and concentration quenching occurred in the 5% Tb-doped crystal. Our device for QY can allow only excitation wavelengths longer than 250 nm. Therefore, if the crystals are excited by 230 nm, which is a suitable excitation wavelength, a higher QY will be expected.
Figure 5 shows the PL decay curves of the crystals. Obtained decay time constants are summarized in Table 1 as well as QY. Here, the excitation wavelength was set to 228 nm by using an optical filter, and the monitoring wavelength was 550 nm. All the decay curves were approximated with a single exponential decay function, and the obtained decay time constants were 627–877 μs. These values are typical for the 4f-4f transitions of Tb3+ [44,45,46].
Figure 6 shows the TSL glow curves of the crystals after X-ray irradiation of 100 mGy. All the crystals exhibited a peak around 90 °C. The peak was also observed in powder and ceramic forms of MgGa2O4, and the origin was related to intrinsic antisite defects due to cation inversion [27,47]. Thus, antisite defects were useful as the trapping center, even in a single crystal form. Luminescence intensity followed PL QY, and the highest luminescence intensity was confirmed from the 3% Tb-doped crystal. The crystals were stable when heated at 490 °C. Therefore, the crystals can be used stably as a TSL dosimetric material.
To clarify the luminescence origin of the crystals in TSL, TSL spectra were measured. Here, the result of the 3% Tb-doped crystal, which exhibited the highest TSL intensity, is shown as the representative since all the crystals showed the same trend. Figure 7a indicates the TSL spectra of the 3% Tb-doped crystal stimulated by 90 and 150 °C after X-ray irradiation with 10 Gy. Figure 7b shows an enlarged view in the range of 350 to 500 nm. The emission peaks due to 4f-4f transitions of Tb3+ were observed from 380 to 620 nm, as well as PL. On the other hand, there was no broad emission band due to oxygen and cation vacancies, unlike in PL. Therefore, Tb3+ played a major role in the TSL luminescence center, and oxygen and cation vacancies probably acted as trapping centers in TSL together with antisite defects. In addition, as shown in Figure 7b, the emission peaks related to the 5D3 level vanished over 150 °C because of thermal quenching [48]. In addition, TSL intensity in Figure 6 might have been underestimated, especially above 150 °C, because the apparatus for TSL glow curves had an optical filter that cut photons with a wavelength longer than 520 nm.
Figure 8 presents the TSL dose response functions of the crystals. The intensity was defined as the peak height at 90 °C. The minimum detectable dose of all the crystals was 0.01 mGy, which was comparable with those of some commercial dosimeters, although fading of the samples may be strong [49]. In addition, 0.01 mGy was the lowest dose that could be tested in our setup, and the signal intensity saturated when the irradiated dose exceeded 100 mGy for the 3% Tb-doped crystal and 300 mGy for the other crystals. Therefore, the crystals may be used in a wider dose range.
Figure 9 shows the results of the X-ray imaging test of the 1% Tb-doped crystal taken by using TSL. Here, the clearest image was obtained from the 1% Tb-doped crystal among the present crystals because of the fewest cracks. Figure 9a,b indicates the obtained image and intensity profiles of each line pattern, respectively. As shown in Figure 9a, luminescence was observed only in the area irradiated by X-rays, while luminescence was not observed in the rest since X-rays were blocked by the Pb substrate. From Figure 9b, the line patterns were well resolved, and the spatial resolution of the 1% Tb-doped crystal was 8.90 LP/mm (56.2 μm). This result indicates that a Tb-doped MgGa2O4 single crystal can be applied to 2D dosimetry (TL imaging plate) as well. In addition, the 3% Tb-doped crystal, which showed the highest luminescence intensity, can demonstrate higher spatial resolution than a 1% Tb-doped crystal if a crystal with no cracks is grown.

4. Conclusion

MgGa2O4 single crystals doped with various concentrations of Tb were synthesized by the FZ method. The XRD patterns showed a single phase of MgGa2O4. In PL, Tb3+ and oxygen and cation vacancies worked as luminescence centers. The highest QY value was obtained in the 3% Tb-doped crystal. In TSL, Tb3+ acted as a luminescence center, as well as PL; on the other hand, oxygen and cation vacancies played the role of trapping centers, unlike PL. The 3% Tb-doped crystal exhibited the highest TSL intensity, as well as QY. The minimum detectable dose of the crystals was 0.01 mGy, which was comparable with some commercial dosimeters. In the X-ray imaging test using TSL, the spatial resolution of the 1% Tb-doped crystal was estimated to be 8.90 LP/mm (56.2 μm). Although the TL glow peak at 90 °C was unstable owing to fading, these results indicate that Tb-doped MgGa2O4 single crystals are applicable to personal and environmental dosimetry and X-ray imaging.

Author Contributions

Conceptualization, Y.T.; methodology, Y.T.; validation, K.N., T.K., D.N. and N.K.; formal analysis, Y.T., S.H., T.K. and T.Y.; investigation, Y.T. and S.H.; resources, T.Y.; data curation, Y.T.; writing-original draft preparation, Y.T.; writing-review and editing, Y.T. and T.Y.; visualization, Y.T.; supervision, K.N., T.K., D.N., N.K. and T.Y.; funding acquisition, T.K., D.N., N.K. and T.Y. All authors have read and agreed to the published version of the manuscript.

Funding

This work was supported by Grant-in-Aid for Scientific Research A (22H00309), Scientific Research B (21H03733, 21H03736, 22H02939, and 22H03872), and Challenging Exploratory Research (22K18997) from the Japan Society for the Promotion of Science. The Foundation from the Cooperative Research Project of the Research Center for Biomedical Engineering, the Nippon Sheet Glass Foundation, the Terumo Life Science Foundation, the Iwatani Naoji Foundation, and the Konica Minolta Science and Technology Foundation are also acknowledged.

Institutional Review Board Statement

Not applicable.

Informed Consent Statement

Not applicable.

Data Availability Statement

Data of the results presented in this article are not publicly available.

Conflicts of Interest

The authors declare no conflict of interest.

References

  1. Yanagida, T.; Okada, G.; Kawaguchi, N. Ionizing-Radiation-Induced Storage-Luminescence for Dosimetric Applications. J. Lumin. 2019, 207, 14–21. [Google Scholar] [CrossRef]
  2. Bhatt, B.C.; Kulkarni, M.S. Worldwide Status of Personnel Monitoring Using Thermoluminescent ( TL ), Optically Stimulated Luminescent (OSL) and Radiophotoluminescent ( RPL ) Dosimeters. Int. J. Lumin. Appl. 2013, 3, 6–10. [Google Scholar]
  3. Viamonte, A.; da Rosa, L.A.R.; Buckley, L.A.; Cherpak, A.; Cygler, J.E. Radiotherapy Dosimetry Using a Commercial OSL System. Med. Phys. 2008, 35, 1261–1266. [Google Scholar] [CrossRef] [PubMed] [Green Version]
  4. Watanabe, K.; Yamazaki, A.; Nakahashi, K.; Miyamae, H.; Uritani, A.; Ariga, E. Development of a Micro-Size Dosimeter Using an Optical Fiber Probe Based on Photostimulable Phosphorescence. Radiat. Meas. 2013, 55, 64–67. [Google Scholar] [CrossRef]
  5. Nanto, H.; Nishimura, A.; Kuroda, M.; Takei, Y.; Nakano, Y.; Shoji, T.; Yanagita, T.; Kasai, S. X-ray Imaging Plate Using CsBr:Eu Phosphors for Computed Radiography. Nucl. Instrum. Methods Phys. Res. Sect. A 2007, 580, 278–281. [Google Scholar] [CrossRef]
  6. McKeever, S.W.S. Optically Stimulated Luminescence: A Brief Overview. Radiat. Meas. 2011, 46, 1336–1341. [Google Scholar] [CrossRef]
  7. Akça, S.; Portakal, Z.G.; Dogan, T.; Kucuk, N.; Canimoglu, A.; Topaksu, M.; Can, N. Thermoluminescence Properties of Tb Doped Mg2SiO4 after Beta Irradiation. Nucl. Instrum. Methods Phys. Res. Sect. B 2019, 458, 12–20. [Google Scholar] [CrossRef]
  8. Bos, A.J.J.; Dielhof, J.B. The Analysis of Thermoluminescent Glow Peaks in CaF2:Tm (TLD-300). Radiat. Prot. Dosim. 1991, 37, 231–239. [Google Scholar] [CrossRef] [Green Version]
  9. Fiksel, G.; Marshall, F.J.; Mileham, C.; Stoeckl, C. Note: Spatial Resolution of Fuji BAS-TR and BAS-SR Imaging Plates. Rev. Sci. Instrum. 2012, 83, 086103. [Google Scholar] [CrossRef]
  10. Zhao, Y.; Zhou, Y.; Jiang, Y.; Zhou, W.; Finch, A.A.; Townsend, P.D.; Wang, Y. Ion Size Effects on Thermoluminescence of Terbium and Europium Doped Magnesium Orthosilicate. J. Mater. Res. 2015, 30, 3443–3452. [Google Scholar] [CrossRef] [Green Version]
  11. Yanagisawa, S.; Shinsho, K.; Inoue, M.; Koba, Y.; Matsumoto, K.; Ushiba, H.; Andoh, T. Applicability of Two-Dimensional Thermoluminescence Slab Dosimeter Based on Al2O3:Cr for the Quality Assurance of Robotic Radiosurgery. Radiat. Meas. 2017, 106, 326–330. [Google Scholar] [CrossRef]
  12. Takebuchi, Y.; Kato, T.; Nakauchi, D.; Kawaguchi, N.; Yanagida, T. Dosimetric Properties of Dy-Doped LiCaPO4. Optik 2022, 260, 169079. [Google Scholar] [CrossRef]
  13. Kato, T.; Nakauchi, D.; Kawaguchi, N.; Yanagida, T. TSL and OSL Properties of Cu-Doped CaF2 Ceramics Prepared by Spark Plasma Sintering. Sens. Mater. 2022, 34, 653. [Google Scholar] [CrossRef]
  14. Oh, R.; Yanagisawa, S.; Tanaka, H.; Takata, T.; Wakabayashi, G.; Tanaka, M.; Sugioka, N.; Koba, Y.; Shinsho, K. Thermal Neutron Measurements Using Thermoluminescence Phosphor Cr-Doped Al2O3 and Cd Neutron Converter. Sens. Mater. 2021, 33, 2129. [Google Scholar] [CrossRef]
  15. Schmocker, U.; Boesch, H.R.; Waldner, F. A Direct Determination of Cation Disorder in MgAl2O4 Spinel by ESR. Phys. Lett. A 1972, 40, 237–238. [Google Scholar] [CrossRef]
  16. Gritsyna, V.T.; Kazarinov, Y.G.; Kobyakov, V.A.; Sickafus, K.E. Defects and Radiation Induced Electronic Processes in Magnesium Aluminate Spinel of Different Compositions. Radiat. Eff. Defects Solids 2002, 157, 659–663. [Google Scholar] [CrossRef]
  17. Pathak, N.; Ghosh, P.S.; Gupta, S.K.; Mukherjee, S.; Kadam, R.M.; Arya, A. An Insight into the Various Defects-Induced Emission in MgAl2O4 and Their Tunability with Phase Behavior: Combined Experimental and Theoretical Approach. J. Phys. Chem. C 2016, 120, 4016–4031. [Google Scholar] [CrossRef]
  18. Khan, K.; Satapathy, K.K.; Mishra, G.C. Thermoluminescence Characterization of MAl2O4 ( M=Ba, Ca, Mg) Phosphors Activated with Dy3+. Int. J. Lumin. Appl. 2015, 5, 26–28. [Google Scholar]
  19. Takebuchi, Y.; Fukushima, H.; Kato, T.; Nakauchi, D.; Kawaguchi, N.; Yanagida, T. Dosimetric Properties of Tb-Doped MgAl2O4 Single Crystals. Jpn. J. Appl. Phys. 2020, 59, 052007. [Google Scholar] [CrossRef]
  20. Takebuchi, Y.; Fukushima, H.; Kato, T.; Nakauchi, D.; Kawaguchi, N.; Yanagida, T. Thermally Stimulated Luminescence Properties of Dy-Doped MgAl2O4 Single Crystals. Optik 2021, 231, 166498. [Google Scholar] [CrossRef]
  21. Takebuchi, Y.; Koshimizu, M.; Kato, T.; Nakauchi, D.; Kawaguchi, N.; Yanagida, T. Effect of Tm Doping on Photoluminescence, Scintillation, and Thermally Stimulated Luminescence Properties of MgAl2O4 Single Crystals. J. Lumin. 2022, 251, 119247. [Google Scholar] [CrossRef]
  22. Takebuchi, Y.; Fukushima, H.; Nakauchi, D.; Kato, T.; Kawaguchi, N.; Yanagida, T. Scintillation and Dosimetric Properties of Ce-Doped MgAl2O4 Single Crystals. J. Lumin. 2020, 223, 117139. [Google Scholar] [CrossRef]
  23. Bos, A.J.J. Theory of Thermoluminescence. Radiat. Meas. 2006, 41, S45–S56. [Google Scholar] [CrossRef]
  24. Galazka, Z.; Klimm, D.; Irmscher, K.; Uecker, R.; Pietsch, M.; Bertram, R.; Naumann, M.; Albrecht, M.; Kwasniewski, A.; Schewski, R.; et al. MgGa2O4 as a New Wide Bandgap Transparent Semiconducting Oxide: Growth and Properties of Bulk Single Crystals. Phys. Status Solidi 2015, 212, 1455–1460. [Google Scholar] [CrossRef]
  25. Hosseini, S.M. Structural, Electronic and Optical Properties of Spinel MgAl2O4 Oxide. Phys. Status Solidi 2008, 245, 2800–2807. [Google Scholar] [CrossRef]
  26. Luchechko, A.; Zhydachevskyy, Y.; Maraba, D.; Bulur, E.; Ubizskii, S.; Kravets, O. TL and OSL Properties of Mn2+-Doped MgGa2O4 Phosphor. Opt. Mater. 2018, 78, 502–507. [Google Scholar] [CrossRef]
  27. Mlotswa, D.V.; Noto, L.L.; Mofokeng, S.J.; Obodo, K.O.; Orante-Barrón, V.R.; Mothudi, B.M. Luminescence Dynamics of MgGa2O4 Prepared by Solution Combustion Synthesis. Opt. Mater. 2020, 109, 110134. [Google Scholar] [CrossRef]
  28. Takebuchi, Y.; Fukushima, H.; Kato, T.; Nakauchi, D.; Kawaguchi, N.; Yanagida, T. Optical, Scintillation, and Dosimetric Properties of Mn-Doped MgAl2O4 Single Crystals. J. Mater. Sci. Mater. Electron. 2020, 31, 8240–8247. [Google Scholar] [CrossRef]
  29. Yanagida, T.; Fujimoto, Y.; Kawaguchi, N.; Yanagida, S. Dosimeter Properties of AlN. J. Ceram. Soc. Jpn. 2013, 121, 988–991. [Google Scholar] [CrossRef] [Green Version]
  30. Okada, G.; Kato, T.; Nakauchi, D.; Fukuda, K.; Yanagida, T. Photochromism and Thermally and Optically Stimulated Luminescences of AlN Ceramic Plate for UV Sensing. Sens. Mater. 2016, 28, 897. [Google Scholar] [CrossRef] [Green Version]
  31. Okada, G.; Fukuda, K.; Kasap, S.; Yanagida, T. Aluminum Nitride Ceramic as an Optically Stimulable Luminescence Dosimeter Plate. Photonics 2016, 3, 23. [Google Scholar] [CrossRef] [Green Version]
  32. Liu, H.; Yu, L.; Li, F. Photoluminescent Properties of Eu3+ and Dy3+ Ions Doped MgGa2O4 Phosphors. J. Phys. Chem. Solids 2013, 74, 196–199. [Google Scholar] [CrossRef]
  33. Zhang, G.; Goldstein, A.; Wu, Y. Novel Transparent MgGa2O4 and Ni2+-Doped MgGa2O4 Ceramics. J. Adv. Ceram. 2022, 11, 470–481. [Google Scholar] [CrossRef]
  34. Basavaraju, N.; Sharma, S.; Bessière, A.; Viana, B.; Gourier, D.; Priolkar, K.R. Red Persistent Luminescence in MgGa2O4: Cr3+; a New Phosphor for in Vivo Imaging. J. Phys. D. Appl. Phys. 2013, 46, 375401. [Google Scholar] [CrossRef]
  35. Ichiba, K.; Takebuchi, Y.; Kimura, H.; Kato, T.; Nakauchi, D.; Kawaguchi, N.; Yanagida, T. Photoluminescence, Scintillation, and Dosimetric Properties of Tb-Doped Mg2SiO4 Single Crystals. J. Mater. Sci. Mater. Electron. 2022, 33, 13634–13641. [Google Scholar] [CrossRef]
  36. Yang, H.; Shi, J.; Gong, M.; Cheah, K.W. Synthesis and Photoluminescence of Eu3+- or Tb3+-Doped Mg2SiO4 Nanoparticles Prepared by a Combined Novel Approach. J. Lumin. 2006, 118, 257–264. [Google Scholar] [CrossRef]
  37. Ichiba, K.; Takebuchi, Y.; Kimura, H.; Kato, T.; Shiratori, D.; Nakauchi, D.; Kawaguchi, N.; Yanagida, T. Synthesis of Tb-Doped SiO2 Glasses by Spark Plasma Sintering Method and Evaluation of Photoluminsecence and Thermally Stimulated Luminescence Properties. Radiat. Phys. Chem. 2023, 202, 110515. [Google Scholar] [CrossRef]
  38. Nakauchi, D.; Kato, T.; Kawaguchi, N.; Yanagida, T. Photoluminescence and Scintillation Properties of Tb:GdTaO4 Crystals. Sens. Mater. 2021, 33, 2203. [Google Scholar] [CrossRef]
  39. Nakagawa, H.; Ebisu, K.; Zhang, M.; Kitaura, M. Luminescence Properties and Afterglow in Spinel Crystals Doped with Trivalent Tb Ions. J. Lumin. 2003, 102–103, 590–596. [Google Scholar] [CrossRef]
  40. Ratnam, B.V.; Jayasimhadri, M.; Bhaskar Kumar, G.; Jang, K.; Kim, S.S.; Lee, Y.I.; Lim, J.M.; Shin, D.S.; Song, T.K. Synthesis and Luminescent Features of NaCaPO4:Tb3+ Green Phosphor for near UV-Based LEDs. J. Alloy. Compd. 2013, 564, 100–104. [Google Scholar] [CrossRef]
  41. Nakauchi, D.; Fukushima, H.; Kato, T.; Kawaguchi, N.; Yanagida, T. Photoluminescence and Scintillation Properties of Ce-, Pr-, and Tb-Doped (Gd,Lu)2Hf2O7 Crystals. Sens. Mater. 2022, 34, 611. [Google Scholar] [CrossRef]
  42. Jiang, B.; Chi, F.; Wei, X.; Chen, Y.; Yin, M. A Self-Activated MgGa2O4 for Persistent Luminescence Phosphor. J. Appl. Phys. 2018, 124, 063101. [Google Scholar] [CrossRef]
  43. Liu, Z.; Hu, P.; Jing, X.; Wang, L. Luminescence of Native Defects in MgGa2O4. J. Electrochem. Soc. 2009, 156, H43. [Google Scholar] [CrossRef]
  44. Liu, F.S.; Liu, Q.L.; Liang, J.K.; Luo, J.; Yang, L.T.; Song, G.B.; Zhang, Y.; Wang, L.X.; Yao, J.N.; Rao, G.H. Crystal Structure and Photoluminescence of Tb3+ Doped Y3GaO6. J. Alloy. Compd. 2006, 425, 278–283. [Google Scholar] [CrossRef]
  45. Dahiya, H.; Dalal, M.; Dalal, J.; Taxak, V.B.; Khatkar, S.P.; Kumar, D. Synthesis and Luminescent Properties of Tb3+ Doped BaLa2ZnO5 Nanoparticles. Mater. Res. Bull. 2018, 99, 86–92. [Google Scholar] [CrossRef]
  46. Liao, J.; Qiu, B.; Lai, H. Synthesis and Luminescence Properties of Tb3+:NaGd(WO4)2 Novel Green Phosphors. J. Lumin. 2009, 129, 668–671. [Google Scholar] [CrossRef]
  47. Matsui, H.; Xu, C.-N.; Akiyama, M.; Watanabe, T. Strong Mechanoluminescence from UV-Irradiated Spinels of ZnGa2O4:Mn and MgGa2O4:Mn. Jpn. J. Appl. Phys. 2000, 39, 6582–6586. [Google Scholar] [CrossRef]
  48. Boruc, Z.; Fetlinski, B.; Kaczkan, M.; Turczynski, S.; Pawlak, D.; Malinowski, M. Temperature and Concentration Quenching of Tb3+ Emissions in Y4Al2O9 Crystals. J. Alloy. Compd. 2012, 532, 92–97. [Google Scholar] [CrossRef]
  49. Bhatt, B.C. Thermoluminescence, Optically Stimulated Luminescence and Radiophotoluminescence Dosimetry: An Overall Perspective. Radiat. Prot. Environ. 2011, 34, 6–16. [Google Scholar]
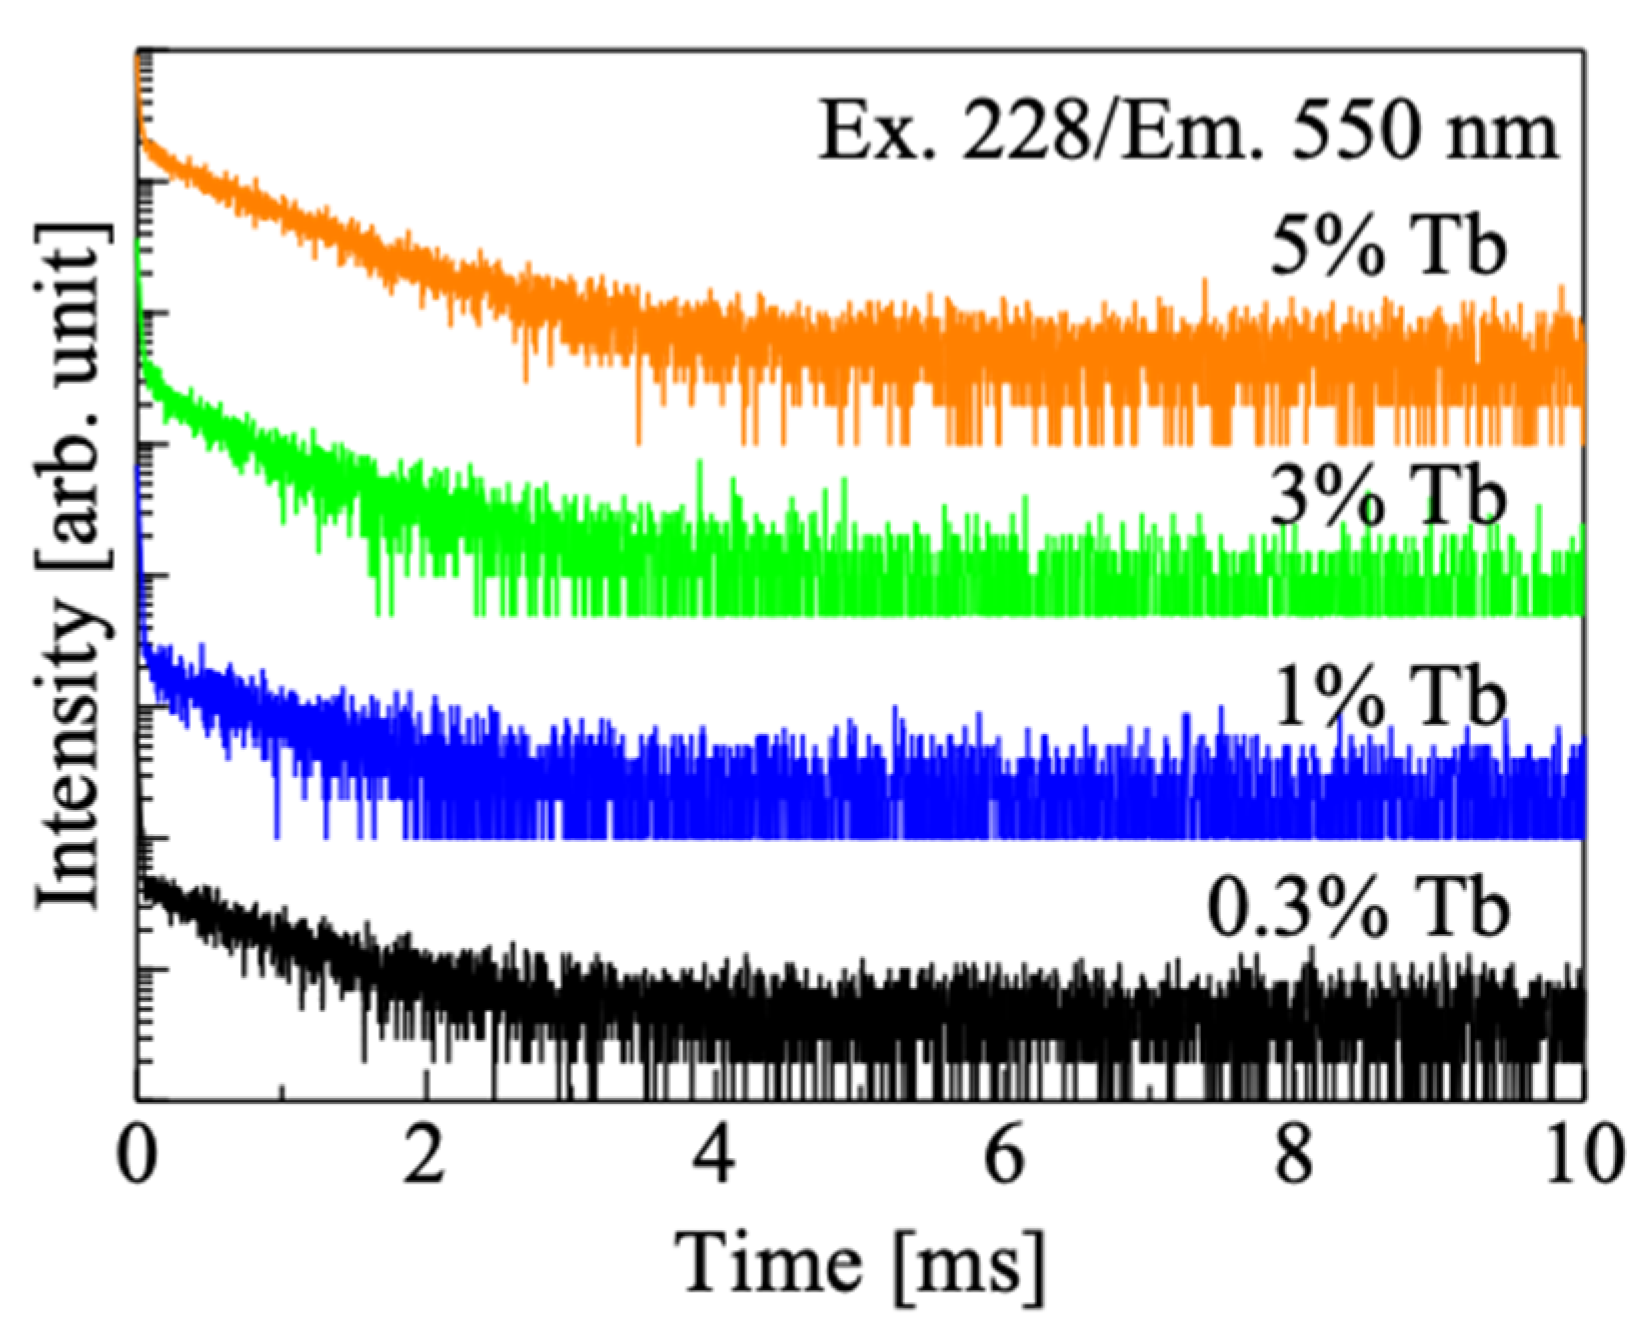
Figure 1. Photograph of the crystals under room light (bottom) and UV light (top).
Crystals 12 01620 g001
Figure 2. XRD patterns of synthesized Tb-doped MgGa2O4 and reference (COD 9006817).
Crystals 12 01620 g002
Figure 3. Diffuse transmittance spectra of Tb-doped MgGa2O4.
Crystals 12 01620 g003
Figure 4. PL excitation (dashed line) and emission (solid line) spectra of Tb-doped MgGa2O4.
Crystals 12 01620 g004
Figure 5. PL decay curves of Tb-doped MgGa2O4.
Crystals 12 01620 g005
Figure 6. TSL glow curves of Tb-doped MgGa2O4 after X-ray irradiation of 100 mGy.
Crystals 12 01620 g006
Figure 7. (a) TSL spectra of 3% Tb-doped MgGa2O4 stimulated by 90 and 150 °C after X-ray irradiation with 10 Gy; (b) shows enlarged view between 350 and 500 nm.
Crystals 12 01620 g007
Figure 8. TSL dose response functions of Tb-doped MgGa2O4.
Crystals 12 01620 g008
Figure 9. Results of X-ray imaging test of 1% Tb-doped MgGa2O4 taken by TSL: (a) obtained image; (b) intensity profiles of each line pattern.
Crystals 12 01620 g009
Table 1. PL QY and decay time constants of the crystals.
SampleQY at 250 nm (%)τ (μs)
0.3% Tb5.0856
1% Tb6.5627
3% Tb10.7703
5% Tb4.4877
Publisher’s Note: MDPI stays neutral with regard to jurisdictional claims in published maps and institutional affiliations.

