
One Pot Synthesis, Surface and Magnetic Properties of Cu2O/Cu and Cu2O/CuO Nanocomposites

 ,
,  and
and
Abstract
:1. Introduction
2. Materials and Methods
2.1. Materials
2.2. Preparation Route
2.3. Characterization Techniques
3. Results
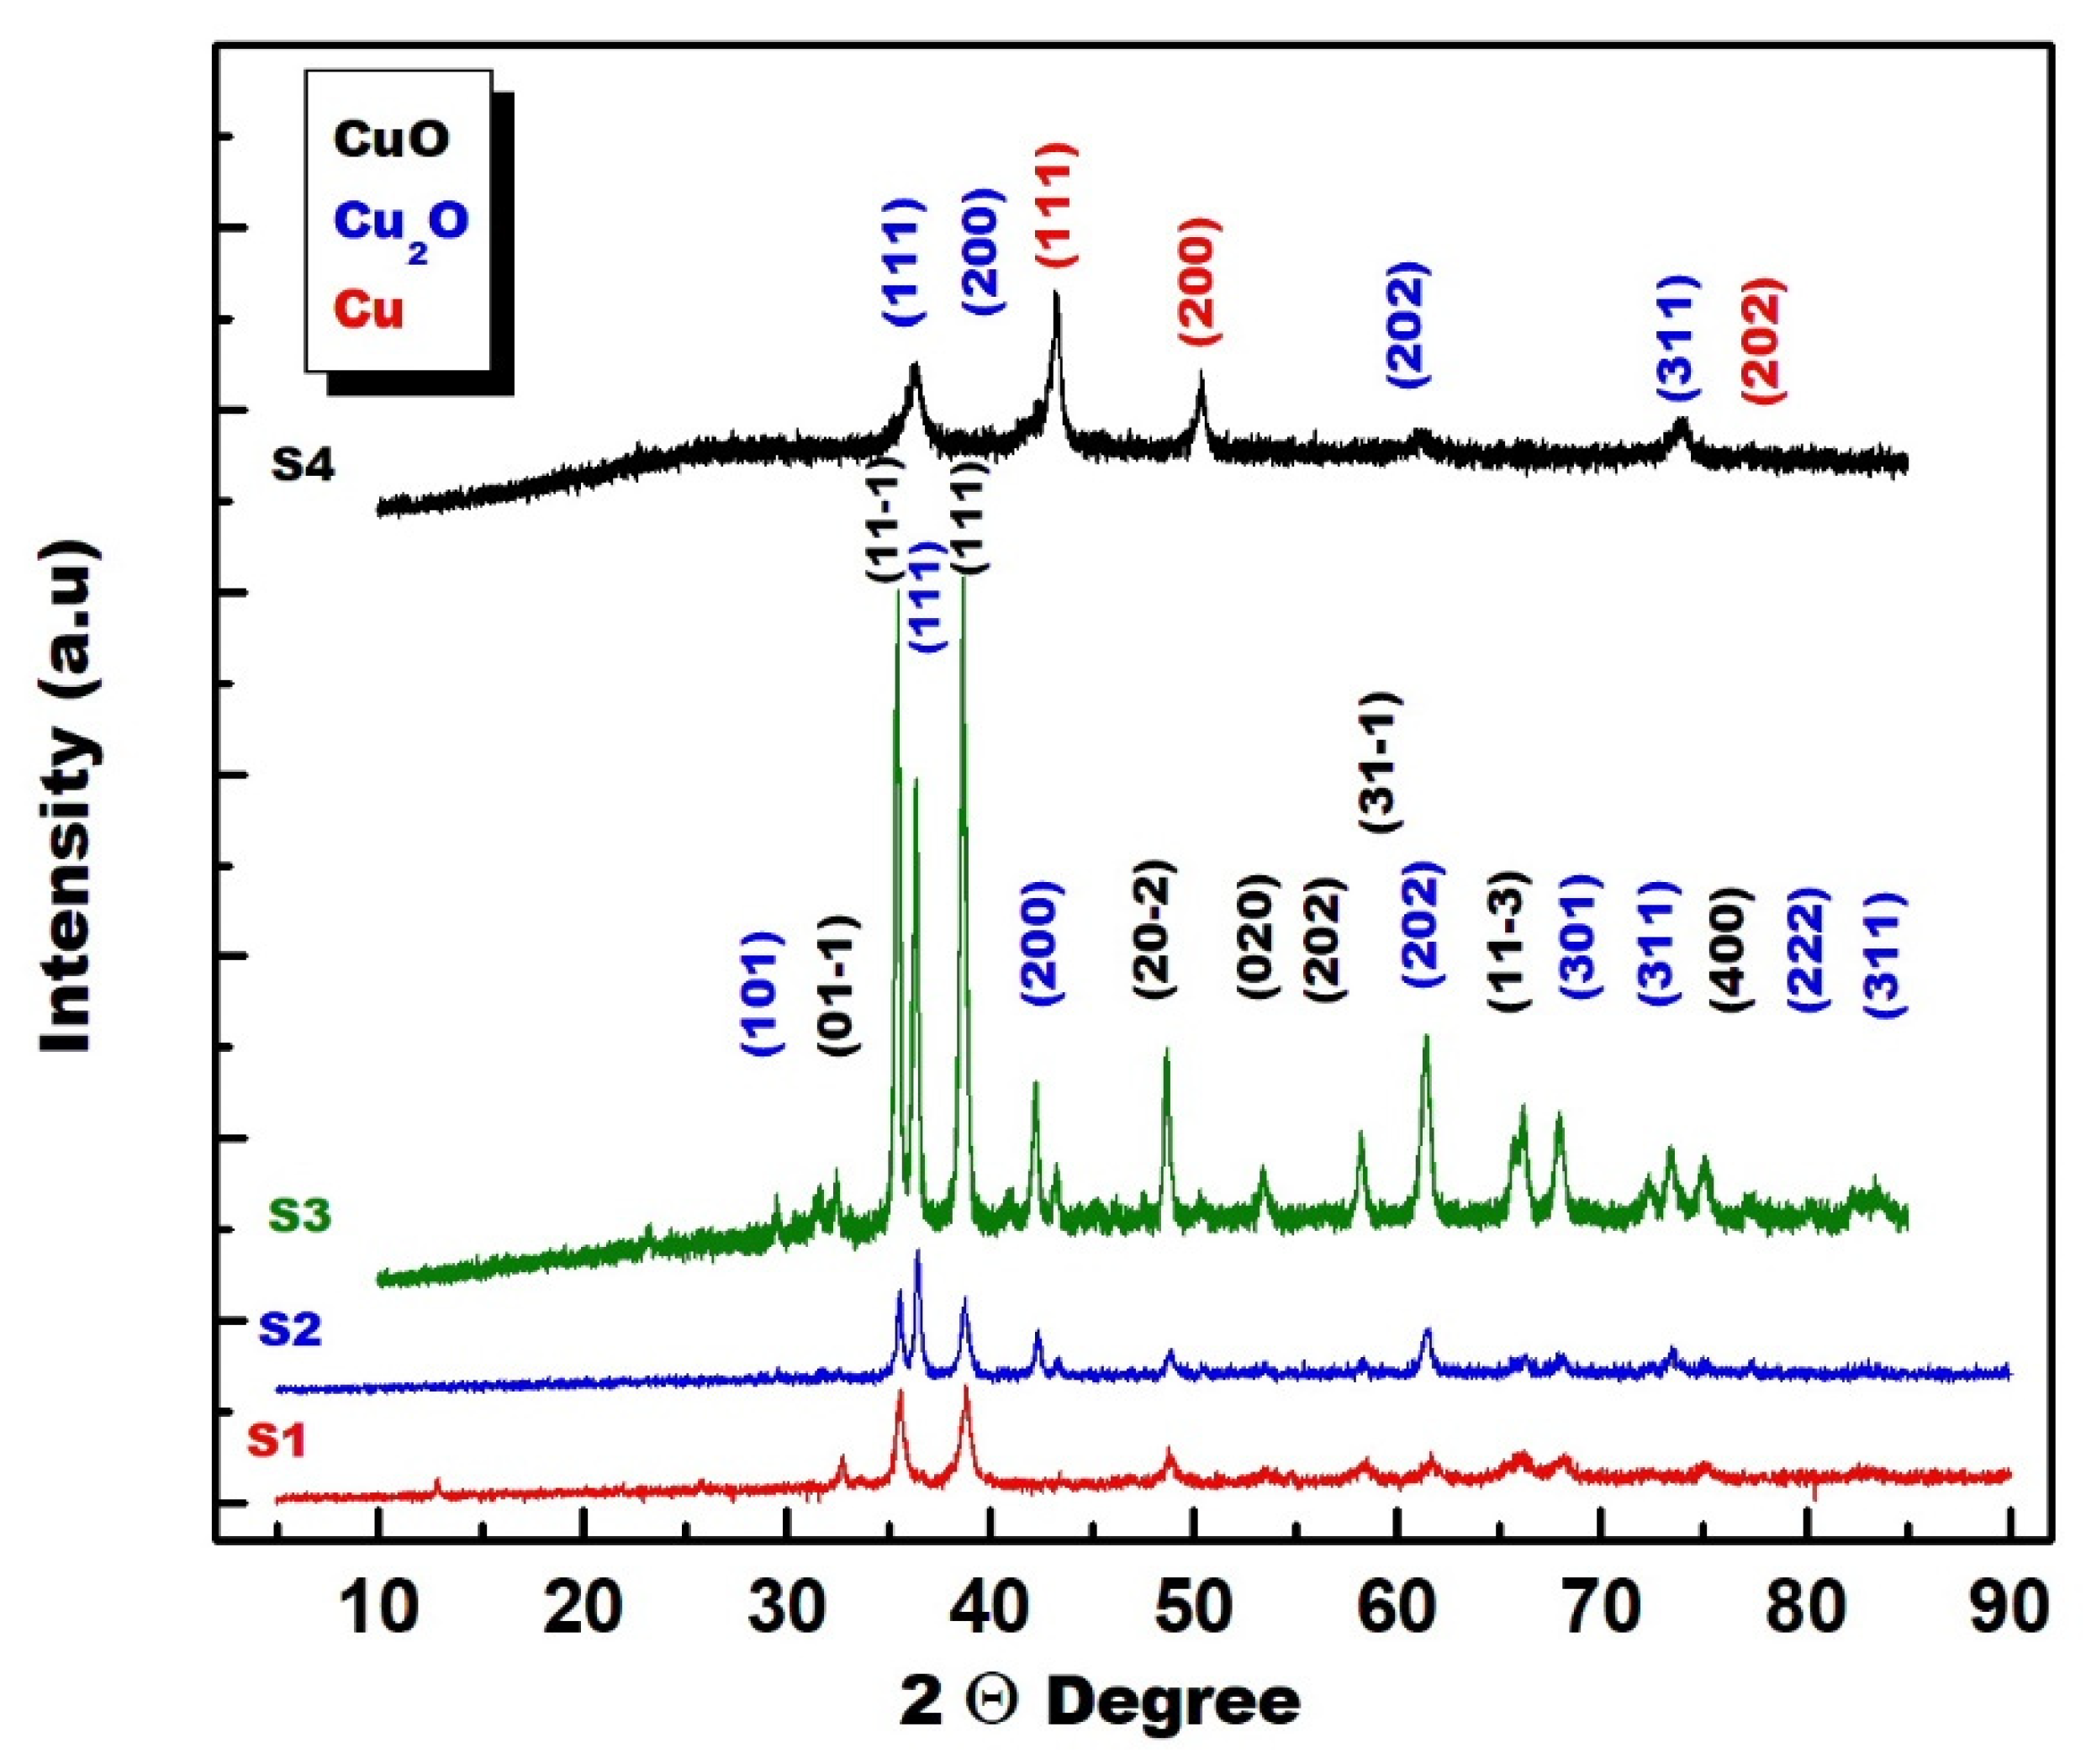
3.1. XRD Study
3.2. FTIR Analysis
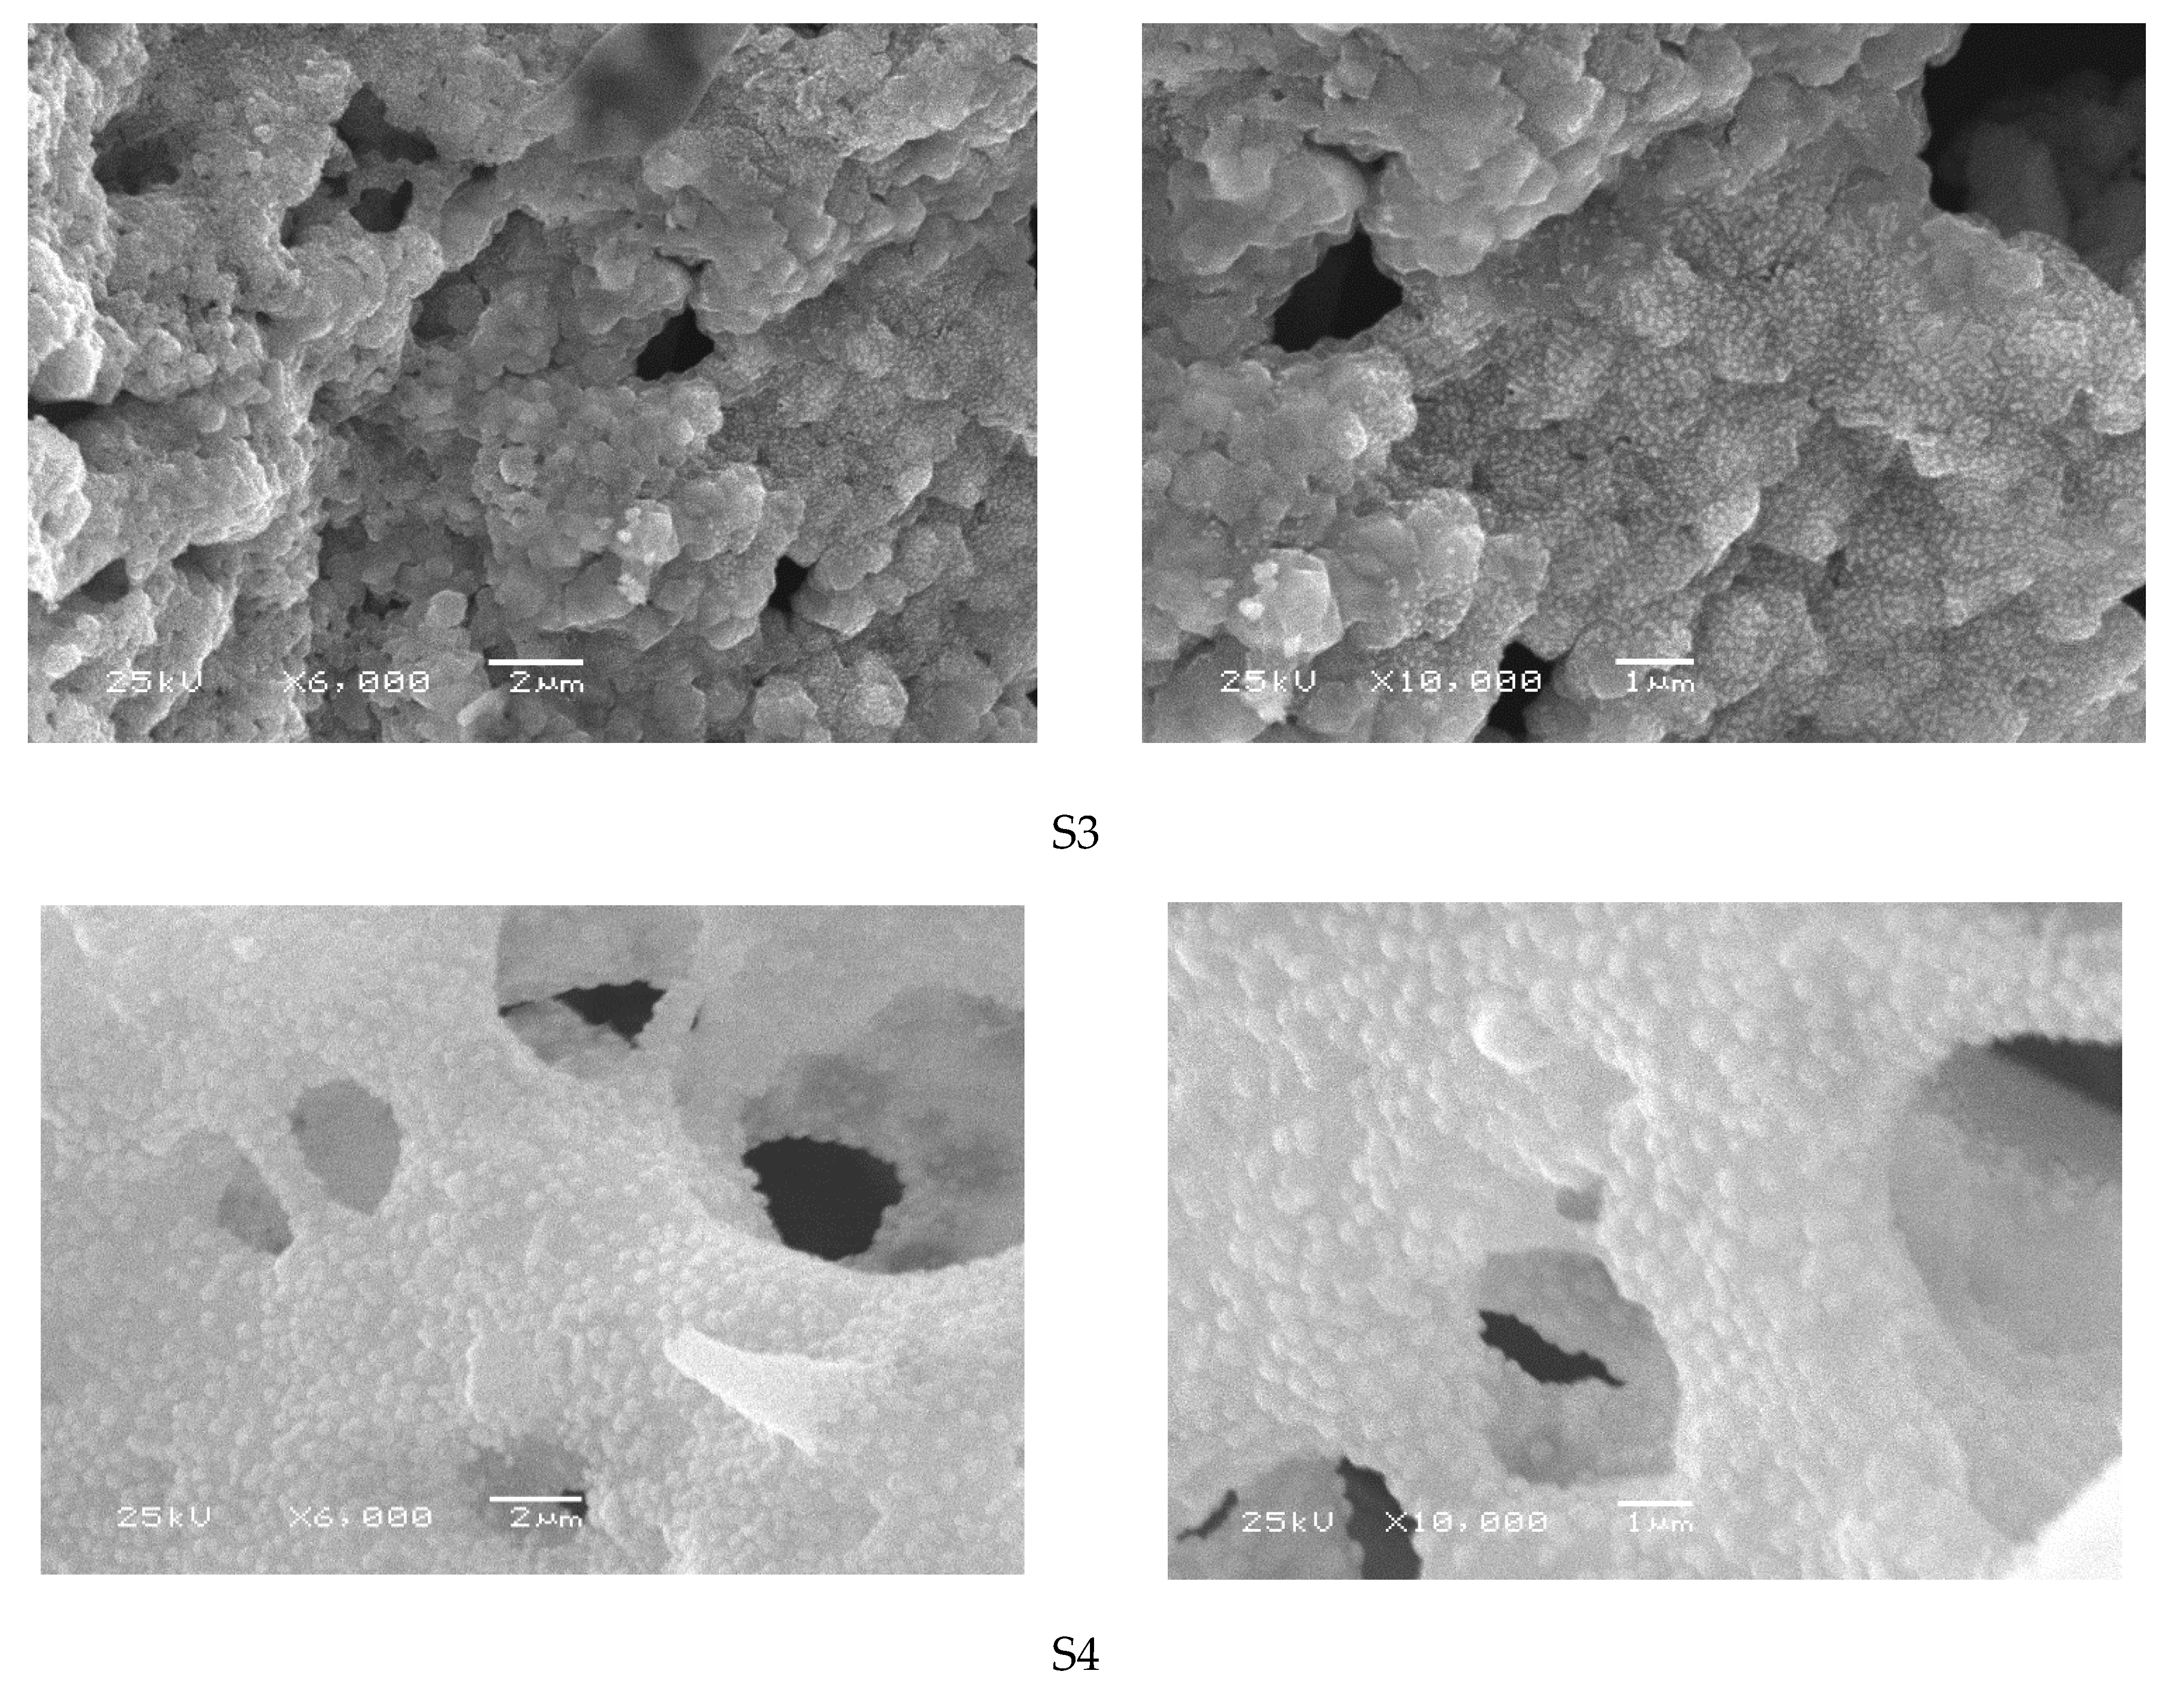
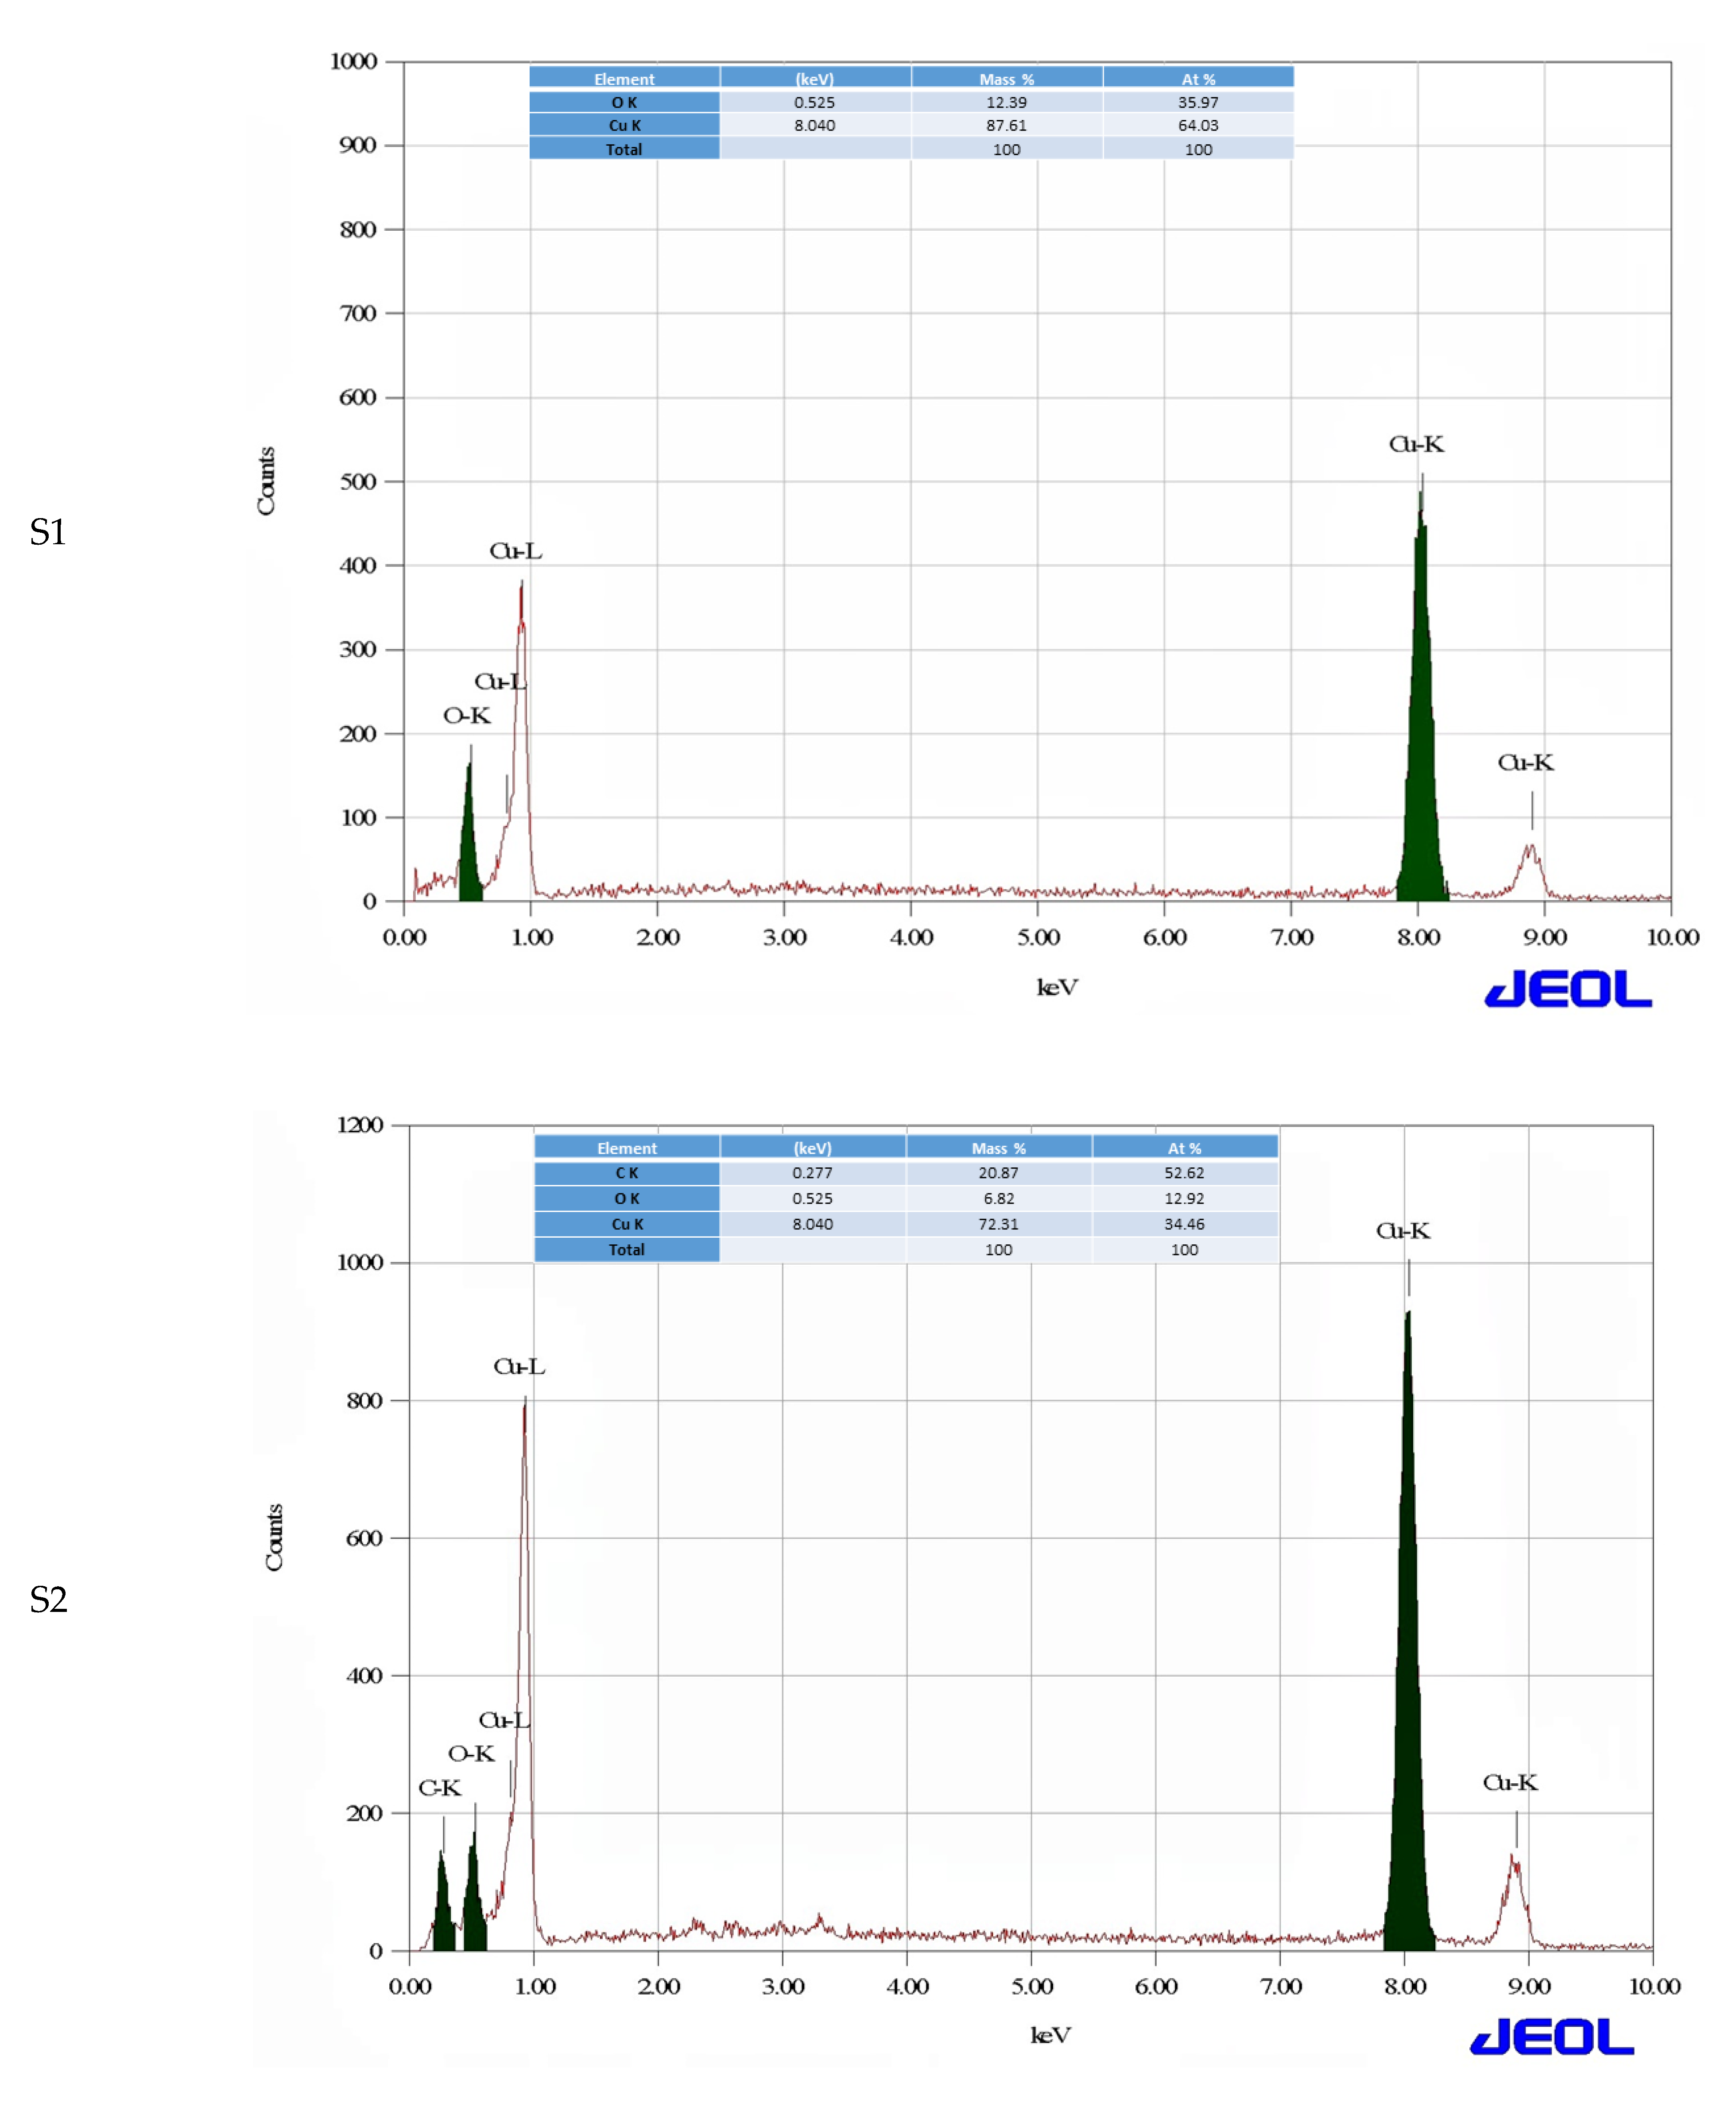
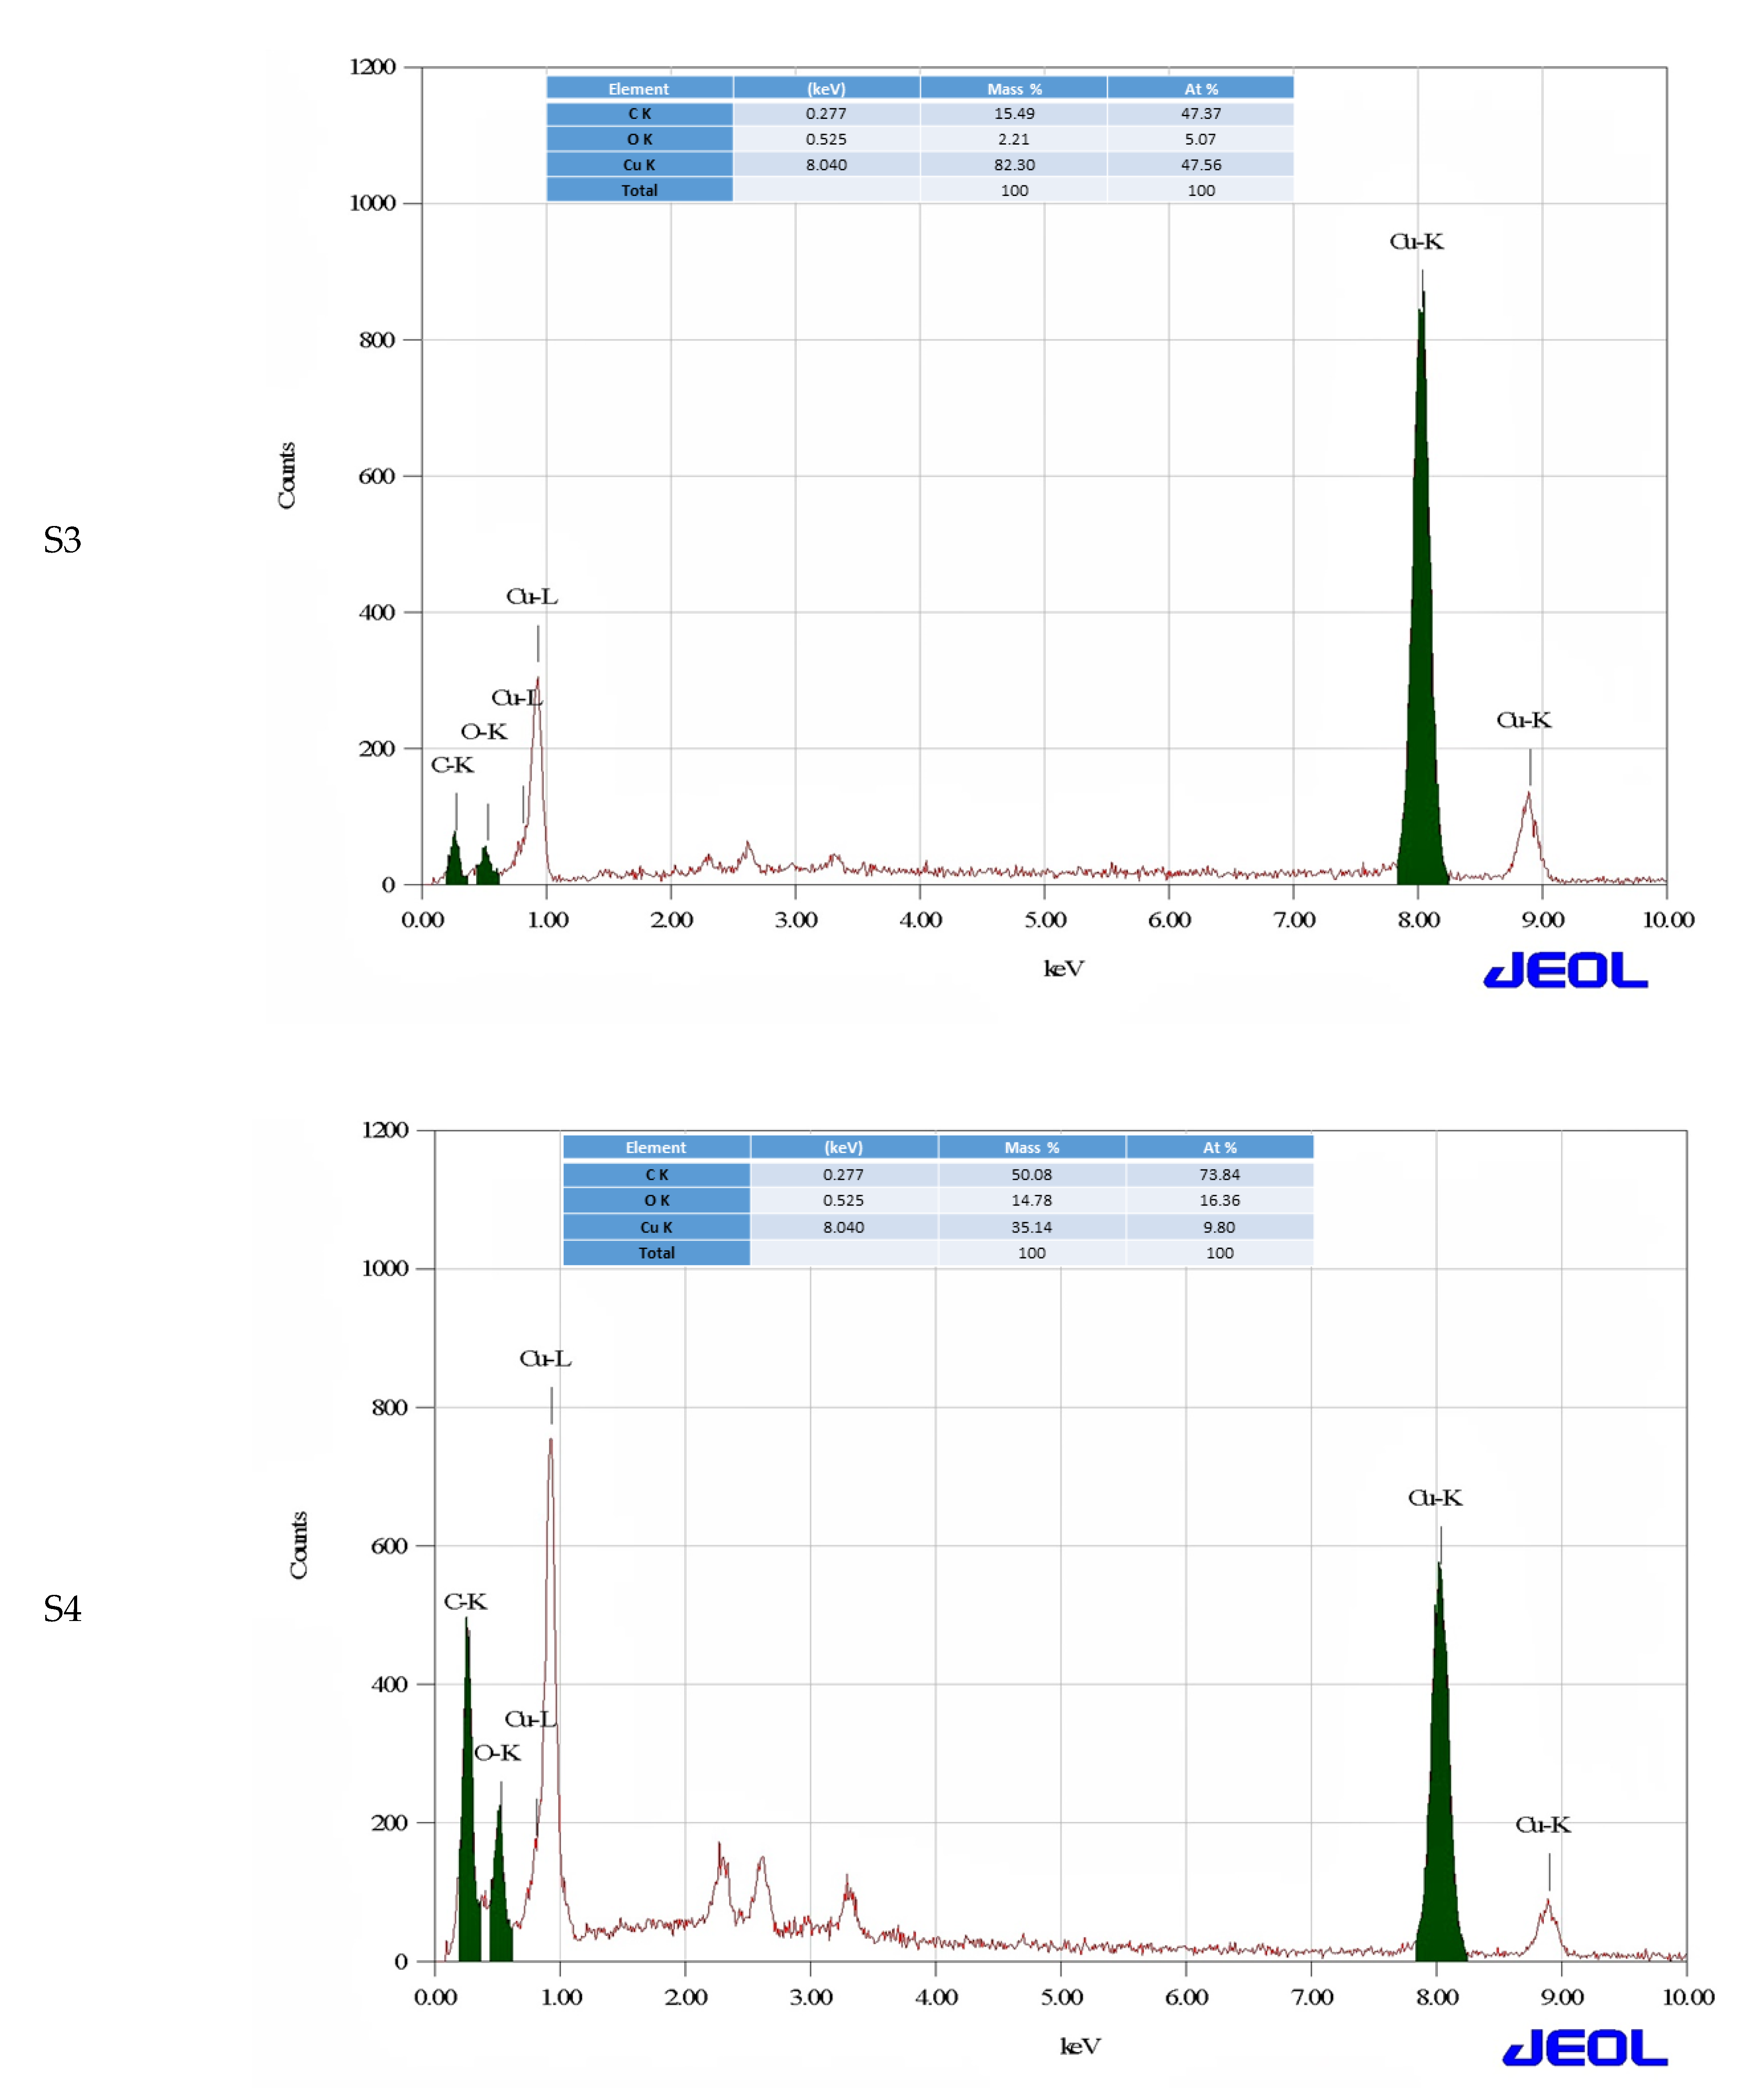
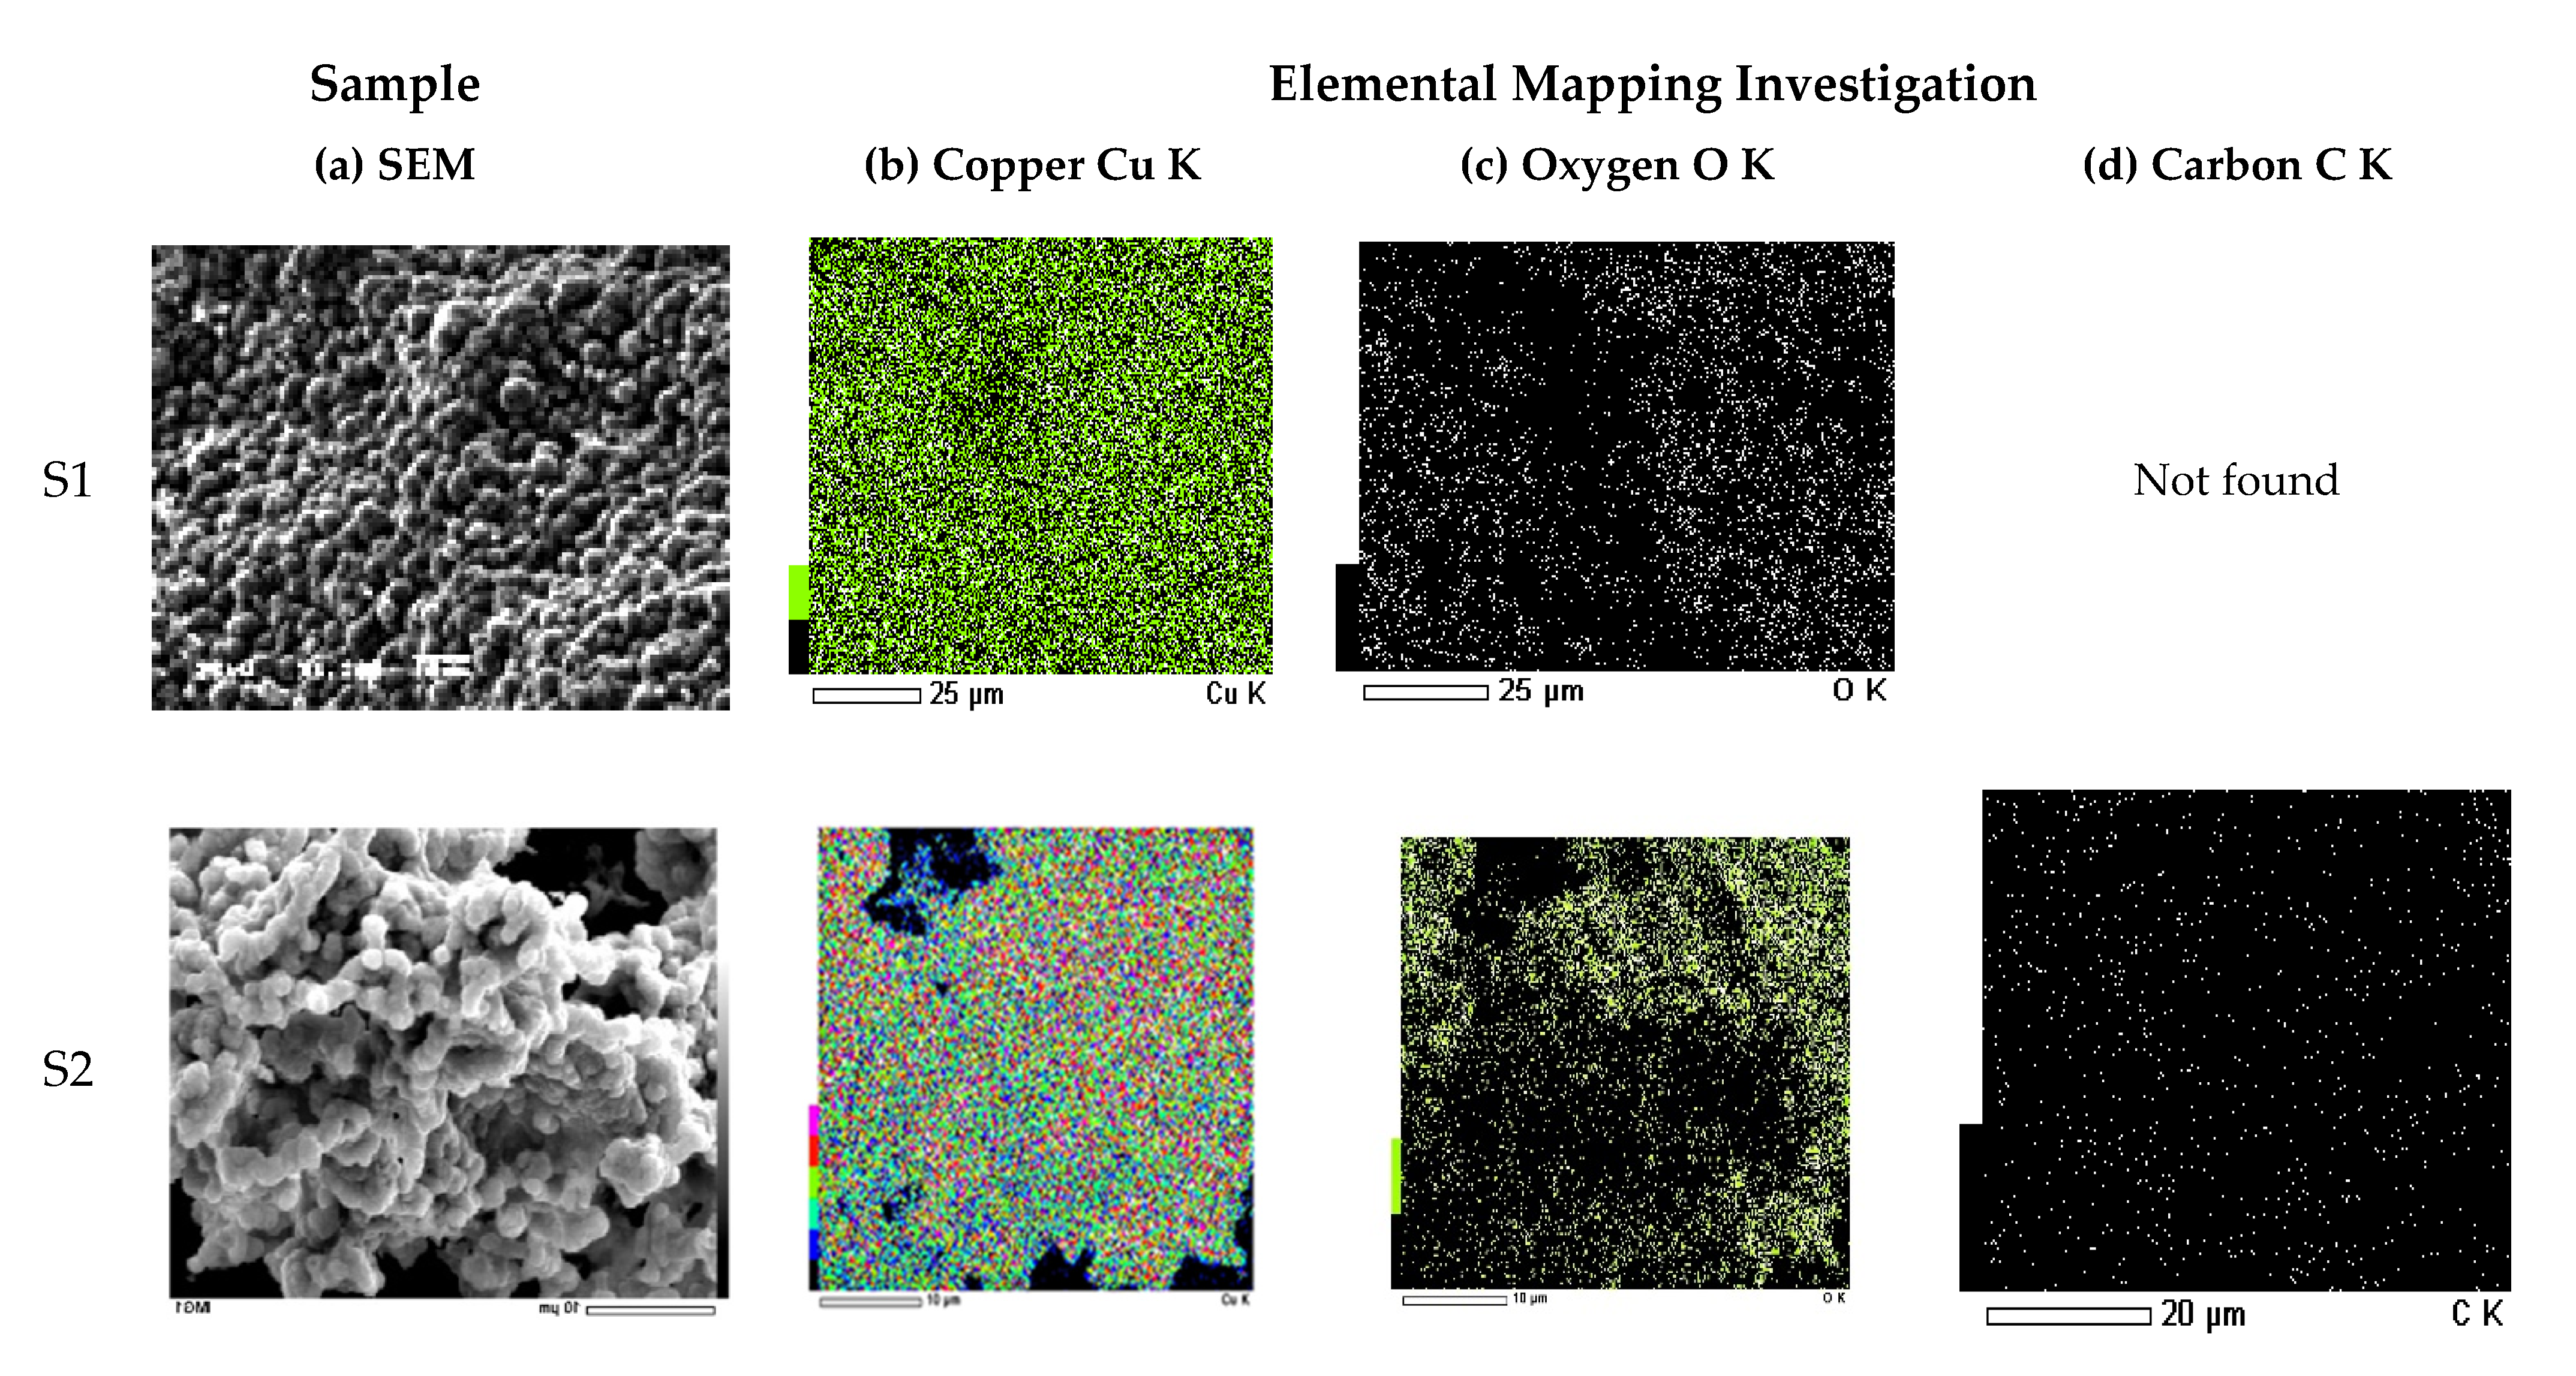
3.3. SEM/EDS and TEM Analyses
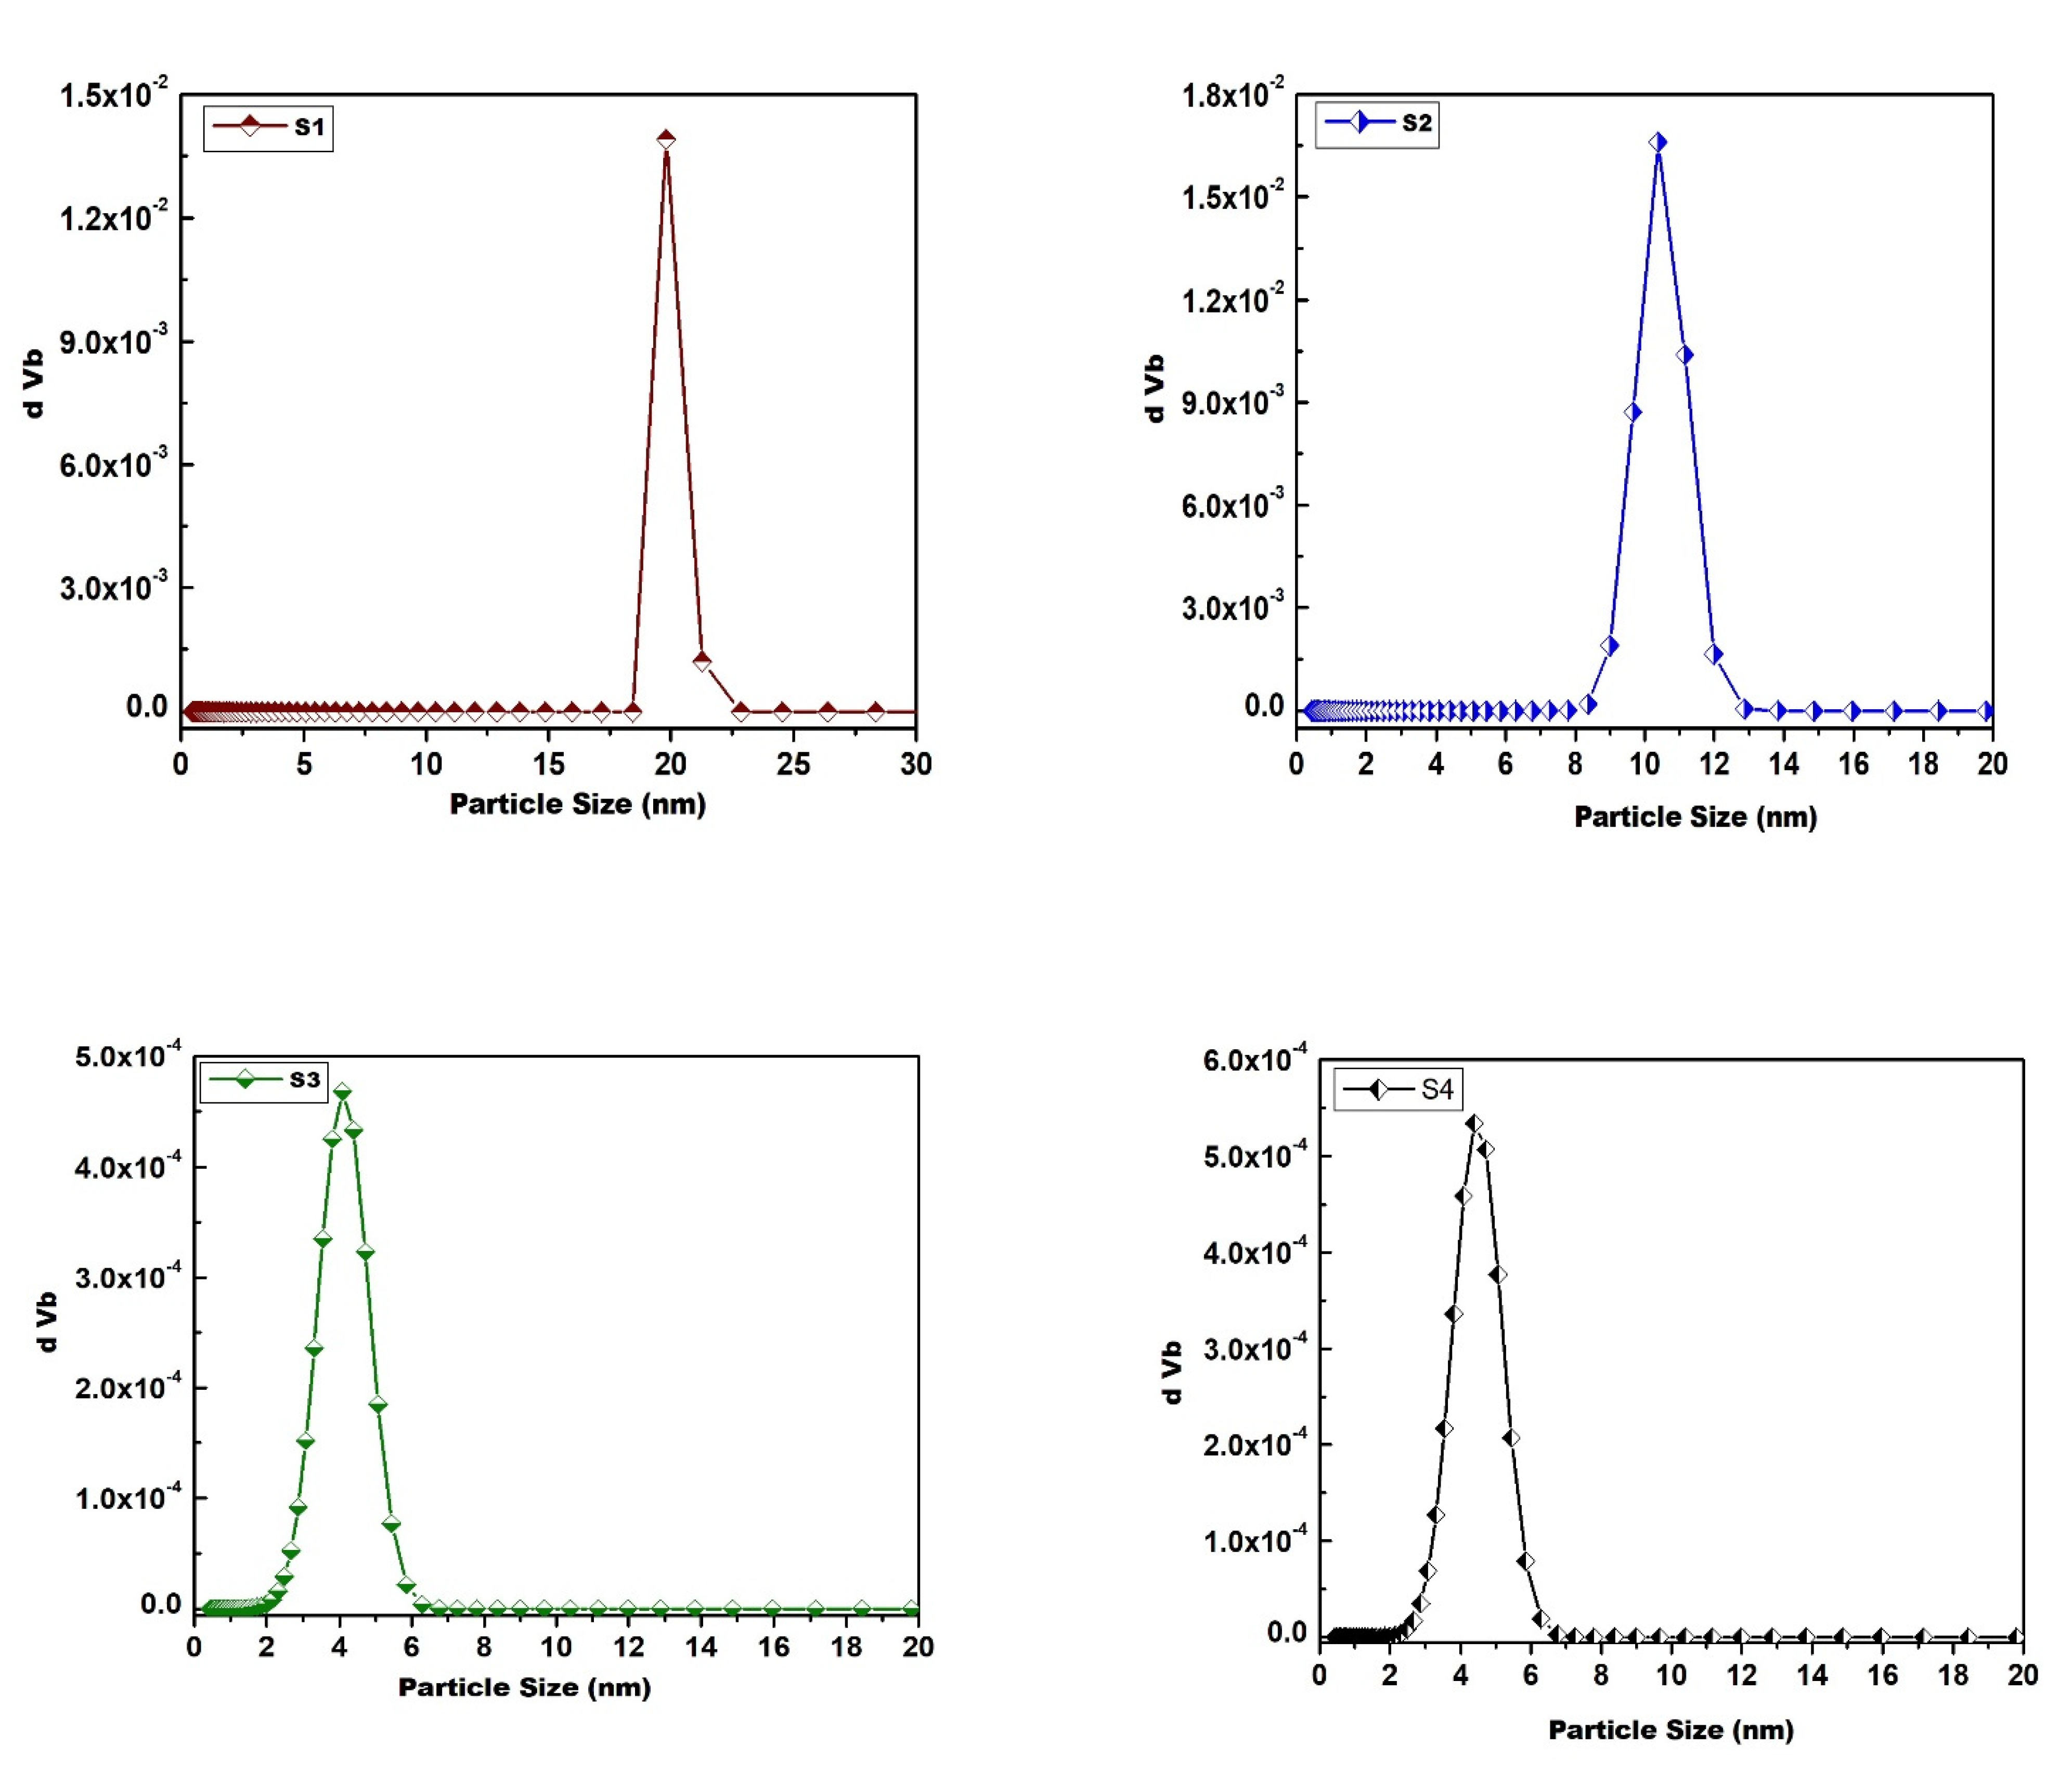
3.4. Surface Characteristics
3.5. Magnetic Properties
4. Discussion
4.1. Cu2O/CuO Nanocomposites
4.2. Cu2O/Cu Nanocomposite
5. Conclusions
- The egg white assisted auto-combustion route is a simple, cheap, and quick method to prepare Cu2O/Cu and Cu2O/CuO nanocomposites. Furthermore, for the synthesis of Cu2O/CuO nanoparticles without the use of any additives, this method has several advantages, including economic feasibility, ease of scale-up, shorter processing time, and environmental friendliness. The crystallite size of the final products was clearly affected when the egg content employed in the preparation procedure was changed. Different elements (CuO, Cu2O, and Cu) have crystallite sizes ranging from 32 to 51 nm, leading to nano phases. The dislocation, stress, and strain of various aspects of the final products were minimized when the amount of egg white was increased to 10 mL. In the case of the 15 mL egg white sample, the opposite behavior was observed.
- The characteristics IR bands of both CuO and Cu2O were observed with different intensities in the FTIR spectra of the S1, S2, and S3 samples. This indicates that these samples consisted of Cu2O/CuO composites. IR bands related CuO are not observed in the case of the S4 sample. The presence of carbon traces is confirmed by FTIR analysis, which is linked to an increase in the reduction process, which eventually leads to the formation of metallic copper, as shown in the S4 sample.
- The egg white assisted combustion method brought about copper-based materials containing nano particles with different shapes. The as-prepared particles have an average grain size of 38 nm. Due to the small amount of egg white used, semi-spherical particles with a sheet-like structure formed. The high egg white concentration resulted in the development of several spherical particles on surface of the condensed sheet.
- The surface properties of the produced solids were sensitive to structural and surface morphological changes. The surface area of the sample made with 5 mL of egg white is higher than that of the samples made with 0, 10, and 15 mL of egg white. The S1, S3, and S4 samples had smaller surface areas because the total pore volume of these samples was lower than the S2 sample. Furthermore, any contaminants will have an impact on the surface attributes. Indeed, due to pore bulking processes, the presence of an excess amount of carbon resulted in a decrease in the surface area of the as formed solids, particularly with the S4 sample.
- The magnetization of Cu2O/CuO and Cu2O/Cu nanocomposites is affected by the concentration of egg white. The Cu2O/Cu nanocomposites demonstrated higher coercivity, dislocation, stress, and strain than the Cu2O/CuO nanocomposites. When the concentration of egg white was increased throughout the preparation process, the particle size of Cu2O/CuO nanocomposites increased, and the magnetization decreased as the oxygen vacancies at the surface/or interface of the particles decreased. The presence of nonmagnetic material (metallic copper) in Cu2O/Cu nanocomposites could be attributed to a decrease in oxygen vacancies.
- The prepared composites are very important due to their various applications, such as catalytic materials, gas sensors, and magnetic storage media.
- This environmentally friendly approach of producing Cu2O/Cu and Cu2O/CuO nanoparticles could be applied to the production of other industrially important metal oxides in the future.
Author Contributions
Funding
Institutional Review Board Statement
Informed Consent Statement
Data Availability Statement
Acknowledgments
Conflicts of Interest
References
- Sankar, R.; Manikandan, P.; Malarvizhi, V.; Fathima, T.; Shivashangari, K.S.; Ravikumar, V. Green synthesis of colloidal copper oxide nanoparticles using Carica papaya and its application in photocatalytic dye degradation. Spectrochim. Acta Part A Mol. Biomol. Spectrosc. 2014, 121, 746–750. [Google Scholar] [CrossRef]
- George, M.; Britto, S.J. Biosynthesis, characterization, antimicrobial, antifungal and antioxidant activity of copper oxide nanoparticles (CONPS). Eur. J. Biomed. Pharma. Sci. 2014, 1, 199–210. [Google Scholar]
- Dhineshbabu, N.R.; Rajendran, V.; Nithyavathy, N.; Vetumperumal, R. Study of structural and optical properties of cupric oxide nanoparticles. Appl. Nanosci. 2016, 6, 933–939. [Google Scholar] [CrossRef] [Green Version]
- Iravani, S. Green synthesis of metal nanoparticles using plants. Green Chem. 2011, 13, 2638–2650. [Google Scholar] [CrossRef]
- Ren, G.; Hu, D.; Cheng, E.W.; Vargas-Reus, M.A.; Reip, P.; Allaker, R.P. Characterisation of copper oxide nanoparticles for antimicrobial applications. Int. J. Antimicrob. Agents 2009, 33, 587–590. [Google Scholar] [CrossRef]
- Yallappa, S.; Manjanna, J.; Sindhe, M.A.; Satyanarayan, N.D.; Pramod, S.N.; Nagaraja, K. Microwave assisted rapid synthesis and biological evaluation of stable copper nanoparticles using T. arjuna bark extract. Spectrochim. Acta Part A Mol. Biomol. Spectrosc. 2013, 110, 108–115. [Google Scholar] [CrossRef] [PubMed]
- Kwak, K.; Chongyoup, K. Viscosity and thermal conductivity of copper oxide nanofluid dispersed in ethylene glycol. Korea-Aust. Rheol. J. 2005, 17, 35–40. [Google Scholar]
- Stoimenov, P.K.; Rosalyn, L.; Klinger, L.; George, L.M.; Kenneth, J.K. Metal oxide nanoparticles as bactericidal agents. Langmuir 2002, 18, 6679–6686. [Google Scholar] [CrossRef]
- Diaz-Droguett, D.E.; Espinoza, R.; Fuenzalida, V.M. Copper nanoparticles grown under hydrogen: Study of the surface oxide. Appl. Surf. Sci. 2011, 257, 4597–4602. [Google Scholar] [CrossRef]
- Mortimer, M.; Kasemets, K.; Kahru, A. Toxicity of ZnO and CuO nanoparticles to ciliated protozoa Tetrahymena thermophile. Toxicology 2010, 269, 182–189. [Google Scholar] [CrossRef]
- Devaraj, M.; Saravanan, R.; Deivasigamani, R.; Vinod Kumar Gupta, V.K.; Gracia, F.; Jayadevan, S. Fabrication of novel shape Cu and Cu/Cu2O nanoparticles modified electrode for the determination of dopamine and paracetamol. J. Mol. Liq. 2016, 221, 930–941. [Google Scholar] [CrossRef]
- Zhang, Q.; Zhang, K.; Xu, D.; Yang, G.; Huang, H.; Nie, F.; Liu, C.; Yang, S. CuO nanostructures: Synthesis, characterization, growth mechanisms, fundamental properties, and applications. Prog. Mater. Sci. 2014, 60, 208–337. [Google Scholar] [CrossRef]
- Devi, A.B.; Moirangthem, D.S.; Talukdar, N.C.; Devi, M.D.; Singh, N.R.; Luwang, M.N. Novel synthesis and characterization of CuO nanomaterials: Biological applications. Chin. Chem. Lett. 2014, 25, 1615–1619. [Google Scholar] [CrossRef]
- Parveen, F.; Sannakki, B.; Mandke, M.V.; Pathan, H.M. Copper nanoparticles: Synthesis methods and its light harvesting performance. Sol. Energy Mater. Sol. Cells. 2016, 144, 371–382. [Google Scholar] [CrossRef]
- Lashanizadegan, M.; Erfaninia, K. Synthesis, characterization and catalytic property of CuO and Ag/CuO nanoparticles for the epoxidation of styrene. Korean J. Chem. Eng. 2013, 30, 2007–2011. [Google Scholar] [CrossRef]
- Suleiman, M.; Mousa, M.; Hussein, A.; Hammouti, B.; Hadda, T.B.; Warad, I. Copper (II)-oxide nanostructures: Synthesis, characterizations and their applications–review. J. Mater. Environ. Sci. 2013, 4, 792–797. [Google Scholar]
- Karunakaran, C.; Manikandan, G.; Gomathisankar, P. Microwave, sonochemical and combustion synthesized CuO nanostructures and their electrical and bactericidal properties. J. Alloys Compd. 2013, 580, 570–577. [Google Scholar] [CrossRef]
- Kumar, P.P.N.V.; Shameem, U.; Kollu, P.; Kalyani, R.L.; Pammi, V.N. Green synthesis of copper oxide nanoparticles using aloe vera leaf extract and its antibacterial activity against fish bacterial pathogens. BioNanoScience 2015, 5, 135–139. [Google Scholar] [CrossRef]
- Han, Z.D.; Wu, Z.; Wang, S.; Yang, S. Oriented Mn-doped CuO nanowire arrays. Nanotechnology 2016, 27, 135603–135610. [Google Scholar] [CrossRef] [Green Version]
- Yang, Y.; Xu, D.; Wu, Q.; Diao, P. Cu2O/CuO bilayered composite as a high-efficiency photocathode for photo electrochemical hydrogen evolution reaction. Sci. Rep. 2016, 6, 35158. [Google Scholar] [CrossRef] [Green Version]
- Han, J.; Zong, X.; Zhoua, X.; Li, C. Cu2O/CuO photocathode with improved stability for photoelectrochemical water reduction. RSC Adv. 2015, 5, 10790–10794. [Google Scholar] [CrossRef]
- Cullity, B.D. Elements of X-ray Diffraction; Addison-Wesly Publishing Co. Inc.: Singapore, 1976; Chapter 14. [Google Scholar]
- Shaltout, A.A.; Abd-Elkader, O.H. The role of gas direction in a modified Grimm-type glow discharge for controlling the degree of crystallinity in brass alloy thin films. Vacuum 2015, 121, 105–112. [Google Scholar] [CrossRef]
- Abd-Elkader, O.H.; Deraz, N.M. Synthesis and characterization of new copper based nanocomposite. Int. J. Electrochem. Sci. 2013, 8, 8614–8622. [Google Scholar]
- Boultif, A.; Louer, D. Powder pattern indexing with the dichotomy method. J. Appl. Cryst. 2004, 37, 724–731. [Google Scholar] [CrossRef]
- Dubal, D.; Dhawale, D.S.; Salunkhe, R.; Jamdade, V.; Lokhande, C.D. Fabrication of copper oxide multilayer nanosheets for supercapacitor application. J. Alloys Compd. 2010, 492, 26–30. [Google Scholar] [CrossRef]
- Ethiraj, A.S.; Kang, D.J. Synthesis and characterization of CuO nanowires by a simple wet chemical method. Nanoscale Res. Lett. 2012, 7, 70–75. [Google Scholar] [CrossRef] [Green Version]
- Alhumaimess, M.S.; Essawy, A.A.; Kamel, M.M.; Alsohaimi, I.H.; Hassan, H.M.A. Biogenic-mediated synthesis of mesoporous Cu2O/CuO nano-architectures of superior catalytic reductive towards nitroaromatics. Nanomaterials 2020, 10, 781. [Google Scholar] [CrossRef] [Green Version]
- Kumar, B.; Smita, K.; Debut, A.; Cumbal, L. Andean sacha inchi (Plukenetia Volubilis L.) leaf-mediated synthesis of Cu2O Nanoparticles:a low-cost approach. Bioengineering 2020, 7, 54. [Google Scholar] [CrossRef]
- Nie, L.; Yu, J.; Li, X.; Cheng, B.; Liu, G.; Jaroniec, M. Enhanced performance of Na OH-modified Pt/TiO2 toward room temperature selective oxidation of formaldehyde. Environ. Sci. Technol. 2013, 47, 2777–2783. [Google Scholar] [CrossRef]
- Sing, K.S.W. Reporting physisorption data for gas/solid systems with special reference to the determination of surface area and porosity (Provisional). Pure Appl. Chem. 1982, 54, 2201–2218. [Google Scholar] [CrossRef]
- Pitike, K.C.; Marquez-Rossy, A.E.; Flores-Betancourt, A.; Chen, D.; Santosh, K.; Cooper, V.R.; Lara-Curzio, E. On the elastic anisotropy of the entropy-stabilized oxide (Mg, Co, Ni, Cu, Zn)O compound. J. Appl. Phys. 2020, 128. [Google Scholar] [CrossRef]
- Lai, B.H.; Yeh, C.C.; Chen, D.H. Surface modification of iron oxide nanoparticles with polyarginine as a highly positively charged magnetic nano-adsorbent for fast and effective recovery of acid proteins. Process Biochem. 2012, 47, 99–105. [Google Scholar] [CrossRef]
- Al-Senani, G.M.; Deraz, N.M.; Abd-Elkader, O.H. Magnetic and characterization studies of Co/Co3O4 nanocomposite. Processes 2020, 8, 844. [Google Scholar] [CrossRef]
- Al-Senani, G.M.; Abd-Elkader, O.H.; Al-Kadhi, N.S.; Deraz, N.M. Effect of the glycine treatment on synthesis and physicochemical characterization of nanosized Ni-Mn mixed oxides. Crystals 2021, 11, 487. [Google Scholar] [CrossRef]
- Deraz, N.M.; Shaban, S. Optimization of catalytic, surface and magnetic properties of nanocrystalline manganese ferrite. J. Anal. Appl. Pyrolysis 2009, 86, 173–179. [Google Scholar] [CrossRef]
- Arbuzova, T.I.; Smolyak, I.B.; Naumov, S.V.; Samokhvalov, A.A. Effect of doping on the magnetic properties of the low-dimensional antiferromagnet CuO. Phys. Solid State 1998, 40, 1702–1705. [Google Scholar] [CrossRef]
- Muraleedharan, K.; Subramaniam, C.K.; Venkataramani, N.; Rao, G.T.K.; Srivastava, C.M.; Sankaranarayan, V.; Srinivasan, R. On the magnetic susceptibility of CuOx. Solid State Commun. 1990, 76, 727–730. [Google Scholar] [CrossRef]
- Punnoose, A.; Magnone, H.; Seehra, M.S.; Bonevich, J. Bulk to nanoscale magnetism and exchange bias in CuO nanoparticles. Phys. Rev. B Condens. Matter 2001, 64, 1–8. [Google Scholar] [CrossRef]
- Gao, D.; Zhang, J.; Zhu, J.; Qi, J.; Zhang, Z.; Sui, W.; Shi, H.; Xue, D. Vacancy-mediated magnetism in pure copper oxide nanoparticles. Nanoscale Res. Lett. 2010, 5, 769–772. [Google Scholar] [CrossRef] [Green Version]
- Gao, D.; Yang, Z.; Zhang, J.; Yang, G.; Zhu, Z.; Qi, J.; Si, M.; Xue, D. Transforming from paramagnetism to room temperature ferromagnetism in CuO by ball milling. AIP Adv. 2011, 1. [Google Scholar] [CrossRef] [Green Version]
- White, J.S.; Bator, M.; Hu, Y.; Luetkens, H.; Stahn, J.; Capelli, S.; Das, S.; Döbeli, M.; Lippert, T.; Malik, V.K.; et al. Strain-induced ferromagnetism in antiferromagnetic LuMnO3 thin films. Phys. Rev. Lett. 2013, 111. [Google Scholar] [CrossRef] [Green Version]
- Sun, H.Y.; Zhang, H.M.; Hou, X.; Liu, L.H.; Wu, T.S.; Yang, S.M. Significant room temperature ferromagnetism in PAA thin films. J. Mater. Chem. C 2013, 1, 3569–3572. [Google Scholar] [CrossRef]
- Hu, L.; Huang, J.; He, H.; Zhu, L.; Liu, S.; Jin, Y.; Sun, L.; Ye, Z. Dual-donor (Zni and VO) mediated ferromagnetism in copper-doped ZnO micron-scale polycrystalline films: A thermally driven defect modulation process. Nanoscale 2013, 5, 3918–3930. [Google Scholar] [CrossRef]
- Gao, D.; Zhang, Z.; Xu, Q.; Zhang, J.; Yan, Z.; Yao, J.; Xue, D. Room temperature ferromagnetism in CuO/Cu2O microspheres: Towards interface effect. Appl. Phys. Lett. 2014, 104. [Google Scholar] [CrossRef]
- Herng, T.S.; Qi, D.C.; Berlijn, T.; Yi, J.B.; Yang, K.S.; Dai, Y.; Feng, Y.P.; Santoso, I.; Sánchez-Hanke, C.; Gao, X.Y.; et al. Room-temperature ferromagnetism of Cu-Doped ZnO Films probed by soft X-ray magnetic circular dichroism. Phys. Rev. Lett. 2010, 105. [Google Scholar] [CrossRef] [Green Version]
- Samokhvalov, A.A.; Arbusova, T.I.; Viglin, N.A.; Naumov, S.V.; Galakhov, V.R.; Zatsepin, D.A.; Kotov, Y.A.; Samatov, O.M.; Kleshchev, D.G. Paramagnetism in copper monoxide systems. Phys. Solid State. 1998, 40, 268–271. [Google Scholar] [CrossRef]


| Crystal Parameters | a (Å) | b (Å) | C (Å) | α (°) | β (°) | γ (°) | Volume (Å3) | Density (g/cm3) | Space Group | Phases |
|---|---|---|---|---|---|---|---|---|---|---|
| S1 | 5.1274 | 3.4231 | 4.6775 | 90.05 | 99.50 | 89.89 | 80.9717 | 6.499 | Monoclinic Cc [9] | CuO (PDF 801917) |
| 4.2667 | 4.2667 | 4.2667 | 90 | 90 | 90 | 77.67 | 6.117 | Cubic Pn3m [224] | Cu2O (PDF 782026) | |
| S2 | 4.6897 | 3.4289 | 5.1350 | 90 | 99.5 | 90 | 81.4409 | 6.507 | Monoclinic C2/c [15] | CuO (PDF 801917) |
| 4.2594 | 4.2594 | 4.2594 | 90 | 90 | 90 | 77.276 | 6.156 | Cubic Pn3m [224] | Cu2O (PDF 782026) | |
| S3 | 4.6897 | 3.4287 | 5.1343 | 90 | 99.5 | 90 | 81.3782 | 6.507 | Monoclinic C2/c [15] | CuO (PDF 801917) |
| 4.2605 | 4.2605 | 4.2605 | 90 | 90 | 90 | 77.330 | 6.156 | Cubic Pn3m [224] | Cu2O (PDF 782026) | |
| S4 | 8.9096 | 8.9096 | 8.9096 | 90 | 90 | 90 | 70.725 | 8.935 | Cubic Fm3m [225] | Cu (PDF 050667) |
| 4.2556 | 4.2556 | 4.2556 | 90 | 90 | 90 | 77.060 | 6.156 | Cubic Pn3m [224] | CuO (PDF 801917) |
| Sample | Crystallite Size (nm) | δ (Lines/nm2) | ε | σ (N/m2) | Phases |
|---|---|---|---|---|---|
| S1 | 38.494868 | 6.75 × 10⁻⁴ | 9.00 × 10⁻⁴ | 0.117 | CuO (PDF 801917) |
| 38.505532 | 6.74 × 10⁻⁴ | 9.00 × 10⁻⁴ | 0.176 | Cu2O (PDF 782026) | |
| S2 | 25.876072 | 1.49 × 10⁻³ | 1.34 × 10⁻³ | 0.1742 | CuO (PDF 801917) |
| 41.395075 | 5.84 × 10⁻⁴ | 8.37 × 10⁻⁴ | 0.1029 | Cu2O (PDF782026) | |
| S3 | 51.134580 | 3.82 × 10⁻⁴ | 6.78 × 10⁻⁴ | 0.08814 | CuO (PDF 801917) |
| 50.978162 | 3.85 × 10⁻⁴ | 6.80 × 10⁻⁴ | 0.08364 | Cu2O (PDF 782026) | |
| S4 | 32.006909 | 9.76 × 10⁻⁴ | 1.08 × 10⁻³ | 0.13284 | Cu2O (PDF 782026) |
| 23.610946 | 1.79 × 10⁻³ | 1.47 × 10⁻³ | 0.19551 | Cu (PDF 050667) |
| Samples | SBET (m2/g) | Vm (cc/g) | Vp (cc/g) | ȓ (nm) |
|---|---|---|---|---|
| S1 | 1.9923 | 0.4418 | 0.01367 | 28.430 |
| S2 | 10.392 | 2.388 | 0.04552 | 17.430 |
| S3 | 2.2995 | 0.5283 | 0.00327 | 5.6938 |
| S4 | 2.5369 | 0.5829 | 0.0036 | 5.6149 |
| Samples | Ms (emu/g) | Mr (emu/g) | Mr/Ms (emu/g) | Hc (Oe) |
|---|---|---|---|---|
| S1 | 0.0092 | 0.000094 | 0.10117 | 171 |
| S2 | 0.0031 | 0.00045 | 0.1452 | 24 |
| S3 | 0.0085 | 0.0021 | 0.2471 | 220 |
| S4 | 0.0095 | 0.0049 | 0.5158 | 38 |
Publisher’s Note: MDPI stays neutral with regard to jurisdictional claims in published maps and institutional affiliations. |
© 2021 by the authors. Licensee MDPI, Basel, Switzerland. This article is an open access article distributed under the terms and conditions of the Creative Commons Attribution (CC BY) license (https://creativecommons.org/licenses/by/4.0/).
Share and Cite
Al-Saeedi, S.I.; Al-Senani, G.M.; Abd-Elkader, O.H.; Deraz, N.M. One Pot Synthesis, Surface and Magnetic Properties of Cu2O/Cu and Cu2O/CuO Nanocomposites. Crystals 2021, 11, 751. https://doi.org/10.3390/cryst11070751
Al-Saeedi SI, Al-Senani GM, Abd-Elkader OH, Deraz NM. One Pot Synthesis, Surface and Magnetic Properties of Cu2O/Cu and Cu2O/CuO Nanocomposites. Crystals. 2021; 11(7):751. https://doi.org/10.3390/cryst11070751
Chicago/Turabian StyleAl-Saeedi, Sameerah I., Ghadah M. Al-Senani, Omar H. Abd-Elkader, and Nasrallah M. Deraz. 2021. "One Pot Synthesis, Surface and Magnetic Properties of Cu2O/Cu and Cu2O/CuO Nanocomposites" Crystals 11, no. 7: 751. https://doi.org/10.3390/cryst11070751