
In-Situ XRD Study of Phase Transformation Kinetics in a Co-Cr-W-Alloy Manufactured by Laser Powder-Bed Fusion


Abstract
:1. Introduction
2. Materials and Methods
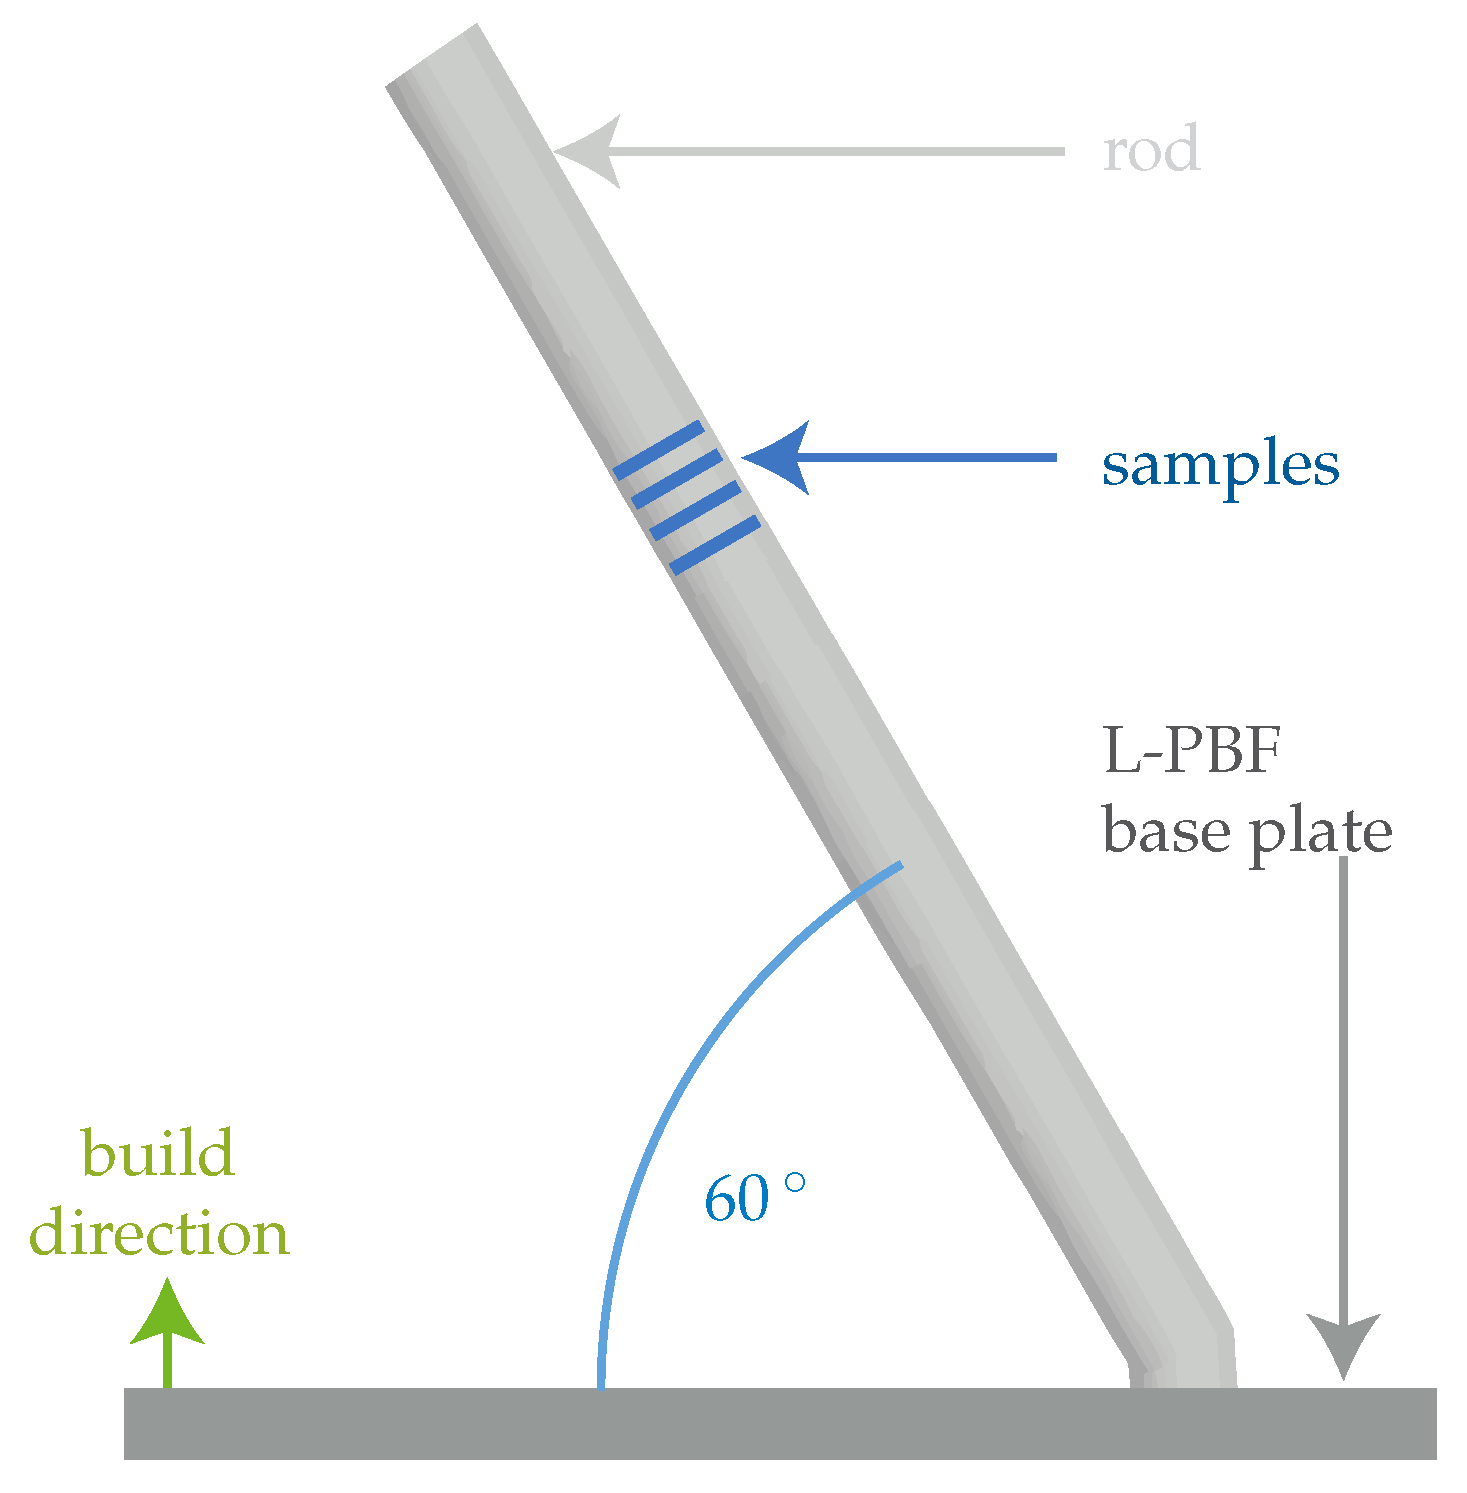
2.1. Sample Preparation
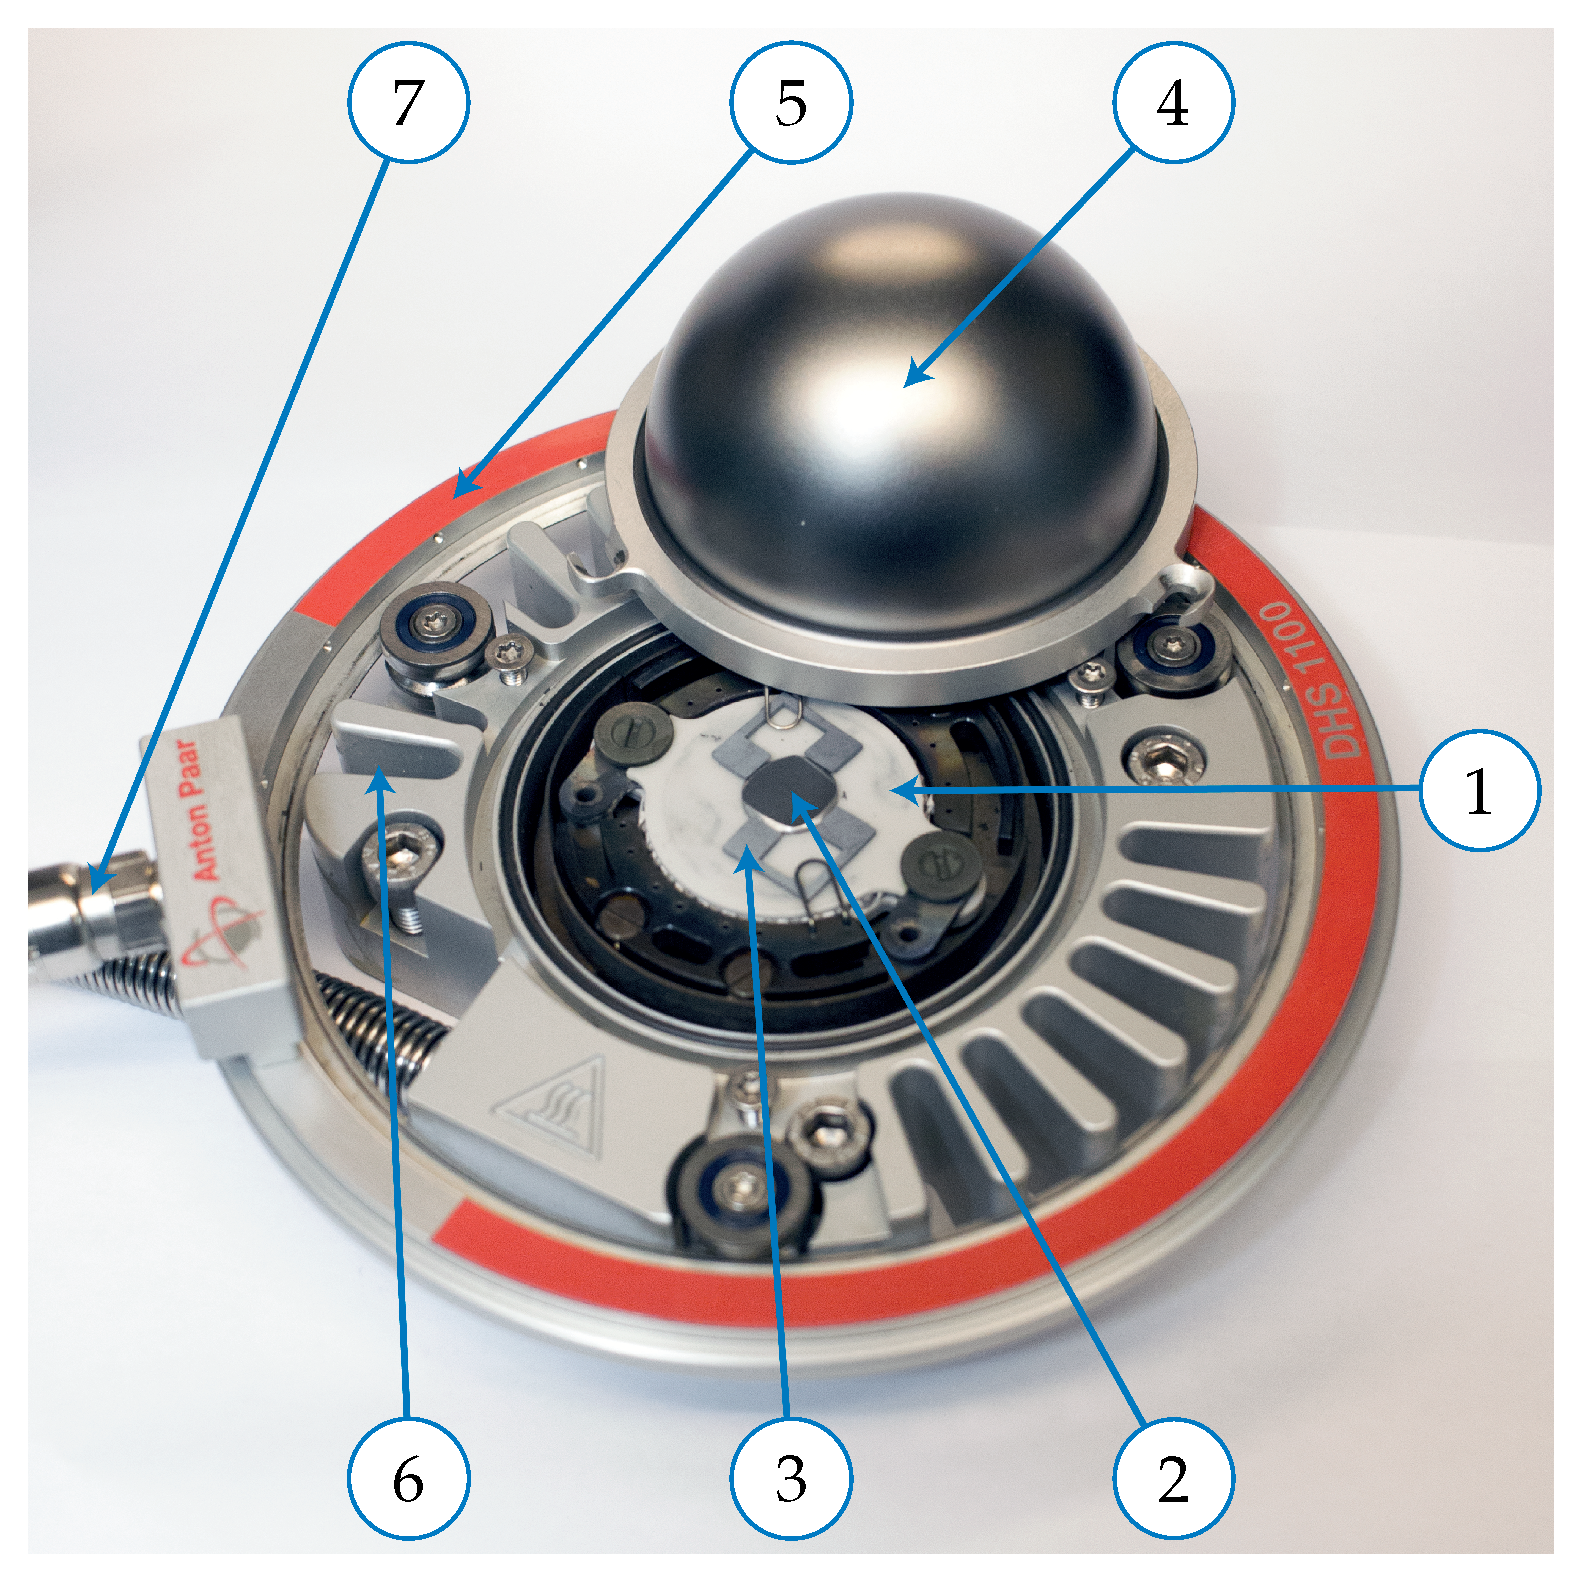
2.2. Heat Treatment and Hot Stage
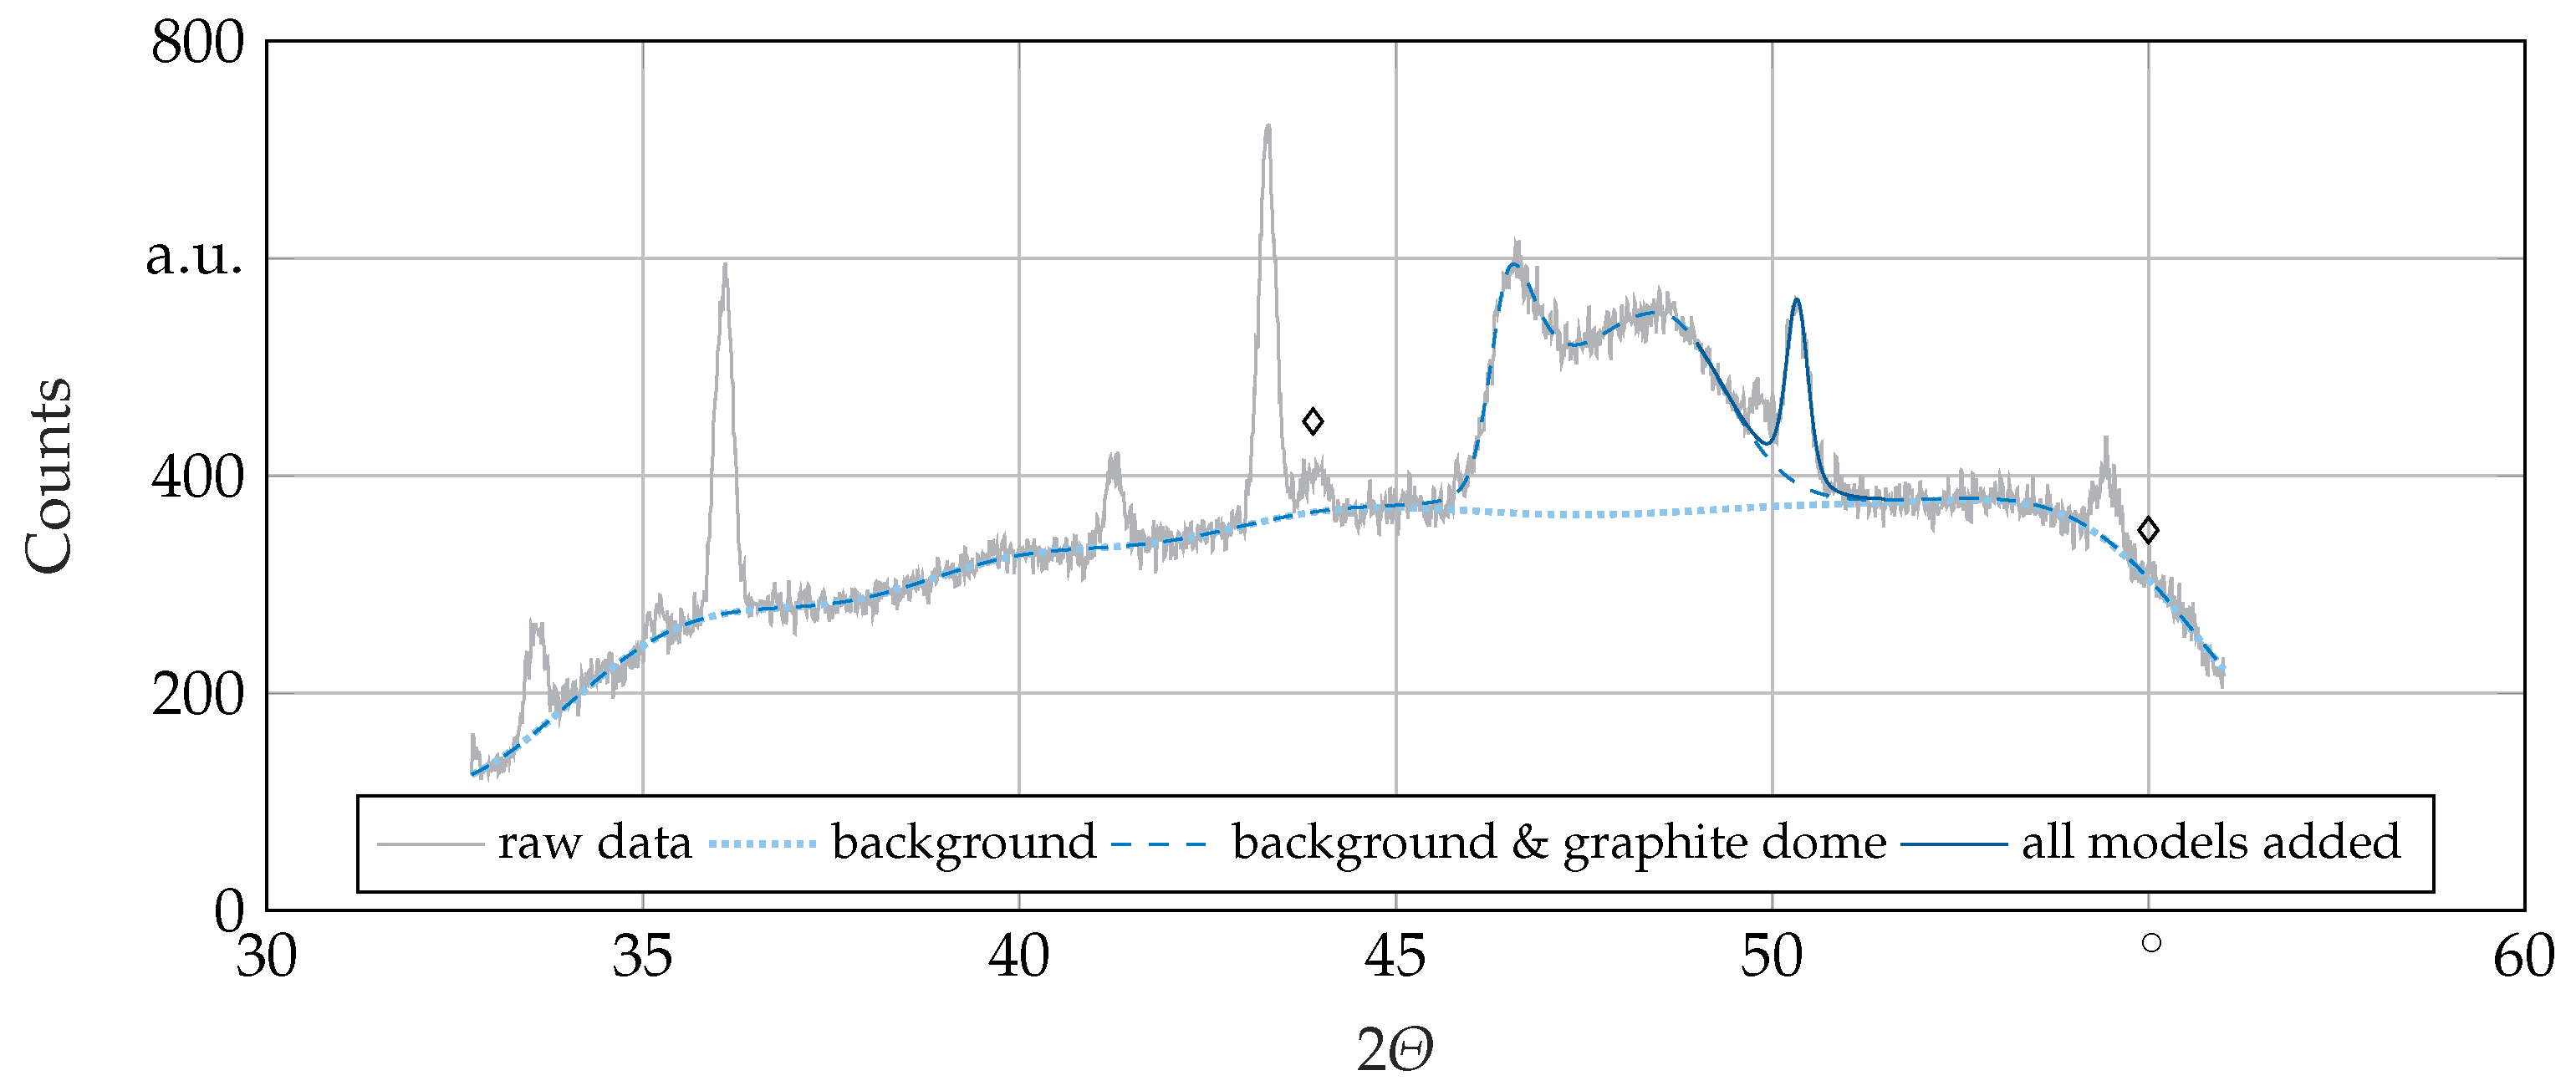
2.3. XRD
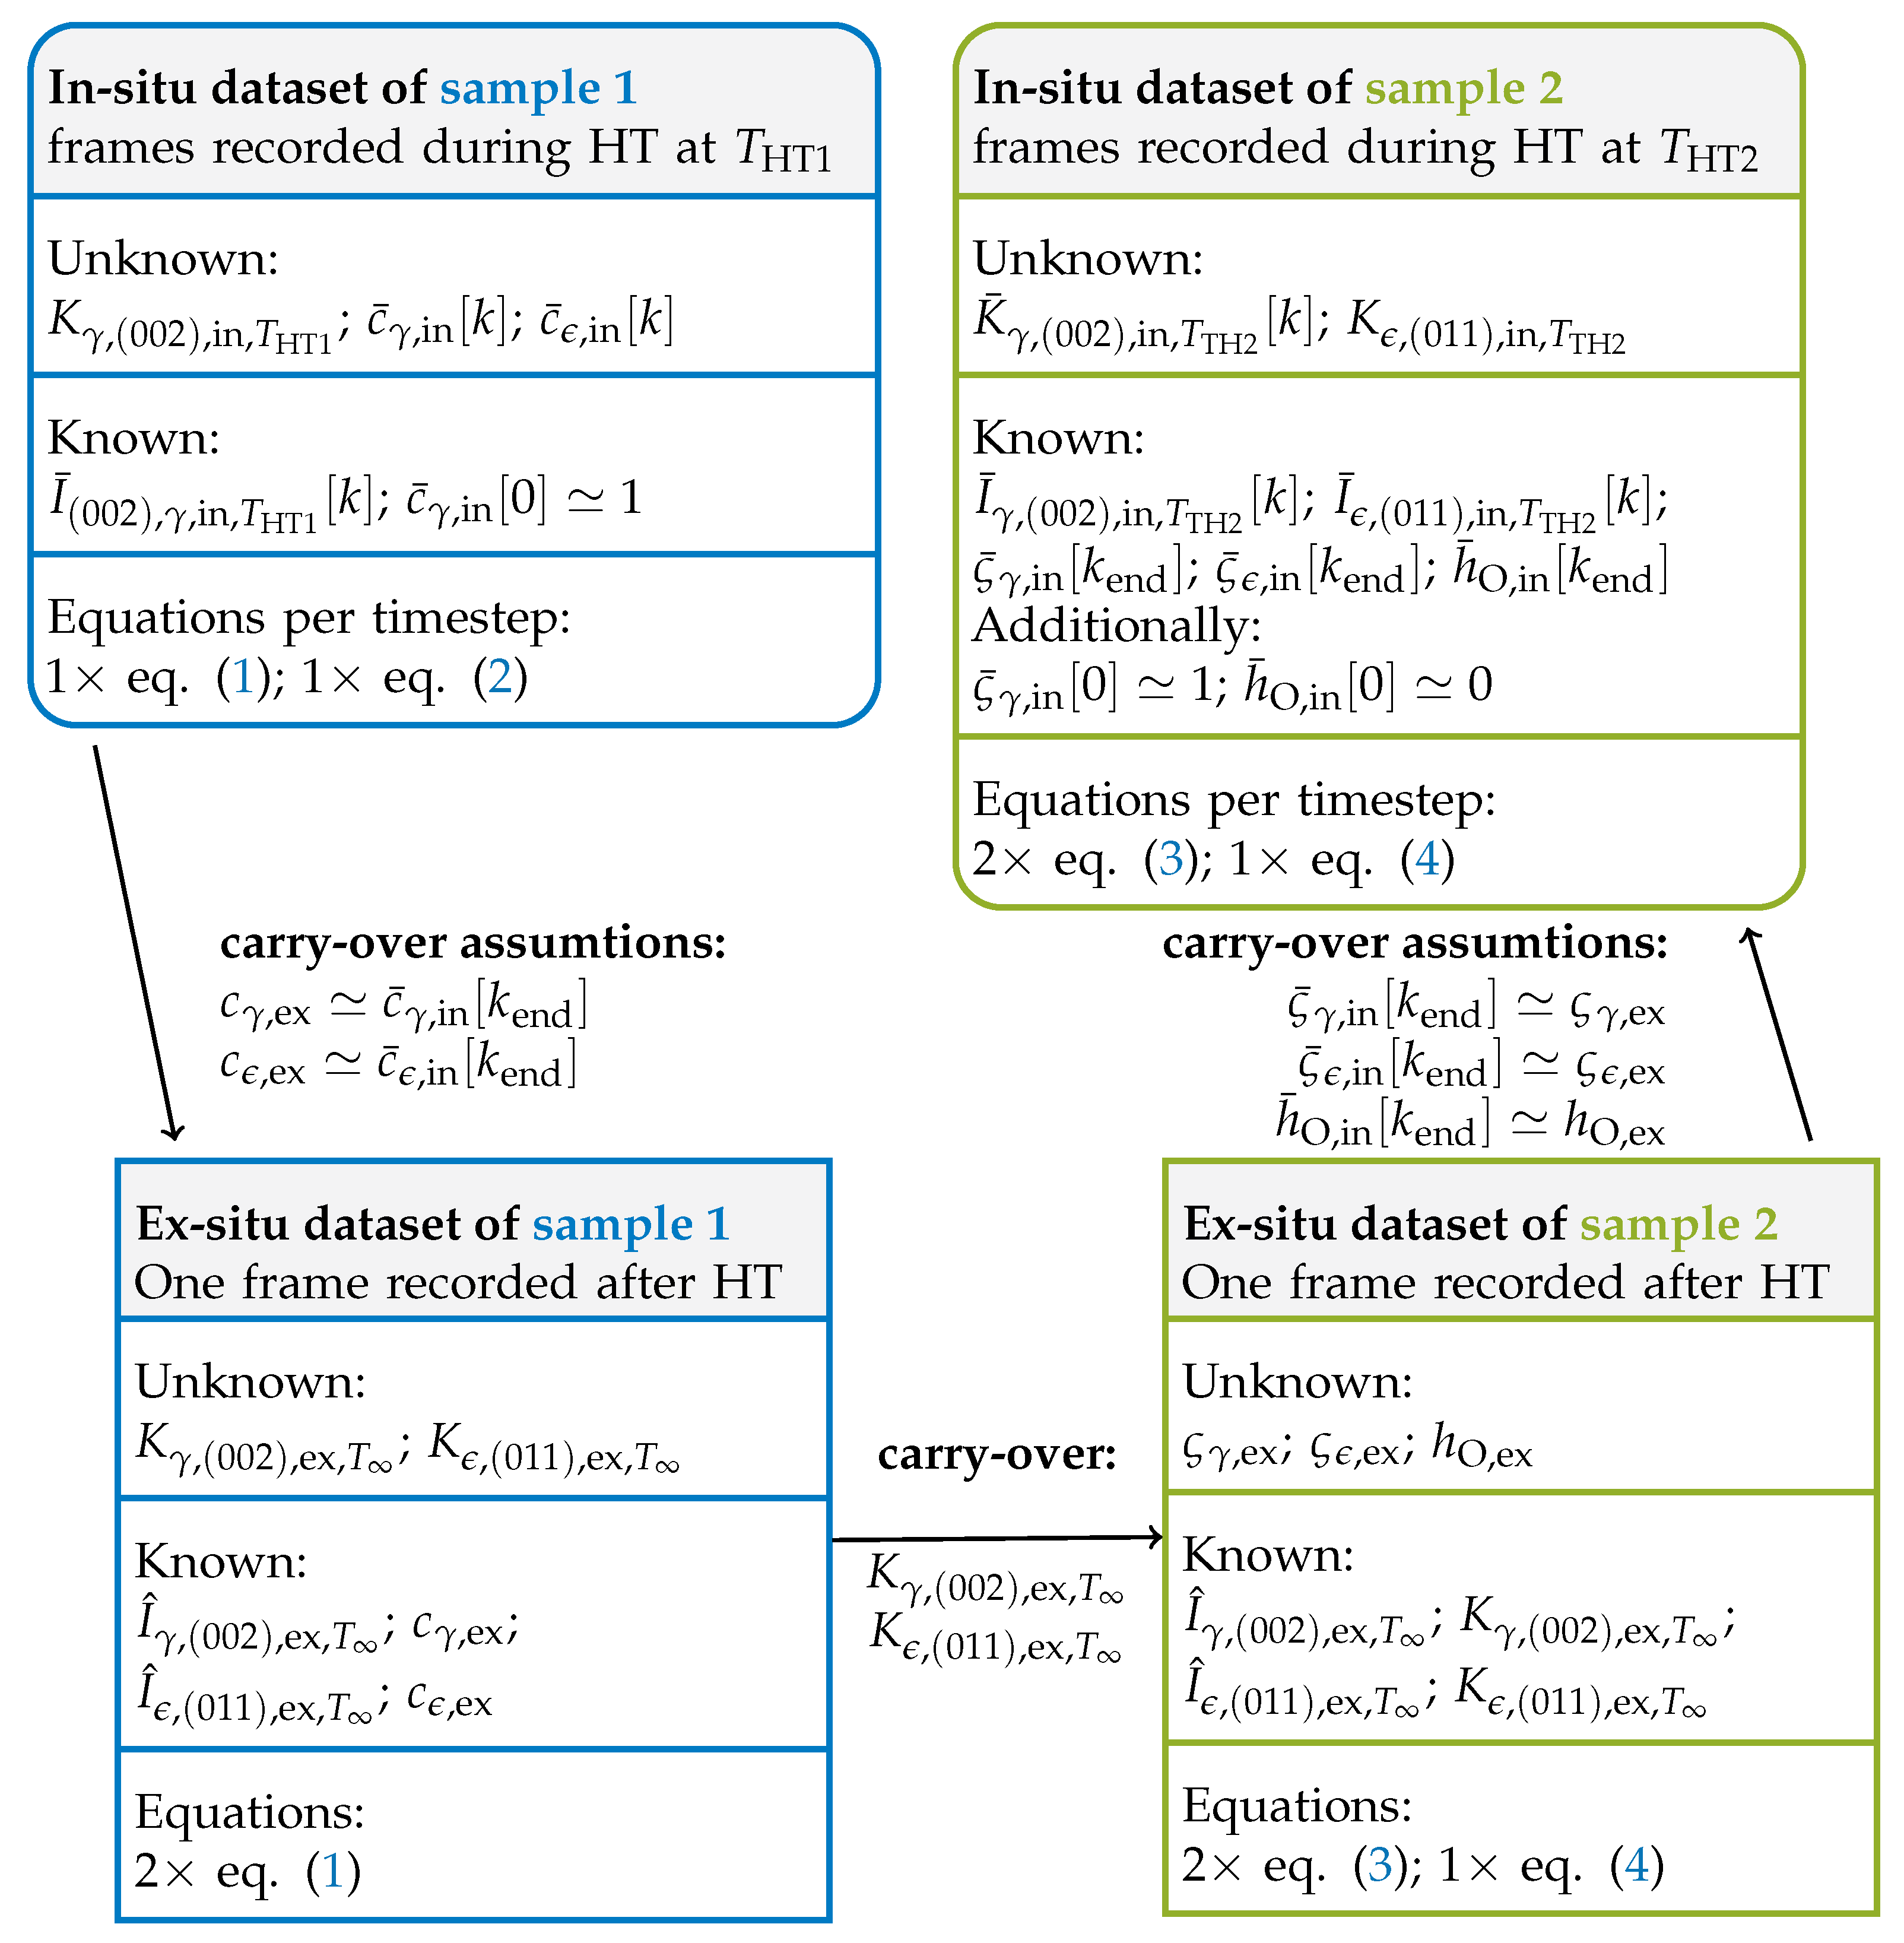
2.4. QXRD
2.5. SEM
3. Results
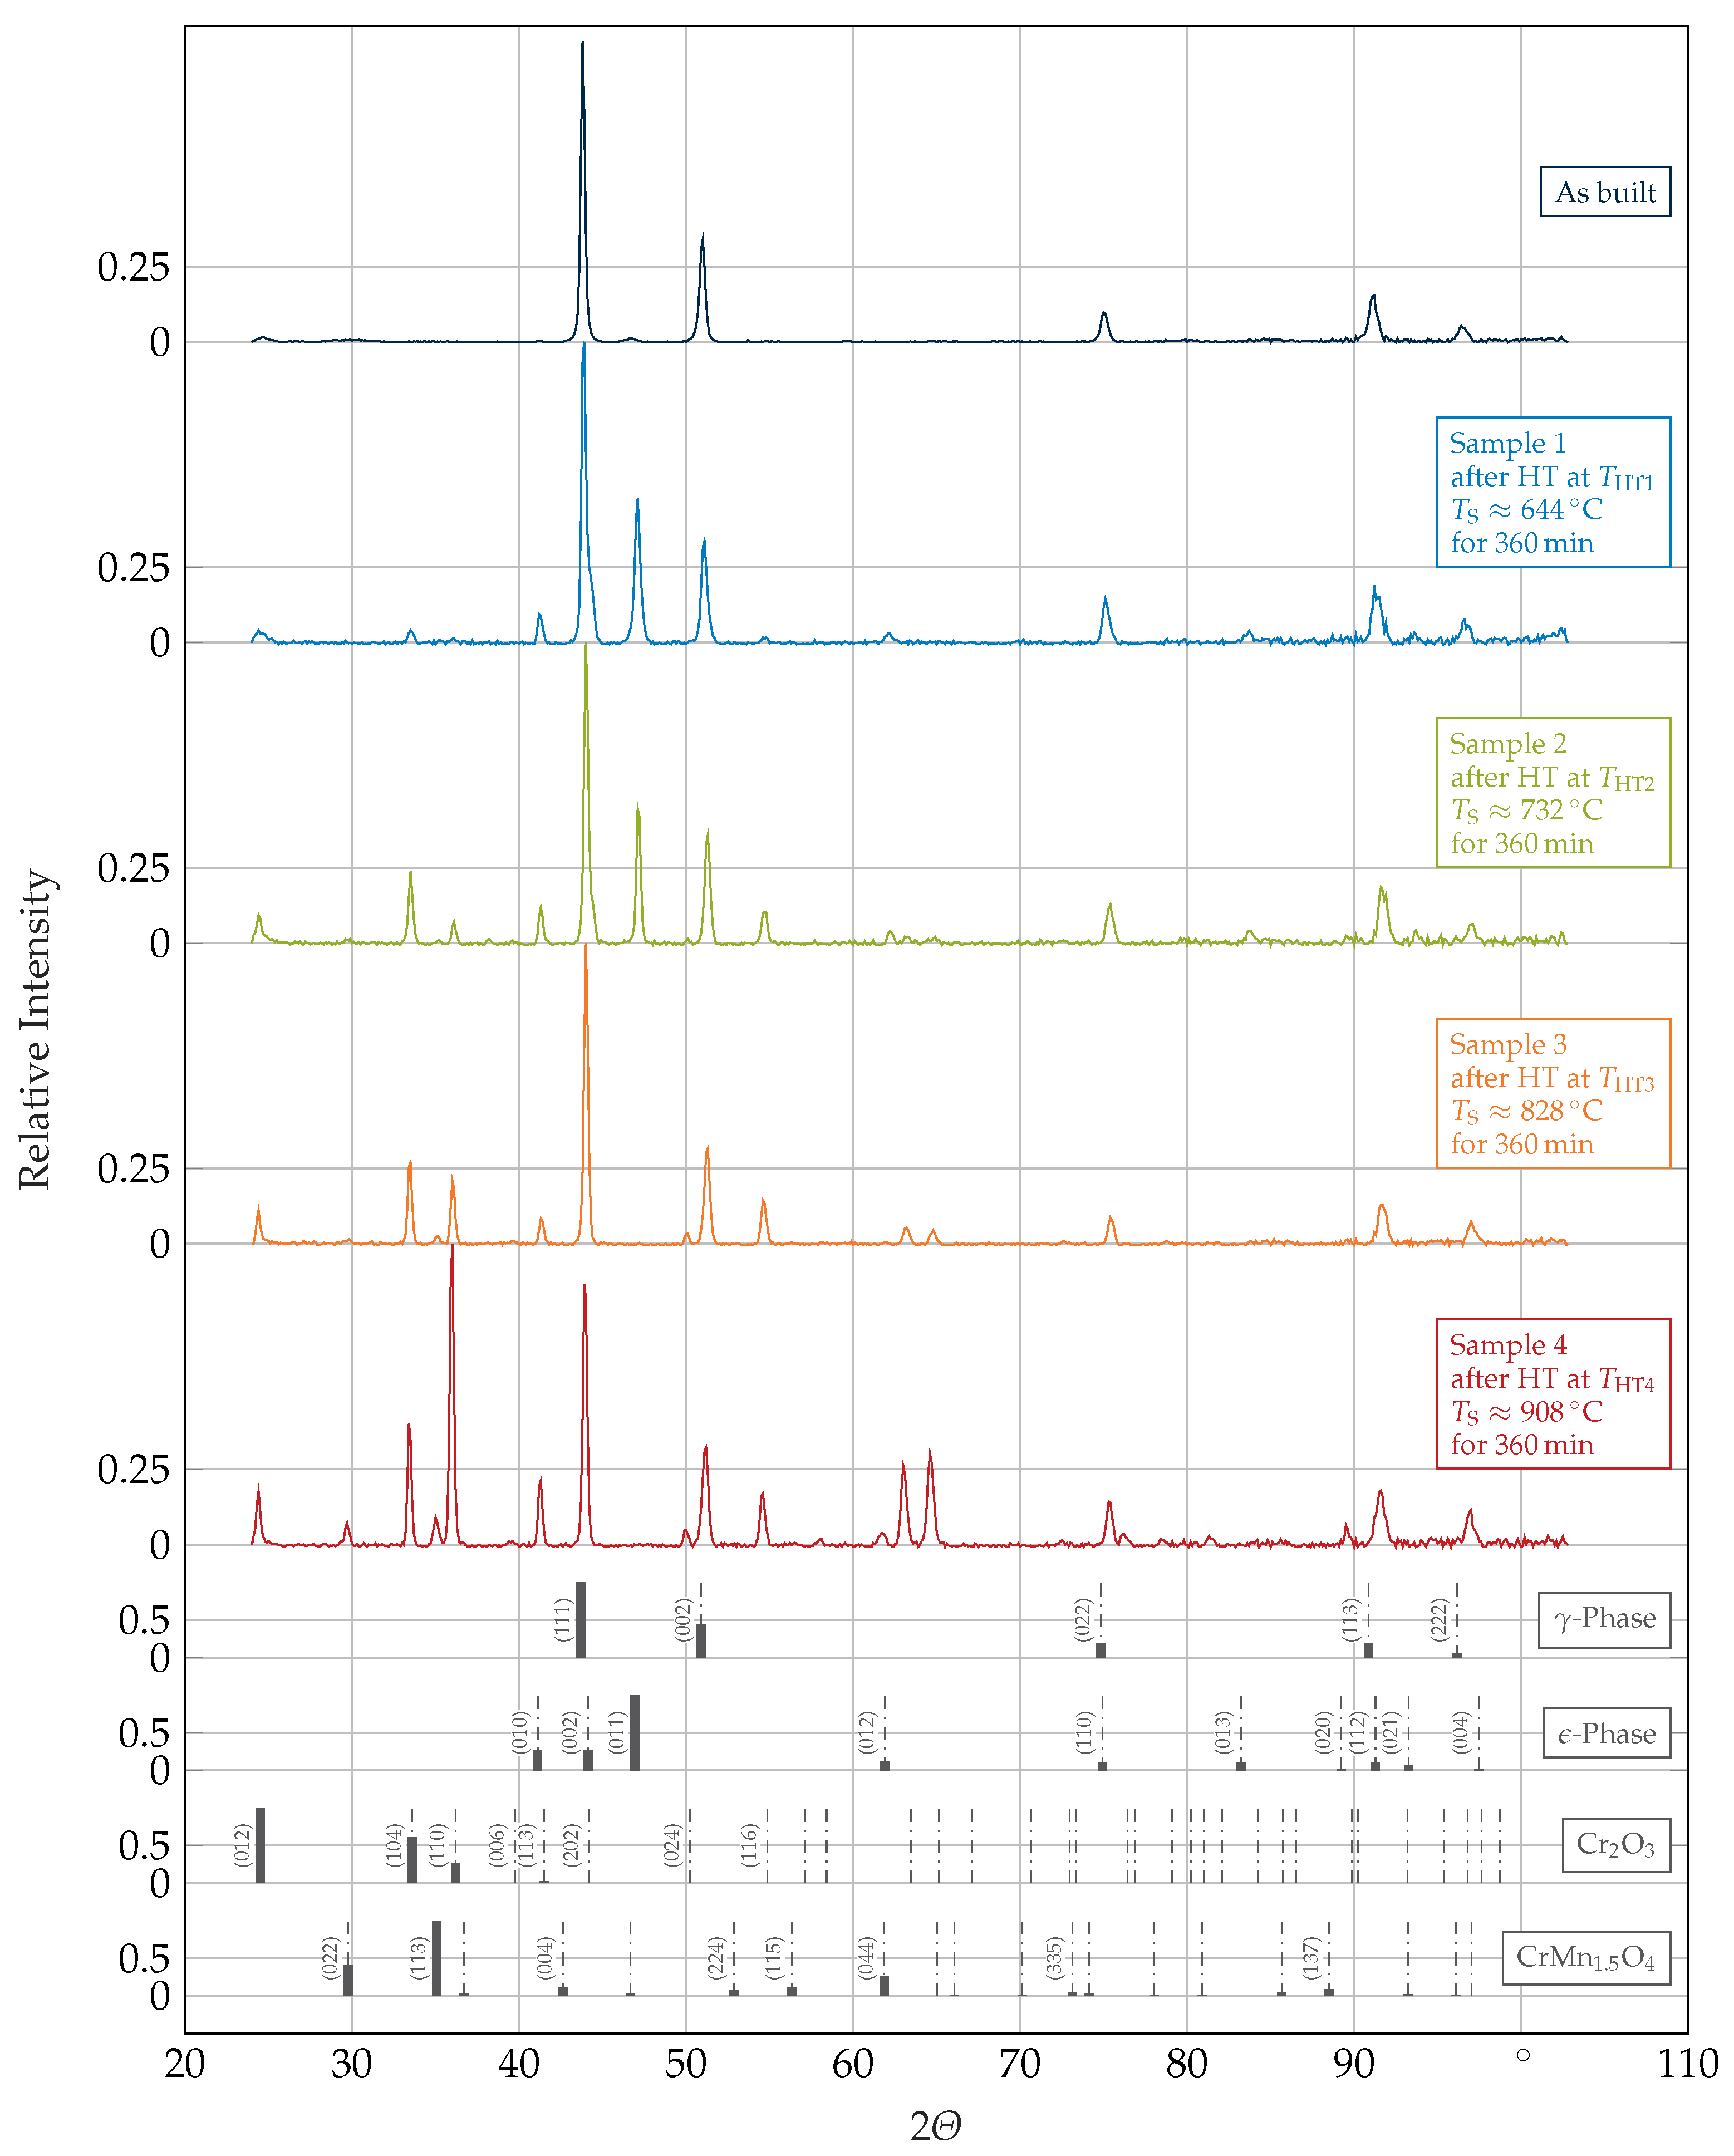
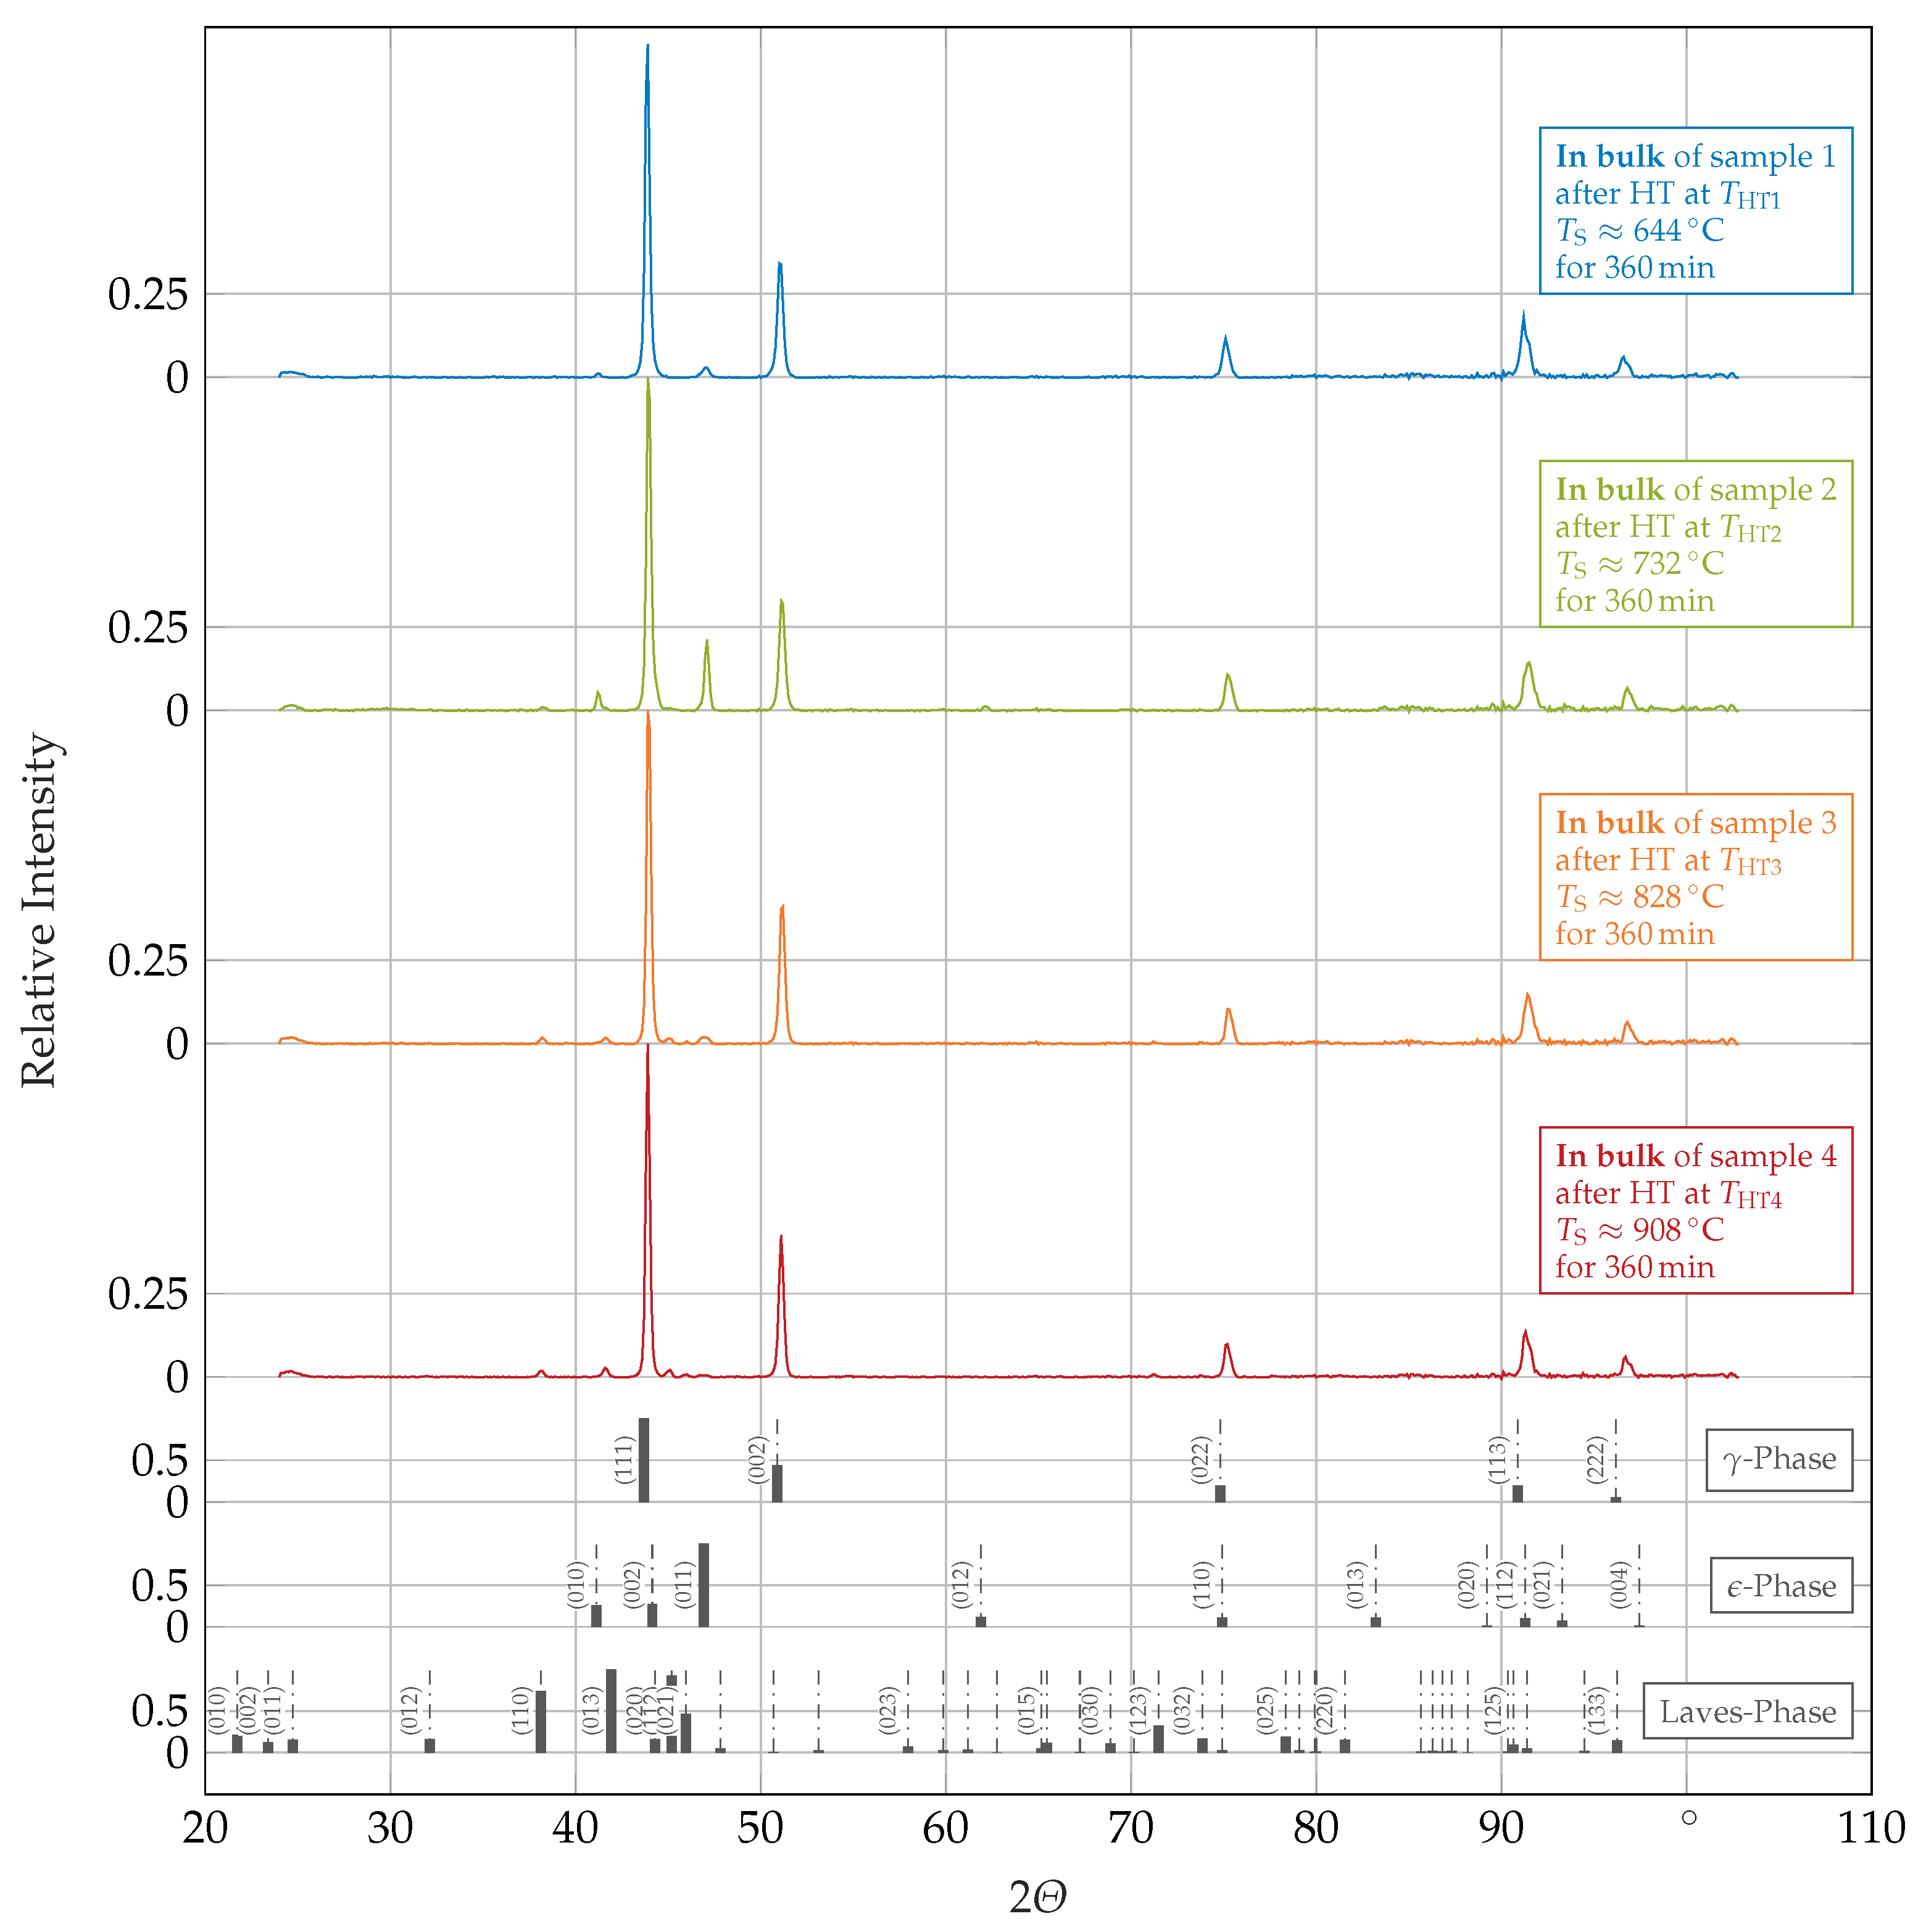
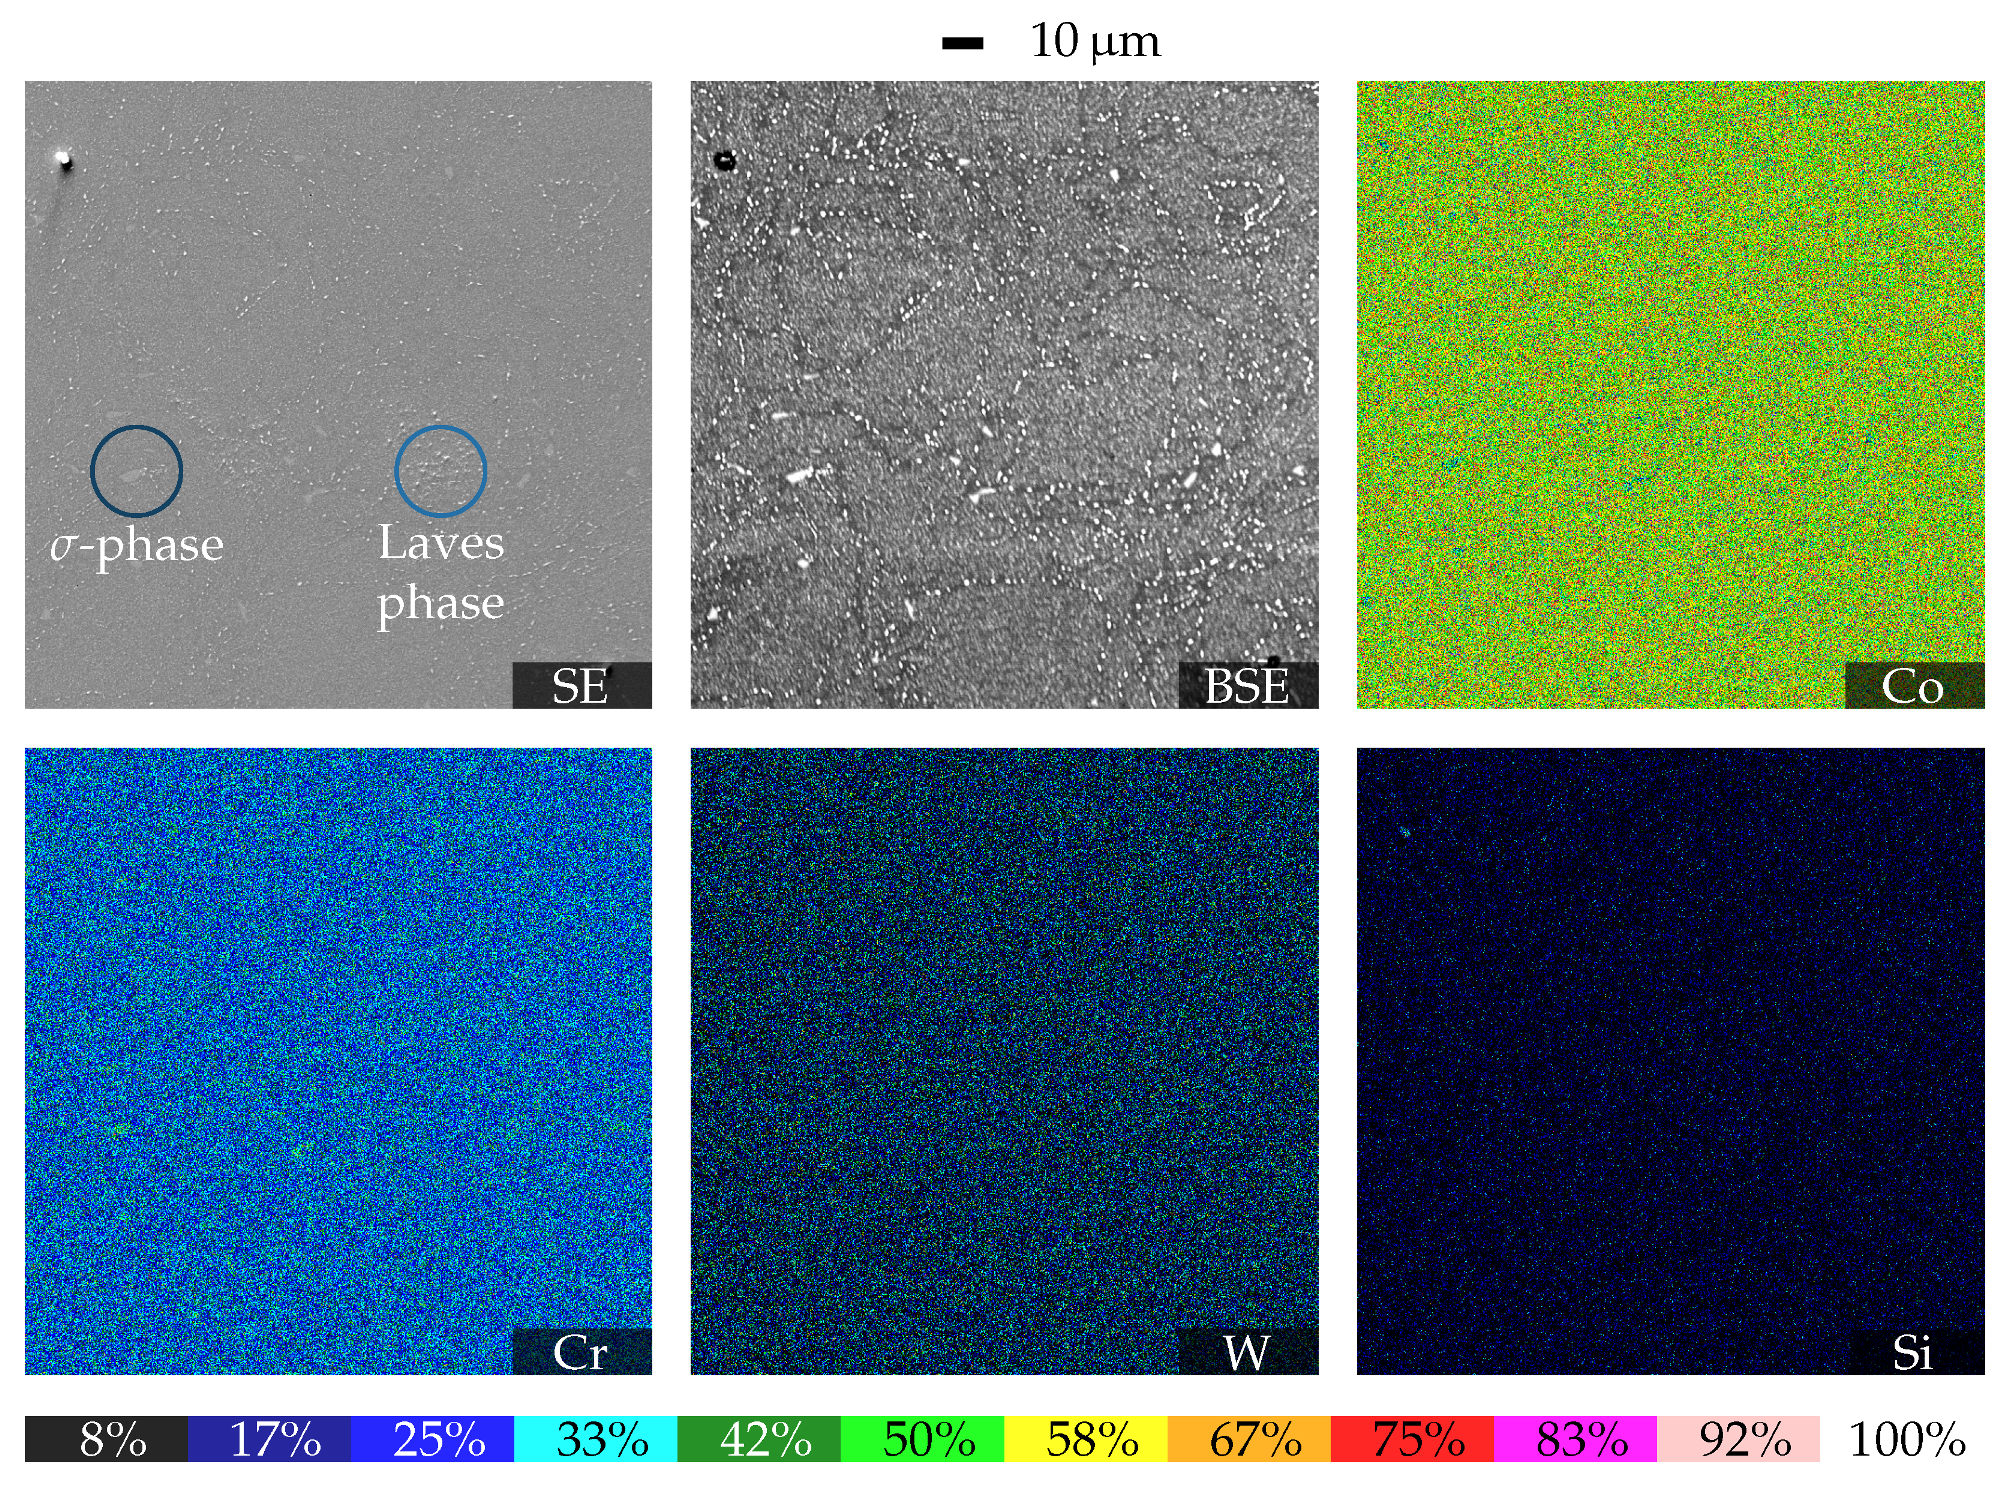
3.1. Phase Identification and Morphology
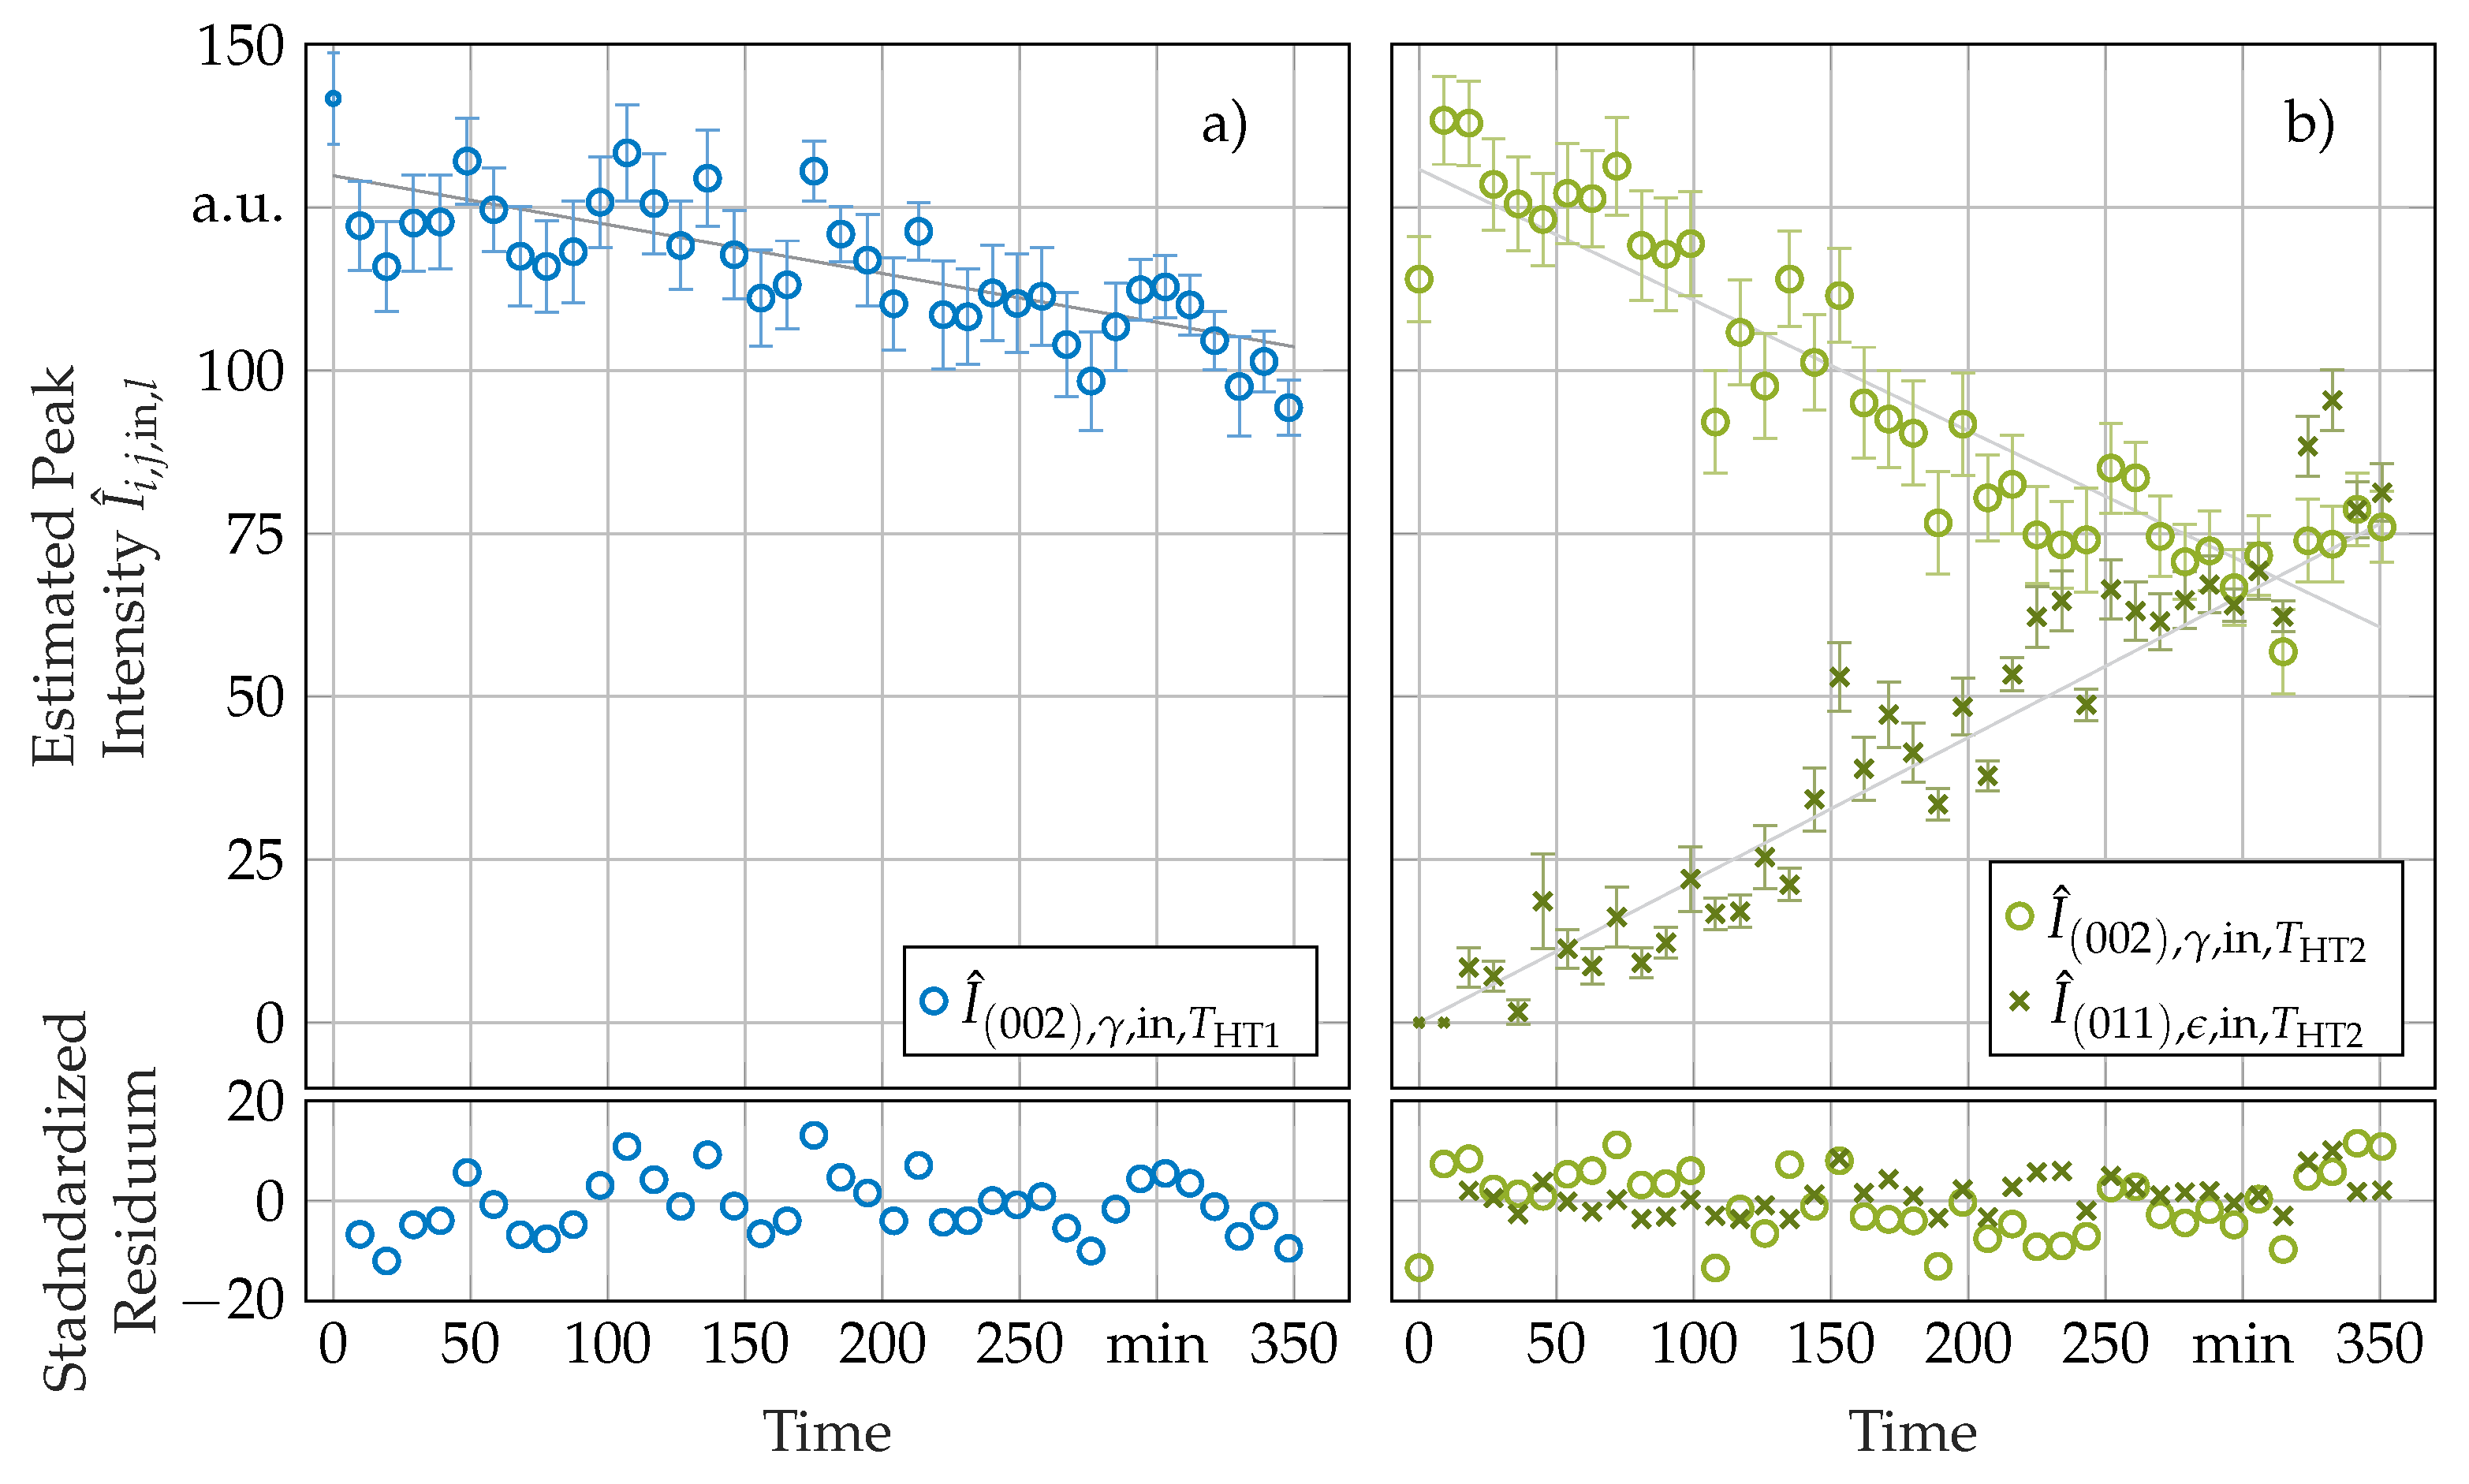
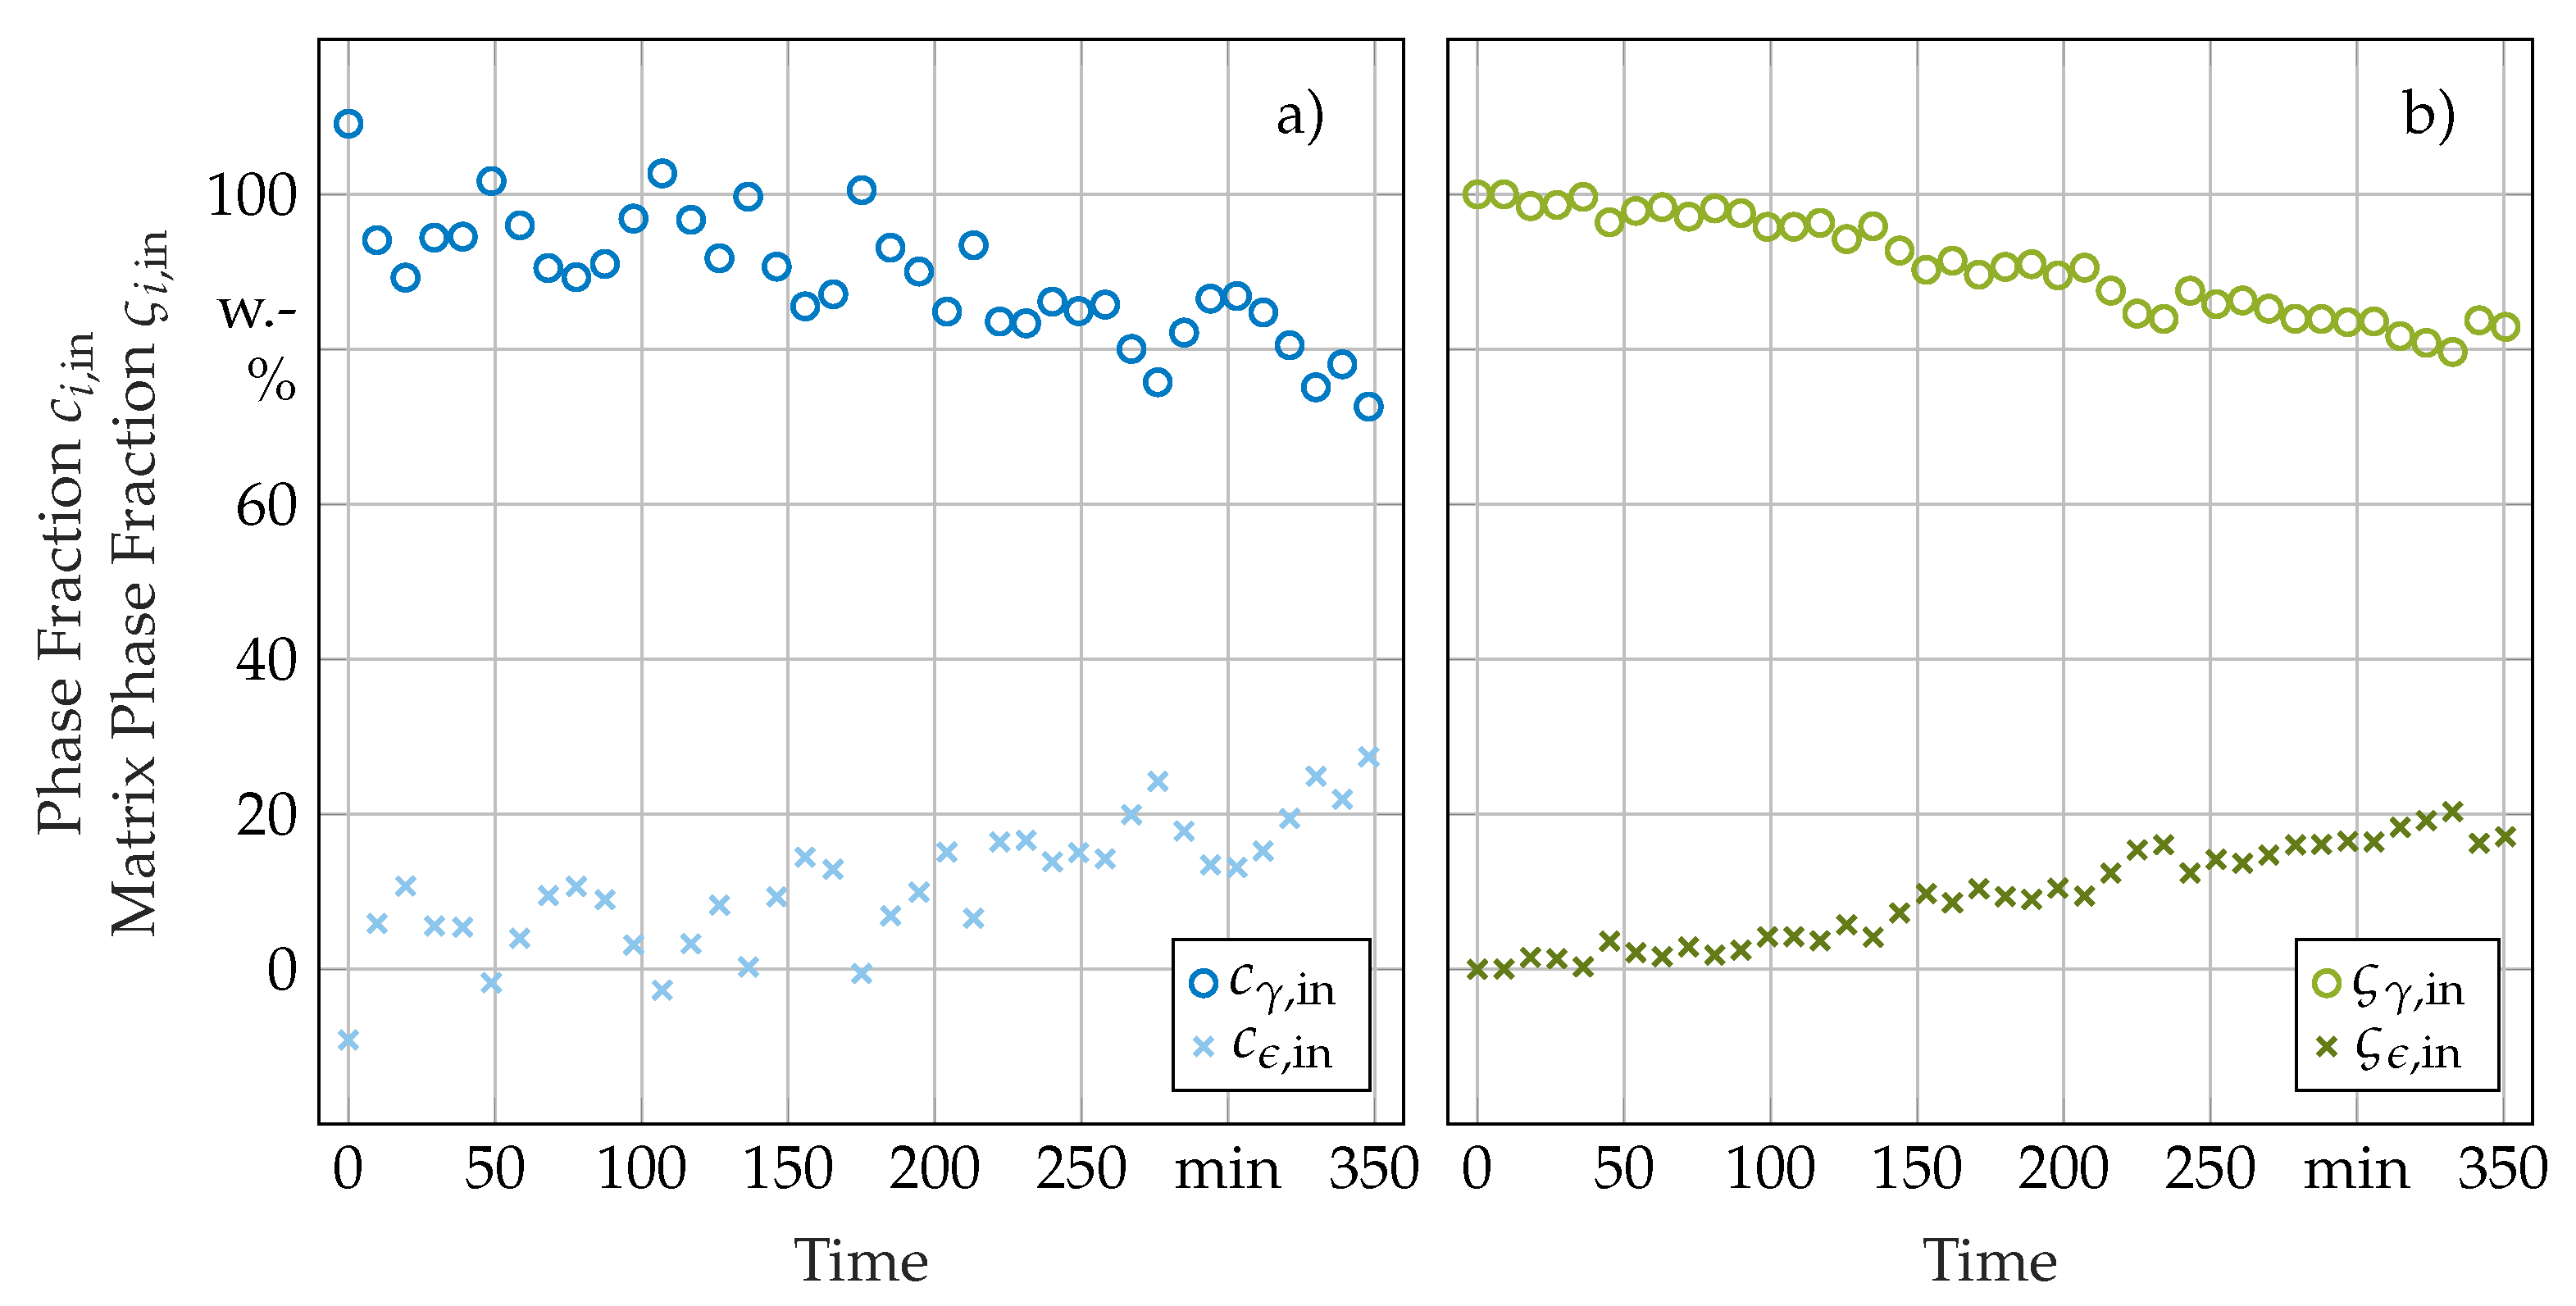
3.2. Phase Transformation Kinetics
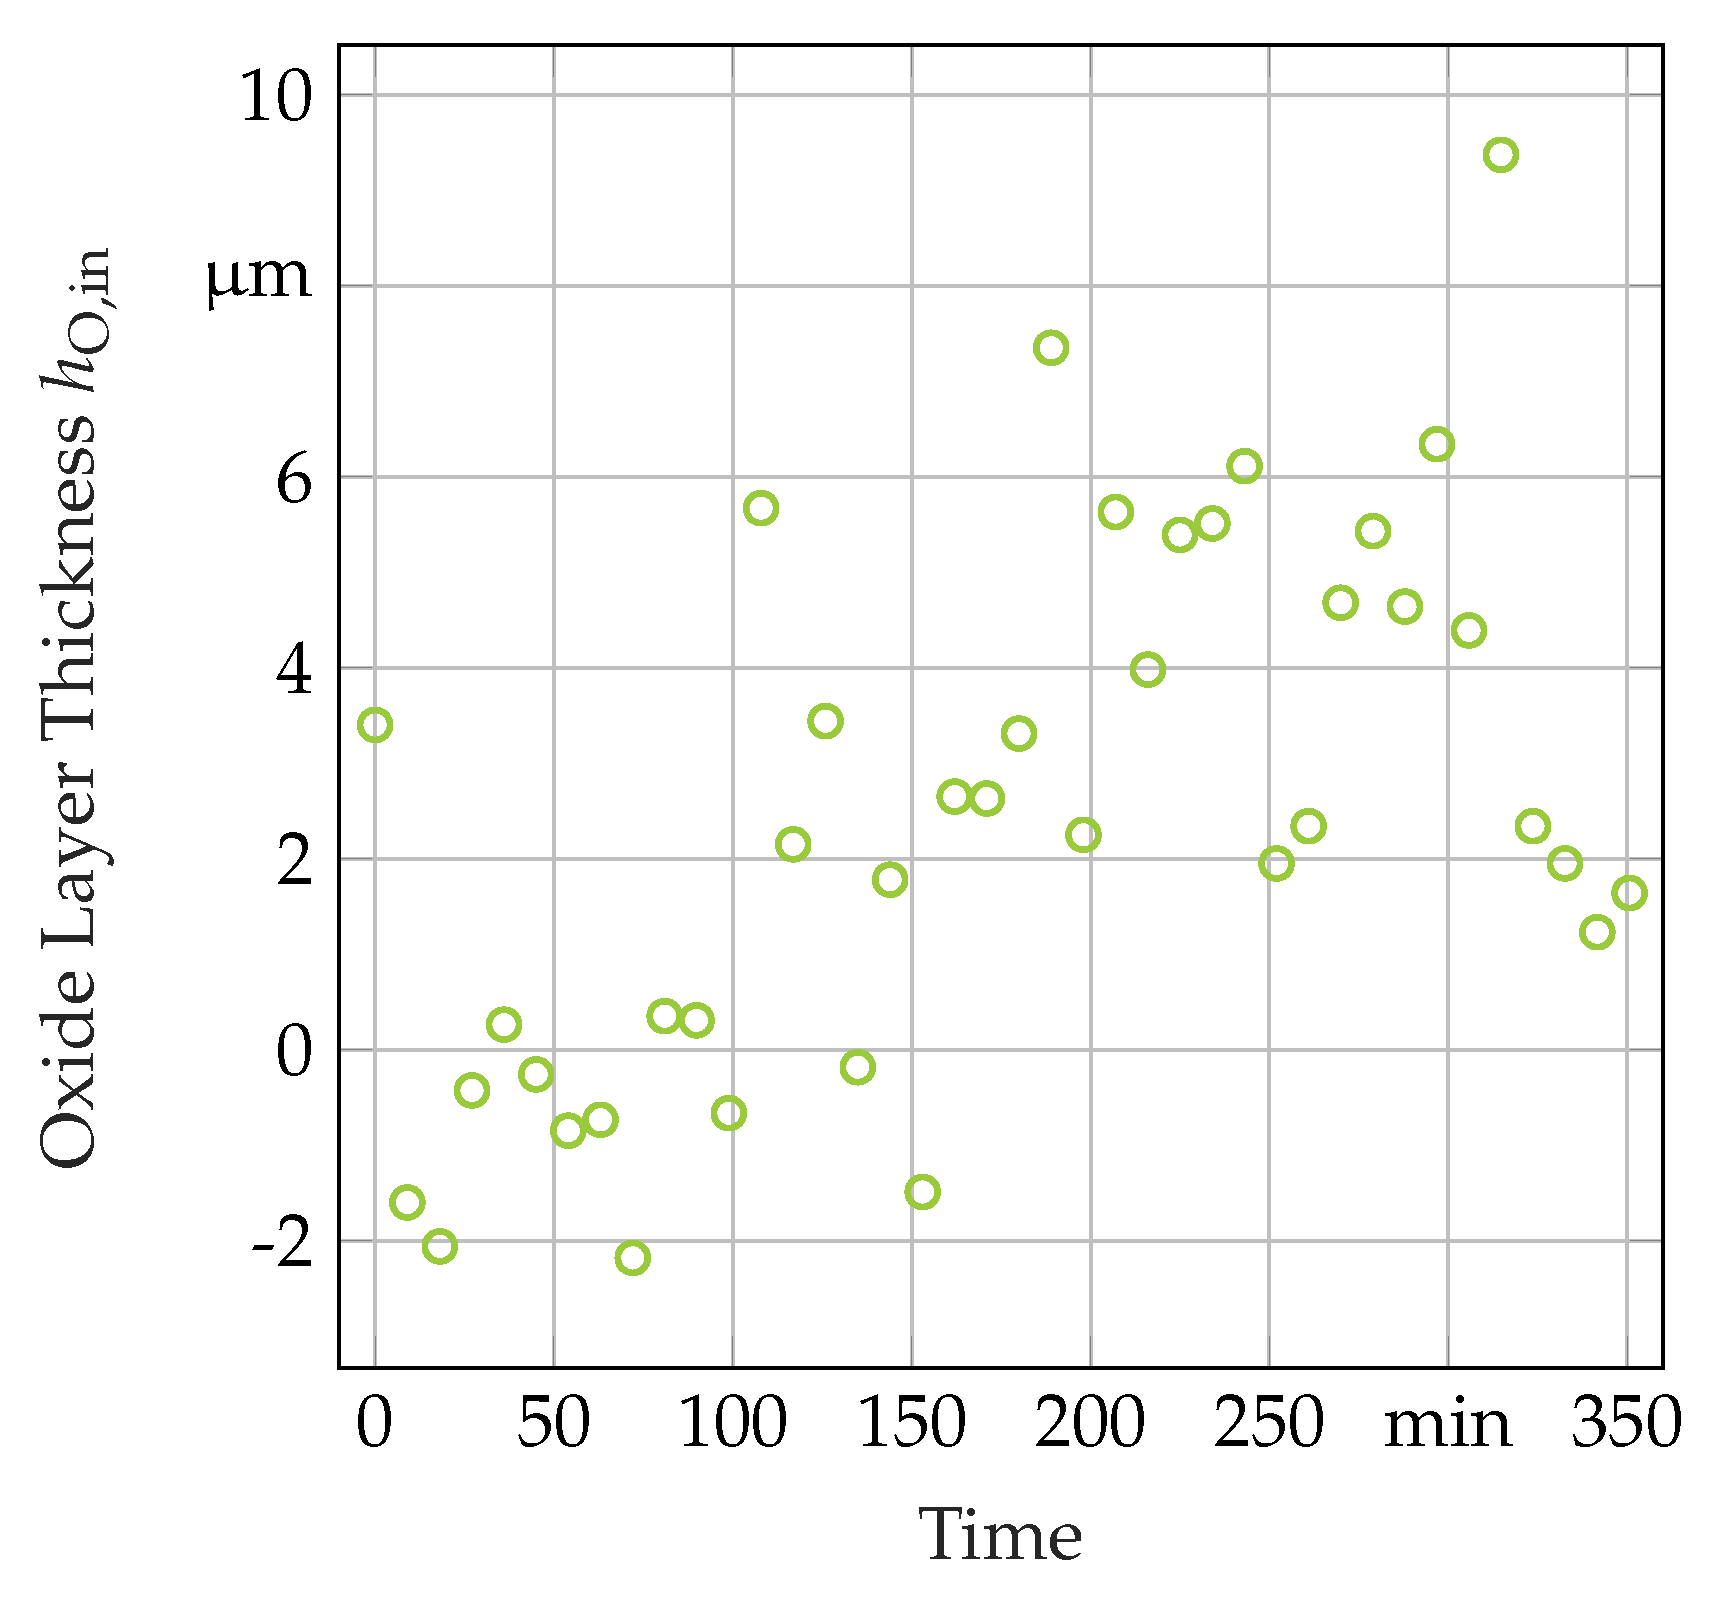
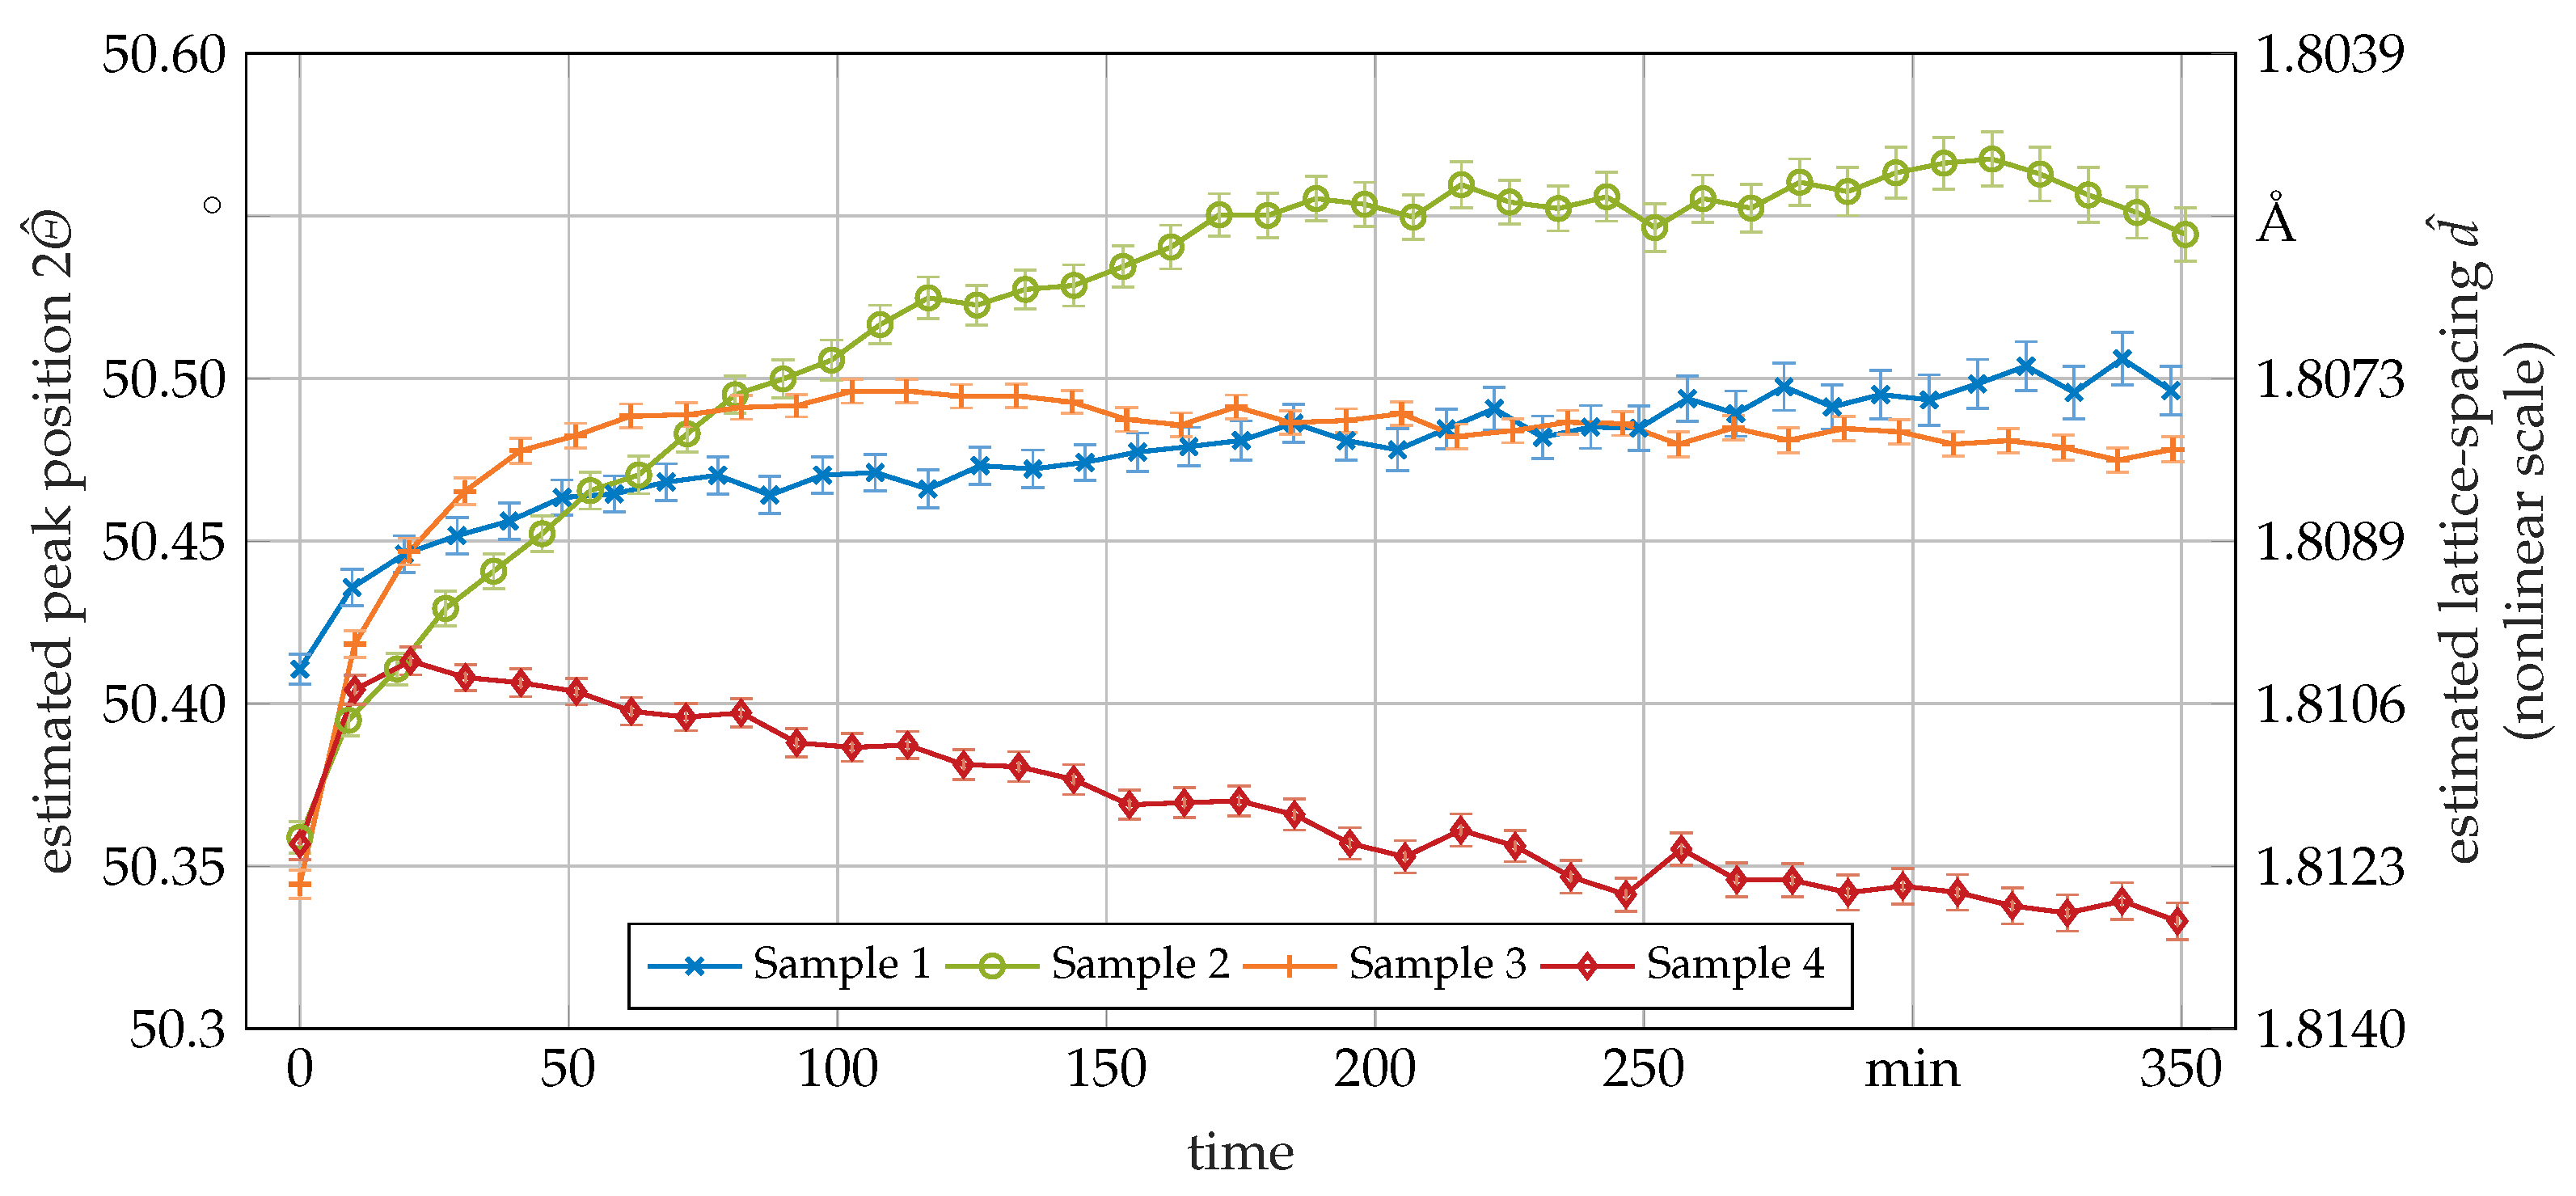
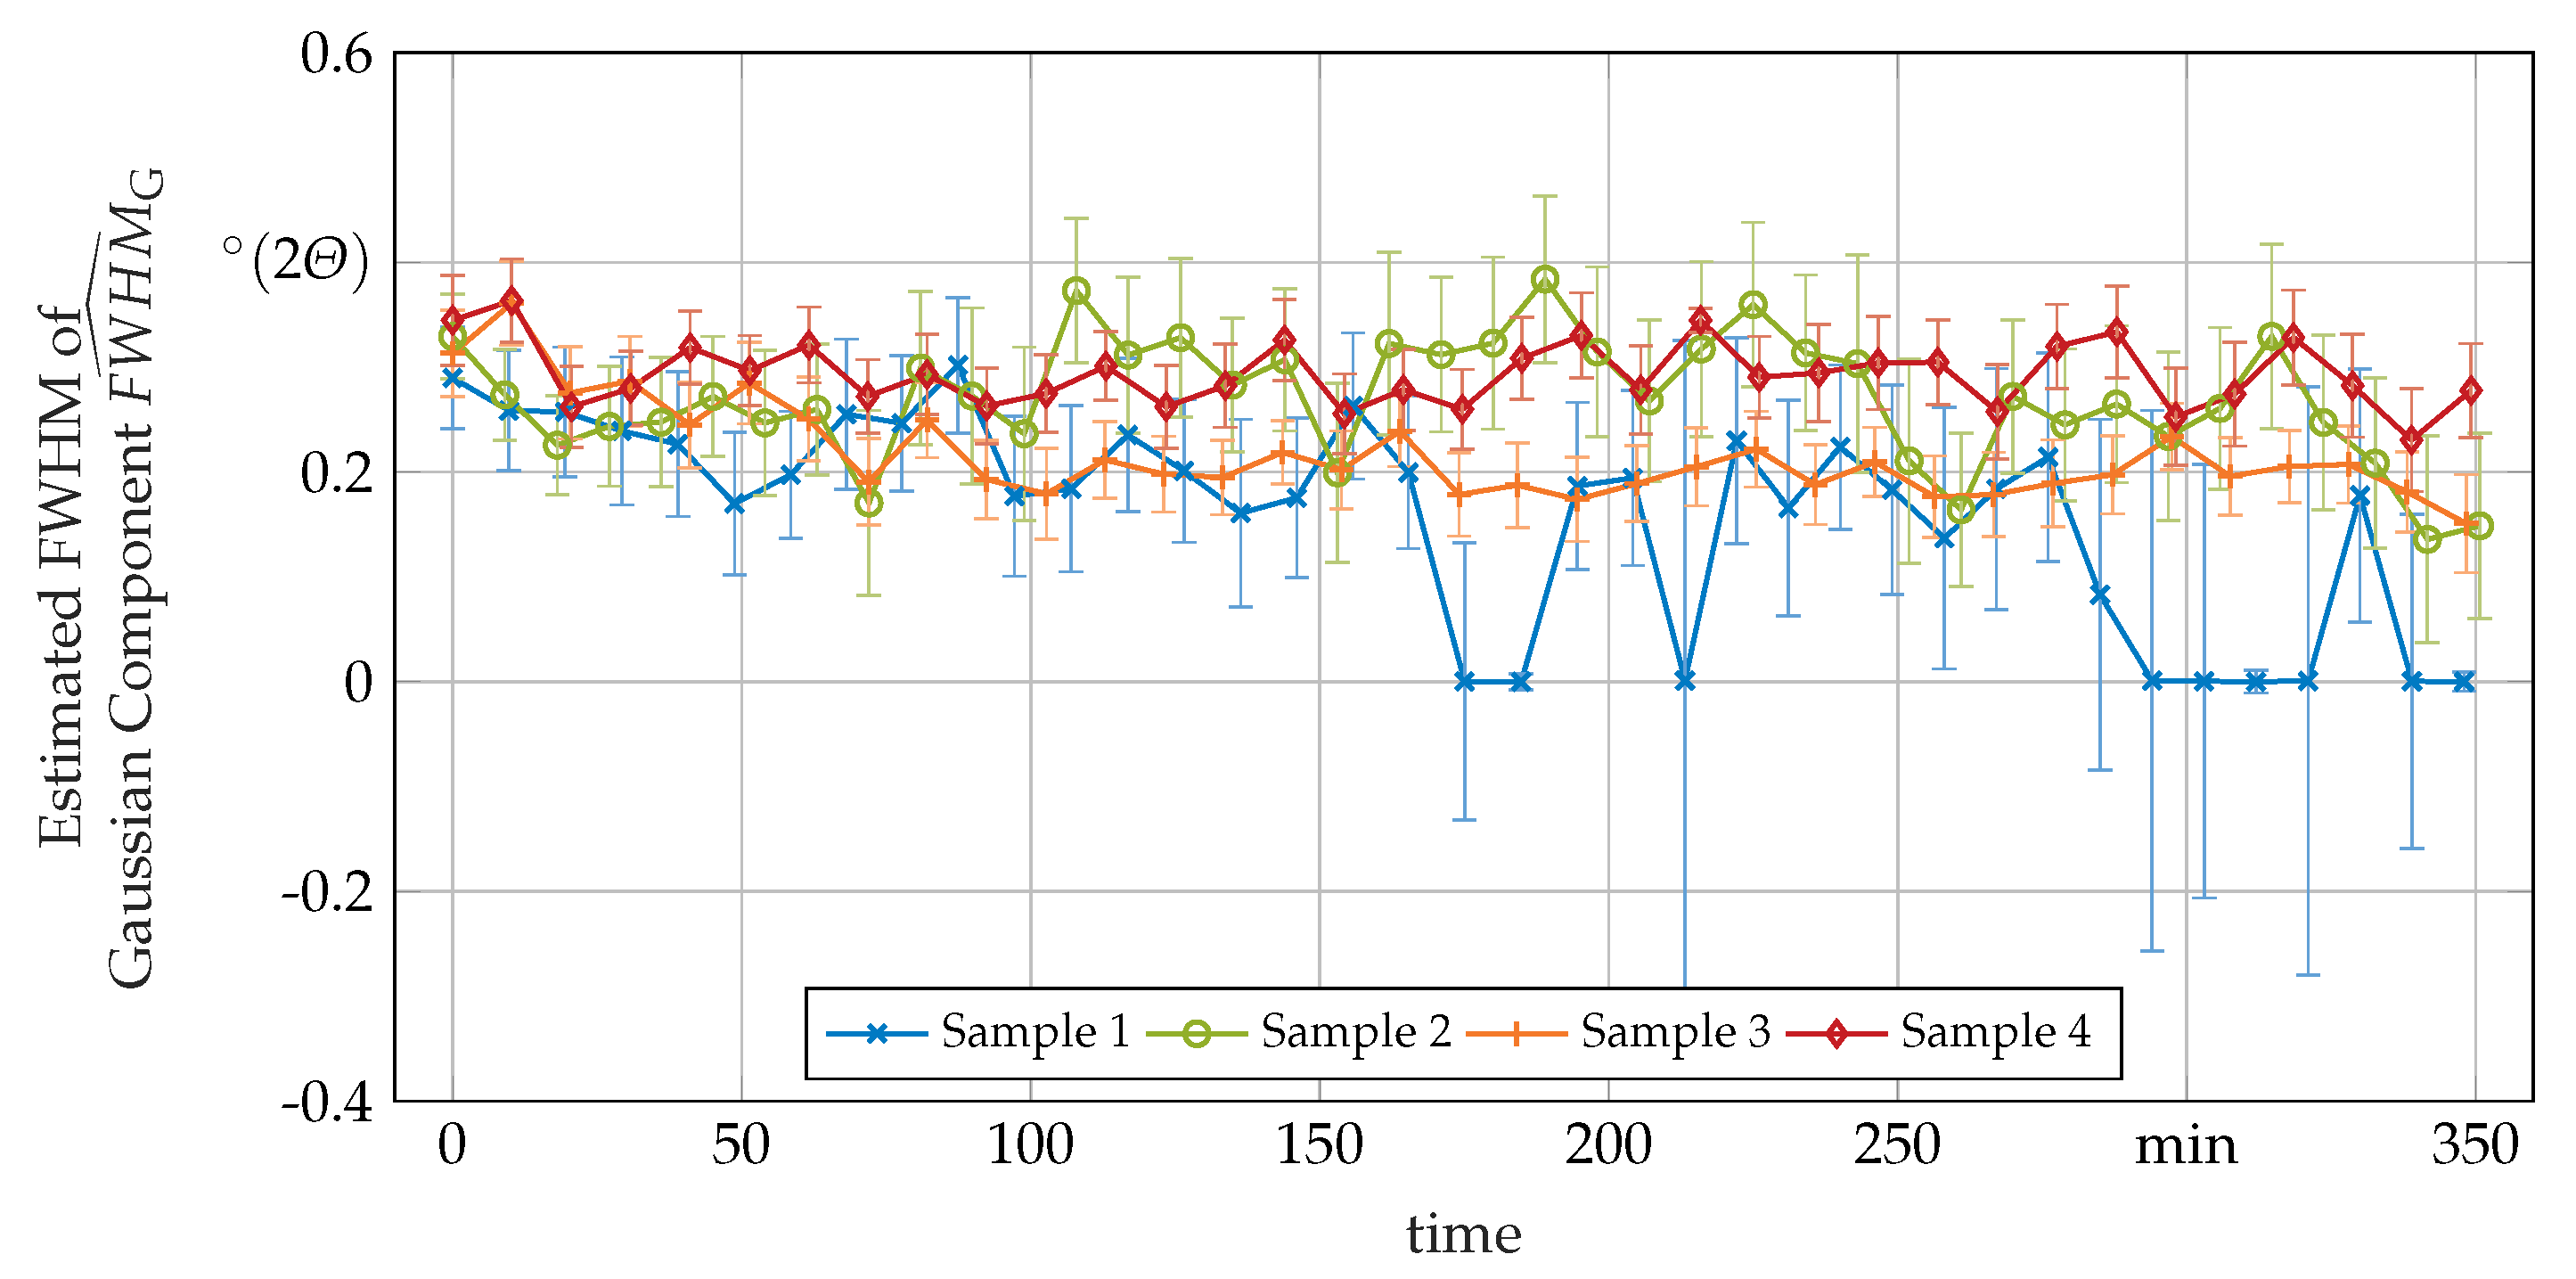
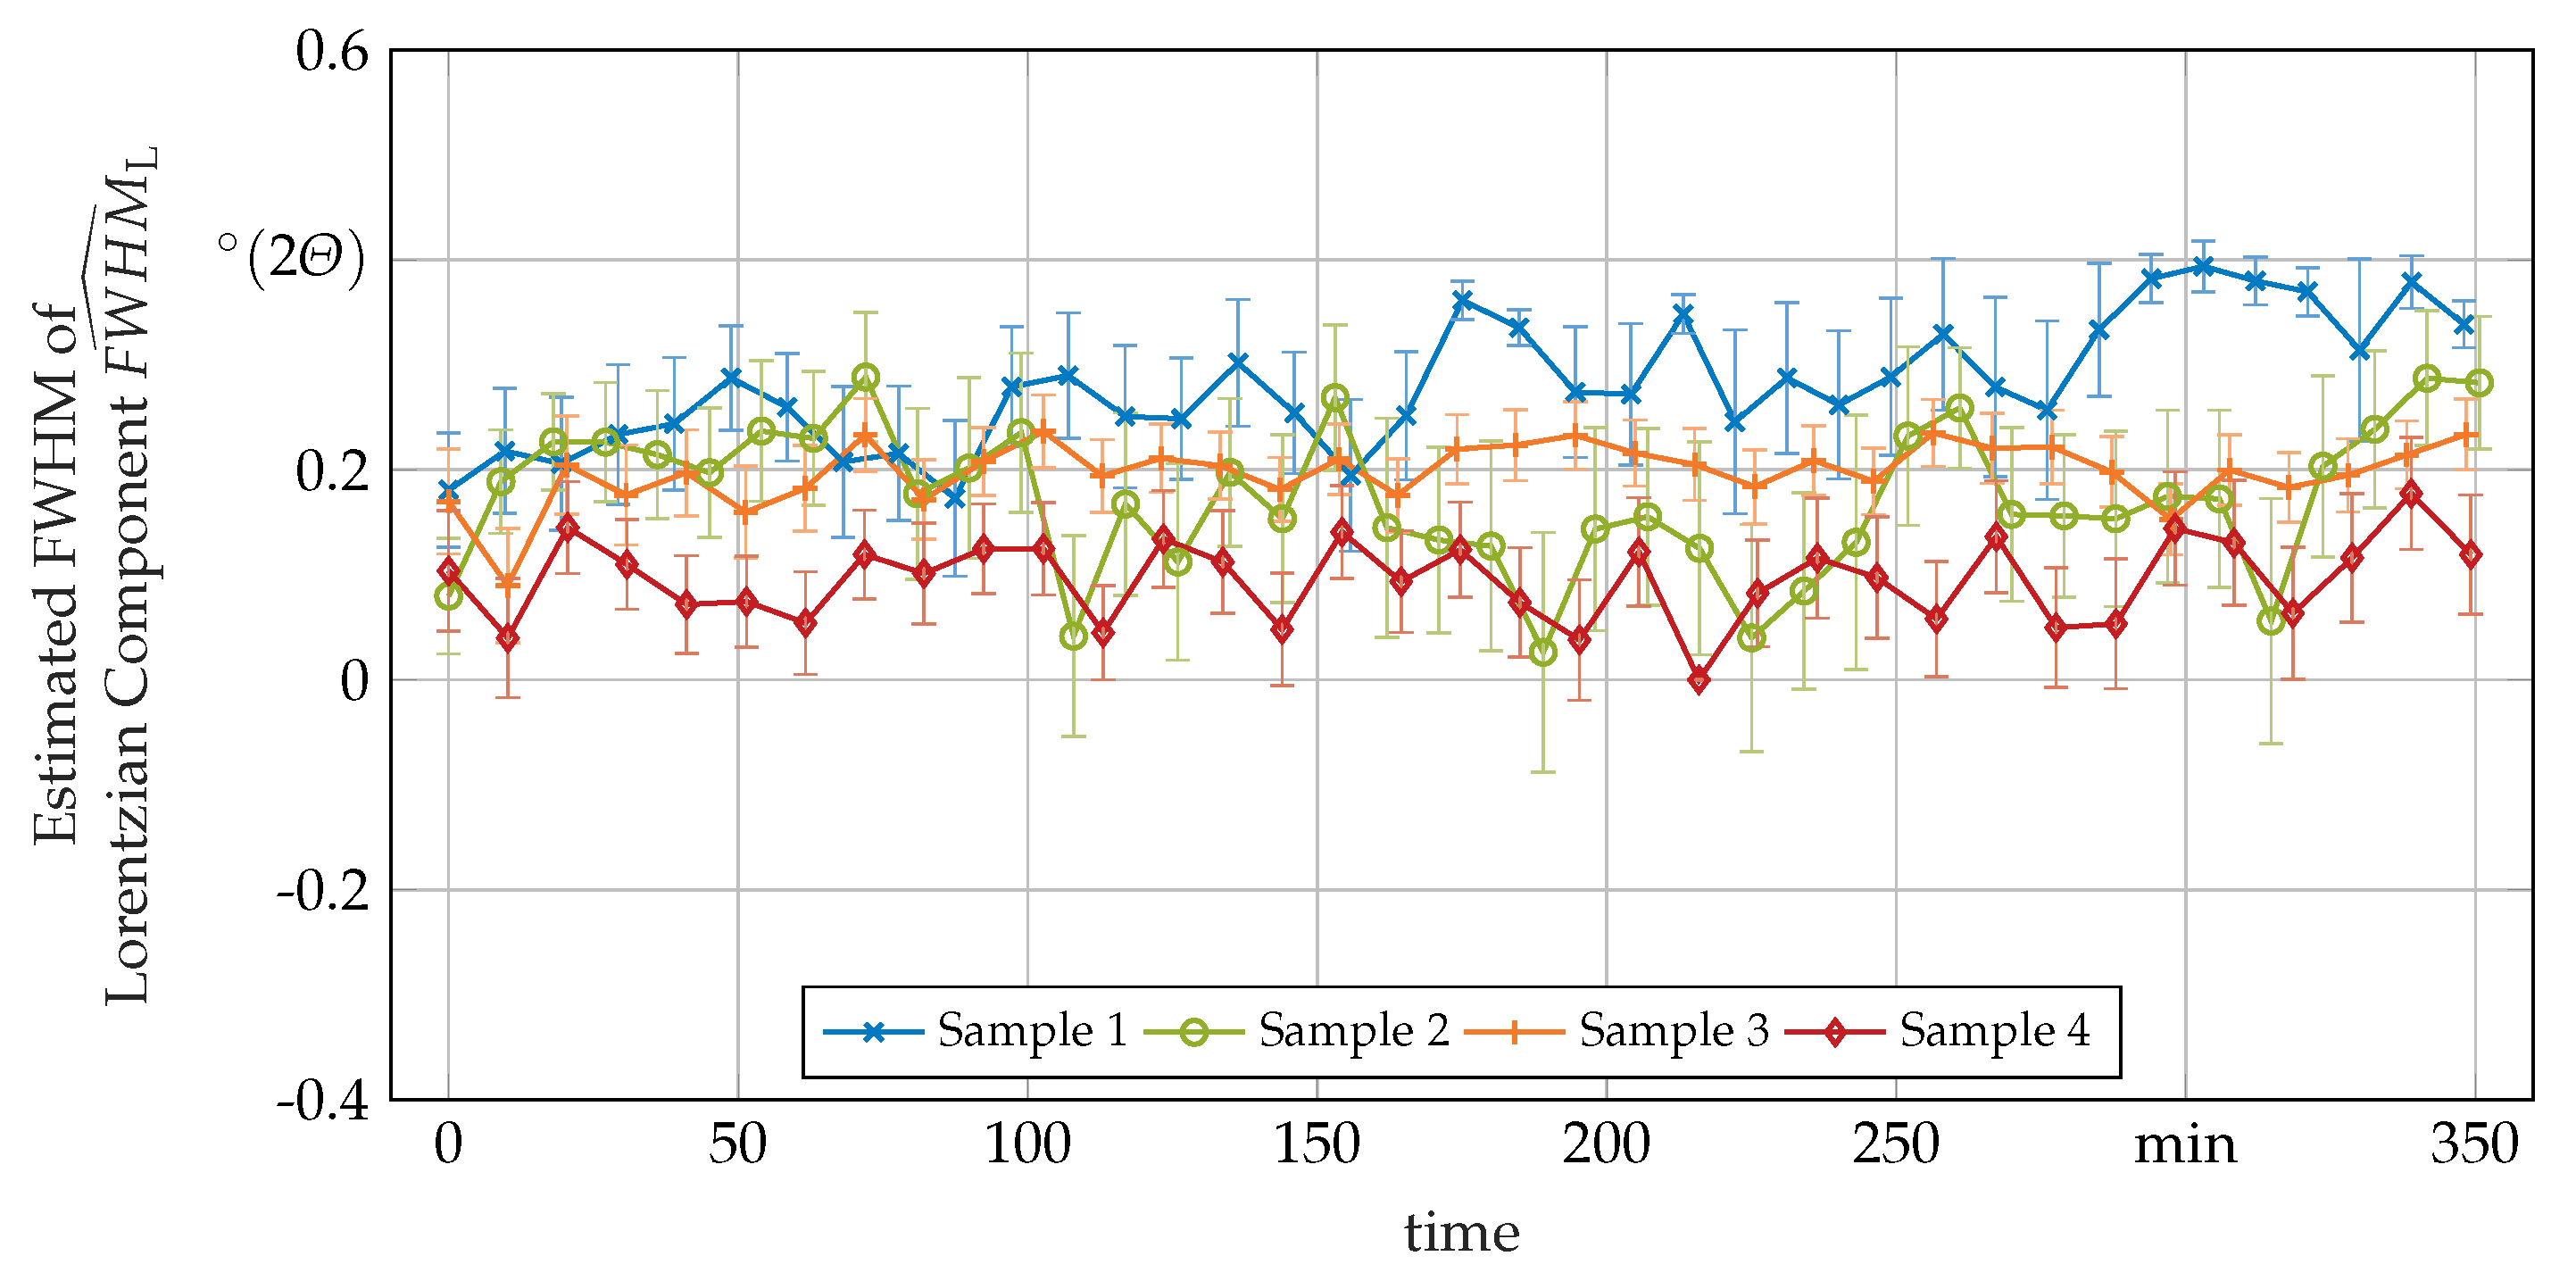
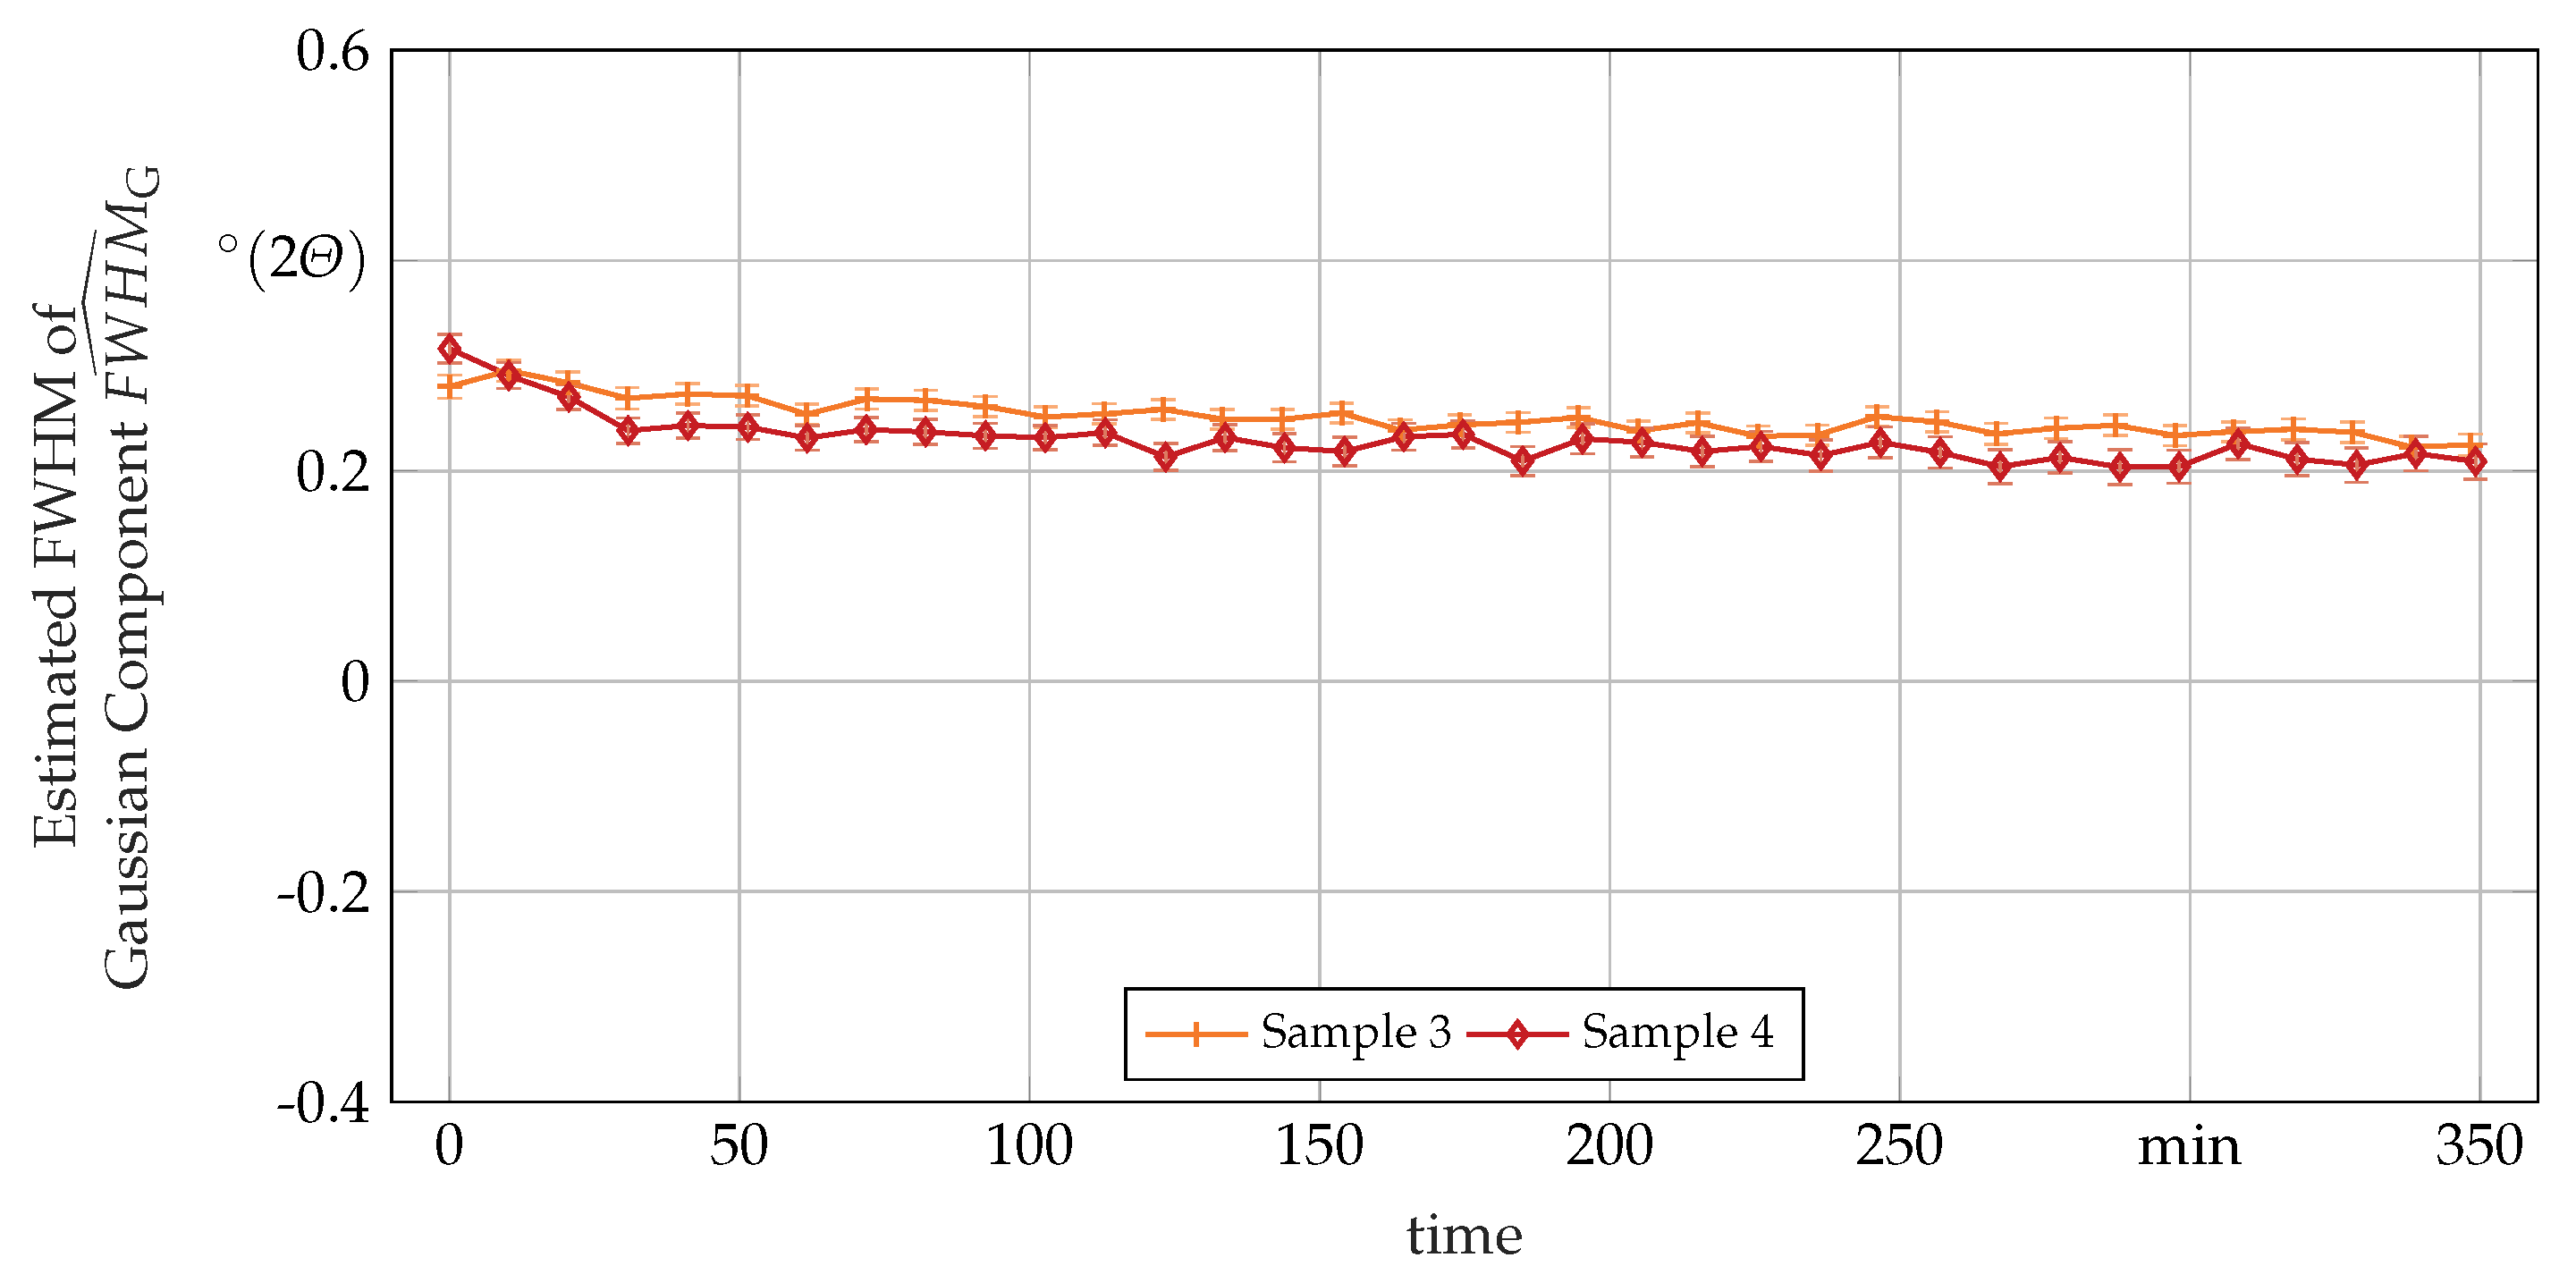
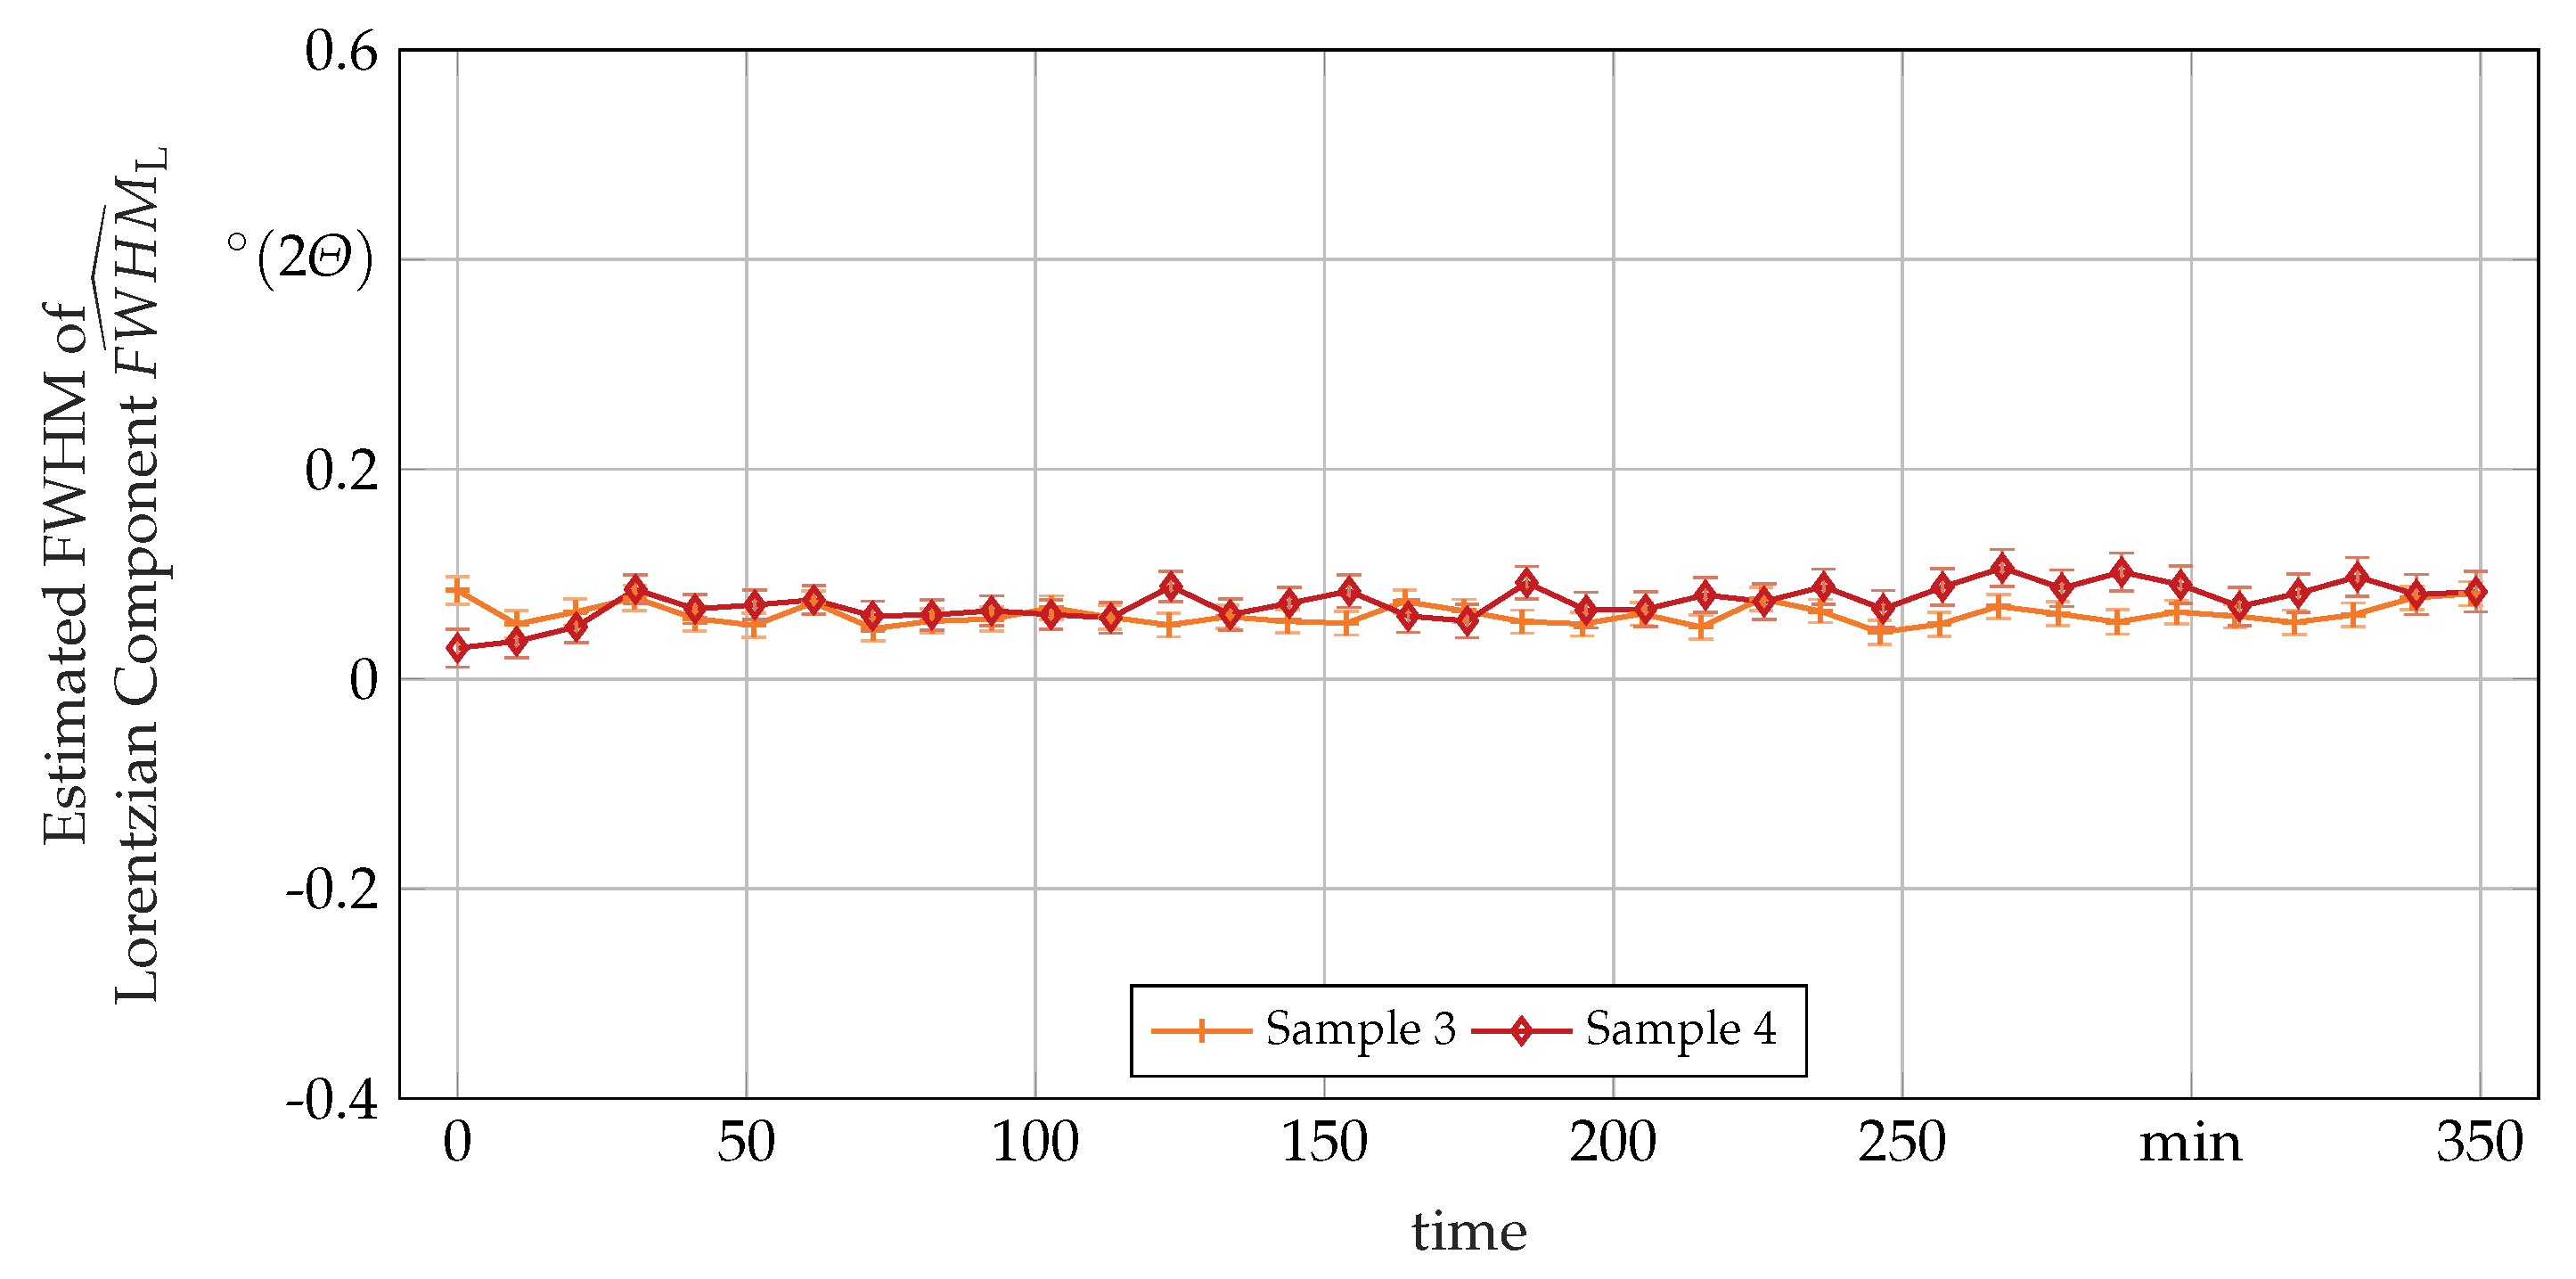
3.3. Secondary In-Situ Fit Variables
4. Discussion
5. Conclusions
- The AB condition was mainly composed of an fcc -phase;
- HTs at temperatures below a certain threshold (probably close to ) induced a -to- matrix transformation, which was slightly below the surface likely assisted by the formation of an oxide imposing stresses and strains onto the matrix and thus, evoking a partially strain-induced transformation there;
- Increasing amounts of Laves-phase and of another phase, likely -phase, precipitated with increasing HT temperatures;
- Inter- and intragranular stresses seemed to be reduced within 30 to during HTs;
- The existence of a high-temperature phase, not present at room temperature and not distinctively assignable, was observed at the highest applied HT temperature ().
Author Contributions
Funding
Data Availability Statement
Acknowledgments
Conflicts of Interest
Nomenclature
| Abbreviated | Unabbreviated | ||
| fcc | Face-centered cubic | ||
| hcp | Hexagonal close-packed | ||
| AB | As built | ||
| AlN | Aluminiumnitride | ||
| BSE | Backscattered electron | ||
| CNC | Computerized numerical control | ||
| DHS | Domed hot stage | ||
| EDS | Energy-dispersive X-ray spectroscopy | ||
| FWHM | Full width at half maximum | ||
| HT | Heat treatment | ||
| L-PBF | Laser powder-bed fusion | ||
| PFM | Porcelain fused to metal | ||
| QXRD | Quantitative X-ray diffraction | ||
| RPD | Removable partial denture | ||
| SE | Secondary electron | ||
| SEM | Scanning electron microscopy | ||
| SiC | Silicon carbide | ||
| TiAl | Titaniumaluminide | ||
| XRD | X-ray diffraction | ||
| Symbol | Meaning | First | Unit |
| Use | |||
| First lattice parameter | Section 2.4 | ||
| Third lattice parameter | Section 2.4 | ||
| c | Weight fraction | Section 2.4 | w.-% |
| Model based weight fraction | Section 2.4 | w.-% | |
| Azimuthal angle of the diffraction cone | Section 2.3 | ||
| Measured lattice-spacing | Section 3.3 | ||
| E | Young’s modulus | Section 1 | |
| Measured FWHM of Gaussian component | Section 2.4 | ||
| Measured FWHM of Lorentzian component | Section 2.4 | ||
| Oxide layer thickness | Section 2.4 | ||
| Model based oxide layer thickness | Section 2.4 | ||
| i | Counting variable referring to observed phases | Section 2.4 | - |
| I | Peak intensity | Section 2.4 | |
| Measured peak intensity | Section 2.4 | ||
| Model based peak intensity | Section 2.4 | ||
| j | Counting variable referring to certain peaks | Section 2.4 | - |
| k | Point in time throughout the treatment | Section 2.4 | - |
| Calibration constant | Section 2.4 | ||
| l | Counting variable referring to a temperature | Section 2.4 | - |
| Average mass absorption coefficient of matrix phases | Section 2.4 | ||
| Mass absorption coefficient of | Section 2.4 | ||
| n | Number of all phases | Section 2.4 | - |
| p | Counting variable referring a setup | Section 2.4 | - |
| Average density of matrix phases | Section 2.4 | ||
| Density of the oxide | Section 2.4 | ||
| Weight fraction relative to matrix phases | Section 2.4 | w.-% | |
| Model based weight fraction relative to matrix phases | Section 2.4 | w.-% | |
| t | Time throughout the treatment | Section 2.4 | |
| Controller temperature of DHS | Section 2.2 | ||
| Sample surface temperature | Section 2.2 | ||
| Glancing angle or Bragg angle | Section 2.3 | ||
| Measured glancing angle | Section 2.3 |
Appendix A. Additional In-Situ XRD-Data


References
- Helsen, J.A.; Missirlis, Y. Biomaterials; Springer: Berlin/Heidelberg, Germany, 2010. [Google Scholar]
- Roberts, H.W.; Berzins, D.W.; Moore, B.K.; Charlton, D.G. Metal-Ceramic Alloys in Dentistry: A Review. J. Prosthodont. 2009, 18, 188–194. [Google Scholar] [CrossRef]
- Kassapidou, M.; Franke Stenport, V.; Hjalmarsson, L.; Johansson, C.B. Cobalt-Chromium Alloys in Fixed Prosthodontics in Sweden. Acta Biomater. Odontol. Scand. 2017, 3, 53–62. [Google Scholar] [CrossRef] [PubMed]
- Al Jabbari, Y.S. Physico-mechanical Properties and Prosthodontic Applications of Co-Cr Dental Alloys: A Review of the Literature. J. Adv. Prosthodont. 2014, 6, 138–145. [Google Scholar] [CrossRef] [Green Version]
- Wataha, J.C. Biocompatibility of Dental Casting Alloys: A Review. J. Prosthet. Dent. 2000, 83, 223–234. [Google Scholar] [CrossRef]
- Bürgel, R.; Jürgen Maier, H.; Niendorf, T. Handbuch Hochtemperatur-Werkstofftechnik: Grundlagen, Werkstoffbeanspruchungen, Hochtemperaturlegierungen und-Beschichtungen, 4th ed.; Vieweg+Teubner Verlag: Wiesbaden, Germany, 2011. [Google Scholar]
- Karaali, A.; Mirouh, K.; Hamamda, S.; Guiraldenq, P. Microstructural Study of Tungsten Influence on Co–Cr Alloys. Mater. Sci. Eng. A-Struct. 2005, 390, 255–259. [Google Scholar] [CrossRef]
- Yamanaka, K.; Mori, M.; Kuramoto, K.; Chiba, A. Development of New Co–Cr–W-based Biomedical Alloys: Effects of Microalloying and Thermomechanical Processing on Microstructures and Mechanical Properties. Mater. Des. 2014, 55, 987–998. [Google Scholar] [CrossRef]
- Asgar, K. Casting Metals in Dentistry: Past-Present-Future. Adv. Dent. Res. 1988, 2, 33–43. [Google Scholar] [CrossRef] [PubMed]
- Hitzler, L.; Alifui-Segbaya, F.; Williams, P.; Heine, B.; Heitzmann, M.; Hall, W.; Merkel, M.; Öchsner, A. Additive Manufacturing of Cobalt-based Dental Alloys: Analysis of Microstructure and Physicomechanical Properties. Adv. Mater. Sci. Eng. 2018, 2018, 1–12. [Google Scholar] [CrossRef] [Green Version]
- Koutsoukis, T.; Zinelis, S.; Eliades, G.; Al-Wazzan, K.; Rifaiy, M.A.; Al Jabbari, Y.S. Selective Laser Melting Technique of Co-Cr Dental Alloys: A Review of Structure and Properties and Comparative Analysis with Other Available Techniques. J. Prosthodont. 2015, 24, 303–312. [Google Scholar] [CrossRef]
- Hitzler, L.; Merkel, M.; Hall, W.; Öchsner, A. A Review of Metal Fabricated with Laser- and Powder-Bed Based Additive Manufacturing Techniques: Process, Nomenclature, Materials, Achievable Properties, and its Utilization in the Medical Sector. Adv. Eng. Mater. 2018, 20, 1700658. [Google Scholar] [CrossRef] [Green Version]
- Hitzler, L. The Anisotropic and Inhomogeneous Nature of Additively Manufactured Metals, and the Application of Selective Laser Melting in Dentistry. Ph.D. Thesis, Griffith University, Gold Coast, Australia, 2018. [Google Scholar] [CrossRef]
- Takaichi, A.; Nakamoto, T.; Joko, N.; Nomura, N.; Tsutsumi, Y.; Migita, S.; Doi, H.; Kurosu, S.; Chiba, A.; Wakabayashi, N.; et al. Microstructures and Mechanical Properties of Co–29Cr–6Mo Alloy Fabricated by Selective Laser Melting Process for Dental Applications. J. Mech. Behav. Biomed. Mater. 2013, 21, 67–76. [Google Scholar] [CrossRef]
- Verein Deutscher Ingenieure. VDI 3405: Additive Fertigungsverfahren - Grundlagen, Begriffe, Verfahrensbeschreibungen; Beuth Verlag: Berlin, Germany, 2014. [Google Scholar]
- Alifui-Segbaya, F.; Evans, J.; Eggbeer, D.; George, R. Clinical Relevance of Laser-Sintered Co-Cr Alloys for Prosthodontic Treatments: A Review. In Proceedings of the 1st International Conference on Progress in Additive Manufacturing, Singapore, 26–28 May 2014; Research Publishing Services: Singapore, 2014; pp. 115–120. [Google Scholar] [CrossRef]
- Kim, H.R.; Jang, S.H.; Kim, Y.K.; Son, J.S.; Min, B.K.; Kim, K.H.; Kwon, T.Y. Microstructures and Mechanical Properties of Co-Cr Dental Alloys Fabricated by Three CAD/CAM-Based Processing Techniques. Materials 2016, 9, 596. [Google Scholar] [CrossRef]
- von Kobylinski, J.; Hitzler, L.; Lawitzki, R.; Krempaszky, C.; Öchsner, A.; Werner, E. Relationship between Phase Fractions and Mechanical Properties in Heat–Treated Laser Powder–Bed Fused Co–based Dental Alloys. ISR J. Chem. 2020. [Google Scholar] [CrossRef] [Green Version]
- Kajima, Y.; Takaichi, A.; Kittikundecha, N.; Nakamoto, T.; Kimura, T.; Nomura, N.; Kawasaki, A.; Hanawa, T.; Takahashi, H.; Wakabayashi, N. Effect of Heat-treatment Temperature on Microstructures and Mechanical Properties of Co–Cr–Mo Alloys Fabricated by Selective Laser Melting. Mater. Sci. Eng. A-Struct. 2018, 726, 21–31. [Google Scholar] [CrossRef]
- Hitzler, L.; von Kobylinski, J.; Lawitzki, R.; Krempaszky, C.; Werner, E. Microstructural Development and Mechanical Properties of Selective Laser Melted Co–Cr–W Dental Alloy. In TMS 2020 149th Annual Meeting & Exhibition Supplemental Proceedings; The Minerals, Metals & Materials Series; Springer International Publishing: Cham, Switzerland, 2020; pp. 195–202. [Google Scholar] [CrossRef]
- Dentaurum: Remanium Star CL Powered by Dentaurum. Available online: https://www.dentaurum.de/files/1105_remaniumstarCL_Materialdatenblatt-10.pdf (accessed on 13 January 2021).
- Instruction Manual DHS 1100: Domed Hot Stage: Version PANalytical. Available online: https://pf18b.neocities.org/docu/Anton%20Paar%20DHS%201100.pdf (accessed on 15 January 2021).
- Resel, R.; Tamas, E.; Sonderegger, B.; Hofbauer, P.; Keckes, J. A Heating Stage up to 1173 K for X-Ray Diffraction Studies in the Whole Orientation Space. J. Appl. Crystallogr. 2003, 36, 80–85. [Google Scholar] [CrossRef]
- Samarati, J.; Iengo, P.; Longo, L.; Sekhniaidze, G.; Sidiropoulou, O.; Wotschack, J. Characterisation of the Charging Up Effect in Resistive Micromegas Detectors. J. Phys. Conf. Ser. 2020, 1498, 012030. [Google Scholar] [CrossRef]
- Mittemeijer, E.J.; Welzel, U. The “State of the Art” of the Diffraction Analysis of Crystallite Size and Lattice Strain. Z. Kristallogr. 2008, 223, 134. [Google Scholar] [CrossRef]
- Schreier, F. Optimized Implementations of Rational Approximations for the Voigt and Complex Error Function. J. Quant. Spectrosc. Radiat. 2011, 112, 1010–1025. [Google Scholar] [CrossRef]
- James, F. Minuit: Function Minimization and Error Analysis Reference Manual. Available online: https://cds.cern.ch/record/2296388/files/minuit.pdf (accessed on 13 January 2021).
- Alexander, L.; Klug, H.P. Basic Aspects of X-Ray Absorption in Quantitative Diffraction Analysis of Powder Mixtures. Anal. Chem. 1948, 20, 886–889. [Google Scholar] [CrossRef]
- Zevin, L.S.; Kimmel, G.; Mureinik, I. Quantitative X-ray Diffractometry; Springer US: New York, NY, USA, 1995. [Google Scholar]
- He, B.B. Two-Dimensional X-ray Diffraction; Wiley: Hoboken, NJ, USA, 2009. [Google Scholar]
- Persson, K. Materials Data on Cr2O3 by Materials Project. Available online: https://materialsproject.org/materials/mp-19399/ (accessed on 13 January 2021).
- Momma, K.; Izumi, F. VESTA 3 for Three-dimensional Visualization of Crystal, Volumetric and Morphology Data. J. Appl. Crystallogr. 2011, 44, 1272–1276. [Google Scholar] [CrossRef]
- Larikov, L.N.; Shmatko, O.A. Solubility of Tungsten in Cobalt in Solid Phase. Dopov. Akad. Nauk A 1967, 29, 540–541. [Google Scholar]
- Yang, J. Structural Analysis of Perovskite LaCr1-xNixO3 by Rietveld Refinement of X-Ray Powder Diffraction Data. Acta Crystallogr. B 2008, 64, 281–286. [Google Scholar] [CrossRef]
- Priebe, R.; Sabrowsky, H. Über einen Chrom-Mangan-Spinell mit Kationenmangelstruktur, CrMn1,5O4: About a Chromium Manganese Spinel with Cation Deficient Structure, CrMn1,5O4. Z. Naturforschung B 1979, 34, 1663–1665. [Google Scholar] [CrossRef]
- Magneli, A.; Westgren, A. Röntgenuntersuchung von Kobalt-Wolframlegierungen. Zeitschrift für Anorganische und Allgemeine Chemie 1938, 238, 268–272. [Google Scholar] [CrossRef]
- Villars, P.; Cenzual, K. W2Co3Si (WCo1.5Si0.5) Crystal Structure: Datasheet from “PAULING FILE Multinaries Edition-2012” in SpringerMaterials. Available online: https://materials.springer.com/isp/crystallographic/docs/sd_0539453 (accessed on 9 September 2020).
- Fanfoni, M.; Tomellini, M. The Johnson-Mehl- Avrami-Kohnogorov Model: A Brief Review. Il Nuovo Cimento D 1998, 20, 1171–1182. [Google Scholar] [CrossRef]
- Hanawa, T.; Hiromoto, S.; Asami, K. Characterization of the Surface Oxide Film of a Co–Cr–Mo Alloy after Being Located in Quasi-biological Environments Using XPS. Appl. Surf. Sci. 2001, 183, 68–75. [Google Scholar] [CrossRef]
- Alifui-Segbaya, F.; Lewis, J.; Eggbeer, D.; Williams, R.J. In Vitro Corrosion Analyses of Heat Treated Cobalt-Chromium Alloys Manufactured by Direct Metal Laser Sintering. Rapid Prototyp. J. 2015, 21, 111–116. [Google Scholar] [CrossRef]
- Peng, Y.; Du, Y.; Materials Science International Team (MSIT). Co-Cr-W Ternary Phase Diagram Evaluation: Phase Diagrams, Crystallographic and Thermodynamic Data: MSI Eureka in SpringerMaterials. Available online: https://materials.springer.com/msi/docs/sm_msi_r_10_017469_01 (accessed on 3 November 2019).
- Yang, S.Y.; Jiang, M.; Li, H.X.; Wang, L. Thermodynamic Assessment of Co-Cr-W Ternary System. Trans. Nonferr. Met. Soc. 2011, 21, 2270–2275. [Google Scholar] [CrossRef]
- Turrubiates-Estrada, R.; Salinas-Rodriguez, A.; Lopez, H.F. FCC to HCP Transformation Kinetics in a Co–27Cr–5Mo–0.23C Alloy. J. Mater. Sci. 2011, 46, 254–262. [Google Scholar] [CrossRef]
- Bauer, R.; Jägle, E.A.; Baumann, W.; Mittemeijer, E.J. Kinetics of the Allotropic hcp–fcc Phase Transformation in Cobalt. Philos. Mag. 2011, 91, 437–457. [Google Scholar] [CrossRef] [Green Version]
- Trömel, M.; Hübner, S. Metallradien und Ionenradien. Z. Krist. Cryst. Mater. 2000, 215. [Google Scholar] [CrossRef]
- Pjetursson, B.E.; Sailer, I.; Zwahlen, M.; Hämmerle, C.H.F. A Systematic Review of the Survival and Complication Rates of All-Ceramic and Metal-Ceramic Reconstructions after an Observation Period of at Least 3 Years. Part I: Single Crowns. Clin. Oral Implants Res. 2007, 18 (Suppl. 3), 73–85. [Google Scholar] [CrossRef] [PubMed]
- Sailer, I.; Pjetursson, B.E.; Zwahlen, M.; Hämmerle, C.H.F. A Systematic Review of the Survival and Complication Rates of All-ceramic and Metal-ceramic Reconstructions after an Observation Period of at Least 3 Years. Part II: Fixed Dental Prostheses. Clin. Oral Implants Res. 2007, 18 (Suppl. 3), 86–96. [Google Scholar] [CrossRef] [PubMed]


| Controller Temperature | Sample Surface Temperature | HT Conditions | |
|---|---|---|---|
| in C | in C | Applied to | |
| 25 | 25 | ||
| 800 | 644 | sample 1 | |
| 900 | 732 | sample 2 | |
| 1000 | 828 | sample 3 | |
| 1100 | 908 | sample 4 |
Publisher’s Note: MDPI stays neutral with regard to jurisdictional claims in published maps and institutional affiliations. |
© 2021 by the authors. Licensee MDPI, Basel, Switzerland. This article is an open access article distributed under the terms and conditions of the Creative Commons Attribution (CC BY) license (http://creativecommons.org/licenses/by/4.0/).
Share and Cite
Hegele, P.; von Kobylinski, J.; Hitzler, L.; Krempaszky, C.; Werner, E. In-Situ XRD Study of Phase Transformation Kinetics in a Co-Cr-W-Alloy Manufactured by Laser Powder-Bed Fusion. Crystals 2021, 11, 176. https://doi.org/10.3390/cryst11020176
Hegele P, von Kobylinski J, Hitzler L, Krempaszky C, Werner E. In-Situ XRD Study of Phase Transformation Kinetics in a Co-Cr-W-Alloy Manufactured by Laser Powder-Bed Fusion. Crystals. 2021; 11(2):176. https://doi.org/10.3390/cryst11020176
Chicago/Turabian StyleHegele, Patrick, Jonas von Kobylinski, Leonhard Hitzler, Christian Krempaszky, and Ewald Werner. 2021. "In-Situ XRD Study of Phase Transformation Kinetics in a Co-Cr-W-Alloy Manufactured by Laser Powder-Bed Fusion" Crystals 11, no. 2: 176. https://doi.org/10.3390/cryst11020176