Article

Effects of Ni Additions on the High Temperature Expansion, Melting and Oxidation Behaviors of Cobalt-Based Superalloys

1
Institut Jean Lamour, Université de Lorraine, F-54000 Nancy, France
2
Faculté des Sciences et Technologies, Université de Lorraine, F-54500 Vandoeuvre-lès-Nancy, France
*
Author to whom correspondence should be addressed.
Crystals 2021, 11(2), 173; https://doi.org/10.3390/cryst11020173
Submission received: 23 December 2020 / Revised: 3 February 2021 / Accepted: 4 February 2021 / Published: 9 February 2021

Abstract

:
Nickel is often added to cobalt-based superalloys to stabilize their austenitic structure. In this work the effects of Ni on several high temperature properties of a chromium-rich cobalt-based alloy reinforced by high fraction of TaC carbides are investigated. Different thermal analysis techniques are used: differential scanning calorimetry (DSC), thermo-mechanical analysis (TMA) and thermogravimetry (TG). Results show that the progressive addition of nickel did not induce great modifications of microstructure, refractoriness or thermal expansion. However, minor beneficial effects were noted, including reduction of the melting temperature range and slight decrease in thermal expansion coefficient. The most important improvement induced by Ni addition concerns the hot oxidation behavior. In this way, introducing several tens wt % Ni in this type of cobalt-based alloy may be recommended.

Graphical Abstract

1. Introduction

Cobalt-based alloys have existed since the first half of the last century. The two main applications were prosthetic dentistry [1] and high temperature components in aeroengines [2]. Early on, nickel was present in many compositions of cobalt alloys, even in dental alloys (e.g., Vitallium, Co–27Cr–5.5Mo–2.5Ni–0.25C). In the last decades, nickel was removed from many “predominantly base” alloys because of the possibility of induced allergic diseases. In contrast, this element still features in most of cobalt-based superalloys [3]. Its role is notably favoring the austenitic structure of cobalt alloys at medium temperatures, by hindering the allotropic transformation to hexagonal compact [4]. There are also several cobalt-based alloys which do not contain nickel, Mar-M 302 or WI-52 for instance. Because of its melting point—which is about 40 °C lower than the cobalt’s one (1455 against 1495 °C)—nickel may be suspected to lower a little the refractoriness of some cobalt-based alloys. Nickel is an important element in the chemical compositions of some of the famous low-expansion alloys named Invar [5]. The presence of a lot of chromium in cobalt-based superalloys for increasing the high temperature oxidation and corrosion resistances [6] may induce an enhanced thermal expansion for them [7,8]. For constant Cr content in the alloy, additions of nickel may possibly correct partially this chromium effect. Another important property for the use of metallic materials at high temperature in gaseous environments that are generally chemical aggressive is the resistance to hot oxidation and hot corrosion. It has been known for a long time that the behavior of nickel-free alloys with cobalt and chromium as the main elements are not very good. Several Cr contents were very early tested in binary Co–Cr alloys, for example by Kofstad [9,10,11,12] in the 10–35 wt % Cr range, for exploring the behavior variation of these alloys in oxidation at 800 to 1300 °C versus the Cr content. This demonstrated that the Cr content must be present at the highest contents tested in these works to allow a real protection of such alloys by the development of a continuous chromia scale. Unfortunately, as consequences, such high Cr amounts have not only the deleterious effect noted above concerning thermal expansion but also possible decreases in refractoriness and metallurgical instabilities (precipitation of brittle TCP-type phases). Nickel additions to cobalt-based alloys are recognized to facilitate volume chromium diffusion which can be of great help in parallel with grain boundary chromium diffusion which can be insufficient in severe conditions. In this way, Ni may allow chromium to be present in not too high contents in the alloy.
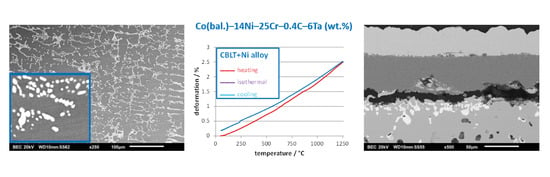
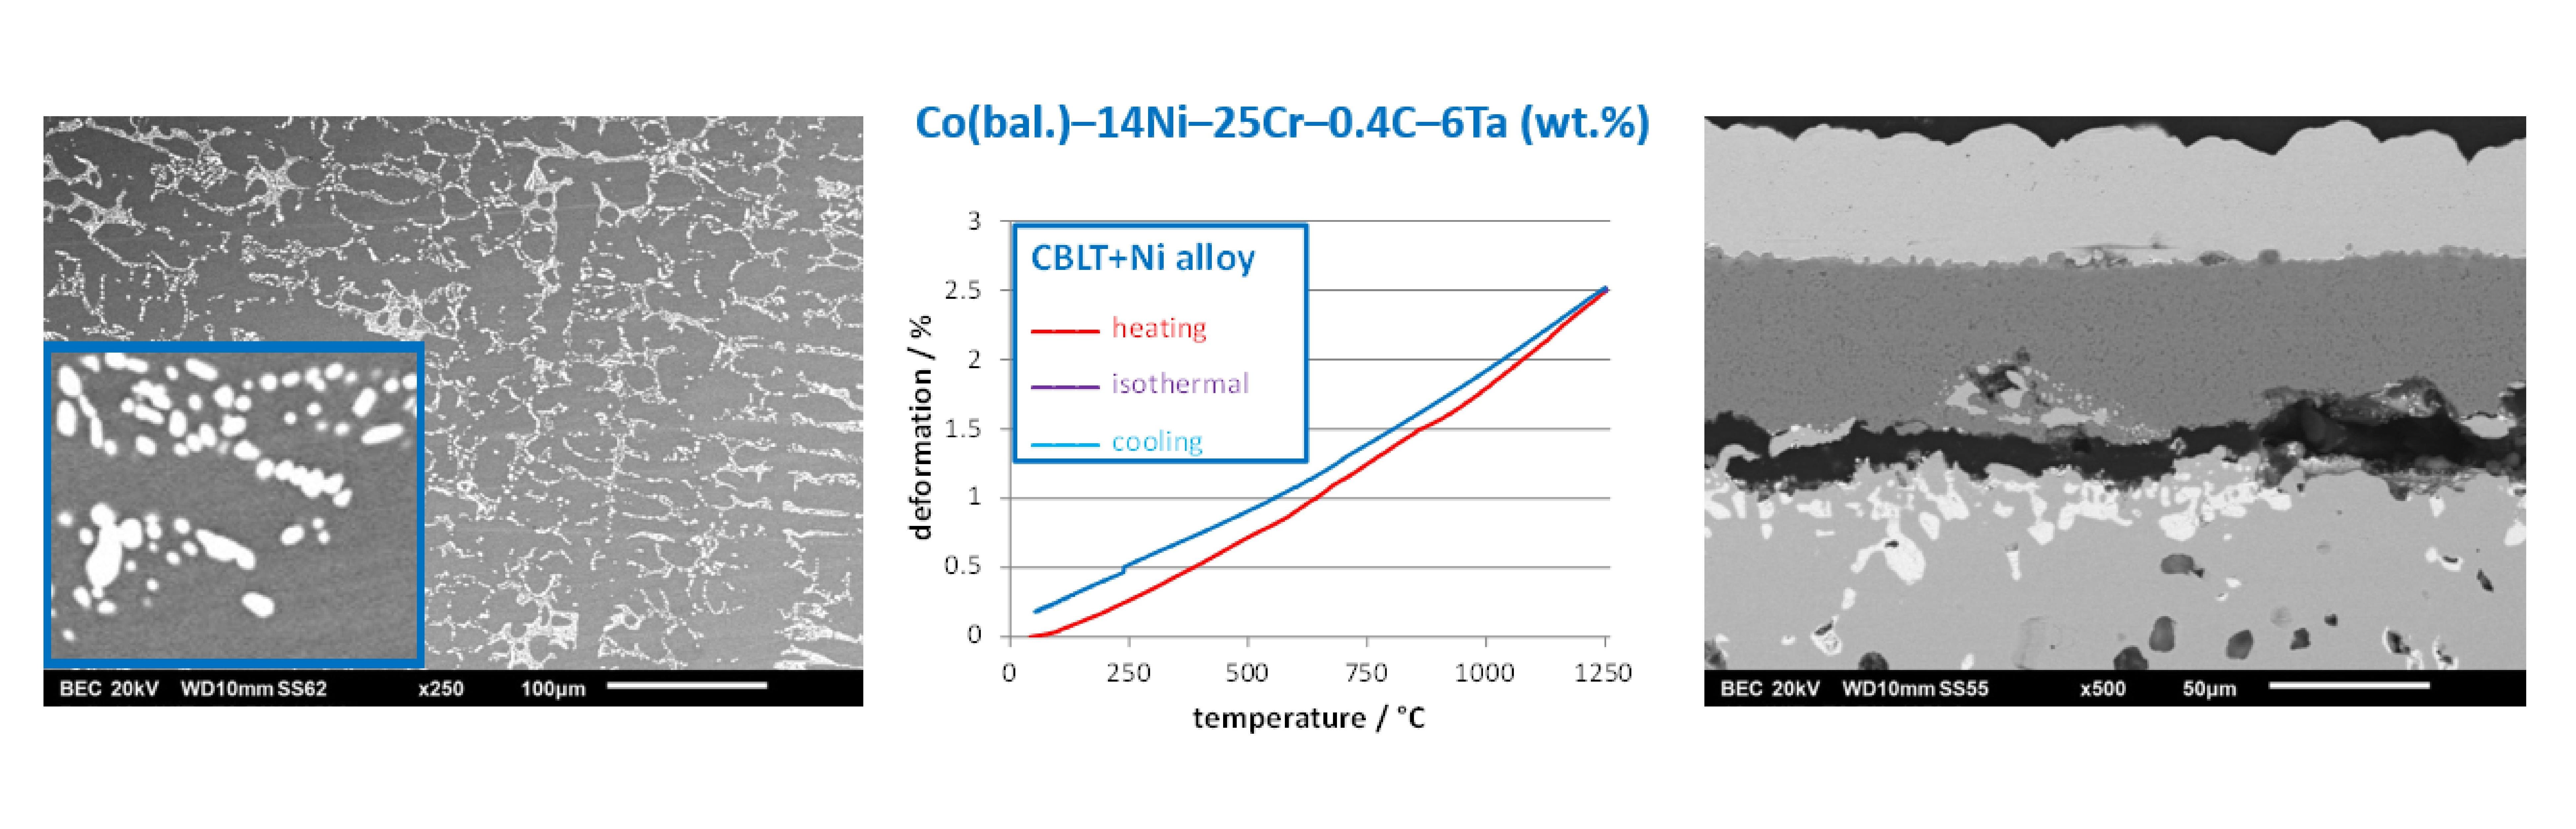
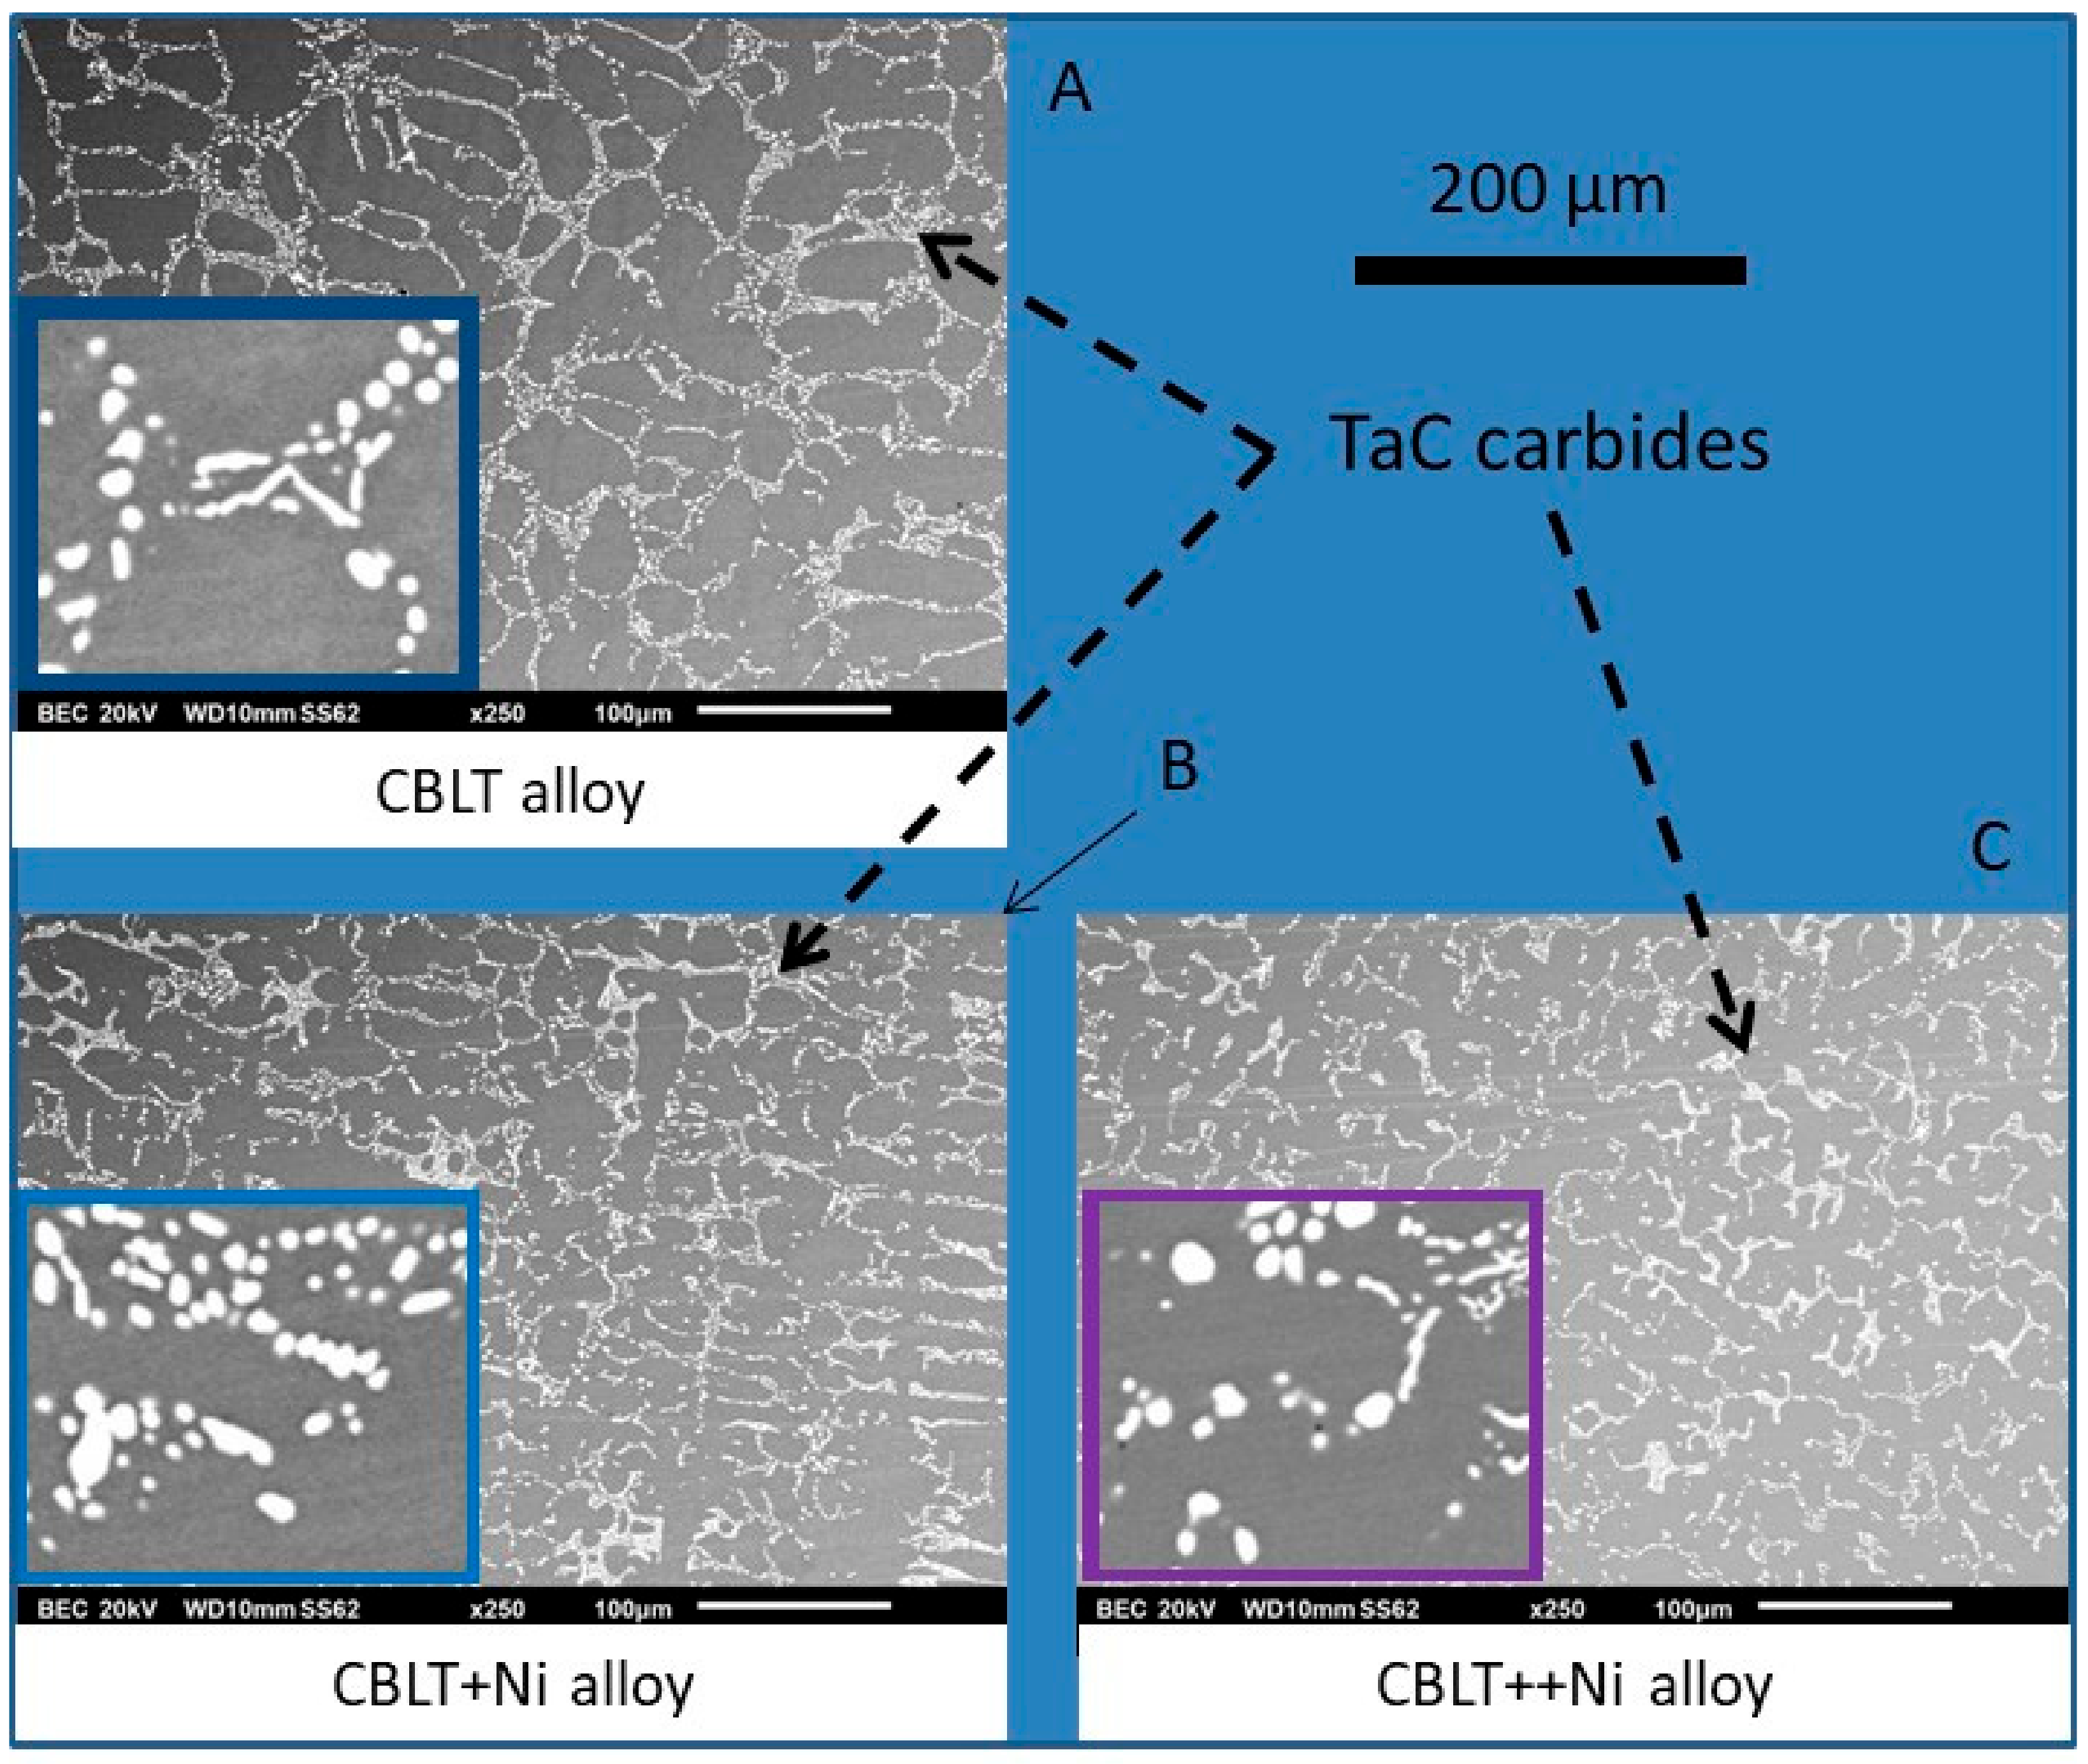
The present work is focused on a particular cobalt-based alloy. Its composition is Co(bal.)–25Cr–0.4C–6Ta, all contents being in weight percent. Due to its particularly high tantalum and carbon contents (weight contents rated in order to have the same atomic contents in Ta and in C), this alloy benefits from both a matrix mechanically resistant at high temperature and an interesting interdendritic carbides network. This one is exclusively made of script-like eutectic TaC carbides, efficient for maintaining the interdendritic cohesion for a long time at elevated temperature. Unfortunately, the oxidation resistance of this alloy in air at temperatures high enough to possibly reveal its superior mechanical strength is not good enough to really test it in conditions close to an industrial application. Increasing its chromium content beyond the 25 wt % is potentially dangerous because of the risk of TCP precipitation due to the rather high Ta content.
A possible way to improve its oxidation behavior without resorting to coatings (which can be difficult to efficiently deposit on the surface of complex-shaped components), is to add nickel to take benefit from an easier Cr diffusion. Another possible—but not really expected—effect may be a slightly lowered thermal expansion coefficient. At the same time, it is unfortunately possible to observe detrimental effects such as a decrease in refractoriness.
In this work a new ingot of the Co(bal.)–25Cr–0.4C–6Ta composition will be elaborated, as well as two ingots of nickel-added versions (with 13.7 wt % Ni and 27.4 wt % Ni), following the same fabrication procedure. The three alloys will be subjected to differential scanning calorimetry (DSC), to thermo-mechanical analysis (TMA) and to thermogravimetry (TG) for oxidation. This will allow verification of whether such Ni additions really improve the oxidation behavior as well as the control of their consequences regarding the two other properties under interest.

2. Materials and Methods

2.1. From Elaboration to Samples

The three alloys were prepared by high frequency induction melting under 300 mbars of pure Ar (HF furnace, CELES, France), from small parts of pure elements (Co, Ni, Cr, Ta and graphite rods from Alfa Aesar). The obtained ovoid-shaped ingots, with a mass of about 40 g, were first cut in different parts using an abrasive cutter. They were then machined with a metallographic saw to prepare the samples for the different examinations and tests. The dimensions of each sample were optimized to obtain the best compromise between the dimensional sample possibilities for each thermal test apparatus and the necessity to have enough material to be representative of the behavior of the whole alloy (DSC and TMA) and of its surface (TG). With volumes all higher than 20 mm3 and external surfaces of more than 2 cm2 the results will be independent of the microstructure texture (mix of various structural orientation and microstructure fineness of about 20 µm). This allowed only one test to be performed by thermal characterization.

2.2. Control of the Chemical Compositions, As–Cast Microstructures and Hardnesses

The chemical compositions were measured on embedded, ground and polished mirror-like metallographic preparations, using the energy dispersion spectrometer (EDS) attached to a scanning electrons microscope (JSM-6010LA, JEOL, Tokyo, Japan). With this SEM, the microstructures were observed in back scattered electrons mode (BSE). The acceleration voltage for all these analyses and observations was 20 kV.
The characterization of the as-cast states of the three alloys was completed by performing Vickers indentation three times per alloy. This was done using a macro–indentor (Testwell Wolpert, Germany) machine with a load equal to 10 kg.

2.3. Assessment of the Melting and Solidification Temperature Ranges

A 2 × 2 × 5 mm3 parallelepiped alloy part was placed in a small alumina crucible. These dimensions are almost the maximal ones to be compatible with the alumina crucible capacity. A thermobalance coupled with a differential thermal analyzer (TG-ATD 92.16-18, SETARAM, Caluire, France) was used for performing DSC runs to determine the temperatures of melting start, melting end, solidification start and solidification end. The first applied cycle—heating at +20 °C min−1 up to 1200 °C and at +5 °C min−1 up to 1500 °C followed by cooling down to 1200 °C at −5 °C min−1—aimed to specify these temperatures values for the as-cast microstructure resulting from the rapid solidification in contact with the cold metallic crucible of the HF furnace. It was followed by a second cycle—heating from 1200 to 1500 °C at +5 °C min−1 and cooling from 1500 to 1200 °C at −5 °C min−1—to measure the same temperatures but for a version of the alloy which solidified much slower than during the elaboration with the HF furnace. Finally, cooling was done between 1200 °C and ambient temperature at −20 °C min−1.

2.4. Behaviors in Thermal Expansion and Thermal Contraction; Dimensional Stability at Elevated Temperature

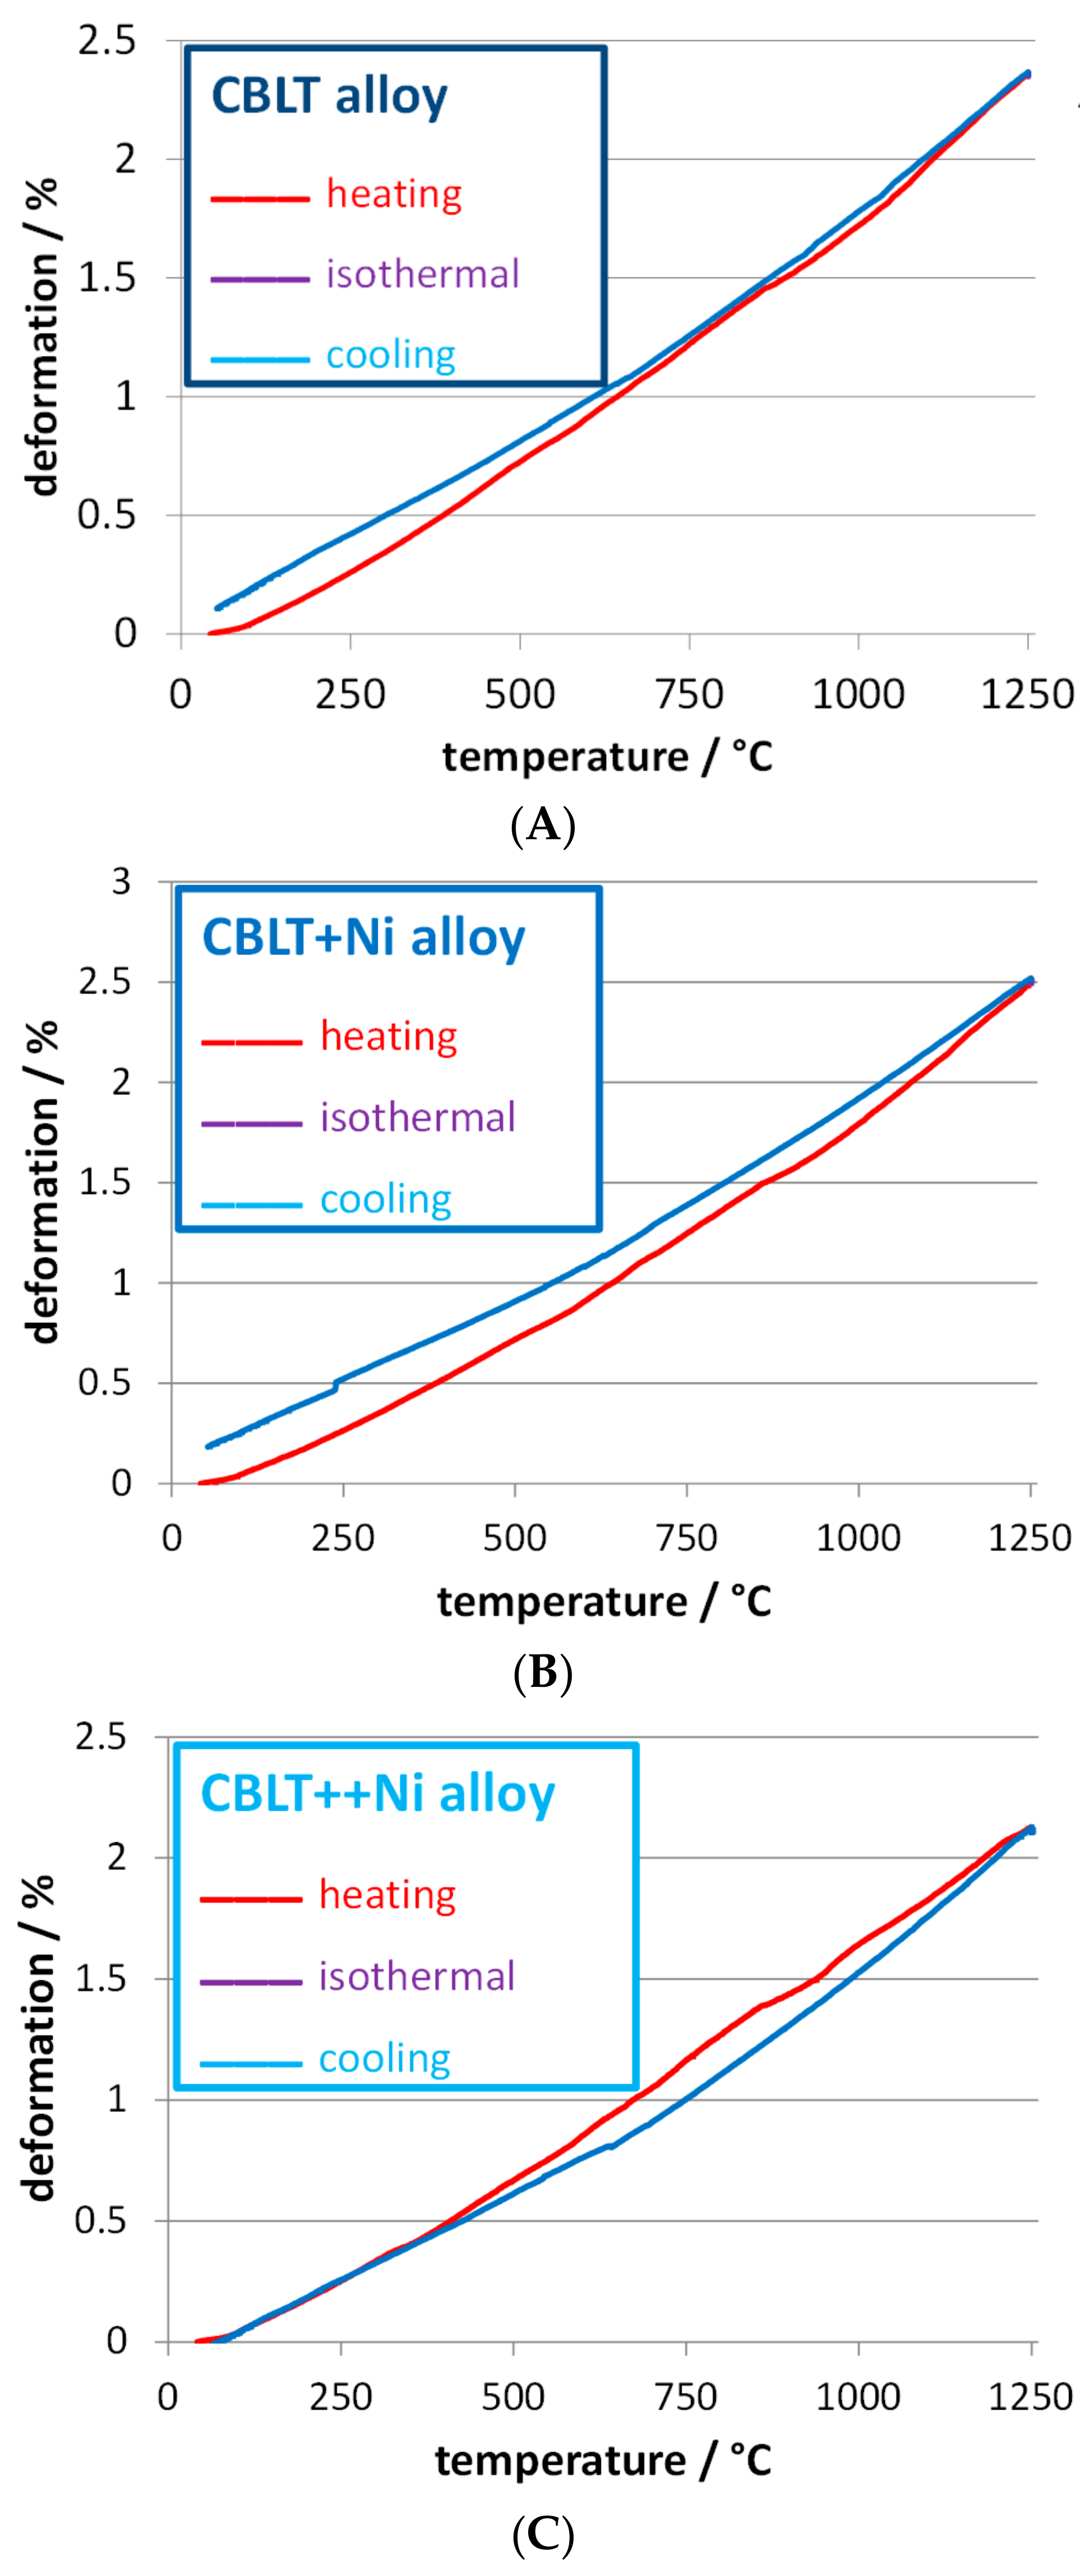
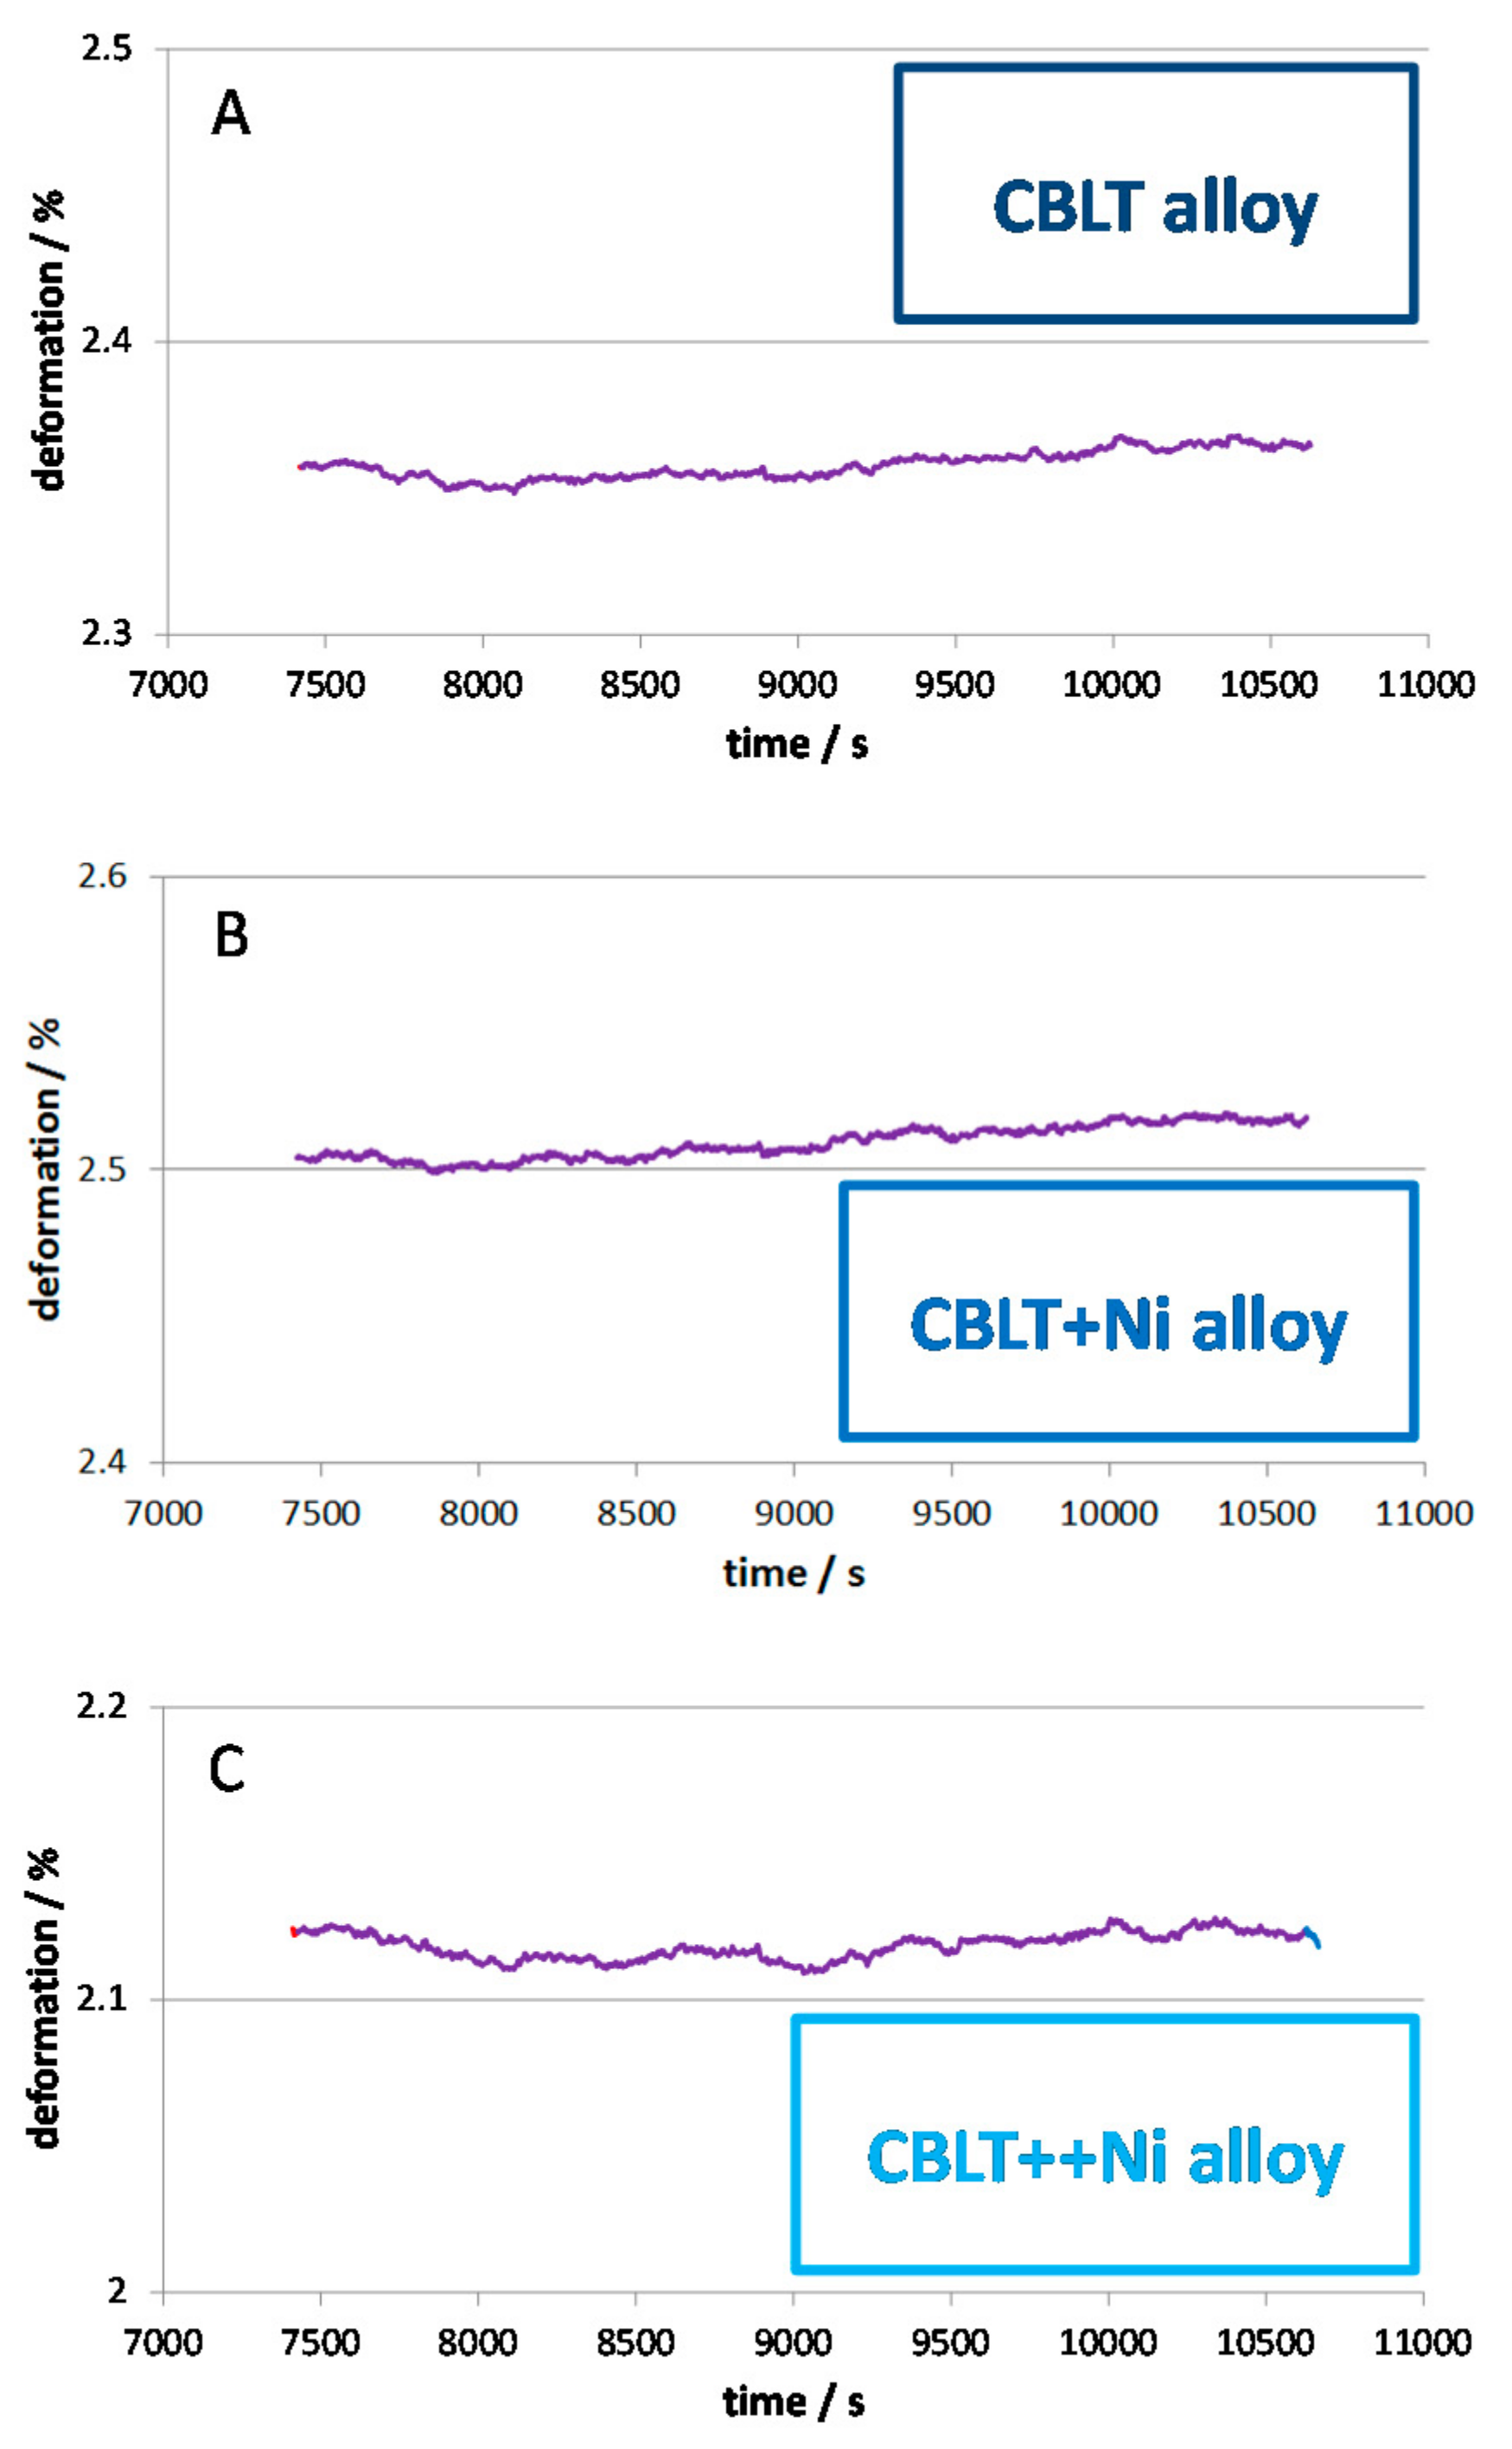
A 7 × 7 × 3 (expansion direction) mm3 parallelepiped alloy part was prepared to characterize the dimensional behavior of the alloy during heating up to a high temperature, during an isothermal stay at this high temperature, and during the cooling down to ambient temperature. The dimensions of the samples are close to those that are recommended for the used thermo–dilatometer (TMA 92.16-18, SETARAM, Caluire, France). Heating up to 1250 °C and cooling down to ambient temperature were carried out at +10 °C min−1 and −10 °C min−1 respectively. The two were separated from one another by a stage at 1250 °C applied for 1 h. The thermo–mechanical analysis (TMA) runs allowed observing possible phase transformations, and at least assessing the values of the thermal expansion coefficients (TEC) at heating and at cooling. The 1 h of isothermal exposure between heating and cooling allowed observation of the possible evolution of the thickness of the samples due to phase transformation or stress release.

2.5. Kinetic of Oxidation at High Temperature and Oxide Scale Behavior during Cooling

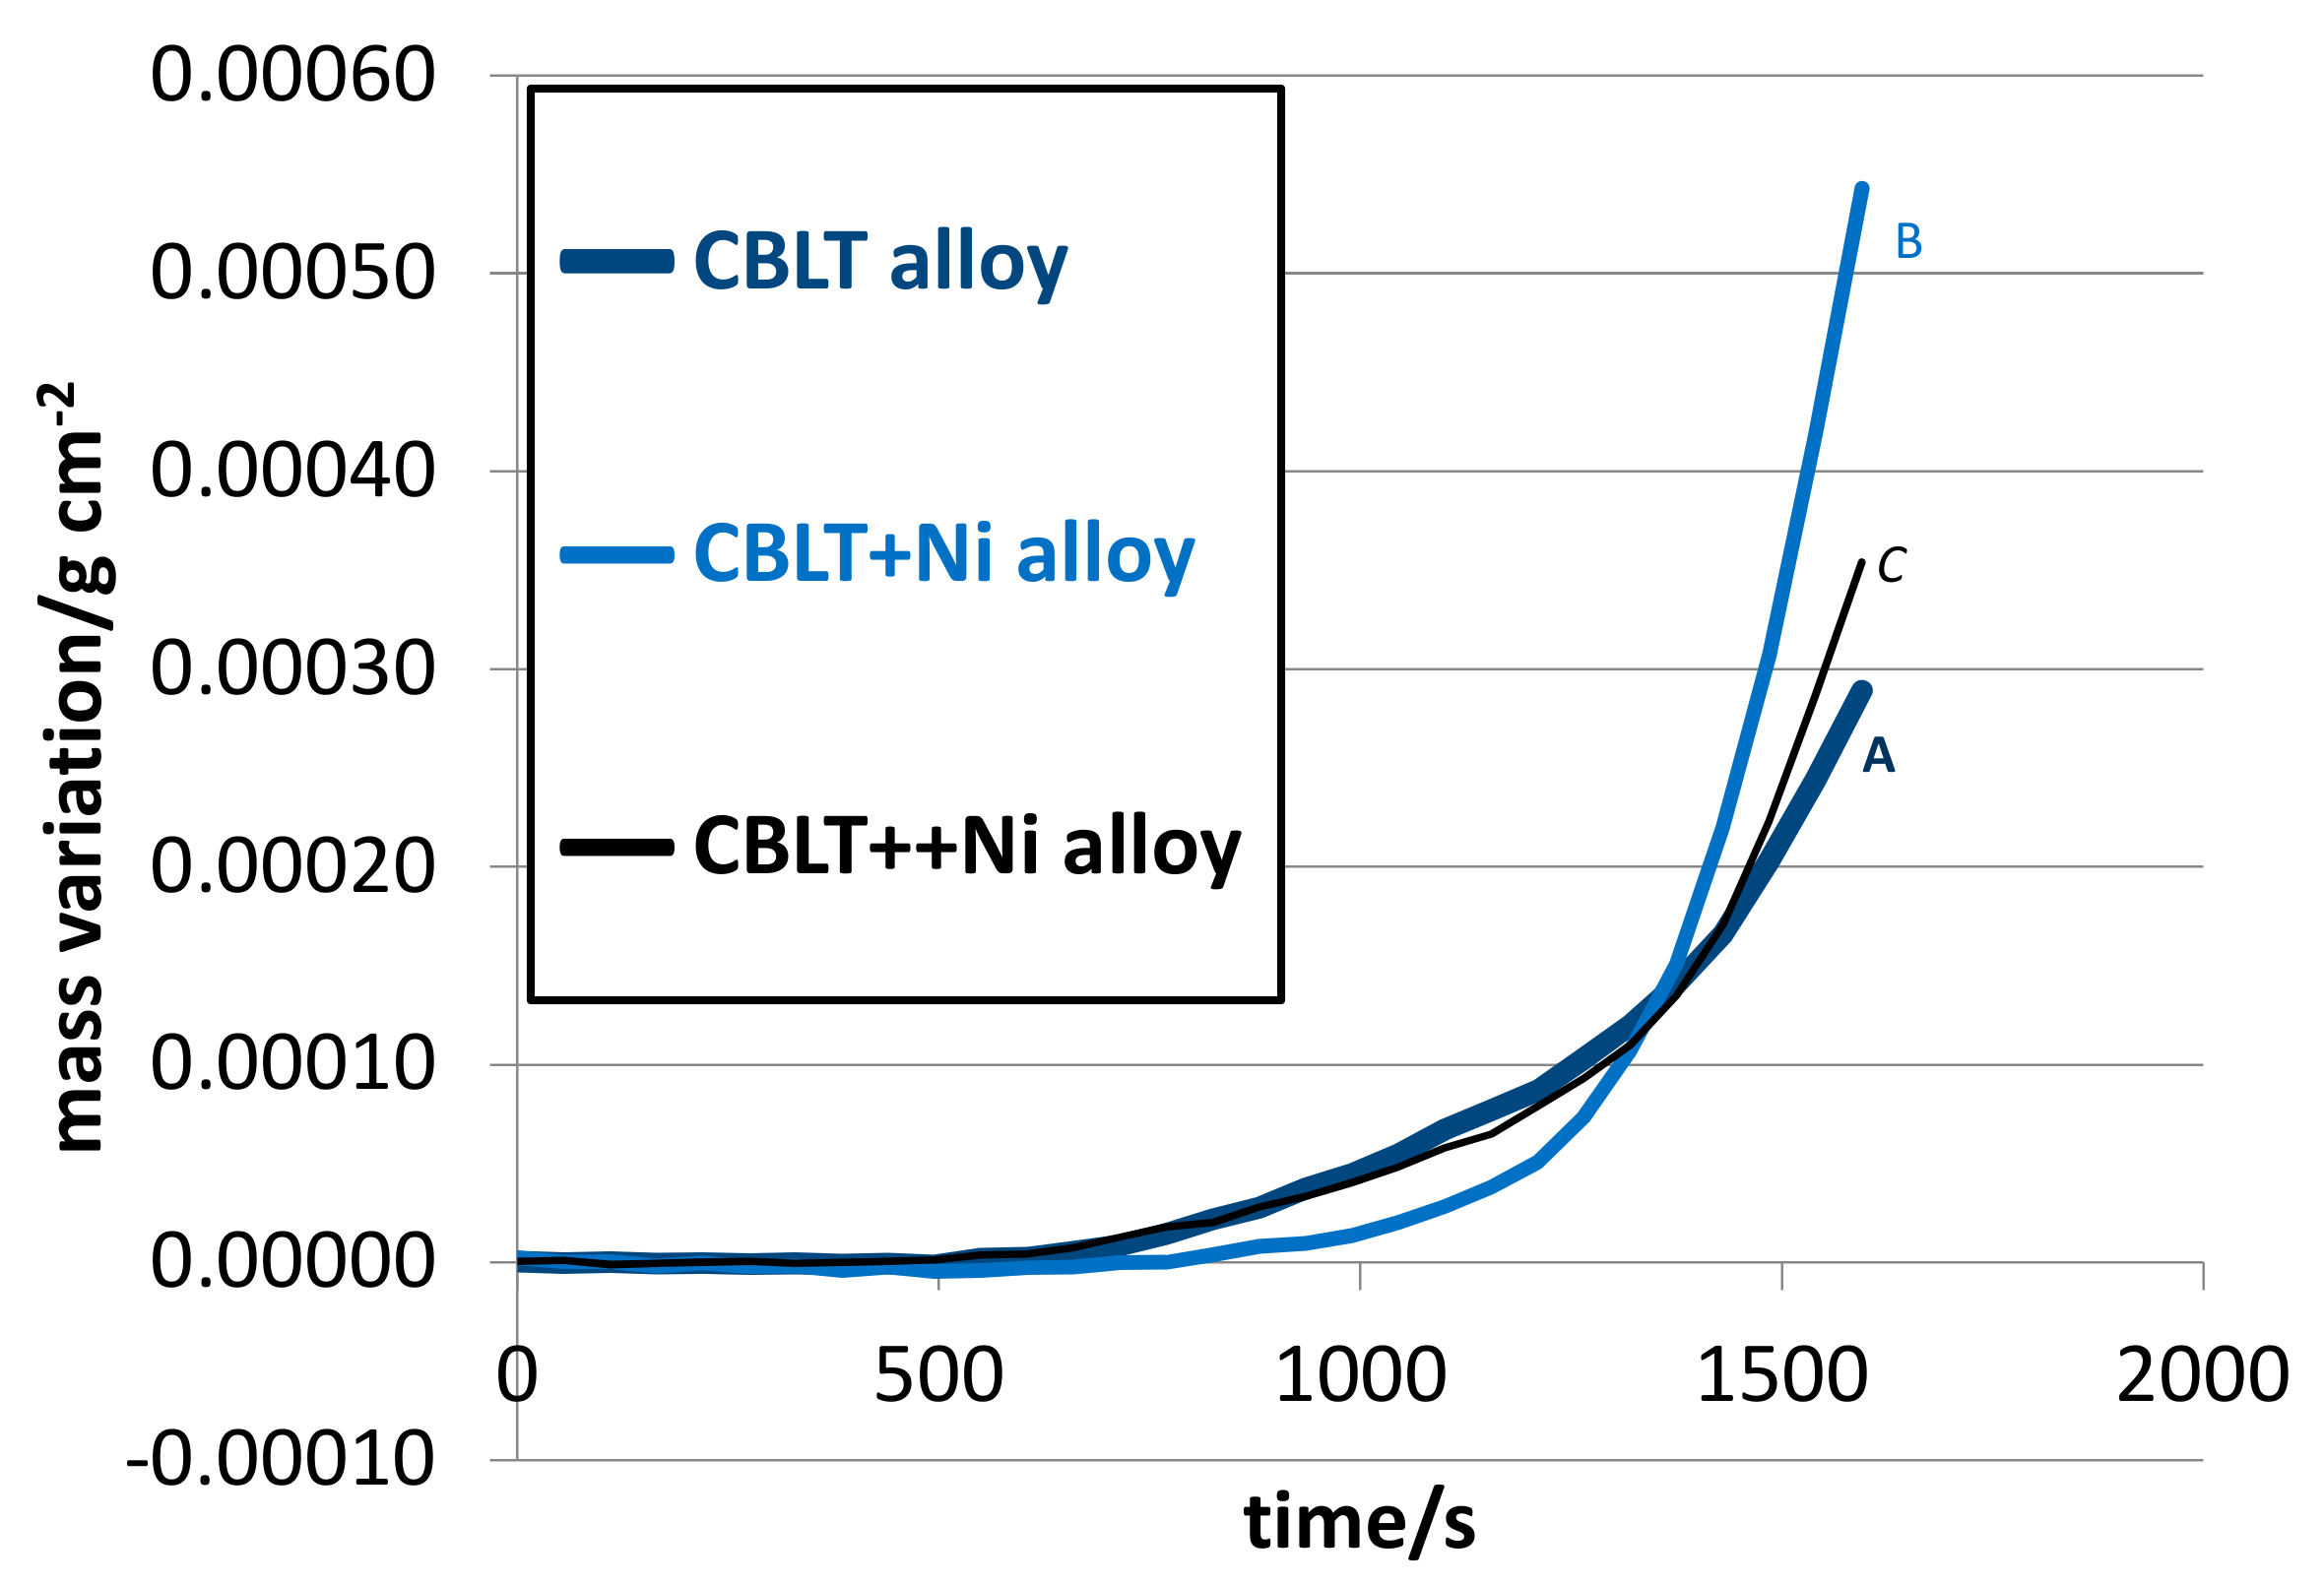
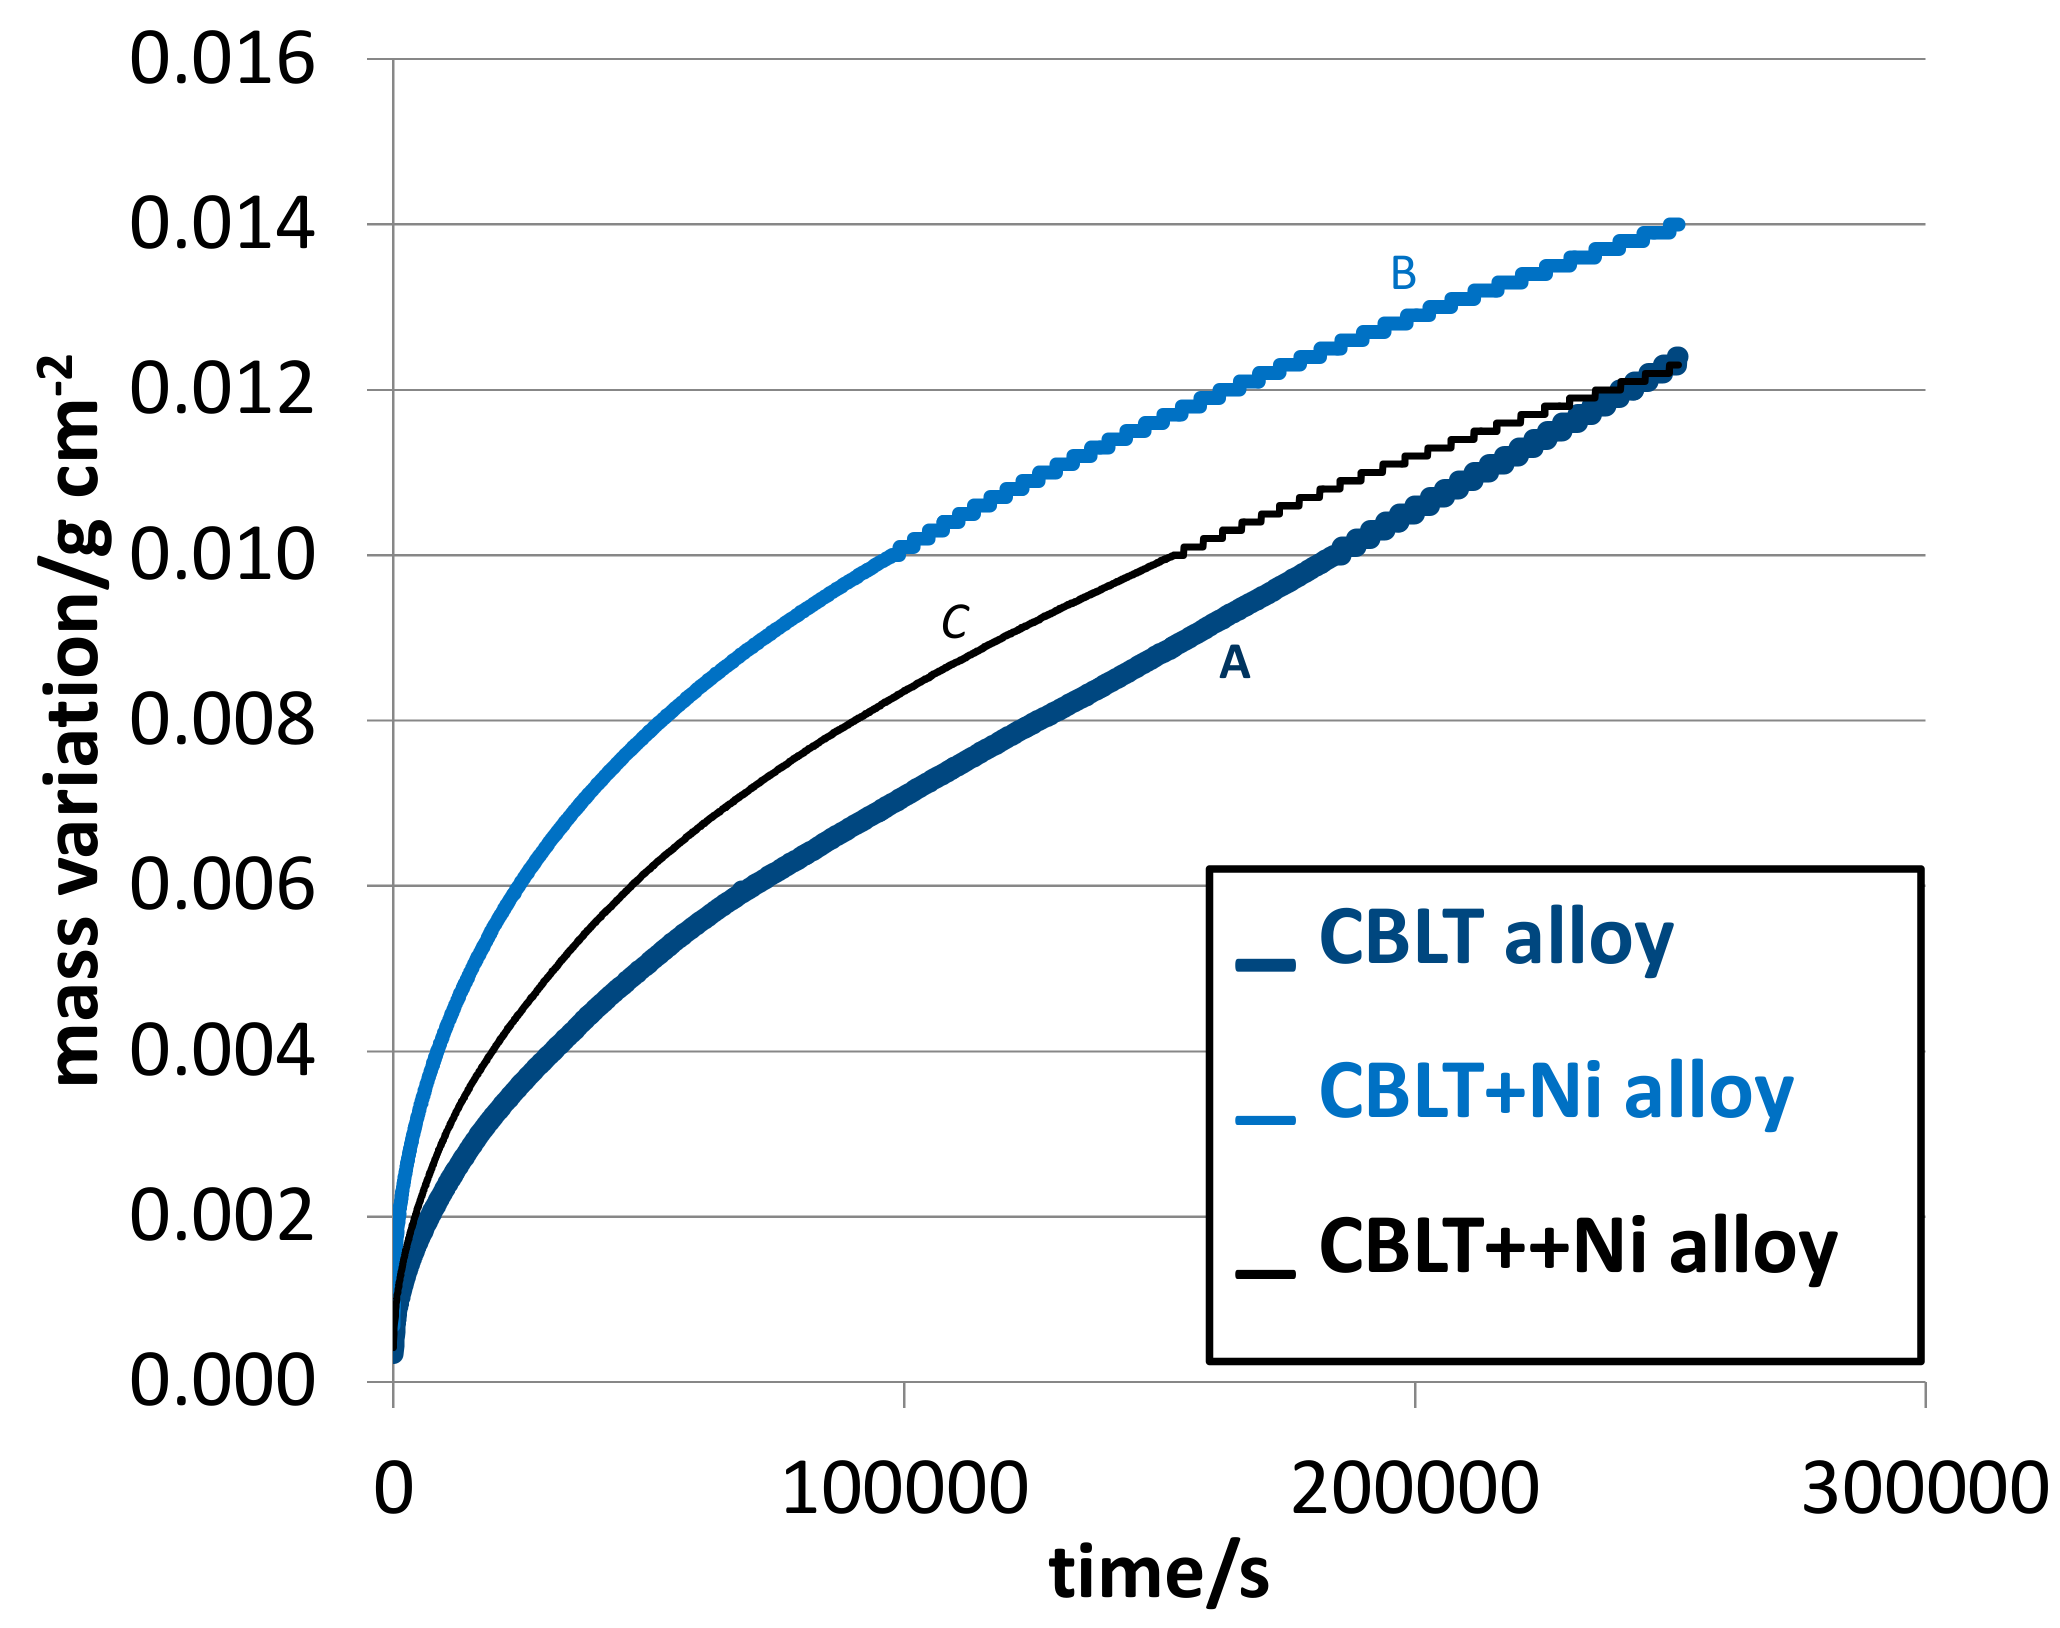
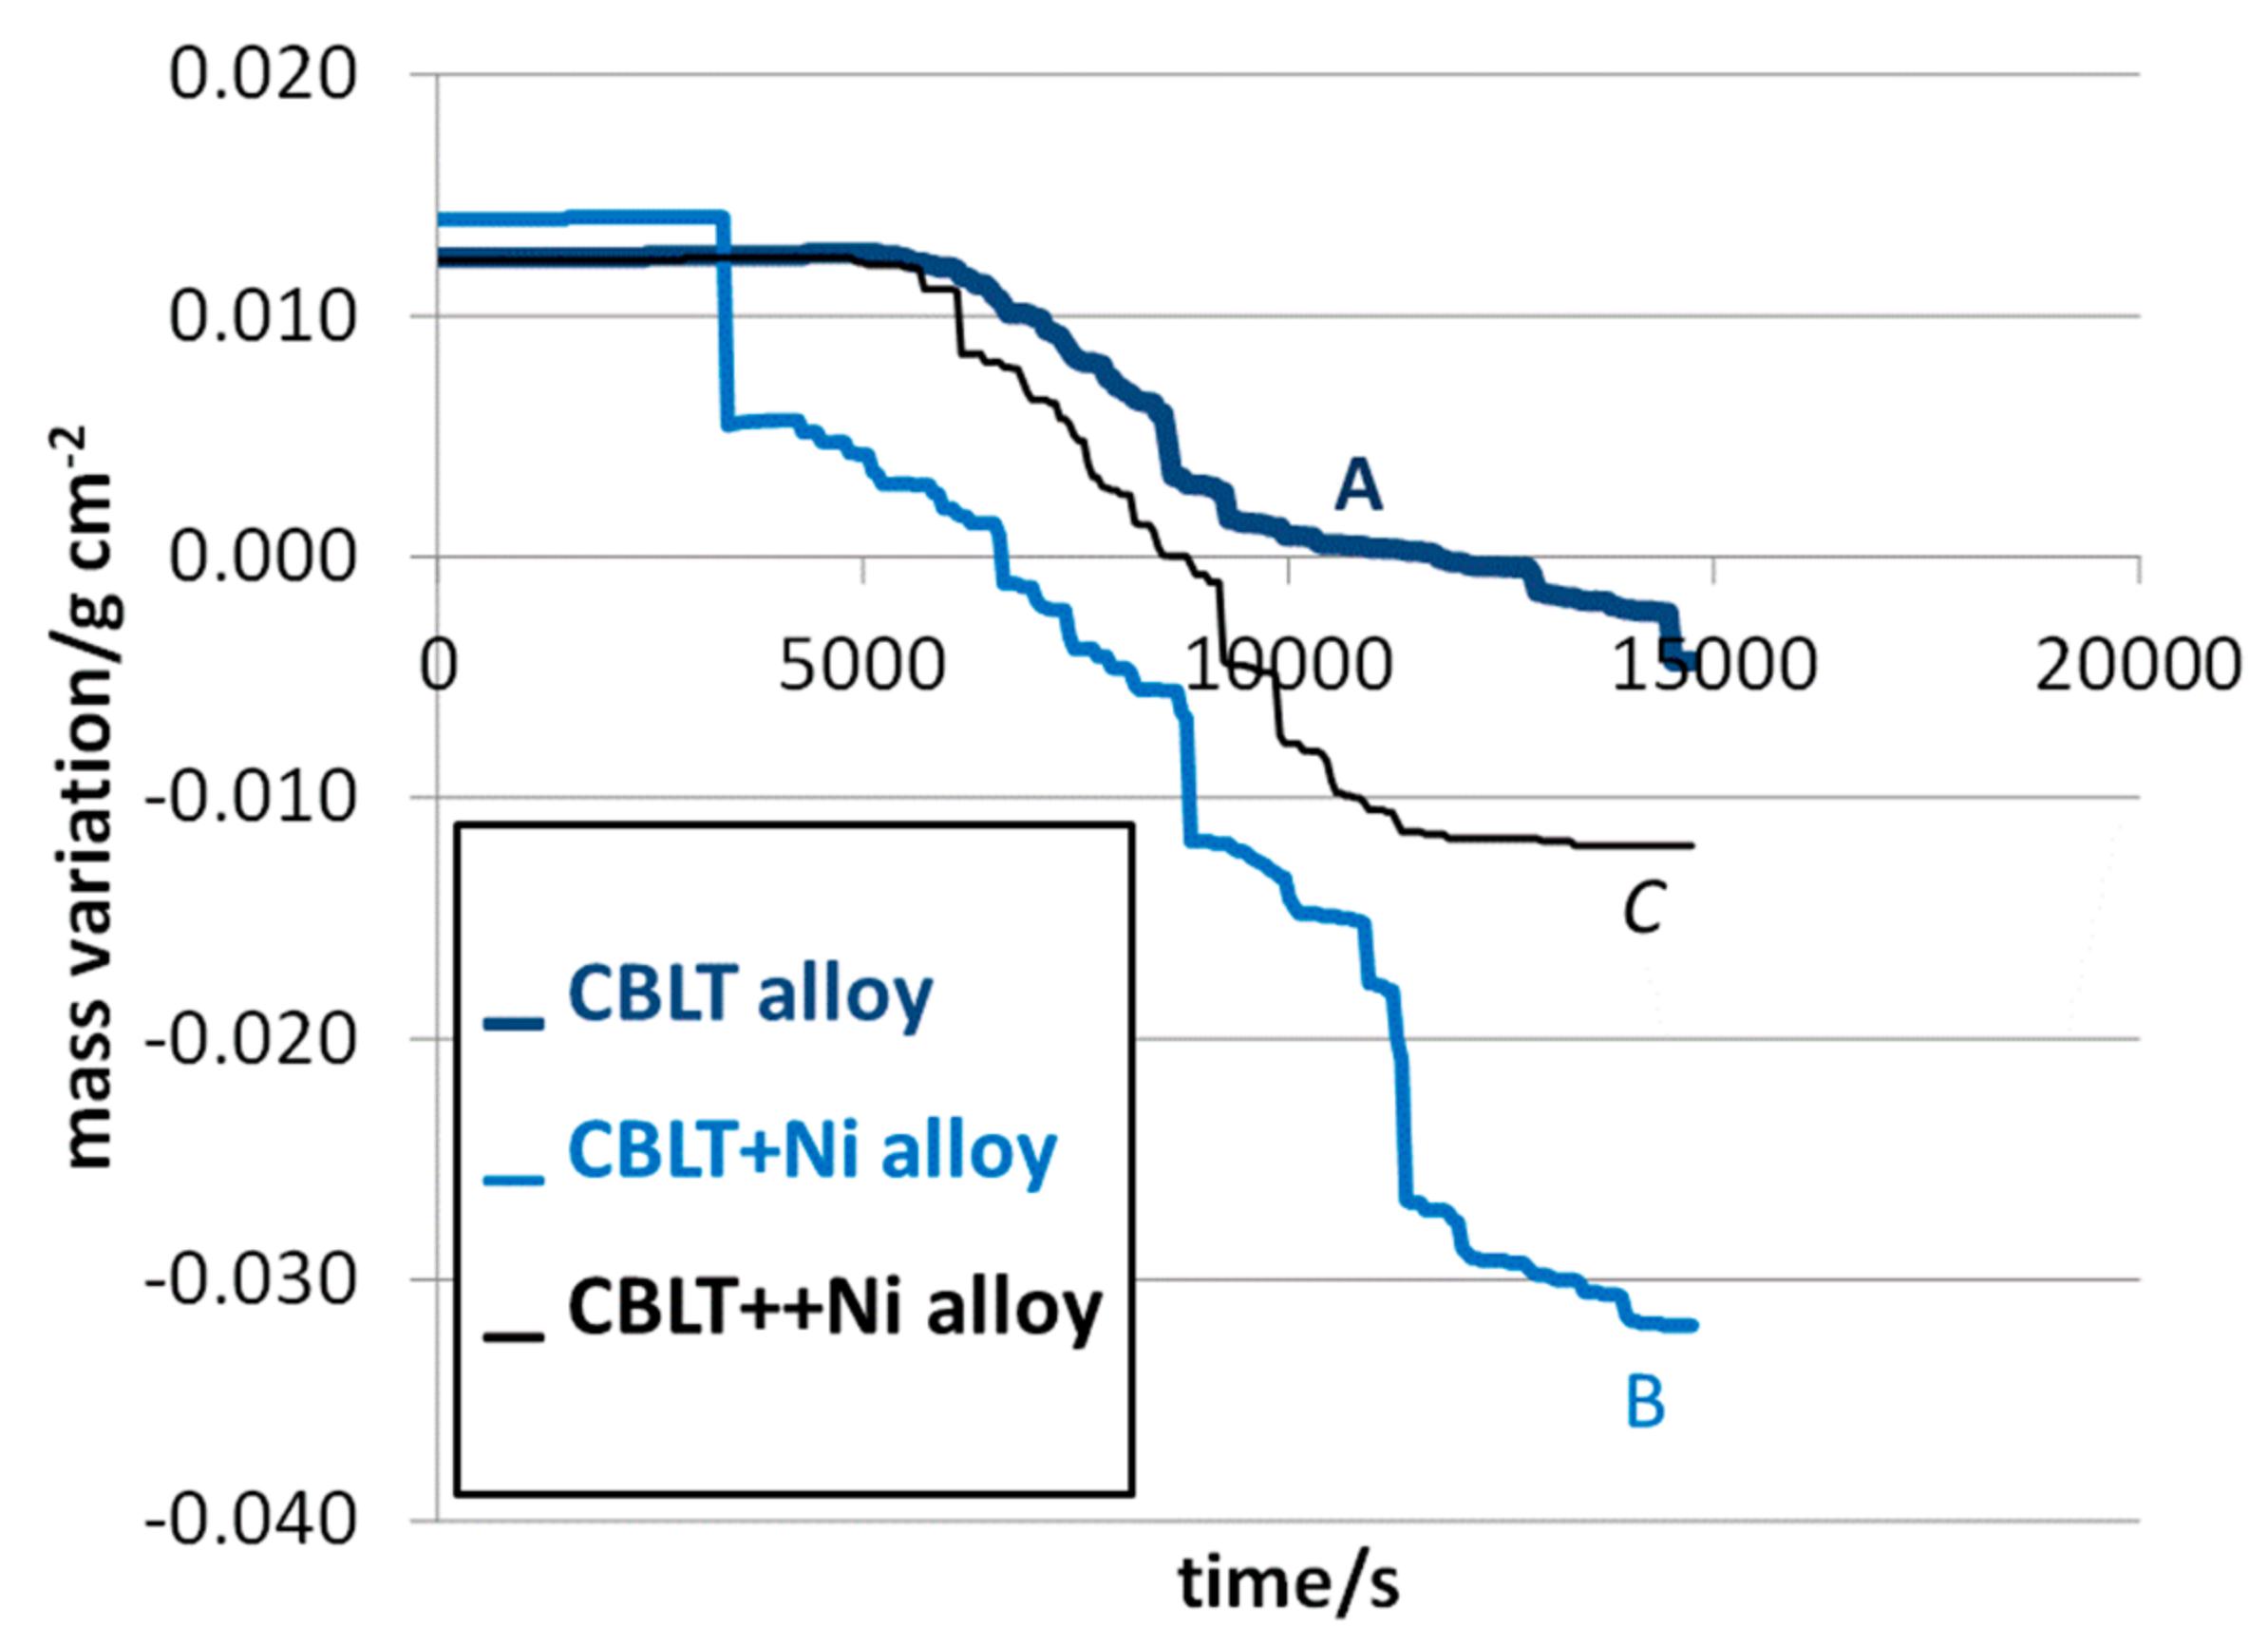
An 8 × 8 × 3 mm3 parallelepiped alloy part (maximal dimensions compatible with the hot zone size) was ground with 1200-grit SiC papers to initialize all the six faces. The same papers were used to smooth edges and corners for avoiding any too early local catastrophic oxidation. Smoothing edges and corners also allows limiting stresses in the external oxide during the cooling to do not facilitate scale spallation at cooling. The sample was hung, with an alumina-gained platinum wire, in the hot zone of a thermo–balance (TGA 92.16-18, SETARAM, France). The heating, isothermal stage and cooling were carried out in a 1.5 L h−1 flow of dry synthetic air (80% N2–20% O2). Heating was performed at +20 °C min−1 up to 1250 °C, the temperature at which the sample stayed thereafter during 70 h. At the end of this isothermal stage, a cooling at −5 °C min−1 down to ambient temperature was applied. The low level of this cooling rate aimed to prevent the most possible oxide scale spallation. In the recorded mass variation files obtained with the three TG runs:
  • The heating part was kept for studying the oxidation progress during the heating (correction from air buoyancy variation and procedure described in [13]);
  • The isothermal part was classically exploited to kinetically characterize isothermal oxidation (after correction from chromia volatilization by adding a (Kv × t) term to the mass gain, with Kv taken equal to 200 × 10−10 g cm−2 s−1 [14]);
  • The cooling part was kept for studying the oxide scale spallation progress (correction from air buoyancy variation and procedure described in [15]).

2.6. Metallographic Examination of the Oxidized Samples

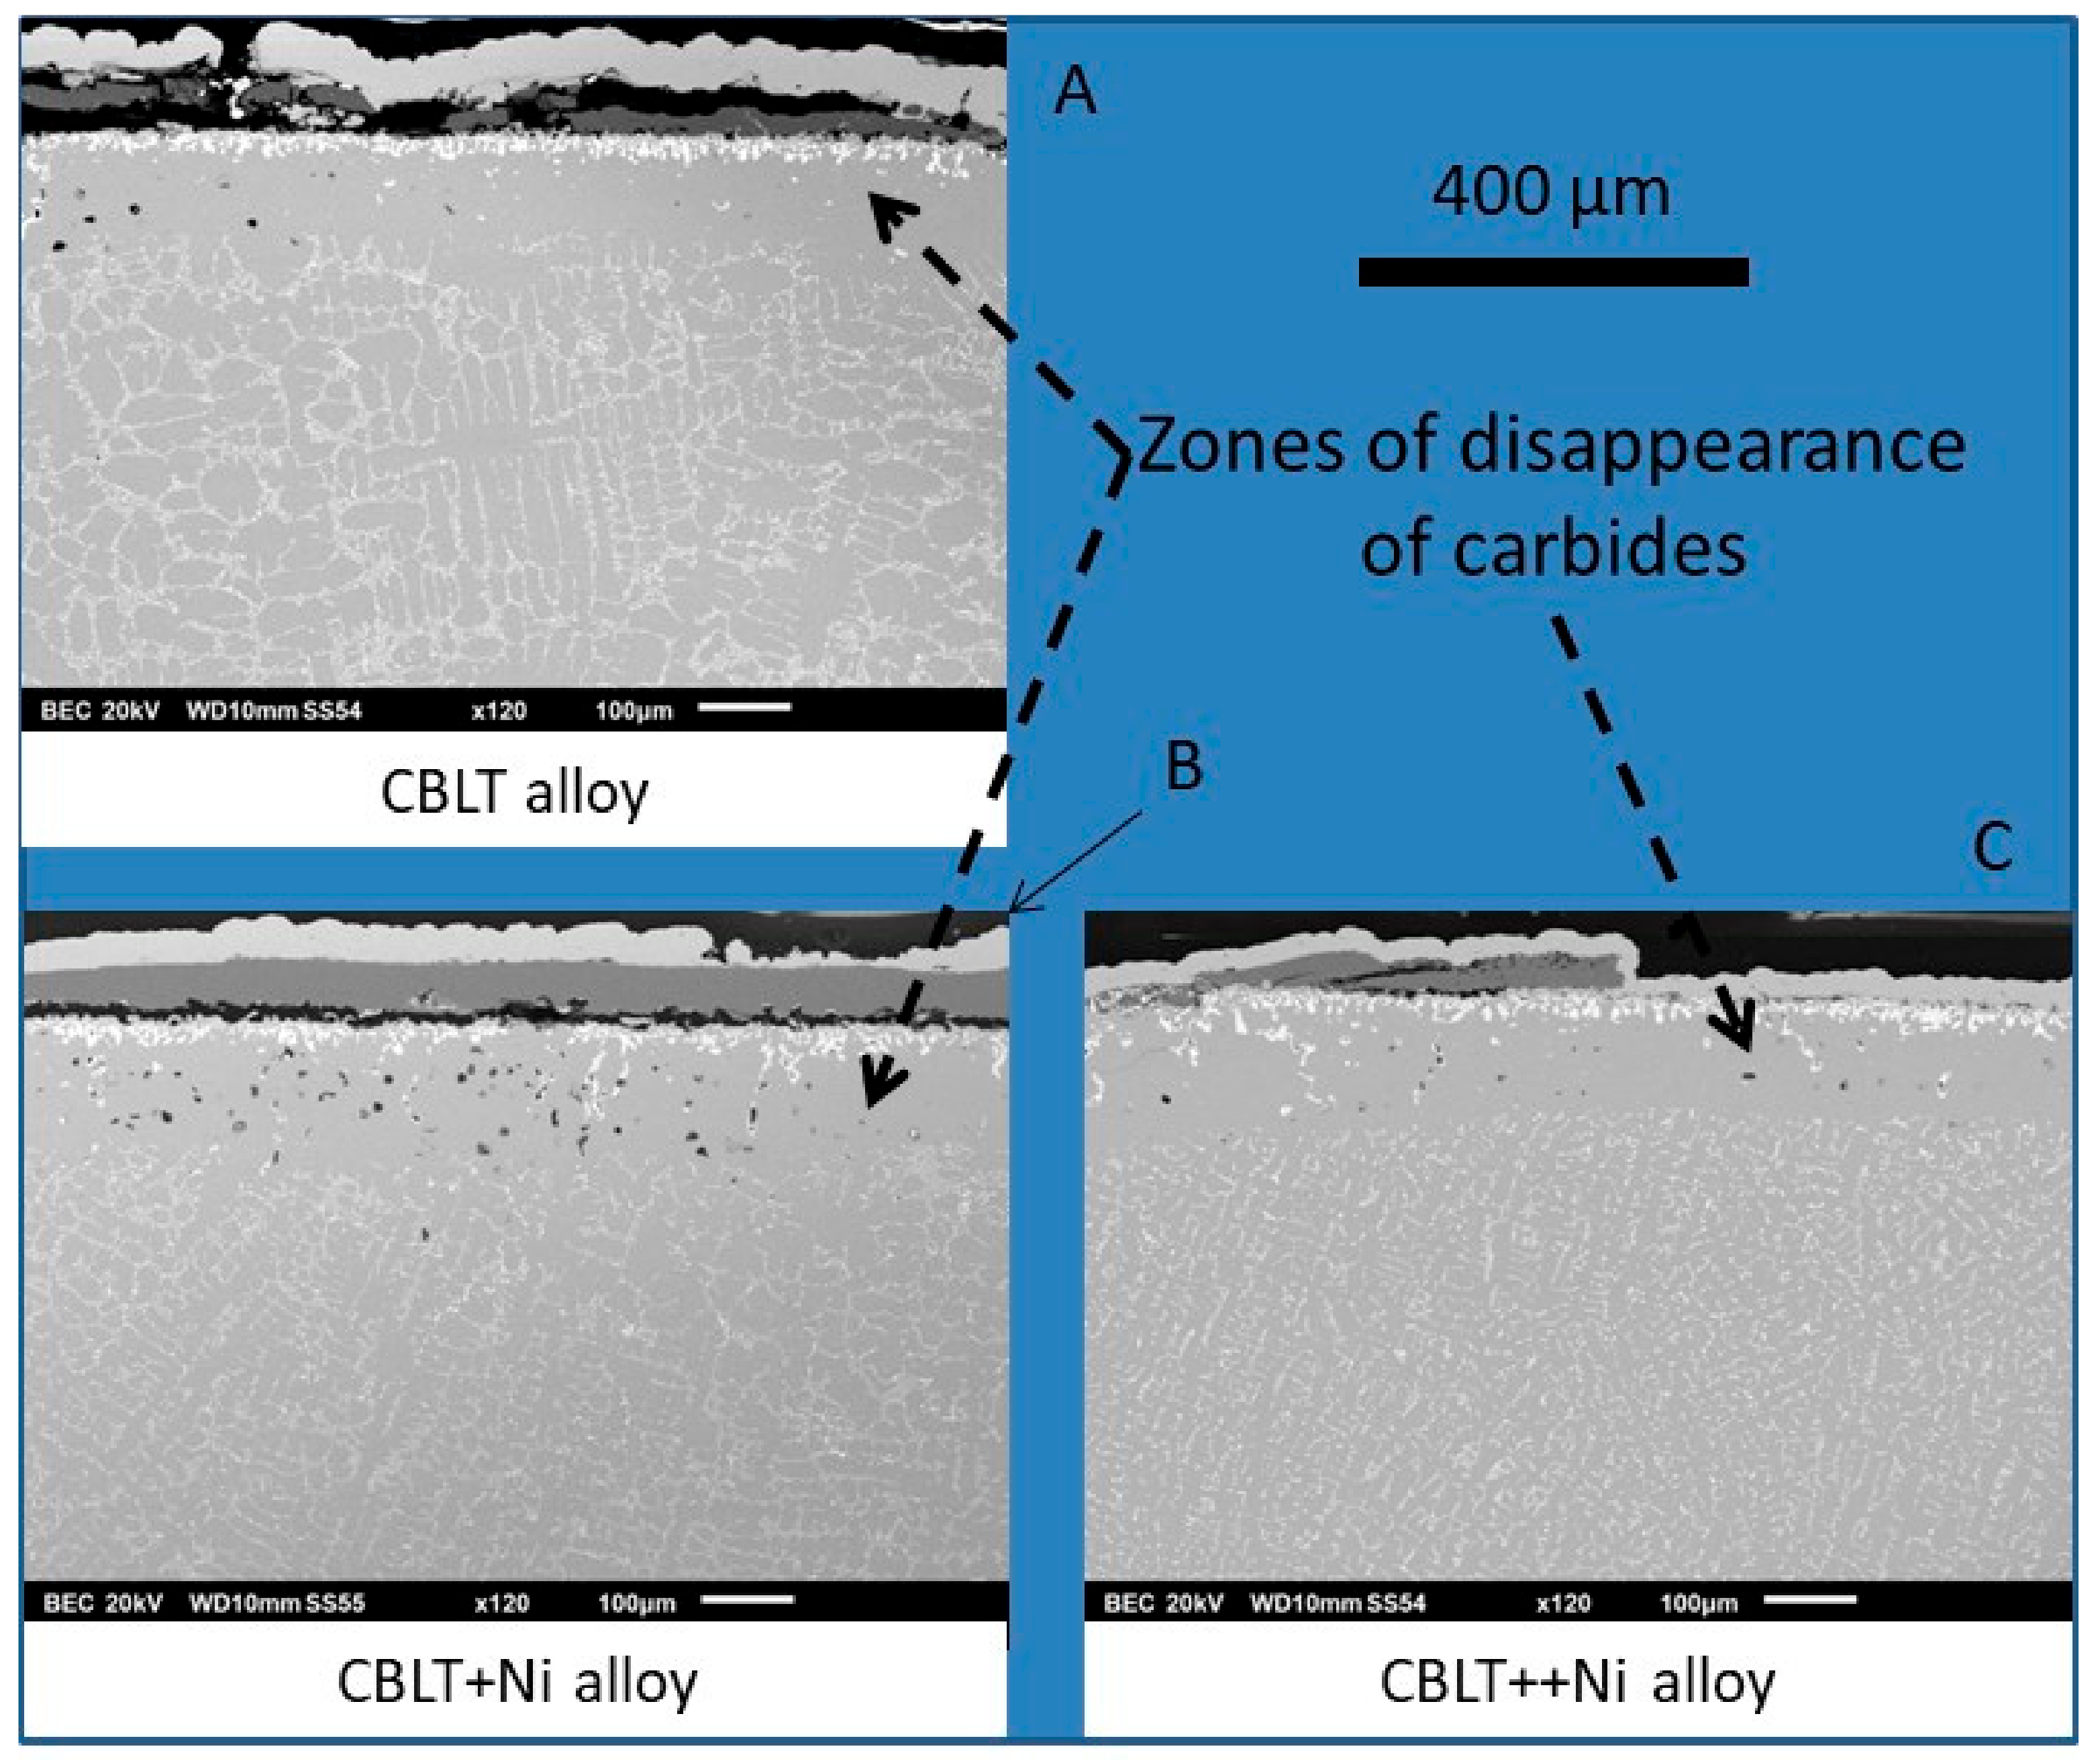
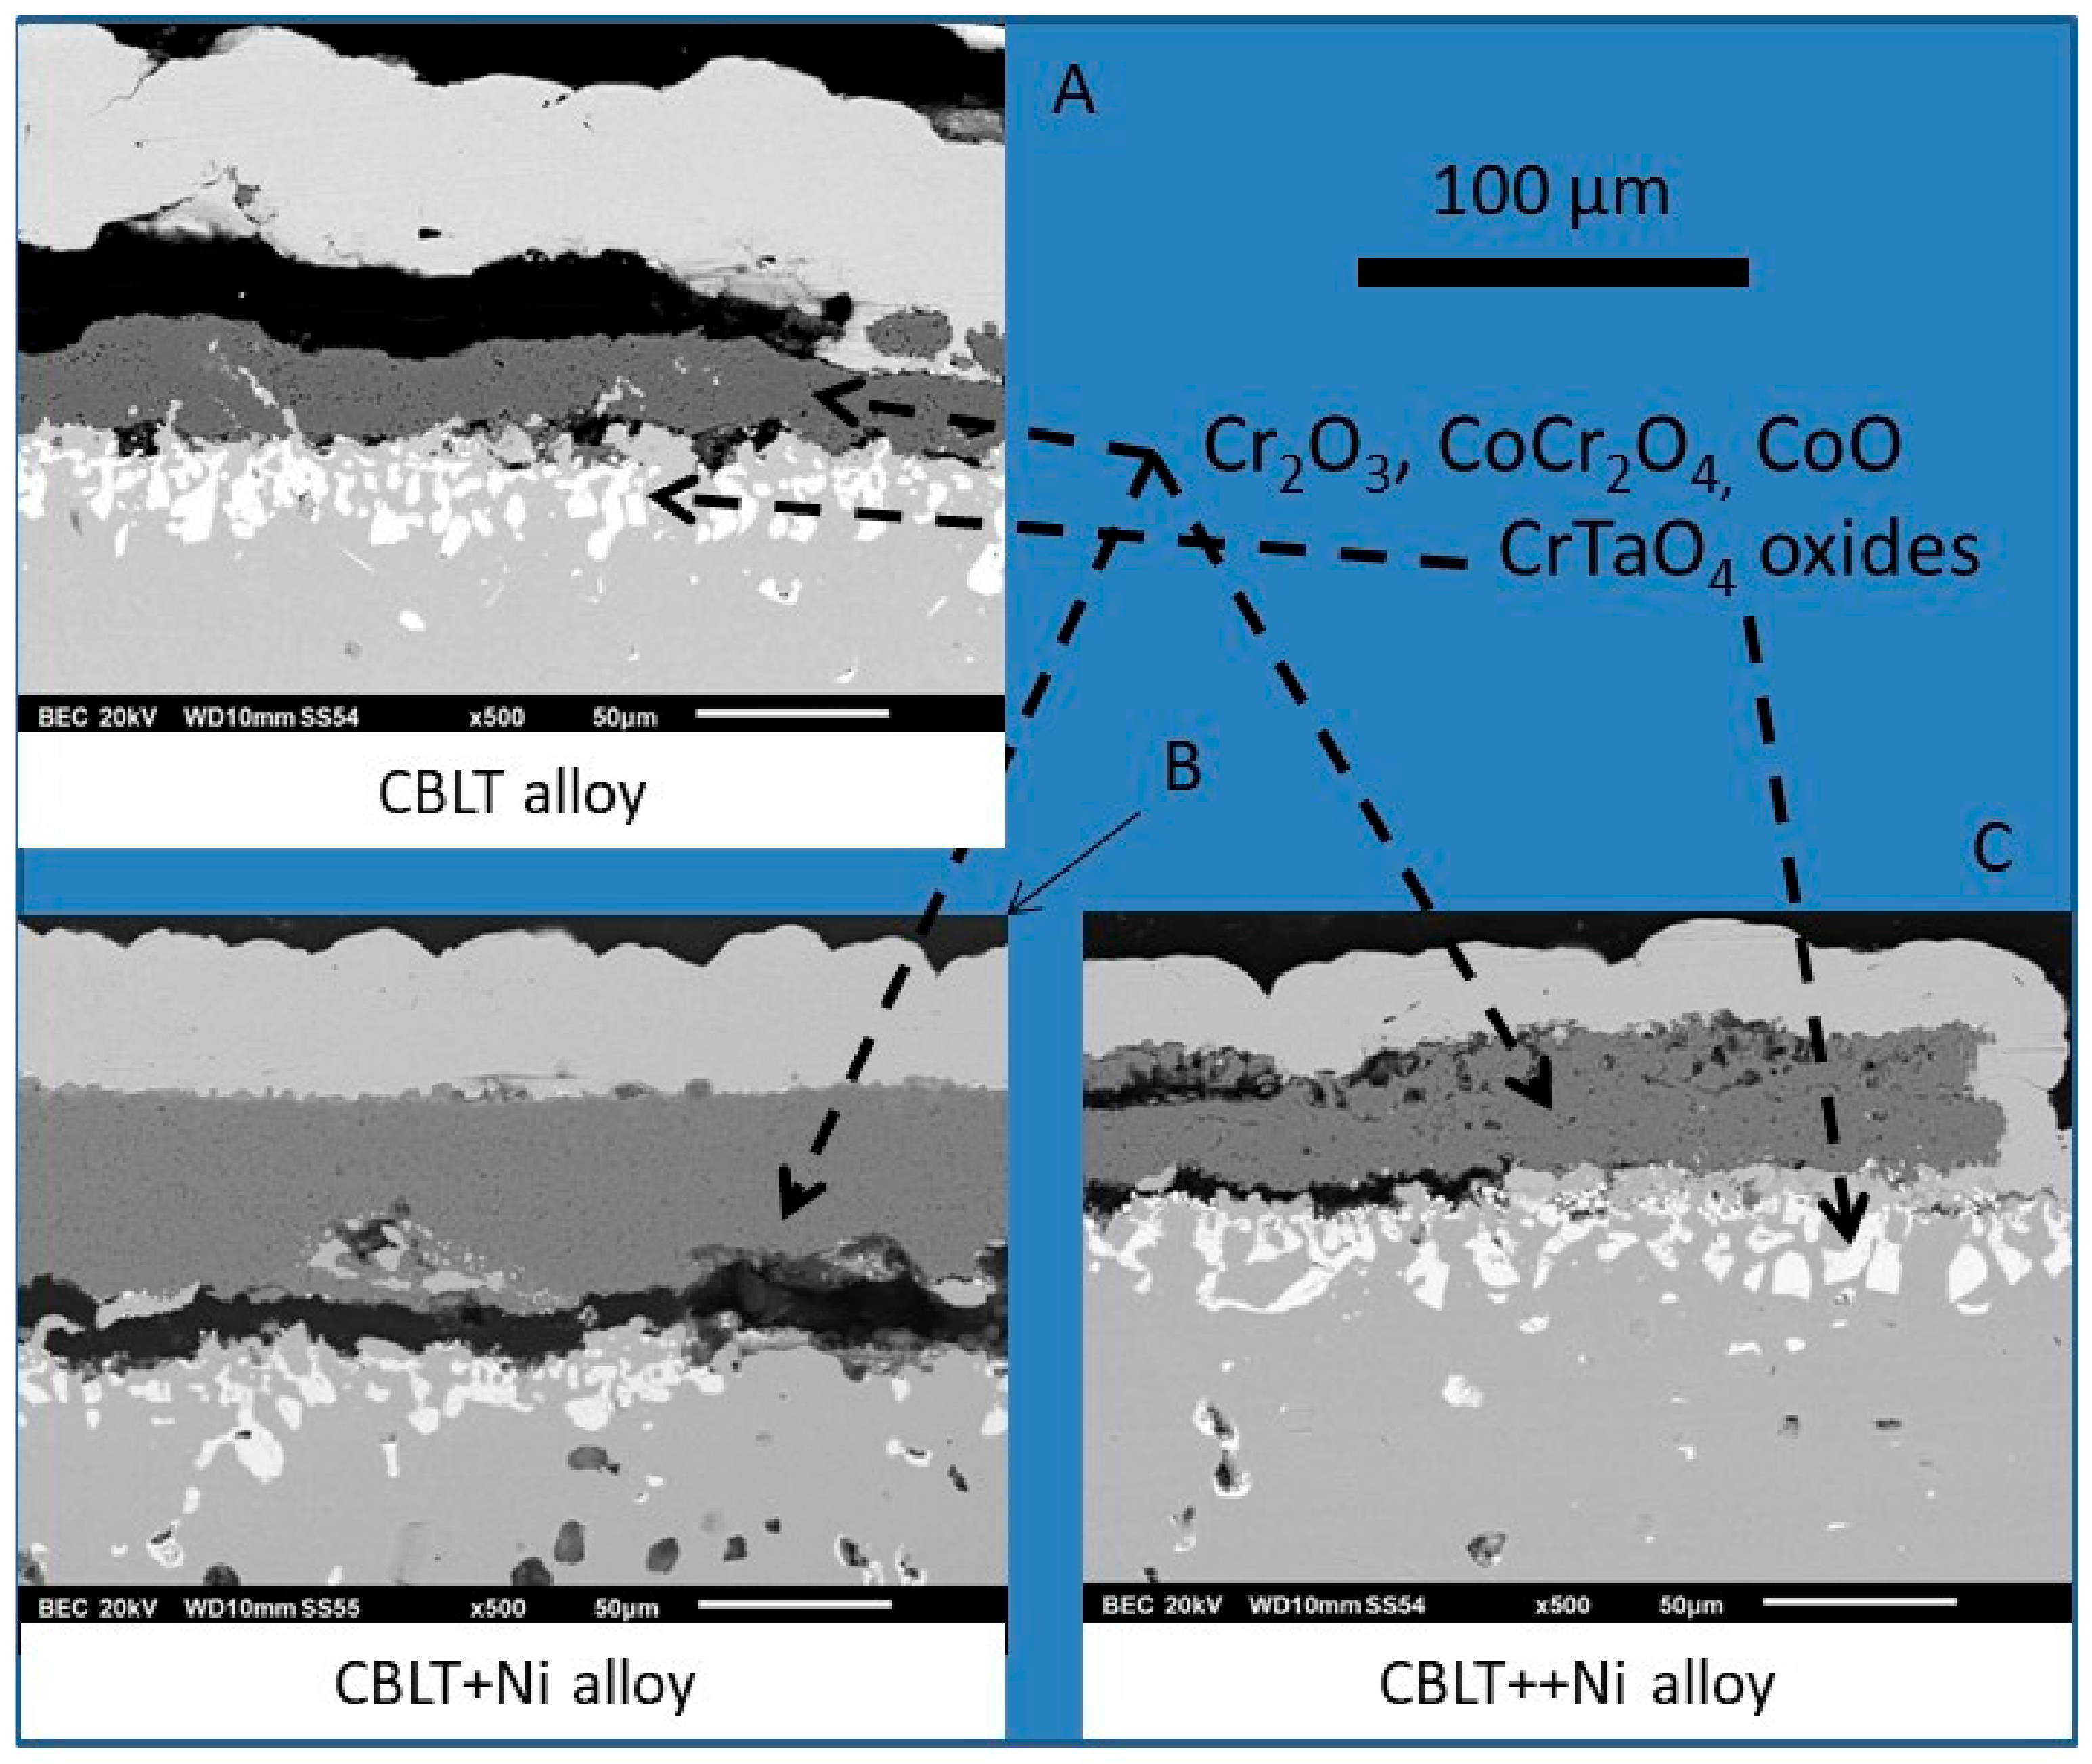
After the TG tests, the oxidized samples were carefully removed from the ceramic–gained platinum wire. After deposition of gold all around the sample (to give electrical conductivity to its surface), achieved using a cathodic sprayer (JFC–1200, JEOL, Tokyo, Japan), the sample was coated by electrolytic nickel deposition to obtain a protective metallic shell devoted to the protection of the external scales during cutting. The sample was cut to obtain two equivalent halves which were embedded (resin CY230 and hardener HY956, ESCIL, France), ground and polished to obtain a mirror–like state. The obtained cross–sections were examined and analyzed with the SEM and its EDS spectrometer.

3. Results

3.1. Chemical Composition and As-Cast Microstructures

The obtained chemical compositions for the alloys, named “CBLT” for the reference alloy, “CBLT+Ni” for the moderate Ni addition, and “CBLT++Ni” for the highest Ni addition) are displayed in Table 1. The weight contents in all elements are rather well respected. This is obvious for Ni and Cr while the measured Ta content is a little overestimated. This is due to the high concentration of this element in the carbides which are more exposed to the beam. Concerning the carbon content, EDS is not able to measure its content when this light element is present in low concentration by comparison with the others. The followed protocol of elaboration (ingot mass, granulometry of the pure elements, thermal cycle and atmosphere adopted for the elaboration, etc.) is very classical and the content in C was always respected in all the numerous earlier elaborations conducted as here, as periodically verified by spark discharge spectrometry on alloys similar to the present ones. This good respect of the targeted carbon content is additionally confirmed by the carbides population which is, in term of surface fraction, typical of 0.4 wt % C.
The as-cast microstructures of the obtained alloys are illustrated by three SEM/BSE micrographs in Figure 1. The three alloys are almost double–phased, with a dendritic matrix and interdendritic carbides. These ones are exclusively script–like shaped bright particles (CBLT and CBLT+Ni alloys), or at least the major carbide present (CBLT++Ni alloy). The Ni–richest alloy also contains small very dark particles. EDS spot analysis was performed on the coarsest bright or dark particles that were found in the three alloys. The analyses clearly showed the very high concentrations in Ta and C in the bright particles and in Cr and C in the dark particles. These elements were not the sole ones since the interaction peer also slightly penetrated a small part of matrix in some cases, with the detection of little contents in Co and Ni. However, Ta and C are both largely predominant in the bright particles with moreover Ta and C molar contents very close to one another, this demonstrating that these bright particles are TaC carbides. Cr and C being themselves predominant in the dark particles, with a Cr /C molar ratio in the 2–2.5 range suggesting that they are Cr7C3.
The Vickers indentations which were performed in the core of these as-cast samples shows a decrease in hardness with the Ni enrichment: 330, 290 and 270 HV10 for respectively the CBLT, CBLT+Ni and CBLT++Ni alloys (average values ±10 HV10).

3.2. Melting and Solidification Temperature Ranges

The DSC results are presented in Figure 2. For each alloy, four curves are gathered in the same graph: the heating curve and the following cooling curve of the first cycle, and the heating curve and the following cooling curve of the second cycle. In each case the heating part of the first cycle is rather perturbed, with the presence of many irregularities. In comparison, the heating part of the second cycle is much more regular. This can be also said about the two cooling parts of both cycles: they are very regular and almost identical. Since it can be thought that the first heating curve is irregular because of a not homogeneous alloy resulting from fast solidification in the cold crucible, it is better to consider only the second heating curve.
Qualitatively the CBLT and CBLT+Ni alloys seem to be melting with two main endothermic peaks, despite the presence of a third little one appearing just before total melting. For these same two alloys the two cooling curves (cycle 1 and cycle 2) present two exothermic peaks. Fusion and solidification are, in their cases, obviously 2–step transformations.
There is only one well distinguished peak for the second heating curves and the cooling curves for the third alloy. Obviously, the solidifications of the dendrites network and of the eutectic compound are not simultaneous but they are very close to one another. For the second cycle, the melting of the eutectic compound has just started when the melting of the dendrites began, this leading to overlapping of the two endothermic phenomena. One can say something similar for solidification. It is interesting to note, for two cases out of three, that solidification at the second cycle started a little earlier for the second cycle than for the first one. This is maybe in relation with a modification of the nucleation power of the melt when re–melting is repeated. An exception is for the second cycle of the first alloy (CBLT) for which this is at the second cycle that the undercooling is the greatest one, which resulted in a sudden and abrupt heat release.
Quantitatively, only the second cycle was taken into consideration. The melting start (Tms), melting end (Tme), solidification start (Tss) and solidification end (Tse) temperatures were determined at the left foot of the first endothermic peak, right foot of the second endothermic peak, right foot of the first exothermic peak and left foot of the second exothermic peak, respectively. Average values were calculated as follows: (Tms + Tse)/2 and (Tme + Tss)/2. The results are presented in Table 2.
One can see that the evolution of the average value associated to the liquidus (temperature of transition between the mushy state and the liquid state) does not vary monotonously with the Ni content. After a very limited decrease (not really significant) the value increases beyond 1420 °C. At the same time the value corresponding to the solidus (temperature of transition between the solid state and the mushy state) increases. Notably, adding 27.4 wt % Ni led to 27 °C more. One can also confirm that the melting or solidification average temperature range constantly decreases with the addition of nickel (99 °C → 92 °C → 79 °C for 0 → 13.7 → 27.4 wt % Ni), showing the interpenetration of the thermal exchange peaks concerning the eutectic compound and dendrites as a consequence.

3.3. Thermal Expansion and Thermal Contraction Behaviors

The TMA curves are plotted in the (deformation versus temperature) scheme in Figure 3. The expansion is rather linear, even if a very slight constant acceleration seems existing in the two first cases while the expansion of the third alloy (CBLT++Ni) knows first a slight acceleration, replaced by a slight deceleration above about 700 °C. The cooling part is never superposed with the heating one. Thermal contraction decelerates in all cases and this leads to a final thickness slightly higher than initial. This is particularly true for the CBLT and CBLT+Ni alloys. The final thickness of the CBLT++Ni sample is almost the same as initially, and its heating part and cooling part show a flat hysteresis loop. The dimensional evolution was monitored during the 1 h–stay at 1250 °C (Figure 4). Globally the thickness stays stable, even if a tendency for a slight increase can be observed for the CBLT and CBLT+Ni alloy.
The average values of the thermal expansion or contraction coefficient over the whole 25–1250 °C range are given in Table 3. The average thermal expansion coefficient tends to slightly decrease when the nickel content increases. The average thermal contraction coefficient does not follow a monotonous variation versus the Ni content. In contrast it can be said that its values are significantly lower than the expansion coefficient ones.

3.4. High Temperature Oxidation Kinetics: Heating

The TG files were analyzed not only in their isothermal parts but also in their heating and cooling parts. Since this was a simple thermo–balance which was used—and not a symmetrical one—a simple method described in [13] was used to correct the measurements recorded during the heating. The mass variation contribution of the decreasing air density was subtracted prior to the analysis of the mass gain variation, for detecting the first very small mass gains only due to oxygen adsorption and alloy oxidation. The heating curves, accordingly corrected from air buoyancy variation, are plotted together in Figure 5. One can see that oxidation began influencing the sample mass at about 600–700 °C for the CBLT and CBLT++Ni alloys, and later—around 800 °C—for the CBLT+Ni alloy. With the temperature increase beyond these values, the mass gain accelerates in all cases, obviously in a stronger manner for the CBLT+Ni alloy than for the two other alloys. These two parameters—start temperature and acceleration—both influence the final mass gain at the end of heating: this one is about 300–350 µg/cm2 for the CBLT and CBLT++Ni alloys, and about 550 µg/cm2 for the other alloy.

3.5. High Temperature Oxidation Kinetics: Isothermal Stage

The isothermal parts of the mass gain curves are wholly parabolic–shaped for the two Ni–richest alloys, but only along the first half for the CBLT alloy’s one. Indeed, for the later alloy the kinetic became almost linear after about 30–35 h. At so high temperature re–oxidation of chromia into gaseous species may be significant. This phenomenon starts at 1000 °C in air and it is amplified for higher temperatures. Data resulting from a previous study carried out with a chromia–forming Ni–30 wt % Cr alloy [14], in which the linear rate of mass loss due to chromia volatilization was experimentally specified versus temperature in the (1000–1300 °C) range, were considered. A value determined in this earlier work was chosen for representing the chromia volatilization mass loss rate here: Kv1250 °C = 200 × 10−10 g cm−2 s−1.
Kv1250 °C × t was added to the measured isothermal mass gain, prior to the determination of the parabolic constant Kp. Before this correction, the (Δm/S versus the square root of time) curves corresponding to the Δm/S versus time of Figure 6, were not linear. They successfully became linear when the Kv1250 °C × t was added, which allowed specifying the values of the parabolic constant Kp. The obtained values are displayed in Table 4, together with the total mass gains achieved during the isothermal stage. In this table the stars (*) show that the values are corrected from the (chromia volatilization)-induced mass loss rate. Obviously, the Kp value decreases regularly—but slowly—with the nickel addition.

3.6. Oxide Scale Spallation at Cooling

The cooling parts of the curves are plotted in Figure 7. One can notice that they become irregular after about 250 °C of cooling for the CBLT alloy and after about 300 °C of cooling for the two other alloys (temperatures at which the sample was at the instants of appearance of the mass variations irregularities, values red in the (t, T, mass) numerical files). This is due to the detachment of the external scale from the alloy surface caused by the thermal contraction of the alloy which is faster than the chromia’s one (about 7.3 × 10⁻⁶ °C−1 for Cr2O3). Despite the very slow cooling rate (−5 °C min−1), the adherence of the external oxide and its resistance to shear, are not efficient enough to avoid its rupture in some locations. The CBLT alloy is the least affected by this scale spallation phenomenon (lowest temperature of spallation start and final mass variation of only −5 mg/cm2). It is the CBLT+Ni alloy for which spallation started the earliest and for which the final mass variation is the lowest one (−30 mg /cm2). At the same time we can remark (Table 3) that the CBLT alloy presents the lowest thermal contraction coefficient while the CBLT+Ni alloy presents the highest one.

3.7. Surface, Subsurface and Bulk Modifications after 70 h at 1250 °C in Air

The low magnification cross-sectional SEM/BSE views of the oxidized surfaces given in Figure 8 illustrate the more or less important loss of the external oxide scale during cooling. It also shows the disappearance of tantalum carbides in the most external part of the alloys. The high magnification views given in Figure 9 show the external oxides more in details. The oxidation behaviors at 1250 °C of the three alloys are rather good, taking into account the exceptionally high level of temperature for such alloys. The most present oxide is chromia in all cases. However, some parts of surface of the CBLT alloys were affected by local catastrophic oxidation, as revealed by the presence of a mix of oxides (chromia but also the CoCr2O4 spinel oxide and even the cobalt oxide CoO). This is also shown by a scale/alloy interface which is irregular in the same location (oxidation progressing inward). These are these local starts of fast oxidation which added a rapid linear part to the parabolic kinetic from the middle of the 70 h of TG test. To finish with the oxidation results, one can also notice the presence of many CrTaO4 oxides in the outermost part of the alloys.
All the oxides cited just above were suspected considering their relative gray levels and definitely identified by EDS spot analyses which clearly gave atomic compositions close to Cr0.4O0.6 for chromia, Co0.5O0.5 for the cobalt oxide, Co0.14Cr0.29O0.57 for the spinel oxide and Cr0.17Ta0.17O0.66 for the mixte oxide of chromium and tantalum.
The last figure (Figure 10) gathers SEM/BSE micrographs which show that the bulk microstructures were not significantly affected by the stage at 1250 °C. The volume fractions of tantalum carbides seem having not evolved significantly. Some surface fraction measurements were done additionally, using an image analysis tool present in the Adobe Photoshop CS software, to verify quantitatively this observation. This one is confirmed: the TaC surface fraction of the CBLT, CBLT+Ni and CBLT++Ni alloys are, respectively, about 8%, 9% and 8% in the as -cast states, and 7.5, 8.5 and 7.5% after exposure at 1250 °C (average of three analyses of ×1000 SEM/BSE micrographs, uncertainty: ±0.5%). However, the script–like shape of these TaC has been partially lost. The stoichiometry of these TaC carbides was here too controlled using spot EDS analysis on the biggest round bright particles: they are essentially made of Ta and C present with equivalent molar contents. Carbides are now fragmented. Another point concerns the small rare chromium carbides initially present in the Ni–richest alloy (CBLT++Ni): they have totally disappeared. After 70 h at 1250 °C it is sure that total chemical homogenization was achieved. The chromium carbides seen in the as-cast microstructures were probably due to C and Cr segregations during the fast cooling in contact with the cold crucible of the furnace.

4. Discussion

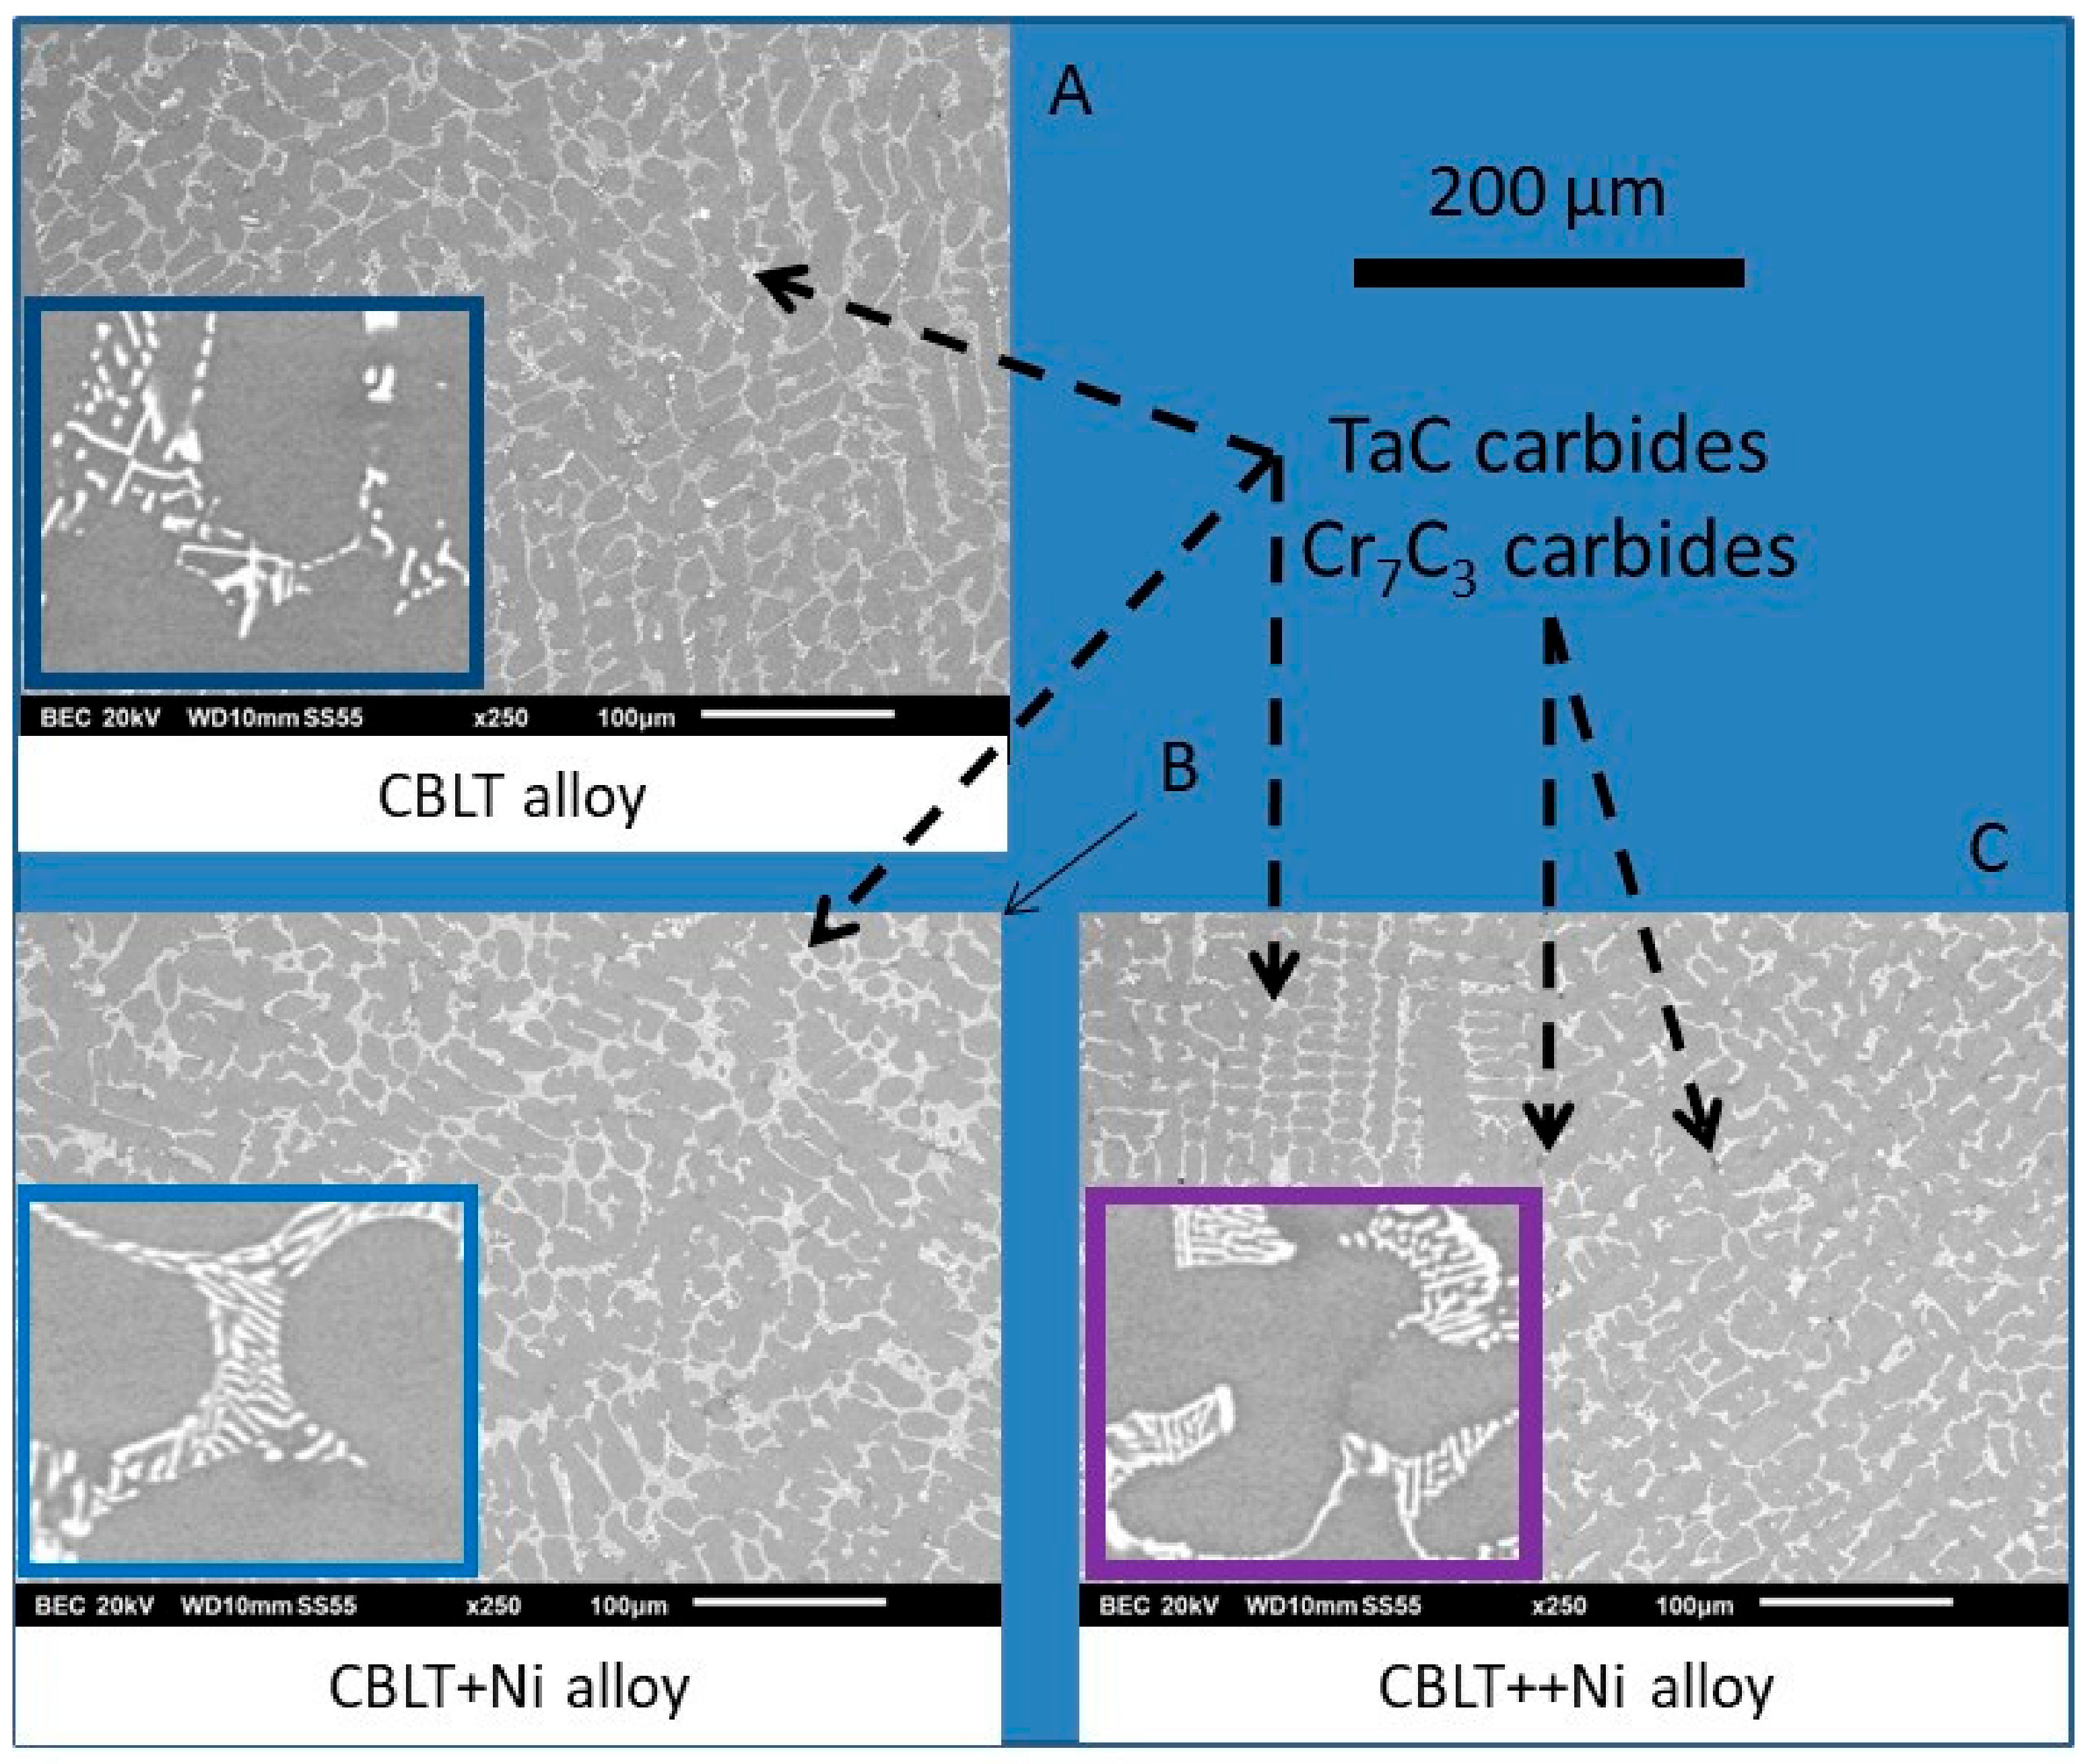
The possible effects of the addition of nickel were expected first for the microstructures of the alloys resulting from solidification. Obviously, even for the highest Ni quantity added in this work, there is no change in the microstructure of the alloys. The CBLT and its Ni-added versions are totally similar. The rare chromium carbides which appeared at solidification for 27.4 wt % Ni added, obviously disappeared at service temperature and did not re-precipitate at cooling despite the low cooling rate. However, the transient appearance of chromium carbides let think that more abundant and stable chromium carbides may appear for nickel contents high enough. This seems occurring for content a little beyond 28 wt %, and may be as soon as Ni becomes more present than Co (i.e., near 35 wt %Ni). An earlier study showed that Cr7C3 are present in higher fractions than TaC in Ni–30Cr–0.4C–6Ta [16].
If the as-cast microstructures seem to be almost invariant versus the Ni content, this is, in contrast, not the case of the room temperature hardness. This one clearly decreases with Ni addition, an evolution which can be easily explained by the well-known difference in intrinsic hardness of solid pure cobalt (hard) and solid pure nickel (softer than Co).
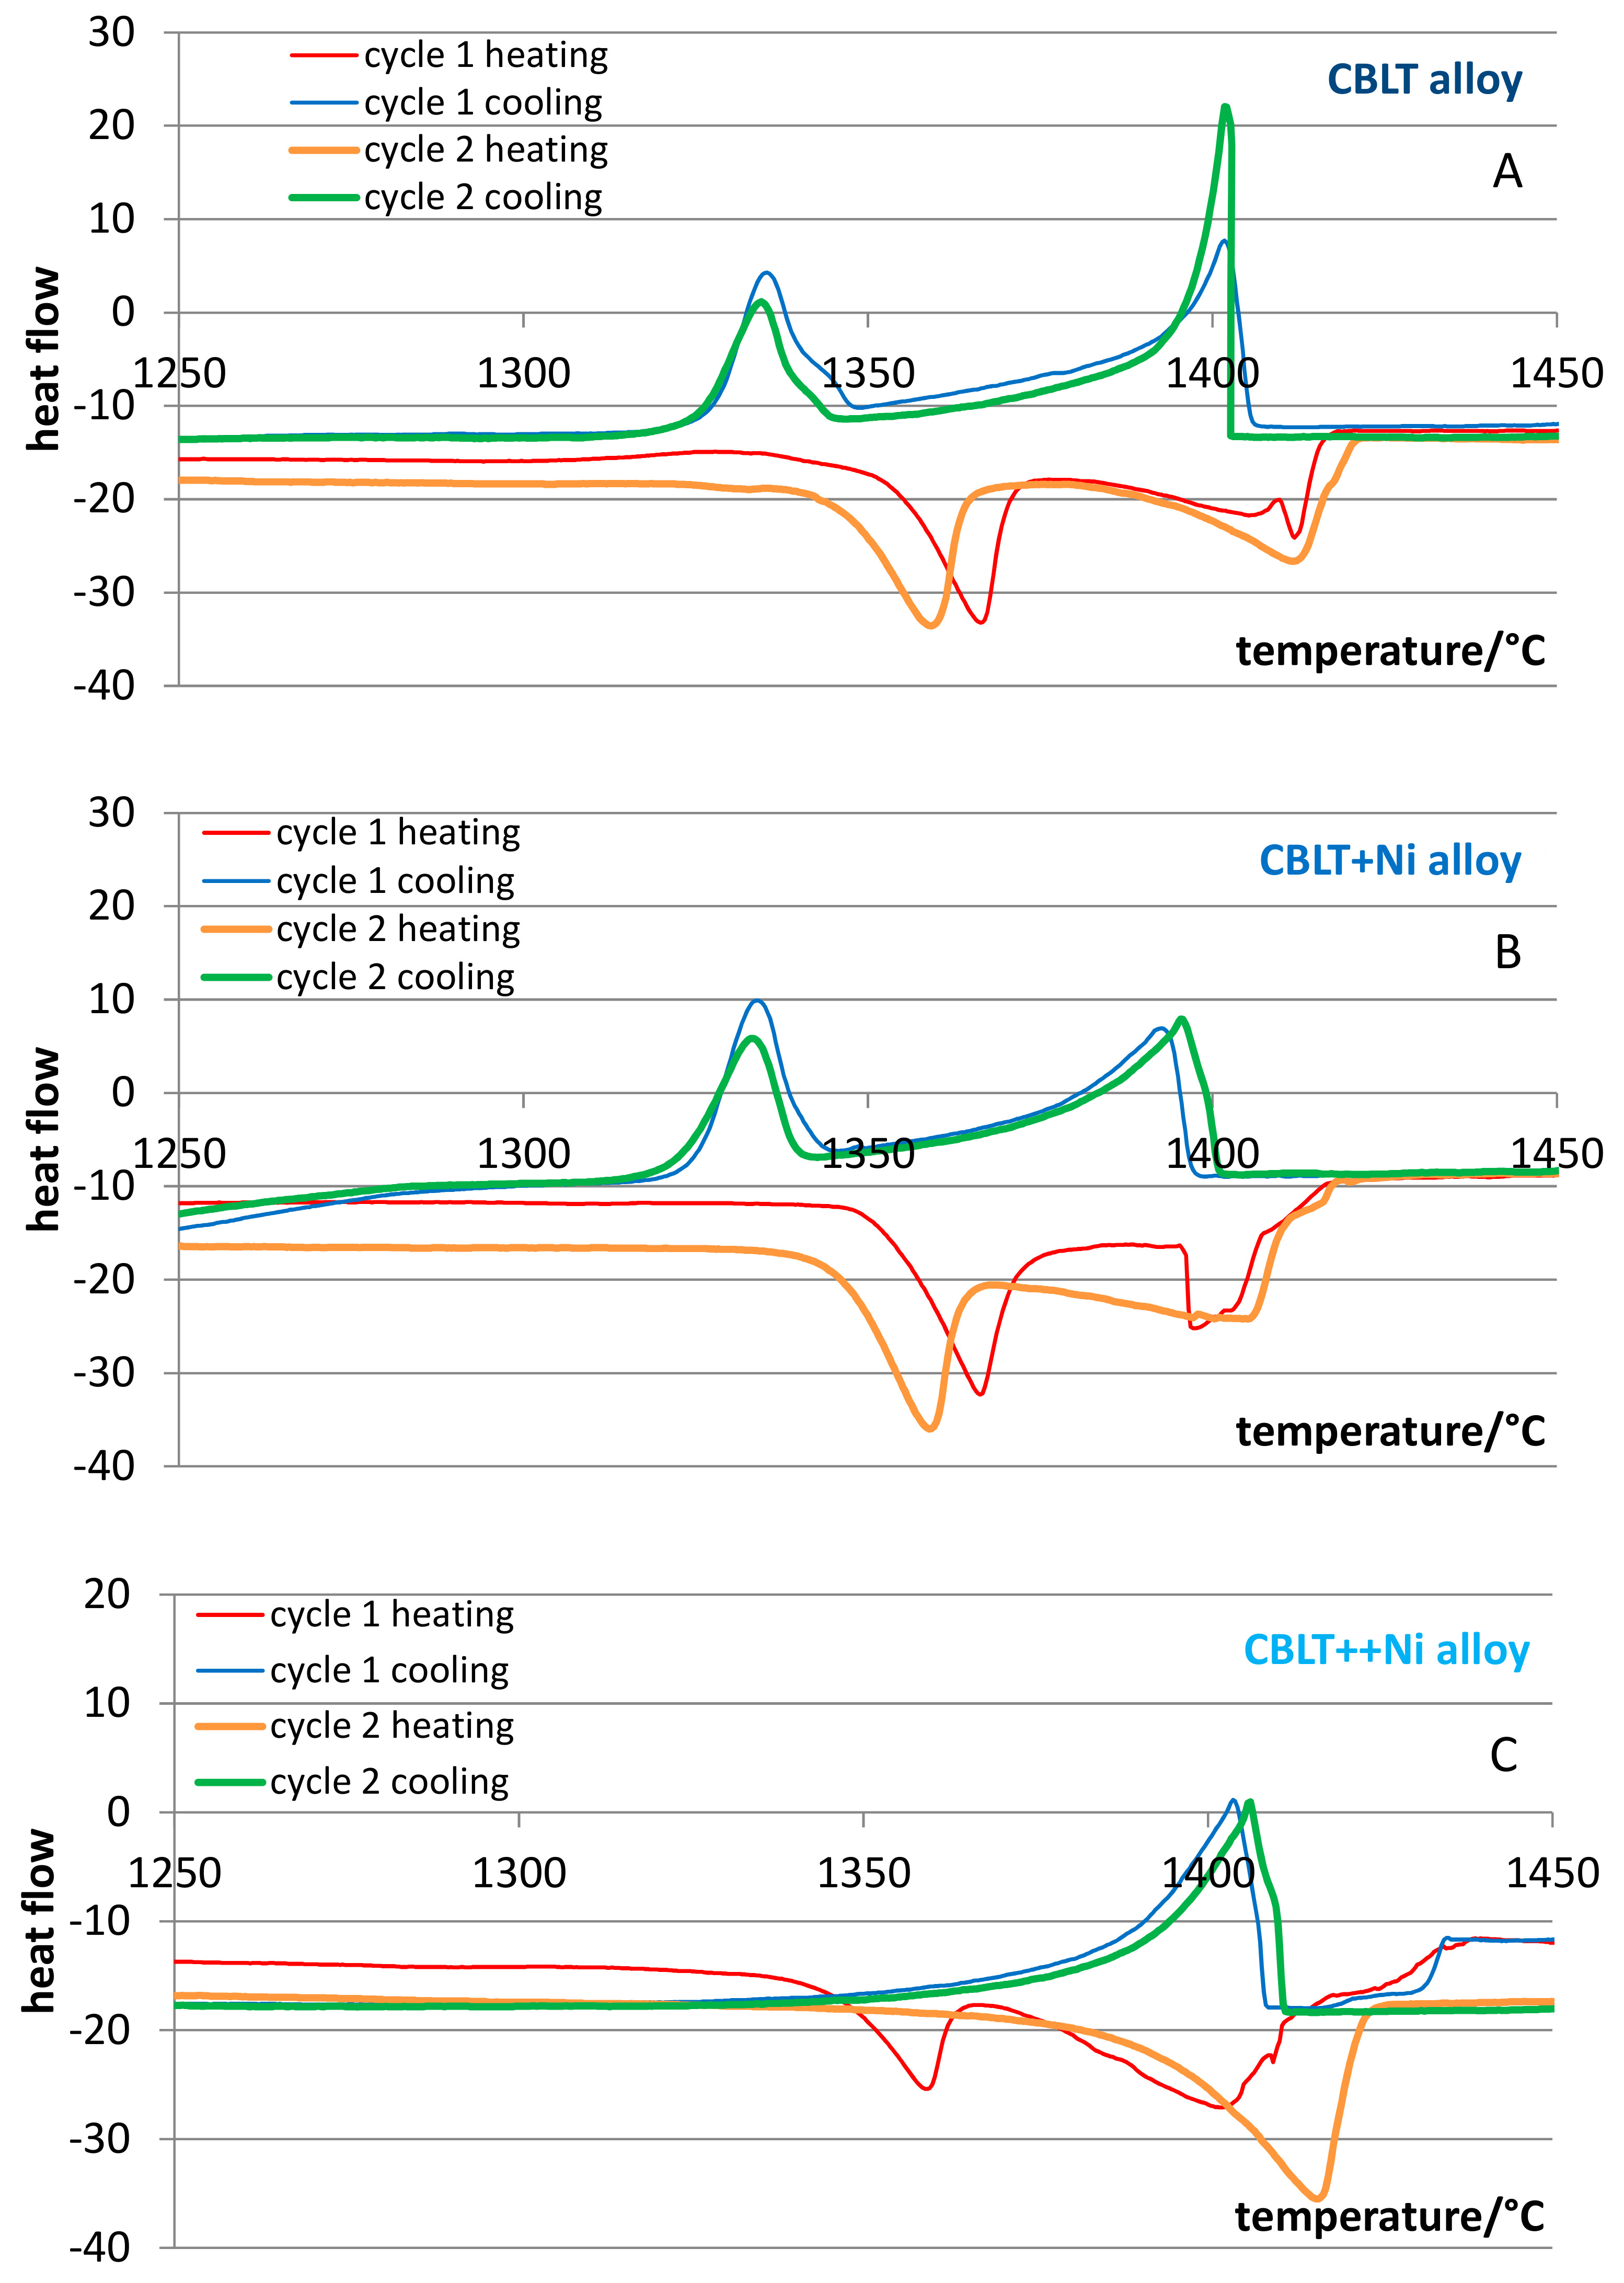
The DSC runs showed that the additions of nickel influence the melting range of the alloys, and not in the expected direction. Indeed, the average value of the two temperatures associated to the solidus one (i.e., the temperatures of melting start and of solidification end) was increased by nickel addition. At the same time the average temperature associated to the liquidus one also varied a little but not monotonously. Globally the melting temperature range became less extended and the two peaks (both endothermic or both exothermic) started to be closely mixed, this resulting in an apparent single peak. One logical guess is that the first endothermic peak corresponds to the melting of the (matrix and TaC)-eutectic compound (and the second exothermic peak is the solidification of this compound). The second endothermic peak corresponds to the melting of the dendrites of solid solution (and the first exothermic peak results from their crystallization). With 27.4 wt % Ni added, dendrites start melting when the eutectic compound is far from having finished its fusion. However, the double nature of the single peak is still visible, thanks to a bump on one of the peak sides. Since there is almost only a single peak for both melting and solidification for the third alloy, the temperature melting range is considerably less extended than for the two first alloys. This is beneficial for foundry practice and for the foundry health. Indeed, a less extended mushy zone disadvantages the appearance of shrinkage defects in the last zones to solidify.
Concerning the double-cycled DSC tests which were carried out in this work the interest of running a second test after the first one was demonstrated. The first cycle was very useful for re-initializing the alloy with the slow solidification occurring during the slow cooling part of the first cycle. The second heating curve was much less perturbed than the first one and thus able to give more accurate values of the critical temperatures of interest.
One also noticed that the start of solidification was, for all alloys, a little earlier for the second cycle than for the first cycle. This suggests that more nuclei were present in the melt after two cycles rather than one cycle. This tends to reduce undercooling and then this leads to solidification start temperatures which are closer to the liquidus temperatures of the alloys.
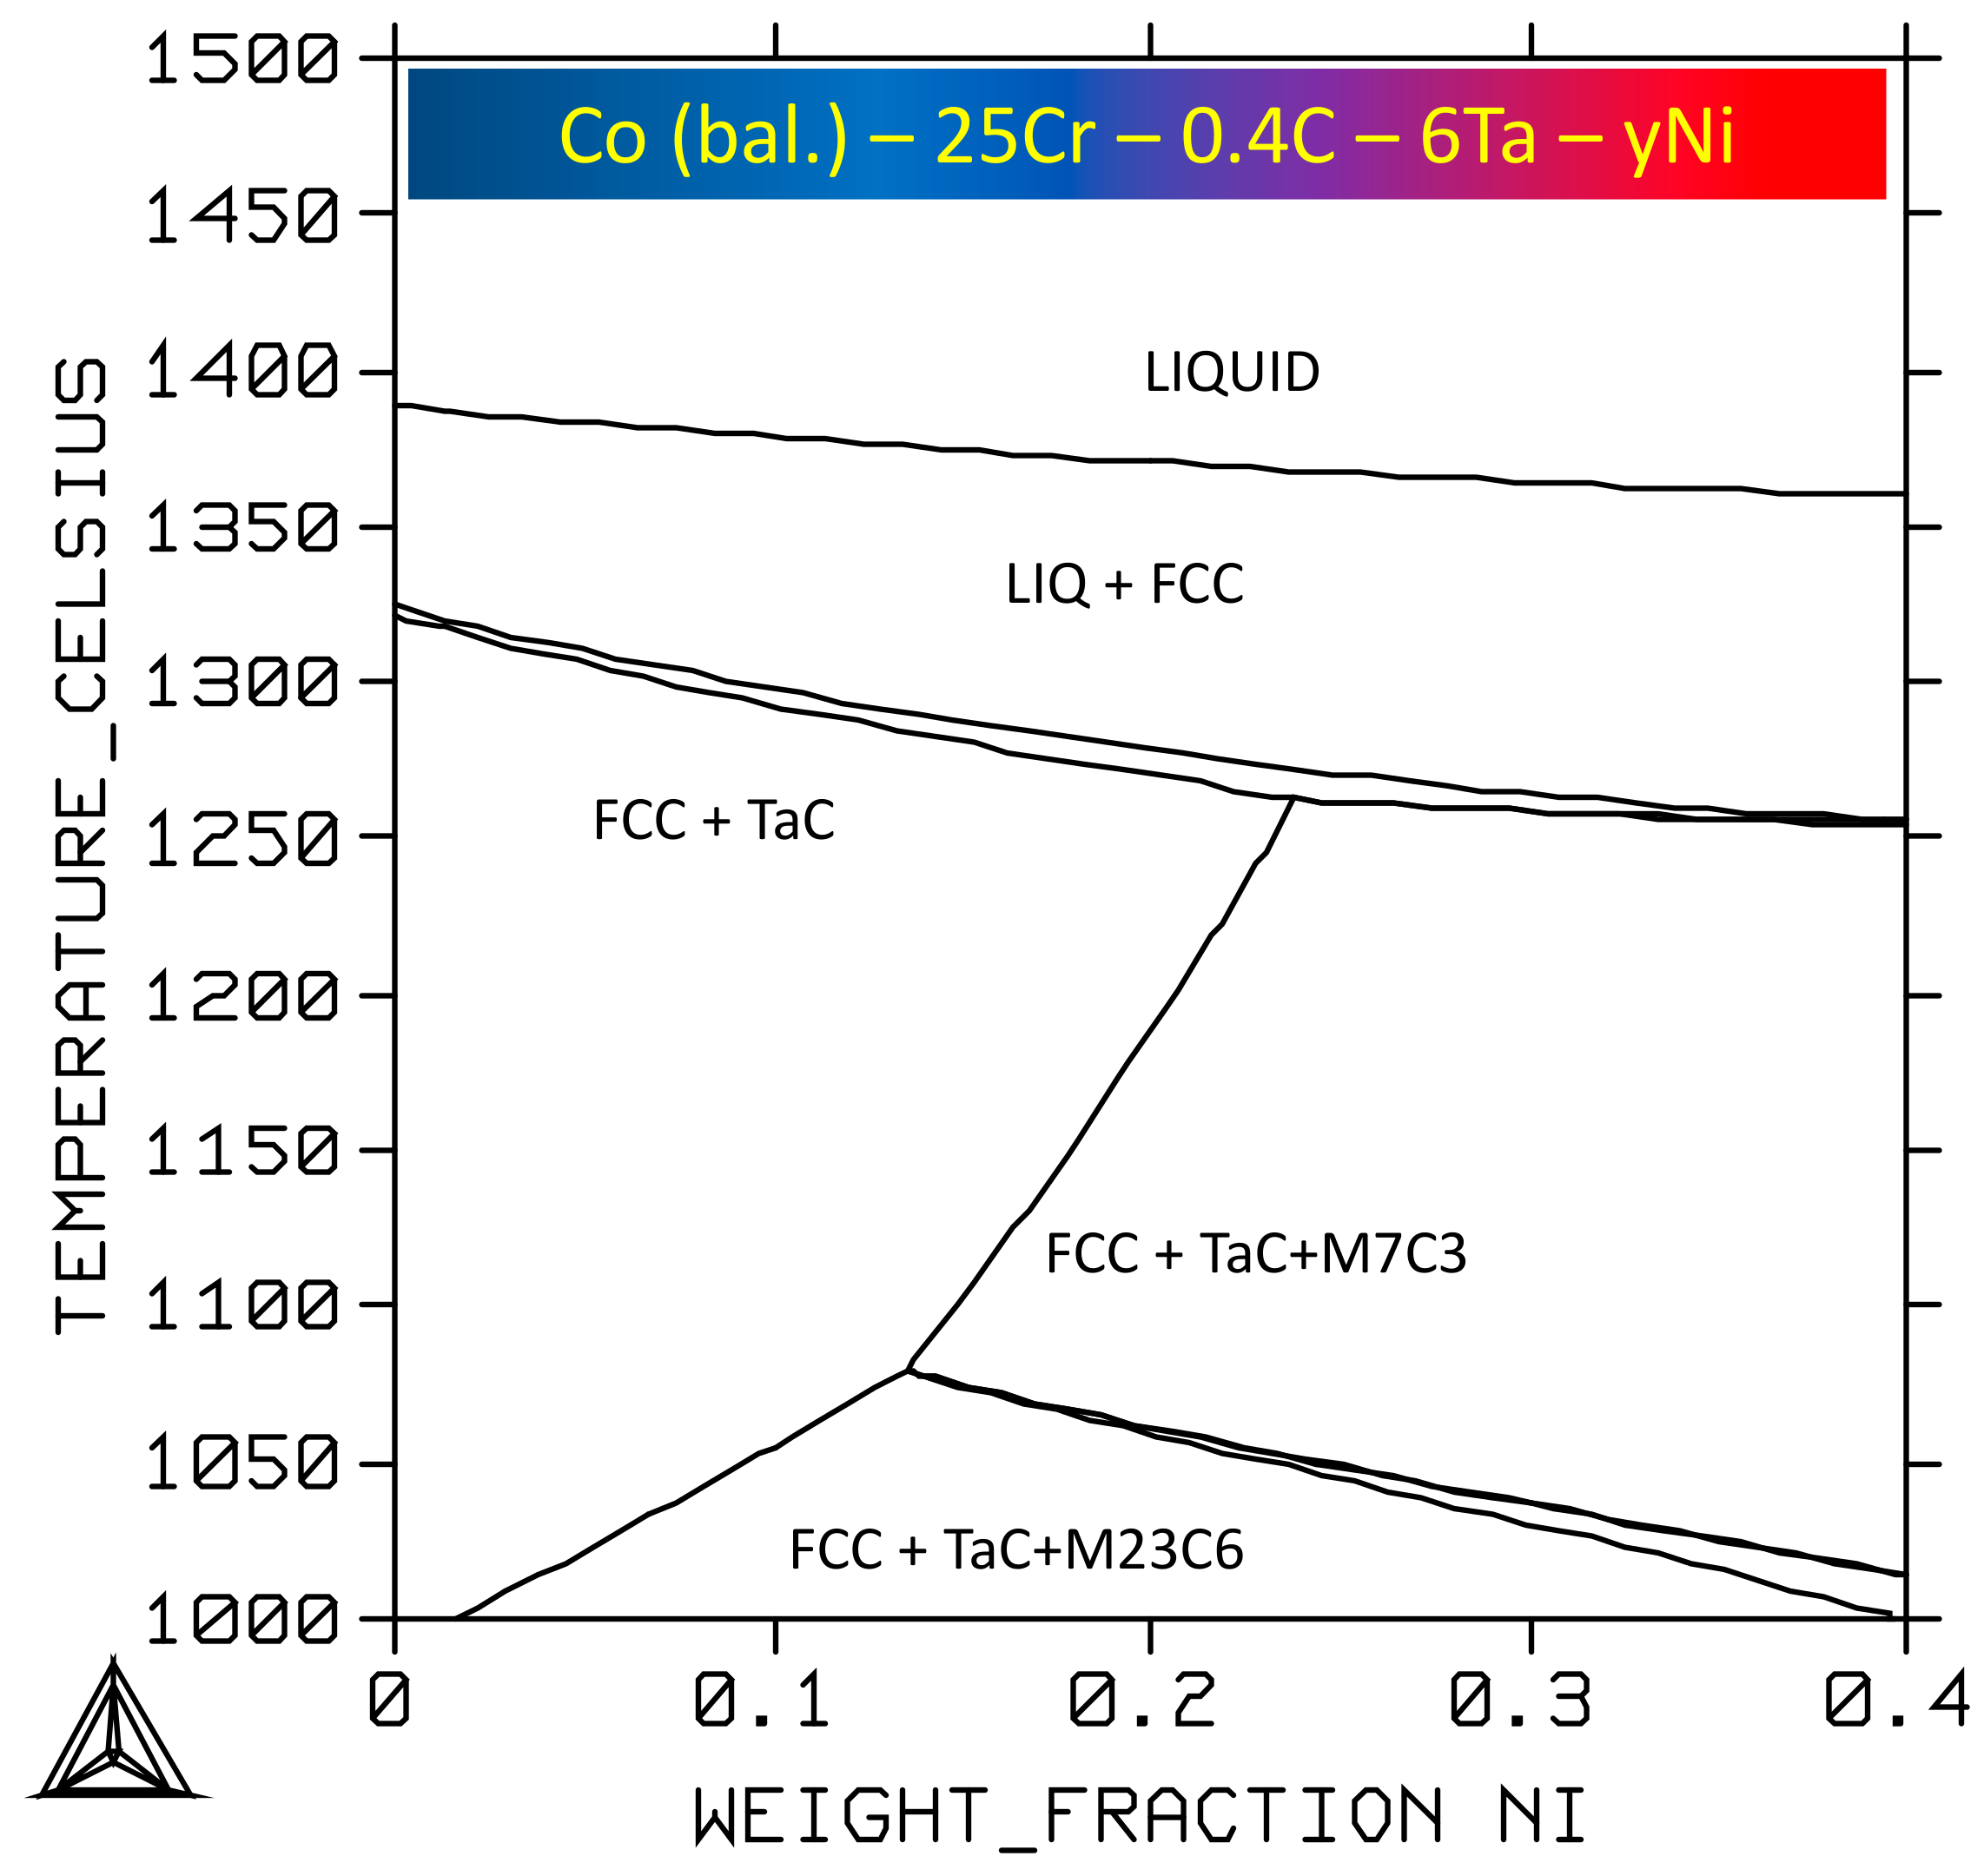
To finish with the DSC test, one must try to find possible explanation for the very curious effect of the Ni addition on the average temperature associated to the solidus, and interpret this results in term of practical consequences. By simply considering the melting points order between cobalt and nickel this was more a decrease which may be expected. In the case of Co–Ni binary alloys, it is clear that such results would be wrong. In the present case, even if the alloys are not very complex chemically (quaternary and quinary systems), the presence of chromium, carbon and tantalum in rather high quantities may influence this refractoriness hierarchy. However, a calculated isopleth section of the Co–Ni –Cr–C–Ta diagram, presented in Figure 11, does not show such effect of nickel for the alloy base under study here. Indeed, according to these thermodynamic calculations, adding Ni ought to decrease the solidus temperature. However, it is true that this system is rather complex and that the used database is not complete (some subsystems are still lacking). Anyway, if this increase in melting start temperature with Ni addition is real, this is an unexpected potentially good point for the high temperature capability of the alloy.
The second thermal experiment which was done here for each alloy was TMA. The first observation concerned the average thermal expansion coefficient. Seemingly it tends decreasing a little when nickel is added. This very moderate effect (average of 0.4 × 10⁻⁶ °C−1 less by 14 wt % Ni–added slice) may contribute to better behavior in thermal cycling concerning the induced thermal stresses. This may be a second good point for the addition of nickel. In addition, with 27 wt % Ni added, the deformation is almost totally reversible while a persistent positive deformation stayed after thermal cycling for the two CBLT and CBLT+Ni alloys. When one looked to the dimensional behavior of the samples during the 1 h-stage at 1250 °C separating the heating phase and the cooling phase, one noticed that the thicknesses of the CBLT and CBLT+Ni samples tended to go on increasing a little. One can remind that such phenomenon was earlier encountered for 30 wt % Cr-containing (Ni, Co or Fe-based) alloys moderately [8] or very [17] rich in carbon then in chromium carbides. This was also observed for 30 wt % Cr-containing Co-based alloys [18] or Fe-based alloys [19] rich in tantalum carbides. In these previous studies the isothermal deformations, which were much more marked than here, were interpreted by increasing internal mechanical interactions acting between matrix and carbides. For instance, during the heating phase, the metallic matrixes tended to expanse much more than carbides because of the difference in thermal expansion coefficient (for matrix: two times higher than for carbides). This led to carbides more and more elastically deformed by the increasing tensile stresses applied by matrix and to matrix more and more elastically deformed by the increasing compressive stress applied by carbides. When the temperature had become high enough, the matrix began to be plastically, then visco-plastically, deformed under the compressive action of the carbides. The results of that were the slowdown of the expansion of the whole alloy, then possibly a stationary state and even an inversion (contraction) although that temperature went on increasing. At the end of heating, during the isothermal stage, the compressive deformation suddenly accelerated then slowed down and finished to stabilize. In the present case, the alloys are far from these extreme behaviors because of carbides networks not as dense and interconnected as in the alloys of the previously reported results. It seems that this is another phenomenon. At the end of heating, the thermal stress state of the alloys is much lower, but the internal stresses applied by the matrix and carbides to each other certainly exist too. At this very elevated temperature the carbides may start fractioning, and give a little freedom to matrix, with as result a very slow isothermal additional elongation.
Concerning oxidation, the first point of interest was the moment, during the heating phase, at which oxidation starts to be significant in term of mass gain (according to the sensitivity or accuracy of the used thermo–balance). The results were a little scattered in term of dependence on the Ni content. Indeed, no clear dependence appeared, neither for oxidation start temperature, nor of total weight gain during the whole heating. It is possible that other parameters can be of higher importance for these very early times of oxidation. One can think to the microstructural characteristics of the alloy surface and subsurface (local dendritic orientation, surface state and reactivity a little different between samples, etc.) and the consequences on the oxide nucleation. It was also seen that the later the oxidation start (i.e., the higher the temperature of oxidation start) the faster the subsequent mass gain (e.g., CBLT+Ni by comparison to the two other alloys). If oxidation starts at rather low temperature, one can imagine that oxide nucleation can be done in many locations with consequently the possibility to have thereafter a thin oxide film almost continuous and then a low growth rate for the first scales. On the contrary, if oxidation starts much later, less numerous nuclei can be obtained, and the formed scales can be much discontinuous. Some consequences of that are higher surface fraction for linear growth kinetic, and lower surface fraction for parabolic growth kinetic, than for an alloy with oxidation start much earlier.
This is at the isothermal oxidation kinetic level that nickel addition demonstrated positive consequences. First, the two nickel-richest alloys oxidized according to a mass gain parabolic law over the whole test duration while the nickel-free alloy started linear oxidation in the middle of the 70 h. Second, the (chromia volatilization)-corrected parabolic constant, rather high due to the exceptional highness of the test temperature, decreases when the nickel content in alloy increases. However, this Kp remains significantly higher than the obtained value for the highly oxidation-resistant Ni–30 wt % Cr alloy the (chromia volatilization)-corrected whose Kp is much lower, even at a higher temperature (245 × 10−12 g−2 cm−4 s−1 at 1300 °C).
Concerning the sustainability of the oxide scale during cooling, problems occurred rather early (near 1000 °C for all alloys), despite the low cooling rate. It is sure that, in case of much faster cooling as this can be encountered in practical situation, spallation should surely occur at higher temperature. It is often suspected that the growth of subsurface islands of CrTaO4 oxides—promoted by the high content in tantalum of these alloys—can be responsible of a bad adherence of the chromia scale formed on the alloys. Thus, the loss of the protective scales as soon as the component decreases in temperature, forces the alloys to reconstitute their protective scales. The higher chromium diffusion easiness given by the presence of nickel may be of great importance for facilitating the supply in chromium of the oxidation front. This is another good point for the nickel addition.

5. Conclusions

Obviously, the advantages of the presence of nickel in chromium-rich cobalt-based alloys designed to be efficiently strengthened by tantalum carbides are not limited to the stabilization of austenite. By performing thermal analyses of three different types—DSC, TMA and TG—it was shown that introducing up to 27–28 wt % of nickel in the chemical composition of a (25Cr–0.4C–6Ta)-containing cobalt-based alloy led to slight improvements in refractoriness (raised), melting temperature range (lowered) and thermal expansion (lowered). It is true that the shift from a Co-based alloy to a (Co, Ni)-based one, despite that the tantalum carbides population seems being the same in both cases, may induce mechanical weakening at elevated temperature. The consequences of Ni enrichment up to 27–28 wt %, or beyond, on the mechanical properties remain to be investigated in future work. It is possible that a weakening effect of Ni will appear, as suggested by the observed decrease in hardness of the alloys resulting from the nickel addition.

Author Contributions

Conceptualization, P.B.; methodology, P.B.; validation, P.B. and L.A.; formal analysis, P.B., J.-P.G. and L.A.; investigation, J.-P.G., L.A. and P.B.; resources, L.A.; data curation, P.B. and L.A.; writing—original draft preparation, P.B.; writing—review and editing, P.B.; visualization, P.B.; supervision, P.B.; project administration, P.B. All authors have read and agreed to the published version of the manuscript.

Funding

This research received no external funding.

Institutional Review Board Statement

Not applicable.

Informed Consent Statement

Not applicable.

Data Availability Statement

Not applicable.

Conflicts of Interest

The authors declare no conflict of interest.

References

  1. Sims, C.T.; Hagel, W.C. The Superalloys; John Wiley & Sons: New York, NY, USA, 1972. [Google Scholar]
  2. Bradley, E.F. Superalloys: A Technical Guide; ASM International: Metals Park, OH, USA, 1988. [Google Scholar]
  3. Donachie, M.J.; Donachie, S.J. Superalloys: A Technical Guide, 2nd ed.; ASM International: Materials Park, OH, USA, 2002. [Google Scholar]
  4. Giamei, A.; Burma, J.; Rabin, S.; Cheng, M.; Freise, E.J. Role of the allotropic transformation in cobalt–base alloys. Cobalt 1968, 39, 88–96. [Google Scholar]
  5. Chikazumi, S.; Mizoguchi, T.; Yamaguchi, N.; Beckwith, P. Invar problem. J. Appl. Phys. 1968, 39, 939–944. [Google Scholar] [CrossRef]
  6. Kofstad, P. High. Temperature Corrosion; Elsevier: London, UK, 1988. [Google Scholar]
  7. Krajewski, W.; Krueger, J.; Winterhager, H. Allotropic transformation and thermal expansion of cobalt, cobalt–chromium, and cobalt–iron alloys. Metall 1970, 24, 480–487. [Google Scholar]
  8. Berthod, P. Influence of carbides and of the dendritic orientation on the thermal expansion of Ni–base, Co–base and Fe–base simple cast alloys. Int. J. Mater. Res. 2008, 99, 265–272. [Google Scholar] [CrossRef]
  9. Kofstad, P.; Hed, A.Z. High–temperature oxidation of cobalt–10 w/o chromium alloys. I. Microstructure of oxide scales. J. Electrochem. Soc. 1969, 116, 224–229. [Google Scholar] [CrossRef]
  10. Kofstad, P.; Hed, A.Z. High–temperature oxidation of cobalt–10 w/o chromium alloys. I. Oxidation kinetics. J. Electrochem. Soc. 1969, 116, 229–234. [Google Scholar] [CrossRef]
  11. Kofstad, P.; Hed, A.Z. Oxidation of Co–25 w/o Cr at high temperatures. J. Electrochem. Soc. 1969, 116, 1542–1550. [Google Scholar] [CrossRef]
  12. Kofstad, P.; Hed, A.Z. Oxidation of cobalt–35 wt. pct. chromium at high temperatures. Mater. Corros. 1970, 21, 894–899. [Google Scholar] [CrossRef]
  13. Berthod, P. Oxidation start detection on heating parts of thermogravimetry curves for high temperature alloys based on nickel, cobalt or iron. Open Corros. J. 2011, 4, 1–8. [Google Scholar]
  14. Berthod, P. Kinetics of high temperature oxidation and chromia volatilization for a binary Ni–Cr alloy. Oxid. Met. 2005, 64, 235–252. [Google Scholar] [CrossRef] [Green Version]
  15. Berthod, P. Thermogravimetric study of oxide spallation for chromium–rich cast cobalt–based and iron–based alloys oxidized at high temperature. Open Corros. J. 2009, 2, 61–70. [Google Scholar] [CrossRef]
  16. Berthod, P.; Aranda, L.; Vébert, C.; Michon, S. Experimental and thermodynamic study of the high temperature microstructure of tantalum containing nickel–based alloys. Calphad 2004, 28, 159–166. [Google Scholar] [CrossRef] [Green Version]
  17. Berthod, P.; Aranda, L. Behaviours in thermal expansion of nickel–based, cobalt–based and iron–based alloys containing very high carbon contents. Studia Phys. Univ. Babes Bolyai 2011, 56, 25–37. [Google Scholar]
  18. Berthod, P.; Heil, C.; Aranda, L. Influence of the morphologic evolution of the eutectic carbides at high temperature on the thermal expansion behavior of refractory cast alloys. J. Alloys Compd. 2010, 504, 243–250. [Google Scholar] [CrossRef] [Green Version]
  19. Berthod, P.; Aranda, L.; Hamini, Y. Thermal expansion of chromium–rich iron–based and iron/nickel–based alloys reinforced by tantalum carbides. Mater. Sci. 2011, 47, 319–326. [Google Scholar] [CrossRef] [Green Version]
Figure 1. SEM/BSE microstructures of the three alloys in their as-cast states (large micrographs ×250; inserted micrographs ×2000): (A): the CBLT alloy; (B): the CBLT+Ni alloy; (C): the CBLT++Ni alloy.
Crystals 11 00173 g001
Figure 2. The differential scanning calorimetry (DSC) curves obtained for the two successive cycles (plotted as heat flow versus temperature): (A) the CBLT alloy; (B): the CBLT+Ni alloy; (C) the CBLT++Ni alloy.
Crystals 11 00173 g002
Figure 3. The thermo-mechanical analysis (TMA) curves obtained for three alloys (plotted in the (deformation versus temperature) scheme): (A) the CBLT alloy; (B) the CBLT+Ni alloy; (C) the CBLT++Ni alloy.
Crystals 11 00173 g003
Figure 4. The isothermal parts of the TMA curves (plotted in the (deformation versus time) scheme): (A) the CBLT alloy; (B) the CBLT+Ni alloy; (C) the CBLT++Ni alloy.
Crystals 11 00173 g004
Figure 5. The heating parts of the thermogravimetry (TG) curves (plotted as mass gain versus time, after correction from the consequence of the air density variation); A: the CBLT alloy; B: the CBLT+Ni alloy; C: the CBLT++Ni alloy.
Crystals 11 00173 g005
Figure 6. The isothermal parts of the TG curves (plotted as mass gain versus time): A: the CBLT alloy; B: the CBLT+Ni alloy; C: the CBLT++Ni alloy.
Crystals 11 00173 g006
Figure 7. The cooling parts of the TG curves (plotted as mass variation versus time, after correction from the consequence of the air density variation): A: the CBLT alloy; B: the CBLT+Ni alloy; C: the CBLT++Ni alloy.
Crystals 11 00173 g007
Figure 8. General view of the surfaces and subsurfaces affected by oxidation: (A): the CBLT alloy; (B): the CBLT+Ni alloy; (C): the CBLT++Ni alloy.
Crystals 11 00173 g008
Figure 9. Detailed view of the surfaces and subsurfaces affected by oxidation: (A): the CBLT alloy; (B): the CBLT+Ni’ alloy; (C): the CBLT++Ni alloy.
Crystals 11 00173 g009
Figure 10. View of the carbides population in the bulk after 70 h at 1250 °C (large micrographs 250; inserted micrographs ×2000): (A): the CBLT alloy; (B): the CBLT+Ni alloy; (C): the CBLT++Ni alloy.
Crystals 11 00173 g010
Figure 11. Isopleth section at 25 wt % Cr, 6 wt % Ta and 0.4 wt % C of the quinary Co-Ni-Cr-C-Ta diagram (computed with Thermo–Calc N and a home-made thermodynamic database).
Crystals 11 00173 g011
Table 1. Chemical compositions of the three obtained alloys (average and standard deviation calculated from five EDS ×1000 full frame measurements; * C not measurable by EDS but considered as well respected).
Alloys (×1000) wt.%CBLTCBLT+NiCBLT++Ni
CoBal.Bal.Bal.
Ni/13.2 ± 0.525.4 ± 0.5
Cr25.5 ± 0.326.5 ± 0.725.6 ± 0.4
Ta7.7 ± 0.77.2 ± 2.27.8 ± 0.6
C0.4 *0.4 *0.4 *
Table 2. Average values of the melting end and solidification start temperatures (temperature frontier between the mushy state and the liquid state) and of the melting start and solidification end (temperature frontier between the solid state and the mushy state); DSC curves, cycle 2.
Alloys Melting RangesCBLTCBLT+NiCBLT++Ni
Liquid-Mushy1416 °C1414 °C1423 °C
Mushy-Solid1317 °C1322 °C1344 °C
Table 3. The average coefficients of thermal expansion (heating) or contraction (cooling) over the (25–1250 °C) temperature range.
Average Thermal Expansion CoefficientCBLTCBLT+NiCBLT++Ni
Heating (× 10−6 °C−1)19.518.818.7
Cooling (× 10−6 °C−1)17.317.817.5
Table 4. Values of the temperature of the total mass gain achieved during the 70 h–isothermal stage and of the parabolic constant of oxidation after correction from chromia volatilization * (rate estimated at Kv = 200 × 10−10 g cm−2 s−1).
Thermal Gravimetry AnalysisCBLTCBLT+NiCBLT++Ni
Isothermal mass gain12.3 mg/cm2
(16.8 mg/cm2) *
13.9 mg/cm2
(18.2 mg/cm2) *
12.3 mg/cm2
(16.7 mg/cm2) *
Kp corrected from Cr2O3 volatilization659
(×10−12 g2 cm−4 s−1) *
648
(×10−12 g2 cm−4 s−1) *
620
(×10−12 g2 cm−4 s−1) *
Publisher’s Note: MDPI stays neutral with regard to jurisdictional claims in published maps and institutional affiliations.

