Article

High Hydrogen Ion Concentration Causes a Blue Shift in Gold Nanoparticles

Department of Applied Physics, National University of Kaohsiung, Kaohsiung 81148, Taiwan
*
Author to whom correspondence should be addressed.
Crystals 2021, 11(2), 132; https://doi.org/10.3390/cryst11020132
Submission received: 7 January 2021 / Revised: 21 January 2021 / Accepted: 24 January 2021 / Published: 28 January 2021

Abstract

:
In this research, our team used a rare electrochemical method to obtain gold nanoparticles (GNPs). The growth solution has been added with nitric acid in order to observe the effect of GNPs. The solution also included cetyltrimethylammonium bromide (CTAB) and acetone. All reactions involved the oxidation of acetone and chain polymerization. Therefore, the GNPs changed to a su pramolecular structure. In addition, our team measured absorption wavelength via ultraviolet/ visible spectrophotometer and found an obviously blue shift. This short absorption wavelength is obviously different from other GNPs.

1. Introduction

In the past decade, nanotechnology has been extensively studied because of the unique characteristics of nanoparticles. Due to the quantum size effect, nanoparticles have many unique characteristics when they are smaller than a certain size. This study focuses on gold nanoparticles (GNPs). The studies on gold nanoparticles are the most abundant in the current literature [1,2,3,4,5,6,7,8], mainly because of the wide range of applications of such nanoparticles. Gold has unique physical and chemical properties, such as small size, large surface area and mass ratio, fluorescence [8,9], surface plasmon resonance (SPR) effect [2,3,4,5], surface-enhanced Raman scattering [10], and electrochemistry. After the GNPs’ surface is specially labeled, it can be used to bond with small molecules to expand the application of GNPs and can be used in biomedical research and clinical applications [11,12].
The manufacturing methods of GNPs are very diverse, including the laser ablation method [13], metal vapor synthesis, the chemical reduction method, and the electrochemical method [14]. The most commonly used method is chemical reduction. In this study, the researchers used a rare electrochemical method. In 1994, Reetz, M.T. and Helbig, W. [14] demonstrated the use of electrochemical methods to generate certain metal nanoparticles. The particle size can be adjusted simply by controlling the current or voltage of the electrolysis device. When electrolysis is performed electrochemically, the bulk metal of the anode is oxidized and produces metal ions; these metal ions will migrate to the cathode, and then the cathode will perform reduction and finally form atoms on the surface of the cathode. These atoms will be coated with a surfactant to form nanoparticles. The surfactant in the growth solution acts like an electrolyte and a stabilizer. The molecules that interact with each other will gather to form a micelle template to control the size and shape of the nanoparticles [15,16]. Therefore, the surfactant plays an important role. In addition, when an organic solvent is added to the surfactant solution, the organic solvent can usually decompose the polar group of the microcell at the interface of water and hydrocarbon so that the organic solvent will reduce the surface of the ionic micelles. The charge density changes the geometry of the surfactant cell template [17,18]. Therefore, adding organic solvent acetone during the electrolysis process may cause changes in the shape of the microcell template [19,20,21,22]. In this study, the research team developed various types of nanoparticles using this method [19,20,21,22,23]. This study mainly explores the effect of strong acids on gold nanoparticles. In the experiment, acetone is added as an organic solvent; the surfactant is cetyltrimethylammonium bromide (CTAB). Surfactant molecules align to form an electric bilayer on the surface of GNPs. The thickness of this electric bilayer will affect the electrostatic force between the particles. A proper thickness can stabilize the entire environment. The strong acid used is nitric acid. The final result will consider the absorption spectrum, full width at half maximum (FWHM), solution color, particle size, and shape.
As gold has good biological compatibility and the nano-gold surface has special effects (easy to bind with sulfur- and hydrogen-based components), nano-gold is often used in biomedical detection, disease diagnosis, and genetic detection. GNPs can also be applied to solar cells to improve conversion efficiency through doping. This study expects that short-wavelength GNPs can make a greater contribution to solar cells.

2. Experimental Process and Method

2.1. Material

(a)
The growth solution of 0.08 M was prepared by powder species: cetyltrimethylammonium bromide (CTAB, Fluka, 98%), liquid species:deionized water (DI water, 18.2 MΩ) of 3 mL, acetone (CH3COCH3, J. T. Baker), and nitric acid (HNO3, Fluka) of 30, 50, 70, and 90 μL in test tubes.
(b)
Aqua regia (nitric acid hydrochloride) solution was prepared by nitric acid (HNO3, Honeywell Fluka) and hydrochloric acid (HCl, J. T. Baker, 37%) at the volume ratio of 1:3.
(c)
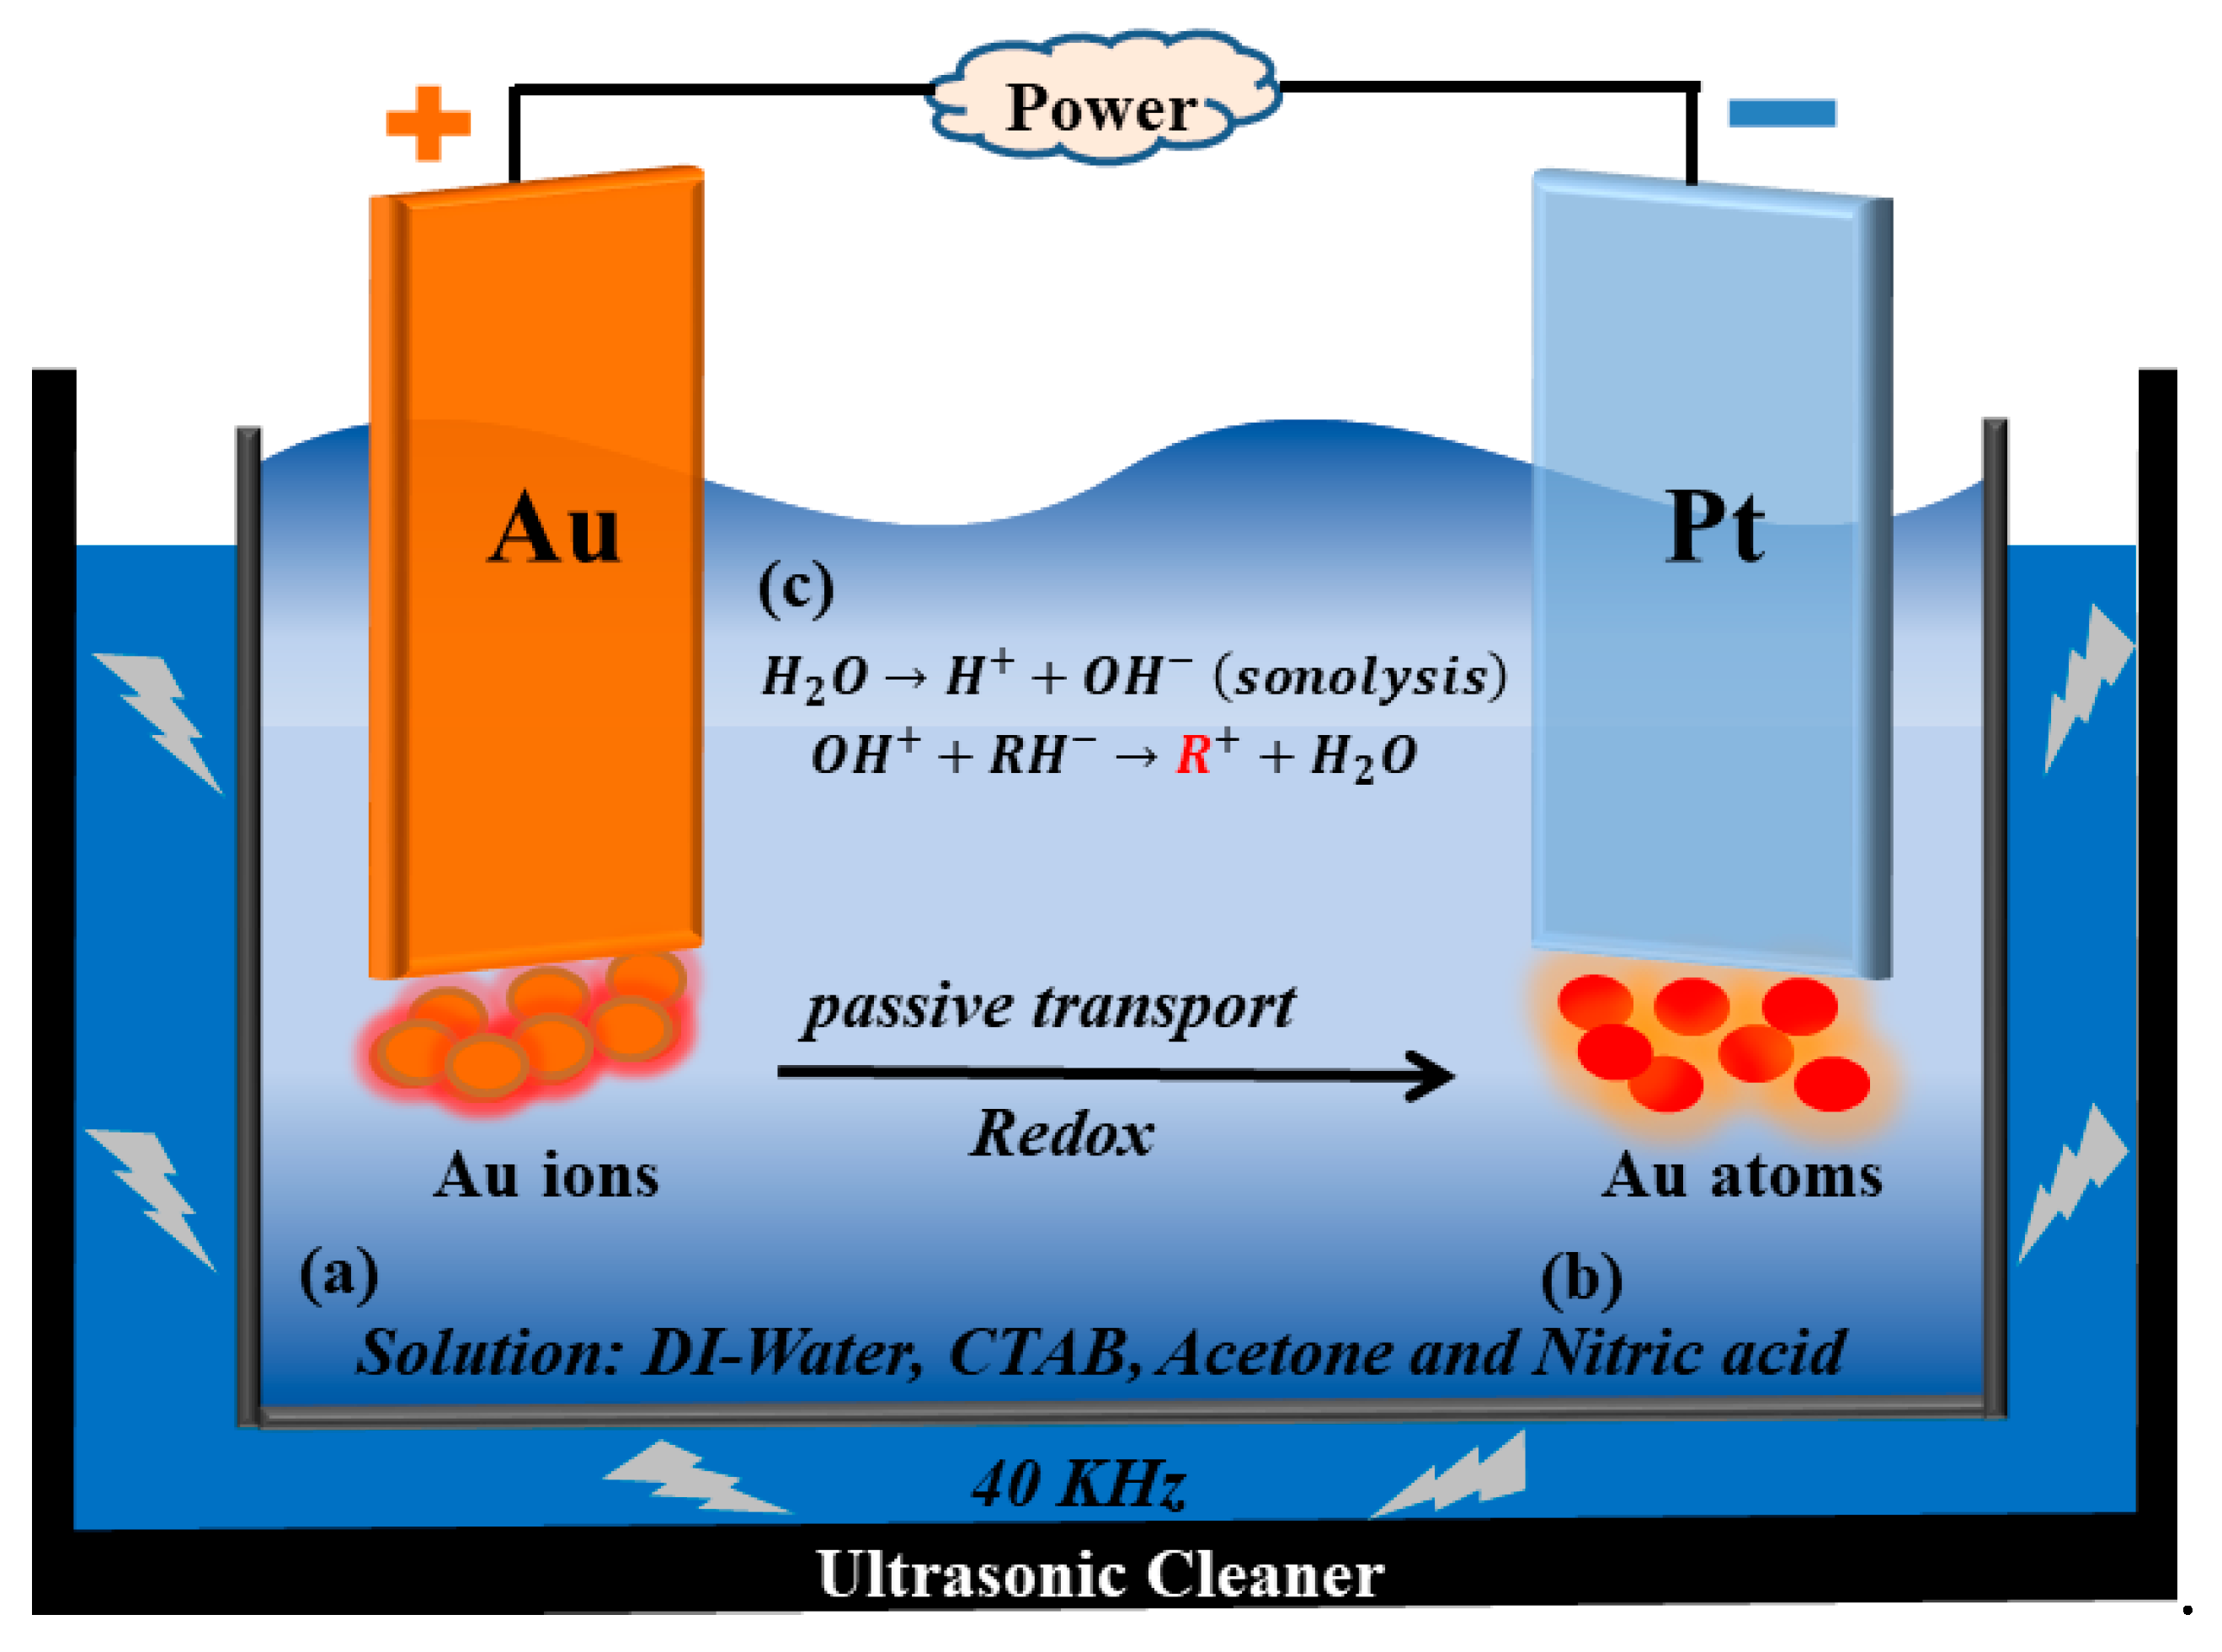
Electrochemical synthesis with two electrodes consisting of gold plate (Au, 99%) and platinum plate (Pt, 99%), connected with solid conductors (copper wire, 99%) to a complete electrolyzer system. A power supply (Agilent E3647A) offered a steady operating current through a fixed depth of electrode below the liquid level (8 mm). The detailed information of each material is also listed in Table 1.

2.2. Synthesis of GNPs

(a)
Both Au and Pt were cut into appropriate pieces (30 × 10 × 0.5 mm3) to act as anode and cathode, respectively. After standard cleaning operation, including polishing with fine sandpaper, immersing in aqua regia solution, and washing in DI water for 5 min each, these two electrodes were dried with nitrogen gas, positioned 5 mm apart, and secured using Teflon spacers.
(b)
Afterwards, a test tube containing growth solution was immersed in an ultrasonic oscillator (Hwashin, Model 420) at 40 KHz for 5 min, and the water temperature was kept at 24 ± 1 °C. The electric voltage between two electrodes was set at 2.5 V, and the test tube was electrolyzed and oscillated in the ultrasonic oscillator at 5 mA for 5 min. The complete process of electrochemical synthesis lasted 5 min, and each parameter is listed in Table 2.
(c)
The GNPs in powder form can be obtained using the following steps: (i) After adding toluene into the product solution and centrifuging at 12,000 rpm for 30 min, the interface separation (GNPs, toluene, and surfactant, from bottom to top) is accomplished; (ii) nanoparticles can be acquired through drying in an electric oven at 100 °C for three days, after extracting the CTAB solution that forms as a surfactant in the interlayer.

2.3. Measurement and Calculation of GNPs’ Characteristics

The optical performance of the GNP sample, filled with DI water in a quartz tube of 12.5 × 12.5 × 45 mm3, was measured by ultraviolet/visible (UV–vis) spectroscopy (HITACHI, U-3900) in the spectral region from 350 to 850 nm. The analysis of microstructure morphology was observed by analytical scanning transmission electron microscopy (TEM, JEM-3010, JEOL) at an accelerating voltage of 200 kV. The composition of GNPs can also be obtained by energy-dispersive X-ray spectroscopy (EDS). Through the three steps: mixing, centrifugation, and baking, the TEM sample of GNPs can be obtained. The mixing solution obtained by adding DI water or toluene was centrifuged to extract the hierarchical CTAB solution. Before placing it on standard copper grids (formvar carbon-supported film), with drying in an electric oven at 100 °C, centrifugation and extraction need to be repeated three times.

3. Result and Discussion

As shown in Figure 1, gold nanoparticles were prepared by a two-electrode electrochemical system. In the process, the gold sheet, as the anode, was electrolyzed, and then, the produced ions were reduced to atoms through free radicals generated by oscillation, following four main Equations [14]:
H2O → H+ + OH (sonolysis)
OH + + RH R + + H 2 O
RH R + H   ( sonolysis )
R + Au m + Au m 1 + H + + R
In Equation (1), the bonding of water molecules in the growth solution will be broken by oscillation to produce hydrogen (H) and hydroxyl (OH) ions. These two ions react with a hydrocarbon (RH) to produce the free radical (R+) in Equation (2). The RH generates free radicals under the action of oscillation in Equation (3). Free radicals can reduce the gold ions generated at the gold electrode from one to three valences and then to gold atoms in Equation (4). Eventually, it will move to the cathode to produce gold nanoparticles. To stabilize the entire system, the researchers added the stabilizer CTAB in the growth solution. This is a surfactant. When the critical microcell concentration is reached, it begins to form microcells and coat the gold atoms. Finally, stable gold nanoparticles will be produced. The experimental system is shown in Figure 1. Next, the optical property is discussed.
As shown in Figure 2, the absorption spectrum of GNPs obtained by different additions of HNO3 (30, 50, 70, and 90 μL) was measured from 350 to 500 nm to gain the optical properties. The absorbed peak of GNPs is located at 398 nm. The intensity is obviously increased with the increased addition of HNO3; the highest intensity is achieved with the HNO3 addition of 70 μL. According to our previous research [19,20,21,22,23], it was clearly found that a huge blue shift phenomenon, from 528 to 398 nm, was accomplished unprecedently. The reason for the large blue shift is attributed to the supramolecular structure of oxidation between acetone and HNO3 [24,25,26]. Generally, the variation in GNP size causes the blue or red shift, leading to a short shift distance of 10–15 nm. Compared to other groups [19,20,21,22,23], the blue shift difference of 130 nm is quite unique and large in this study.
Absorption intensity generally involves the uniformity and average particle size of the overall particles. Basically, we can evaluate the uniformity of the overall GNPs by calculating the value of FWHM. Figure 3 shows the FWHM of different additions of HNO3 (30, 50, 70, and 90 μL). It is found that the FWHM presented under different amounts of HNO3 is similar; the lowest value was obtained at 70 μL HNO3, that is to say, the uniformity obtained when adding 70 μL is the best. Figure 3 also shows the average particle size of the GNPs produced by HNO3 under different amounts. When HNO3 is initially added, there is a significant decrease in particle size, which indicates that the particle size is suppressed after the addition of HNO3. When we added 70 μL of HNO3, we get the GNPs with the smallest particle size.
Figure 4 shows the TEM images of different amounts of HNO3. GNPs with small particle size are shown in the 30 μL figure, and it was found that there are aggregation conditions; 70 and 90 μL amounts of HNO3 are aggregated into an island structure. This may be one of the reasons for the decrease in absorption strength. In addition, a shell-like substance was found in the 30 μL figure; thus, EDS was used for analysis.
Figure 5 shows the EDS analysis results of a specific area of the 30 μL sample. In this analysis, because the added nitric acid contains nitrogen, gold and nitrogen are selected to analyze the results. The results are displayed in places with more shell-like materials (green squares); the main element distribution is nitrogen. The material in the red square is mainly the aggregation of gold. Therefore, it is reasonable to speculate that nitrogen-related compounds generate and coat GNPs. Figure 6 shows that the irregular GNPs formed by the aggregation of particles are caused by numerous particles that are combined. The boundaries of these particles have different directions, resulting in defects. The reason for the aggregation may be due to the chain polymerization reaction. The chain polymerization reaction between acetone and nitric acid has been described in other studies. The initial step of acetone oxidation can be to extract H atoms from the methyl group of the ketone form of acetone by HNO3 molecules or to add HNO3 molecules to the double bond in the enol form of acetone, and then reduce nitric acid to nitrous acid. The equilibrium shifts from NO2 to N2O3, then to HNO2, and, finally, to NO2, according to the following equations [24,25,26]:
CH 3 C ( O ) CH 3 + HNO 3   CH 3 C ( O ) C · H 2 + H 2 O + NO 2
3 NO 2 + H 2 O   NO + 2   HNO 3
NO + NO 2   N 2 O 3
N 2 O 3 + H 2 O   2 HNO 2
HNO 2 + H 2 O   H 3 O + +   NO 2
With the development of the process, these reduced nitrogen-containing molecules appear in the system. When the Equations (6)–(9) moves to the left, NO2 is formed, and these reactions lead to chain branching. The following describes the chain polymerization reaction [24,25,26], which consumes NO2 to form acetone oxidation products.
CH 3 C ( O ) CH 3 + NO 2   CH 3 C ( O ) C · H 2 +   HNO 2
CH 3 C ( O ) C · H 2 + NO 2   CH 3 C ( O ) CH 2 O · + NO
CH 3 C ( O ) CH 2 O ·   CH 3 C · ( O ) + CH 2 O
CH 3 C · ( O ) +   NO 2     CH 3 C ( O ) ONO
CH 3 C ( O ) ONO + H 2 O   CH 3 COOH + HNO 2
CH 2 O +   NO 2   C · HO + HNO 2
With the acid-base equilibrium in Reaction (5), the NO2 concentration in the process will increase. For the two NO2 molecules consumed in Reactions (10) and (11), three NO2 molecules were regenerated by balancing (5). The formed NO2 molecules can enter the oxidation reaction again to form NO and HNO2. This process can be formally regarded as a branched-chain reaction. The above reproducible reactions will form supramolecular structures (Figure 7). For detailed principles and proofs, please refer to other literature.
As there are a large number of free radicals in the chain polymerization reaction, it indirectly affects the reduction and growth of GNPs. Therefore, it is speculated that gold ions cannot be successfully reduced. The GNPs in this experiment will likely exist in the form of monovalent (colorless), trivalent (light yellow), or atomic (Figure 8a) nanoparticles. The nitrogen compound produced by the final reaction of acetone and nitric acid is basically red or colorless. The final product made in this experiment is light yellow (Figure 8b), which can be speculated to be the form of trivalent gold. Therefore, the addition of nitric acid not only hinders the reduction of gold but also suppresses the particle size. In addition, for nitrogen compounds, including nitric acid, nitrate, and nitrite, the absorption wavelength is about 350~450 nm, which is the main reason for the blue shift.

4. Conclusions

In this study, a breakthrough was successfully made for the electrochemical manufacture of gold nanoparticles. A large blue shift is a very rare result. This result may be caused by the change of the dielectric constant around the GNPs, which will directly affect the change in the absorption wavelength of the SPR effect. Although the absorption strength is insufficient, it can be further improved, and stable manufacturing methods and formulations can be found in the future. Here, we only need a moderate amount (70 μL) to get the best result. In addition, it also explains the phenomenon of agglomeration, which is mainly related to acetone, nitric acid, and free radicals. It has a chain growth effect and grows into a supramolecular structure. It may be used in thin films and solar cells in the future. Macromolecular GNPs can enhance the scattering and optical path. In the use of small molecules, if absorption intensity is improved, this phenomenon can be used in the absorption layer, absorbing the short wavelength; combining with other materials will help form a large range of absorption wavelength solar cells. The application of this material is very promising.

Author Contributions

Data curation, P.-Y.L.; Formal analysis, P.-Y.L.; Funding acquisition, C.-J.H.; Investigation, P.-Y.L.; Resources, P.-C.L.; Writing–original draft, P.-Y.L.; Writing–review & editing, C.-J.H. All authors have read and agreed to the published version of the manuscript.

Funding

This work is sponsored by the Ministry of Science and Technology (MOST) of the Republic of China under contact number of 108-2221-E-390-006.

Institutional Review Board Statement

Not applicable.

Informed Consent Statement

Not applicable.

Data Availability Statement

Not applicable.

Acknowledgments

In here: thanks the contribution and guide in this paper for Shui-Yang Lien. Besides, this work is sponsored by the Ministry of Science and Technology (MOST) of the Republic of China under contact number 108-2221-E-390-006.

Conflicts of Interest

The authors declare no conflict of interest.

References

  1. Lucky, S.S.; Soo, K.C.; Zhang, Y. Nanoparticles in Photodynamic Therapy. Chem. Rev. 2015, 115, 1990–2042. [Google Scholar] [CrossRef] [PubMed]
  2. Ariga, K.; Li, J.; Fei, J.; Ji, Q.; Hill, J.P. Nanoarchitectonics for Dynamic Functional Materials from Atomic-/Molecular-Level Manipulation to Macroscopic Action. Adv. Mater. 2016, 28, 1251–1286. [Google Scholar] [CrossRef] [PubMed]
  3. Malgras, V.; Ji, Q.; Kamachi, Y.; Mori, T.; Shieh, F.-K.; Wu, K.C.-W.; Ariga, K.; Yamauchi, Y. Templated Synthesis for Nanoarchitectured Porous Materials. Bull. Chem. Soc. Jpn. 2015, 88, 1171–1200. [Google Scholar] [CrossRef]
  4. Wolfbeis, O.S. An overview of nanoparticles commonly used in fluorescent bioimaging. Chem. Soc. Rev. 2015, 44, 4743–4768. [Google Scholar] [CrossRef] [Green Version]
  5. Rubio, A.S. Modified Au-Based Nanomaterials Studied by Surface Plasmon Resonance Spectroscopy; Springer: Berlin, Germany, 2015. [Google Scholar]
  6. Linic, S.; Aslam, U.; Boerigter, C.; Morabito, M. Photochemical transformations on plasmonic metal nanoparticles. Nat. Mater. 2015, 14, 567–576. [Google Scholar] [CrossRef] [PubMed]
  7. Li, C.C.; Cai, W.; Cao, B.Q.; Sun, F.Q.; Li, Y.; Kan, C.X.; Zhang, L.D. Mass Synthesis of Large, Single-Crystal Au Nanosheets Based on a Polyol Process. Adv. Funct. Mater. 2006, 16, 83–90. [Google Scholar] [CrossRef]
  8. Vilchis-Nestor, A.; Sánchez-Mendieta, V.; Camacho-López, M.A.; Gómez-Espinosa, R.M.; Camacho-López, M.A.; Arenas-Alatorre, J.A. Solventless synthesis and optical properties of Au and Ag nanoparticles using Camellia sinensis extract. Mater. Lett. 2008, 62, 3103–3105. [Google Scholar] [CrossRef]
  9. Medley, C.D.; Smith, J.E.; Tang, Z.; Wu, Y.; Bamrungsap, S.; Tan, W. Gold Nanoparticle-Based Colorimetric Assay for the Direct Detection of Cancerous Cells. Anal. Chem. 2008, 80, 1067–1072. [Google Scholar] [CrossRef]
  10. Jain, P.K.; Lee, K.S.; El-Sayed, I.H.; El-Sayed, M.A. Calculated Absorption and Scattering Properties of Gold Nanoparticles of Different Size, Shape, and Composition: Applications in Biological Imaging and Biomedicine. J. Phys. Chem. B 2006, 110, 7238–7248. [Google Scholar] [CrossRef] [Green Version]
  11. Mizukoshi, Y.; Okitsu, K.; Maeda, Y.; Yamamoto, T.A.; Oshima, R.; Nagata, Y. Sonochemical preparation of bimetallic nanoparticles of gold/palladium in aqueous solution. J. Phys. Chem. B 1997, 101, 7033–7037. [Google Scholar] [CrossRef]
  12. Daniel, M.-C.; Astruc, D. Gold nanoparticles: Assembly, supramolecular chemistry, quantum-size-related properties, and applications toward biology, catalysis, and nanotechnology. Chem. Rev. 2004, 104, 293–346. [Google Scholar] [CrossRef] [PubMed]
  13. Kawasaki, M.; Masuda, K. Laser fragmentation of water-suspended gold flakes via spherical submicroparticles to fine nanoparticles. J. Phys. Chem. B 2005, 109, 9379–9388. [Google Scholar] [CrossRef] [PubMed]
  14. Reetz, M.T.; Helbig, W. Size-Selective Synthesis of Nanostructured Transition Metal Clusters. J. Am. Chem. Soc. 1994, 116, 7401–7402. [Google Scholar] [CrossRef]
  15. Kim, F.; Sohn, K.; Wu, J.; Huang, J. Chemical Synthesis of Gold Nanowires in Acidic Solutions. J. Am. Chem. Soc. 2008, 130, 14442–14443. [Google Scholar] [CrossRef] [PubMed]
  16. Törnblom, M.; Henriksson, U. Effect of Solubilization of Aliphatic Hydrocarbons on Size and Shape of Rodlike C16TABr Micelles Studied by2H NMR Relaxation. J. Phys. Chem. B 1997, 101, 6028–6035. [Google Scholar] [CrossRef]
  17. Galletto, P.; Brevet, P.F.; Girault, H.H.; Antoine, R.; Broyer, M. Enhancement of the Second Harmonic Response by Adsorbates on Gold Colloids: The Effect of Aggregation. J. Phys. Chem. B 1999, 103, 8706–8710. [Google Scholar] [CrossRef]
  18. Mulvaney, P.; Liz-Marzán, L.M.; Giersig, M.; Ung, T. Silica encapsulation of quantum dots and metal clusters. J. Mater. Chem. 2000, 10, 1259–1270. [Google Scholar] [CrossRef]
  19. Chou, D.-W.; Huang, C.-J.; Liu, N.-H. Synthesis of the Small and Uniform Gold Nanoparticles by Electrochemical Technique. J. Electrochem. Soc. 2016, 163, D603–D607. [Google Scholar] [CrossRef]
  20. Huang, C.-J.; Chiu, P.-H.; Wang, Y.-H.; Yang, C.-F. Synthesis of the gold nanodumbbells by electrochemical method. J. Colloid Interface Sci. 2006, 303, 430–436. [Google Scholar] [CrossRef]
  21. Huang, C.-J.; Chiu, P.-H.; Wang, Y.-H.; Yang, C.-F.; Feng, S.-W. Electrochemical formation of crooked gold nanorods and gold networked structures by the additive organic solvent. J. Colloid Interface Sci. 2007, 306, 56–65. [Google Scholar] [CrossRef]
  22. Huang, C.-J.; Wang, Y.-H.; Chiu, P.-H.; Shih, M.-C.; Meen, T.-H. Electrochemical synthesis of gold nanocubes. Mater. Lett. 2006, 60, 1896–1900. [Google Scholar] [CrossRef]
  23. Sze, P.-W.; Lan, W.-H.; Chou, D.-W.; Liu, N.-H.; Feng, S.-W.; Huang, C.-J. The Effect of Ascorbic Acid Using in Electrochemical Method to Synthesize Gold Nanoparticles. J. Nanosci. Nanotechnol. 2017, 17, 5735–5739. [Google Scholar] [CrossRef]
  24. Lagodzinskaya, G.V.; Laptinskaya, T.V.; Kazakov, A.I.; Kurochkina, L.S.; Manelis, G.B. Slow large-scale supramolecular structuring as a cause of kinetic anomalies in the liquid-phase oxidation with nitric acid. Russ. Chem. Bull. 2016, 65, 984–992. [Google Scholar] [CrossRef]
  25. Manelis, G.B.; Lagodzinskaya, G.V.; Kazakov, A.I.; Chernyak, A.V.; Yunda, N.G.; Kurochkina, L.S. Influence of the supramolecular structure of the liquid reaction medium on the kinetics of acetone oxidation with aqueous solutions of nitric acid. Russ. Chem. Bull. 2013, 62, 994–1002. [Google Scholar] [CrossRef]
  26. Rubtsov, Y.I.; Kazakov, A.I.; Sorokina, T.V.; Manelis, G.B. Critical phenomena in acetone oxidation by nitric acid. Russ. Chem. Bull. 2008, 57, 2065–2071. [Google Scholar] [CrossRef]
Figure 1. Schematic diagrams for gold nanoparticles (GNPs) via electrochemistry preparation: (a) the preparation of grown solution; (b) HNO3 added as a catalyst, forming a micelle template of condensation reaction; (c) electrolysis and oscillation are kept working in the interim.
Crystals 11 00132 g001
Figure 2. Light absorbance spectra of GNP solutions obtained at different HNO3 additions of 30, 50, 70, and 90 μL within a growth solution.
Crystals 11 00132 g002
Figure 3. Average diameter and full width at half maximum (FWHM) of GNP solutions obtained at different HNO3 additions of 30, 50, 70, and 90 μL within a growth solution.
Crystals 11 00132 g003
Figure 4. Growth solution is added to (a) 30, (b) 50, (c) 70, and (d) 90 μL HNO3 solution.
Crystals 11 00132 g004aCrystals 11 00132 g004b
Figure 5. Energy-dispersive X-ray spectroscopy (EDS) analysis of GNP solutions was obtained with an HNO3 addition of 30 μL within a growth solution (Sample A). In addition, red and green square represent the distribution of nitrogen and gold, respectively.
Crystals 11 00132 g005
Figure 6. (a) Transmission electron microscopy (TEM) analysis of GNPs observed a defect in Sample D. (b) TEM analysis of GNPs observed many GNPs were combined with large GNPs by the chain polymerization reaction.
Crystals 11 00132 g006
Figure 7. The growth process module of the supramolecular structure (a)→(b)→(c), produced in the reaction of acetone and nitric acid. (a) Initial structure generation. (b) chain polymerization reaction starts. (c) The chain polymerization reaction ends and becomes a supramolecular structure.
Crystals 11 00132 g007
Figure 8. The growth solution with and without nitric acid. (a) The growth solution color without nitric acid. (b) The growth solution color with nitric acid. (c) The absorption wavelength without nitric acid. (d) The absorption wavelength with 30 μL nitric acid.
Crystals 11 00132 g008
Table 1. Detailed information on the materials.
ItemValueUnit
Au plate30 × 10 × 0.5mm3
Pt plate30 × 10 × 0.5mm3
CTAB powder (0.08 M)87.5mg
DI water18.2
Acetone500μL
HNO330/50/70/90μL
Aqua regia (HNO3 per HCl)1:3volume
Table 2. Parameters for sonoelectrochemistry fabrication.
ParameterValueUnit
Depth of electrode below the liquid level8mm
Oscillated frequency40KHz
Oscillated temperature24 ± 1°C
Operated current5mA
Oscillated and operated time5min
Publisher’s Note: MDPI stays neutral with regard to jurisdictional claims in published maps and institutional affiliations.

