Article

The Influence of Annealing Temperature on the Structural and Optical Properties of ZrO2 Thin Films and How Affects the Hydrophilicity

by
A. Méndez-López
1,*,
O. Zelaya-Ángel
1,
M. Toledano-Ayala
1,
I. Torres-Pacheco
1,
J.F. Pérez-Robles
2 and
Y.J. Acosta-Silva
1,*
1
División de Investigación y Posgrado, Facultad de Ingeniería, Universidad Autónoma de Querétaro (UAQ), Centro Universitario, Querétaro, Qro. 76010, Mexico
2
Centro de Investigación y de Estudios Avanzados del Instituto Politécnico Nacional, Unidad Querétaro, A.P. 1-798, Querétaro, Qro. 76230, Mexico
*
Authors to whom correspondence should be addressed.
Crystals 2020, 10(6), 454; https://doi.org/10.3390/cryst10060454
Submission received: 11 February 2020 / Revised: 11 May 2020 / Accepted: 12 May 2020 / Published: 31 May 2020
(This article belongs to the Special Issue Optical and Microstructural Characterization of Thin Layers)

Abstract

:
Zirconium oxide (ZrO2) thin films were prepared by the sol-gel dip coating technique, in combination with annealing at different temperatures in air atmosphere, with the final goal of studying the water wettability of the surface. The annealing effects on the structural and optical properties of the ZrO2 films were investigated to check the characteristics of the material. X-ray diffraction (XRD) patterns of ZrO2 annealed at 450 °C and 550 °C show the formation of tetragonal phase, with layers constituted by nanoparticles with average particle size of 21 nm and 25 nm, respectively. Fourier-transform infrared spectroscopy (FT-IR) spectra revealed the presence of vibrational modes associated to ZrO2. Photoluminescence (PL) and ultraviolet-visible spectroscopy (UV–Vis) spectroscopy was used for optical properties. All deposited ZrO2 thin films presented a high optical transparency, with an average transmittance above 70% in the visible range (400–700 nm). The hydrophilic properties of ZrO2 films were characterized by means of the measurements of the contact angle. When the sample was annealed at 550 °C, the hydrophilicity reached the best behavior, which was explained as an effect of the structural and morphological change of the films.

1. Introduction

Zirconium oxide (ZrO2) is a very useful semiconductor material with several application areas such as catalyst [1], sensor of chemical species [2], corrosion resistant coatings [3], and in solid oxide fuel cells as a solid electrolyte [4]. In general, three polymorphs are known for ZrO2: monoclinic (< 1170 °C), tetragonal (1170–2370 °C), and cubic (> 2370 °C) [5]. ZrO2 is a widely studied material, due to its special properties, such as a wide ban gap (5.1–7.8 eV) [6], a dielectric constant (12–25) [7,8], good mechanical strength [9], high thermal expansion coefficient [10], and excellent hydrophilic properties [11].
For the ZrO2 films synthesis, a large variety of preparation methods have been applied: chemical spray pyrolysis [12], hydrothermal synthesis [13], electrodeposition [14], chemical vapor deposition (CVD) [15], atomic layer deposition [16], and sol-gel [17], among others. However, the sol-gel technique has been extensively applied due to some advantages, such as low temperature of synthesis and processing, surface homogeneity, control over the stoichiometry of films, large area deposition, and economic benefits [18]. Nowadays, ZrO2 hydrophilic films have attracted scientific and technological interest due to its applications in anti-fogging and self-cleaning surfaces [11,19] and superficial painting and protecting, etc. [20]. The hydrophilic properties of ZrO2 are determined by the following parameters: surface roughness characteristics [11], surface chemistry, free energy, and morphology [21]. The change of hydrophilic properties of ZrO2 after thermal treatments has become the material important for a large variety of applications, like the surface wettability controllable-switching and self-cleaning of many kinds of surfaces. This phenomenon, considered as thermo-induced hydrophilicity, is observed in the change of the water contact angle with the annealing temperature. Ye et al. [22] reported that the phenomenon can be explained by taking into account three aspects: 1) the cleansing effect, (2) the phase transition of crystal, and (3) the porosity change. Shirtcliffe et al. [23] found that tetraethyl orthosilicate (TEOS) foams are hydrophilic when they are annealed at temperatures greater than 400 °C, due to their surface chemistry starting to change, which occurs when organic groups migrate away from the surface. Meng et al. [24] reported that the annealing temperature can convert the TiO2 thin films into a material gifted with excellent hydrophilic surfaces. In fact, poor hydrophilicity is observed in amorphous TiO2 films; however, when the rutile phase rises by the increase of the annealing temperature, the hydrophilicity enhances. In mixed phases of anatase and rutile, where the mass fraction of anatase phase is 13%, the hydrophilicity is optimal [24]. Simon et al. [25] reported the inclusion of Poly(methyl methacrylate) and Pluronic-F127 in ZrO2-TiO2 layers to obtain superhydrophilic surfaces. These authors also reported a smooth spreading and channeling of the water by means of porous structure and high roughness, named the “wicking effect”. Here, the water is drawn from the pores by the water in contact with the surface material, and by capillary and suction, which slips smoothly on the channels of the rough surface. The vast majority of hydrophilic surfaces studied are dioxide titanium based.
In this paper, we reported the effect of the annealing temperature on the structural and optical properties of the ZrO2 films, with emphasis on the changes of the hydrophilic characteristics, synthetized by sol gel-dip coating method. The films were characterized by X-ray diffraction (XRD), photoluminescence (PL), Fourier-transform infrared spectroscopy (FT-IR), ultraviolet-visible spectroscopy (UV-Vis), scanning electron microscopy (SEM), atomic force microscopy (AFM) and contact angle measuring.

2. Experimental Details

2.1. Preparation of Films

ZrO2 films were deposited on glass substrates (Corning 2947, area 2.5 × 7.5 cm2) by the sol gel dip-coating method. The glass substrates were ultrasonically cleaned in a distilled and deionized aquous solution for a couple of hours, and later they were immersed in an aqueous solution of chromic acid during 1 h, before finally being put in a nitric acid water-solution at 100 °C for 1 h. The glass substrates were immersed into the ZrO2 growing solution at the dipping speed of 2 cm/s. The precursor solution was prepared using zirconium n-propoxide Zr(OCH3)4, and ethanol C2H5OH as the solvent. First, a controlled amount of nitric acid was dissolved in 40 ml of ethanol by magnetic stirring for 15 min, then 9 mL of zirconium propoxide was added to the solution. The stirring was continued for 1 hour to get a transparent yellowish solution. Last, the precursor solution was maintained at 7 °C for 24 h for aging. The removing rate of coated substrates was 2 cm/min. The ZrO2 films were prepared with six coatings, each layer was kept dried at 250 °C for 5 min in an open atmosphere oven. The set of as-grown layers were dried at 250 °C for 30 min and annealed at 250, 350, 450, and 550 °C in air atmosphere after desired number of coating.

2.2. Characterization of Films

For phase analysis X-ray diffraction (XRD) (Rigku, Tokyo, Japan) study of the thin films was carried out in a Philips X-ray diffractometer (PANalytical’s X’pert PRO X-ray diffractometer), using Cu-Kα radiation, with a wavelength of 0.15405 nm for the 20 ≤ 2θ ≤ 80° range. The voltage and current setting were 30 kV and 40 mA, respectively. The XRD data were registered with a step size of 0.02° (2θ) and 1 s per step. Photoluminescence (PL) signal was obtained at room temperature (RT) by optical excitation with a He-Cd laser, and luminescence was registered employing a Horiba/Spex 1404 0.85 m Double Spectrometer. Perkin Elmer Spectrum GX spectrometer operating at 4 cm−1 resolution was used to obtain the Fourier transform infrared spectroscopy (FT-IR) (PerkinElmer Inc., Wellesley, MA, USA) spectra in the wavenumber range of 4000–400 cm−1. The UV–visible transmittance spectrum (Thermo Fisher Scientific, Billerica, MA, USA) of thin films was recorded using Thermo Scientific™ Evolution 220 UV-Vis Spectrophotometer. Surface images of the films were achieved with a scanning electron microscope (SEM, Jeol JSM-6300) (SEMTech Solutions, Inc., North Billerica, MA, USA). The roughness and surface topography of the ZrO2 thin films were examined by AFM using a Park Scientific Inst. system. The hydrophilic properties of ZrO2 thin films were evaluated by the contact angle measuring instrument (Dataphysics, model OCA 50) by depositing a 5 μL droplet of deionized water on the ZrO2 thin films surface at RT.

3. Results and Discussion

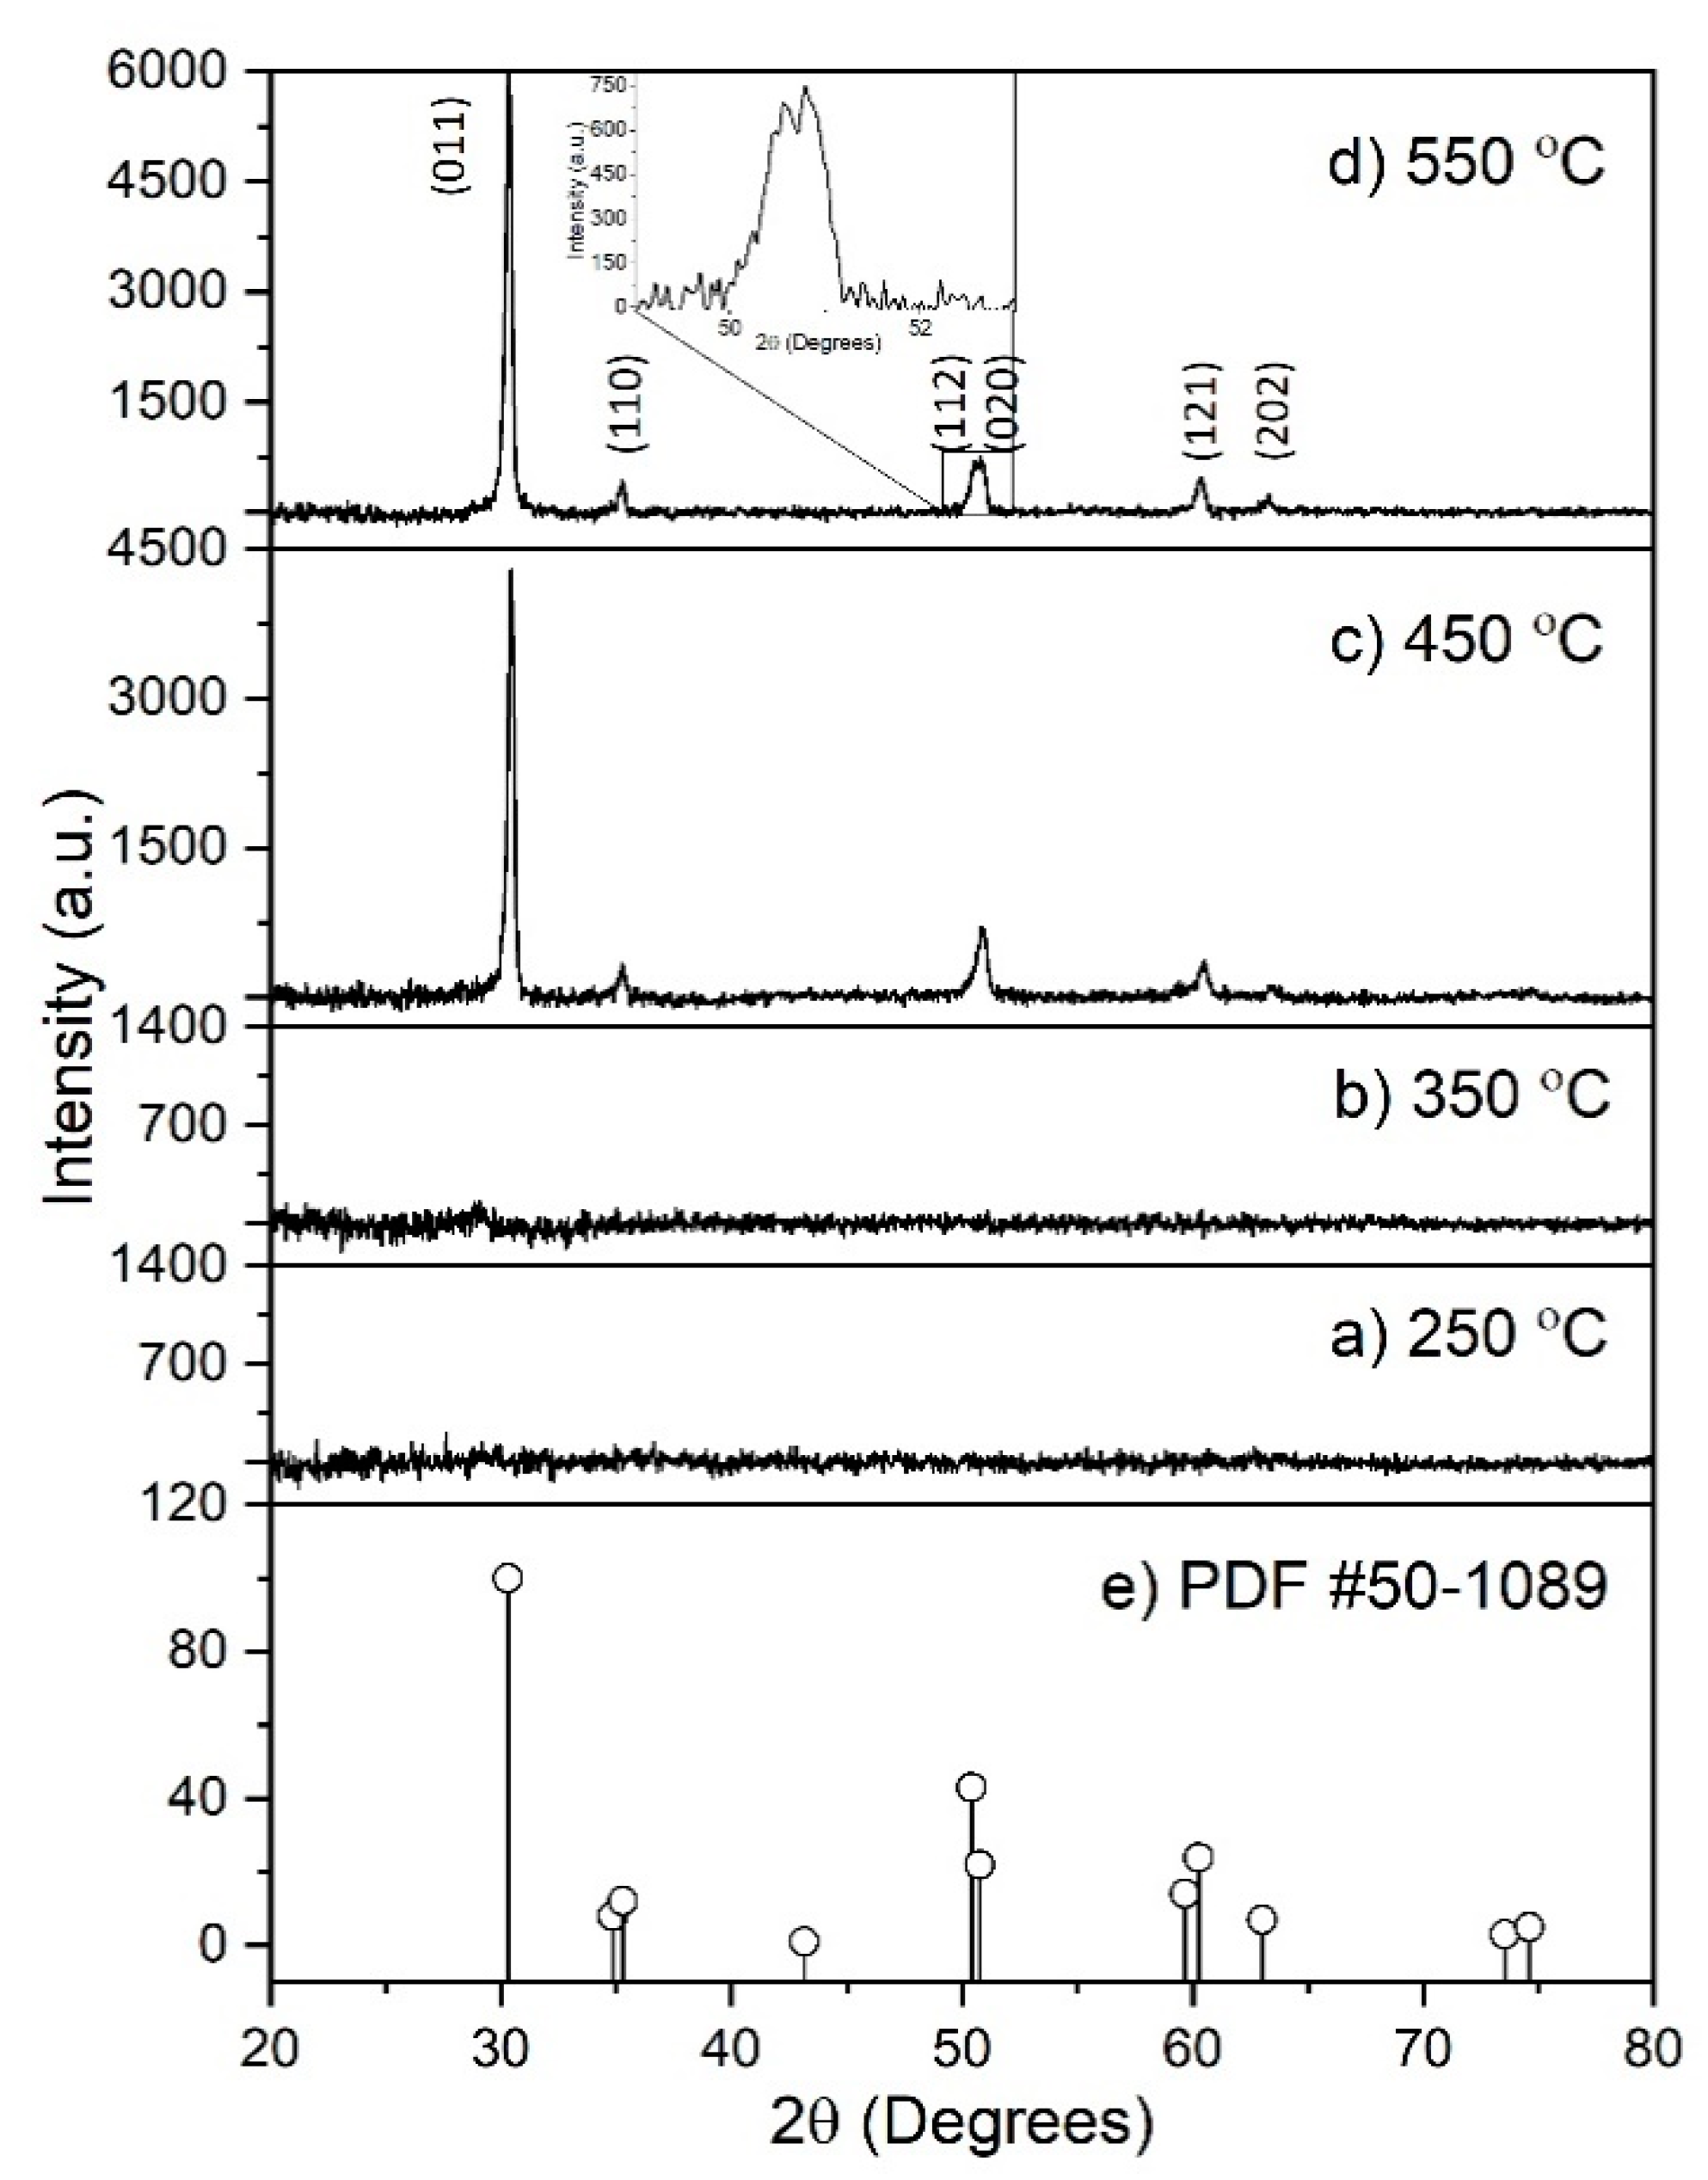
3.1. X-ray Diffraction

The phase composition of the synthetized ZrO2 thin films was characterized by XRD. Figure 1 exhibits the X-ray diffraction (XRD) patterns of ZrO2 thin films deposited on corning 2947 substrates at equal growth times, but at different annealing temperatures (Ta). The XRD patterns of the films sintered at Ta = 250 °C, 350 °C, 450 °C, and 550 °C are shown in Figure 1a–d. At the bottom of Figure 1e, the diffraction file of ZrO2 (PDF #50-1089) is plotted. For the high Ta values, the samples present only the tetragonal crystalline phase of ZrO2 [26]. The diffractograms of the film deposited at Ta = 250 °C and 350 °C exhibit a signal associated with an amorphous material. The patterns of the films deposited at 450 °C and 550 °C show both a peak with the higher intensity at 30.29°, corresponding to the (011) plane of the baddeleyite structure. These films grow with the (011) as preferred orientation. The presence of the reflection peaks at 35.28°, 50.42°, 50.75°, 60.26°, and 63.02° correspond to the (110), (112), (020), (121), and (202) planes of this same phase, respectively. The presence of some reflections from other phases are not observed. From the XRD patterns, it can be deduced that the as-deposited ZrO2 thin films remain amorphous until Ta < 350 °C. However, other authors have observed that by adding a low concentration of sulfur the crystallinity arises even at Ta as low as 200 °C, stabilizing predominantly the tetragonal phase [27]. Garvie found that the tetragonal phase stabilization in ZrO2 can be attributed to crystal-size effects [28]. The increasing sharpness of the XRD peaks with increasing temperatures indicates the gradual ripening of the ZrO2, phase, and gradual growth of tetragonal ZrO2 crystallites. These results are in agreement with those of Cassir et al. [29], and Li and Su [30], who obtained non-crystallized deposits close to 250 °C and 350 °C, as well as Lin et al. [31] and Lin et al. [32], who obtained crystallized deposits close to 450 °C and 550 °C. From the XRD patterns, the Full Width at Half Maximum (FWHM) of the diffraction reflection, λ = 1.5406 Å is the X-ray wavelength (for CuKα line), θ is the angle of reflection, and K = 0.94 is the shape factor was used to estimate the crystallite size (CS) using the Scherrer formula [33]. An XRD pattern of silicon wafer was used for instrumental error compensation and calibration of JADE 6.5® analysis software. For Ta = 450 °C the average crystallite size was around 21 nm, which slightly increases to 25 nm for 550 °C. Similar results have been reported in the literature: 17 nm, 20 nm, and 22 nm at 450 °C, 500 °C and 600 °C, respectively [34,35,36].

3.2. FT-IR Spectroscopy

For the vibrational properties study, FT-IR spectrometry was employed, FT-IR spectra of the as-prepared and annealed zirconia thin films measured along the 400–4000 cm−1 range are presented in Figure 2. The FT-IR spectra were employed to check the formation of nanocrystalline zirconia in the tetragonal phases. The most vibrational bands observed in the spectra corresponds to bonds existing in ZrO2. The metal and oxygen bonds (Zr-O) are situated between 400 and 820 cm−1 [37,38,39]. The weak bands at 1260 cm−1 can be associated to carboxylate (COO-) groups [40]. Navio and coworkers reported that, for the ZrO2 tetragonal phase stabilization, the oxygen ion vacancy density needed may be originated only if carbonaceous material is present in the oxide lattice. In this manner, the stabilizization, to a high degree, of tetragonal ZrO2 structure is induced by carbon impurities [41,42]. The signal centered at 1350 cm−1 can be ascribed to stretching modes of terminal groups Zr-O– [43]. As per Bermúdez et al., the peak in the vicinity of 1610 cm−1 and the peak within the region, 1150–1350 cm−1 are characteristic of tetragonal ZrO2 [44]. Peaks of around 1610 cm–1 and 3600 cm−1 are attributed to the vibration modes of the –OH bond related hydroxyl groups [45,46], and the one at around 2200 cm–1 to CO2 [47]. These vibrational modes, come of OH from ambient, and CO2 from ambient and solution residual [48].

3.3. UV-Vis

A wide distribution of light wavelength absorption is an important property should possess every good photocatalyzer [49]. The optical transmittance (To) spectra of the ZrO2 thin film deposited at 250 °C, 350 °C, 450 °C, and 550 °C are shown in Figure 3a. The thin films exhibit continuous transmittance across the UV-vis spectrum, with decreasing transmittance near the UV region. The ZrO2 films of this work showed a high transparency, with an average optical transmittance >70% in the 400–700 nm range, that enables them for transparent electronic applications, moreover, the absence of interference fringes indicates the films are thin, and the lack of multiple reflections at the air/film and film/substrate interfaces, facilitates a maximum transmittance of light through the films volume [50]. In addition, the presence of no fringes assures thickness uniformity. A shift of the transmittance curves toward the region of lower wavelength values is observed, which suggested a decrease of the thin films thickness, which supports the profilometer results on the increase of annealing temperature; moreover, different research groups have reported similar observations on other ZrO2 films [51,52,53,54]. This variation (wavelength shift) of the optical properties plays also as a basic requirement for a material that modifies its photocatalytic behavior. The direct optical bandgap was calculated using the Tauc’s method, ( α h v ) 2 data was plotted versus the photon energy ( h v ) , the extrapolation of the linear section of the curve to ( α h v ) 2 = 0, that is the energy axis, as observed in Figure 3b-e, provides the Eg value. Here, α is the optical absorbance coefficient (α = [Log(100/To)]/ [τLoge]). The all Eg values have been determined to be, 4.0 ± 0.1, that is, Eg has, within the error bar, practically the same value for all Tas. It is well known that a population of localized states intervenes as an important factor to alter sensitively the states into the band gap. This density is generally attributed to the presence of impurities, defects, and disorder into the material lattice, which, in turn, leads to the decreasing Eg. Nevertheless, the crystalline quality is, in general, improved with Tas, thus, it can enlarge the Eg value [55]. In our case, both effects can be compensated. The high Ta values help to reduce the density of defects and disorders in the material, so the density of the local states also decreases. The transmission peaks in the low wavelength region can arise (see Figure 3a), due to the valence band to conduction band transition [56]. However, these peaks in the transmission spectra are located at lower energy, as compared with the optical band gap 5.00 eV reported for bulk ZrO2 [57]. The result indicates that a considerable contribution from states exists, so that affects the transmission in that region. A large amount of surface defects can appear on the zirconia nanocrystals, due to their high surface/volume ratio [58,59]. It is worth noting that the Eg values obtained in our study are comparable with most of the ones reported in samples prepared by others processes [60,61,62], and have even more similarity with those reported for ZrO2 thin films prepared by Carević et al. (4.10 eV) [63] and Vaizoğullar (4.11 eV) [64].

3.4. Photoluminescence Spectroscopy

The photoluminescence (PL) technique is one of the most used optical methods for the semiconductor analysis. It has a powerful and sensitive ability to find presence of impurities, exciton fine structure, and defects, which commonly affect the material quality. Hih purity ZrO2 shows, in general, several broad emission-bands, which depend on the preparation techniques and excitation energy [65]. ZrO2 thin films of 250 °C and 350 °C mainly present two emission signals: one centered at 423 nm (2.93 eV) and the other at 532 nm (2.33 eV). For the 450 °C and 550 °C samples, three emission bands are present: one centered at 414 nm (3 eV), 434 nm (2.86 eV), and 532 nm (2.33 eV). The observed photoluminescence in ZrO2 films is probably due to non-stoichiometric material because an oxygen deficiency, originated by oxygen vacancies, formed when ZrO2 is synthesized [66]. Most peaks present in the PL spectra are transitions involving defects, which are after modified due to different Tas. therefore, an evident variation of the PL bands intensity for the different films is expected. A representative fluorescence spectrum excited with a wavelength of 325 nm and measured at RT, shown in Figure 4, exhibits four emission PL bands. The PL peak at 414 nm has been associated to Zr4+ vacancies, which is one of most intense peaks considered to be originated from emissions of free-exciton recombination at near band edge (NBE) [67]. Liang et al. [68] have reported that large amounts of surface defects should exist on the as-synthesized ZrO2 crystallites, because of the relatively high surface area. In the case of the emission at around 423 nm, it has been assigned to electron transitions from F-centers excited states to the ground state [69]. This emission can be compared with the 425 nm (2.92 eV) PL emission band in Zr1-xMnxO2 prepared by chemical synthesis and associated to oxygen vacancies, as reported previously by Pattanaik et al. [70]. Selvam et al. reported that oxygen-vacancies present in the lattice of ZrO2 nanocrystals are responsible for that PL emission [46]. The blue band at 434 nm is originated by singly ionized two-oxygen-vacancy (F–F)+ defects [71]. The peak at 532 nm could be ascribed to the emission from NBE transitions [65]. In the case of the complete emission band, transitions from all the mid-gap trap states are involved, such as surface defects and oxygen vacancies (Ov), grain boundaries [72].

3.5. Scanning Electron Microscope

The micrographs were recorded using an accelerating voltage of 1.0 kV with a ×50,000 magnification. The micrographs of ZrO2 thin films were recorded in samples with the different Ta values studied. Figure 5a shows a sample which mostly presents a flat surface, is highly homogeneous, and has no cracks, and also looks somewhat spongy, with some surface imperfections like dark spots, which probably are a product of polycondensation (sol/gel) and/or densification cases. In Figure 5b, the film looks something dense without any cracks, scales, or pores. In addition, some bulges and pits irregularly distributed on the surface were observed [73]. It is believed that this fact is related to the crystallization of the thin film and with the formation of ZrO2. For the samples annealing at 450 °C and 550 °C (Figure 5c,d), it can be observed that both thin films are polycrystalline. Figure 5c shows that the thin film has a high homogeneity on the surface, with some nanocrystals with the size dispersed in the 30–60 nm interval. In addition, these nanocrystals are distributed non-uniformly and discontinuously on the surface of the ZrO2 sample, as shown in Figure 5d. The size of nanocrystals can increase up to ~ 100–150 nm, because they gradually agglomerate, giving place to a particle whose size augments as the annealing temperature increases. The shapes and sizes of these nanocrystal are found to depend on the annealing temperature. It can be observed that these shapes gradually transform from nanocrystal shapeless at 450 °C, until exhibiting tetragonal morphology at 550 °C [74].

3.6. Atomic Force Microscopy

In order to further investigate the effect of the annealing temperature on the surface appearance of the ZrO2 thin films, a quantitative method for examining the morphology and structure is obtained, studying the roughness of AFM surface measurements. Figure 6a,c,e,g shows three-dimensional AFM images where the surface morphology can be appreciated. Figure 6b,d,f,h shows the roughness taken over 2 μm × 2 μm area of the surface coatings. The thin film roughness after the treatment at different Tas, determined by the AFM analysis, can be seen in Figure 6i. Figure 6i shows the thickness versus Ta plot. The mean roughness (MR), and root mean square roughness (RMSR), which represent the arithmetic average of the deviations from the median plane, are displayed in the upper inset. Area measure of the surface imperfections. Our results show a small increase in roughness after thermal annealing. As shown in Figure 6a, the surface roughness of the as-grown ZrO2 thin film is 0.312 nm, the increase in roughness after thermal annealing can be explained by the grain growth, the sintering process and some structure densification of the films [75,76].

3.7. Measurement of the Contact Angles

The contact angles (CAs) of the water drop can be observed in snapshot images showing the on the samples, annealed with different Ta, are shown in Figure 7a–d. The contact (or wetting) angle is a measurement of the surface-surface wettability of a solid by a liquid. CA > 90° (high contact angle) is interpreted as unfavorable wetting, in this way, the fluid minimizes contact with the surface and forms a compact liquid droplet. Surfaces with CA > 90° are classified as hydrophobic, which show low wettability, adhesion, and surface free energy. When CA < 90°, the surface is considered as hydrophilic. The Young-Laplace equation explains the drop-surface profile [77]. A simpler Young-Laplace approach application is to consider that the drop profile is a spherical section. Under this assumption, we will applied the well-known A/2 method suggested to measure the drop CA. Here, three to five points on the surface drop are chosen to quickly obtain the sphere parameters. In this way, the corresponding static CA (θ) is calculated by obtaining several data of the diameter D and the height A of a drop [78]:
θ 2 = 180 π tan 1 ( 2 A D )
Provided the drop volume is considered as a very small one, the gravity effect may not be taken into account as compared with the liquid surface tension, and the spherical assumption is enough valid with little random error [79]. The water drops volume for this work was set to be ~5 µL. As shown in Figure 7a–d, the hydrophilicity of film for Ta = 550 °C is better than for 250 °C, 350 °C, and 450 °C. According to theory, CA is drastically influenced by the surface tension [80]. Figure 7e shows that the CA versus Ta plot for the four thin films studied describes a high linear inverse relation. This fact can be, in part, attributed to the surface roughness, added to defects formed on the surface (oxygen vacancies) [81]. The modification of the surface by thermal treatments influences the wettability of the samples, as shown in Figure 7.
The effect of annealing on most oxides is to provoque oxygen vacancies (Ov), whose density increases in a larger degree at the surface when Ta increases, where ZrO2 is one of them [82]. The Ov influences, besides the roughness factor, the wettability properties of solid surfaces [81]. Some existent theories on the hydrophilicity contain an admissible explanation on the wettability of a liquid on a hydrophylic surface, which, for this work, should be considered in relation to the polar character of the H2O molecule, because here, the effect of the surface charged defects (vacancies, impurities, etc) on the dipolar charge O2−-2H+ intervenes, that is, the dipolar charge of H2O moleculeis affected by the lack of electrical neutrality of surface. In Figure 8, a schematic image [83] of the ZrO2 (011) tetragonal surface (the films present high preferred orientation along the (011) direction) with H2O molecules, is represented in the case of (a) the hydrophobic character with no Ov on the surface, and (b) with Ov generated by the annealing.

4. Conclusions

The structural, morphological, and optical properties of ZrO2 thin films, prepared by means of the sol-gel method using a simple precursor, were discussed in this work. The influence of annealing on the optical and structural properties of tetragonal ZrO2 and, mainly, on the water wettability of the films. As the prepared samples are amorphous, they stay like this up to Ta ≅ 350 °C. For Ta = 450 and 550 °C, the ZrO2 becomes crystalline. The crystallite size of the ZrO2 thin films, increased as Ta increases, indicates improved crystallinity. Band gap energies of all the synthesized samples were estimated using the Tauc formulas. It was shown that ZrO2 thin films in this work have a narrower band-gap than the bulk of those reported. The Eg of the samples lies between 3.929–4.037 eV. PL of the thermal annealed ZrO2 films was studied for the different Ta values, lower PL intensity suggested more numbers of surface defects and oxygen vacancies. These results corroborated SEM analysis that evidenced homogeneous surface of the film, with an absence of cracks and good adhesion to the substrate. The surface morphologies of the ZrO2 thin films showed that the mean and Rms roughness of the thin films increases with the increase of the annealing temperature. Measurements of the contact angles suggested that the decrease in contact angles with temperature is more sensitive to the change in water surface tension. The increase of the crystallite size, the augmentation of oxygen vacancies, and the roughness can influence the transformation of ZrO2 from a low-hydrophilic to a high-hydrophilic material.

Author Contributions

Conceptualization, J.F.P.-R.; Formal analysis, I.T.-P.; Investigation, Y.J.A.-S.; Methodology, A.M.-L. and M.T.-A.; Project administration, Y.J.A.-S.; Resources, A.M.L.; Supervision, A.M.-L., O.Z.-A. and Y.J.A.-S. All authors have read and agreed to the published version of the manuscript.

Funding

This research received no external funding.

Acknowledgments

We appreciate the support of the “Programa para el Desarrollo Profesional Docente (PRODEP)” with the project “Concreto mejorado mediante el deposito de nanopartículas de ZrO2” and “Dirección de Planeación–Universidad Autónoma de Querétaro.” In addition, thanks are due to C. Zuñiga-Romero, A. Tavira- Fuentes, R.A. Mauricio-Sánchez, A.B. Soto, R. Fragoso, and A. Guzmán-Campuzano for their technical assistance. Also, the authors would like to thank especially to the all members of the Nanotechnology and Photocatalysis Laboratory at Airport Campus of the Autonomous University of Querétaro.

Conflicts of Interest

The authors declare no conflict of interest.

References

  1. Kauddori, A.; Mazzochia, C.; Tempesti, E.; Anouchinsky, R. On the activity of ZrO2 prepared by different methods. J. Therm. Anal. 1998, 53, 97–109. [Google Scholar] [CrossRef]
  2. Gannavarapu, K.P.; Ganesh, V.; Thakkar, M.; Mitra, S.; Dandamudi, R.B. Nanostructured Diatom-ZrO2 composite as a selective and highly sensitive enzyme free electrochemical sensor for detection of methyl parathion. Appl. Surf. Sci. 2015, 349, 916–923. [Google Scholar] [CrossRef]
  3. Yu, J.; Ji, G.; Shi, Z.; Wang, X. Corrosion resistance of ZrO2 films under different humidity coal gas conditions at high temperature. J. Alloys Compd. 2019, 783, 371–378. [Google Scholar] [CrossRef]
  4. Cha, S.W.; Cho, G.Y.; Lee, Y.; Park, T.; Kim, Y.; Lee, J. Effects of carbon contaminations on Y2O3-stabilized ZrO2 thin film electrolyte prepared by atomic layer deposition for thin film solid oxide fuel cells. Cirp Ann. 2016, 65, 515–518. [Google Scholar] [CrossRef]
  5. Chen, L.; Mashimo, T.; Omurzak, E.; Okudera, H.; Iwamoto, C.; Yoshiasa, A. Pure Tetragonal ZrO2 Nanoparticles Synthesized by Pulsed Plasma in Liquid. J. Phys. Chem. C 2011, 115, 9370–9375. [Google Scholar] [CrossRef]
  6. Balog, M.; Schieber, M. The chemical vapor deposition and characterization of ZrO2 films organometallic compounds. Thin Solid Films 1997, 47, 109–120. [Google Scholar] [CrossRef]
  7. Harrop, P.J.; Wanklyn, J.N. The dielectric constant of zirconia. Br. J. Appl. Phys. 1967, 18, 739–742. [Google Scholar] [CrossRef]
  8. Mahajan, A.M.; Khairnar, A.G.; Thibeault, B.J. High Dielectric Constant ZrO2 Films by Atomic Layer Deposition Technique on Germanium Substrates. Silicon 2016, 8, 345–350. [Google Scholar] [CrossRef]
  9. Kumar, K.R.; Pridhar, T.; Balaji, V.S.S. Mechanical properties and characterization of zirconium oxide (ZrO2) and coconut shell ash(CSA) reinforced aluminium (Al 6082) matrix hybrid composite. J. Alloys Compd. 2018, 765, 171–179. [Google Scholar] [CrossRef]
  10. Patil, R.N.; Subbarao, E.C. Axial thermal expansion of ZrO2 and HfO2 in the range room temperature to 1400 °C. J. Appl. Crystallogr. 1969, 2, 281–288. [Google Scholar] [CrossRef]
  11. Duan, Z.; Luo, D.; Liu, Z.; Zhao, Z.; Zhao, M.; Zhang, J.; Zhao, G. Patterning ZrO2 films surface: Superhydrophilic and superhydrophobic properties. Ceram. Int. 2017, 43, 5089–5094. [Google Scholar] [CrossRef]
  12. Oluwabi, A.T.; Acik, I.O.; Katerski, A.; Mere, A.; Krunks, M. Structural and electrical characterisation of high-k ZrO2 thin films deposited by chemical spray pyrolysis method. Thin Solid Films 2018, 662, 129–136. [Google Scholar] [CrossRef]
  13. Piticescu, R.R.; Monty, C.; Taloi, D.; Motoc, A.; Axinte, S. Hydrothermal synthesis of zirconia nanomaterials. J. Eur. Ceram. Soc. 2001, 21, 2057–2060. [Google Scholar] [CrossRef]
  14. Stefanov, P.; Stoychev, D.; Valov, I.; Kakanakova-Georgieva, A.; Marinova, T. Electrochemical deposition of thin zirconia films on stainless steel 316 L. Mater. Chem. Phys. 2000, 65, 222–225. [Google Scholar] [CrossRef]
  15. Carta, G.; Habra, N.E.; Rossetto, G.; Zanella, P.; Casarin, M.; Barreca, D.; Maragno, C.; Tondello, E. MgO and CaO stabilized ZrO2 thin films obtained by Metal Organic Chemical Vapor Deposition. Surf. Coat. Technol. 2007, 201, 9289–9293. [Google Scholar] [CrossRef]
  16. Song, H.; Jeon, H.; Shin, C.; Shin, S.; Jang, W.; Park, J.; Chnag, J.; Choi, J.H.; Kim, Y.; Lim, H.; et al. The effect of ozone concentration during atomic layer deposition on the properties of ZrO2 films for capacitor applications. Thin Solid Films 2016, 619, 317–322. [Google Scholar] [CrossRef]
  17. Xia, W.; Li, N.; Deng, B.; Zheng, R.; Chen, Y. Corrosion behavior of a sol-gel ZrO2 pore-sealing film prepared on a microarc oxidized aluminum alloy. Ceram. Int. 2019, 45, 11062–11067. [Google Scholar] [CrossRef]
  18. Boratto, M.H.; Congiu, M.; Santos, S.B.O.d.; Scalvi, L.V.A. Annealing temperature influence on sol-gel processed zirconium oxide thin films for electronic applications. Ceram. Int. 2018, 44, 10790–10796. [Google Scholar] [CrossRef] [Green Version]
  19. Rudakova, A.V.; Emeline, A.V.; Bulanin, K.M.; Chistyakova, L.V.; Maevskaya, M.V.; Bahnemann, D.W. Self-cleaning Properties of Zirconium Dioxide Thin Films. J. Photochem. Photobiol. A Chem. 2018, 367, 397–405. [Google Scholar] [CrossRef]
  20. Joung, Y.H.; Choi, W.S.; Shin, Y.; Lee, M.; Kim, H.; Song, W. Characterization of a novel super-hydrophilic coating film as a function of different spin coating speeds. J. Korean Phys. Soc. 2013, 63, 246–250. [Google Scholar] [CrossRef]
  21. Sun, Y.; Sun, S.; Liao, X.; Wen, J.; Yin, G.; Pu, X.; Yao, Y.; Huang, Z. Effect of heat treatment on surface hydrophilicity-retaining ability of titanium dioxide nanotubes. Appl. Surf. Sci. 2018, 440, 440–447. [Google Scholar] [CrossRef]
  22. Ye, Q.; Liu, P.Y.; Tang, Z.F.; Zhai, L. Hydrophilic properties of nano-TiO2 thin films deposited by RF magnetron sputtering. Vacuum 2007, 81, 627–631. [Google Scholar] [CrossRef]
  23. Shirtcliffe, N.J.; McHale, G.; Newton, M.I.; Perry, C.C. Intrinsically Superhydrophobic Organosilica Sol-Gel Foams. Langmuir 2003, 19, 5626–5631. [Google Scholar] [CrossRef]
  24. Meng, F.; Xiao, L.; Sun, Z. Thermo-induced hydrophilicity of nano-TiO2 thin films prepared by RF magnetron sputtering. J. Alloys Compd. 2009, 485, 848–852. [Google Scholar] [CrossRef]
  25. Simon, S.M.; Chandran, A.; George, G.; Sajna, M.S.; Valparambil, P.; Kumi-Barmiah, E.; Jose, G.; Biju, P.R.; Joseph, C.; Unnikrishnan, N.V. Development of Thick Superhydrophilic TiO2−ZrO2 Transparent Coatings Realized through the Inclusion of Poly(methyl methacrylate) and Pluronic-F127. ACS Omega 2018, 3, 14924–14932. [Google Scholar] [CrossRef]
  26. Codato, S.; Carta, G.; Rosetto, G.; Rizzi, G.A.; Zanella, P.; Scardi, P.; Leoni, M. MOCVD Growth and Characterization of ZrO2 Thin Films Obtained from Unusual Organo-Zirconium Precursors. Chem. Vap. Depos. 1999, 5, 159–164. [Google Scholar] [CrossRef]
  27. Morterra, C.; Cerrato, G.; Emanuel, C.; Bolis, V. On the Surface Acidity of Some Sulfate-Doped ZrO2 Catalysts. J. Catal. 1993, 142, 349–367. [Google Scholar] [CrossRef]
  28. Garvie, R.C. The Occurrence of Metastable Tetragonal Zirconia as a Crystallite Size Effect. J. Phys. Chem. 1965, 69, 1238–1243. [Google Scholar] [CrossRef]
  29. Cassir, M.; Goubin, F.; Bernay, C.; Vernoux, P.; Lincot, D. Synthesis of ZrO2 thin films by atomic layer deposition: Growth kinetics, structural and electrical properties. Appl. Surf. Sci. 2002, 193, 120–128. [Google Scholar] [CrossRef]
  30. Li, Z.; Su, K. The direct reaction between CO2 and phenol catalyzedby bifunctional catalyst ZrO2. J. Mol. Catal. A Chem. 2007, 277, 180–184. [Google Scholar] [CrossRef]
  31. Lin, C.; Zhang, C.; Lin, J. Phase Transformation and Photoluminescence Properties of Nanocrystalline ZrO2 Powders Prepared via the Pechini-type Sol-Gel Process. J. Phys. Chem. C 2007, 111, 3300–3307. [Google Scholar] [CrossRef]
  32. Lin, J.M.; Hsu, M.C.; Fung, K.Z. Deposition of ZrO2 film by liquid phase deposition. J. Power Sources 2006, 159, 49–54. [Google Scholar] [CrossRef]
  33. Lucio-Ortiz, C.J.; de la Rosa, J.R.; Hernández-Ramírez, A.; López-Cuellar, E.M.; Beltrán-Pérez, G.; Miranda-Guardiola, R.C.; Pedroza-Solís, C.D. La-, Mn- and Fe-doped zirconia catalysts by sol–gel synthesis: TEM characterization, mass-transfer evaluation and kinetic determination in thecatalytic combustion of trichloroethylene. Colloids Surf. A Physicochem. Eng. Asp. 2010, 371, 81–90. [Google Scholar] [CrossRef]
  34. Štefanic, G.; Štefanic, I.I.; Music, S. Influence of the synthesis conditions on the properties of hydrous zirconia and the stability of low-temperature t-ZrO2. Mater. Chem. Phys. 2000, 65, 197–207. [Google Scholar] [CrossRef]
  35. Silva, M.C.; Trolliard, G.; Masson, O.; Guinebretiere, R.; Dauger, A.; Lecomte, A.; Frit, B. Early Stages of Crystallization in Gel Derived ZrO2 Precursors. J. Sol-Gel Sci. Technol. 1997, 8, 419–424. [Google Scholar] [CrossRef]
  36. Bokhimi, X.; Morales, A.; García-Ruiz, A.; Xiao, T.D.; Chen, H.; Strutt, P.R. Transformation of yttrium-doped hydrated zirconium into tetragonal and cubic nanocrystalline zirconia. J. Solid State Chem. 1999, 142, 409–418. [Google Scholar] [CrossRef]
  37. Phillippi, C.M.; Mazdiyasni, K.S. Infrared and Raman Spectra of Zirconia Polymorphs. J. Am. Ceram. Soc. 1971, 54, 254–258. [Google Scholar] [CrossRef]
  38. Gao, Y.; Masuda, Y.; Seo, W.S.; Ohta, H.; Koumoto, K. TiO2 nanoparticles prepared using an aqueous peroxotitanate solutions. Ceram. Int. 2004, 30, 1365–1368. [Google Scholar] [CrossRef]
  39. Chen, S.; Yin, Y.; Wang, D.; Liu, Y.; Wang, X. Structures, growth modes and spectroscopic properties of small zirconia clusters. J. Cryst. Growth 2005, 282, 498–505. [Google Scholar] [CrossRef]
  40. Navío, J.A.; Hidalgo, M.C.; Colón, G.; Botta, S.G.; Litter, M.I. Preparation and physicochemical properties of ZrO2 and Fe/ZrO2 Prepared by a sol-gel technique. Langmuir 2001, 17, 202–210. [Google Scholar] [CrossRef]
  41. Shukla, S.; Seal, S. Mechanisms of room temperature metastable tetragonal phase stabilisation in zirconia. Int. Mater. Rev. 2005, 50, 45–64. [Google Scholar] [CrossRef]
  42. Osendi, M.I.; Moya, J.S.; Serna, C.J.; Soria, J. Metastability of Tetragonal Zirconia Powders. J. Am. Ceram. Soc. 1985, 68, 135–139. [Google Scholar] [CrossRef]
  43. Badenes, J.A.; Vicent, J.B.; Llusar, M.; Tena, M.A.; Monros, G. The nature of Pr-ZrSiO4 yellow ceramic pigment. J. Mater. Sci. 2002, 37, 1413–1420. [Google Scholar] [CrossRef]
  44. Bermúdez-Reyes, B.; Contreras-García, M.; Almaral-Sánchez, J.; Espitia-Cabrera, I.; Espinoza-Beltrán, F. Chemical anchorage of hydroxyapatite on 316LSS using a ZrO2 interlayer for orthopedic prosthesis applications. Superf. Vacío 2012, 25, 150–156. [Google Scholar]
  45. Prakashbabu, D.; Krishna, R.H.; Nagabhushana, B.M.; Nagabhushana, H.; Shivakumara, C.; Chakradar, R.P.S.; Ramalingam, H.B.; Sharma, S.C.; Chandramohan, R. Low temperature synthesis of pure cubic ZrO2 nanopowder: Structural and luminescence studies. Spectrochim. Acta Part A Mol. Biomol. Spectrosc. 2014, 122, 216–222. [Google Scholar] [CrossRef]
  46. Selvam, N.C.S.; Manikandan, A.; Kennedy, L.J.; Vijaya, J.J. Comparative investigation of zirconium oxide (ZrO2) nano and microstructures for structural, optical and photocatalytic properties. J. Colloid Interface Sci. 2013, 389, 91–98. [Google Scholar] [CrossRef]
  47. Taguchi, M.; Takami, S.; Adschiri, T.; Nakane, T.; Sato, K.; Naka, T. Simple and rapid synthesis of ZrO2 nanoparticles from Zr(OEt)4 and Zr(OH)4 using a hydrothermal method. CrystEngComm 2012, 14, 2117–2123. [Google Scholar] [CrossRef]
  48. Li, C.; Li, M. UV Raman spectroscopic study on the phase transformation of ZrO2, Y2O3–ZrO2 and SO42−/ZrO2. J. Raman Spectrosc. 2002, 33, 301–308. [Google Scholar] [CrossRef]
  49. Thejaswini, T.V.L.; Prabhakaran, D.; Maheswari, M.A. Synthesis of mesoporous worm-like ZrO2–TiO2 monoliths and their photocatalytic applications towards organic dye degradation. J. Photochem. Photobiol. A Chem. 2017, 344, 212–222. [Google Scholar] [CrossRef]
  50. Bensaha, R.; Bensouyad, H. Synthesis, Characterisation and roperties of Zirconium oxide doped Titanium oxide thin films obtained via Sol-gel process. In Heat Treatment-Conventional and Novel Applications; Czerwinsk, F., Ed.; Intech open Sci./open mind: Rijeka, Croatia, 2012; pp. 207–234. [Google Scholar]
  51. Liu, A.; Liu, G.; Zhu, H.; Shin, B.C.; Fortunato, E.; Martins, R.; Shan, F. Hole mobility modulation of solution-processed nickel oxide thin-film transistor based on high-k dielectric. Appl. Phys. Lett. 2016, 108, 233506. [Google Scholar] [CrossRef]
  52. Yoo, D.; Kim, I.; Kim, S.; Hahn, C.H.; Lee, C.; Cho, S. Effects of annealing temperature and method on structural and optical properties of TiO2 films prepared by RF magnetron sputtering at room temperatura. Appl. Surf. Sci. 2007, 253, 3888–3892. [Google Scholar] [CrossRef]
  53. Zhu, C.; Liu, A.; Liu, G.; Jiang, G.; Meng, Y.; Fortunato, E.; Martins, R.; Shan, F. Low- temperature, nontoxic water-induced high-k zirconium oxide dielectrics for low-voltage, high-performance oxide thin-film transistors. J. Mater. Chem. C 2016, 4, 10715–10721. [Google Scholar] [CrossRef]
  54. Gao, Y.; Masuda, Y.; Ohta, H.; Koumoto, K. Room-temperature preparation of ZrO2 precursor thin in an aqueous peroxozirconium-complex solution. Chem. Mater. 2004, 16, 2615–2622. [Google Scholar] [CrossRef]
  55. Liu, M.; Fang, Q.; He, G.; Li, L.; Zhu, L.Q.; Li, G.H.; Zhang, L.D. Effect of post deposition annealing on the optical properties of HfOxNy films. Appl. Phys. Lett. 2006, 88, 192904. [Google Scholar] [CrossRef]
  56. Cao, H.Q.; Qiu, X.Q.; Luo, B.; Liang, Y.; Zhung, Y.H.; Tan, R.Q.; Zhao, M.J.; Zhu, Q.M. Synthesis and room-temperature ultraviolet photoluminescence properties of zirconia nanowires. Adv. Funct. Mater. 2004, 14, 243–246. [Google Scholar] [CrossRef]
  57. Emelie, A.; Kataeva, G.V.; Litke, A.S.; Rudakova, A.V.; Ryabchuk, V.K.; Serpone, N.J. Spectroscopic and photoluminescence studies of a wide band gap insulating Material: Powdered and colloidal ZrO2 sols. Langmuir 1998, 14, 5011–5022. [Google Scholar] [CrossRef]
  58. Kumari, L.; Li, W.Z.; Xu, J.M.; Leblanc, R.M.; Wang, D.Z.; Li, Y.; Guo, H.; Zhang, J. Controlled hydrothermal synthesis of zirconium oxide nanostructures and their optical properties. Cryst. Growth Des. 2009, 9, 3874–3880. [Google Scholar] [CrossRef]
  59. Kumar, C.S.S.R. Nanomaterials-toxicity, Health and Environmental Issues; Wiley- VCH: Weinhein, Germany, 2006. [Google Scholar]
  60. An, M.; Li, L.; Zhang, J.; Zhao, L.; Yang, C. Three-dimensional ordered hollow sphere composite Pt/TiO2-ZrO2: Enhanced performance of photocatalytic degradation and photocatalytic hydrogen evolution. J. Nanoparticles Res. 2019, 21, 117. [Google Scholar] [CrossRef]
  61. Kumaresan, M.; Anand, K.V.; Govindaraju, K.; Tamilselvan, S.; Kumar, V.G. Seaweed Sargassum wightii mediated preparation of zirconia (ZrO2) nanoparticles and their antibacterial activity against gram positive and gram negative bacteria. Microb. Pathog. 2018, 124, 311–315. [Google Scholar] [CrossRef]
  62. Chauhan, V.; Kumar, R. Dense electronic excitation induced modifications in nanocrystalline zirconium oxide thin films: Detailed analysis of optical and surface topographical. Opt. Mater. 2019, 89, 576–590. [Google Scholar] [CrossRef]
  63. Carević, M.V.; Abazović, N.D.; Savić, T.D.; Novaković, T.B.; Pjević, D.J.; Čomor, M.I. Binary oxide ceramics for enhanced phenols degradation under simulated solar light. J. Am. Ceram. Soc. 2018, 101, 1420–1431. [Google Scholar] [CrossRef]
  64. Vaizoğullar, A.I. ZnO/ZrO2 composites: Synthesis characterization and photocatalytic performance in the degradation of oxytetracycline antibiotic. Mater. Technol. 2019, 34, 433–443. [Google Scholar] [CrossRef]
  65. Smits, K.; Grigorjeva, L.; Millers, D.; Sarakovskis, A.; Grabis, J.; Lojkowski, W. Intrinsic defect related luminescence in ZrO2. J. Lumin. 2011, 131, 2058–2062. [Google Scholar] [CrossRef]
  66. Prakashbabu, D.; Krishna, R.H.; Nagabhushana, B.M.; Nagabhushana, H.; Shivakumara, C.; Ramalingam, H.B.; Chandramohan, R. Influence of Precursors on Photoluminescence of Hydrothermally Derived ZrO2. J. Chem. Eng. Res. 2014, 2, 105–111. [Google Scholar]
  67. Singh, A.K.; Viswanath, V.; Janu, V.C. Synthesis, effect of capping agents, structural, optical and photoluminescence properties of ZnO nanoparticles. J. Lumin. 2009, 29, 874–878. [Google Scholar] [CrossRef]
  68. Liang, J.; Deng, Z.; Jiang, X.; Li, F.; Li, Y. Photoluminescence of tetragonal ZrO2 nanoparticles synthesized by microwave irradiation. Inorg. Chem. 2002, 41, 3602–3604. [Google Scholar] [CrossRef]
  69. Cong, Y.; Li, B.; Lei, B.; Li, W. Long lasting phosphorescent properties of Ti doped ZrO2. J. Lumin. 2007, 126, 822–826. [Google Scholar] [CrossRef]
  70. Pattanaik, S.; Martha, S.; Sharma, M.K.; Pradhan, S.K.; Sakthivel, R.; Chatterjee, R.; Mishra, D.K. Enhancement of room temperature ferromagnetism in nanocrystalline Zr1-xMnxO2 by the suppression of monoclinic structure of zirconia. J. Magn. Magn. Mater. 2020, 494, 165758. [Google Scholar] [CrossRef]
  71. Wang, Z.; Yang, B.; Fu, Z.; Dong, W.; Yang, Y.; Liu, W. UV–blue photoluminescence from ZrO2 nanopowders prepared via glycine nitrate process. Appl. Phys. A 2005, 81, 691–694. [Google Scholar] [CrossRef]
  72. Huang, M.H.; Wu, Y.; Feick, H.; Tran, N.; Weber, E.; Yang, P. Catalytic Growth of Zinc Oxide Nanowires by Vapor Transport. Adv. Mater. 2001, 13, 113–116. [Google Scholar] [CrossRef]
  73. Mansilla, Y.; Arce, M.; Gonzalez-Oliver, C.; Troiani, H.; Serquis, A. Synthesis and characterization of ZrO2 and YSZ thin films. Mater. Today Proc. 2019, 14, 92–95. [Google Scholar] [CrossRef]
  74. Zhang, Y.; Jin, S.; Yang, Y.; Liao, C.; Yan, C. Annealing effects on the phase and microstructure transformations of nanocrystalline (ZrO2)1-x(Sc2O3)x(x = 0.02–0.16) thin films deposited by sol-gel method. Solid State Commun. 2002, 122, 439–444. [Google Scholar] [CrossRef]
  75. Martin, N.; Rousselot, C.; Rondot, D.; Palmino, F.; Mercier, R. Microstructure modification of amorphous titanium oxide thin films during annealing treatment. Thin Solid Films 1997, 300, 113–121. [Google Scholar] [CrossRef]
  76. Takahashi, T.; Nakabayashi, H.; Terasawa, T.; Masugata, K. Atomic force microscopy observation of TiO2 films deposited by dc reactive sputtering. J. Vac. Sci. Technol. A 2002, 20, 1205–1209. [Google Scholar] [CrossRef]
  77. Song, J.W.; Zeng, D.L.; Fan, L.W. Temperature dependence of contact angles of water on a stainless steel surface at elevated temperatures and pressures: In situ characterization and thermodynamic analysis. J. Colloid Interface Sci. 2020, 561, 870–880. [Google Scholar] [CrossRef]
  78. Yang, M.W.; Lin, S.Y. A method for correcting the contact angle from the θ/2 method. Colloids Surf. A Physicochem. Eng. Asp. 2003, 220, 199–210. [Google Scholar] [CrossRef]
  79. Stalder, A.F.; Melchior, T.; Müller, M.; Sage, D.; Blu, T.; Unser, M. Low-bond axisymmetric drop shape analysis for surface tension and contact angle measurements of sessile drops. Colloids Surf. A Physicochem. Eng. Asp. 2010, 364, 72–81. [Google Scholar] [CrossRef] [Green Version]
  80. Law, K.Y.; Zhao, H. Surface Wetting Characterization, Contact Angle, and Fundamentals; Springer: Berlin/Heidelberg, Germany, 2015; ISBN 978-3-319-25212-4. [Google Scholar]
  81. Kong, X.; Hu, Y.; Wang, X.; Pan, W. Effect of surface morphology on wettability conversión. J. Adv. Ceram. 2016, 5, 284–290. [Google Scholar] [CrossRef] [Green Version]
  82. Salari, S.; Ghodsi, F.E. Novel superhydrophilic and hydrophobic nanostructured agar-like zirconia thin films: Manipulating of morphology with PEG/CTAB. J. Mater. Sci. 2018, 53, 11986–12004. [Google Scholar] [CrossRef]
  83. Hiley, I.; Fisher, J.M.; Thompsett, D.; Kashtiban, R.J.; Sloan, J.; Walton, R.I. Incorporation of square-planar Pd2+ in fluorite CeO2: Hydrothermal preparation, local structure, redox properties and stability. J. Mater. Chem. A 2015, 3, 13072–13079. [Google Scholar] [CrossRef] [Green Version]
Figure 1. X-ray diffraction (XRD) patterns of Zirconium oxide (ZrO2) thin films annealed at different temperatures (a) 250 °C, (b) 350 °C, (c) 450 °C, and (d) 550 °C. (e) At the bottom, the standard JCPDS card data for tetragonal ZrO2 are provided as references (PDF #50-1089).
Crystals 10 00454 g001
Figure 2. Fourier transform infrared (FT-IR) spectra of ZrO2 samples after annealing at different temperatures.
Crystals 10 00454 g002
Figure 3. (a) Transmittance spectrum of ZrO2 thin films at different annealing temperature. (b–e) Band gap was determined by optical method using (αhν)2 versus hν plots.
Crystals 10 00454 g003
Figure 4. Photoluminescence (PL) spectra of ZrO2 thin films measured at different annealing temperature.
Crystals 10 00454 g004
Figure 5. Scanning electron microscopy (SEM) images of ZrO2 thin films at different temperatures of annealing: (a) 250 °C (b) 350 °C, (c) 450 °C, and (d) 550 °C. In the images, the white bars at the bottom indicate 100 nm.
Crystals 10 00454 g005
Figure 6. Three-dimensional atomic force microscopy (AFM) images of ZrO2 thin films of annealed at different temperatures: (a) 250 °C, (c) 350 °C, (e) 450 °C, and (g) 550 °C. Roughness was taken over areas of 2 μm × 2 μm of the coatings at (b) 250 °C, (d) 350 °C, (f) 450 °C, and (h) 550 °C. (i) Thicknes versus annealing temperatures (Ta), the upper inset shows the mean roughness (MR) and the root mean square roughness (RMSR) vs. Ta. Lower inset shows MR and RMSR in percent values vs. Ta.
Crystals 10 00454 g006aCrystals 10 00454 g006b
Figure 7. (a–e) Contact Angle of ZrO2 thin films at different annealing temperatures (Ta).
Crystals 10 00454 g007
Figure 8. Schematic diagram of the tetragonal (111) surface of ZrO2 for hydrophobic (a) and hydrophilic (b) properties of the material. Dot lines represent the two dipoles obtained from the two H+ with O2+ in the H2O molecule.
Crystals 10 00454 g008

