1. Introduction
The benefit of tunable filters in communication systems also applies to satellite communications, and especially also to the payload on the satellite itself. Typically, such a payload contains numerous RF filters operating mostly in frequency ranges from the L-band (1–2 GHz) to the Ka-band (26–40 GHz) [
1] and dealing with signal strengths from low-RF power levels (in the order of mW) up to power levels as high as 100 W (as needed to transfer the signal back from the satellite to an earth-based receiver). Depending on those exact needs, various filter technologies have developed over the last decades and are routinely manufactured and employed in satellite missions [
2]. It is noted that although concepts for tunable filters in various technologies have been developed and presented, untunable filters are still state-of-the-art for satellite communication. Obstacles for the introduction of tunable filters are:
The lifetime of a geostationary communications satellite is typically fifteen years, and a new technology will only be considered if sufficient confidence has been gained that it will remain functional over this period of time.
The application on a satellite is in a harsh environment with respect to, for example, mechanical robustness, thermal environment, radiation, or electromagnetic compatibility, which further strengthens the need for thorough design and testing phases beforehand.
In order to operate a tunable filter, some kind of control electronics is needed. This control electronics draws power from the satellite power supply and translates received telecommands into signals that set the tunable filter to the desired state. Although such kind of electronics is routinely used for various applications on the satellite and its design therefore does not present fundamental hurdles, it considerably adds complexity to the switchable filter system in terms of reliability, power consumption, thermal design, and telemetry/telecommand transfer to and from an earth-based operator
Filters based on liquid crystal technology can be operated by static electrical fields, and hence, they consume little power, which is advantageous for satellite applications. Another remarkable aspect is that RF losses are relatively low, especially for higher frequencies. Further, liquid crystal devices do not rely on the mechanical movement of parts, which is a natural advantage in satellite application.
The application of liquid crystal technology to filters is based on pioneering work on high birefringence liquid crystals [
3] and its use in mmW phase shifters [
4,
5]. This article describes work that was done on a tunable filter operating at 20 GHz (Ka-band downlink), which is a frequency range that is widely used in satellite communications. The filter has a fixed bandwidth and can be tuned in center frequency.
The application of a liquid crystal device on a satellite presents another challenge, which is the liquid crystal itself. Being a liquid, it must be absolutely assured that it always remains in its assigned container. If this container showed leakage and liquid crystal could penetrate to the outside, it would not only degrade the function of the tunable filter itself (which would still be a failure confined to a specific part of the communication systems), but it could even harm other units of the satellite itself, such as the solar panels. Therefore, much emphasis is devoted to the container.
Work on the filter has been ongoing for many years, and design aspects have been published before [
6]. Some relevant details are replicated here, in order to set a base for the description of new work in
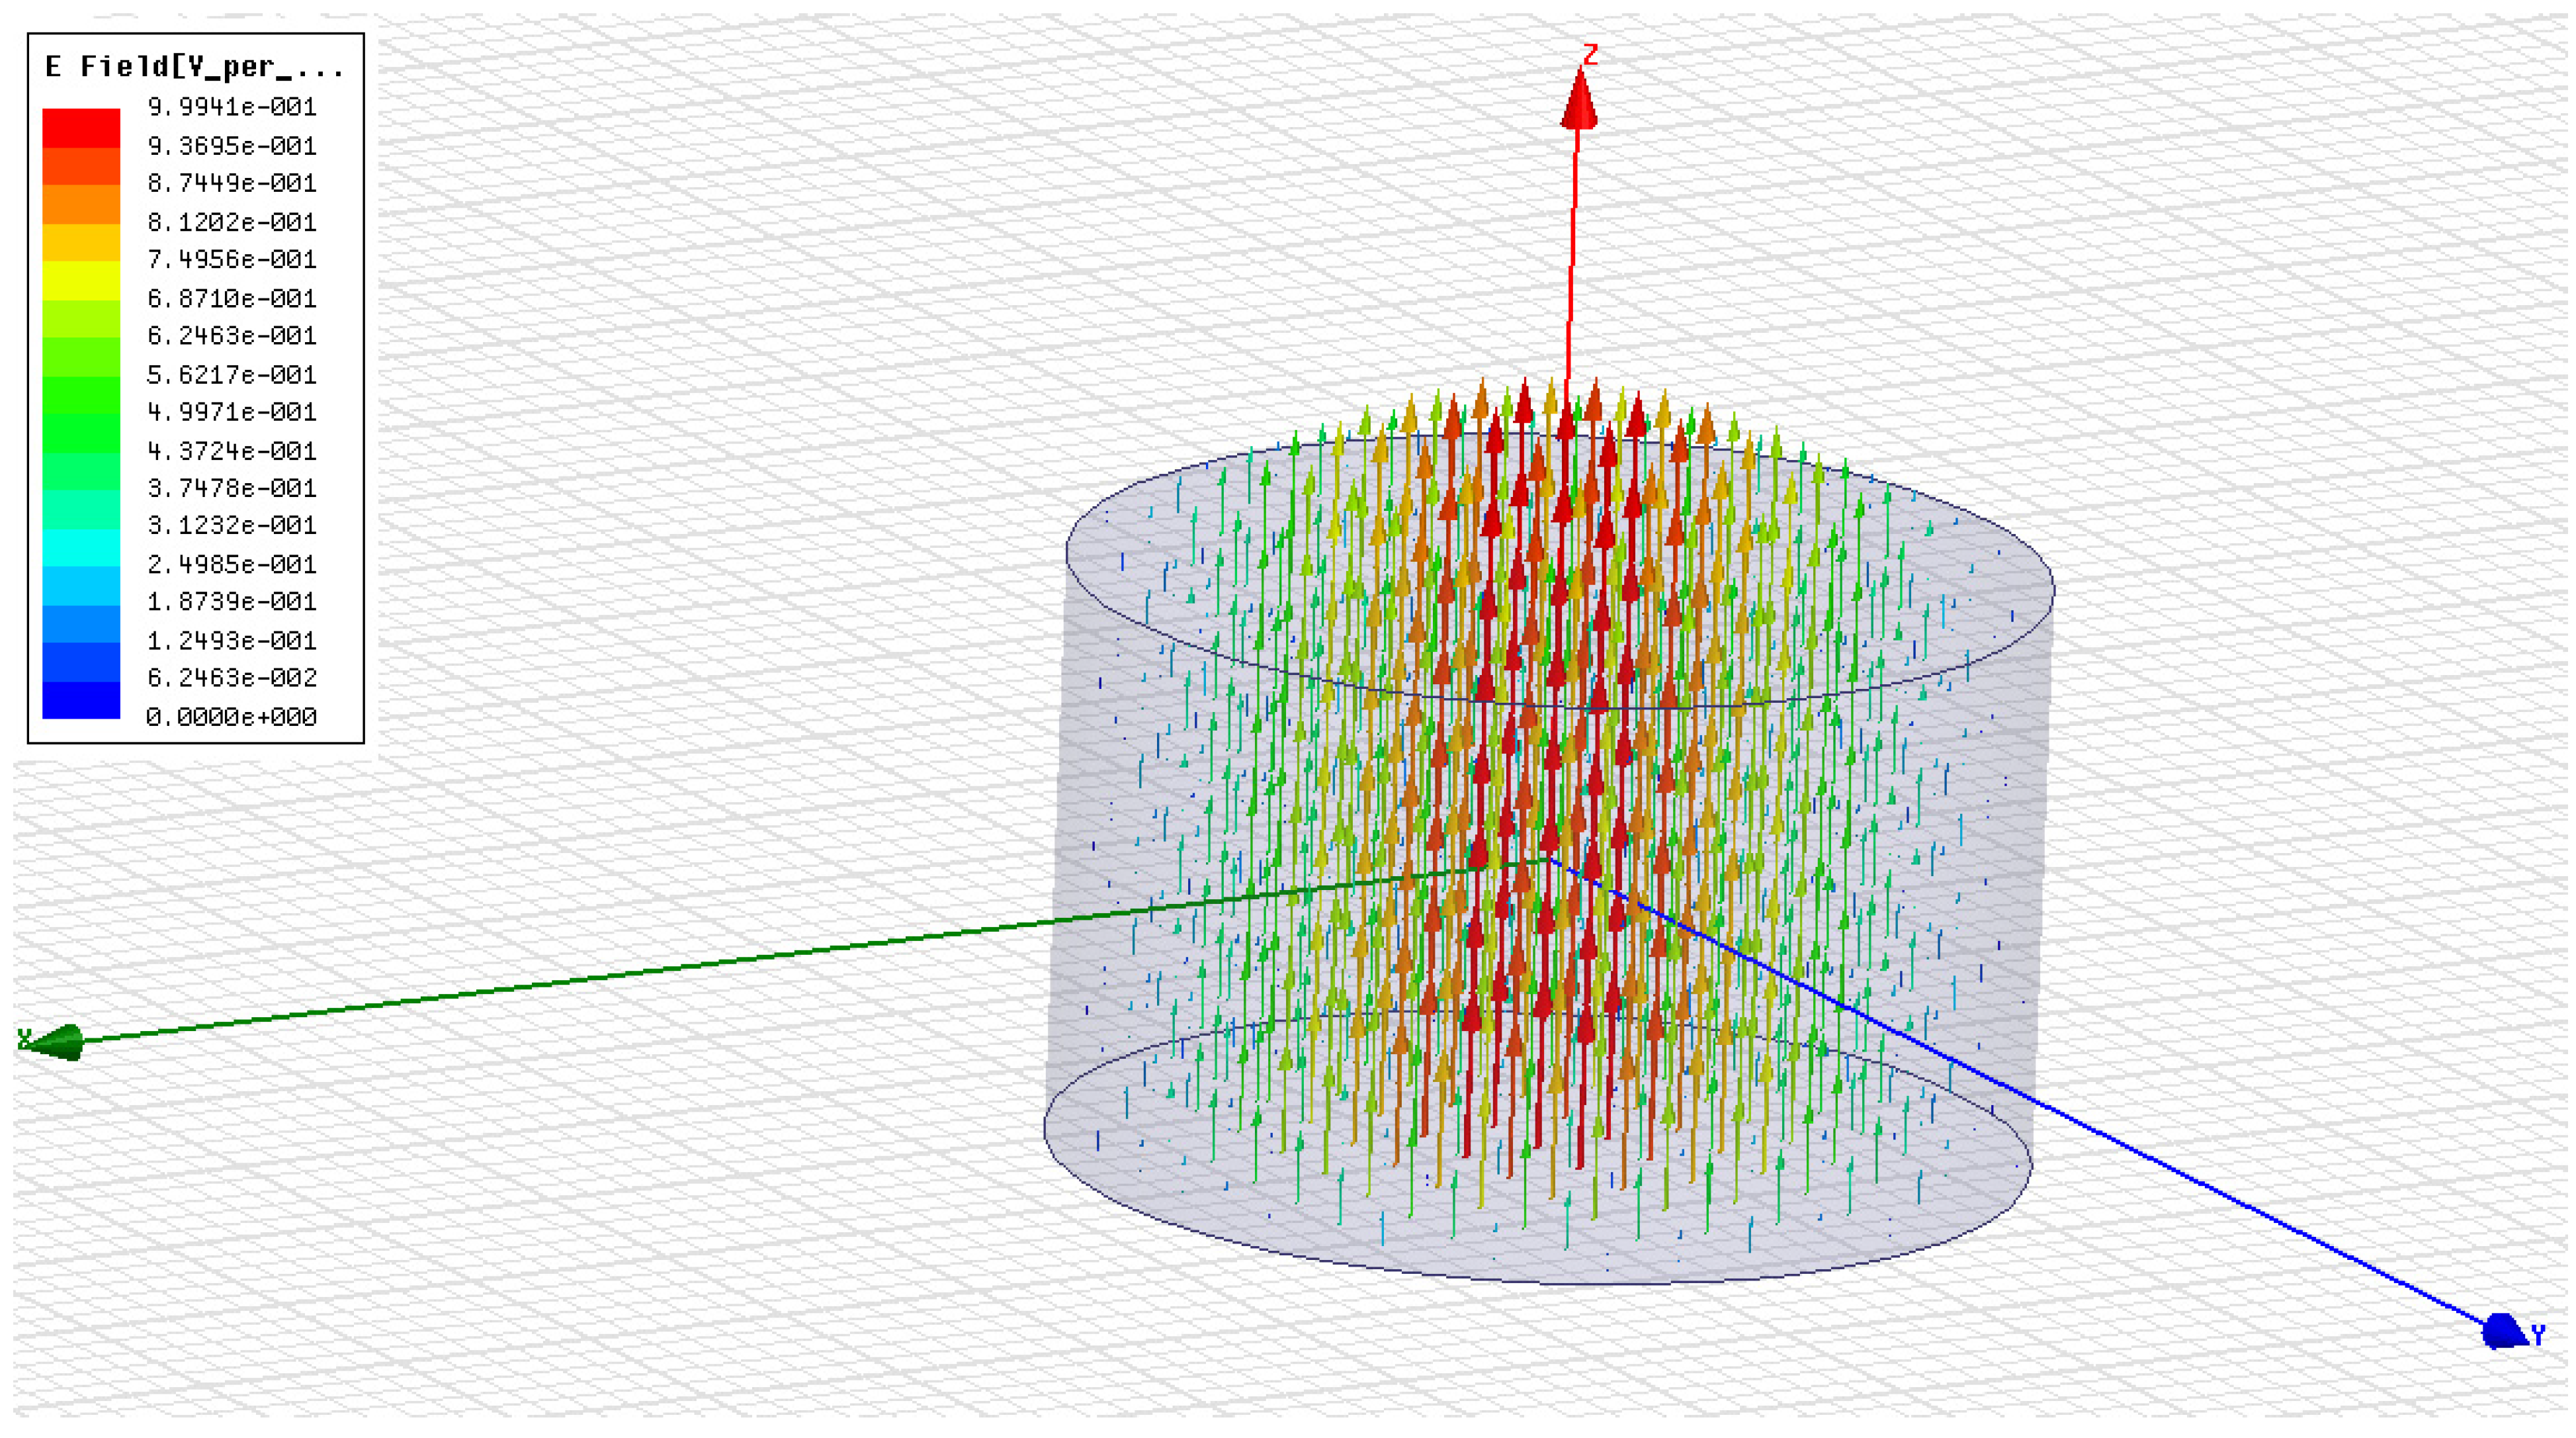
Section 2. The filter is based on the TM010 mode, which allows the favorable introduction of the liquid crystal container and of the biasing electrodes. Conventional tuning screws can be inserted as needed to overcome manufacturing tolerances and deficiencies in simulation. Further, this geometry allows the coupling between adjacent resonators as needed for a multi-pole filter. Other resonator modes may be found that are equally suitable for this purpose. The geometry and distribution of the electrical field inside the circular shaped resonator are shown in
Figure 1. The field pattern was calculated by means of the software tool Ansys HFSS (Ansys, Electromagnetics Suite 15.0, Canonsburg, USA), which performs full-wave simulation by employing a finite-element approach. The electrical field is oriented from the bottom to the top, with its maximum in the center and vanishing field along the lateral housing wall.
A photograph of a practical realization of this resonator is shown in
Figure 2. With respect to
Figure 1, the z-axis is now oriented towards the observer. The resonator cavity is milled out of aluminum, which is silver-plated to improve RF loss performance. The upper enclosure of the resonator is a planar lid (also made of silver-plated aluminum), screwed onto the resonator housing using four screws. The liquid crystal container is reaching into the cavity from the right side. Thus, the liquid crystal material is placed in the center of the cavity, where the highest electrical field is present and hence, the maximum tuning effect can be achieved. The liquid crystal container penetrates the cavity through a hole in the lateral wall. This hole can be regarded as a circular waveguide, and since its diameter is much smaller than the wavelength in the Ka-band, it can be understood that the flow of RF energy through this hole can be easily controlled by its length. At the bottom of the cavity, partly hidden by the upper edge of the lateral wall in
Figure 2, a coaxial connector is entering the resonator. It is used to determine the resonance frequency of the resonator by measurement.
The liquid crystal container is made from Rexolite. This material is a cross-linked polystyrene and has favorable properties for the current application, namely low RF losses, low dielectric constant (as not to dominate the resonant frequency), it can be machined easily, and further, it is commonly used in space applications [
7].
The resonator cavity inside the metal housing has a diameter of 15.5 mm and a height of 3.8 mm. With a liquid crystal container having a diameter of the liquid crystal volume of 1.5 mm, the resonance frequency was tuned from 18,707 MHz to 18,836 MHz, by changing the orientation of the liquid crystal with external permanent magnets.
2. Materials and Methods
2.1. Liquid Crystal
The filter is tuned by changes in the effective permittivity of a liquid crystal volume inside the resonator.
Liquid Crystals (LC) are a functional material, which is well known for its application in LC displays (LCD). In display applications, the anisotropic material is used in a controllable light valve, which regulates the color filtered backlight of thousands of individual addressable pixels and therefore creates a visible image on the screen.
In the nematic phase, LC shows both properties of a liquid as well as a crystal: The material is liquid, but the molecules show a certain orientation. This orientation can be influenced by special surface treatment or by an external electrical field. Due to their anisotropy, the LC molecules tend to align along electrical field lines.
The anisotropic LC properties are also used at microwave frequencies, where two different permittivities along and perpendicular to the molecule axis can be observed. By changing the molecule orientation in an LC layer or volume, it can be used as a material with tunable effective permittivity.
Figure 3 shows an example of a simple liquid crystal molecule.
The liquid crystal mixture was specifically developed for this particular filter application. The properties of the LC mixture are listed in
Table 1.
The wide temperature range of the filter requires a high clearing point of the LC mixture. The clearing point represents an upper limit of the nematic phase range, and therefore, the maximum temperature where the LC has anisotropic properties and can be used as a functional material. The microwave permittivity anisotropy () determines the tuning range of the filter. The loss tangent, measures the dielectric absorption of the LC mixture in both molecule orientations and has an impact on the insertion loss of the filter. The low-frequency dielectric anisotropy is important in designing the static electrical field used for orienting the liquid crystal volume. The rotational viscosity has an impact on the tuning speed of the filter—a higher rotational viscosity means a slower tuning speed. Rotational viscosity of the presented mixture is relatively high compared to standard LC display mixtures; however, a fast tuning speed is not very important for the given filter application. Therefore, a trade-off was made in favor of good microwave properties.
2.2. Thermomechanics of the Liquid Crystal Container
The liquid crystal container has two major purposes. First, it must position the liquid crystal in the right place of the resonator, in which the RF electromagnetic field is maximum. Second, it must ensure that the liquid crystal remains in that place at all times and especially that it never penetrates through the container walls to the outside. The latter task presents a considerable challenge, because “at all times” includes an applicable temperature range which is typically −35 °C/+85 °C for a satellite. The liquid crystal mixture is incompressible and shows significant volume expansion over temperature, therefore a container consisting of rigid walls and being completely filled with liquid crystal would unavoidably burst even in a much smaller temperature range.
To overcome a potential burst of the liquid crystal container, a solution is presented in Reference [
6]. It consists of a flexible metallic bellow, which is mounted to the liquid crystal container on the container end outside of the RF cavity. Although such a solution has been shown to be feasible, significant hurdles must be overcome:
The variation of the volume of the liquid crystal over temperature is compensated by movement of the bellow. The bellow acts as a spring, with a force increasing with movement of the bellow. This force corresponds to a pressure increase in the liquid crystal volume. Pressures encountered in this application are significant (exceeding 5 bar). Also, thermal stress in the associated container and bellow materials build up.
The container material is rexolite, while the bellow is metallic. Hence, the connection between rexolite and bellow is not between similar partners, and therefore it is challenging by nature due to the difference in thermal expansion presenting stress to the connecting mechanism.
Especially for the application on satellites, considerable effort is needed to proof integrity of this design over its lifetime, and to verify running production. Therefore, an improved solution was developed by introducing a gas bubble into the container making the bellow obsolete. It must be ensured that this gas bubble always remains in the part of the container outside the RF cavity. Since gas is much more compressible than a bellow, much lower pressure is building up over temperature. The container consists of similar materials only, facilitating the connection between the container parts. A simulation of the internal container pressure over temperature was performed (
Figure 4), and the pressure increase building up due to temperature is now reduced to a few 100 mbar.
In this simulation, the internal container pressure change over temperature is calculated analytically for a container with a degree of filling of 50% (remaining volume being filled with the air bubble). For the filling process, typical laboratory conditions are considered with an environmental temperature of 23 °C and 50% relative humidity. The liquid crystal is assumed as incompressible fluid and the stiffness of the container walls as ideal in the pressure range investigated. The stored air is modeled as mixture of ideal gas, taking into account the saturation of water vapor.
2.3. Configuration of Biasing Circuit
The biasing circuit must supply a static electrical field, which can be oriented in the relevant directions. In one extreme, it must be in parallel to the electrical RF field, with reference to
Figure 1 and
Figure 2, this is in the z-axis. In the other extreme, it must be at 90° to the first direction, which is (with reference to
Figure 2) in the x-y-plane.
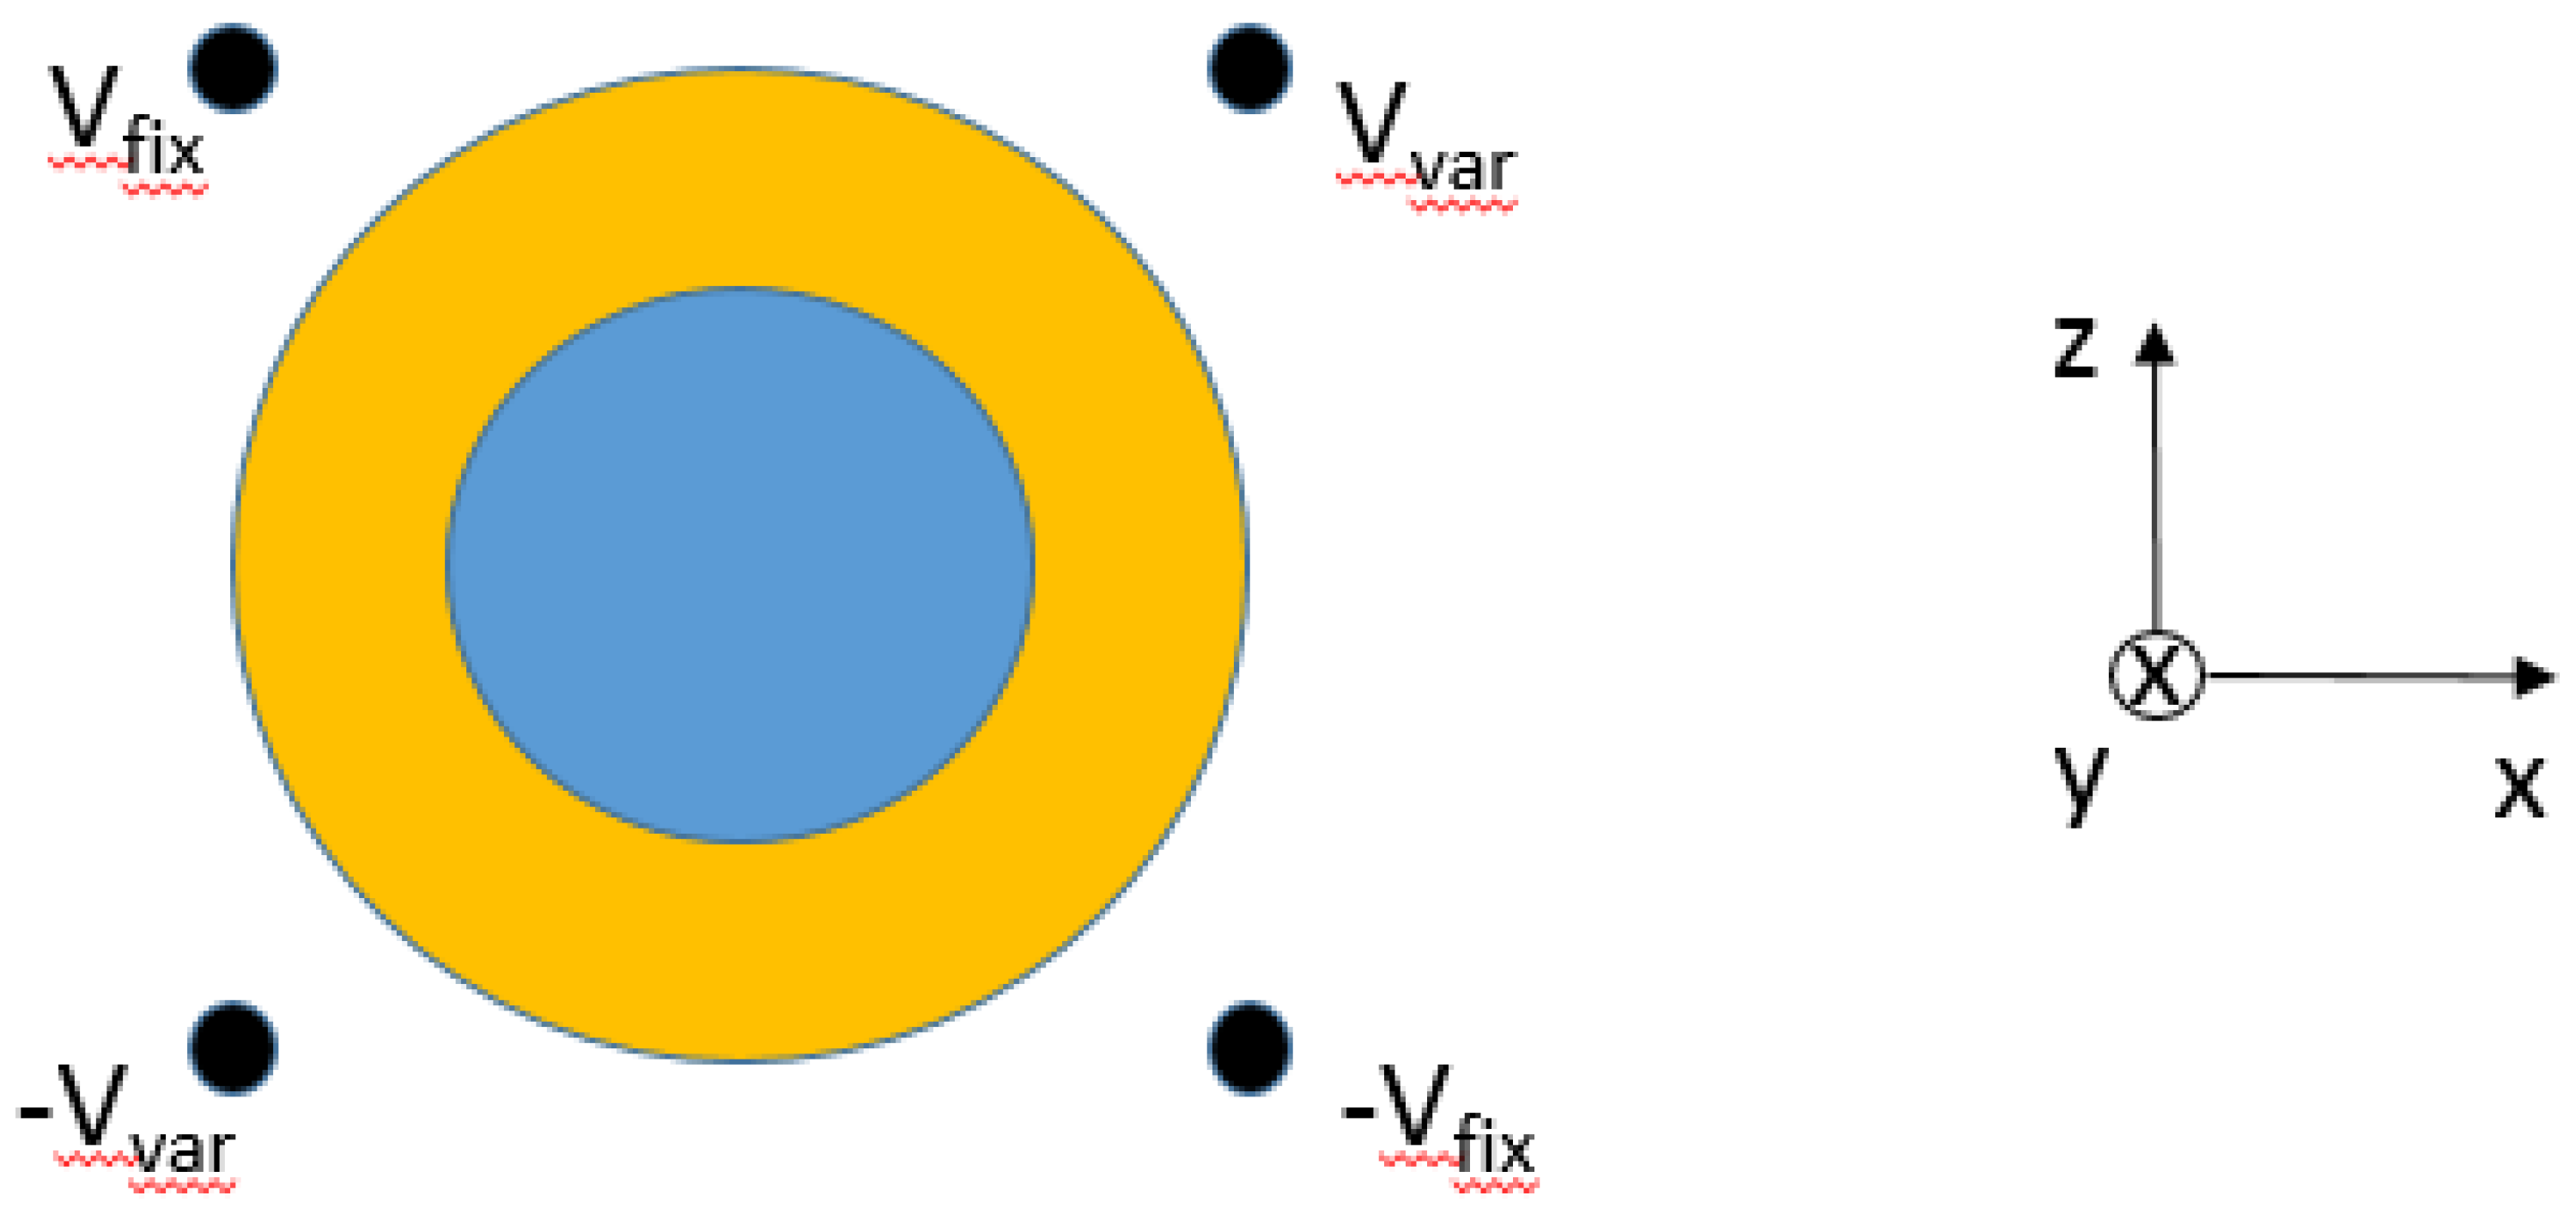
The biasing circuit for a resonator consists of four electrodes, which run in parallel to the container and which are arranged around the container, as shown in
Figure 5.
A similar four-electrode configuration has been reported in Reference [
8]. One electrode is set to a fixed voltage, V
fix (with reference to the resonator housing), and the opposite electrode is set to the same value but with opposite polarity: −V
fix (upper left and lower right in
Figure 5). For the remaining pair of opposite electrodes, one electrode is set to a variable voltage, V
var, and the opposite electrode to the same voltage but with opposite polarity: −V
var. When the variable voltage, V
var, is varied between −V
fix and +V
fix, then the resulting vector of the static electrical field in the center of the liquid crystal container can be adjusted within the full range of being in parallel to the electrical RF field until being perpendicular to the electrical RF field (corresponding to the x and z direction in
Figure 4).
For the filter discussed in this article, the voltage Vfix is chosen to be 60 V. An increase/decrease of the voltage results in an increase/decrease of the switching speed, but with the same center frequency being reached. However, a decrease in this voltage of more than about 5 Vfix will additionally result in a smaller frequency range that can be reached by the resonator. With Vfix being set, the variable voltage, Vvar, can be regarded as a representative for the center frequency of the resonator.
Some further points in the design of the biasing circuit deserve attention:
The electrodes necessarily consist of conducting material, and they are exposed to the RF electromagnetic field. The field induces RF current on the electrodes, which is subject to Ohmic losses, which in turn increases the resonator loss. To limit this undesired effect, the electrodes must be designed as small as possible, having a surface with low Ohmic losses (low surface roughness, plated with a good conductor such as silver, thickness exceeding skin depth). The RF losses can be further lowered by using a well-chosen glue in the right amount for the mounting of the electrodes.
The electrodes will exhibit RF eigenmodes for themselves. In order not to disturb the resonator or filter function, these eigenmodes must be shifted sufficiently away from the filter passband. In the current filter design, the eigenmodes are more than 5 GHz away from the filter passband.
The electrodes, and especially where they penetrate into the RF cavity of the resonator, are a potential source of EMC leakage. RF energy fed into the filter will to some amount leak to the outside via the biasing electrodes—this amount must be minimized. On the other hand, the environment on a satellite can comprise stray electromagnetic fields within a broad frequency range from 0 to 30 GHz. The amount of those signals that penetrate into the filter via the electrodes and couple into the RF path must also be minimized. The DC harness that delivers the biasing voltage to the electrodes can act as an antenna and enhance these undesired effects. In order to meet the requirement, the following measures have been taken:
Where the electrode penetrates the RF cavity wall, a capacitor to ground is introduced, acting as a lowpass filter,
Those wires of the harness belonging to opposite electrodes (hence carrying signal with opposite voltage) are twisted,
There is shielding around the harness which is connected to the housing wall.
It is an advantage of liquid crystal technology that due to its relatively low switching speed (in the order of minutes), it is not sensitive to faster time-varying disturbances overlayed to the command voltages. Such voltages can arise from the command electronics and can be difficult to control.
2.4. Filter Design
A 3-pole filter was designed, based on the resonator configuration above. A three-dimensional (3D) view is shown in
Figure 6. Note the orientation of the x-, y-, and z-axis, which is consistent to previous figures.
The resonator shape in the x-y-plane has evolved from a round shape (
Figure 1 or
Figure 2) to a rectangular shape with rounded corners, in order to allow for mounting of the biasing electrodes. The input and output ports are realized in waveguide technology. The individual resonators are coupled by irises either to the waveguide run or the adjacent resonator. Conventional tuning screws are foreseen for each resonator and for each iris.
2.5. Filter Tuning and Temperature Compensation
The first step is to set a baseline performance by means of the tuning screws. Such a tuning step is also common for conventional untunable filters, where manufacturing tolerances and imperfect predictions of the simulation software must be overcome. For the liquid crystal filter, in addition, both aspects are magnified by the presence of the biasing electrodes. When establishing this baseline performance, the liquid crystal is in a defined state, meaning that the fixed voltage, V
fix, of 60 V is applied, and the varying voltage, V
var, for each resonator has a defined value. Once the baseline performance is set, the conventional tuning screws are no longer operated. Measurement results are shown in
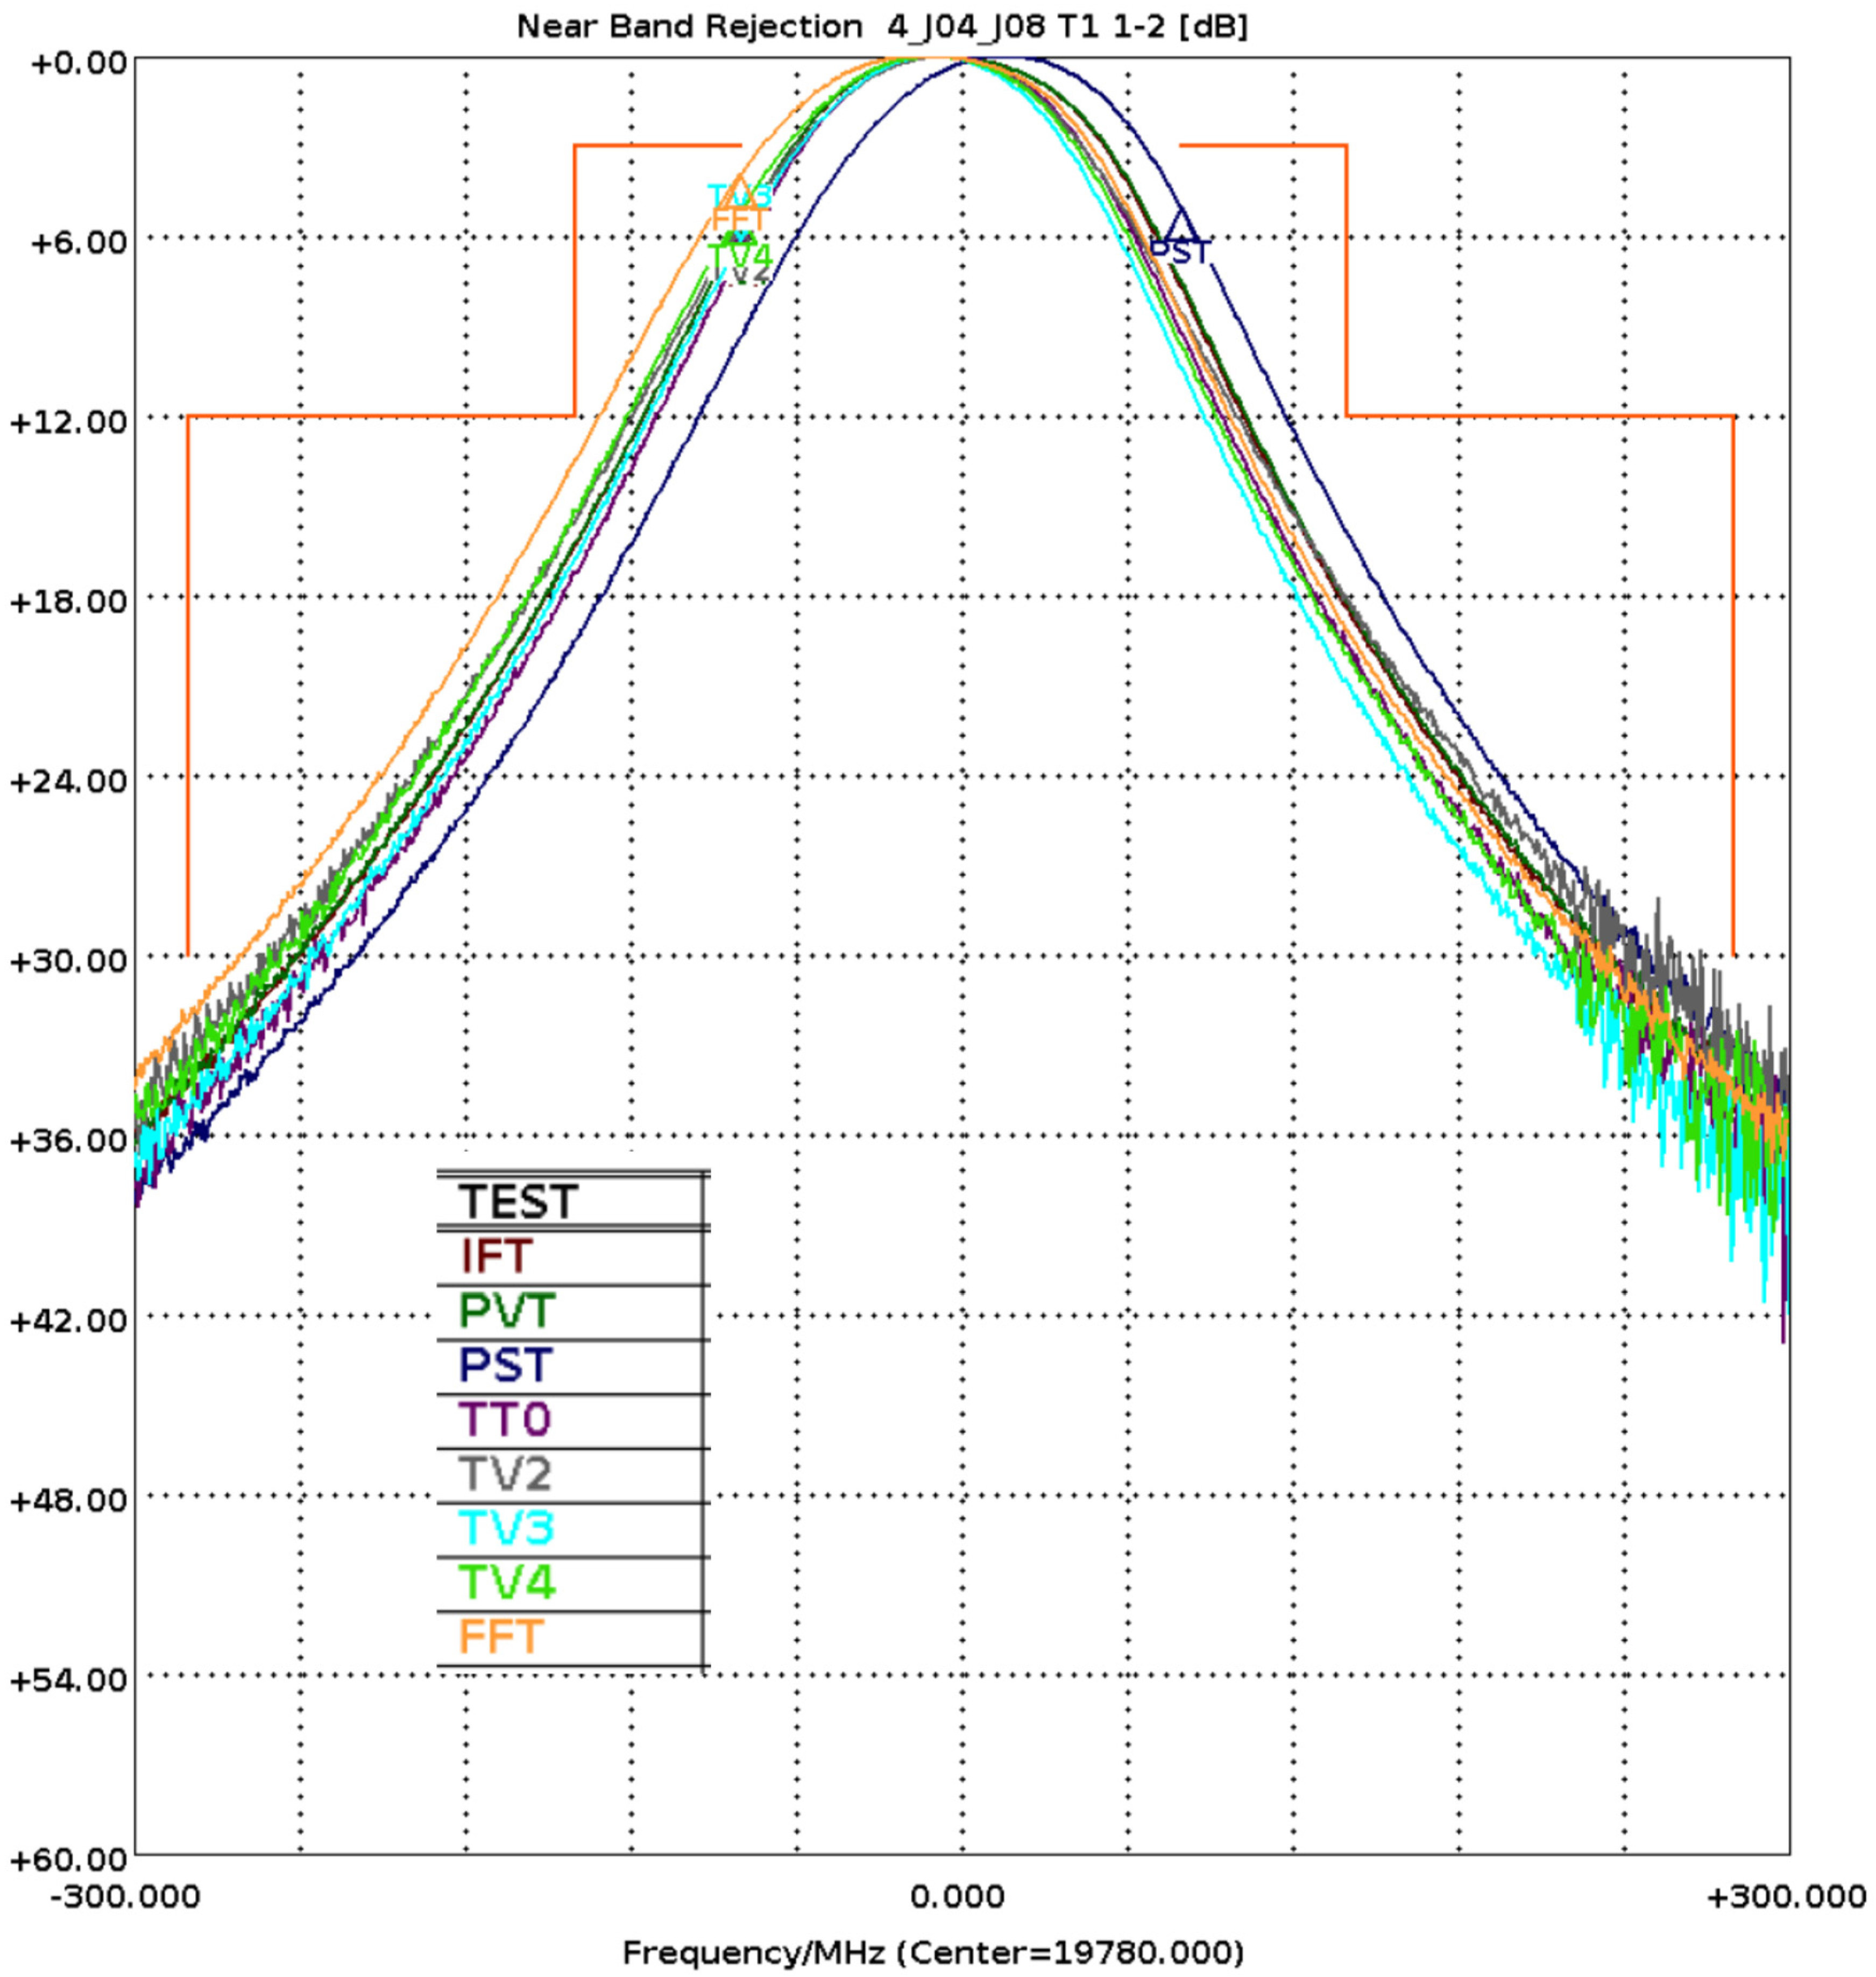
Figure 7 (measured at room temperature).
The initial version of the filter is plotted in green color (dotted). At the center frequency of 19,780 MHz, the filter has an insertion loss of 16.1 dB. The insertion loss was improved by optimizing the bias electrodes according to the points mentioned in
Section 2.3. The improved filter properties are plotted in blue color (dashed), the insertion loss at center frequency has been improved to 10.3 dB. In both filter versions, all dimensions (including those of the liquid crystal container) are identical, and the liquid crystal mixture is from the same manufacturing batch. All following measurement results have been obtained with the first filter version (shown in green).
In a next step, the tuning range of the liquid crystal mixture is explored. For this filter, a tuning range of 190 MHz is achieved by changing the orientation of the liquid crystal with the static electrical field created by the biasing electrodes. The insertion loss at filter center frequency is 1.9 dB less for the lower accessible center frequency compared to the upper center frequency. This range is achieved by varying the variable biasing voltage, V
var, from −60 V to +60 V (
Section 2.3). When the filter is tuned in this way, always wait for at least 90 minutes after the biasing voltage, V
var, is set to a different value until the new frequency is evaluated. The same waiting time was also applied for all measurements shown later at varying temperature (within the applicable temperature range of –10 °C to +65 °C). For tuning at temperatures towards the lower end of the temperature range, this waiting time is needed, while for temperatures towards the higher temperature end, a shorter waiting time would have been sufficient. However, tuning time is not an issue in the application envisaged, and no effort was made to reduce this waiting time.
In yet another step, the filter is measured with fixed biasing voltages applied, but varying temperature. There is a drift of filter center frequency over temperature due to thermal expansion of the materials involved, and due to a change of dielectric constant (of the liquid crystal) over temperature. Within a temperature range of −10 °C to +65 °C, a drift of center frequency of approximately 40 MHz is observed (lower frequency at higher temperature). On the other hand, in the application on a satellite, a filter must operate within a certain temperature range (−10 °C to +65 °C is a typical range) and must exhibit the same operating frequency at any temperature.
2.6. Control Electronics
The control electronics is powered by the satellite bus. The major task is to control and operate the tunable filters on the satellite by supplying the bias voltage to the tunable resonators of each filter. In order to set the filter to the desired frequency, it must accept telecommands from the ground—a telecommand value represents a filter center frequency. The electronics converts this information into the control voltages supplied to the filter. Further, it takes into account the actual temperature of the filter (by means of measurement) and adjusts the biasing voltages such that the desired frequency is reached, no matter at which temperature the filter actually is.
In the present configuration, it is foreseen to be able to set the filter to certain discrete center frequencies. For these center frequencies, the biasing voltages at certain discrete temperatures are stored in a memory of the control electronics. Then, the actual temperature of the filter is taken into account by interpolating between stored temperature support points.
2.7. Test Vehicle for Qualification Test
The test vehicle consists of two tunable filters mounted on a common support, a control electronics for commanding the filters, and an interconnecting DC harness. The test results presented in this publication focus on the 3-pole filter already discussed above, a photograph of which is shown in
Figure 8.
Compared to
Figure 6, coaxial to waveguide transitions and coaxial isolators (with gold-plated housings) are included on the ports. The filter is screwed on a baseplate. Green cables are seen, which connect to temperature sensors. On top of the filter housing, there are three gold-plated screws, which are the conventional tuning screws for the filter resonators (those screws for the irises are at the bottom of the filter and are not visible).
The control electronics was configured for three center frequencies of the filter: 19,740 MHz, 19,780 MHz, and 19,820 MHz.


