Article

Enhanced Photocatalytic and Antibacterial Activities of K2Ti6O13 Nanowires Induced by Copper Doping

1
School of Materials Science & Engineering, Hebei University of Technology, No. 5340, Xi Ping Road, Bei Chen District, Tianjin 300401, China
2
Key Lab. for New Type of Functional Materials in Hebei Province, Hebei University of Technology, No. 5340, Xi Ping Road, Bei Chen District, Tianjin 300401, China
*
Authors to whom correspondence should be addressed.
Crystals 2020, 10(5), 400; https://doi.org/10.3390/cryst10050400
Submission received: 19 February 2020 / Revised: 7 May 2020 / Accepted: 11 May 2020 / Published: 15 May 2020

Abstract

:
Cu-doped K2Ti6O13 (Cu–KTO) nanowires were prepared using a combination of sol–gel and hydrothermal methods to improve the photocatalytic and antibacterial performance of K2Ti6O13 (KTO) nanowires. The Cu–KTO nanowires maintained the monoclinic structure of KTO. The Cu2+ ions could enter into the lattice of KTO by substituting for certain Ti4+ ions and cause the formation of defects and oxygen vacancies. The UV–Visible absorption spectra showed that after Cu doping, the absorption edge of KTO moved to the visible region, indicating that the band gap decreased and the ability to absorb visible light was acquired. The photocatalytic properties of the Cu–KTO nanowires with different doping amounts were assessed by simulating the photodegradation of rhodamine B (RhB) under simulated sunlight irradiation. The 1.0 mol% Cu–KTO nanowires showed the best photocatalytic performance, and 91% of RhB was decomposed by these nanowires (the catalyst dose was only 0.3 g/L) within 5 h. The performance of the Cu–KTO nanowires was much better than that of the KTO nanowires. The Cu–KTO nanowires also showed high antibacterial activity for Escherichia coli (ATCC 25922) of up to 99.9%, which was higher than that of the pure KTO samples. Results proved that Cu doping is an effective means to develop multifunctional KTO nanomaterials. It can be used to degrade organic pollutants and remove harmful bacteria simultaneously in water environments.

Graphical Abstract

1. Introduction

As human society rapidly grows, water pollution has become increasingly serious and has caused widespread concern [1]. Organic contaminants and harmful bacteria in industrial wastewater directly endanger the survival of organisms and humans [2]. The ecological imbalance between humans and natural systems is increasing due to the random disposal of industrial wastewater and the shortage of water sources [3]. Current sewage treatment methods include physical adsorption, chemical flocculation, microbe degradation, chlorination, and UV irradiation [2,3,4,5,6]. However, the application of sewage treatment technologies is limited by these technologies’ low efficiency, high cost, high energy consumption, and secondary pollution such as the production of toxic by-products or large amounts of sewage sludge rich in organic pollutants. Therefore, efficient and environmentally-friendly wastewater treatment technologies must be developed to cope with the increasing water pollution. Since 1972 [7], many reports have shown that photocatalytic technology is an effective method to remove organic contaminants and harmful bacteria from wastewater solutions [1,7,8,9,10,11]. The success of photocatalytic degradation depends primarily on the selection of suitable photocatalyst materials [12,13]. Many metal oxides and sulfides have good photocatalytic performance under UV-light irradiation [14,15,16,17,18,19]. Among them, TiO2 is the most widely used class of photocatalyst material due to its effective photocatalytic performance, excellent chemical stability, and low cost [15,20,21,22,23]. In addition, the photocatalytic and antibacterial properties of TiO2 under UV light are well-known and have been mentioned in several studies [24,25,26]. Meanwhile, UV irradiation is a harmful, high-energy light source, and its permeability is limited to water. Metal ion doping can not only enhance the interfacial charge transfer at the interface, but also limit the recombination of electron–hole pairs, thereby effectively improving the photocatalytic performance of TiO2 under visible light. The most effective means to expand the optical response of TiO2 to the visible range is doping or surface modification with transition metals [27,28,29,30]. Wu et al. [31] proved that transition metal-doped TiO2 enhances photocatalytic performance due to the decreased band gap. Cu, Zn, and Ag are transition metal elements, and they are known to have antibacterial activity. Therefore, Cu, Zn, and Ag have become the preferred modification elements for improving the photocatalytic and antibacterial properties of TiO2.
KTO is a semiconductor material with a wide band gap. KTO has excellent physical and chemical properties, such as high chemical stability [32,33,34], good biocompatibility [35], acid and alkali corrosion resistance [36], and satisfactory photoelectric properties [37]. Reports on KTO nanomaterials are primarily on synthesis methods [32,33,34,35,36,37,38] and photocatalytic properties under UV light [34,39,40]. Few studies have been conducted on the photocatalytic and antibacterial activities of metal-doped KTO. According to our theoretical calculation based on the first principle [41,42], Cu or Ag doping can enhance the photocatalytic performance of KTO under visible light, but this finding still requires experimental verification.
In this study, Cu was selected as the doping metal of KTO because of its low cost and antibacterial effect. The photocatalytic property of Cu–KTO nanowires was compared with that of pure KTO. The antibacterial activity against Escherichia coli (E. coli) of KTO and Cu–KTO nanowires irradiated with 300 W of UV light and without light was investigated. The synergistic antibacterial mechanism was also discussed.

2. Materials and Methods

2.1. Synthesis of Materials

The chemicals used in the experiment such as tetra-n-butyl titanate (C16H36O4Ti), anhydrous alcohol (C2H5OH), sodium polyacrylate [(C3H3NaO2)n], nitric acid (HNO3), potassium hydroxide (KOH), and copper nitrate (Cu(NO3)2•xH2O) were of analytical grade. First, the Cu-doped TiO2 nanoparticles used for the hydrothermal method were prepared via the sol–gel method. In the sol–gel process, 5 wt.% (C3H3NaO2)n and 2 wt.% HNO3 were added to quantitatively deionized water via intense stirring for 30 min, which was named as solution A. Second, Cu(NO3)2•xH2O and C16H36O4Ti with four Cu/Ti mole ratios of 0%, 0.5%, 1.0%, and 1.5% were added to C2H5OH at a volume ratio of 1:1 and vigorously stirred for 30 min, which was named as solution B. Finally, solution A was gradually added to solution B with vigorous stirring for 2 h at room temperature until a white precipitate formed. Pure and Cu-doped TiO2 nanoparticles were obtained by filtering. For hydrothermal synthesis, pure or Cu-doped TiO2 was added to a KOH aqueous solution (10 mol/L), and the mixed solution was poured into an autoclave. The reaction system was heated to 150 °C and operated for 12 h. Afterward, KTO or Cu–KTO was rinsed and percolated until it became neutral and then dried. The 0.5 mol% Cu–KTO, 1.0 mol% Cu–KTO, and 1.5 mol% Cu–KTO samples were designated as 0.5 Cu–KTO, 1.0 Cu–KTO, and 1.5 Cu–KTO, respectively.

2.2. Characterization

The phase compositions of all samples were determined via X-ray diffraction (XRD, Bruker AXS D8 Advance, Germany). The elements and their valence states in the samples were analyzed through X-ray photoelectron spectroscopy (XPS, ESCALAB 250Xi, Thermo Fisher Scientific Co., Ltd., Waltham, MA, USA). The morphologies and electron diffraction patterns of the samples were characterized via field-emission scanning electron microscopy (FESEM, S-4800, Hitachi, Tokyo, Japan) at 1 KV and transmission electron microscopy (TEM, JEM-2100F, JEOL Ltd., Tokyo, Japan) at 200 KV, respectively. Raman spectra were obtained using a laser Raman spectrometer (HORIBA, LabRAM HR Evolution, Darmstadt, Germany) with a 532 nm laser. UV–Vis diffuse reflectance spectroscopy was conducted using a spectrophotometer (U-3900H, Hitachi, Tokyo, Japan) over a range of 240–800 nm with a diffuse reflectance attachment that used BaSO4 as a reference. The Cu-ion release behavior was measured with an atomic absorption spectrometer (ASD-6880, Shimadzu, Kyoto, Japan). The zeta potential of the Cu–KTO nanowires was measured with a laser scattering particle analyzer (SURPASS 3, Anton Paar, Graz, Austria).

2.3. Photocatalytic Experiments

For the activity measurement of photocatalytic degradation, RhB (analytical reagent) was selected as a degradation target. The photocatalytic reaction was implemented in a quartz reactor with a cold water bath. The simulated solar light source was provided by a xenon long-arc lamp (CEL-LAX500) as a built-in light source. In this photodegradation experiment, 0.3 g/L of Cu–KTO was dispersed thoroughly in 10 mg/L RhB aqueous solution. At the beginning of the photodegradation experiment, the suspensions were magnetically agitated in a darkroom for 1 h to ensure adsorption/desorption equilibrium so that the adsorption error could be revoked. The xenon long-arc lamp was turned on, and its power was set to 300 W. The light intensity reaching the sample equaled 25 mW/cm2. The suspensions were continuously stirred at various time intervals (1, 2, 3, 4, and 5 h). Mixed solutions (4 mL) were obtained at every time interval, and the solid catalyst was removed via centrifugation. Then, the absorbance values (At) of the clear solutions were analyzed with a UV–Vis spectrophotometer with a characteristic wavelength of 554 nm. UV–Vis absorption spectra between 400 and 700 nm were collected to analyze the gradual degradation process of RhB. Analogous experiments were conducted with KTO under similar conditions. The same photocatalysis experiments were repeated three times to reduce random errors.

2.4. Antibacterial Activity Tests

The effect of KTO and Cu–KTO samples on Gram-negative bacterium (E. coli, ATCC 25922) was studied. Before the antibacterial experiments, all glass instruments, the distilled water, the phosphate buffer solution containing 0.1% Tween-80 (PBS, 0.03 mol/L, pH = 7.2–7.4), and the nutrient agar (NA) medium were sterilized, and the experiments were performed in an aseptic environment. Before all samples were placed in the bacterial culture medium, they were divided into two groups for different treatments. One group was irradiated with a 300 W high-voltage mercury lamp for 1 h, and the other group was not irradiated. In a typical experiment, E. coli was transferred to PBS and diluted to make a 1.2 × 10⁵ CFU/mL bacterial suspension. Only 0.03 g of the sample was added to a triangle flask with 49 mL of PBS and evenly mixed. Then, 1 mL of the prepared bacterial suspension was added to the triangle flask with the sample and PBS mixture. The triangle flasks were placed in a 37 °C constant temperature culture oscillator (150 r/min) and cultured for 24 h in the dark. The group without a sample was used as a blank control. Afterward, 0.1 mL of the medium was coated on an NA plate, which was cultured in a 37 °C incubator for 24 h. Three parallel samples were set for each material to reduce the random error and other uncertain factors that may affect the experiment [43]. The same experiment was repeated three times. The standard plate count method was used to determine the number of viable bacteria and evaluate the antibacterial activity against E. coli in the as-prepared samples. The colony number was recorded. The antibacterial rates of different photocatalysts were calculated using the equation
Antibacterial rate (R, %) = (N0 − N)/N0 × 100%,
where N0 and N represent the average colonies of the blank control group and the experiment group on the NA plates, respectively [44].

3. Results and Discussion

3.1. Microstructure

Figure 1 describes the XRD spectra of the KTO and Cu–KTO nanowires prepared with the combination of sol–gel and hydrothermal methods. In accordance with the PDF card of the XRD database (40-04032), the XRD peaks at 2θ = 11.484° (200), 29.257° (310), and 47.887° (020) were identified as characteristic diffraction peaks of the K2Ti6O13 monoclinic phase. All Cu–KTO and KTO samples exhibited a monoclinic structure of K2Ti6O13, and no other Cu or Cu-related peaks were observed. Cu ions could be doped into the TiO2 lattice and substituted for Ti ions via the sol–gel method, as reported by Meng et al. [34] and Yang et al. [45]. Considering the process of preparing Cu–KTO in this study, we believe that Cu ions can replace some Ti ions in KTO and enter into the lattice of KTO. The diffraction peak (200) of the Cu–KTO samples slightly shifted to a lower 2θ diffraction angle compared with that of the KTO nanowires. This result can be ascribed to the increase in the interplanar distance induced by the doped Cu ions because the radius of Cu2+ (0.73 Å) is larger than that of Ti4+ (0.605 Å). In addition, the diffraction peak intensity at (200) increased slightly and then decreased with the increase in the Cu doping amount. This result indicates that the crystallinity of the samples increased in different degrees or the crystallite size decreased [46,47], which can be attributed to the slight inhibition effect of doped Cu on the growth of the KTO crystal during thermal treatment [48].
XPS analyses of KTO and 1.5 Cu–KTO nanowires were performed to confirm the valence state of Cu ions and whether these ions were doped into the KTO nanowires. The XPS spectra of Ti 2p and O 1s of KTO and 1.5 Cu–KTO are shown in Figure 2a,b, respectively. The peaks of Ti 2p3/2 and Ti 2p1/2 for KTO were located at 457.9 and 463.7 eV, respectively, corresponding to the tetravalent state (Ti4+) [45,49]. For 1.5 Cu–KTO, the binding energies of the Ti 2p3/2 and Ti 2p1/2 states increased slightly to 458.1 and 463.9 eV, respectively, indicating that Cu ions were doped into the KTO lattice. The XPS spectrum of O 1s for KTO showed that the peak at the binding energy of 529.5 eV was attributed to the lattice oxygen (Olatt) of the Ti–O species, whereas the one at 531.4 eV was assigned to the oxygen adsorbed (Oads) on the catalyst surface [45,50]. The binding energy of O 1s attributed to Olatt for 1.5 Cu–KTO exhibited a clear shift toward a higher energy level of up to 529.7 eV in Figure 2b, indicating that Cu–O bonds were formed due to Cu doping. The peak at 531.3 eV for 1.5 Cu–KTO was also attributed to Oads on the surfaces of 1.5 Cu–KTO [45,50]. The ratios of Oads/Olatt refer to the amount of surface oxygen vacancies [51]. A high ratio suggests a large amount of surface oxygen vacancies [52]. The ratio of Oads/Olatt was 0.6957 in the 1.5 Cu–KTO sample, which was higher than that in the KTO sample (0.4741). The XPS spectrum for Cu 2p of 1.5 Cu–KTO is shown in Figure 2c. The binding energies of Cu 2p3/2 and Cu 2p1/2 peaks were located at 932.2 and 951.8 eV, respectively. These binding energies are consistent with that of Cu+ [50,52]. However, the observation of Cu+ is attributed to the reduction of Cu2+ due to either Ar cleaning or extended X-ray irradiation [52,53,54,55,56,57,58]. Low Cu2+ loading samples are easily susceptible to X-ray-induced beam damage [53].
FESEM images of the Cu–KTO nanowires with different doping amounts are shown in Figure 3a–d. The morphologies of all the KTO samples before and after Cu doping showed typical nanowire features. The nanowires were entangled with one another and grouped into bundles because of the nanosize and surface effect. The KTO and 1.5 Cu–KTO samples were analyzed via TEM to further distinguish the structure of KTO and Cu–KTO nanowires (Figure 3e,f). The nanowires for both samples were not uniform in size. The diameter distributions of KTO and 1.5 Cu–KTO were 5–7 and 3–4 nm, respectively. A slight decrease in diameter was observed, and this decrement may have been induced by Cu doping. The Cu2+ ions were doped into the TiO2 lattice via the sol–gel method in this work, and they tended to be distributed at the edge of the grain boundary or on the particle surface to restrain the growth of TiO2 crystals [48]. The size of the TiO2 nanocrystals directly affected the diameter scale of the KTO nanowires during the hydrothermal process. Thus, the Cu-doped TiO2 could induce small KTO nanowires. In addition, the selective area electron diffraction (SAED) pattern of the 1.5 Cu–KTO nanowires showed a typical polycrystalline diffraction ring, as presented in the insert of Figure 3f. After careful measurement and calculation, this set of diffraction rings from the inside to the outside could be combined with KTO crystal planes (200), (20-1), (002), (110), (310), (311), and (31-2). TEM investigations proved that Cu doping affected only the nanomorphology of KTO and retained the monoclinic structure of KTO, which is in accordance with the XRD result in Figure 1.
Figure 4a shows the Raman spectra of the KTO and Cu–KTO nanowires with different amounts of Cu doping. Each sample had six main peaks that corresponded to KTO at the Raman shift from 100 cm−1 to 1000 cm−1 on the Raman spectra, which is consistent with the literature [48]. The peaks below 500 cm−1 were ascribed to K–O–Ti extending vibration. The peak near 660 cm−1 was attributed to the Ti–O–Ti stretch in the edge-shared TiO6 [59]. The peak close to 870 cm−1 was due to a short Ti–O stretching vibration in distorted TiO6 [59,60]. No peaks relevant to Cu or Cu compounds were observed, and this outcome is in accordance with the XRD result. Further observation of the Raman peaks at about 290 cm−1 (Figure 4b) revealed three different aspects. First, the peak positions of the Cu–KTO samples shifted to a wavenumber that is lower than that of KTO. Second, Cu doping narrowed the width of the Raman peak. Third, the peak intensity decreased dramatically after Cu doping. Previous studies [61,62,63,64] have proven that Cu doping can cause peak shifting, reduce the peak intensity, and decrease the peak width exhibited in Raman spectra. The difference in the ionic size of Cu2+ and Ti4+ causes a mismatch in the lattice structure. Cu2+ ions may substitute for Ti4+ ions, thereby generating a new bond in the lattice. This new bond could be Cu–O–Ti or Cu–O–Cu, as claimed by Choudhury et al. [64]. This claim further proves that Cu ions entered the lattice of KTO in the current study. After Cu doping, the vibration strength decreased because of the creation of oxygen vacancies nearby, which reduced the intensity of the Raman scattering peaks. The differences in the intensity of the Raman spectra could be ascribed to the change in the number of surface oxygen vacancies [65,66] resulting from the lattice defects of KTO caused by the substitution of Cu2+ for Ti4+. This finding is also consistent with the XPS result. The surface oxygen vacancy can be used to capture electrons and reduce the recombination of electron–hole pairs. As shown in Figure 4b, the peak intensity of 1.0 Cu–KTO was the lowest, which reveals the potentially high photocatalytic activity of 1.0 Cu–KTO. The crystal size of KTO reduced by Cu doping can cause a shift in the location of the Raman peaks and narrow their widths; this is referred to as the quantum size confinement effect [59,60,67]. Guo et al. [68] explored the relationship between the size and shape of CdSe nanocrystals and their Raman shifted through theoretical calculation and experimental measurement. They found that as the size of these crystals decreases, the bond length shortens, and the Raman shift moves toward a low wavenumber. The results in Figure 4 demonstrate that Cu doping could inhibit the growth of KTO nanocrystals, which is consistent with the TEM result.

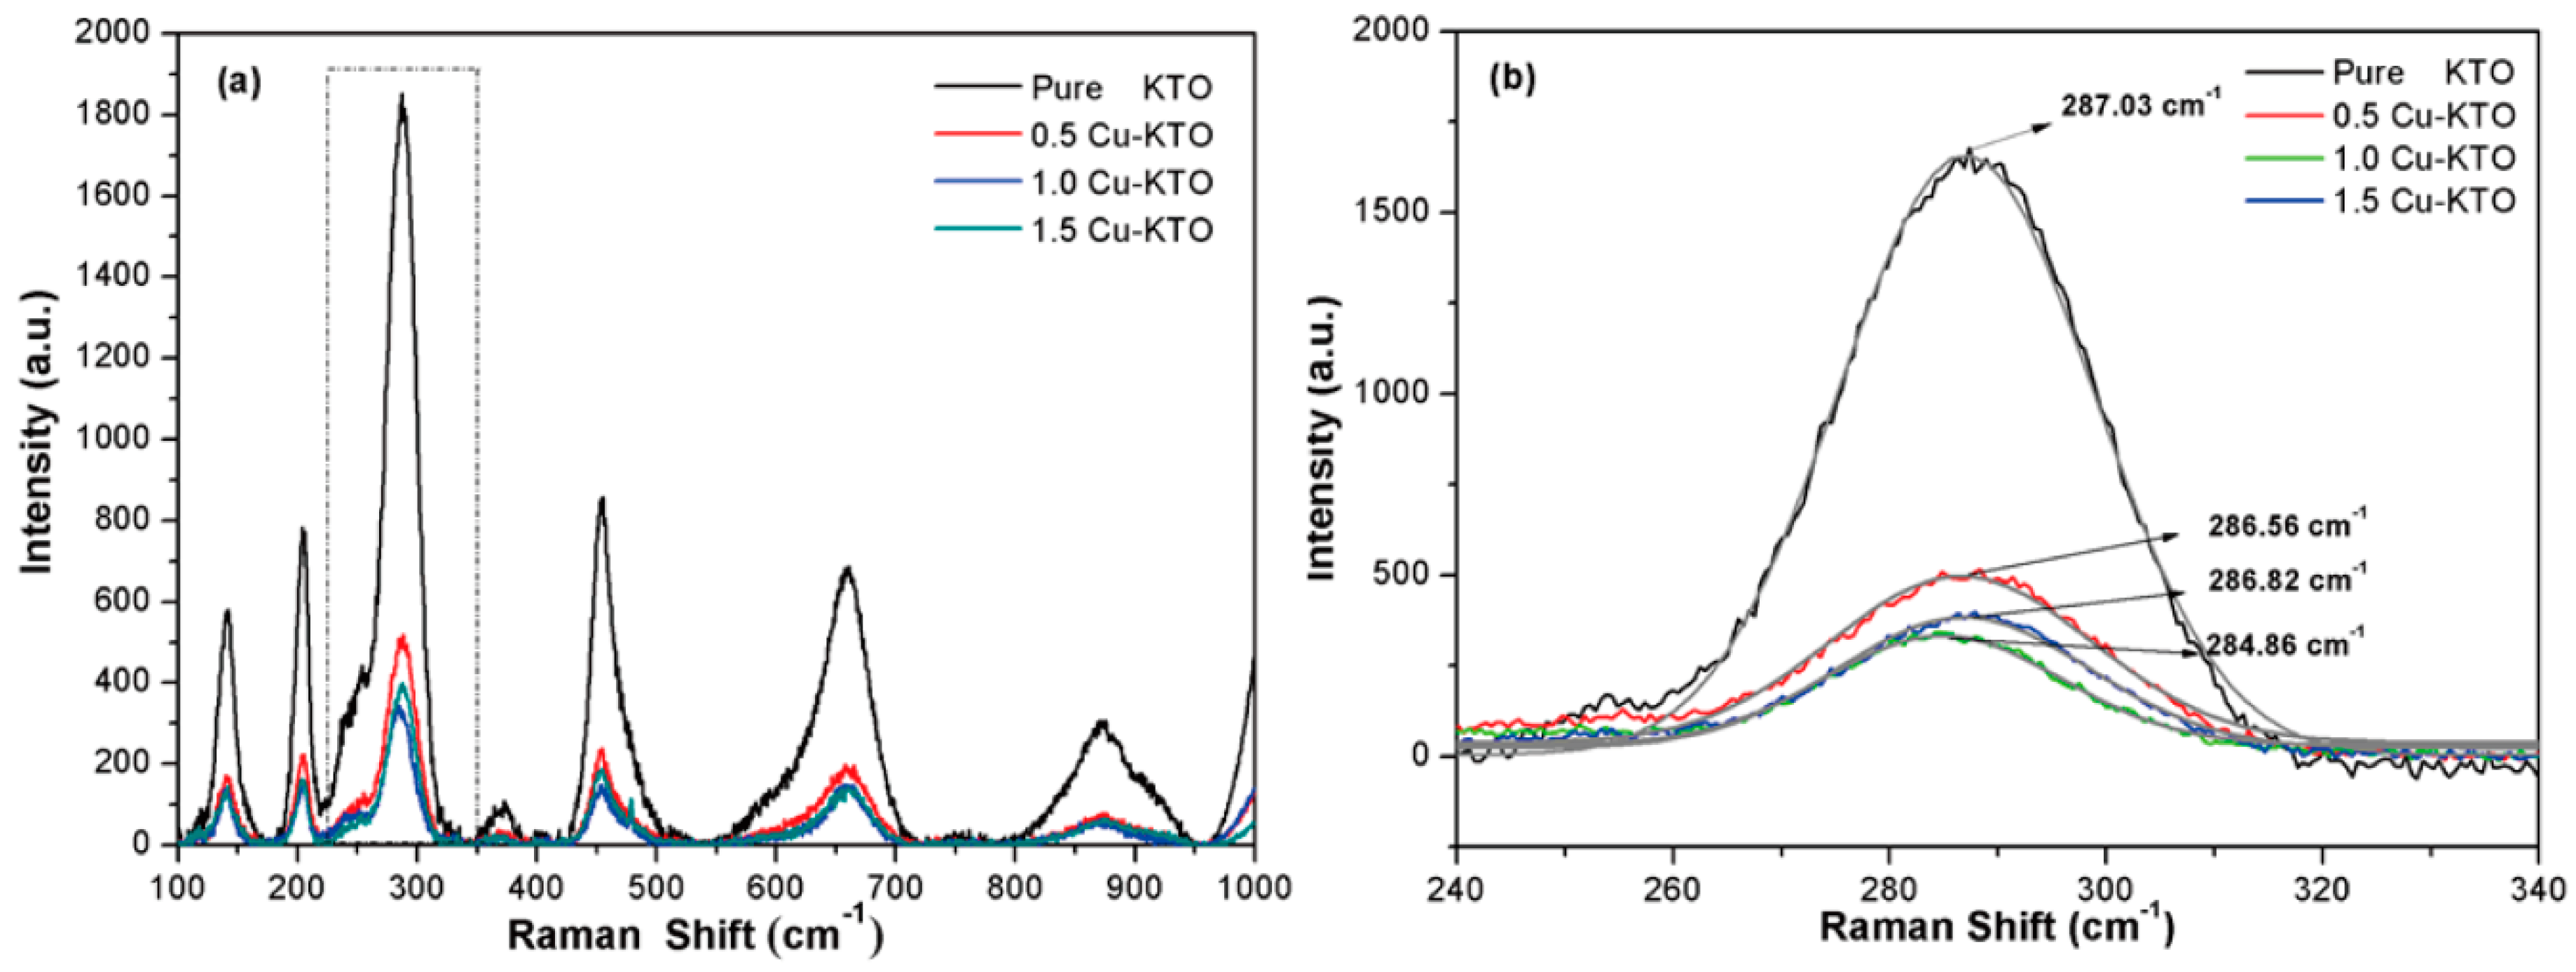
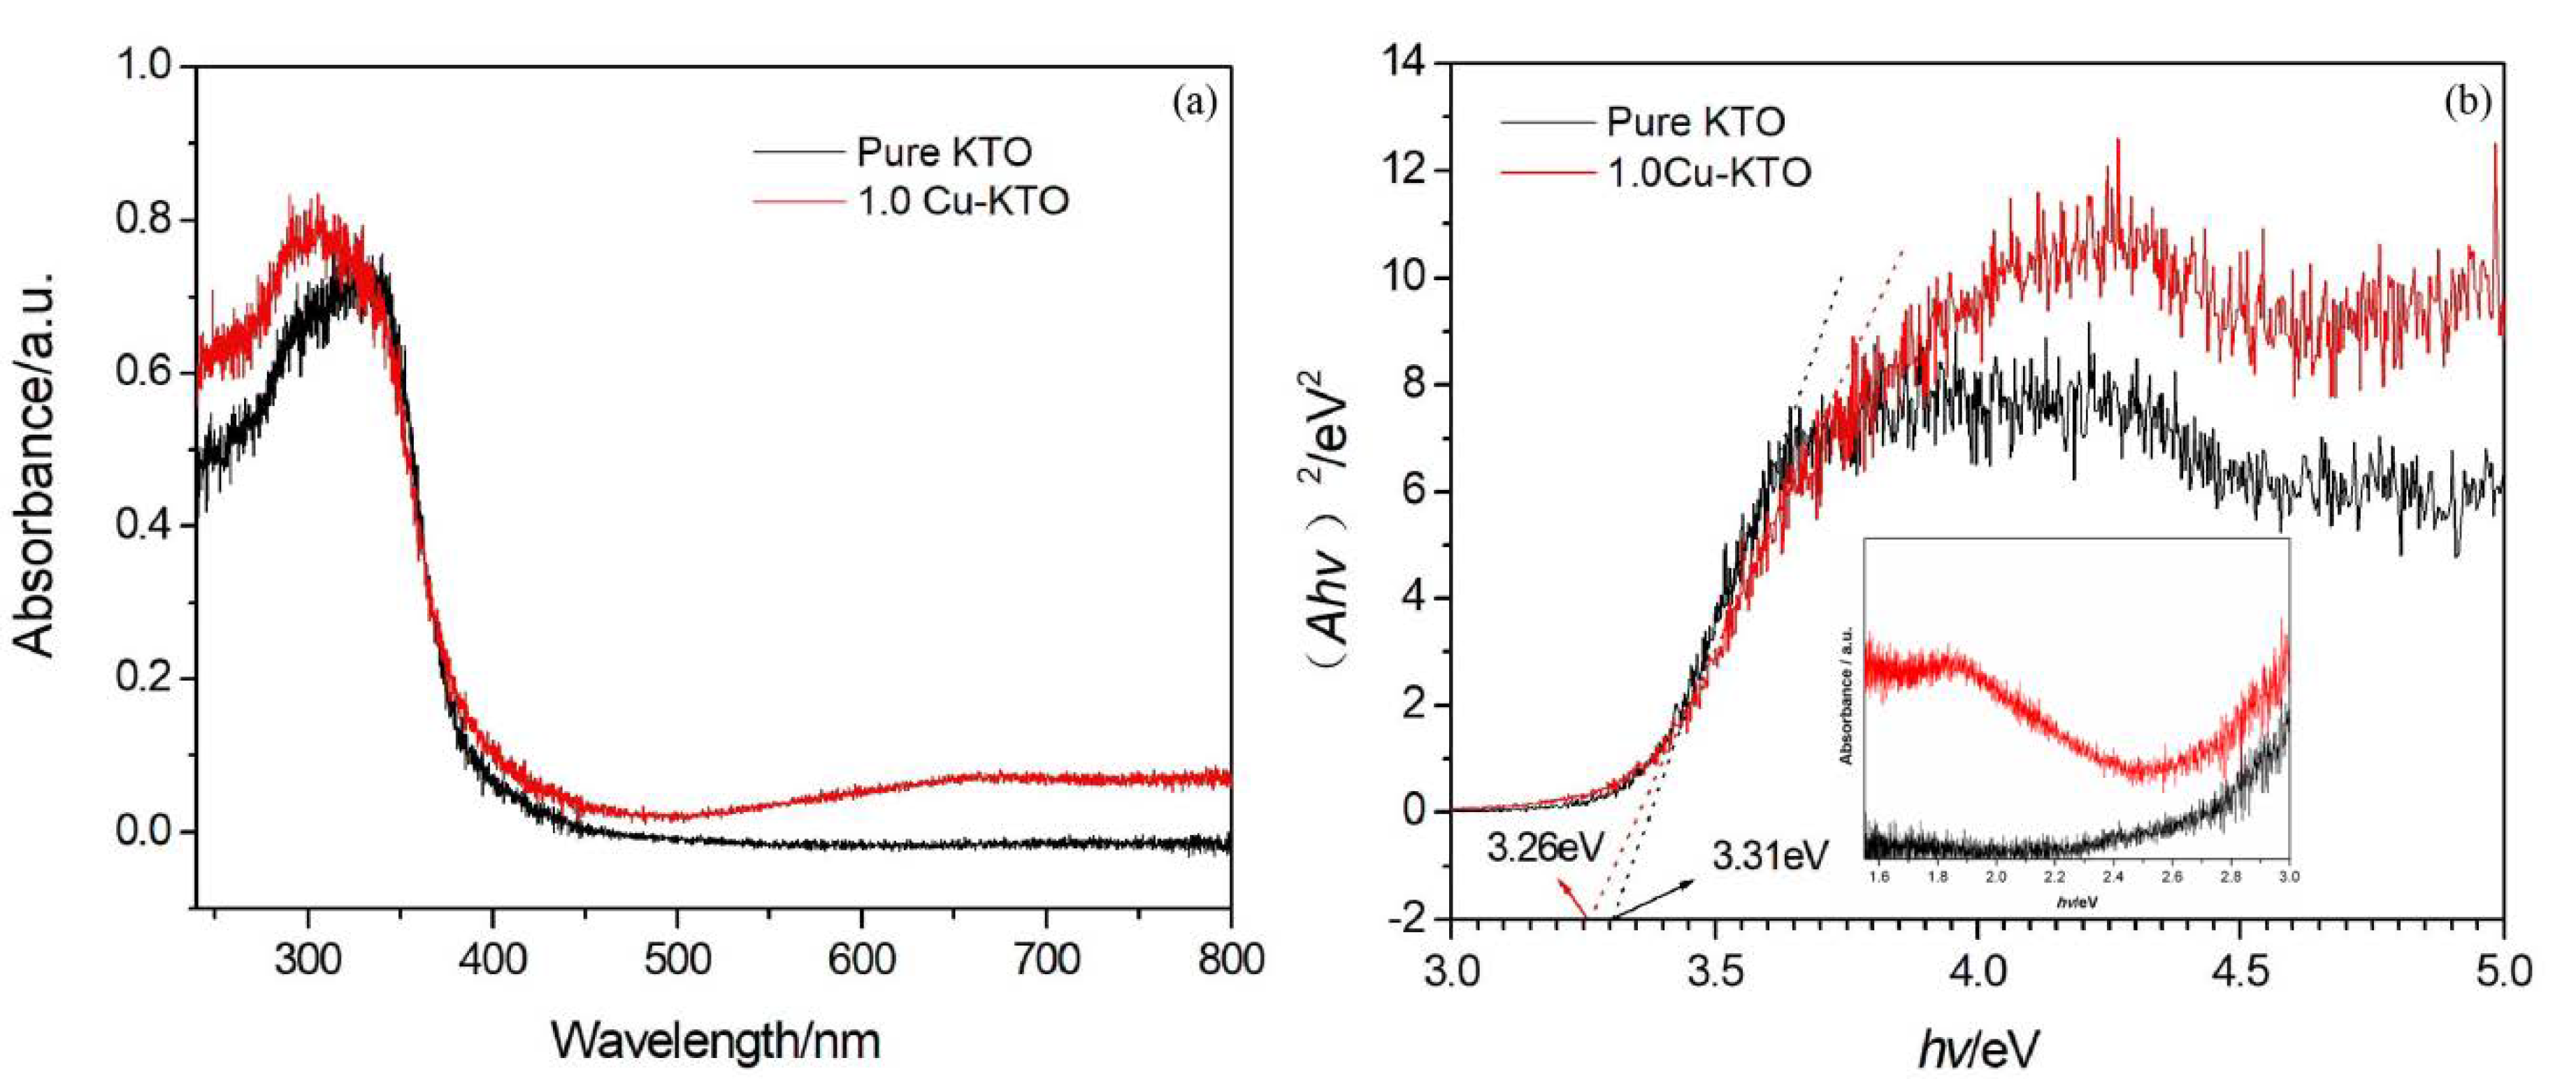
3.2. Optical Properties

The UV–Vis diffuse reflection spectra of the pure KTO and 1.0 Cu–KTO samples are explained in Figure 5a. The 1.0 Cu–KTO sample had a higher lighting performance reflected by its UV absorbance peak, which simultaneously enhanced the light absorbance covering the entire visible range. The red shift of the band gap could be obtained from the plot of (Ahν)2 versus (Eg) in Figure 5b, where A is the absorbance, h is the Planck constant, and ν is the frequency of incident light. The band gap shifted from 3.31 eV for pure KTO to 3.26 eV for 1.0 Cu–KTO. Thus, Cu doping could decrease the bandgap of KTO. Although the decrease in the band gap was minimal, Cu doping could introduce an impurity energy level to KTO at the top of the valence band (VB), which can be used as a bridge for electronic transitions [42]. In addition, a new absorption peak was observed at 1.9 eV, which is attributed to the absorbance peak of oxygen vacancies, as presented in the inset of Figure 5b [51]. This helps increase absorption in the visible range. The defect levels introduced by doping between CB and VB are one of the important strategies to improve the photocatalytic activity of a semiconductor under visible light [27,51]. Accordingly, Cu–KTO nanowires are expected to exhibit photocatalytic activity in the visible region.

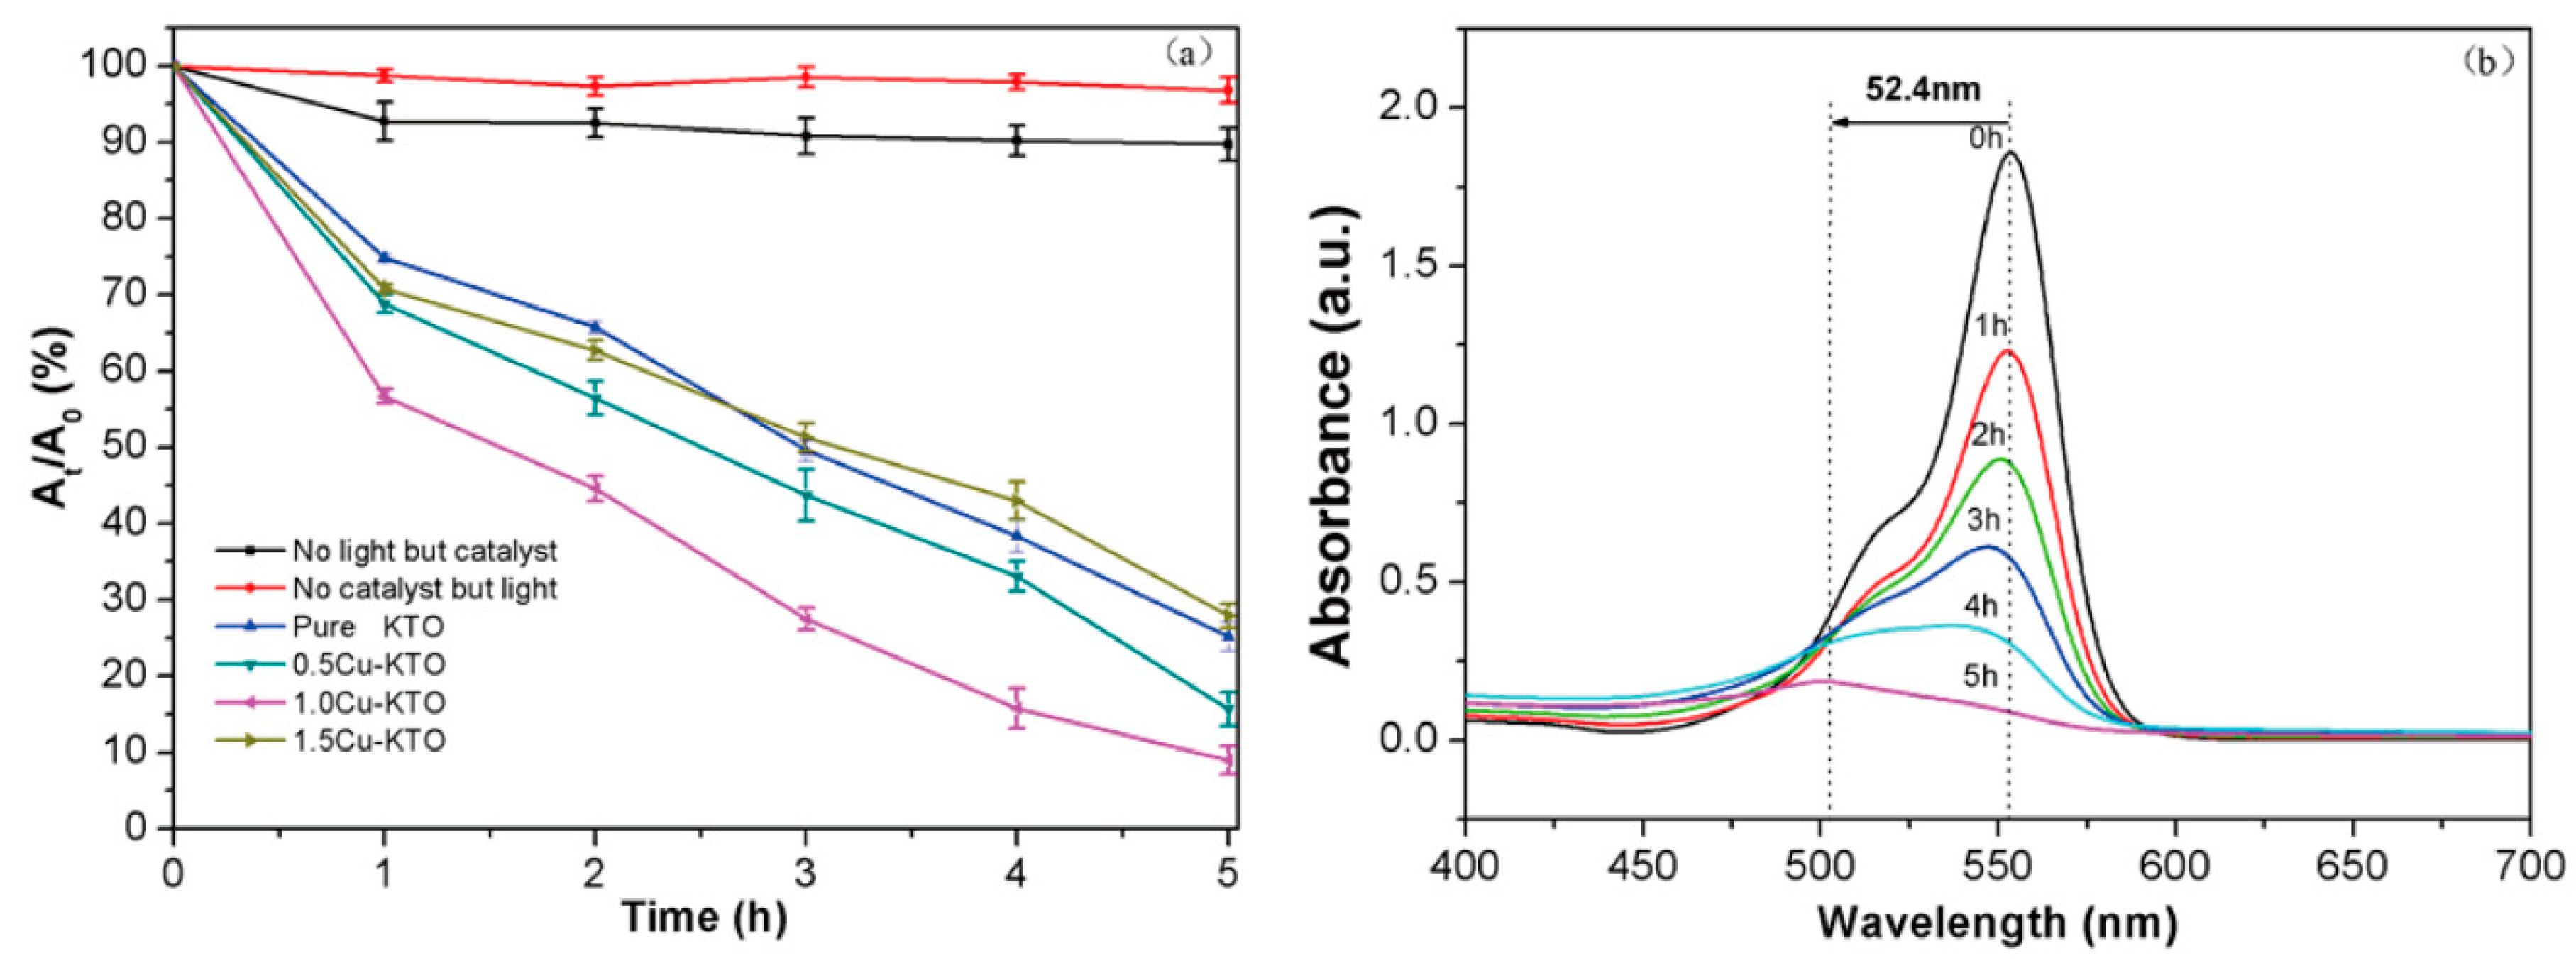
3.3. Photocatalytic Properties

The photocatalytic activities of the as-prepared samples were evaluated by degrading RhB under simulated sunlight. Prior to the photocatalytic reaction, all samples were immersed in the reactor and kept in the dark for 1 h to achieve equilibrium adsorption of RhB. The degradation of dyes was determined by monitoring the absorption peak intensity of RhB at 554 nm. Absorptive capacity is a key factor for photocatalytic activities of the photocatalyst [69,70]. Figure 6a shows the degradation rate of RhB in different conditions with respect to time. A time-dependent photoactive performance was observed from RhB degradation. With the prolongation of the photocatalysis reaction, the gradual degradation of RhB led to a subsequent reduction in the absorption peak intensity. The degradation rate is expressed as At/A0, where A0 is the initial absorbance value of RhB and At is the absorbance value of the remaining RhB. The degradation rate of RhB was almost unchanged under dark conditions with the photocatalyst and under light irradiation without the photocatalyst. The Cu–KTO samples had excellent photocatalytic characteristics compared with the KTO sample. Among all the samples, 1.0 Cu–KTO showed the best photocatalytic activity, and its degradation rate of RhB was 91% (only 0.3 g/L catalyst concentration) under simulated sunlight for 5 h. However, the dye degraded up to only 74.8% for KTO. The UV–Vis absorption spectra of RhB collected using 1.0 Cu–KTO as the photocatalyst under simulated sunlight irradiation are shown in Figure 6b. The intensity of the RhB characteristic absorption peaks decreased obviously, and the peak wavelength shortened with increasing exposure time. This result suggests the decomposition of RhB by the photocatalyst under simulated sunlight irradiation [71].

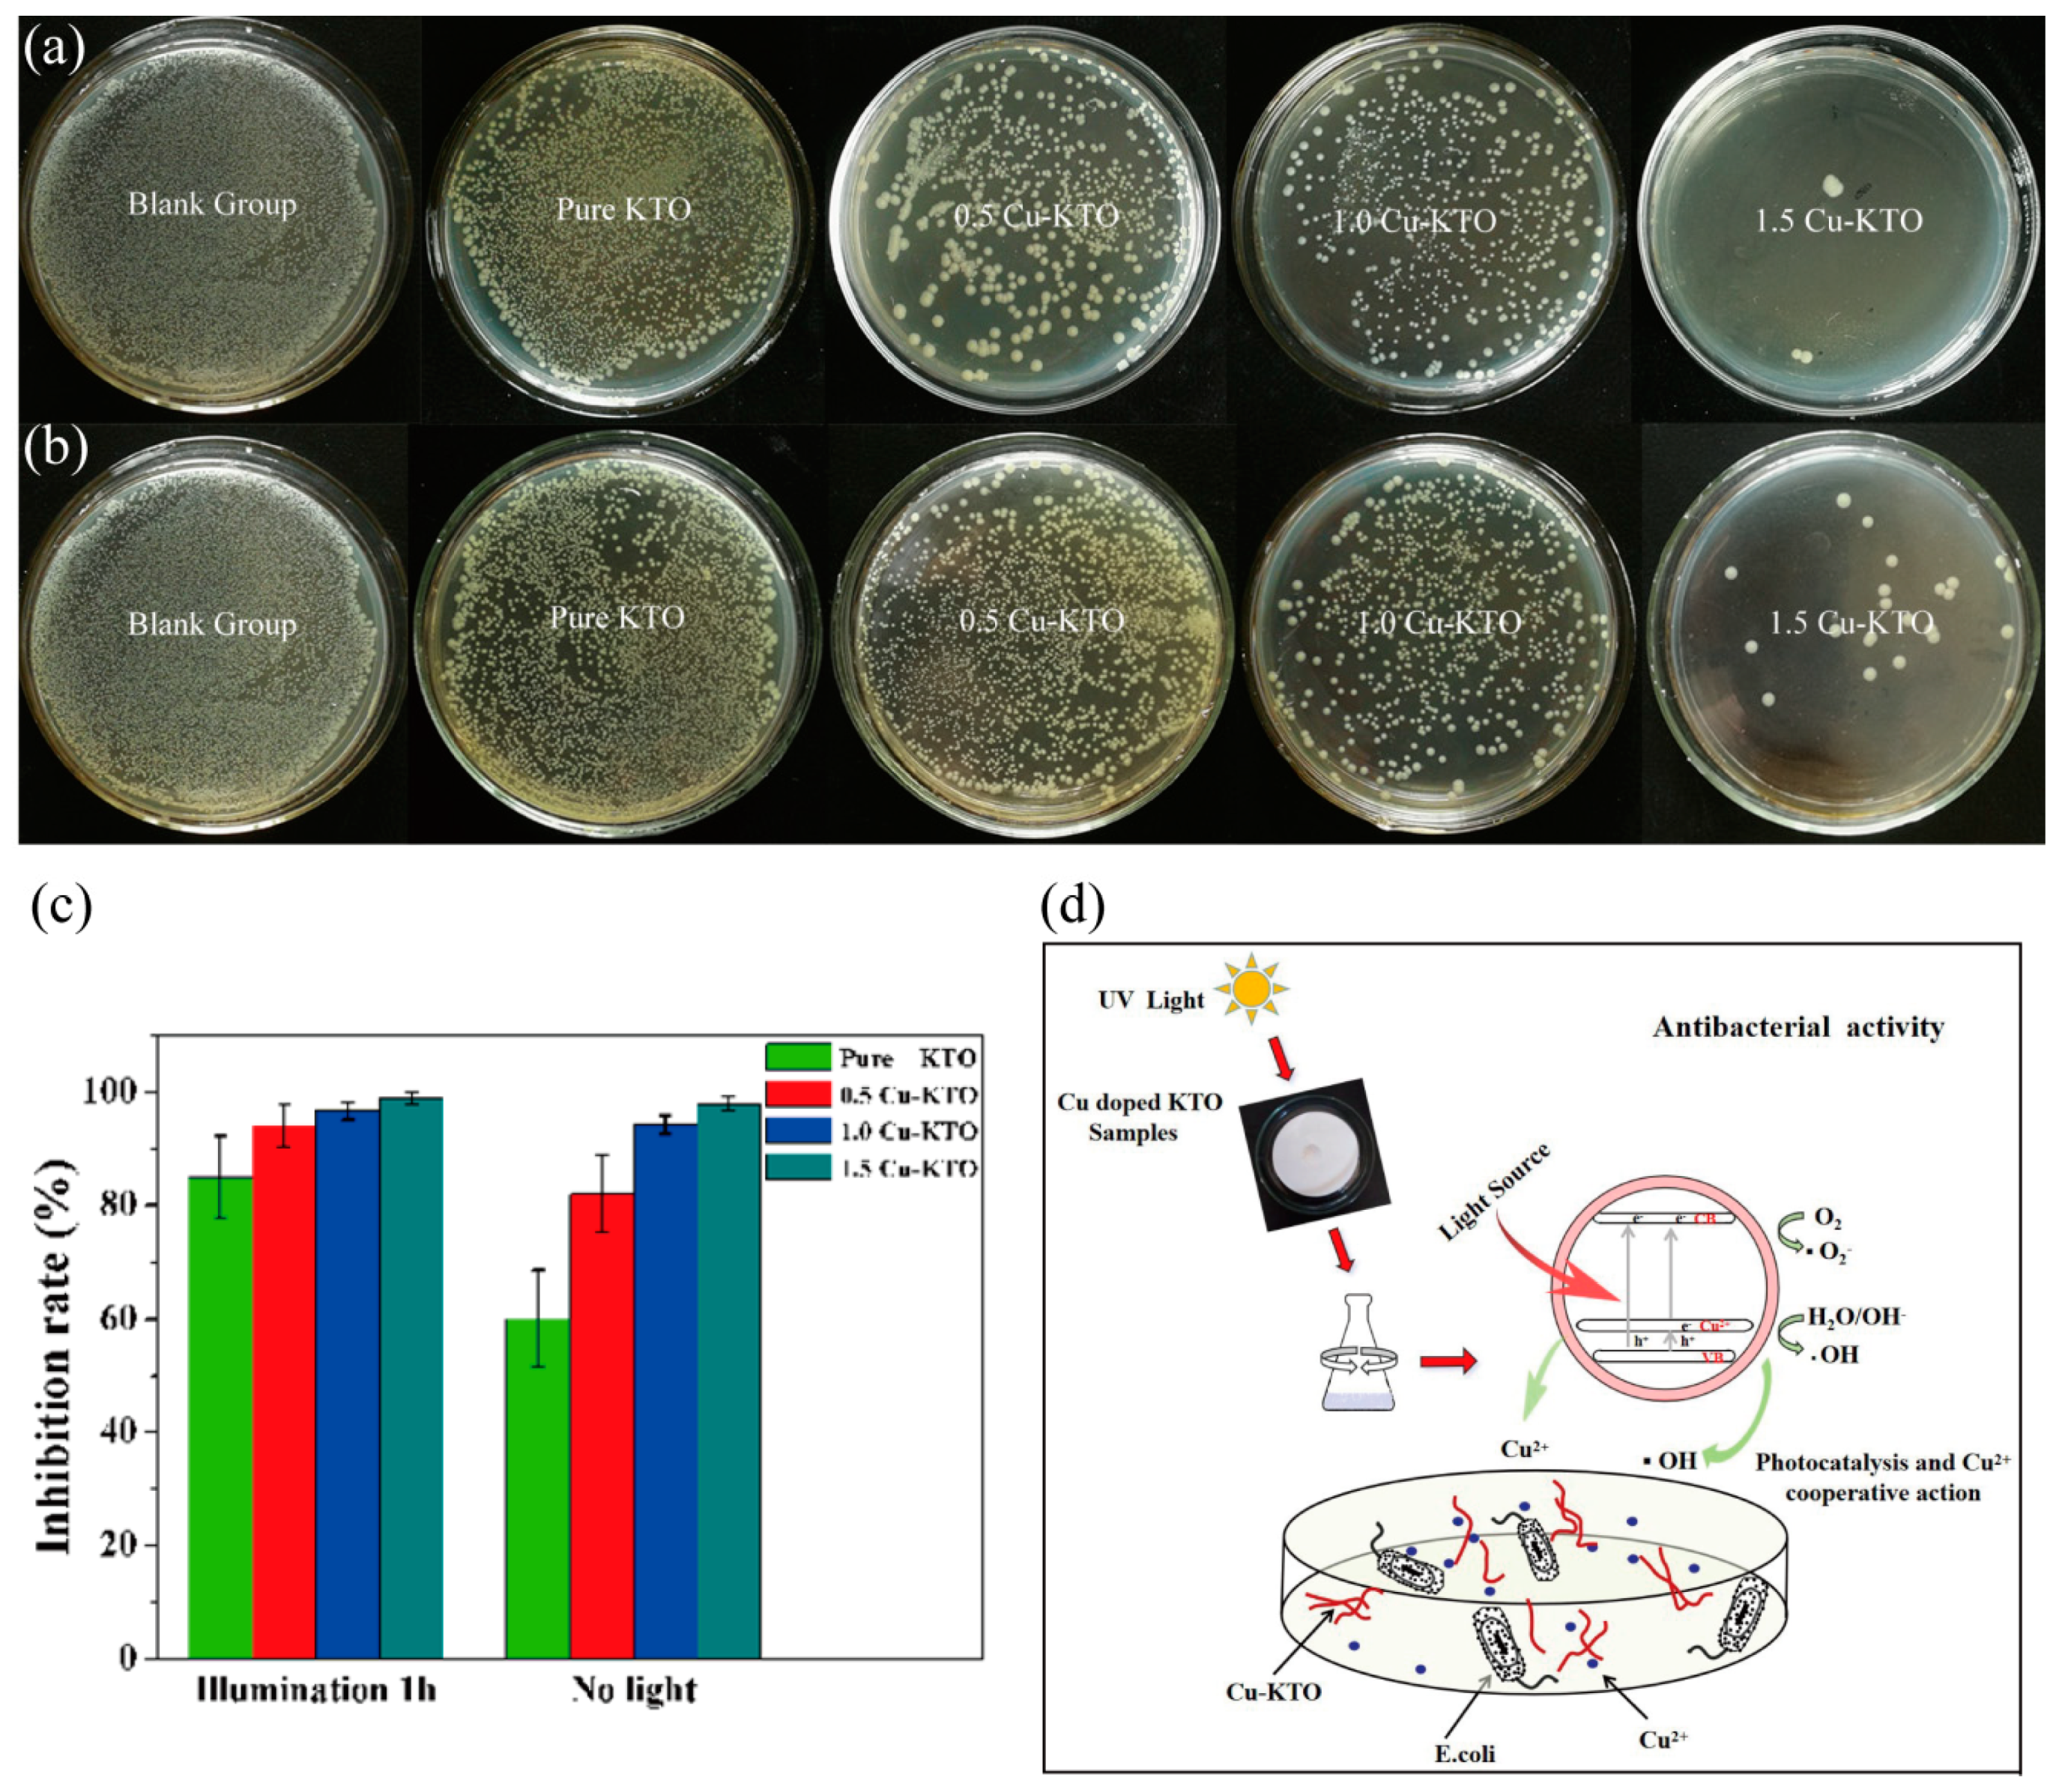
3.4. Antibacterial Properties

The antibacterial activities of the Cu–KTO nanowires were evaluated against Gram-negative bacteria E. coli by using the standard plate counting method to observe the bacterial growth quantities on the plates, as shown in Figure 7a,b. The amount of bacteria in the Petri dish of the KTO nanowires before and after Cu doping decreased significantly when compared with that of the control group. The number of bacterial colonies for the group irradiated by UV light was significantly smaller than that for the group irradiated without light. This result shows the effect of photocatalysis on the antibacterial activity of the materials. Moreover, Cu doping improved the antibacterial activity of the KTO nanowires. The higher the Cu doping amount, the higher the antibacterial activity. This finding can be attributed to the effect of released Cu2+ ions on antibacterial performance. The 1.5 Cu–KTO showed the highest antibacterial activity.
Figure 7c shows the antibacterial rate of the different samples against E. coli. On the basis of the standard reduction of bacteria criterion, 50–70% and greater than 70% reductions are known to exert an expressive bactericidal effect and an effective antibacterial effect, respectively [34]. In accordance with this criterion, the KTO without light irradiation exerted an expressive bactericidal effect, and all Cu–KTO samples without light irradiation had powerful bactericidal effects, as proven further by the antibacterial effect of Cu2+ ions. Moreover, the antibacterial rates of the group irradiated by UV light were higher than those of the group irradiated without light. This result is attributed to the photocatalytic antibacterial performance of the KTO and Cu–KTO samples. The synergistic antibacterial effect of photocatalysis and Cu2+ ions is thus fully demonstrated. The antibacterial mechanism of Cu-doped KTO nanowires is shown in Figure 7d.
To further understand the antibacterial mechanism of the Cu–KTO nanowires, the zeta potential of 1.0 Cu–KTO was investigated with a laser scattering particle analyzer to determine the stability of the sol solution. Graphite furnace atomic absorption spectrometry was performed to analyze the Cu-ion release behavior of the Cu–KTO nanowires. Sol is stable when the zeta potential (ζ, mV) is greater than︱±30︱mV [72]. The electrokinetic behavior of the 1.0 Cu–KTO nanowires in deionized water (pH = 7) is shown in Figure 8a. The zeta potential of the nanowires was −43.5 mV, indicating that the nanowires could spontaneously disperse in water. This phenomenon is helpful for the organic contaminants or bacteria in the bacterial suspension fully contacting with the surface of the dispersed nanowires to achieve strong photocatalytic and antibacterial effects. In the experiment, the release rate of the Cu ions was mainly determined by the Cu doping concentration of the KTO nanowires and the interaction between the Cu ions and KTO matrix. The Cu ions went through a gradual release process, and the KTO nanowires acted as the carriers of Cu ions for a sustained release. The amount of cumulative release over 24 h for the 0.5, 1.0, and 1.5 Cu–KTO nanowires were 12.25, 18.36, and 32.14 ppb, respectively (Figure 8b).
The bacteriostatic sterilization process of Cu–KTO nanowires can be understood from two aspects. First, it is mainly related to the photocatalytic process. After being irradiated by UV light for an hour, doped Cu promoted the separation of electron–hole pairs of the Cu–KTO nanowires and caused a delay in the recombination of the electron–hole pairs. When the Cu–KTO nanowires were placed in the bacterial suspension, the cell membrane was destroyed by active oxygen radicals (ROS) such as hydroxyl (OH) and oxygen (O2) radicals. Therefore, the photocatalytic behavior of the materials could effectively inhibit the E. Coil population. Second, the bactericidal effect of the Cu–KTO samples is also related to the appearance of Cu ions [72,73,74]. With the prolongation of co-culture time, the photocatalytic antibacterial effect gradually decreased, and the amount of Cu ion release increased simultaneously. Although the photocatalytic activities of the Cu–KTO samples decreased, the enrichment of Cu ions in the bacterial suspension improved their antibacterial property. The results of this work confirm that the antibacterial mechanism of Cu–KTO is a synergistic antibacterial process involving photocatalysis and Cu ions that exert antibacterial activity, even in the dark. In addition, Cu2+ is a biologically friendly metal ion that can enhance cell activity and osteoblast proliferation and improve angiogenesis [75,76]. The Cu–KTO nanowires in the present work can be regarded as reliable candidates for sewage treatment.

4. Conclusions

Cu–KTO can be successfully synthesized by the combination of sol–gel and hydrothermal methods. The crystal structure of Cu–KTO still maintains the monoclinic structure of K2Ti6O13, and Cu2+ ions can enter the lattice of KTO by substituting for some Ti4+ ions. Cu2+ ion doping can not only effectively enhance the photocatalytic activities of KTO under simulated sunlight irradiation, but also improve the inhibition of E. coli in the dark. The increase in the photocatalytic activity of the Cu–KTO nanowires can be attributed to the increased specific area of the crystals, enhancement of visible light absorption ability, narrowed band gap, and reduced recombination ratio of photoinduced electron–hole pairs. Among all Cu–KTO samples, 1.0 Cu–KTO showed the highest photocatalytic activity, and the photodegradation rate of RhB for 1.0 Cu–KTO reached 91% after 5 h under simulated sunlight irradiation. This work further confirms that Cu–KTO nanowires have a synergistic antibacterial function that involves both photocatalysis and Cu ions under light irradiation while Cu ions continue to exert antibacterial activity in the dark. Therefore, Cu doping is an effective method to develop KTO nanomaterials with dual functions of organic pollutant degradation and bacteriostatic sterilization.

Author Contributions

Data curation, W.Z.; Formal analysis, H.W.; Funding acquisition, C.C. and Y.Q.; Investigation, W.Z. and H.W.; Methodology, X.W. and Y.M.; Project administration, Y.Q.; Validation, C.C. and X.W.; Writing – original draft, W.Z.; Writing – review & editing, Y.Q. and X.W. All authors have read and agreed to the published version of the manuscript.

Funding

This work was financially supported by the National Natural Science Foundation (No. 51871087) and the Key Foundation Project of Applied and Fundamental Research in Hebei Province (No. 11965151D).

Acknowledgments

The authors are thankful to Hui Zhang, Xiao Yu, and Hongshui Wang for providing Raman, Zeta potential, and metal ion release analysis at the Material Analysis Center, School of Materials Science & Engineering, Hebei University of Technology.

Conflicts of Interest

The authors declare no conflicts of interest.

References

  1. Zhao, D.; Wu, X. Nanoparticles assembled SnO2 nanosheet photocatalysts for wastewater purification. Mater. Lett. 2017, 210, 354–357. [Google Scholar] [CrossRef]
  2. Batista, L.M.B.; Dos Santos, A.J.; Silva, D.R.; Alves, A.P.D.; Garcia-Segura, S.; Martinez-Huitle, C.A. Solar photocatalytic application of NbO2OH as alternative photocatalyst for water treatment. Sci. Total Environ. 2017, 596, 9–86. [Google Scholar]
  3. Zubair, M.; Daud, M.; Mckay, G.; Shehzad, F. Recent progress in layered double hydroxides (LDH)-containing hybrids as adsorbents for water remediation. Appl. Clay Sci. 2017, 143, 79–92. [Google Scholar] [CrossRef]
  4. Liu, X.J.; Lei, G.; Wei, L.; Wang, X.Z.; Feng, L. Layered double hydroxide functionalized textile for effective oil/water separation and selective oil adsorption. ACS Appl. Mater. Interfaces 2015, 7, 791–800. [Google Scholar] [CrossRef] [PubMed]
  5. Cataldo, S.; Lazzara, G.; Massaro, M.; Muratore, N.; Pettignano, A.; Riela, S. Functionalized halloysite nanotubes for enhanced removal of lead(II) ions from aqueous solutions. Appl. Clay Sci. 2018, 156, 87–95. [Google Scholar] [CrossRef]
  6. Yang, S.; Wang, L.; Zhang, W. Enhanced adsorption of Congo red dye by functionalized carbon nanotube/mixed metal oxides nanocomposites derived from layered double hydroxide precursor. Chem. Eng. J. 2015, 5, 315–321. [Google Scholar] [CrossRef]
  7. Fujishima, A.; Honda, K. Electrochemical Photolysis of water at a semiconductor electrode. Nature 1972, 238, 37–38. [Google Scholar] [CrossRef]
  8. Shekofteh, G.M.; Habibi, Y.A.; Abitorabi, M. Magnetically separable nanocomposites based on ZnO and their applications in photocatalytic processes: A review. CRC Crit. Rev. Environ. Control 2018, 48, 806–857. [Google Scholar] [CrossRef]
  9. Pang, Y.L.; Lim, S.; Ong, H.C.; Chong, W.T. Research progress on iron oxide-based magnetic materials: Synthesis techniques and photocatalytic applications. Ceram. Int. 2016, 42, 9–34. [Google Scholar] [CrossRef]
  10. Jia, W.; Jia, B.; Qu, X. Towards a highly efficient simulated sunlight driven photocatalyst: A case of heterostructured ZnO/ZnS hybrid structure. Dalton Trans. 2013, 3, 14178–14187. [Google Scholar] [CrossRef]
  11. Sathishkumar, S.; Parthibavarman, M.; Sharmila, V.; Karthik, M. A facile and one step synthesis of large surface area SnO2 nanorods and its photocatalytic activity. J. Mater. Sci. Technol. 2017, 28, 1–5. [Google Scholar] [CrossRef]
  12. Wang, M.; Guo, P.; Chai, T.Y.; Xie, Y.; Han, J.; You, M. Effects of Cu dopants on the structures and photocatalytic performance of cocoon-like Cu-BiVO4 prepared via ethylene glycol solvothermal method. J. Alloys Compd. 2017, 691, 8–14. [Google Scholar] [CrossRef]
  13. Bakar, S.A.; Ribeiro, C. Nitrogen-doped titanium dioxide: An overview of material design and dimensionality effect over modern applications. J. Photoch. Photobiol. C 2016, 27, 1–29. [Google Scholar] [CrossRef]
  14. Hitam, C.N.C.; Jalil, A.A. A review on exploration of Fe2O3 photocatalyst towards degradation of dyes and organic contaminants. J. Environ. Manag. 2020, 258, 110050. [Google Scholar] [CrossRef]
  15. Hussain, M.; Ceccarelli, R.; Marchisio, D.L. Synthesis characterization, and photocatalytic application of novel TiO2 nanoparticles. Chem. Eng. J. 2010, 157, 45–51. [Google Scholar] [CrossRef]
  16. Ma, S.; Li, R.; Lv, C. Facile synthesis of ZnO nanorod arrays and hierarchical nanostructures for photocatalysis and gas sensor applications. J. Hazard. Mater. 2011, 192, 730–740. [Google Scholar] [CrossRef]
  17. Liu, H.; Dong, X.N.; Li, G.J. Solvothermal synthesis and photocatalysis of SnO2 nanocrystal microspheres. Adv. Mater. Res. 2011, 412, 40–43. [Google Scholar] [CrossRef]
  18. Karunakaran, C.; Senthilvelan, S. Photocatalysis with ZrO2: Oxidation of aniline. J. Mol. Catal. A Chem. 2005, 233, 1–8. [Google Scholar] [CrossRef]
  19. Hazra, C.; Kundu, D.; Chaudhari, A. Biogenic synthesis, characterization, toxicity and photocatalysis of zinc sulfide nanoparticles using rhamnolipids from Pseudomonas aeruginosa BS01 as capping and stabilizing agent. J. Chem. Technol. Biot. 2013, 88, 1039–1048. [Google Scholar] [CrossRef]
  20. Fujishima, A.; Zhang, X.; Tryk, D.A. TiO2 photocatalysis and related surface phenomena. Surf. Sci. Rep. 2008, 63, 515–582. [Google Scholar] [CrossRef]
  21. Verbruggen, S.W. TiO2 photocatalysis for the degradation of pollutants in gas phase: From morphological design to plasmonic enhancement. J. Photochem. Photobiol. C 2015, 24, 64–82. [Google Scholar] [CrossRef]
  22. Yahya, N.; Aziz, F.; Jamaludin, N.A.; Mutalib, M.A.; Ismail, A.F.; Salleh, W.N.W. A review of integrated photocatalyst adsorbents for wastewater treatment. J. Environ. Chem. Eng. 2018, 6, 7411–7425. [Google Scholar] [CrossRef]
  23. Kim, D.H.; Nikles, D.E.; Brazel, C.S. Synthesis and Characterization of Multifunctional Chitosan-MnFe2O4 Nanoparticles for Magnetic Hyperthermia and Drug Delivery. J. Mater. 2010, 3, 4051–4065. [Google Scholar] [CrossRef] [PubMed] [Green Version]
  24. He, G.; Meng, Q.; Zhao, X.; He, C.; Zhou, P.; Duan, C. A new copper (II) selective fluorescence probe based on naphthalimide: Synthesis, mechanism and application in living cells. Inorg. Chem. Commun. 2016, 65, 28–31. [Google Scholar] [CrossRef]
  25. Dou, Y.; Liu, H.; Peng, J.; Li, M.; Yang, F. A green method for preparation of CNT/CS/Ag NP composites and evaluation of their catalytic performance. J. Mater. Sci. 2016, 51, 1–10. [Google Scholar] [CrossRef]
  26. Moongraksathum, B.; Shang, J.Y.; Chen, Y.W. Photocatalytic antibacterial effectiveness of Cu-doped TiO2 thin film prepared via the peroxo sol-gel method. Catalysts 2018, 8, 352. [Google Scholar] [CrossRef] [Green Version]
  27. Pelaez, M.; Nolan, N.T.; Pillai, S.C. A review on the visible light active titanium dioxide photocatalysts for environmental applications. Appl. Catal. B Environ. 2012, 125, 331–349. [Google Scholar] [CrossRef] [Green Version]
  28. Bouras, P.; Stathatos, E.; Lianos, P. Pure versus metal-ion-doped nanocrystalline titania for photocatalysis. Appl. Catal. B Environ. 2007, 73, 51–59. [Google Scholar] [CrossRef]
  29. Thida, S.N.; Lek, S.; Rungrote, K. Photocatalytic activity enhancement of Dy-doped TiO2 nanoparticles hybrid with TiO2 (B) nanobelts under UV and fluorescence irradiation. Curr. Appl. Phys. 2020, 20, 249–254. [Google Scholar]
  30. Poonam, Y.; Pravin, K.D.; Surendar, T. Metal and non-metal doped metal oxides and sulfides. Green Photocatal. 2020, 3, 89–132. [Google Scholar]
  31. Wu, M.C.; Wu, P.Y.; Lin, T.H. Photocatalytic performance of Cu-doped TiO2 nanofibers treated by the hydrothermal synthesis and air-thermal treatment. Appl. Surf. Sci. 2018, 430, 390–398. [Google Scholar] [CrossRef]
  32. Xu, L.Q.; Li, C. Environmentally friendly growth of single-crystalline K2Ti6O13 nanoribbons from kcl flux. Mater. Charact. 2010, 61, 245–248. [Google Scholar] [CrossRef]
  33. Wang, B.L.; Chen, Q.; Wang, R.H.; Peng, L.M. Synthesis and characterization of K2Ti6O13 nanowires. Chem. Phys. Lett. 2003, 376, 726–731. [Google Scholar] [CrossRef]
  34. Meng, X.; Wang, D.; Liu, J.; Lin, B.; Fu, Z. Effects of titania different phases on the microstructure and properties of K2Ti6O13 nanowires. Solid State Commun. 2006, 137, 146–149. [Google Scholar] [CrossRef]
  35. Qi, Y.M.; Geng, X.Y.; Ma, B.H. In vitro hemolytic properties assessment of K2Ti6O13 nanowires. J. Nanoeng. Nanosyst. 2015, 229, 201–205. [Google Scholar] [CrossRef]
  36. Shim, J.P.; Lee, H.K.; Park, S.G.; Lee, J.S. The synthesis of potassium hexatitanate and manufacturing alkaline fuel cell matrix. Synth. Met. 1994, 71, 2261–2262. [Google Scholar] [CrossRef]
  37. Zhang, X.; Tang, S.; Zhai, L. A simple molten salt method to synthesize single-crystalline potassium titanate nanobelts. Mater. Lett. 2009, 63, 887–889. [Google Scholar] [CrossRef]
  38. Zhang, J.; Wang, Y.A.; Yang, J. Microwave-assisted synthesis of potassium titanate nanowires. Mater. Lett. 2006, 60, 3015–3017. [Google Scholar] [CrossRef]
  39. Garay, R.G.; Torres, M. Photocatalytic performance of K2Ti6O13 whiskers to H2 evolution and CO2 Photo-reduction. J. Nat. Gas Chem. 2019, 37, 18–28. [Google Scholar]
  40. Wang, Q.; Guo, Q.; Li, B. Low temperature synthesis and characterization of substitutional Na-modified K2Ti6O13 nanobelts with improved photocatalytic activity under UV irradiation. RSC Adv. 2015, 5, 66086–66095. [Google Scholar] [CrossRef]
  41. Chen, H.L.; Lu, H.Y.; Qi, Y.M.; Jin, P. The electronic structure and optical properties of K2Ti6O13 doped with transition metal Fe or Ag. Chin. J. Chem. Phys. 2018, 31, 318–324. [Google Scholar] [CrossRef] [Green Version]
  42. Qi, Y.M.; Chen, H.L.; Jin, P.; Lu, H.Y.; Cui, C.X. First-principles study of electronic structure and optical properties of Mn and Cu doped potassium hexatitanate (K2Ti6O13). Acta Phys. Sin. 2018, 67, 067101. [Google Scholar]
  43. Yan, L.; Li, Q.; Chi, H.; Qiao, Y.; Zhang, T.; Zheng, F. One-pot synthesis of acrylate resin and ZnO nanowires composite for enhancing oil absorption capacity and oil-water separation. Adv. Compos. Lett. 2018, 1, 567–576. [Google Scholar] [CrossRef]
  44. Raut, A.V.; Yadav, H.M.; Gnanamani, A.; Pushpavanam, S.; Pawar, S.H. Synthesis and characterization of chitosan-TiO2: Cu nanocomposite and their enhanced antimicrobial activity with visible light. Colloid Surf. B 2016, 148, 566–575. [Google Scholar] [CrossRef] [PubMed]
  45. Yang, X.J.; Wang, S.; Sun, H.M.; Wang, X.B.; Lian, J.S. Preparation and photocatalytic performance of Cu-doped TiO2 nanoparticles. Trans. Nonferrous Met. Soc. 2015, 25, 504–509. [Google Scholar] [CrossRef]
  46. Gladis, P.H.; Iliana, E.; Medina, R.; Juan Antonio, L.A.; Sandra, E.R. Evaluation of the photocatalytic activity of copper doped TiO2 nanoparticles for the purification and/or disinfection of industrial effluents. Catal. Today 2019, 341, 37–44. [Google Scholar]
  47. Lopez, R.; Gomez, R.; Llanos, M.E. Photophysical and photocatalytic properties of nanosized copper-doped titania sol-gel catalysts. Catal. Today 2010, 148, 103–108. [Google Scholar] [CrossRef]
  48. Zhang, W.J.; Li, Y.; Zhu, S.L.; Wang, F.H. Copper doping in titanium oxide catalyst film prepared by DC reactive magnetron sputtering. Catal. Today. 2004, 93–95, 589–594. [Google Scholar] [CrossRef]
  49. Yu, L.; Yuan, S.; Shi, L.; Zhao, Y.; Fang, J. Synthesis of Cu2+ doped mesoporous titania and investigation of its photocatalytic ability under visible light. Microporous Mesoporous Mater. 2010, 134, 108–114. [Google Scholar] [CrossRef]
  50. Luo, Z.; Cetegen, S.A.; Miao, R.; Jiang, T.; Chen, S.Y.; Jafari, T. Structure–property relationships of copper modified mesoporous TiO2 materials on alkyne homocoupling reactions. J. Catal. 2016, 338, 94–103. [Google Scholar] [CrossRef] [Green Version]
  51. Nada, A.A.; Bekheet, M.F.; Viter, R.; Miele, P.; Roualdes, S.; Bechelany, M. BN/GdxTi(1−x)O(4−x)/2 nanofibers for enchanced photocatalytic hydrogen production under visible light. Appl. Catal. B Environ. 2019, 251, 76–86. [Google Scholar] [CrossRef]
  52. Ying, L.; Xu, Z.; Chu, Y. Cu2O nanocrystals/TiO2 microspheres film on a rotating disk containing long-afterglow phosphor for enhanced round-the-clock photocatalysis. Appl. Catal. B Environ. 2018, 224, 239–248. [Google Scholar]
  53. Chen, W.T.; Jovic, V.; Sun, W.H. The role of CuO in promoting photocatalytic hydrogen production over TiO2. Int. J. Hydrogen Energy 2013, 38, 15036–15048. [Google Scholar] [CrossRef]
  54. Klein, J.C.; Li, C.P.; Hercules, D.M.; Black, J.F. Decomposition of copper compounds in X-ray photoelectron spectrometers. Appl. Spectrosc. 1984, 8, 729–734. [Google Scholar] [CrossRef]
  55. Xu, B.; Dong, L.; Chen, Y. Influence of CuO loading on dispersion and reduction behavior of CuO/TiO2 (anatase) system. J. Chem. Soc. Faraday Trans. 1998, 94, 1905–1909. [Google Scholar] [CrossRef]
  56. Lee, S.Y.; Mettlach, N.; Nguyen, N.; Sun, Y.M.; White, J.M. Copper oxide reduction through vacuum annealing. Appl. Surf. Sci. 2003, 206, 102–109. [Google Scholar] [CrossRef]
  57. Zhu, H.; Dong, L.; Chen, Y. Effect of titania structure on the properties of its supported copper oxide catalysts. J. Colloid Interface Sci. 2011, 357, 497–503. [Google Scholar] [CrossRef]
  58. Sathe, A.; Peck, M.A.; Balasanthiran, C.; Langell, M.A.; Rioux, R.M.; Hoefelmeyer, J.D. X-ray photoelectron spectroscopy of transition metal ions attached to the surface of rod-shape anatase TiO2 nanocrystals. Inorg. Chim. Acta 2014, 422, 8–13. [Google Scholar] [CrossRef] [Green Version]
  59. Ye, C.; Zhang, J.; Chen, F. Synthesis and Characterization of Nitrogen-Doped TiO2 nano photocatalyst with High Visible Light Activity. J. Phys. Chem. 2017, 111, 6976–6982. [Google Scholar]
  60. Xu, J.N.; Liu, Q.; Lin, S.F.; Cao, W.B. One-step synthesis of nanocrystalline N-doped TiO2 powders and their photocatalytic activity under visible light irradiation. Res. Chem. Intermediat. 2013, 39, 1655–1664. [Google Scholar] [CrossRef]
  61. Garzon, R.A.; Zuñiga, I.C.; Quiroga, G.E. Immobilization of doped TiO2 nanostructures with Cu or inside of macroporous silicon using the solvothermal method: Morphological, structural, optical and functional properties. Ceram. Int. 2020, 46, 1137–1147. [Google Scholar] [CrossRef]
  62. Xue, X.; Ji, W.; Mao, Z.; Mao, H.; Wang, Y.; Wang, X. Raman investigation of nanosized TiO2: Effect of crystallite size and phonon confinement. J. Phys. Chem. C 2012, 116, 8792–8797. [Google Scholar] [CrossRef]
  63. Mashary, F.S.; Castro, S.; Silva, A.F.; Felix, J.F. Effect of growth techniques on the structural, optical and electrical properties of indium doped TiO2 thin films. J. Alloys Compd. 2018, 766, 194–203. [Google Scholar] [CrossRef] [Green Version]
  64. Choudhury, B.; Dey, M.; Choudhury, A. Defect generation, d-d transition, and band gap reduction in Cu-doped TiO2 nanoparticles. Int. Nano Lett. 2013, 3, 25. [Google Scholar] [CrossRef] [Green Version]
  65. Dong, F.; Wang, H.Q.; Wu, Z.B.; Qiu, J.F. Marked enhancement of photocatalytic activity and photochemical stability of N-doped TiO2 nanocrystals by Fe3+/Fe2+ surface modification. J. Colloid Interface Sci. 2010, 343, 200–208. [Google Scholar] [CrossRef] [PubMed]
  66. Zhu, J.; Ren, J.; Hu, Y.N.; Bian, Z.F.; Li, H.X. Nanocrystalline Fe/TiO2 visible photocatalyst with a mesoporous structure prepared via a nonhydrolytic sol-gel route. J. Phys. Chem. 2007, 111, 18965–18969. [Google Scholar]
  67. Pollard, A.J.; Brennan, B.; Tyler, B.J.; Sean, M.P. Quantitative characterization of defect size in graphene using Raman spectroscopy. Appl. Phys. Lett. 2014, 105, 253107.1–253107.5. [Google Scholar] [CrossRef]
  68. Guo, N.G.; Zhou, Z.F. Size, shape, and temperature dependence of the phonon relaxation dynamics of cdse nanocrystals. Chem. Phys. Lett. 2013, 585, 167–170. [Google Scholar] [CrossRef]
  69. Huang, S.; Xu, Y.; Xie, M.; Liu, Q.; Xu, H.; Zhao, Y. A Z-scheme magnetic recyclable Ag/AgBr@CoFe2O4 photocatalyst with enhanced photocatalytic performance for pollutant and bacterial elimination. RSC Adv. 2017, 7, 30845–30854. [Google Scholar] [CrossRef] [Green Version]
  70. Yoon, H.J.; Choi, Y.I.; Jang, E.S. Graphene, charcoal, ZnO, and ZnS/BiOX (X = Cl, Br, and I) hybrid microspheres for photocatalytic simulated real mixed dye treatments. J. Ind. Eng. Chem. 2015, 32, 137–152. [Google Scholar] [CrossRef]
  71. Wu, Y.Q.; Zhou, S.S.; He, T.; Jin, X.Y.; Lun, L.Y. Photocatalytic activities of ZnWO4 and Bi@ ZnWO4 nanorods. Appl. Surf. Sci. 2019, 484, 409–413. [Google Scholar] [CrossRef]
  72. Funda, S.; Meltem, A.; Nadir, K.; Esin, B.; Ertğrul, A.; Hikmet, S. Photocatalytic antibacterial performance of Sn4+-doped TiO2 thin films on glass substrate. J. Hazard. Mater. 2009, 162, 1309–1316. [Google Scholar]
  73. Rtimi, S.; Giannakis, S.; Sanjines, R.; Pulgarin, C.; Bensimon, M.; Kiwi, J. Insight on the photocatalytic bacterial inactivation by co-sputtered TiO2–Cu in aerobic and anaerobic conditions. Appl. Catal. B Environ. 2016, 182, 277–285. [Google Scholar] [CrossRef]
  74. Yadav, H.M.; Otari, S.V.; Koli, V.B.; Mali, S.S.; Hong, C.K.; Pawar, S.H.; Delekar, S.D. Preparation and characterization of copper-doped anatase TiO2 nanoparticles with visible light photocatalytic antibacterial activity. J. Photochem. Photobiol. A Chem. 2014, 280, 32–38. [Google Scholar] [CrossRef]
  75. Gerard, C.; Bordeleau, L.J.; Barralet, J. The stimulation of angiogenesis and collagen deposition by copper. Biomaterials 2010, 31, 824–831. [Google Scholar] [CrossRef]
  76. Ram, K.S.; Kannan, S. Synthesis, structural analysis, mechanical, antibacterial and hemolytic activity of Mg2+ and Cu2+ co-substitutions in β-Ca3(PO4)2. Mater. Sci. Eng. C 2014, 45, 530–538. [Google Scholar]
Figure 1. XRD spectra of KTO and Cu–KTO nanowires with different Cu doping amounts.
Crystals 10 00400 g001
Figure 2. XPS spectra of Ti 2p for KTO and 1.5 Cu–KTO (a), O 1s for KTO and 1.5 Cu–KTO (b), and Cu 2p for 1.5 Cu–KTO (c).
Crystals 10 00400 g002
Figure 3. FESEM images of KTO (a), 0.5 Cu–KTO (b), 1.0 Cu–KTO (c), 1.5 Cu–KTO (d), and TEM images of KTO (e) and 1.5 Cu–KTO (f). Insert in (f) shows the respective SAED pattern.
Crystals 10 00400 g003
Figure 4. Raman spectra of KTO and Cu–KTO with different doping amounts (a) and Raman spectra of KTO and Cu–KTO samples in the range 240~340 cm−1 (b).
Crystals 10 00400 g004
Figure 5. UV–Vis diffuse reflection spectra of KTO and 1.0 Cu–KTO (a) and (Ahν)2 vs. (Eg) curves from the absorption spectra to obtain band gap values (b).
Crystals 10 00400 g005
Figure 6. Degradation rate of RhB in different conditions with respect to time (a) and UV–Vis absorption spectra of RhB using 1.0 Cu–KTO as the photocatalyst under simulated sunlight irradiation (b).
Crystals 10 00400 g006
Figure 7. The optical images of E. coli cultured for 24 h in the presence of different samples irradiated by UV light (a) and without light (b); antibacterial rate (%) against E. coli (c); schematic diagram of antibacterial mechanism of Cu–KTO nanowires (d).
Crystals 10 00400 g007
Figure 8. Zeta potential characteristics of 1.0 Cu–KTO dispersed in deionized water (a) and the amount of Cu ion release for 0.5, 1.0 and 1.5 Cu–KTO with respect to immersion time (b).
Crystals 10 00400 g008

