Article

Effect of Cholesterol and Ibuprofen on DMPC-β-Aescin Bicelles: A Temperature-Dependent Wide-Angle X-ray Scattering Study

1
Physical and Biophysical Chemistry, Bielefeld University, 33615 Bielefeld, Germany
2
Soft Matter at Interfaces, Technical University of Darmstadt, 64289 Darmstadt, Germany
3
ESRF—The European Synchrotron, 38043 Grenoble CEDEX 9, France
4
Institut Laue-Langevin, DS/LSS, 38042 Grenoble CEDEX 9, France
*
Author to whom correspondence should be addressed.
Crystals 2020, 10(5), 401; https://doi.org/10.3390/cryst10050401
Submission received: 10 April 2020 / Revised: 8 May 2020 / Accepted: 11 May 2020 / Published: 16 May 2020

Abstract

:
β -aescin is a versatile biosurfactant extracted from the seeds of the horse chestnut tree Aesculus hippocastanum with anti-cancer potential and is commonly used in the food and pharmaceutical and cosmetic industries. In this article, wide-angle X-ray scattering (WAXS) is used in order to study the modifications of the structural parameters at the molecular scale of lipid bilayers in the form of bicelles composed of 1,2-dimyristoyl-sn-glycero-3-phosphocholine (DMPC) and the triterpenoid saponin β -aescin. In particular, the impact on the cooperative phase transition and the structural parameters of the DMPC bilayers at different compositions and temperatures is of special interest. Moreover, we show how cholesterol and the non-steroidal anti-inflammatory drug (NSAID) ibuprofen modulate the structural parameters of the β -aescin-DMPC assemblies on a molecular scale. Ibuprofen and cholesterol interact with different parts of the bilayer, namely the head-region in the former and the tail-region in the latter case allowing for specific molecular packing and phase formation in the binary and ternary mixtures.

1. Introduction

Aescin (or escin) is a mixture of the triterpene saponins extracted from the seeds of the horse chestnut tree Aesculus hippocastanum [1,2,3,4,5,6,7]. The active compound in this mixture is β -aescin, which is also the key molecule in this work [8]. It has gained significant attention in the last 10 years especially in relation to aescins’ pharmacological activity [9,10,11,12,13,14]. The compound itself has proven to be very tolerable in in-vivo and in-vitro studies [15,16] and its potent anti-inflammatory and anti-odematous properties make it used for therapy of chronic venous insufficiency (CVI), edema, post thrombotic syndrome, and arthritis [8,13,14,15,17,18,19]. More recently, aescin has been investigated with respect to its potential for anti-cancer therapy [20,21,22]. Especially its growth-inhibiting activity against glioblastoma-initiating cells (GIC) is remarkable and is more efficient compared to clinically used drugs [23]. In addition, it was found to augment the effects of existing chemotherapeutic drugs [20].
β -aescin is a monodesmoside saponin. Its molecular structure possesses surfactant-like character with a distinct headgroup (glycone) and backbone (aglycone) (Figure 1a).
The glycone consists of an oligosaccharide chain with 3 sugar units and is linked via a glycosidic bond to the triterpenoid aglycone. The peculiarity of the structure arises from the additional polar groups primarily attached one sided to the aglycone. More details about the structure are reported elsewhere [8,9,24]. Due to this peculiar structure, β -aescin adsorption layers posses unique surface rheological properties [25,26,27,28,29].
β -aescin molecules form micelles in aqueous solution. Their critical micelle concentration ( c m c ) in aqueous phosphate buffer (50 mM, pH 7.4) is c m c ( β -aescin) ≈ 0.3–0.4 mM [24]. In lipidic environment consisting of 1,2-dimyristoyl-sn-glycero-3-phosphocholine (DMPC, Figure 1b, main phase transition temperature T m (DMPC) = 23.6 C [30]), self-assembled and thermodynamically stable structures form, which depend on β -aescin concentration and lipid-to-saponin ratio [9]. Depending on β -ascin concentration phase segregation into saponin-rich and saponin-poor regions occurs, as proven by differential scanning calorimetry (DSC) [30,31,32]. Far below c m c ( β -aescin), stable unilamellar vesicles are obtained by extrusion [33,34]. The successful incorporation of β -aescin molecules into the bilayer occurs at both phase states (gel and fluid), as shown by modified electron density profiles of bilayers from small-angle X-ray scattering (SAXS) experiments. The modification of the structural parameter of the vesicular DMPC bilayer was found to be more prominent in the gel-phase state than in the fluid phase state [33,34]. Neutron spin-echo spectroscopy (NSE) experiments revealed that β -aescin strongly softenes the gel-phase bilayer and slightly rigidifies the fluid phase bilayer. The softening was derived to result from interactions between β -aescins (charged) sugar group with DMPC’s zwitterionic headgroup, similar to the softening effect of non-steroidal anti-inflammatory drugs (NSAIDs) [35]. The rigidification was derived to result from the insertion of β -aescin’s stiff triterpene backbone into the fluid-like bilayer, similar to the stiffening effect of cholesterol [36].
In this work concentrations > c m c ( β -aescin) are used. In a recent study with X-rays and neutrons at small angles (SAXS/SANS) on the same samples, bicelle (or nanodisk) shape was confirmed for the samples with 10 mol% (E100) to 30 mol% (E300) at 10 C. Nanoscale lipid disks were obtained at highest and larger structures at lower saponin contents. The final diameter of the disks ranges in the present case from 300 Å at 7 mol% to 120 Å at 30 mol% β -aescin. The β -aescin concentration is given with respect to the amount of DMPC. In the model fits to the SAXS/small-angle neutron scattering (SANS) data, β -aescin molecules were taken into account in the form of a rim around the bilayer [37]. However, while the model fits and the data were in excellent agreement, some of the parameters lead to the discussion of possible interaction or insertion of some saponin molecules into the bilayer part, especially at β -aescin contents above 20 mol%. Between 20 and 30 mol%, the radius of the disks was found to become inferior to the bilayer thickness, thus most-likely almost fully symmetric micellar structures are present. The temperature-dependent structural evolution of these structures is subject of current analysis and was already published for slightly lower contents (up to 7 mol% [33]). However, in these unpublished data and former results, a lateral expansion of the disks is observed with increasing temperature. Conclusively, it is very interesting and important to look more closely into the structural parameters on the sub-nm scale in order to understand the expansion of the disks into sheets. This process implies modifications in the solubility of the surfactant molecules in the lipids and a changing rim line tension [38].
The phase behaviour of the β -aescin-DMPC mixtures can be modified through the addition of additive molecules, such as the steroid cholesterol (Figure 1c) [32] or the NSAID ibuprofen (Figure 1d) [31]. Cholesterol is one major compound in mammalian cells and its concentration can be as high as 50% in lipid bilayers [39]. Ibuprofen is a freely available and frequently consumed drug. Moreover, in the public opinion, ibuprofen is seen as rather harmless medication so that consumption of higher amounts frequently occurs; also together with other drugs or for example, plant-based supplements such as β -aescin based dietary components.
In addition to the biological relevance, these two molecules are known to interact with different parts of the phospholipid molecule allowing for an interesting comparison of molecular interactions. Cholesterol is known to incorporate in a ’vertical’ manner in the hydrophobic part of the bilayer interacting with hydrophobic chains of the lipid and ridigifying the bilayer [36,39]. Thereby, the ordering of the lipid chains is disturbed and also the cooperative phase transition of the lipid chains is broadened [39]. Ibuprofen is known to interact with the lipid hydrophilic headgroups from the inside of the bilayer, as shown by Boggara et al. with contrast-variation small-angle neutron scattering (SANS) experiments [35,40]. In such experiments, parts of the molecule are contrast matched with the solvent, that is, for example the tails of DMPC become invisible for the neutrons and location of the drug molecules becomes precisely visible.
The specific interactions of those additives (cholesterol and ibuprofen) were elucidated at similar environmental conditions in the presence of β -aescin at concentrations close to or below c m c ( β -aescin), that is, at lower β -aescin concentrations as presented in this article [31,32]. It is known that β -aescin and cholesterol molecules form strong complexes in lipid environment [32,41,42]. On larger length scales, deformation and aggregation between adjacent bilayers in the form of for example, vesicles dominates the structural picture. β -Aescin and ibuprofen have similar effects on the structural parameters of the bilayer. Nevertheless, ibuprofen was found to reduce the membrane disrupting effect of β -aescin and generally reducing aggregation between bilayers. Both compounds modulate the thermotropic behaviour and the nature of phase segregation, as studied for both systems by means of DSC [31,32].
The scope of this article is to investigate the impact of the additives cholesterol and ibuprofen on the molecular scale structural parameters of DMPC- β -aescin assemblies with β -aescin concentrations above c m c ( β -aescin). In this work, especially the correlation between the kind of additive and the phase state of the lipid will be established. The study is conducted by using wide-angle X-ray scattering (WAXS) at temperatures between 10 and 50 C covering all phase states (‘gel’ (L β ) and ‘fluid’ (L α , liquid crystalline)) of DMPC and different β -aescin concentrations. First, the article discusses modifications of shape of the WAXS diffraction patterns and later of structural parameters and melting conditions. WAXS covers the short-range order including partitioning at the molecular scale, while the long-range order (via small-angle scattering), thermodynamics (differential scanning calorimetry), and visual observation of the samples were subject of former works as described above [31,32,37].

2. Materials and Methods

2.1. Chemicals

β -aescin (>95%, CAS 6805-41-0, C 55 H 86 O 24 , M = 1131.269 g/mol), 2-(4- isobutylphenyl) propanoic acid (ibuprofen, ≤98%, CAS 15687-27-1, C 13 H 18 O 2 , M = 206.28 g/mol), cholesterol (≤95%, CAS 57-88-5, C 27 H 46 O, M = 386.65 g/mol), and chloroform were purchased from Sigma Aldrich (Munich, Germany). 1,2-dimyristoyl-sn-glycero-3-phosphocholine (DMPC) was purchased from Lipoid GmbH (>99%, Ludwigshafen, Germany). The samples were prepared in a 50 mM phosphate buffer solution at pH 7.4 with purified water (Sartorius arium VF pro, Göttingen, Germany).

2.2. Sample Preparation

DMPC and ibuprofen or cholesterol powder were mixed and dissolved in chloroform. The chloroform was slowly evaporated in a rotary evaporator and the dry lipid film stored over night at 60 C for complete chloroform removal. The lipid film was hydrated with an aqueous β -aescin solution with phosphate buffer (50 mM, pH 7.4) in the final aescin concentration. The samples were treated by five freeze-thaw cycles in liquid nitrogen and warm water. The pure DMPC (and aescin-free) sample was transformed into small unilamellar vesicles (SUVs) by extrusion (21×, extruder from Avanti Polar Lipids Inc., Alabaster, AL, USA) through polycarbonate membranes with a pore diameter of 500 Å (Whatman, Avanti Polar Lipids Inc.). The phospholipid mass concentration was w = 15 g·L 1 . Apart from the pure DMPC SUVs for WAXS, the investigated aescin contents x aescin range from 10–30 mol% and are defined with respect to the lipid and saponin concentration in solution ( x aescin = n aescin / ( n DMPC + n aescin + n IBU / Chol )). In the manuscript, sample names are abbreviated. Thereby, the capital letters E, C, and I denote aescin, cholesterol, and ibuprofen, respectively. The concentrations are indicated by full numbers whereby the last digit indicates the first decimal and so on. Hence, a sample with 10 mol% cholesterol and 20 mol% aescin is named as follows: C100_E200.

2.3. Wide-Angle X-ray Scattering

The insertion of larger bio-molecules and pharmaceuticals causes dramatic changes in the structure and ordering of lipids, the building unit of biological membranes. WAXS is able to reveal such structural modifications on the sub-nm scale through the position and shape of the acyl chain correlation peak with its peak maximum at q peak [43]. The distance ( d WAXS ) between the hydrocarbon chains of the lipid molecules results from the inverse relationship between the peak maximum of the correlation peak and the acyl chain correlation distance (Equation (1)) and is schematically depicted in Figure 2.
d WAXS = 2 π q peak .
In lipid bilayers, the area per lipid ( A L ) results from the two-dimensional packing of the phospholipids. In the case of DMPC, that is, below T m , and especially at 10 C, the phospholipids are in their gel state (L β ) and are packed in a hexagonal lattice. Equation (2) relates then the position of the acyl chain correlation peak with A L .
A L = 16 π 2 3 q WAXS 2 .
Above T m , the lipids are more randomly packed (right scheme in Figure 2) and A L can vary from a hexagonal lattice [43,44]. Therefore, in the following, only d WAXS values are discussed in order to guarantee phase state-independent comparability of the results. Moreover, this allows also to discuss the results from temperatures where the lipids are not in well defined phase states (e.g., close to T m ). A detailed description of DMPC’s gel phase structure as determined by wide-angle X-ray diffraction was reported by Tristam-Nagle et al. in Reference [44]. These authors report an area per lipid of 47 Å 2 for DMPC at around 10 C.
WAXS experiments were performed between 10 C and 50 C ( Δ T = 5 C with a heating rate of 20 C/min). The samples were measured in a flow-through Kapton capillary (1 mm, GoodFellow GmbH, Bad Nauheim, Germany) in a Linkam stage (Linkam Scientific, Tadworth, UK). WAXS experiments were performed at the ID02 beamline at the ESRF synchrotron in Grenoble, France [45]. The data were recorded with a CCD Rayonix LX-170HS detector at a sample-to-detector distance of 0.12 m and a wavelength of 1 Å. Recording time was 25 × 1 s (for DMPC SUVs 10 × 1 s) and the reduced curves were averaged. Initial data treatment was done using the beamlines data reduction program package [46]. The sample scattering was normalized with respect to incident intensity, sample thickness, acquisition time, transmission and background and was brought to absolute scale using water. Moreover, a constant background was subtracted for better visualization of the data. In scattering experiments, the intensity I ( q ) amounts to I ( q ) = N ( Δ ρ ) 2 V 2 P ( q ) S ( q ) and depends on number of particles (N), particle volume (V), contrast in the form of the X-ray scattering length density differences (XSLD; Δ ρ = ρ particle ρ solvent ), particle form factor ( P ( q ) ) and structure factor ( S ( q ) ). The scattering vector magnitude is defined as q = 4 π / λ sin ( θ ) at a scattering angle of 2 θ .

3. Results and Discussion

Temperature-dependent WAXS diffraction patterns of DMPC bilayers with β -aescin (10–30 mol%, E100-E300) and additional ibuprofen (10 mol%, I100) or cholesterol (10 mol%, C100) are shown in Figure 3.
The temperature is varied between 10 and 50 C in steps of 5 C covering temperatures around the main phase transition temperature T m (DMPC) ≈ 23.6 C [30]. The effect of higher cholesterol contents is discussed later.
Below T m , phospholipid molecules are tightly packed and exhibit a hexagonal ordering (see left drawing of Figure 2b) in the rigid L β ‘gel’ phase. Above T m the acyl chains undergo a conformational transition from all trans to partially gauche configuration leading to the more disordered arrangement of lipid molecules and the flexible fluid L α phase of DMPC is reached (see right drawing of Figure 2b). When increasing the temperature from below to above T m , coexistence of both phases is expected at temperatures close to T m . The ordering of the lipid molecules determines the shape of the WAXS diffraction signal, that is, the acyl chain correlation peak [43]. A narrow distribution is observed in the L β where lipid chains are tightly packed. This signal suddenly broadens at T > T m , representing the rather broadly distributed distances between lipid molecules at fluid-like conditions. In the case of DMPC this transition occurs at temperatures above 25 C (Figure 3a). Therefore, variations in the shape of the WAXS diffraction patterns indicate structural modifications in the systems whereas q-values are correlated with the real-space distances by Equation (1).

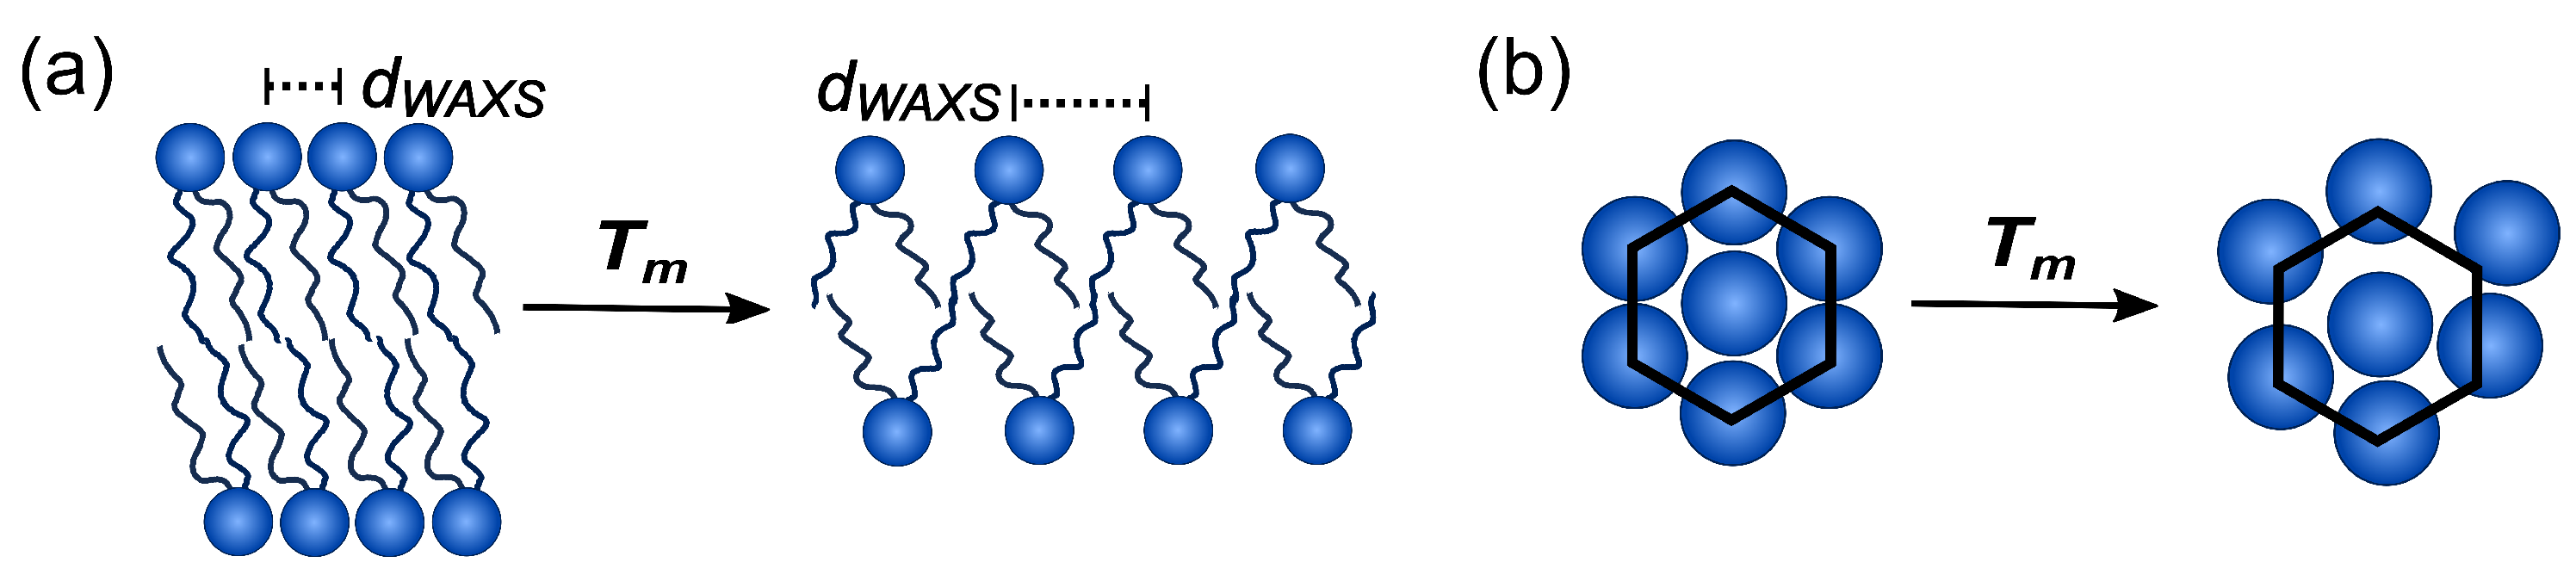
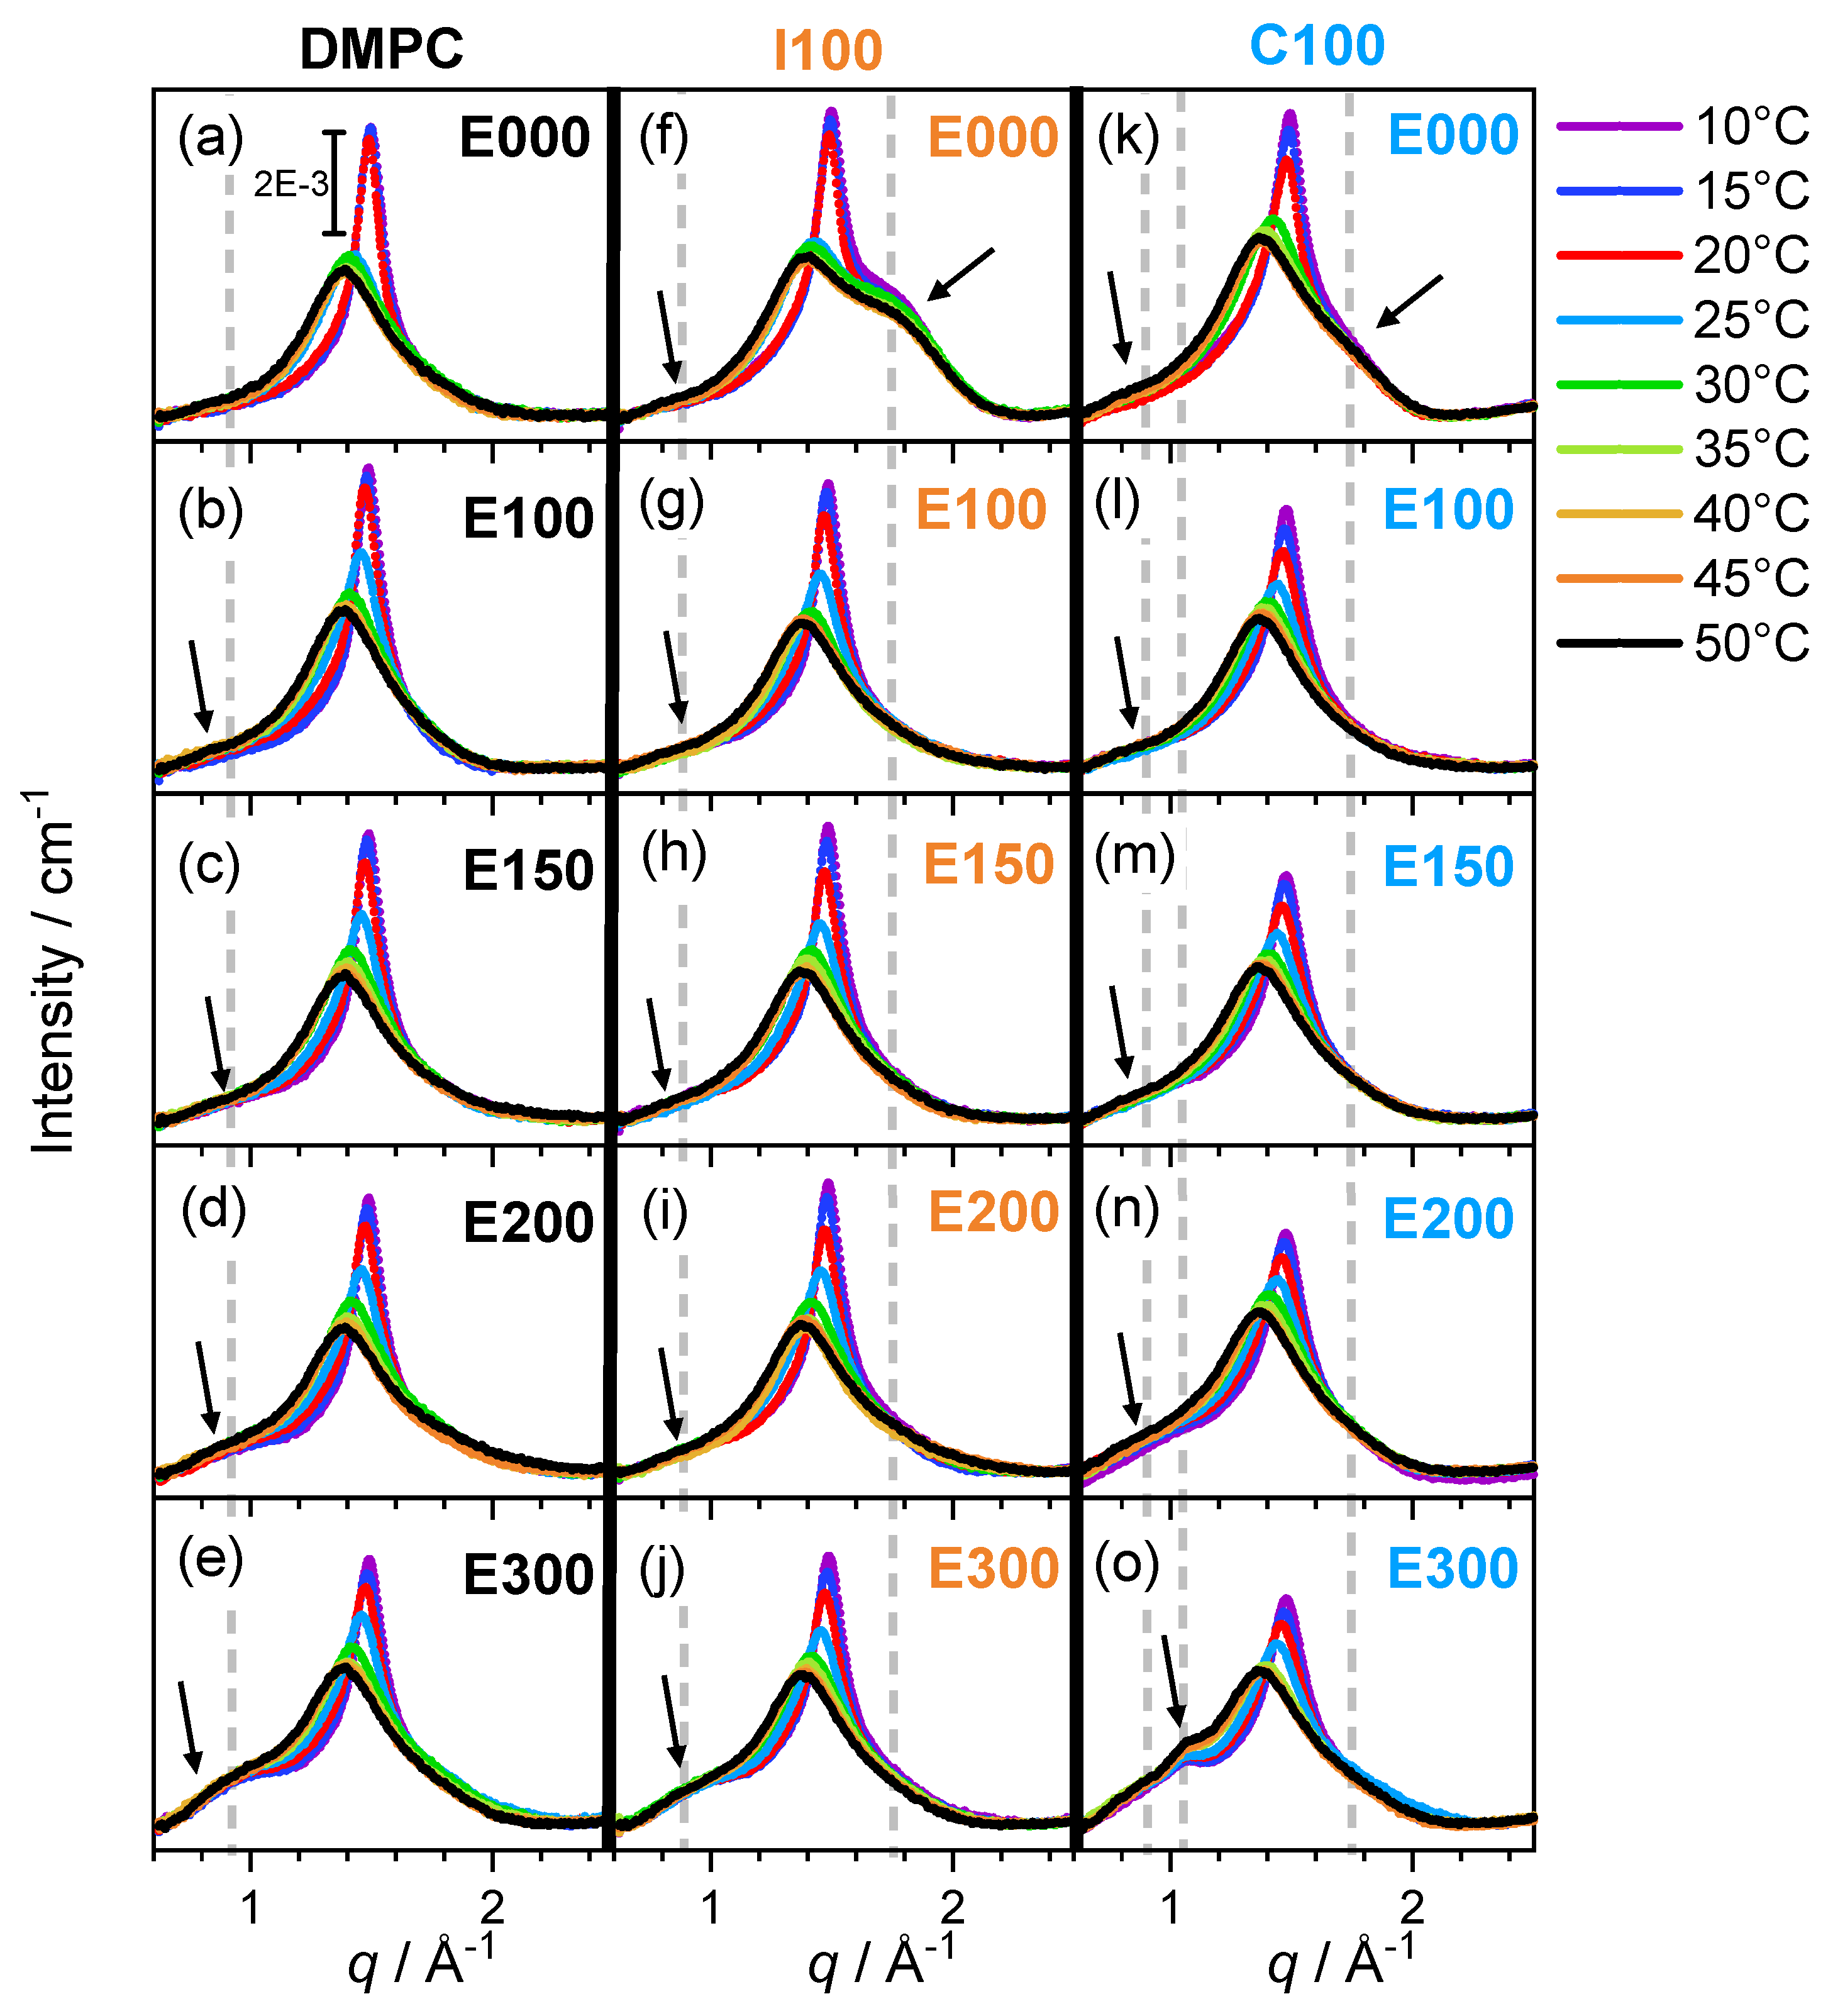
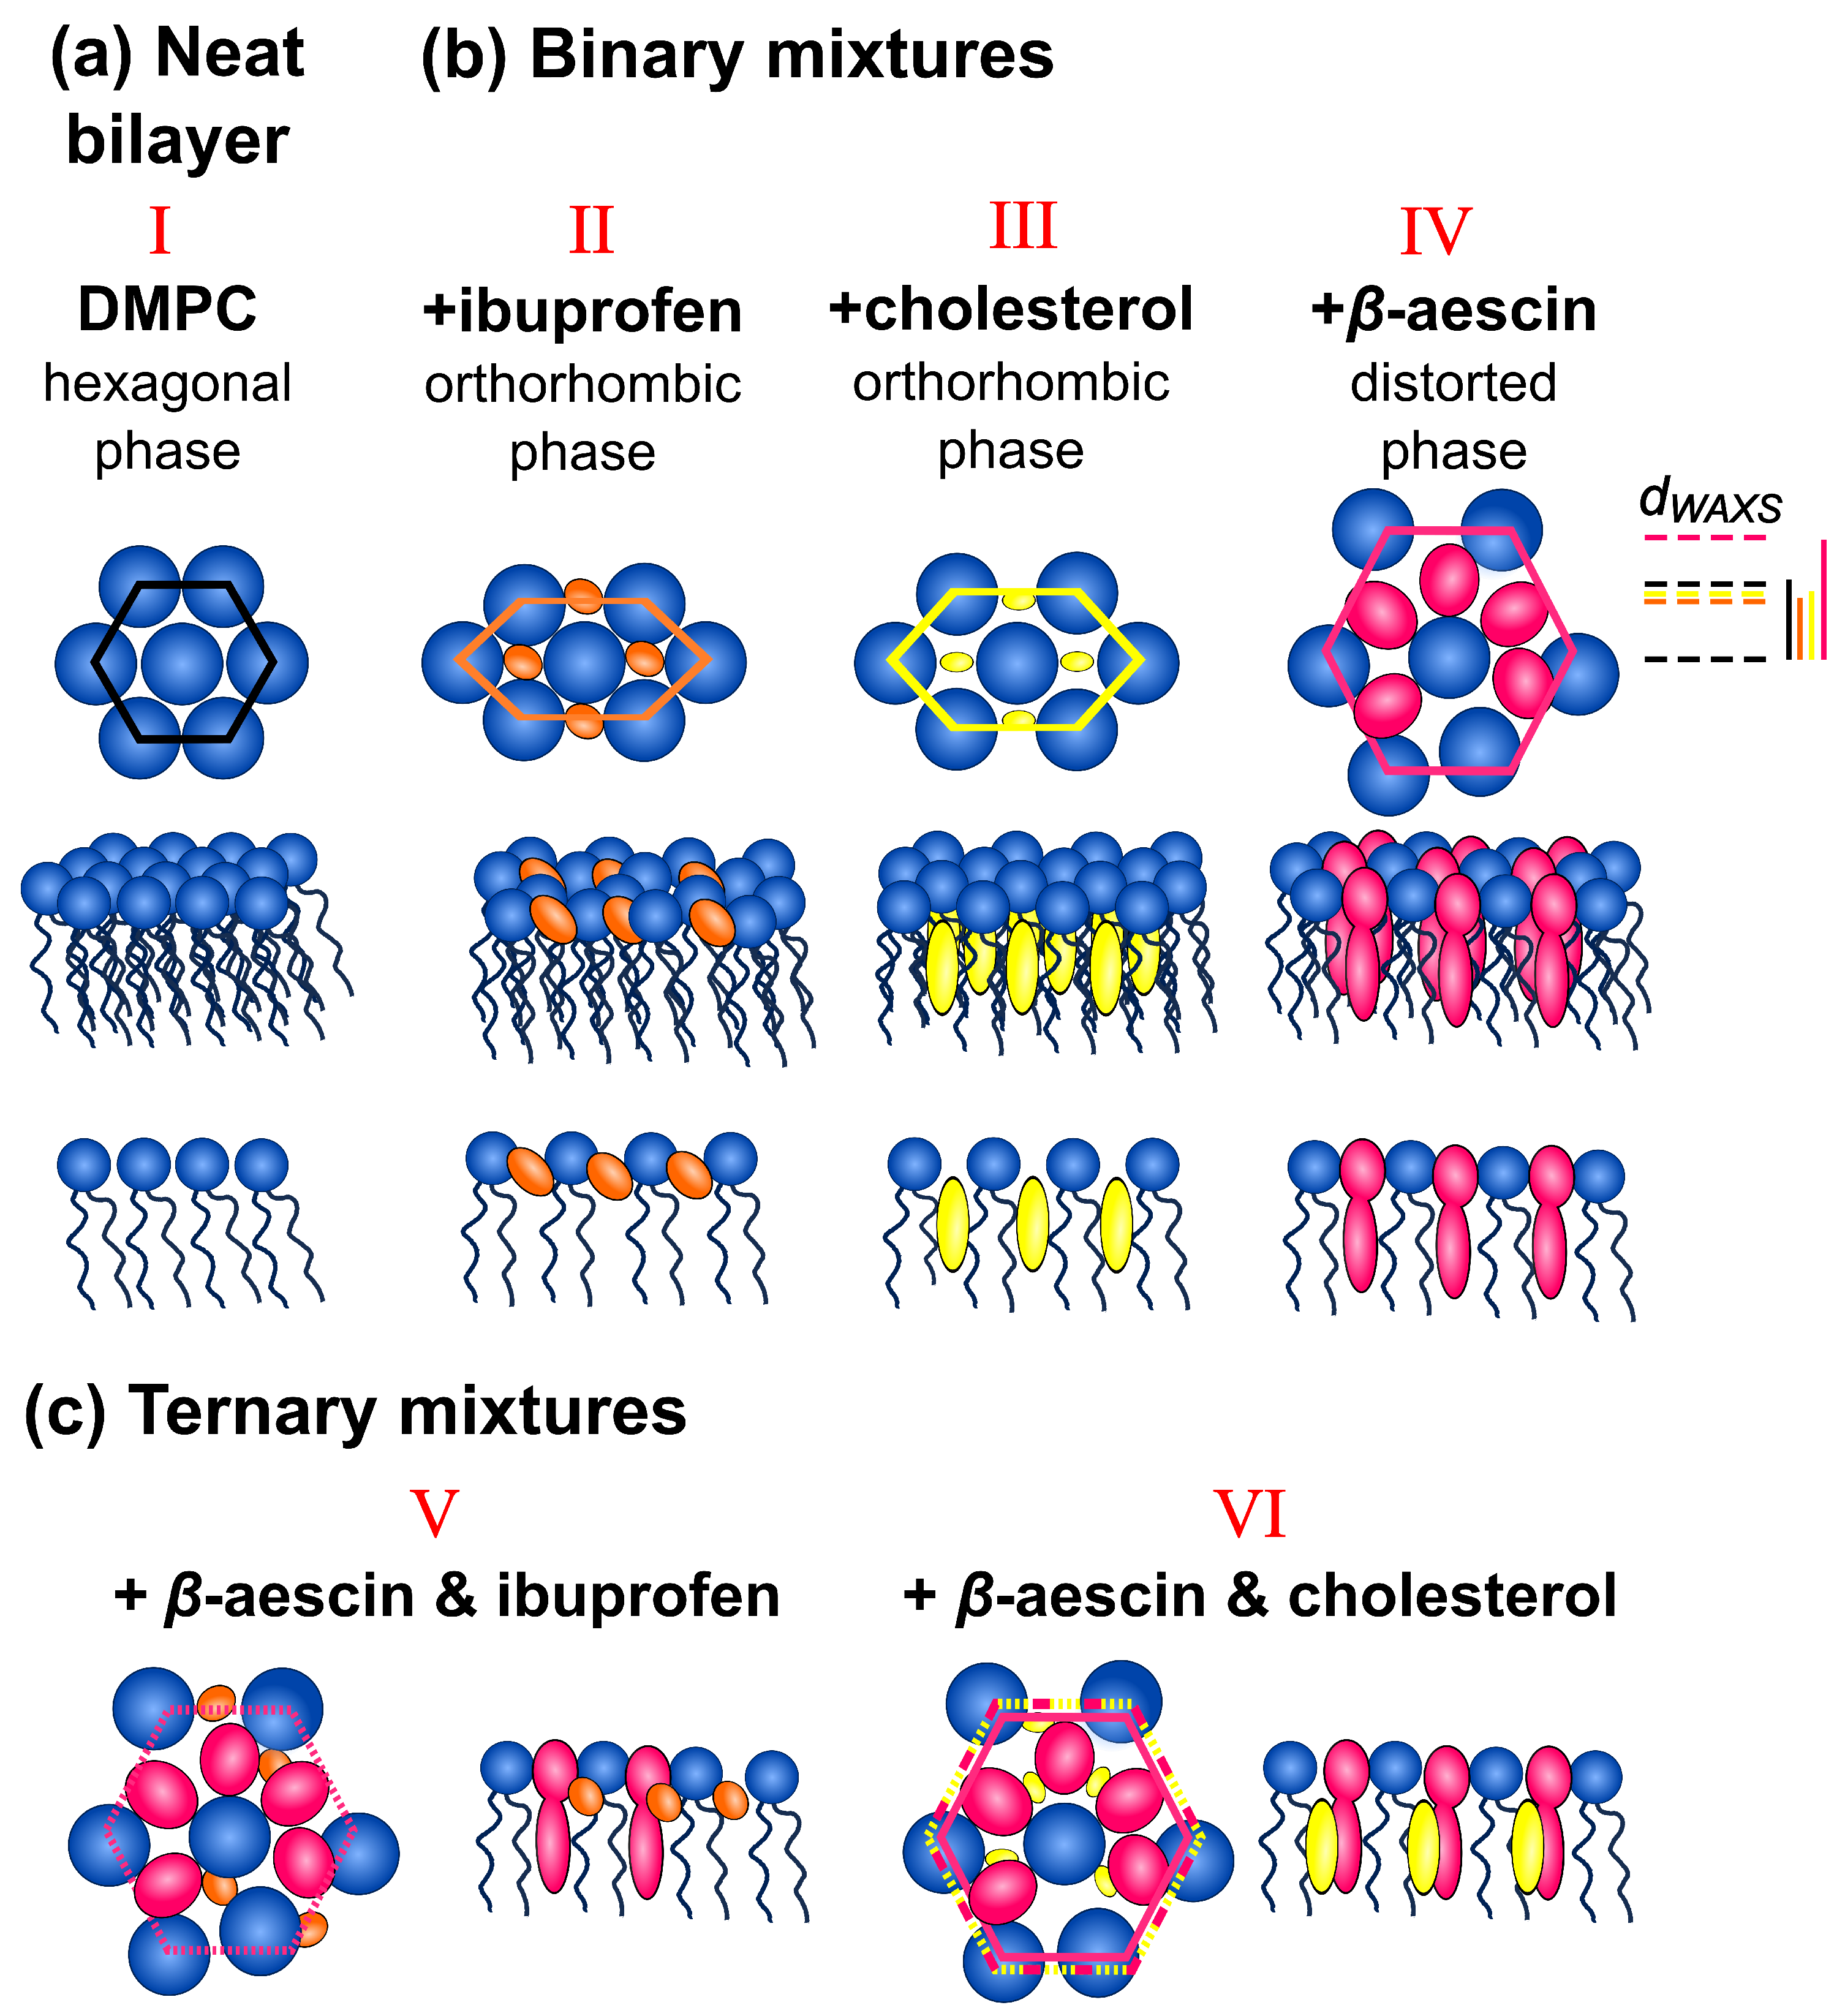
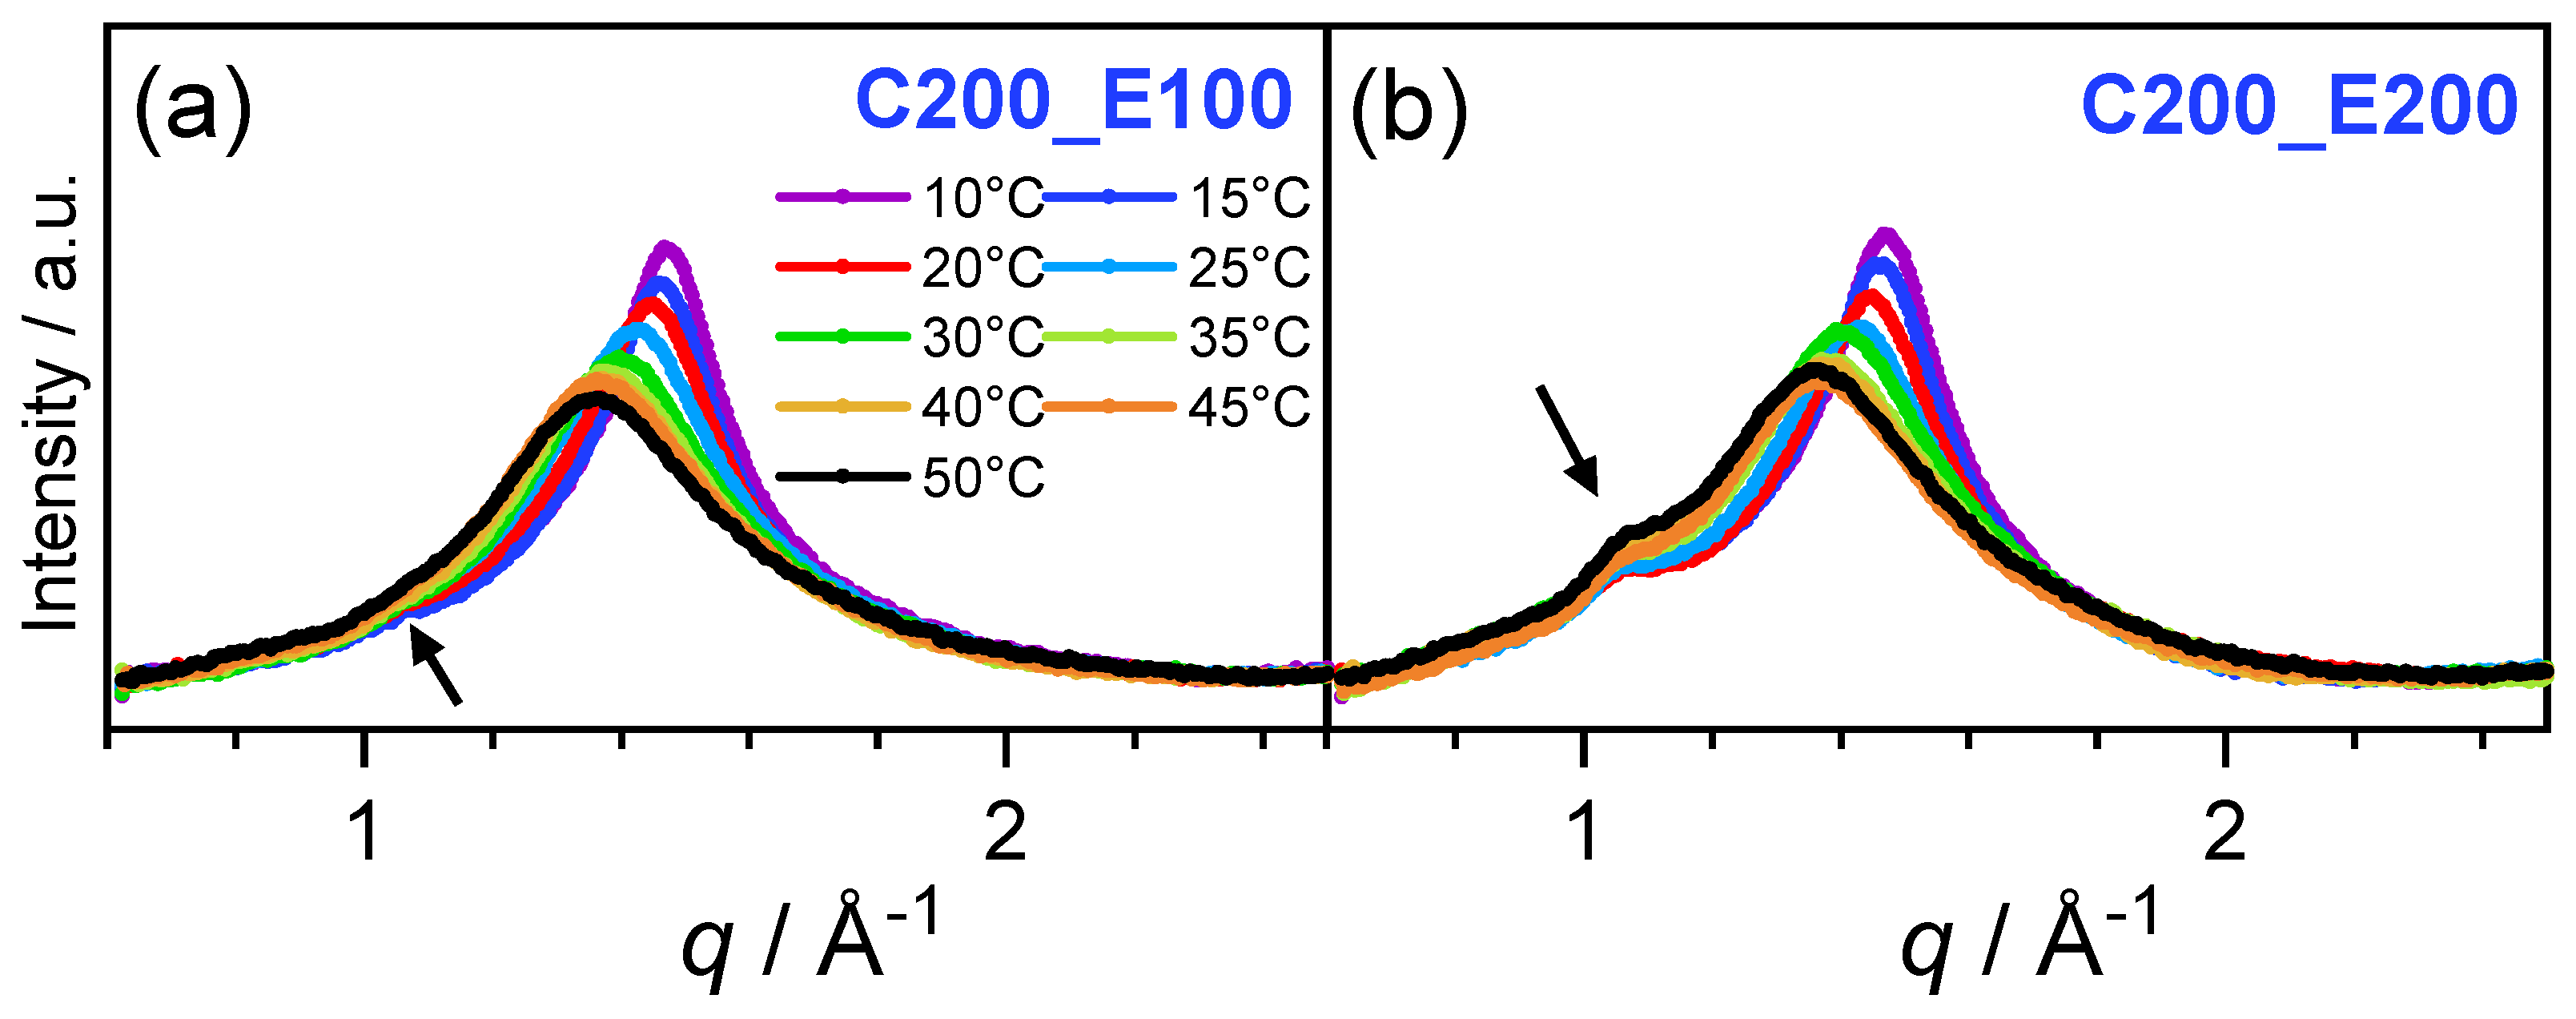
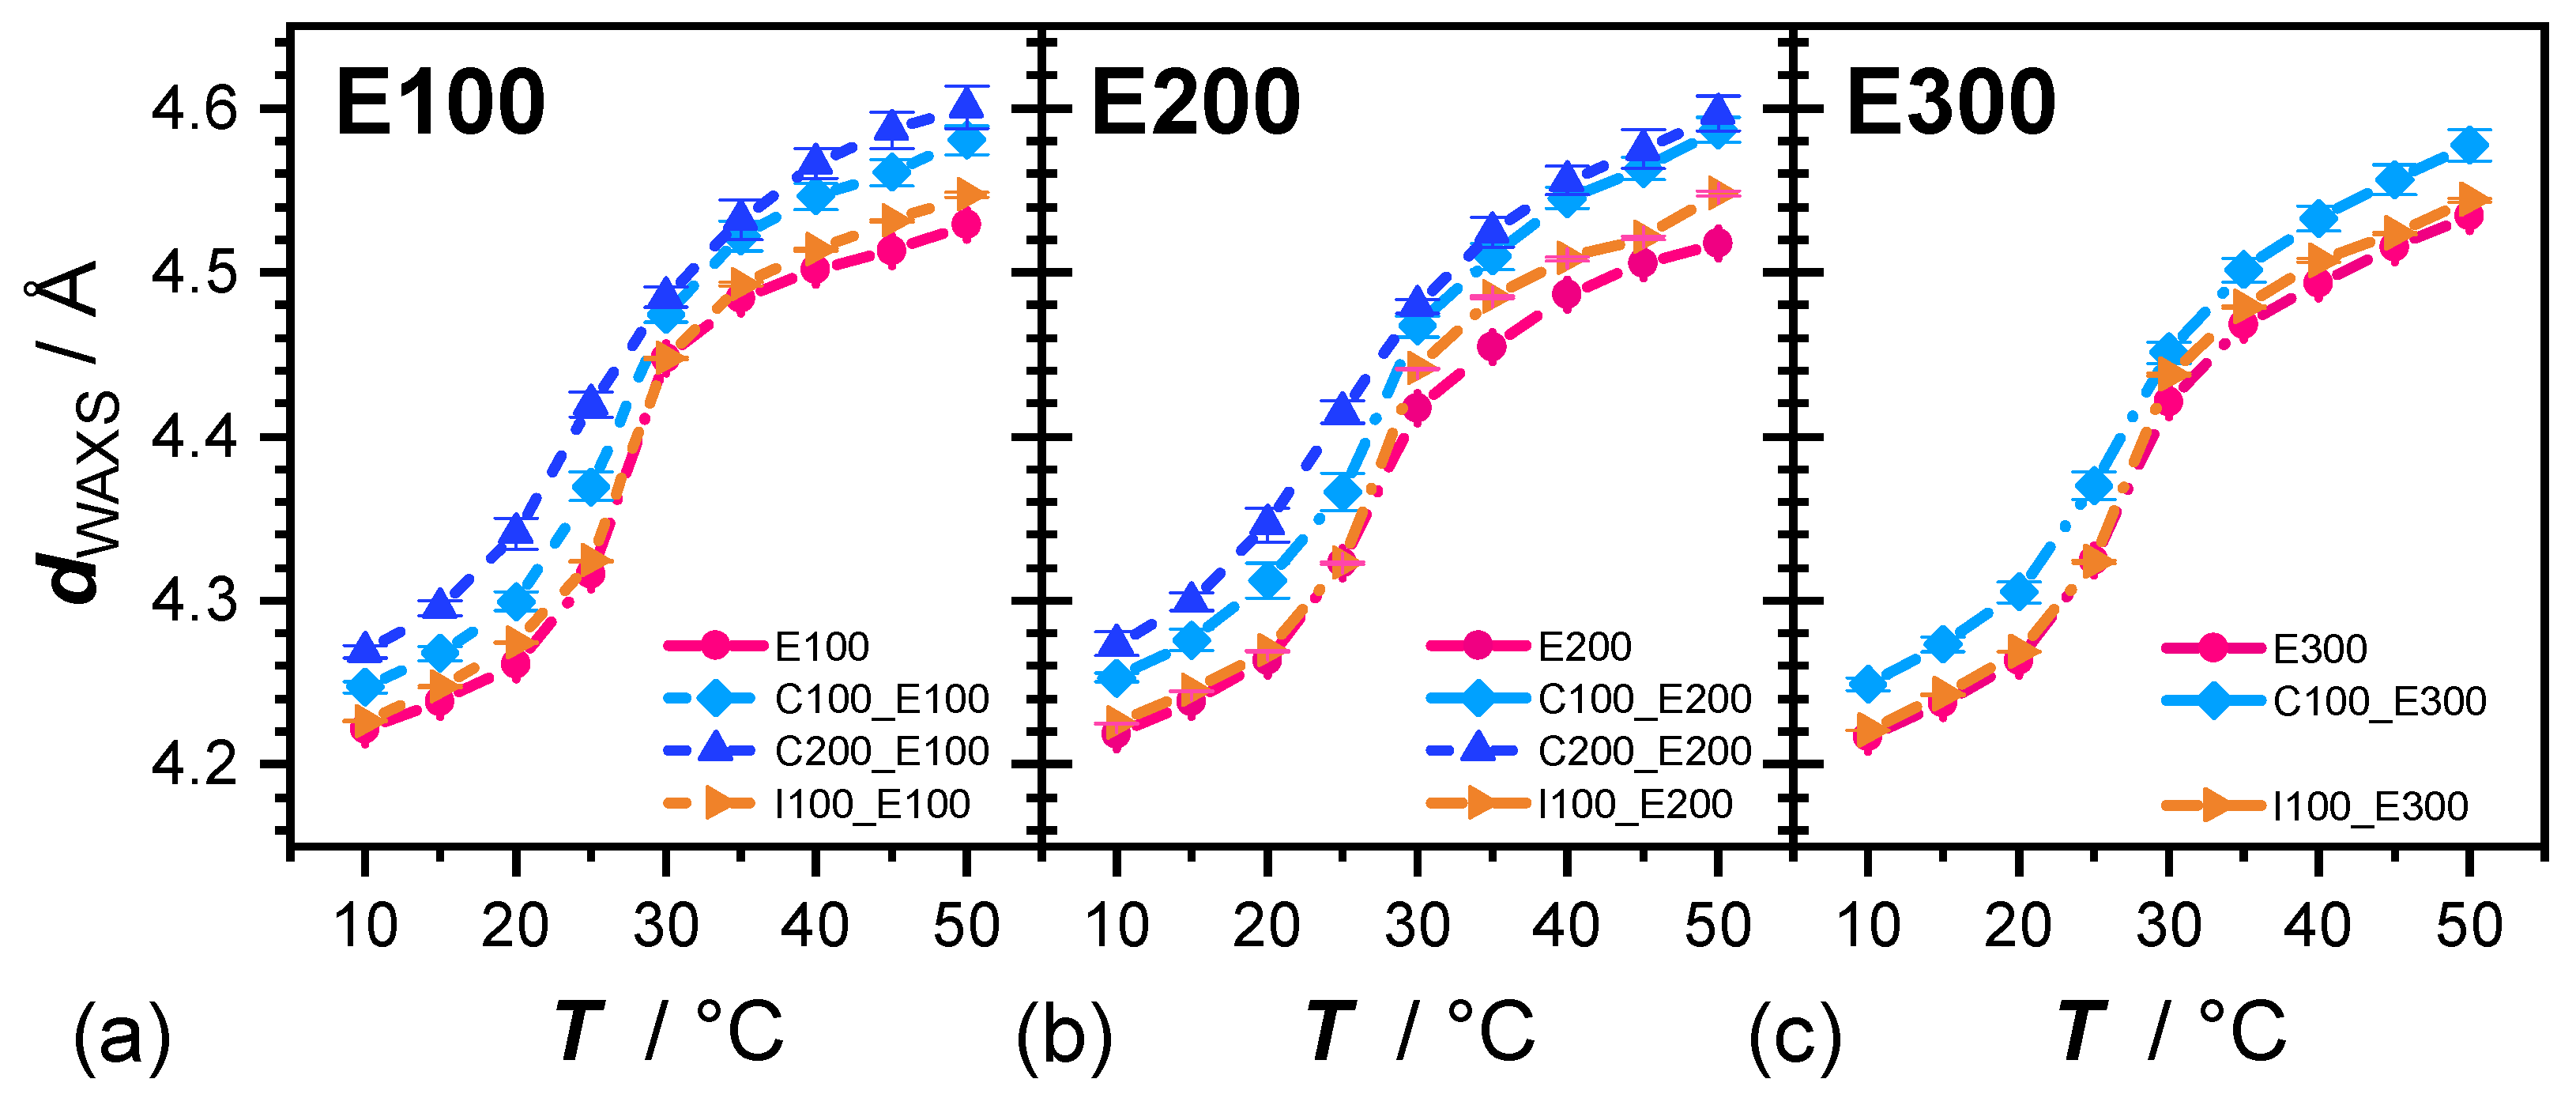
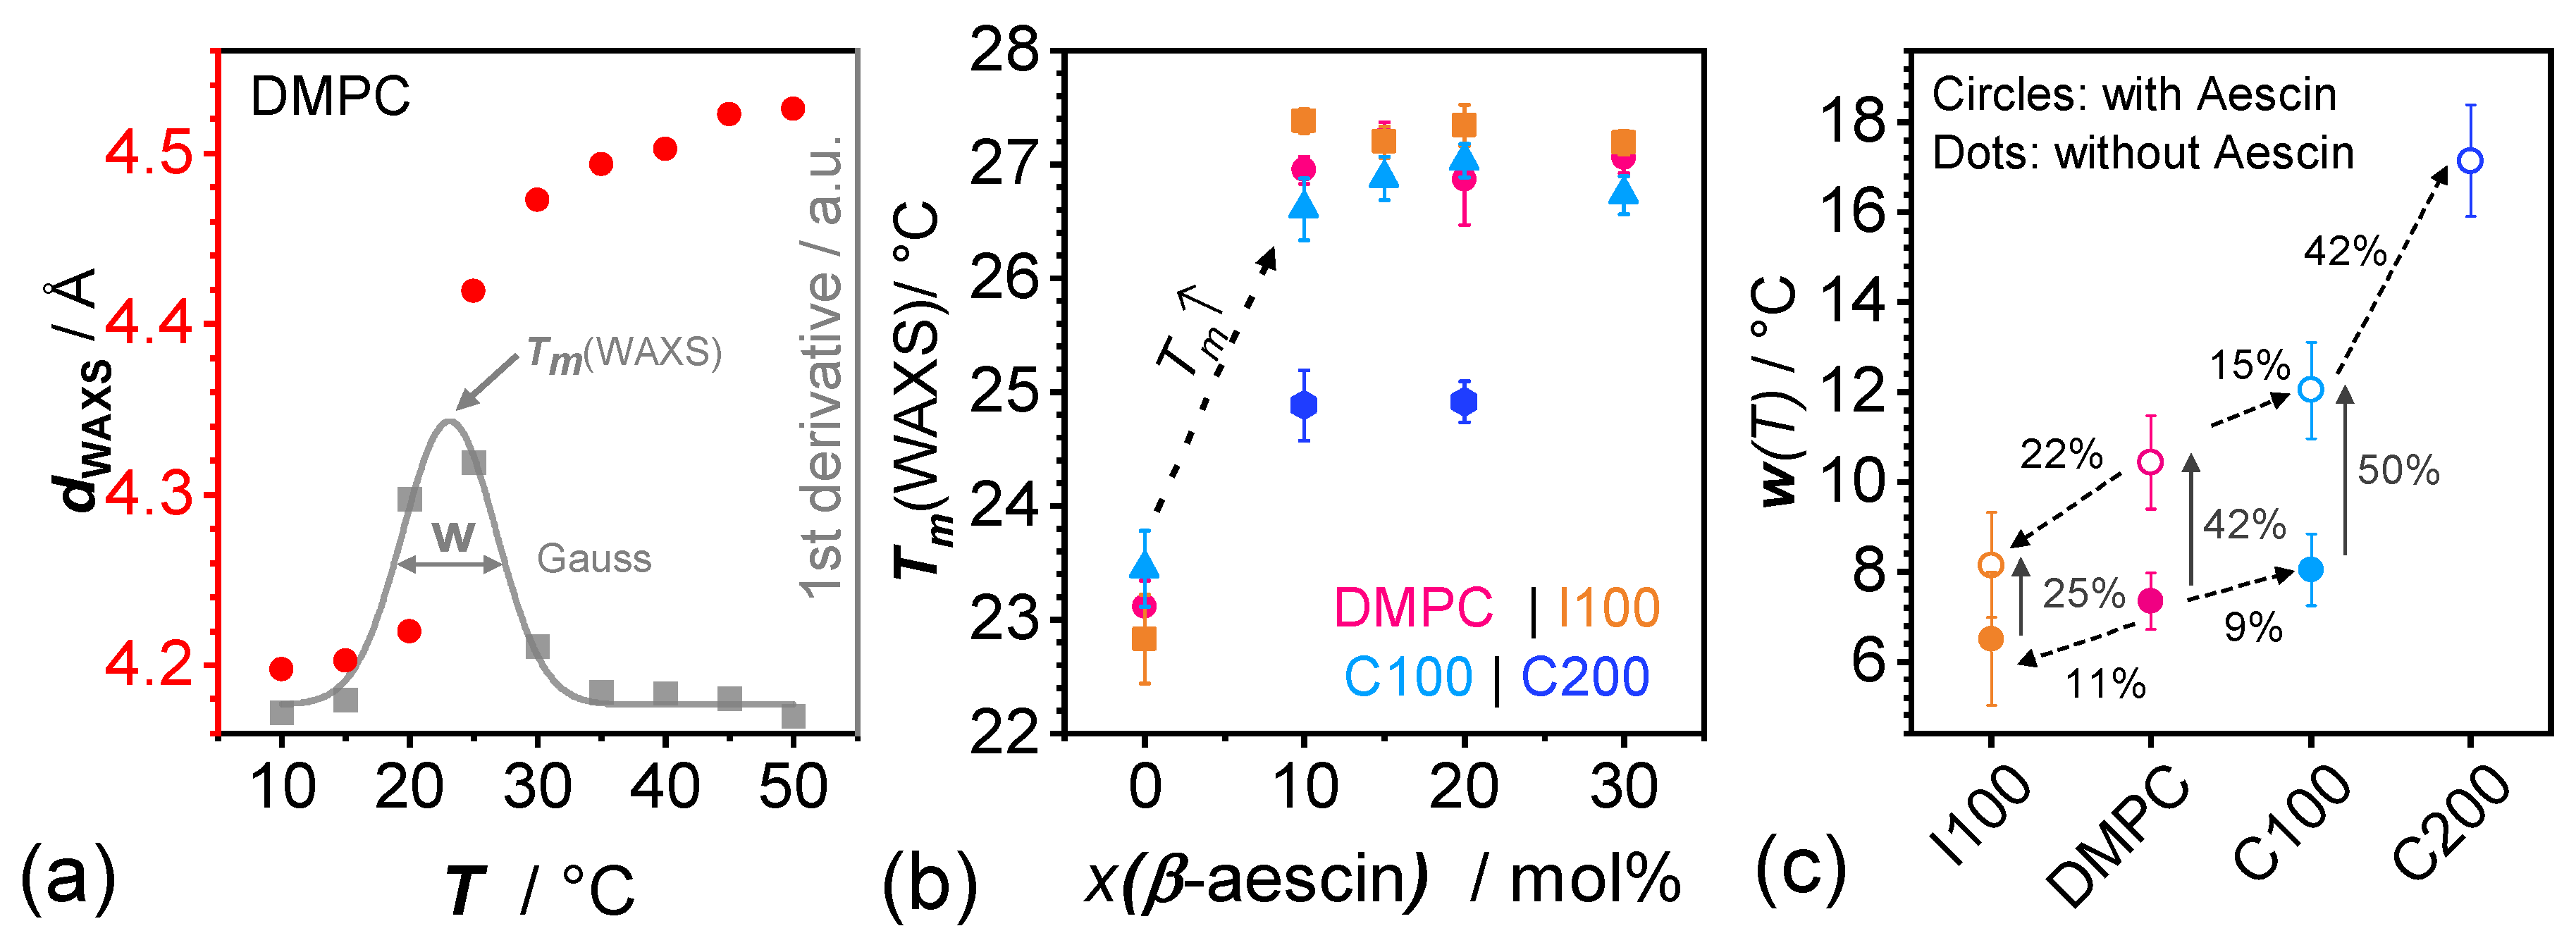
3.1. Shape of the WAXS Diffraction Patterns at Different Temperatures and Composition

In Figure 3, WAXS graphs are grouped in vertical arrangement as function of β -aescin content and the horizontal arrangement for the same β -aescin content but different additive for better comparability. The most symmetric patterns are obtained for the additive-free DMPC system where a homogeneous lateral distribution of lipid molecules and symmetric peaks are expected and confirmed for all temperatures.
The presence of β -aescin causes a shoulder in the WAXS curves (black arrows in panels (a)–(e)) at lower q-values, that is, larger distances. This shoulder between 0.8–1 Å 1 increases in intensity with rising β -aescin content and is clearly visible above 20 mol% of β -aescin and appears to be independent of temperature. Such a shoulder in the data gives rise to the assumption of phase segregation and formation of two separate phases by DMPC and β -aescin molecules. While the exact composition of the second phase is not known from this data or corresponds to a disturbed hexagonal phase, the peak maximum gives rise to a molecular spacing of around 6 Å. This phenomenon was already previously briefly discussed for a β -aescin content of 6.5 mol% [30] and is now confirmed for β -aescin contents far above the c m c . A possible disturbance of the hexagonal phase by β -aescin is shown schematically in Figure 4b (phase IV) compared to the neatly ordered hexagonal DMPC bilayer in Figure 4a (phase I). Here, it must be assumed that phases I and IV coexist within the bilayer. In addition to this, at these β -aescin concentrations curvature effects may contribute since in in the nanoscale bicelles, the radius becomes inferior to the bilayer thickness above 20 mol% [37].
In the following, the binary β -aescin-DMPC system is compared to the ibuprofen loaded (I100) ternary system in the middle column of Figure 3. In the β -aescin free system (panel f, E000), a shoulder at higher q is found (see arrow) at around 1.75 Å 1 . From the WAXS perspective, the distortion of the ordering of the lipid head groups and chains in the DMPC bilayer by the ibuprofen molecules as reported by Boggara et al. [40] leads to a modified WAXS signal and modifies the molecular ordering of the DMPC molecules. Ibuprofen increases the headgroup volume allowing the lipid acyl chains arrange in an orthorhombic arrangement instead of the tightly packed hexagonal phase, as indicated schematically in Figure 4a,b. When β -aescin is added, this packing is reversed by increasing the tail volume which shows in the disappearing peak at around 1.75 Å 1 and again, a shoulder at lower q forms between 0.8–1 Å 1 , similar to the corresponding binary β aescin-DMPC system. It becomes obvious that the effect of β -aescin dominates the interaction with DMPC’s phosphocholine groups and the packing of the DMPC acyl chains as depicted on the left of Figure 4c. Nevertheless, besides the packing effects, both molecules ( β -aescin and ibuprofen) carry a carboxylic group (see Figure 1) and are deprotonated at the present pH of 7.4. Therefore, we do not expect strong complexation of these molecules but rather similar interactions with the lipid bilayer and especially with the zwitterionic phosphocholine head group of DMPC. However, it cannot be excluded that both molecules interact through the hydrophobic parts (e.g., phenol group of ibuprofen with the double bond located at β -aescins triterpene backbone).
A more interesting pattern is observed for the cholesterol-containing system (panels (k)–(o) in Figure 3 for 10 mol% and Figure 5 for 20 mol% cholesterol).
Here, cholesterol similar to ibuprofen causes formation of a shoulder at larger q-values (around 1.8 Å 1 ) in the WAXS diffraction pattern (see arrow in panel (k) and dashed grey line). This shoulder also is caused by the incorporated cholesterol molecules in the bilayer distorting the homogeneous order of the lipid molecules. From these results it is expected that cholesterol increases the volume of the hydrophobic chains allowing for arrangement of the acyl chains of DMPC in a orthorhombic structure. This is schematically depicted in phase III in Figure 4b. Addition of β -aescin reverses this effect through complexation between β -aescin and the cholesterol molecules and additionally increases the headgroup volume (see phase VI in Figure 4c). The complexation is known for other saponin molecules and β -aescin [32,42,47] From the sharpness of the peaks in the WAXS patterns it becomes visible that the complexes formed may have crystalline character, form at highest β -aescin (see arrows in panel (o) in Figure 3 for 30 mol%) and higher cholesterol contents (see arrows in Figure 5) and are independent of temperature. From the location of the peak maximum, the spacing of the lipids around these structures can be approximated to ≈6 Å from the peak position. From these results it can be concluded that higher amounts of the steroid enhance the formation of complexes. Additionally, this effect increases with rising saponin content. Nevertheless, the exact morphology of this crystal-like phase seeks investigation by microscopy for final proof. The almost equal elevation of T m and broadening of the phase transition for all samples implies again, that β -aescin dominates phase behaviour on the molecular level. Also, especially the elevation of T m suggests attractive interactions between inserted molecules and the phospholipid hydrocarbon chains.

3.2. Evolution of d W A X S with Temperature and Composition and Impact of the Composition on the Cooperative Phase Transition of the DMPC Bilayer

Besides the shape of the diffraction signal, also the peak maximum shifts with temperature for all curves. With increasing temperature, the peak maximum ( q WAXS ) shifts to lower q-values, that is, to larger distances d WAXS . The evolution of d WAXS is discussed for the different systems investigated and the values are summarized for each of them in Figure 6.
The pure DMPC bilayer (black symbols in panel (a)) exhibits a sharp phase transition with temperature: when T m of DMPC is crossed, d WAXS increases and represents a loser packing of the phospholipids in the lipids fluid phase compared to the gel phase. A L for the DMPC sample results to 40.7 Å 2 at 10 C and to 47.3 Å 2 at 50 C when calculated by Equation (2). Addition of β -aescin modifies this evolution of d WAXS with temperature. The most prominent features of β -aescin’s impact are highlighted by numbered arrows in the figure. The first one (arrow 1) becomes visible at ‘gel’ phase temperatures below 25 C. Here, d WAXS values are slightly larger compared to those of DMPC and are almost constant for all β -aescin containing samples. Thus, from these results it can be assumed that complete phase separation of saponin and lipid molecules in the bilayer does not occur. A complete micro-phase separation of lipid and saponin molecules would lead to the same d WAXS values as for pure DMPC bilayers. Thus, it is assumed that β -aescin molecules partially mix with DMPC molecules in the bilayer part. However, this assumption is only sparsely proven by these experiments and seeks confirmation by for example, contrast variation experiments with neutrons, where DMPC molecules are contrast matched. When DMPC is contrast matched, that is, invisible for the neutrons, only the distribution of β -aescin molecules is visible revealing homogeneous or island-like distribution in the bilayer. However, the deviation of the E100 to E300 samples is most pronounced around T m of DMPC (arrows 2 and 3), that is, between 20 and 40 C. Here, it becomes visible that the temperature-driven phase transition is smoother when crossing T m (DMPC). Interestingly, at fluid-phase DMPC and only far above T m , the same d WAXS values are obtained for DMPC and the samples E100, E200, and E300. Thus, we assume that β -aescin molecules are mixed more efficiently with DMPC molecules, that is, that β -aescin molecules are distributed more homogeneously within the bilayer. This is in concordance with our earlier results from dynamic experiments with NSE where most prominent impact of β -aescin was found in gel phase and lowest impact in fluid-phase DMPC bilayer.
The comparison of the results of the binary DMPC- β -aescin mixtures (Figure 6a) to those for the samples with additional 10 mol% ibuprofen (Figure 6b) or cholesterol (Figure 6c), highlights even more the strong impact of β -aescin on the evolution of the structural parameters of these samples. In addition, the different interacting properties of both additives becomes visible:
Ibuprofen (I100 sample) has most prominent impact at T > 25 C by reducing the average spacing between DMPCs acyl chains and head groups in the fluid state. This occurs through ibuprofen-headgroup interactions from the inside of the bilayer [40]. In the gel state, no significant effect of ibuprofen is observed. Additional β -aescin in these samples at different concentrations (I100_E100, etc.), again leads to d WAXS values similar to those of the additive-free samples in panel (a) and also the d WAXS reduction in the fluid phase is reversed. This indicates competing or synergistic interactions of ibuprofen and β -aescin with the DMPC model membrane.
Cholesterol (C100 sample) increases d WAXS -values at both well-defined phase states (gel ( T < 20 C) and fluid ( T > 30 C)) through incorporation of the stiff steroid backbone into the bilayer. At temperatures close to T m (20–30 C), no clear effect is visible probably because of the inhomogeneous phase state conditions. Additional β -aescin (C100_E100, etc.) again dominates the structural picture whereas, in this case, largest d WAXS -values in the fluid phase correspond to the ones found for samples containing cholesterol. This confirms the complex formation between β -aescin and cholesterol in lipid bilayers. This effect is already presented in the literature [32,41] and is consistent with our results.
In order to obtain a clearer picture of the combined effect of ibuprofen or cholesterol with β -aescin on model membranes, d WAXS -values at constant β -aescin content are compared to each other (Figure 7).
The comparison of d WAXS -values at constant β -aescin content highlights the impact of the added species on the structural parameters on the sub-nm scale. The figure highlights that at every β -aescin concentration, ibuprofen as well as cholesterol indeed modify the d WAXS values, as a result that was not directly visible from the plots in Figure 6. Thereby, ibuprofen shows the major impact at higher temperatures, that is, in the presence of fluid phase DMPC. These slightly increased values confirm attractive interaction between β -aescin and ibuprofen molecules. In case of cholesterol, the complexes formed between β -aescin and cholesterol lead to even higher d WAXS values at the same amount (C100) compared to ibuprofen (I100). Moreover, a higher cholesterol content (C200) leads to even larger values and this effect is observed for all temperatures, and thus phase states. Higher d W A X S -values indicate that these structures require more space within the bilayer.
In the following, the effect of the different compositions on the melting properties of the bilayer will be discussed. Therefore, the evolution of the d WAXS -values with temperature will be used in order to obtain information on T m (WAXS) (Figure 8).
T m (WAXS) is extracted from the maximum of a peak fit (Lorentzian or Gaussian, see Figure S3) to the first numerically calculated derivative of the d WAXS -values (see grey points in Figure 8a). The results on T m (WAXS) on the different composition is shown in Figure 8b. It becomes visible that T m shifts for all samples to higher temperatures upon β -aescin addition and stays almost constant for all saponin concentrations added. Thereby, no major difference is observed between the additive-free samples (only β -aescin, pink) and the ones with 10 mol% cholesterol or ibuprofen. Solely the presence of 20 mol% cholesterol leads to much lower T m compared to the other β -aescin containing samples.
The broadening of the phase transition w ( T ) is derived from the FWHM of the peak fit (Figure 8c). It provides information on the impact of the additives on the cooperative phase transition process of the DMPC molecules and describes how ‘smooth’ the cooperative phase transition proceeds with temperature. Thus, when w ( T ) is high, the temperature-driven conformational transition of the DMPC molecules from the gel to the fluid state is rather smooth compared to the ‘native’ (pure DMPC) bilayer whose transition is rather ‘sharp’ around T m .
When comparing the β -aescin-free samples (dots) to each other it becomes visible that the w ( T ) is almost constant for all samples within error-bars. When β -aescin is added, a broadening (increase in w ( T ) ) occurs for all samples. The most prominent impact occurs for 20 mol% cholesterol where w ( T ) strongly increases.
The increase of T m goes along with the broadening of the phase transition upon addition of β -aescin. Here, strong interaction between β -aescin molecules and DMPC molecules occurs, leading to a distorted arrangement of the acyl chains of DMPC. Upon this distortion and due to the proximity to β -aescins stiff triterpene backbone, the acyl chains of DMPC transition from all-trans to partially gauche conformation at already lower temperatures below T m . Above T m , on the other hand, attractive interactions between β -aescin and DMPC’s acyl chains hinder the cooperative phase transition of DMPC’s acyl chains when crossing the melting temperature of the phospholipid. Altogether, an elevated T m results when attractive interactions predominate the phase transition of DMPC’s acyl chains.
The results for T m and w ( T ) of the ternary systems show that, again, the presence of β -aescin controls the overall phase behaviour and thermotropic phase transition. The specific interaction and packing modifications (increase of either head or tail volume) induced by ibuprofen and cholesterol slightly modify these parameters. Thereby, ibuprofen mainly increasing headgroup volume, does not change T m but seems to reduce the w ( T ) . Here, probably β -aescin’s distorting effect on lipid chains becomes less important. The opposite effect is observed upon cholesterol addition which increases the tail volume and becomes more pronounced with rising cholesterol content. In this context, the bilayer is continuously fluidized resulting in a significantly lowered T m in the presence of 20 mol% cholesterol.

4. Summary and Conclusions

In this publication, we employed wide-angle X-ray scattering (WAXS) in order to discuss the effect of β -aescin on local structural parameters of a DMPC bilayer and on the cooperative phase transition of the lipid molecules on the sub-nm scale. Moreover, we showed how the additives cholesterol and ibuprofen modify these parameters and how the specific saponin-additive interactions become visible in the WAXS diffraction patterns. The study was conducted for β -aescin concentrations above its c m c and for temperatures covering both lipid phase states. From former experiments it is known that the overall structure of β -aescin-DMPC samples are bicelles (nanodisks) at gel phase DMPC [37] that grow in size with rising temperature ([33]). Data were consistent with a model of DMPC disks stabilized with a rim of β -aescin.
Here, we show that β -aescin modifies the cooperative phase transition of the DMPC molecules. The phase transition process broadens with rising β -aescin content, the main phase transition temperature T m is elevated and the acyl chain correlation distance d WAXS is impacted most prominently in the gel-phase and close to T m of DMPC. In the presence of ibuprofen, β -aescin reverses the orthorhombic lipid packing and d WAXS values at fluid-phase DMPC are slightly elevated indicating interaction between ibuprofen and β -aescin (note that both molecules are negatively charged). Cholesterol, on the other hand, is known to form insoluble crystal-like complexes with saponins such as β -aescin [42]. This effect becomes especially prominent at higher amounts of the steroid and is clearly indicated by respective peaks in the WAXS diffraction pattern. These complexes also lead to larger d WAXS values at all temperatures. Thus, depending on lipid phase state and kind of additive, partitioning at the molecular scale in the bilayers investigated occurs.
The findings in this article shall improve the overall understanding of the effect of saponins in general on the structural parameters of lipid bilayers. The findings for β -aescin can help understanding the effects of other saponins on lipid bilayers. This is relevant for application of cosmetics and pharmaceuticals on for example, human skin in the form of cremes. Also the role of β -aescin in making membranes of living cells permeable when medication is either injected or ingested orally can be better understood on the basis of knowledge of β -aescin-lipid interaction on a molecular level. Especially in this context, understanding the combined effect of regularly used drugs such as freely-available NSAIDs is of special interest because there is almost no published work investigating how these different drugs interact with each other. The findings for the special case ibuprofen will also help to understand and derive the effects for similar drugs such as diclofenac and naproxen [48]. In addition, this study supports the idea of using β -aescin as co-medication to mimic pharmacological effects of NSAIDs and to reduce their medication-based side effects [49]. Cholesterol is a major component in mammalian cells so that understanding the saponin-cholesterol interaction is indispensable.

Supplementary Materials

The following are available online at https://www.mdpi.com/2073-4352/10/5/401/s1, Figure S1: Full WAXS Spectra, Figure S2: Full WAXS Spectra with 20 mol% cholesterol and 10 and 20 mol% β -aescin, Figure S3: Determination of T m (WAXS) from d WAXS , Table S1: Summary of full width half thickness w ( T ) values of peak fits presented in Figure 7.

Author Contributions

R.G., S.P., and R.D. carried out SAXS experiments. R.G. did the data analysis and wrote the draft of the manuscript. All authors (R.G., S.P., R.D. and T.H.) read, revised and approved the final version of the manuscript. All authors have read and agreed to the published version of the manuscript.

Funding

This research was funded by Deutsche Forschungsgemeinschaft (DFG) grant number HE2995/7-1. We acknowledge support for the Article Processing Charge by the Deutsche Forschungsgemeinschaft and the Open Access Publication Fund of Bielefeld University.

Acknowledgments

The experiments (proposal number: SC-4393) were performed on beamline ID02 at the European Synchrotron Radiation Facility (ESRF), Grenoble, France. Y. Hannappel and O. Wrede are acknowledged for help during SAXS beamtime.

Conflicts of Interest

The authors have no conflict to declare.

References

  1. Vujic, Z.; Novovic, D.; Arsic, I.; Antic, D. Optimization of the extraction process of escin from dried seeds of Aesculus hippocastanum L. by Derringer’s desirability function. J. Anim. Plant Sci. 2013, 17, 2514–2521. [Google Scholar]
  2. Wilkinson, J.; Brown, A. Horse Chestnut—Aesculus hippocastanum: Potential Applications in Cosmetic Skin-care Products. Int. J. Cosmet. Sci. 1999, 21, 437–447. [Google Scholar] [CrossRef] [PubMed] [Green Version]
  3. Wulff, G.; Tschesche, R. Über triterpene XXVI: Über die Struktur der Rosskastaniensaponnie (Aescin) und die Aglykone verwandter Glykoside. Tetrahedron 1969, 25, 415–436. [Google Scholar] [CrossRef]
  4. Yoshikawa, M.; Murakami, T.; Matsuda, H.; Yamahara, J.; Murakami, N.; Kitagawa, I. Bioactive saponins and glycosides. III. Horse chestnut.(1): The structures, inhibitory effects on ethanol absorption, and hypoglycemic activity of escins Ia, Ib, IIa, IIb, and IIIa from the seeds of Aesculus hippocastanum L. Chem. Pharm. Bull. 1996, 44, 1454–1464. [Google Scholar] [CrossRef] [Green Version]
  5. Yoshikawa, M.; Murakami, T.; Yamahara, J.; Matsuda, H. Bioactive saponins and glycosides. XII. Horse chestnut.(2): Structures of escins IIIb, IV, V, and VI and isoescins Ia, Ib, and V, acylated polyhydroxyoleanene triterpene oligoglycosides, from the seeds of horse chestnut tree (Aesculus hippocastanum L., Hippocastanaceae). Chem. Pharm. Bull. 1998, 46, 1764–1769. [Google Scholar] [PubMed] [Green Version]
  6. Horvath, E. Verfahren zur Gewinnung von β-Aescin-Reichen Extrakten. European Patent EP0298148B1, 18 September 1991. [Google Scholar]
  7. Khan, L.; Kifayatullah, Q.; Ahmad, K.; Arfan, M. Preparation of water-soluble aescin from aesculus-indica seeds. J. Chem. Soc. Pak. 1994, 16, 269–272. [Google Scholar]
  8. Sirtori, C.R. Aescin: Pharmacology, pharmacokinetics and therapeutic profile. Pharmacol. Res. 2001, 44, 183–193. [Google Scholar] [CrossRef] [Green Version]
  9. Geisler, R.; Dargel, C.; Hellweg, T. The Biosurfactant β-Aescin: A Review on the Physico-Chemical Properties and Its Interaction with Lipid Model Membranes and Langmuir Monolayers. Molecules 2020, 25, 117. [Google Scholar] [CrossRef] [Green Version]
  10. Zhang, X.; Zhang, S.; Yang, Y.; Wang, D.; Gao, H. Natural barrigenol-like triterpenoids: A comprehensive review of their contributions to medicinal chemistry. Phytochemistry 2019, 161, 41–74. [Google Scholar] [CrossRef]
  11. Gallelli, L. Escin: A review of its anti-edematous, anti-inflammatory, and venotonic properties. Drug Des. Dev. Ther. 2019, 13, 3425–3437. [Google Scholar] [CrossRef] [Green Version]
  12. Patlolla, J.M.; Rao, C.V. Anti-inflammatory and Anti-cancer Properties of β-Escin, a Triterpene Saponin. Curr. Pharmacol. Rep. 2015, 1, 170–178. [Google Scholar] [CrossRef] [Green Version]
  13. Du, Y.; Song, Y.; Zhang, L.; Zhang, M.; Fu, F. Combined treatment with low dose prednisone and escin improves the anti-arthritic effect in experimental arthritis. Int. Immunopharmacol. 2016, 31, 257–265. [Google Scholar] [CrossRef] [PubMed]
  14. Zhang, L.; Huang, Y.; Wu, C.; Du, Y.; Li, P.; Wang, M.; Wang, X.; Wang, Y.; Hao, Y.; Wang, T.; et al. Network Pharmacology Based Research on the Combination Mechanism Between Escin and Low Dose Glucocorticoids in Anti-rheumatoid Arthritis. Front. Pharmacol. 2019, 10, 280. [Google Scholar] [CrossRef] [PubMed]
  15. Dudek-Makuch, M.; Studzińska-Sroka, E. Horse chestnut—Efficacy and safety in chronic venous insufficiency: An overview. Rev. Bras. Farmacogn. 2015, 25, 533–541. [Google Scholar] [CrossRef] [Green Version]
  16. Costantini, A. Escin in pharmaceutical oral dosage forms: Quantitative densitometric HPTLC determination. Il Farmaco 1999, 54, 728–732. [Google Scholar] [CrossRef]
  17. Pittler, M.H.; Ernst, E. Horse chestnut seed extract for chronic venous insufficiency. Cochrane Database Syst. Rev. 2012, 11, CD003230. [Google Scholar] [CrossRef]
  18. Kahn, S.R. The post-thrombotic syndrome. Hematol. Am. Soc. Hematol. Educ. Program 2010, 216–220. [Google Scholar] [CrossRef] [Green Version]
  19. Kahn, S.R. The post thrombotic syndrome. Thromb. Res. 2011, 127, S89–S92. [Google Scholar] [CrossRef] [Green Version]
  20. Cheong, D.H.; Arfuso, F.; Sethi, G.; Wang, L.; Hui, K.M.; Kumar, A.P.; Tran, T. Molecular targets and anti-cancer potential of escin. Cancer Lett. 2018, 422, 1–8. [Google Scholar] [CrossRef]
  21. Fedotcheva, T.A.; Sheichenko, O.P.; Sheichenko, V.I.; Fedotcheva, N.I.; Shimanovskii, N.L. Preparation of a horse chestnut extract with a 50% content of escin and its actions on tumor cell proliferation and isolated mitochondria. Pharm. Chem. J. 2019, 53, 57–64. [Google Scholar] [CrossRef]
  22. Zhou, X.Y.; Fu, F.H.; Li, Z.; Dong, Q.J.; He, J.; Wang, C.H. Escin, a natural mixture of triterpene saponins, exhibits antitumor activity against hepatocellular carcinoma. Planta Medica 2009, 75, 1580–1585. [Google Scholar] [CrossRef] [PubMed] [Green Version]
  23. Harford-Wright, E.; Bidère, N.; Gavard, J. β-escin selectively targets the glioblastoma-initiating cell population and reduces cell viability. Oncotarget 2016, 7, 66865. [Google Scholar] [CrossRef] [PubMed] [Green Version]
  24. Dargel, C.; Geisler, R.; Hannappel, Y.; Kemker, I.; Sewald, N.; Hellweg, T. Self-assembly of the bio-surfactant aescin in solution: A small-angle X-ray scattering and Fluorescence study. Colloids Interfaces 2019, 3, 47. [Google Scholar] [CrossRef] [Green Version]
  25. Tcholakova, S.; Mustana, F.; Pagureva, N.; Golemanov, K.; Denkov, N.D.; Pelan, E.G.; Stoyanov, S.D. Role of surface properties for the kinetics of bubble Ostwald ripening in saponin-stabilized foams. Colloids Surf. A 2017, 534, 16–25. [Google Scholar] [CrossRef]
  26. Tsibranska, S.; Ivanova, A.; Tcholakova, S.; Denkov, N. Self-Assembly of Escin Molecules at the Air-Water Interface as Studied by Molecular Dynamics. Langmuir 2017, 33, 8330–8341. [Google Scholar] [CrossRef] [PubMed]
  27. Tsibranska, S.; Ivanova, A.; Tcholakova, S.; Denkov, N. Structure of dense adsorption layers of escin at the air-water interface studied by Molecular Dynamics simulations. Langmuir 2019, 35, 12876–12887. [Google Scholar] [CrossRef] [PubMed]
  28. Golemanov, K.; Tcholakova, S.; Denkov, N.; Pelan, E.; Stoyanov, S.D. Surface Shear Rheology of Saponin Adsorption Layers. Langmuir 2012, 28, 12071–12084. [Google Scholar] [CrossRef]
  29. Golemanov, K.; Tcholakova, S.; Denkov, N.; Pelana, E.; Stoyanov, S.D. The role of the hydrophobic phase in the unique rheological properties of saponin adsorption layers. Soft Matter 2014, 10, 7034–7044. [Google Scholar] [CrossRef]
  30. Sreij, R.; Dargel, C.; Moleiro, L.H.; Monroy, F.; Hellweg, T. Aescin Incorporation and Nanodomain Formation in DMPC Model Membranes. Langmuir 2017, 33, 14527. [Google Scholar] [CrossRef] [Green Version]
  31. Sreij, R.; Prevost, S.; Dargel, C.; Dattani, R.; Hertle, Y.; Wrede, O.; Hellweg, T. Interaction of the saponin aescin with ibuprofen in DMPC model membranes. Mol. Pharm. 2018, 15, 4446–4461. [Google Scholar] [CrossRef]
  32. Sreij, R.; Dargel, C.; Schweins, R.; Prevost, S.; Dattani, R.; Hellweg, T. Aescin-Cholesterol Complexes in DMPC Model Membranes: A DSC and Temperature-Dependent Scattering Study. Sci. Rep. 2019, 9, 5542. [Google Scholar] [CrossRef] [PubMed] [Green Version]
  33. Sreij, R.; Dargel, C.; Hannappel, Y.; Jestin, J.; Prévost, S.; Dattani, R.; Wrede, O.; Hellweg, T. Temperature dependent self-organization of DMPC membranes promoted by intermediate amounts of the saponin aescin. Biochim. Biophys. Acta BBA Biomembr. 2019, 1861, 897–906. [Google Scholar] [CrossRef] [PubMed]
  34. Sreij, R.; Dargel, C.; Geisler, P.; Hertle, Y.; Radulescu, A.; Pasini, S.; Perez, J.; Moleiro, L.H.; Hellweg, T. DMPC vesicle structure and dynamics in the presence of low amounts of the saponin aescin. Phys. Chem. Chem. Phys. 2018, 20, 9070–9083. [Google Scholar] [CrossRef] [PubMed]
  35. Boggara, M.B.; Faraone, A.; Krishnamoorti, R. Effect of pH and ibuprofen on the phospholipid bilayer bending modulus. J. Phys. Chem. B 2010, 114, 8061–8066. [Google Scholar] [CrossRef]
  36. Arriaga, L.R.; Lopez-Montero, I.; Monroy, F.; Orts-Gil, G.; Farago, B.; Hellweg, T. Stiffening Effect of Cholesterol on Disordered Lipid Phases: A Combined Neutron Spin Echo+Dynamic Light Scattering Analysis of the Bending Elasticity of Large Unilamellar Vesicles. Biophys. J. 2009, 96, 3629–3637. [Google Scholar] [CrossRef] [Green Version]
  37. Geisler, R.; Pedersen, M.C.; Hannappel, Y.; Schweins, R.; Prévost, S.; Dattani, R.; Arleth, L.; Hellweg, T. Aescin-induced conversion of gel-phase lipid membranes into bicelle-like lipid nanoparticles. Langmuir 2019, 35, 16244–16255. [Google Scholar] [CrossRef]
  38. Mahabir, S.; Small, D.; Li, M.; Wan, W.; Kucerka, N.; Littrell, K.; Katsaras, J.; Nieh, M.P. Growth kinetics of lipid-based nanodiscs to unilamellar vesicles: A time-resolved small angle neutron scattering (SANS) study. Biochim. Biophys. Acta BBA Biomembr. 2013, 1828, 1025–1035. [Google Scholar] [CrossRef]
  39. Genz, A.; Holzwarth, J.; Tsong, T. The influence of cholesterol on the main phase transition of unilamellar dipalmytoylphosphatidylcholine vesicles. A differential scanning calorimetry and iodine laser T-jump study. Biophys. J. 1986, 50, 1043–1051. [Google Scholar] [CrossRef] [Green Version]
  40. Boggara, M.B.; Krishnamoorti, R. Small-angle neutron scattering studies of phospholipid NSAID adducts. Langmuir 2010, 26, 5734–5745. [Google Scholar] [CrossRef]
  41. de Groot, C.; Müsken, M.; Müller-Goymann, C.C. Novel Colloidal Microstructures of β-Escin and the Liposomal Components Cholesterol and DPPC. Planta Medica 2018, 84, 1219–1227. [Google Scholar] [CrossRef]
  42. Bombardelli, E.; Patri, G.; Pozzi, R. Complexes of Aescin, β-Sitosterol or Cholesterol, and Phospholipids and Pharmaceutical Compositions Containing Them. U.S. Patent 5118671, 2 June 1992. [Google Scholar]
  43. Marsh, D. Lateral order in gel, subgel and crystalline phases of lipid membranes: Wide-angle X-ray scattering. Chem. Phys. Lipids 2012, 165, 59–76. [Google Scholar] [CrossRef] [PubMed] [Green Version]
  44. Tristam-Nagle, S.; Liu, Y.; Legleiter, J.; Nagle, J.F. Structure of Gel and Phase DMPC and Determined by X-Ray and Diffraction. Biophys. J. 2002, 83, 3324–3335. [Google Scholar] [CrossRef] [Green Version]
  45. Narayanan, T.; Sztucki, M.; Van Vaerenbergh, P.; Léonardon, J.; Gorini, J.; Claustre, L.; Sever, F.; Morse, J.; Boesecke, P. A multipurpose instrument for time-resolved ultra-small-angle and coherent X-ray scattering. J. Appl. Crystallogr. 2018, 51, 1511–1524. [Google Scholar] [CrossRef] [PubMed]
  46. Boesecke, P. Reduction of two-dimensional small- and wide-angle X-ray scattering data. J. Appl. Crystallogr. 2007, 40, 423–427. [Google Scholar] [CrossRef]
  47. Gestetner, B.; Assa, Y.; Henis, Y.; Tencer, M.; Rotman, Y.; Birk, Y.; Bondi, A. Interaction of lucerne saponins with sterols. Biochim. Biophys. Acta 1972, 270, 181–187. [Google Scholar] [CrossRef]
  48. Moreno, M.M.; Garidel, P.; Suwalsky, M.; Howe, J.; Brandenburg, K. The membrane-activity of Ibuprofen, Diclofenac, and Naproxen: A physico-chemical study with lecithin phospholipids. Biochim. Biophys. Acta BBA Biomembr. 2009, 1788, 1296–1303. [Google Scholar] [CrossRef] [PubMed] [Green Version]
  49. Maghsoudi, H.; Hallajzadeh, J.; Rezaeipour, M. Evaluation of the effect of polyphenol of escin compared with ibuprofen and dexamethasone in synoviocyte model for osteoarthritis: An in vitro study. Clin. Rheumatol. 2018, 37, 2471–2478. [Google Scholar] [CrossRef]
Figure 1. Molecular structures of (a) β -aescin [24], (b) 1,2-dimyristoyl-sn-glycero-3-phosphocholine (DMPC), (c) cholesterol, and (d) ibuprofen. At pH 7.4 the carboxylic acid groups of ibuprofen and β -aescin are deprotonated.
Crystals 10 00401 g001
Figure 2. (a) Schematics of the acyl chain correlation distance d WAXS extracted from the maximum of the wide-angle X-ray scattering (WAXS) diffraction signal from the peak maximum at q peak below and above the melting temperature of the lipid. Figure modified and adapted on the basis of reference [43]. (b) Schematics of the head group ordering in a hexagonally ordered L β ‘gel’ phase below and flexible fluid L α phase above the main phase transition temperature T m .
Crystals 10 00401 g002
Figure 3. WAXS graphs of DMPC+ β -aescin samples without additive (panels (ae)), with additional 10 mol% ibuprofen (panels (fj)), and with additional 10 mol% cholesterol (panels (ko)). The β -aescin content is varied between 0 (E000) and 30 mol% (E300) with respect to the lipid content. The temperature ranges from 10 to 50 C. Arrows indicate interesting features in the graphs. The dashed grey lines mark peak positions of the shoulder at lower and higher q-values and the position of the sharp peak in the C100_E300 sample. The legend applies to all panels. The full WAXS patterns are shown in Figure S1.
Crystals 10 00401 g003
Figure 4. Scheme summarising the effects from ibuprofen (orange), cholesterol (yellow molecules), and β -aescin (pink molecules) on a half DMPC bilayer (blue molecules). (a) Neat DMPC bilayer exhibiting hexagonal ordering (black hexagon) at gel phase conditions. (b) Molecular ordering in the binary systems of additives with DMPC. Ibuprofen (orange, Phase II) and cholesterol (yellow, Phase III) induce an orthorhombic phase order of the DMPC bilayer. β -aescin (pink, Phase IV) does not lead to a distinct phase. We assume a distorted hexagonal phase. (c) Molecular ordering in the ternary mixtures of DMPC with β -aescin and ibuprofen (left) and of DMPC with β -aescin and cholesterol (right). In both cases the main lipid ordering is determined by β -aescin (pink dashed hexagon). Additionally to this, cholesterol increases the spacing between DMPC molecules. For all samples, it is assumed that phases II-VI coexist with phase I.
Crystals 10 00401 g004
Figure 5. WAXS diffraction patterns of ternary mixtures composed of DMPC, 20 mol% cholesterol and (a) 10 mol% ‘beta’-aescin and (b) 20 mol% ‘beta’-aescin at temperatures around T m ( D M P C ) . Arrows point on a shoulder rising with increasing aescin content. The full WAXS patterns are shown in Figure S2.
Crystals 10 00401 g005
Figure 6. d WAXS for the binary system (a) DMPC/ β -aescin and additional ternary systems with 10mol% of the additive in (b) for DMPC/beta-aescin/ibuprofen and in (c) DMPC/beta-aescin/cholesterol mixtures calculated from the peak maxima in Figure 3 and Figure 5 by Equation (1). The dashed lines are guides to the eye for better readability. The arrows in panel (a) mark interesting points which are discussed in the main text. Not visible error bars are within the symbol size. Fits to these data are shown in Figure S3.
Crystals 10 00401 g006
Figure 7. d WAXS -values at constant β -aescin content of (a): 10 mol% (E100), (b): 20 mol% (E200), and (c): 30 mol% (E300). d WAXS are calculated from the peak maxima in Figure 3 and Figure 5 by Equation (1). The dashed lines are guides to the eye for better readability. If error bars are not visible, they are within the symbol size.
Crystals 10 00401 g007
Figure 8. (a) Determination of T m (WAXS) from the maximum of the peak fit (grey line) of the first derivative (grey symbols) of d WAXS values (red symbols). (b) T m (WAXS) values of all data. The fits to the data are shown in Figure S2. (c) Full width at half maximum (FWHM, w ( T ) ) of the peak fits. The values here are mean values over all β -aescin concentrations. The single values of each concentration are listed in Table S1. These values represent the ’broadening’ of the phase transition with temperature.
Crystals 10 00401 g008

