1. Introduction
The interest in LaFeO
3 among perovskite inorganic materials increased tremendously due to their applicability ranging as chemical sensors, electrode materials, etc. [
1,
2]. Doping the La-site with divalent metals and/or Fe-site with transition metals has been reported to increase the structural and thermal stability, magnetic, and electrical properties as compared with the parent compound [
1,
3]. Specifically, doping in Fe-site with varying metal cations and concentrations has been reported in many studies [
4,
5,
6,
7].
Ti-doped on Fe-site showed weak ferromagnetic behavior, followed by the increase of magnetization with increasing Ti concentration [
4]. Doping with Mg
2+ and Zn
2+ induces changes in the band structure-property and enhances the oxygen reduction’s efficiency when photocathodes are built from this material [
5]. Another study reported that Mg substitution at the Fe-site with 10% of concentration reduces the resistance of LaFeO
3 and produces better response and selectivity to ethanol gas [
6]. Zn-doped on Fe-site exhibited the colossal dielectric constant following by the Debye-like dipolar relaxation mechanism [
7].
In spite of the fact that there are numerous works committed to studying the physical properties in LaFeO
3 containing valence cations as substituents [
1,
2,
3,
4,
5,
6,
7], research investigations on the effect of Zr cations on the Fe-site of LaFeO
3 are still lacking information. The question of the effect of Zr, as tetravalent cations occupying the Fe-site of LaFeO
3 on the structural parameters and electrical transport mechanism, has not been systematically studied. Therefore, this present work concentrates on the investigation of the effect of the Zr content on the structure and electrical properties of LaFeO
3. In this work, we prepared the Zr-doped LaFeO
3 with different concentration of Zr. The XRD was employed to determine the crystal structure and structural parameters for the prepared samples, while the phonon characteristics were studied by Raman scattering spectroscopy. The morphology and grain distribution were investigated using SEM. The impedance spectroscopy was applied to get a better understanding of the electrical mechanism working on this material.
2. Experimental Details
The LaFe
1−xZr
xO
3 (x = 0.01, 0.05) powdered ceramics were prepared by sol-gel method using La
2O
3, Fe(NO
3)
3.9H
2O, Cl
2H
12O
9Zr, and citric acid monohydrate as precursors (all analytically pure) [
8].
Distilled water and citric acid monohydrate were used to solve the precursors with certain stoichiometry. The solvent obtained was stirred and heated under certain condition to form the homogeneous gel. The gel-obtained was dried to form the black powder and then calcined at 900 °C for 6 h. This powder-calcined was pressed into a thin pellet with 1 cm of diameter under 3 kN of pressure for 3 min. Finally, the pellet was sintered and then annealed at 800 °C for 6 h to form the polycrystalline ceramics.
The crystal structure was investigated by X-ray diffraction (X’Pert PRO PANalytical diffractometer, Almelo, The Netherlands) using Cu Kα (λ = 1.5418Å) radiation source in the 2θ range of 20° ≤ 2θ ≤ 90°. The structural analysis obtaining from XRD data were analyzed using Fullprof.2k (Institut Laue-Langevin, Grenoble, France) and VESTA (JP-Mineral.org, Ibaraki, Japan) software. The Raman scattering spectra were recorded in the range from 70–2000 cm−1 using 532 nm laser source by Thermo Scientific DXR2 Raman Microscope (Thermo Electron Scientific Instruments, Fitchburg, WI, USA). The morphology of the ceramic samples was analyzed by SEM (FEI QUANTA 650 FEG, Thermo Electron Scientific Instruments, Fitchburg, WI, USA). The sample’s surface was gold-coated before surface observation. Electrical properties were carried out using LCR meter (FLUKE-PM 6303, Glottertal, Germany) with single parallel resistance-capacitance model in the temperature range of 125–300 °C under the frequency range of 100 Hz to 1 MHz.
3. Results and Discussion
3.1. X-ray Diffraction Analysis
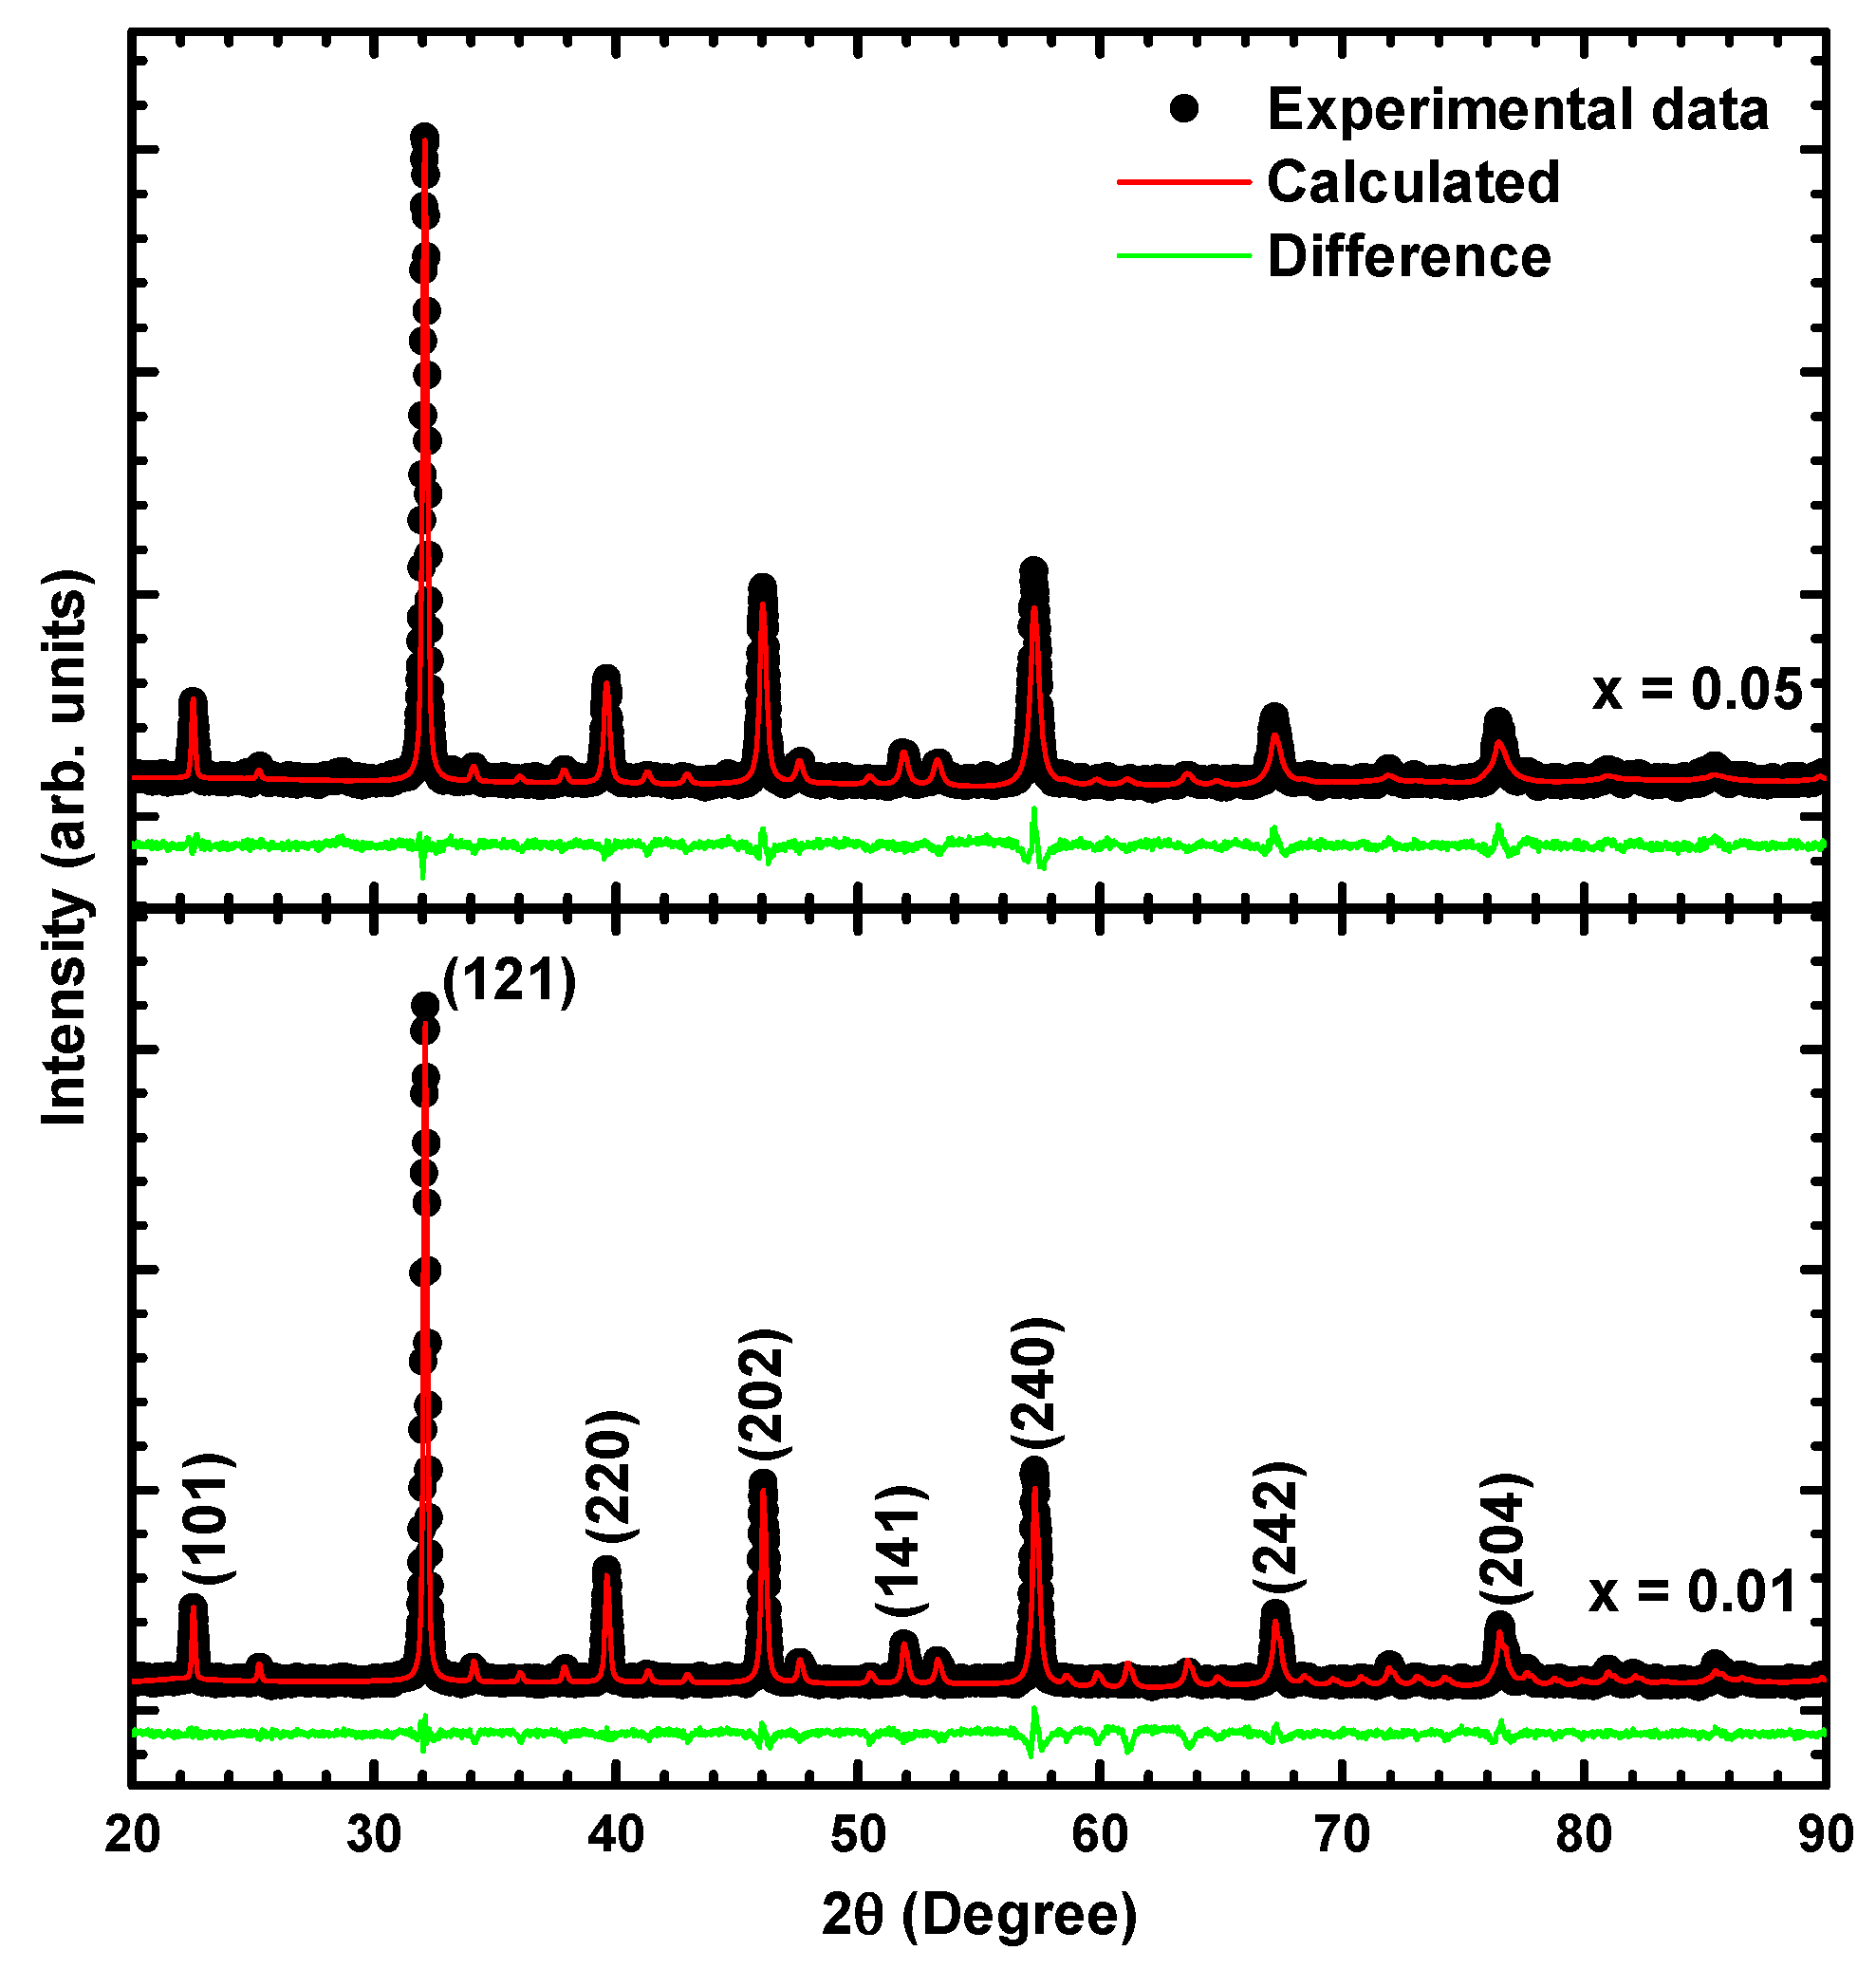
Figure 1 denotes the XRD patterns of LaFe
1−xZr
xO
3, annealed at 800 °C for 6 h. The analysis results confirm the formation of the single-crystalline perovskite. Peaks corresponding to lanthanum oxide, iron hydrate, and zirconium hydrate did not appear, indicating the incorporation of Zr with Fe in perovskite lattice. The indexation was performed according to the proposed orthorhombic structure within the Pbnm space group with four formula units (Z = 4). The obtained crystallographic parameters are tabulated in
Table 1. The lattice constant increased with increasing Zr content because the ionic radii of Fe
3+ (64 pm) are smaller than that of Zr
4+ (86 pm) and might be due to the changes in cation degree of Zr as compensation of electric charge.
The average crystallite size was calculated based on Scherrer’s method [
9]:
where
(1.5405 Å) is the wavelength of the X-rays,
is the Bragg angle,
is the FWHM, and
= 0.89. We calculated the average crystallite size using XRD data. We found that the crystallite size decreases with increasing Zr content, indicating the decrease in crystallinity degree [
10].
Now, we turn to illustrate the geometrical parameters for each sample. The obtained geometrical refinement analysis was used to estimate the selection rules, symmetry, and normal modes of the vibrational modes of LaFe
1−xZr
xO
3 at room temperature [
11,
12,
13]. The Brillouin zone center normal modes of LaFe
1−xZr
xO
3 with
Pbnm symmetry (x = 0.01, 0.05) are represented in
Table 2 [
12]. The results predict 24 Raman active phonon modes, 28 infrared modes, and 8 silent modes for the room temperature LaFe
1−xZr
xO
3 structure (belonging to the
Pbnm symmetry) [
12,
13]. This prediction was used to analyze the vibrational modes characterized by Raman scattering spectra. To determine the distortion degree for each sample, the calculated tolerance factor and Fe/ZrO
6 tilting degree have been estimated from the bond angle and bond length data [
10,
13]. The obtained tolerance factors indicate that the crystal distortion decreased with increasing Zr content. In other words, the crystal structure tends to preserve the ideal orthorhombic structure with increasing Zr content. The decreasing Fe/ZrO
6 tilting angle (see
Table 3) indicates an increasing driving force of the octahedral tilting.
3.2. Raman Scattering Spectra
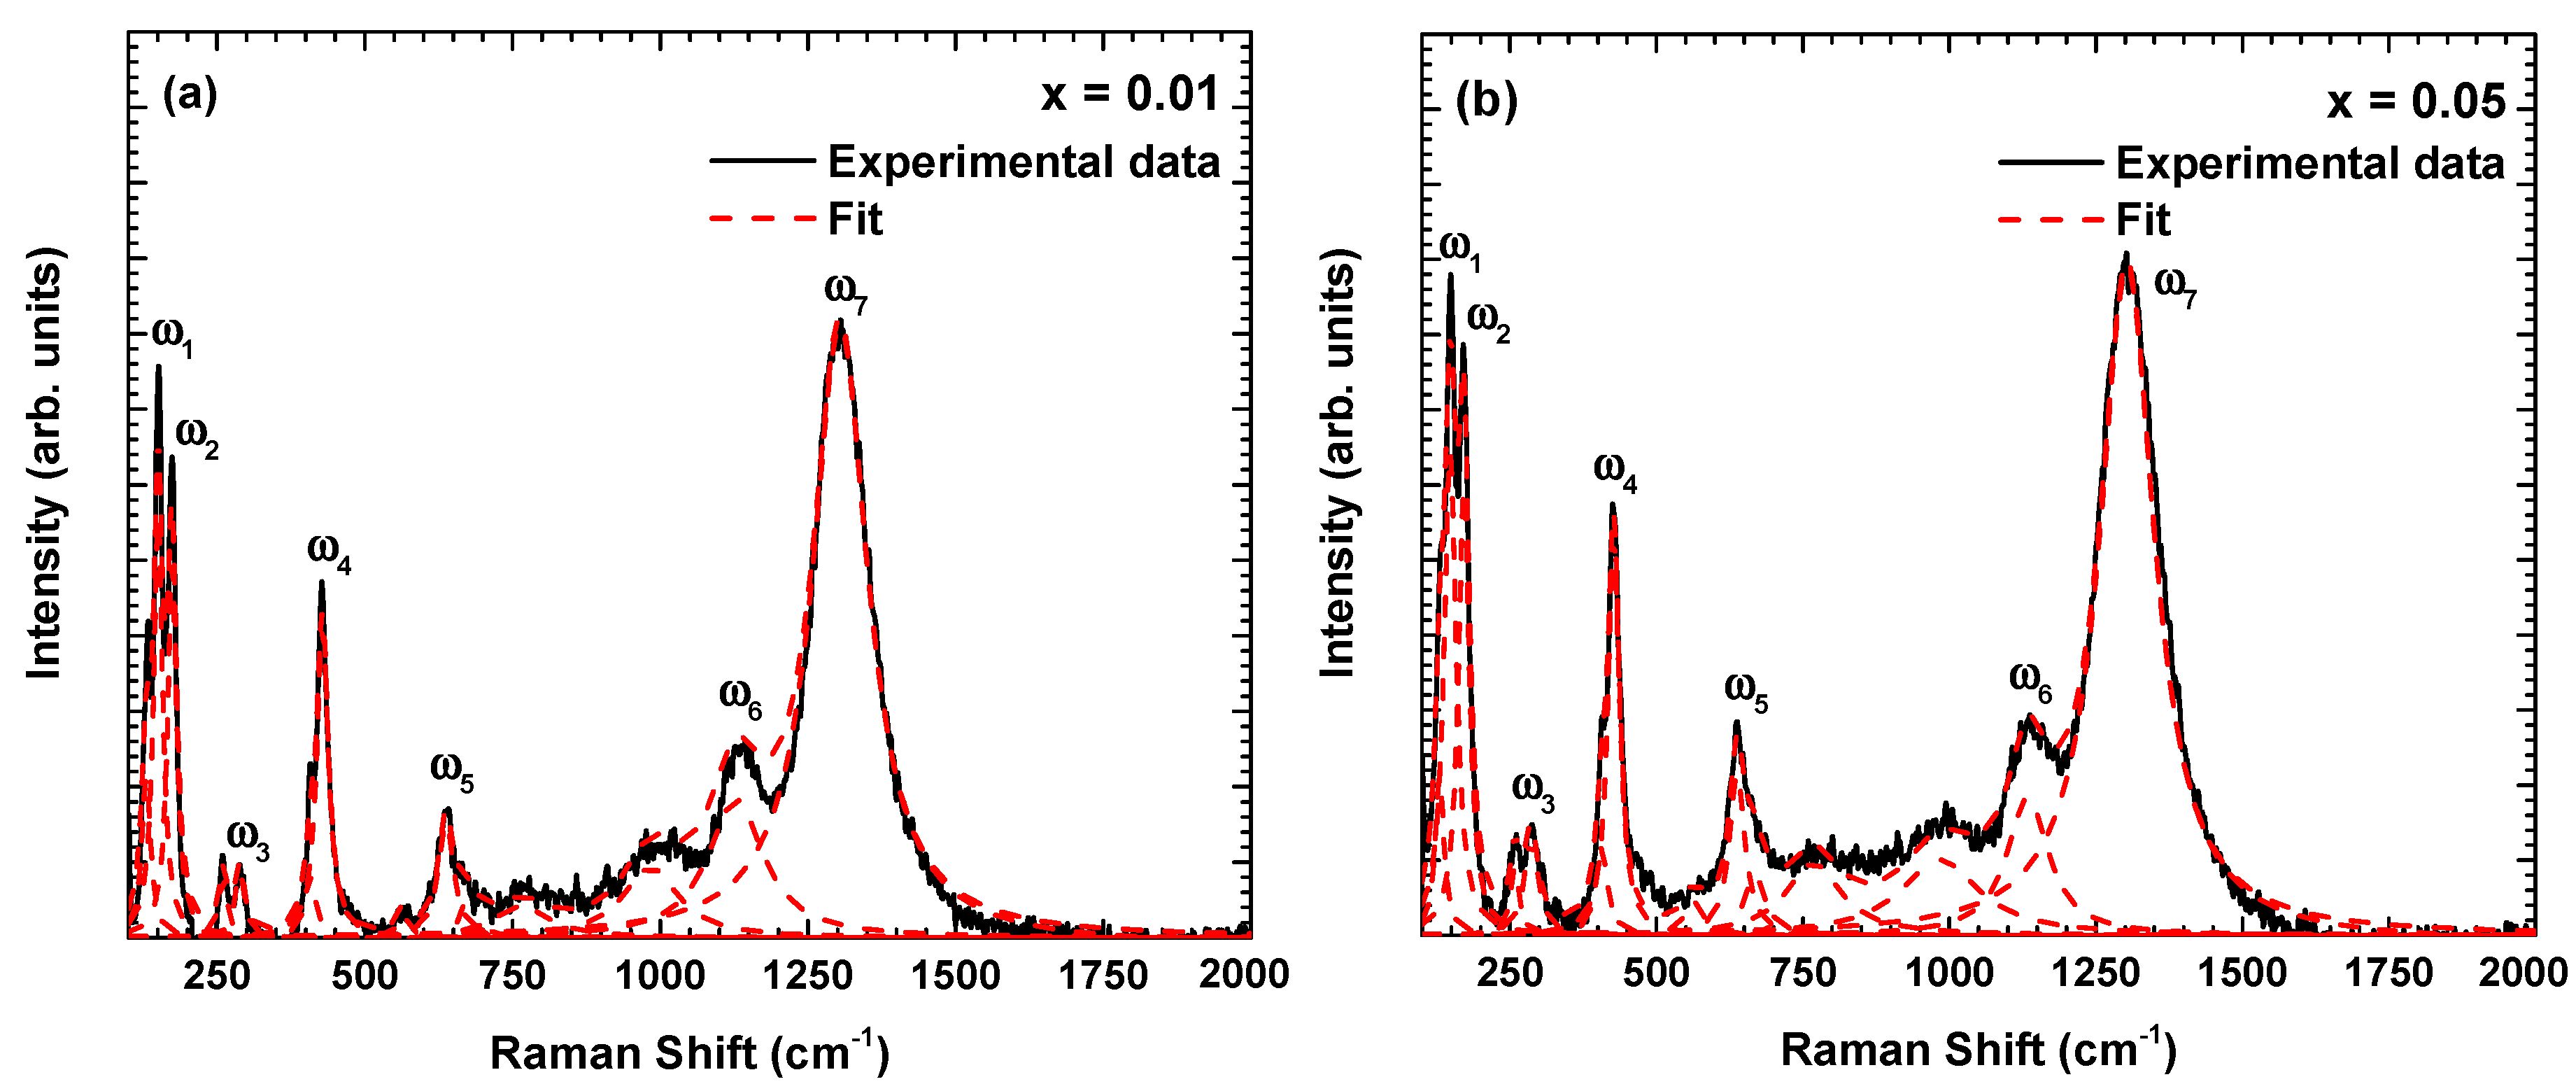
For complex perovskite, normally all the Raman modes cannot be experimentally observed. However, there are some dominating modes assigned in
Figure 2 and tabulated in
Table 4. Due to the similar crystal structure and symmetry, the Raman scattering spectra of LaFe
1−xZr
xFeO
3 ceramics is similar to a previously reported Raman scattering spectrum of pure-LaFeO
3 and LaFe
1−xMo
xO
3 [
12,
13].
As confirmed in previous reports [
12,
13], the ω
1 and ω
2 modes are related to vibrations of the La-site cations with A
g symmetry. The ω
3 mode is attributed to the Fe/ZrO
6 octahedra displacement with A
g symmetry. The ω
4 mode is considered by the asymmetric stretching vibrations, to be related with Jahn–Teller distortions with A
g symmetry. The ω
5 mode is assigned to the stretching symmetric vibrations of Fe/ZrO
6 octahedra with B
1g symmetry. Another phonon mode over 700 cm
−1 could be indicated with multiphonon processes [
13,
14]. The Raman phonon modes tend to shift to the lower wavenumber reflecting the lattice constant and bond length increased with Zr content which is fitted with refinement results (
Table 1). The Raman intensity for all phonon modes is increased and their linewidth is compressed with increasing Zr content. This reflects the decreasing of lattice disorder and crystal distortion which is consistent with the decreased tolerance factor observed by X-ray diffraction analysis (
Table 2).
3.3. SEM
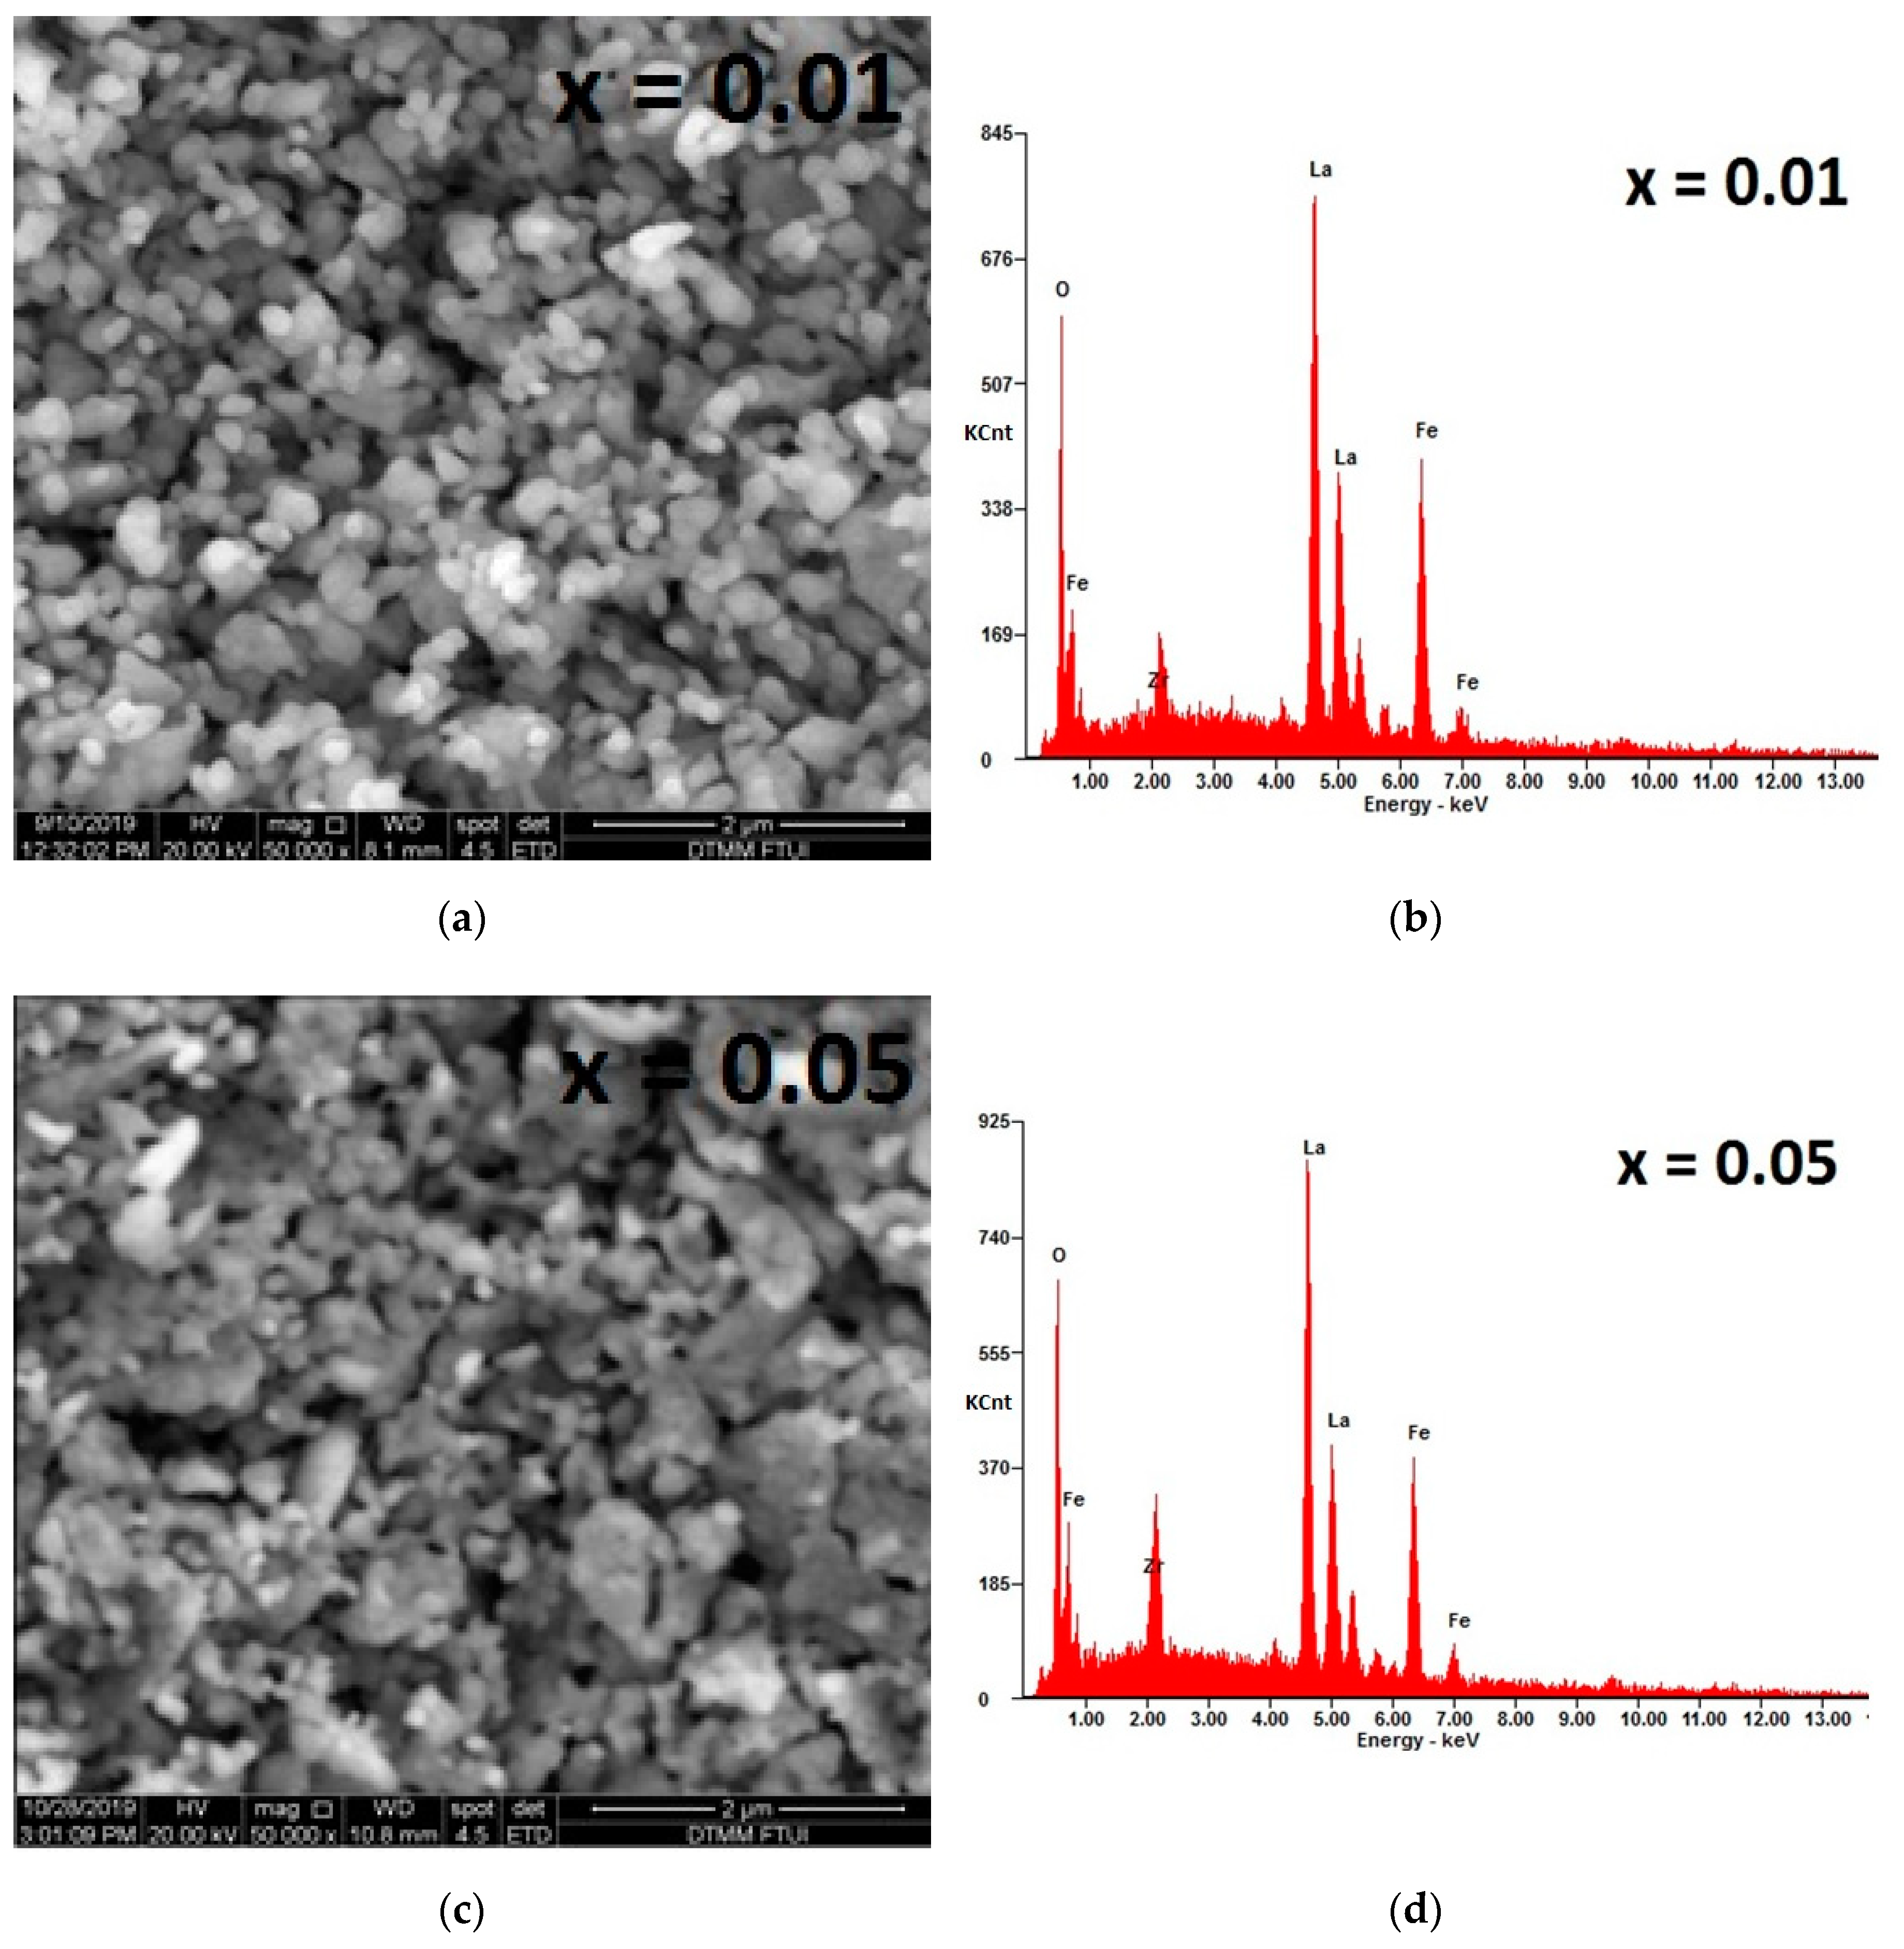
Figure 3 shows the SEM micrographs of the ceramics samples. The typical polycrystalline microstructure is shown with a larger non-uniform grain distribution. The average grain size was estimated to be 159 and 127 nm for x = 0.01 and x = 0.05, respectively. In the typical energy dispersive X-ray spectroscopy pattern of each ceramic, all of the elements’ (La, Fe, Zr, and O) peaks are presented in their respective molar concentrations during the annealing process, indicating the purity and phase formation of LaFe
1−xZr
xO
3 ceramics.
3.4. Electrical Properties
3.4.1. Impedance Spectroscopy Analysis
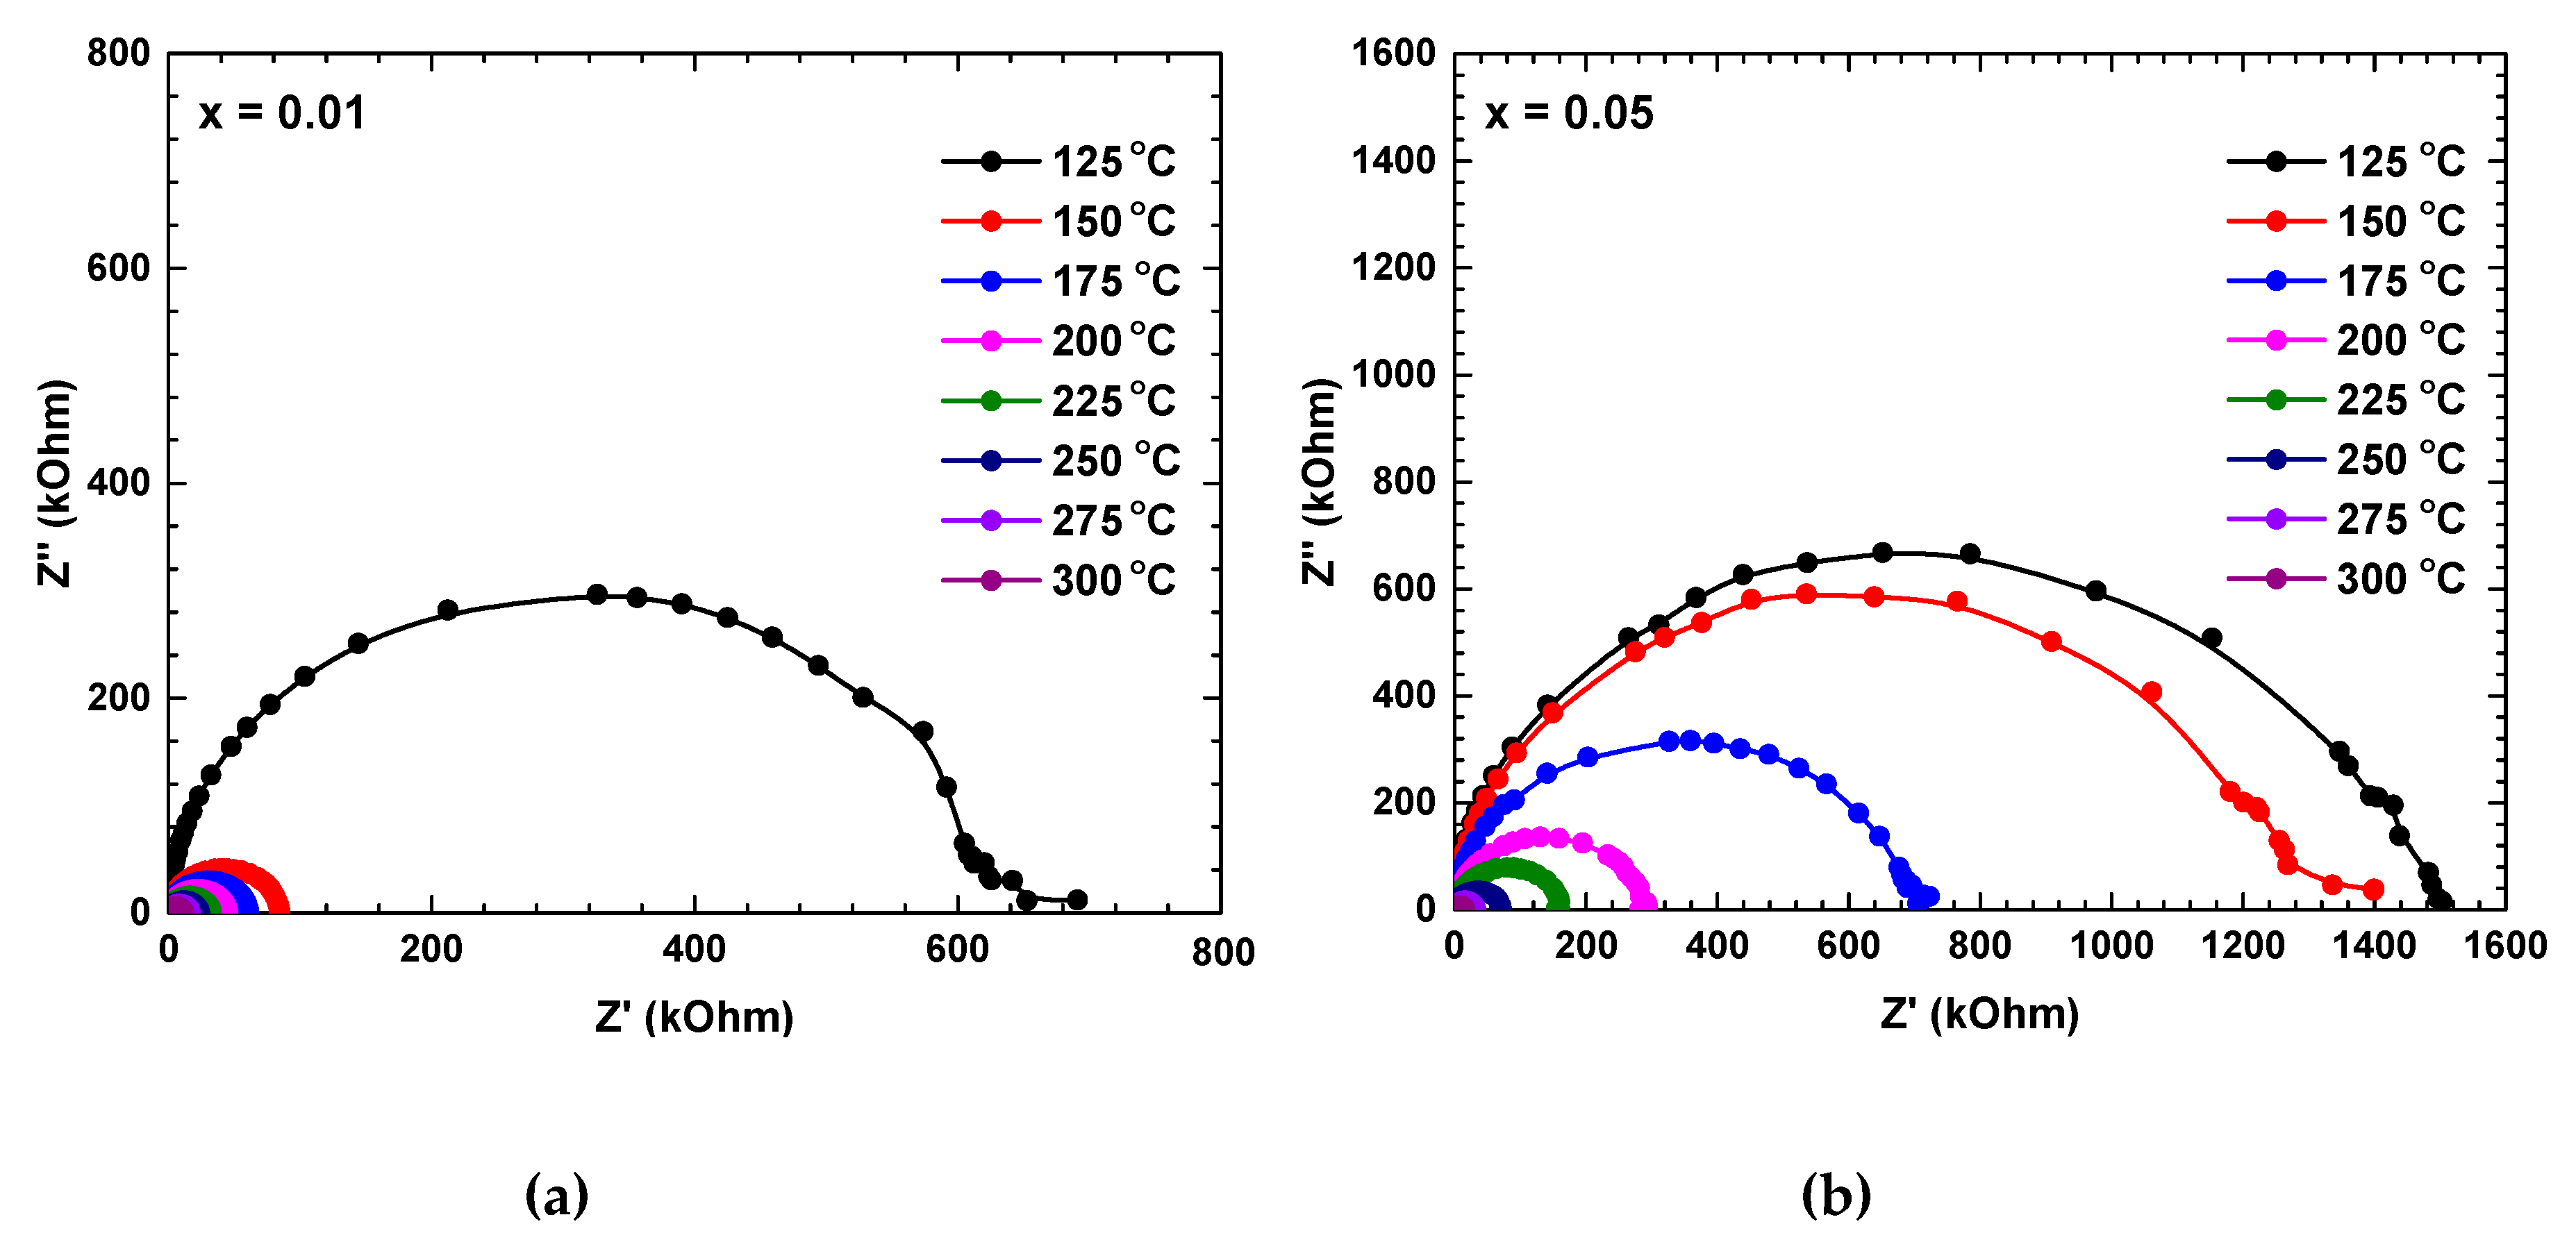
Figure 4 shows the Nyquist plot of LaFe
1−xZr
xO
3 annealed at 800 °C for 6 h at different temperatures. All plots are suppressed into two semicircular arcs centering in Z′ axis; the first one is observed at high frequencies while the second circle is observed at low frequencies, which are represented by the grain and grain boundary contribution working on electrical transport mechanism in these materials, respectively [
13]. The semicircle decreases with increasing temperature, in other words, the decreasing of impedance value with temperature, indicates the increase in electrical conductivity with temperature and displays the polycrystalline nature of the material. [
15,
16]. The impedance value is also shown to be increasing with increasing Zr content.
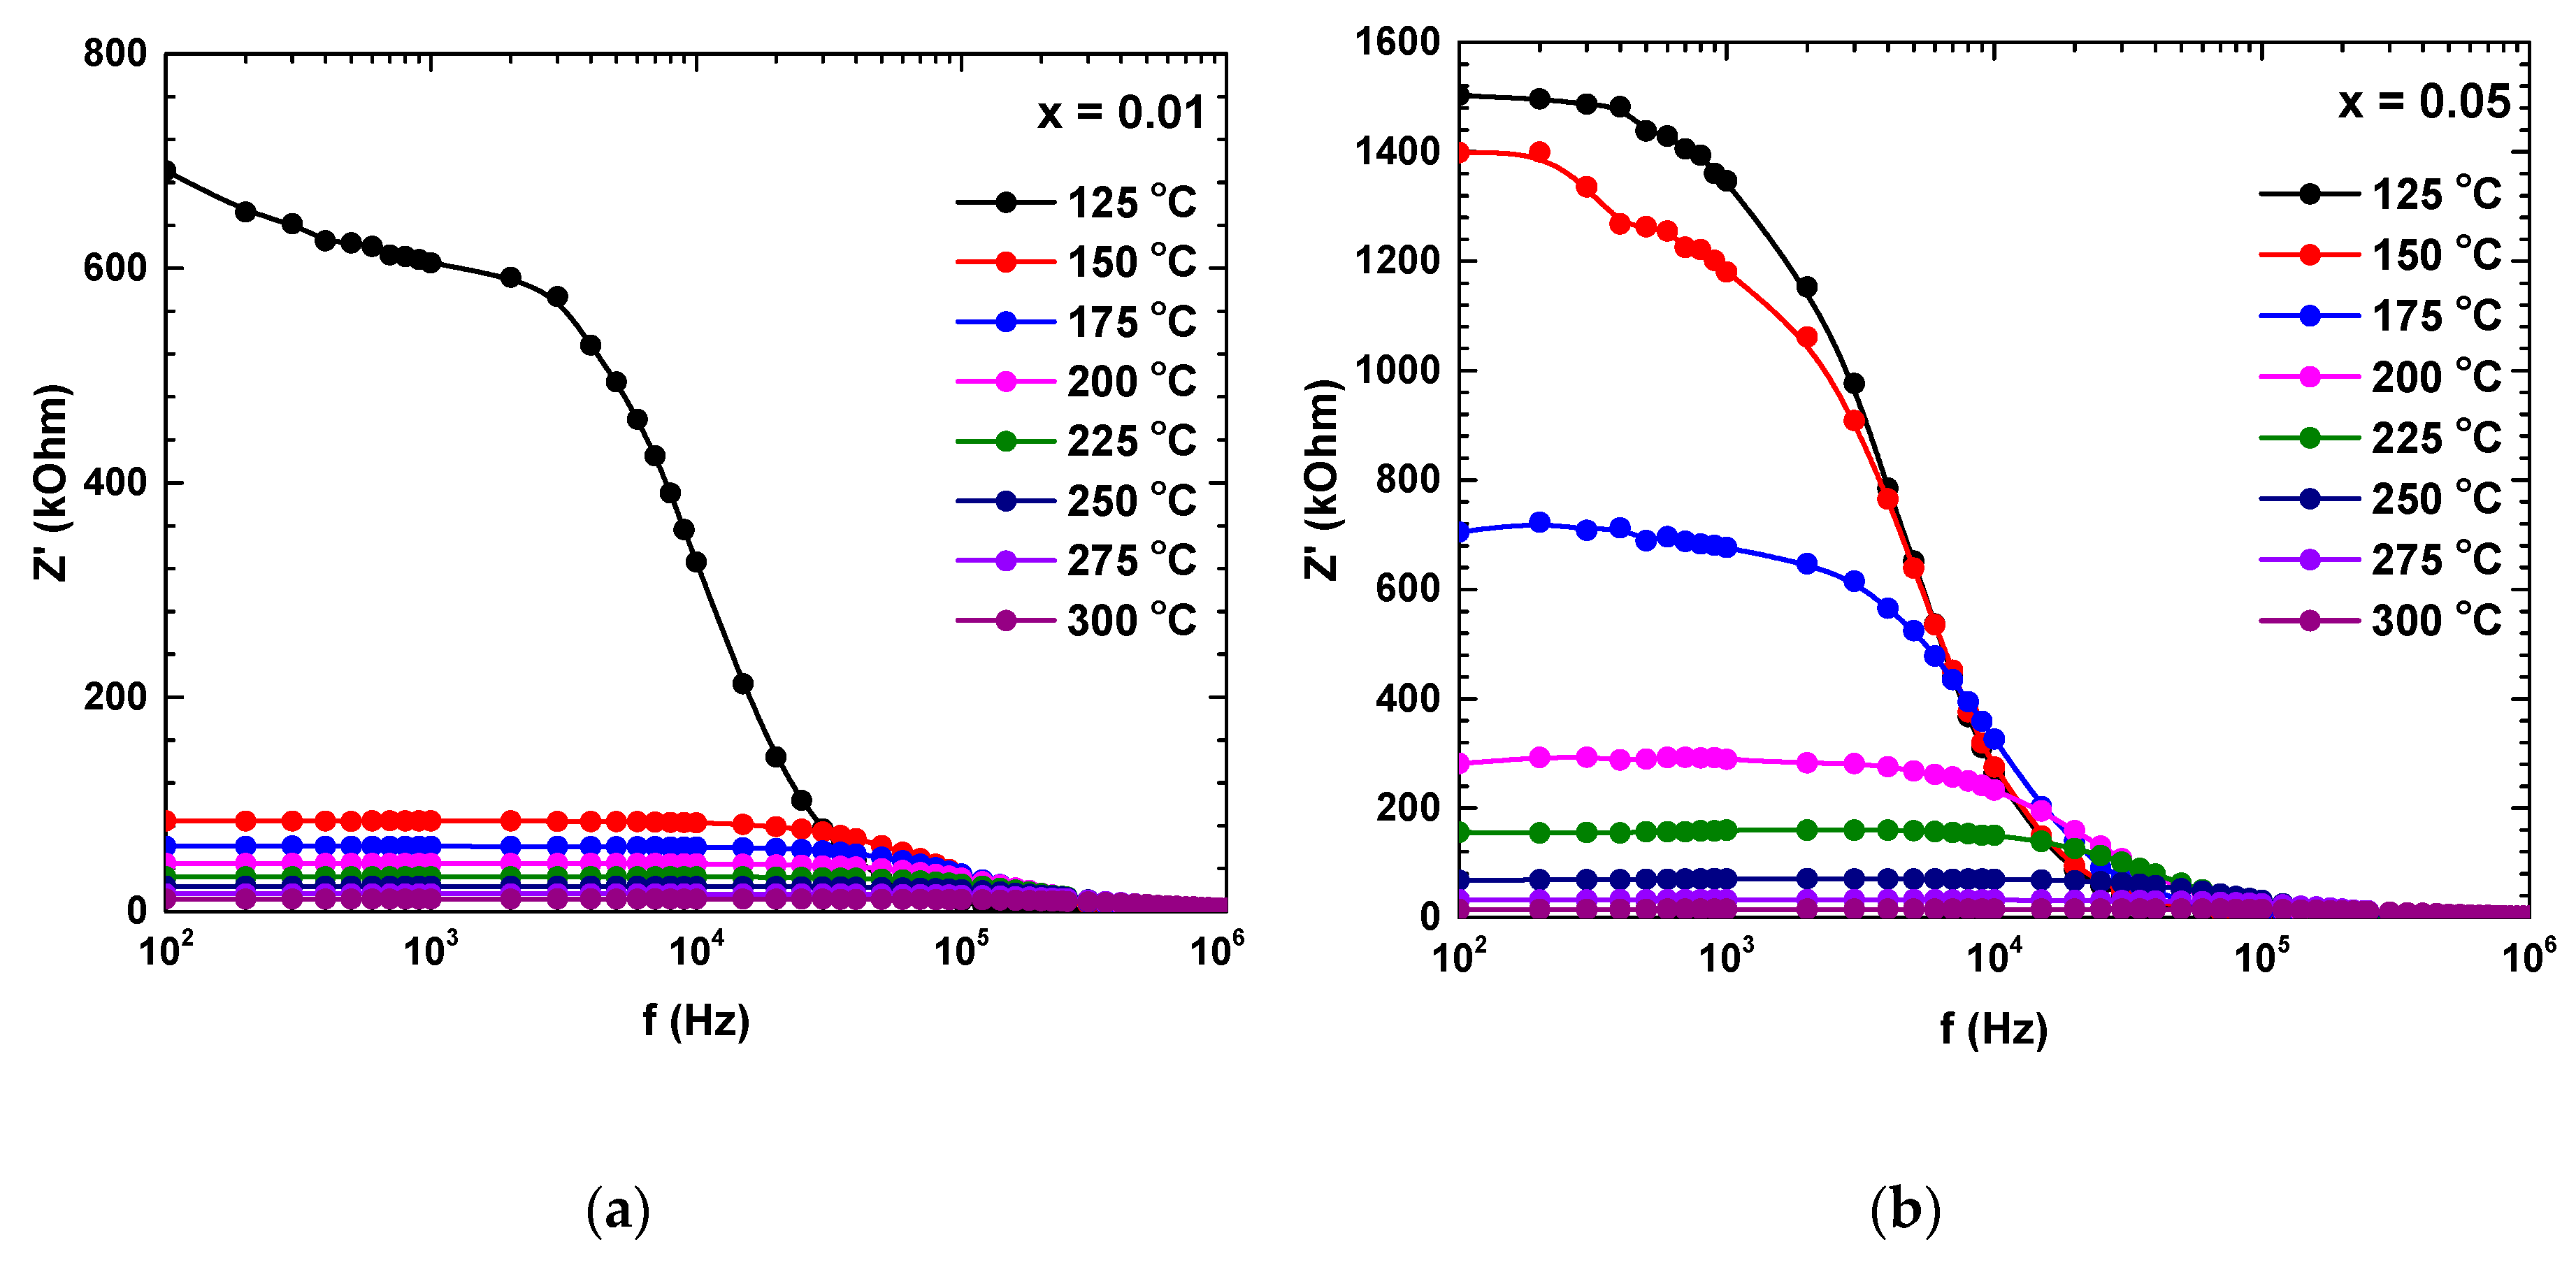
Figure 5 displays the real part of the impedance (Z′) at different temperatures as a function of the frequency for LaFe
1−xZr
xO
3 ceramics. The Z′ decreases with increasing frequency in the low-frequency region and becomes independent in the high-frequency region. The Z′ independent parts are merged at higher frequency regions for all temperatures. The Z′ decreases with increasing temperature, indicating a negative thermal coefficient of resistance (NTCR) behavior at lower frequency regions, together with the increasing of electrical conductivity with temperature [
17]. The increase in electrical conductivity could be due to the release of space charges which is causing the reduction of potential barrier strength [
16].
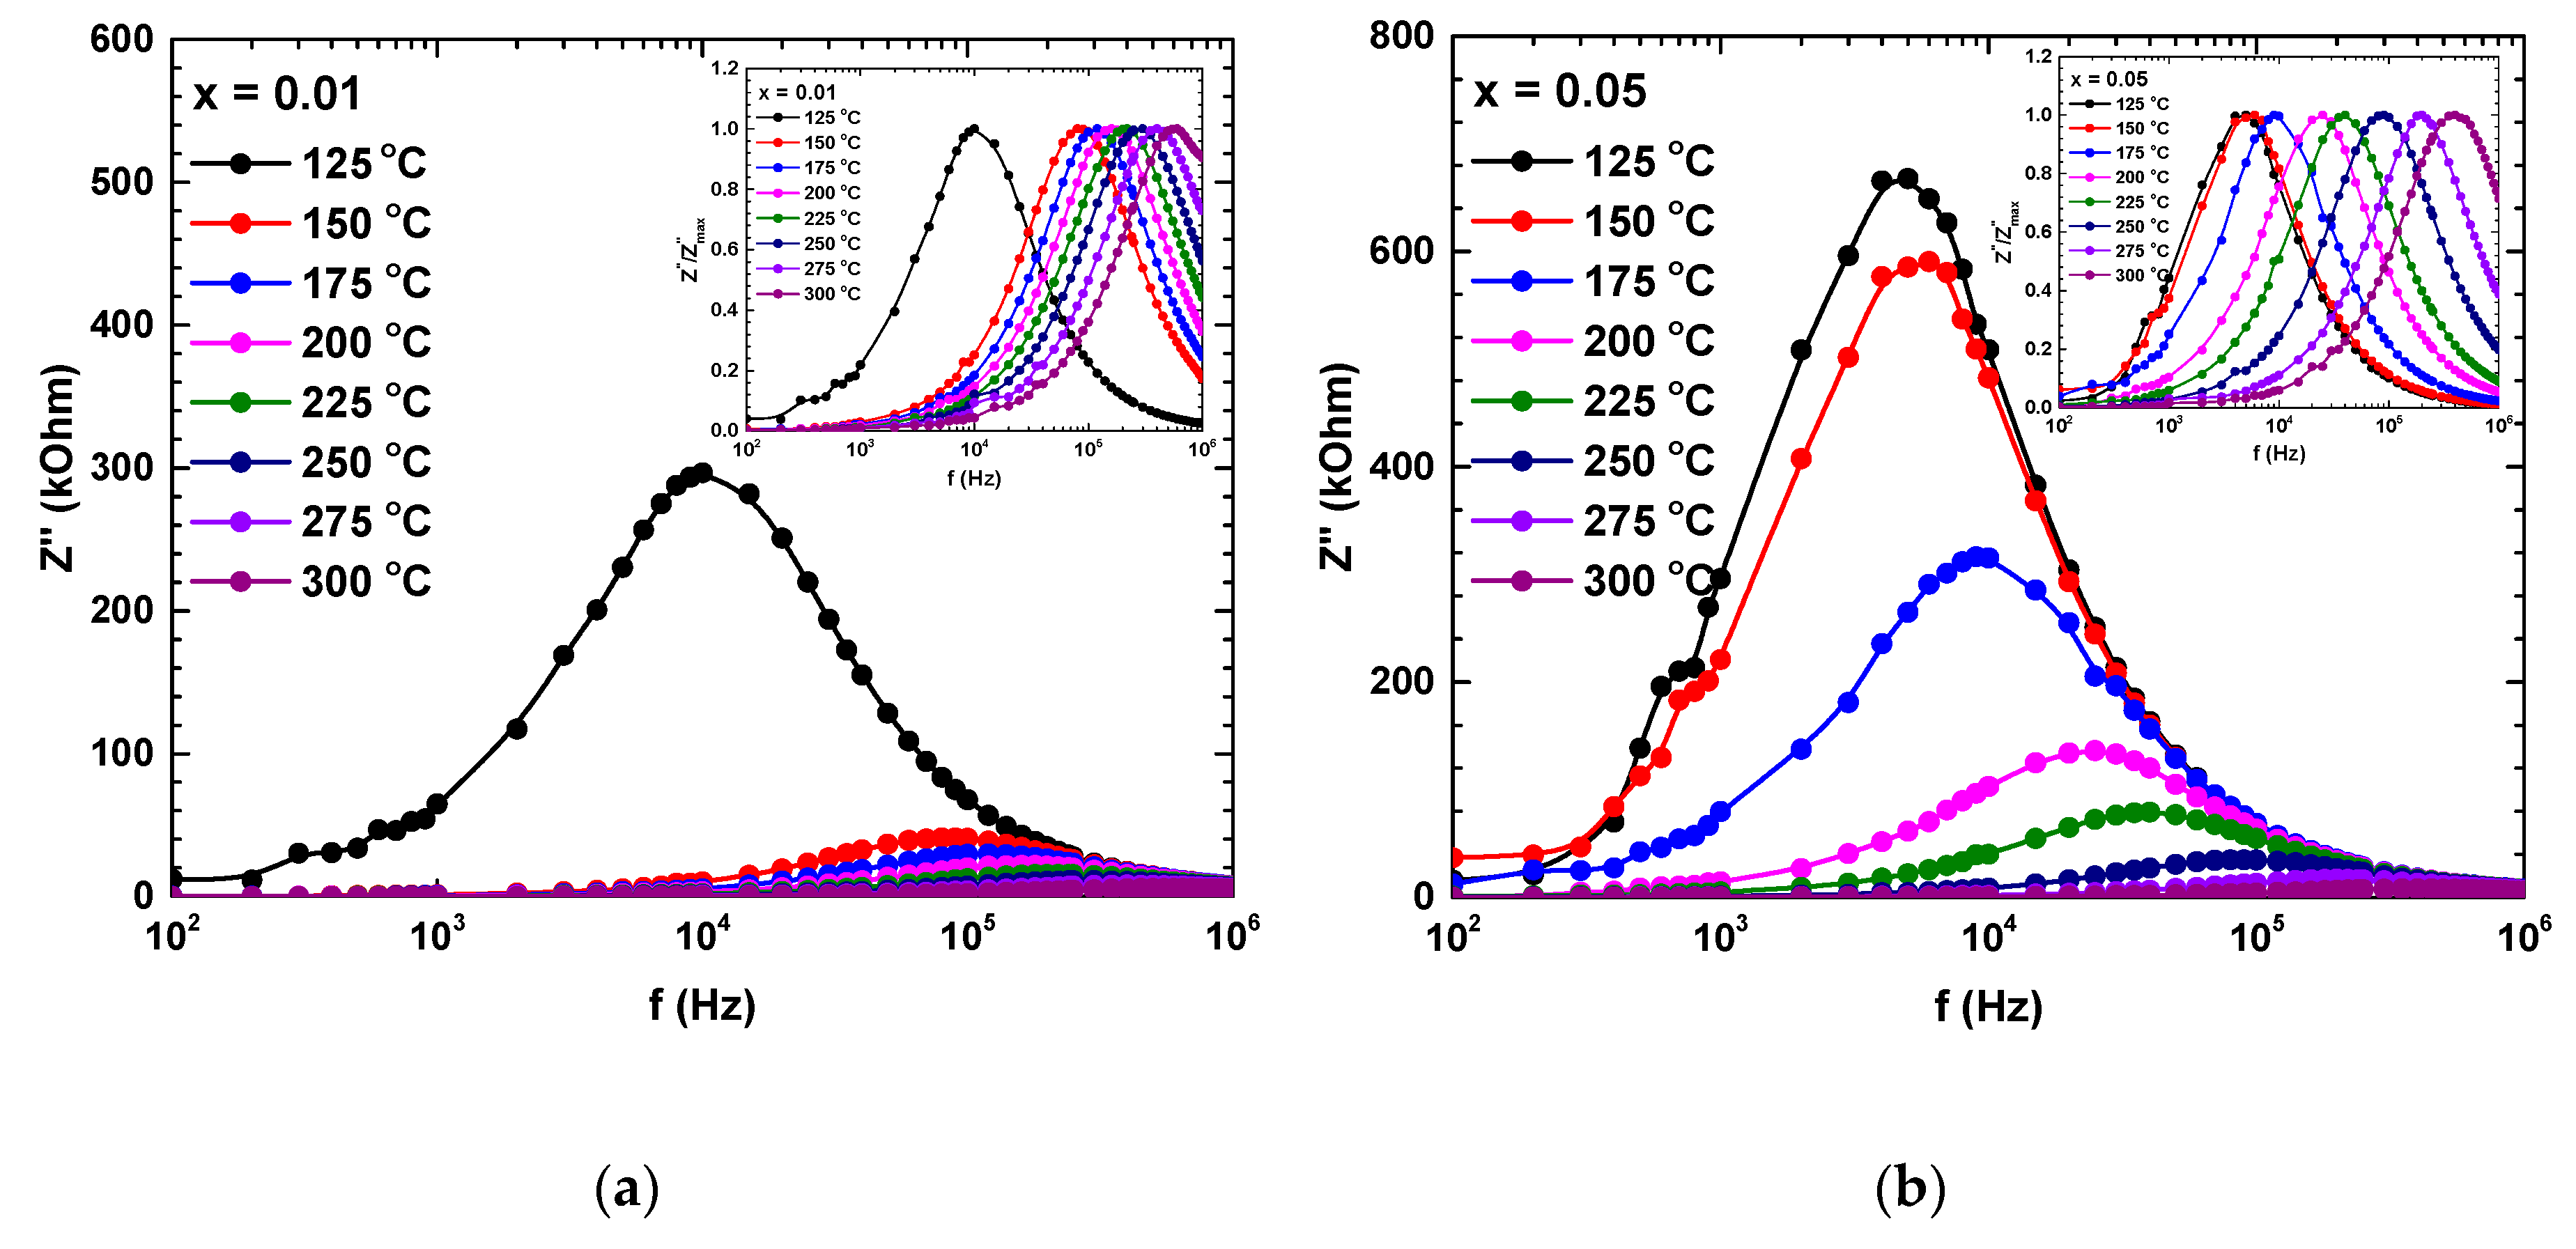
Figure 6 shows the imaginary part of the impedance (Z″) of LaFe
1−xZr
xO
3 ceramics as a function of the frequency at different temperatures. All the plots merge at the higher frequency region indicating the charge carrier through grains at higher frequency [
16,
18]. The increase in frequency is accompanied by an increase of Z″ until a maximum value is reached at a particular frequency, and then decreases with an increasing frequency, indicating the existence of a relaxation mechanism in the ceramics. The relaxation peaks shift to the high frequencies and become more broad with a rise in the temperature, indicating that the relaxation is thermally activated [
18].
By using the Arrhenius law [
19], the activation energy of the relaxation mechanism for each sample was calculated and tabulated in
Table 5. The activation energy increased with increasing Zr content, indicating the decreasing of charge carrier concentration in materials [
20]. The normalized spectra of the imaginary impedance in each sample are shown in the insets of
Figure 6. All normalized spectra were non-overlapping and scaled to the multiple master curve, suggesting the temperature-dependent and localized relaxation dynamics [
21].
3.4.2. Dielectric Analysis
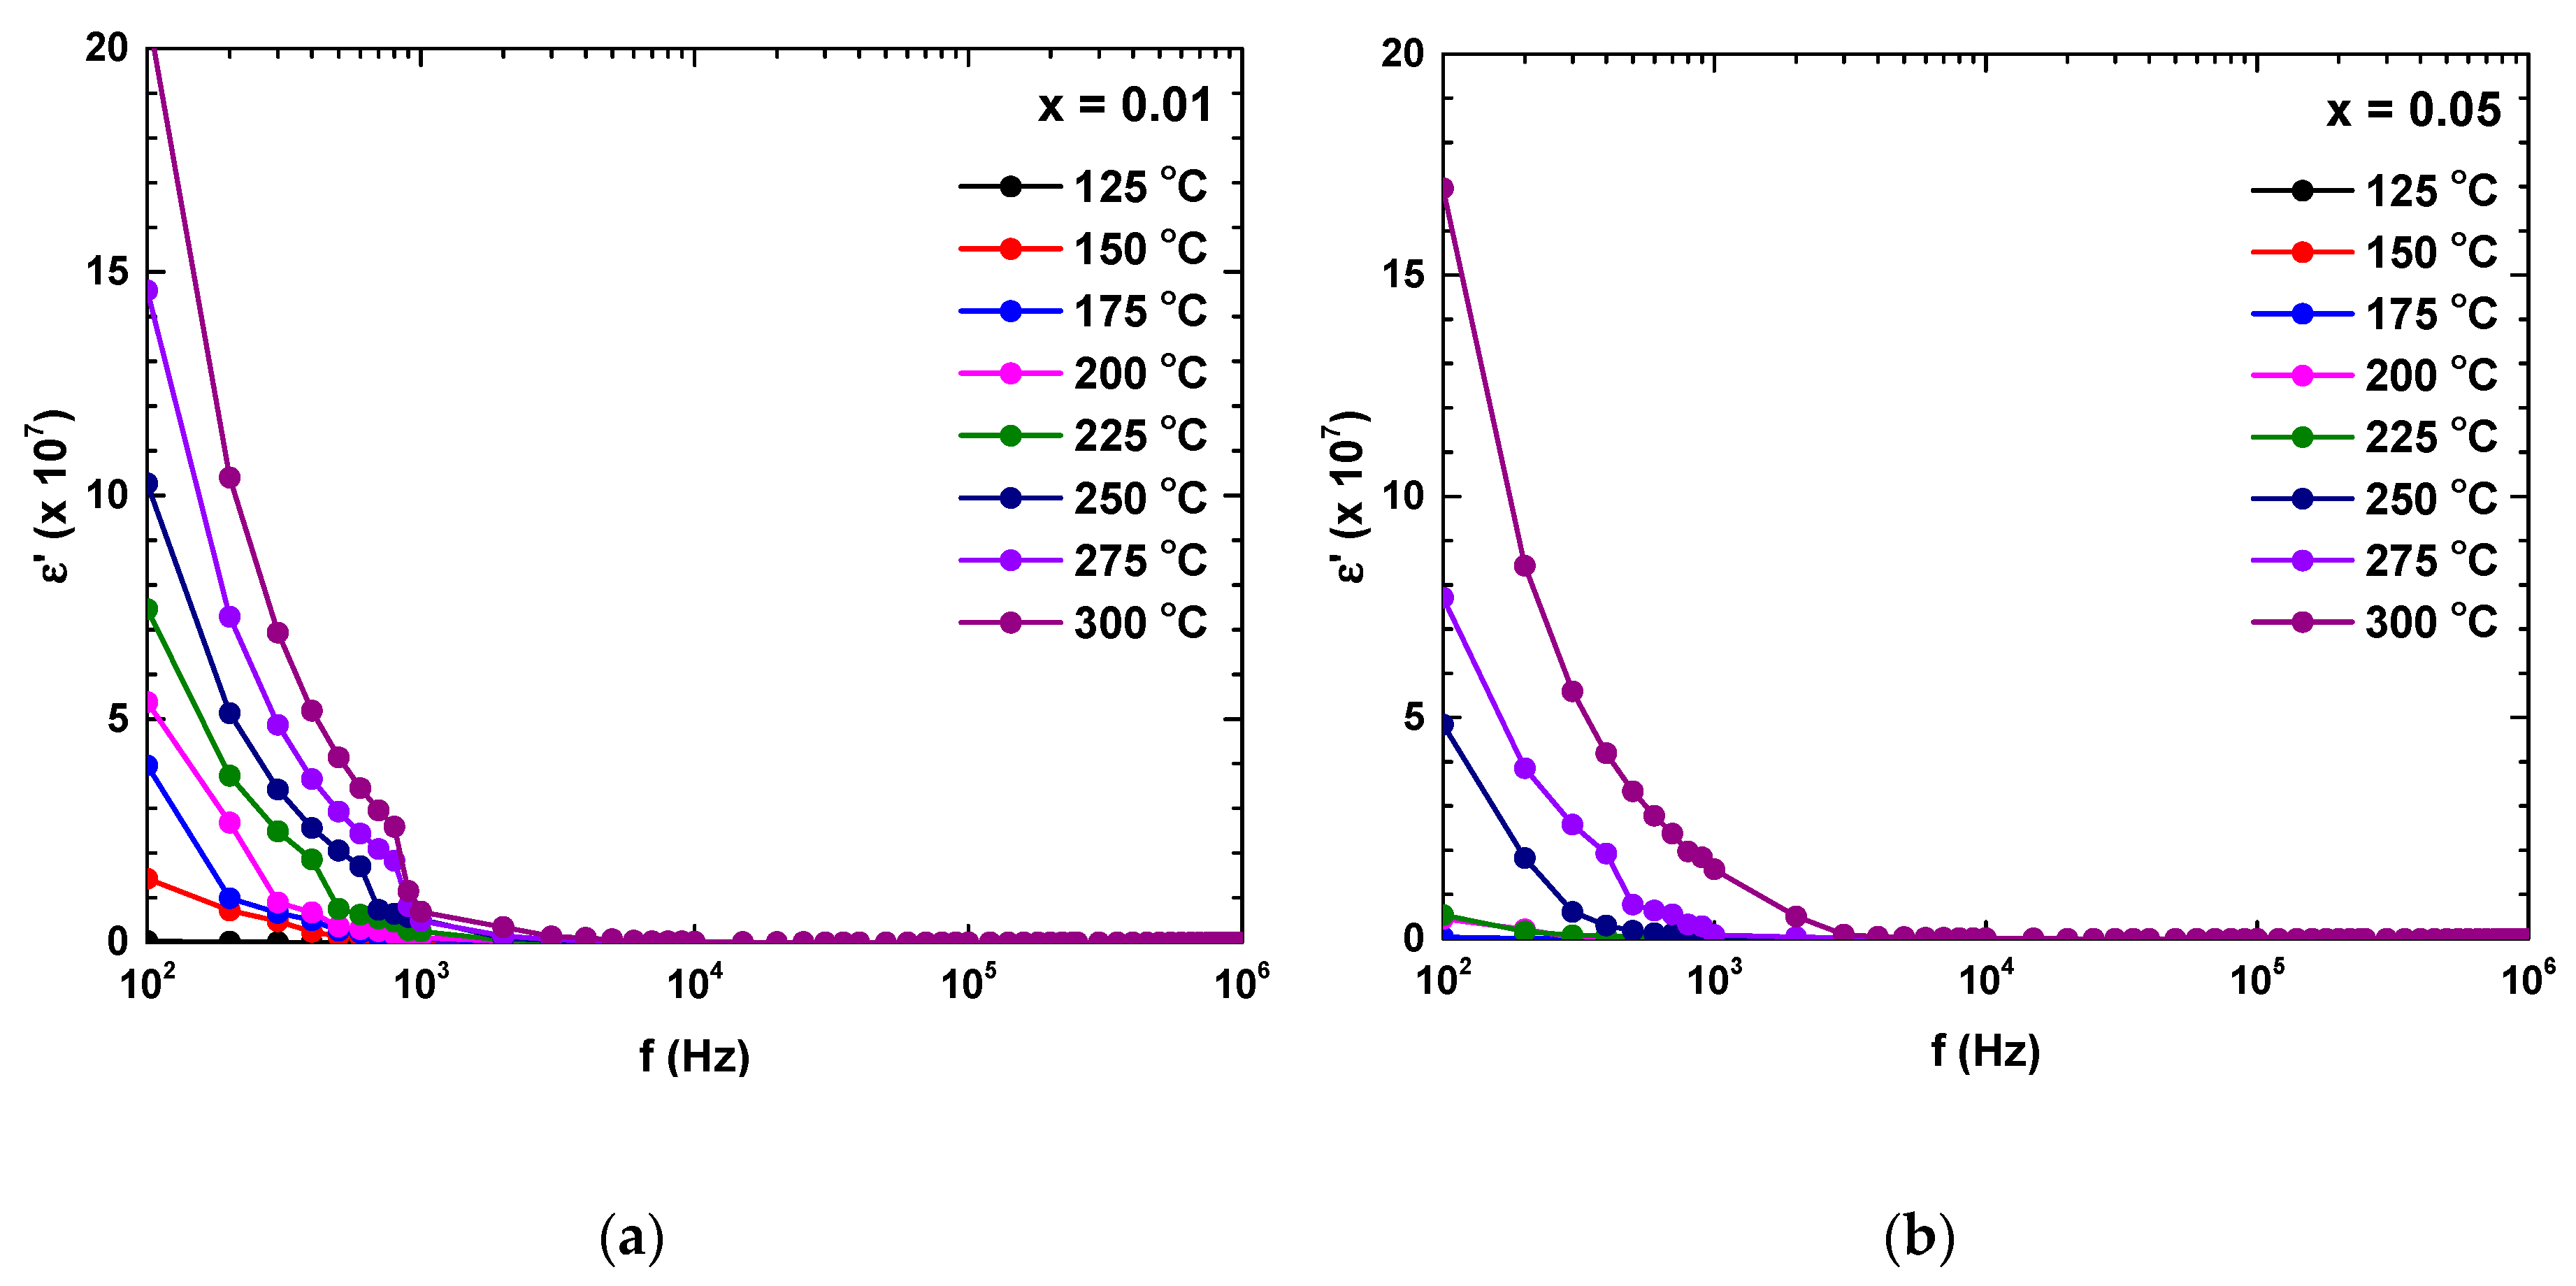
Figure 7 shows the dielectric constant of LaFe
1−xZr
xO
3 ceramics as a function of frequency at different temperatures. The dielectric constant decreases with increasing frequency. The dielectric constant at lower frequency is higher because all polarizations appear in this region which comes from the grain boundary effect, which is a characteristic of dielectric material [
22]. A decrease in the dielectric constant value is due to the reduction in ionic and dipolar polarizations at higher frequency regions. Moreover, the dielectric constant decreases with increasing Zr content.
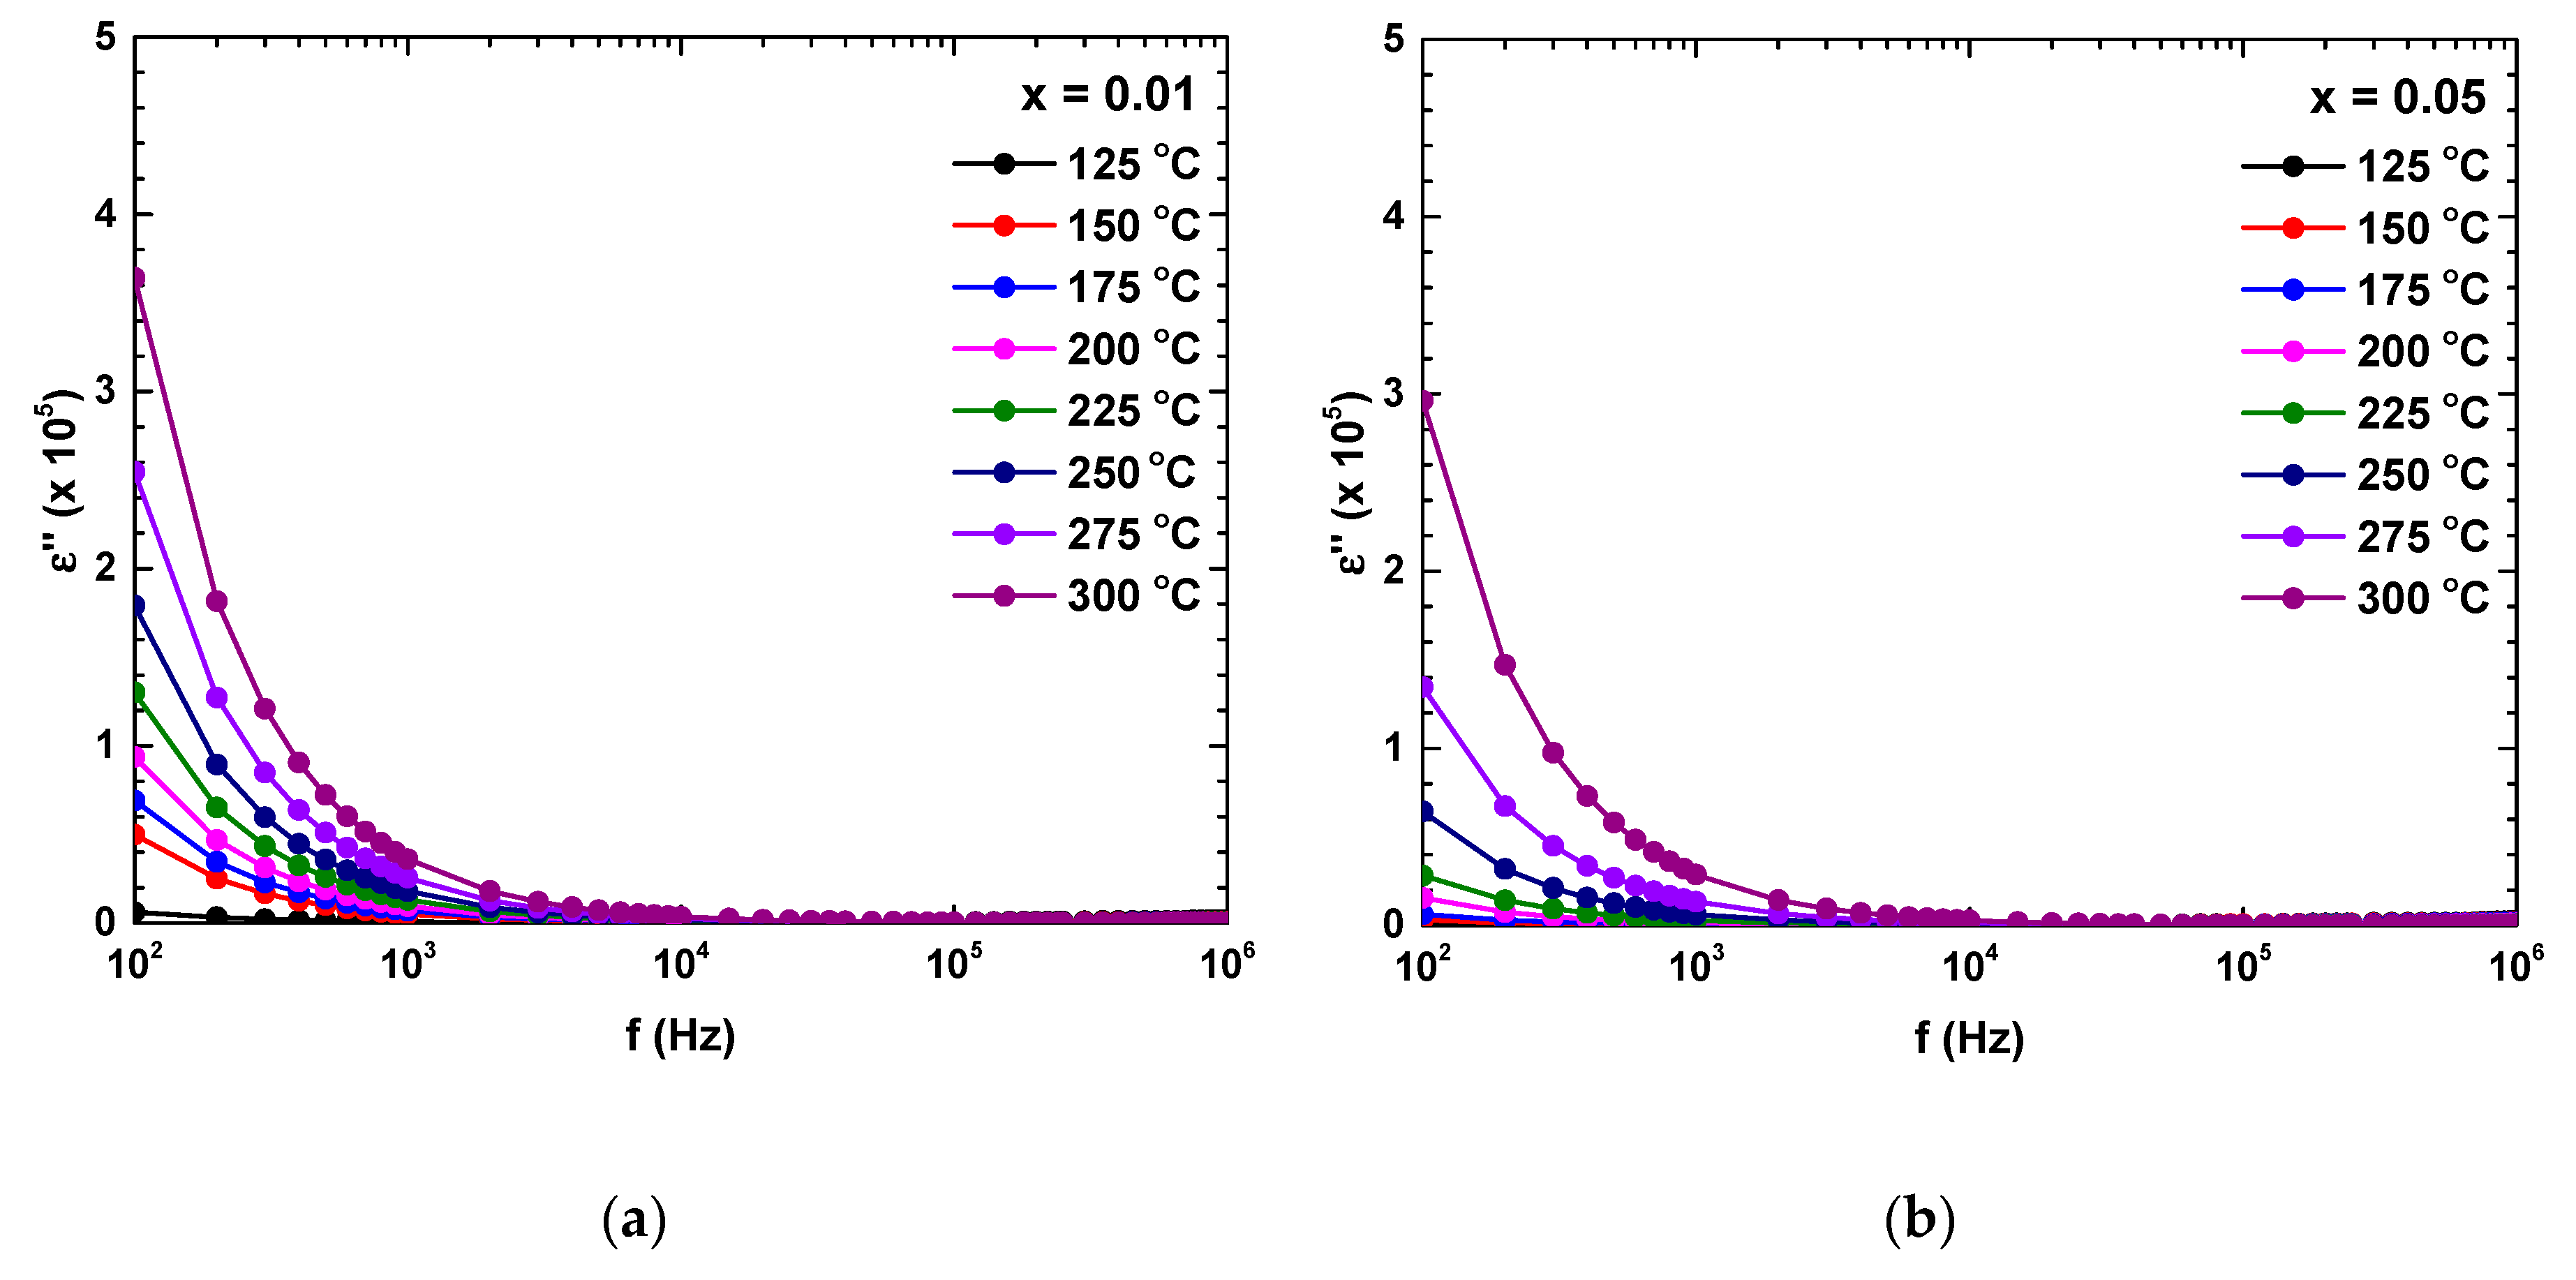
The evolution of dielectric loss as a function of frequency at different temperatures is shown in
Figure 8. The dielectric loss spectra have a similar trend with the dielectric constant. The dielectric loss decreases with increasing Zr content. This convinces the usefulness of the Zr substitution which has the significance of reducing the loss dielectric. Overall, the dielectric spectra analysis does not exhibit any specific anomaly associated with the phase transition in this temperature range.
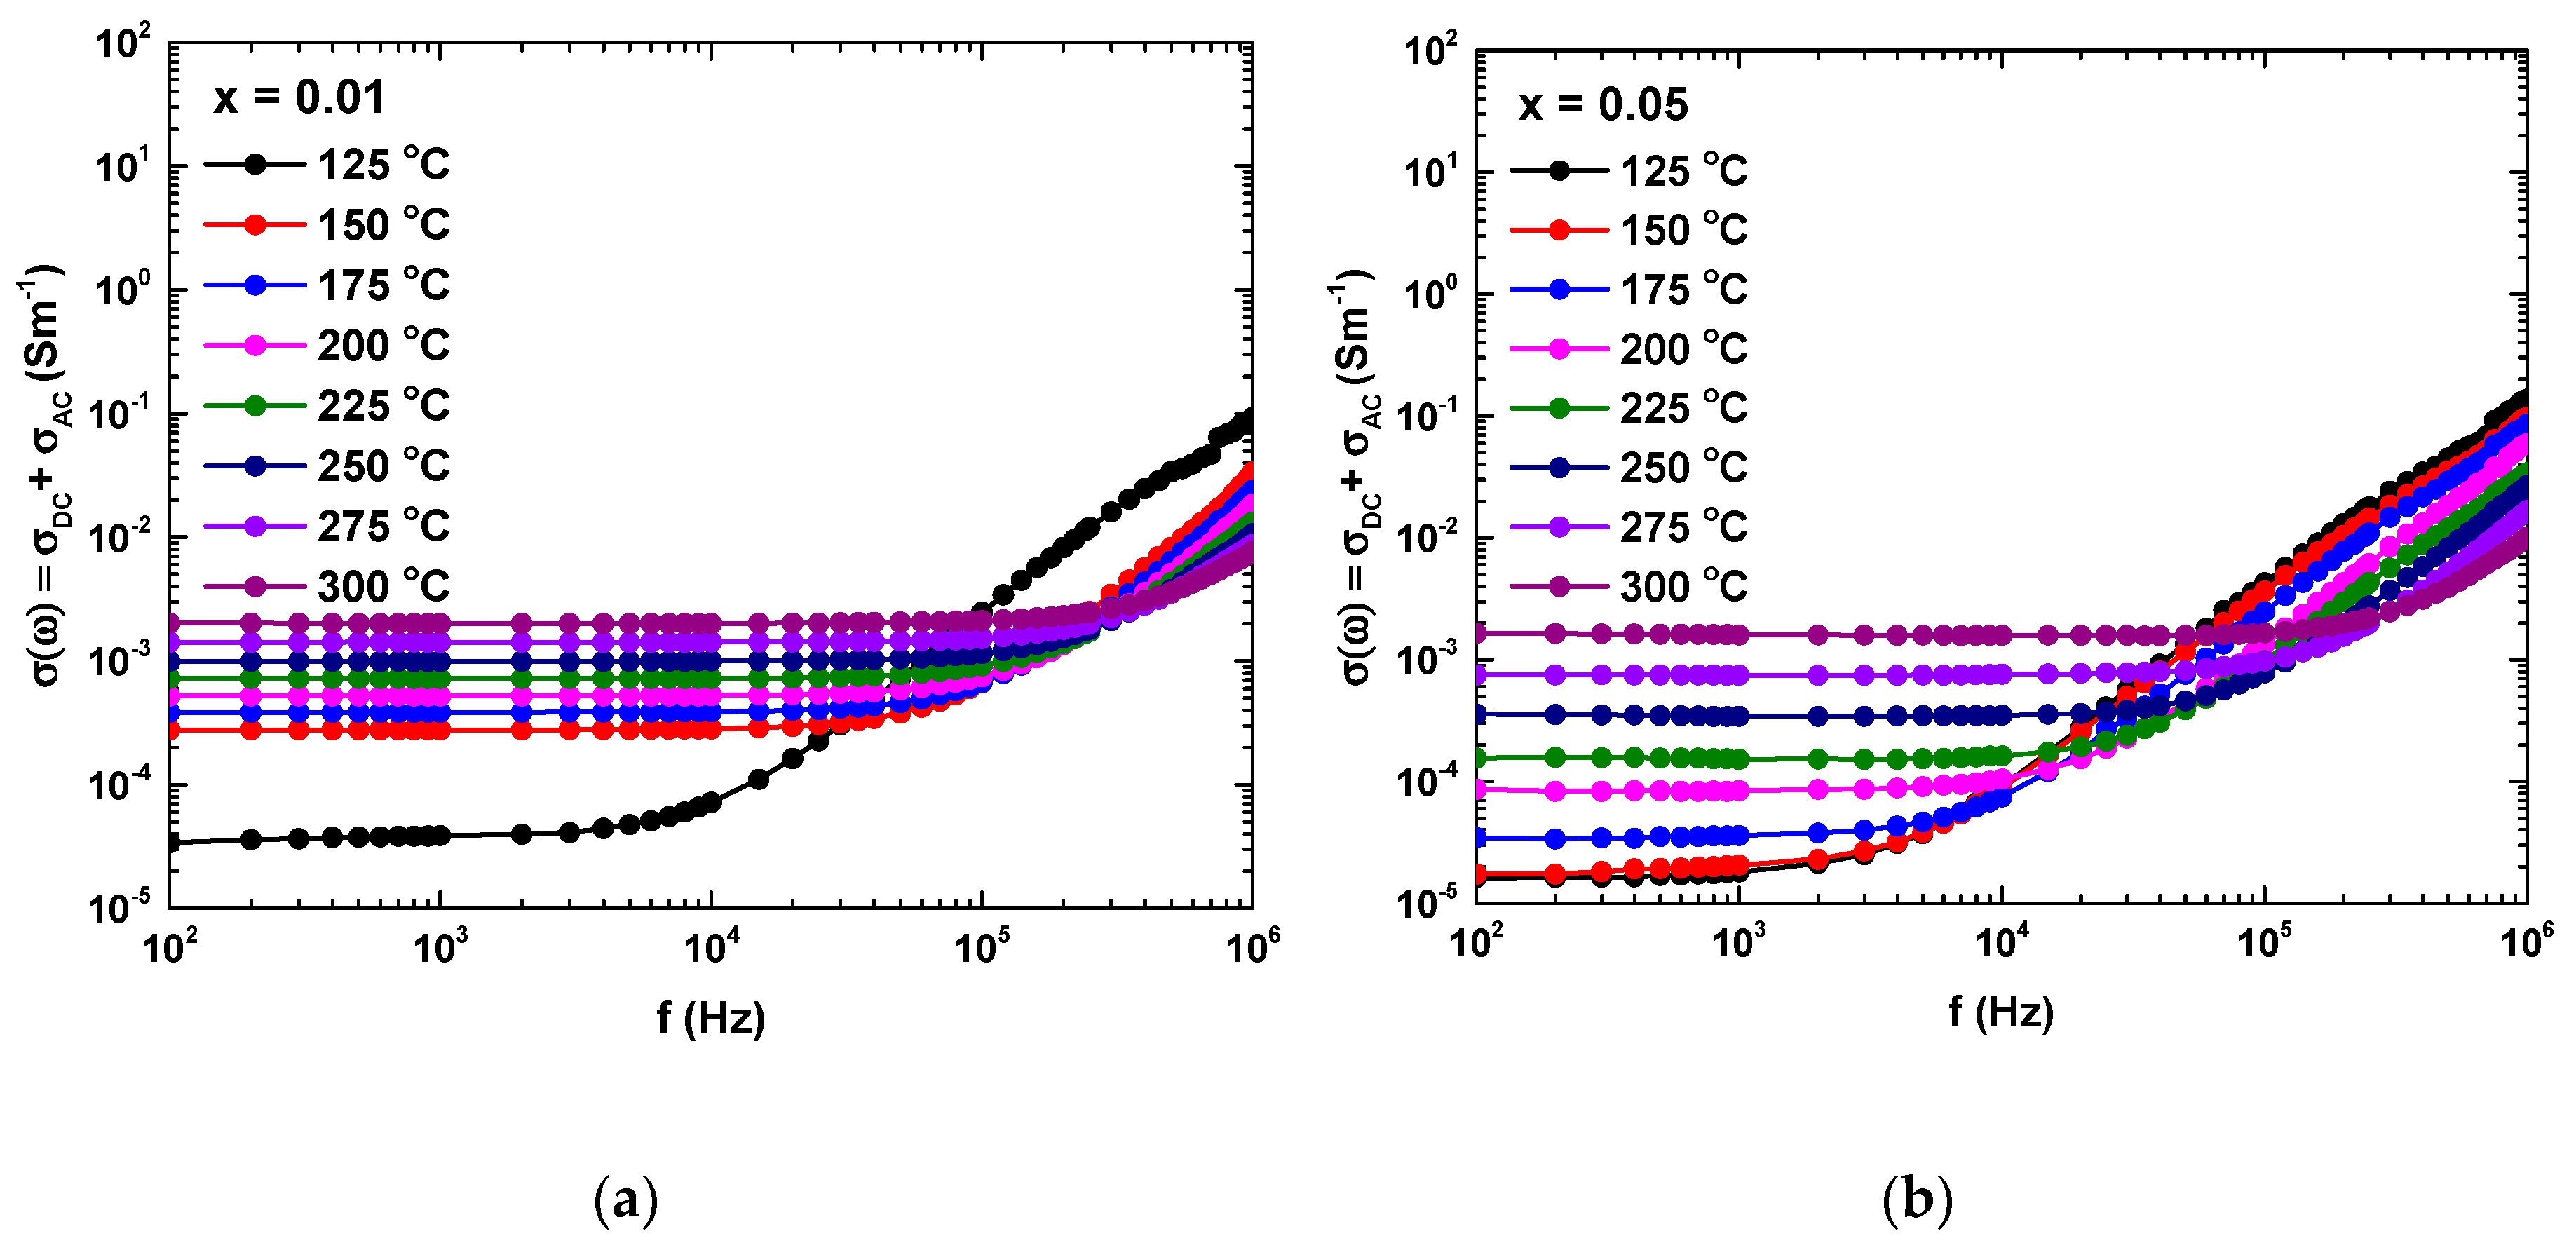
Figure 9 shows the complex conductivity for LaFe
1−xZr
xO
3 ceramics. It is clear that the plot σ(ω) consists of two different regions: Ac conductivity, increasing with the frequency approximating to linear function, and dc conductivity, dominating in low frequencies. The frequency dependence of the complex conductivity followed the Jonscher’s power law [
23]:
where
σDC is the DC conductivity,
ω is the (measured) angular frequency, the exponent
s is a temperature-dependent constant, and
A is a constant which strongly depends on the temperature and composition of the material. From this,
σDC as a function of temperature could be obtained.
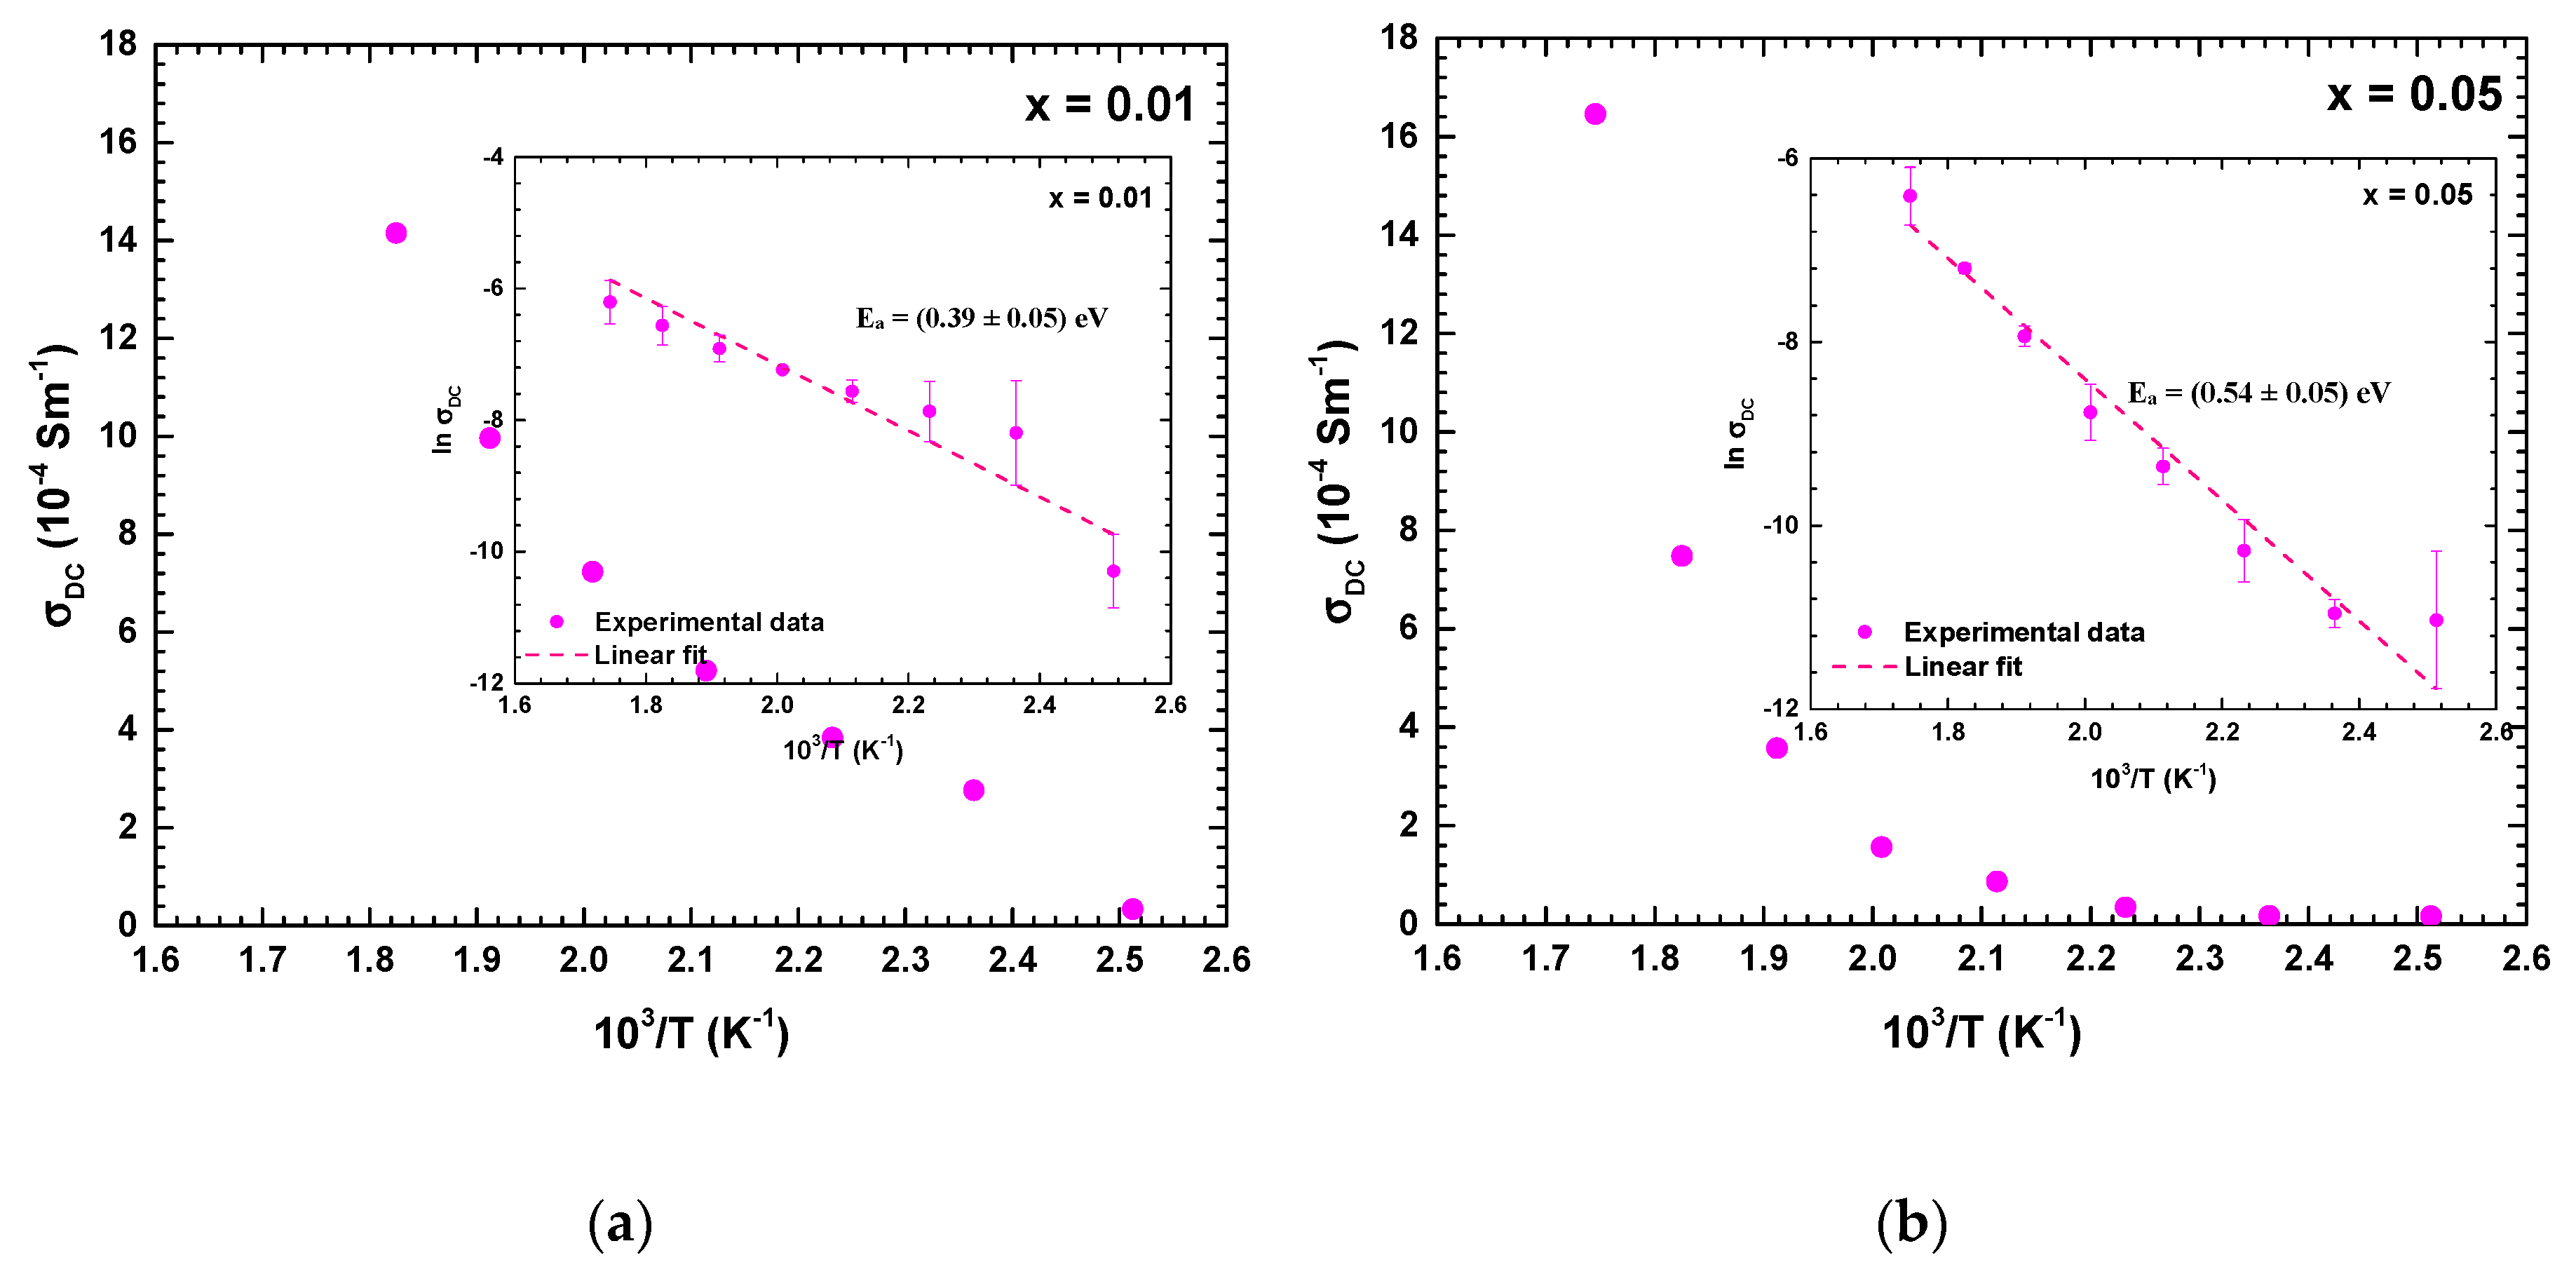
Figure 10 shows the dc conductivity versus 1000/T, including the inset shows dc conductivity as a function of temperature on a semi-logarithmic scale. The dc conductivity vs reciprocal temperature fulfils the Arrhenius law [
24]. The activation energy of the dc conductivity process was calculated from the slope of log σ
DC vs reciprocal temperature (10
3/T). It was found that the activation energy increased with increasing Zr content. The activation energy is in the range of 0.20 <
Ea < 1.0 eV, suggesting the dc conduction mechanism is dominated by polaron hopping [
25].
4. Conclusions
The effect of Zr substitution on LaFeO3 has been studied in this paper. The X-ray diffraction revealed that Zr substitution, until 5% molar concentration, still preserves the single phase of orthorhombic perovskite structure with Pbnm symmetry, followed by the increase of lattice constant with increasing Zr content. The average crystallite and grain size decrease with Zr content indicating the reduced degree of crystallinity. The phonon characteristics from Raman scattering analysis reflect the decrease in lattice disorder and crystal distortion with Zr content which is consistent with the decreased calculated tolerance factor. The dielectric parameters decrease with increasing Zr content. The activation energy calculated in relaxation and dc conduction mechanism is found to be increased with increasing Zr content.
Author Contributions
Conceptualization, D.T.; methodology, D.T., I.P., and R.A.R.; software, I.P. and R.A.R.; validation, D.T., I.P. and R.A.R.; formal analysis, D.T.; investigation, D.T. and I.P.; resources, I.P. and R.A.R.; data curation, I.P. and R.A.R.; writing—original draft preparation, D.T.; writing—review and editing, D.T.; visualization, I.P. and R.A.R.; supervision, D.T.; funding acquisition, D.T. and R.A.R. All authors have read and agreed to the published version of the manuscript.
Funding
The authors acknowledge funding HIBAH PUTI Q2—2020 from DRPM Universitas Indonesia.
Conflicts of Interest
The authors declare no conflict of interest.
References
- Taylor, F.H.; Buckeridge, J.; Catlow, C.R.A. Screening divalent metals for A- and B-site dopants in LaFeO3. Chem. Mater. 2017, 29, 8147–8157. [Google Scholar] [CrossRef]
- Moreira, R.L.; Lobo, R.P.S.M.; Ramos, S.L.L.M.; Sebastian, M.T.; Matinaga, F.M.; Righi, A.; Dias, A. Raman and infrared spectroscopic investigations of a ferro elastic phase transition in Ba2ZnTeO6 double perovskite. Phys. Rev. Mater. 2018, 2, 054406. [Google Scholar] [CrossRef]
- Mizusaki, J.; Yoshihiro, M.; Yamauchi, S.; Fueki, K. Nonstoichiometry and defect structure of the perovskite-type oxides La1−xSrxFeO3−δ. J. Solid State Chem. 1985, 58, 257–266. [Google Scholar] [CrossRef]
- Phokha, S.; Hunpratup, S.; Pinitsoontorn, S.; Putasaeng, B.; Rujirawat, S.; Maensiri, S. Structure, magnetic, and dielectric properties of Ti-doped LaFeO3 ceramics synthesized by polymer pyrolysis method. Mater. Res. Bull. 2015, 67, 118–125. [Google Scholar] [CrossRef]
- Diez-Garcia, M.I.; Gomez, R. Metal doping to enhance the photoelectrochemical behavior of LaFeO3 hotocathodes. ChemSusChem. 2017, 10, 2457–2463. [Google Scholar] [CrossRef] [PubMed] [Green Version]
- Liu, X.; Bin Cheng, B.; Hu, J.; Qin, H.; Jiang, M. Semiconducting gas sensor for ethanol based on LaMgxFe1−xO3 nanocrystals. Sens. Actuators B 2008, 129, 53–58. [Google Scholar] [CrossRef]
- Bhat, I.; Husain, S.; Khan, W.; Patil, S.I. Effect of Zn doping on structural, magnetic and dielectric properties of LaFeO3 synthesized through sol–gel auto-combustion process. Mater. Res. Bull. 2013. 48, 4506–4512. [CrossRef]
- Triyono, D.; Laysandra, H.; Liu, H.L.; Anugrah, A.W. Structural, optical and dielectric properties of LaFe1−xMnxO3 (x = 0.00, 0.05, 0.10, 0.15, and 0.20) perovskites. J. Matter. Sci. Mater. Electron. 2019, 30, 18584–18598. [Google Scholar] [CrossRef]
- Dash, S.; Choudhary, R.N.P.; Das, P.R.; Kumar, A. Structural, dielectric, and multiferroic properties of (Bi0.5K0.5)(Fe0.5Nb0.5)O3. Can. J. Phys. 2015, 93, 738–744. [Google Scholar] [CrossRef] [Green Version]
- Triyono, D.U.; Hanifah, U.; Laysandra, H. Structural and optical properties of Mg-substituted LaFeO3 nanoparticles prepared by a sol-gel method. Results Phys. 2020, 16, 102995. [Google Scholar] [CrossRef]
- Rousseau, D.L.; Bauman, R.P.; Porto, S.P.S. Normal mode determination in crystals. J. Raman Spectrosc. 1981, 10, 253. [Google Scholar] [CrossRef]
- Mahapatra, A.S.; Mitra, A.; Mallick, A.; Ghosh, M.; Chakrabarti, P.K. Enhanced magnetic property and phase transition in Ho3+ doped LaFeO3. Mater. Lett. 2016, 169, 160–163. [Google Scholar] [CrossRef]
- Triyono, D.; Laysandra, H.; Liu, H.L. Structural, optical, and dielectric studies of LaFe1−xMoxO3 (x = 0.0, 0.5) perovskite materials. J. Mater. Sci. Mater. Elektron. 2019, 30, 2512–2522. [Google Scholar] [CrossRef]
- Andreasson, J.; Holmlund, J.; Rauer, R.; Kall, M.; Borjesson, L.; Knee, C.S.; Eriksson, A.K.; Eriksson, S.G.; Rubhausen, M.; Chaudhury, R.P. Electron-phonon interactions in perovskites containing Fe and Cr studied by Raman scattering using oxygen-isotope and cation substitution. Phys. Rev. B 2008, 78, 235103. [Google Scholar] [CrossRef]
- Costa, M.M.; Pires Júnior, G.F.M.; Sombra, A.S.B. Impedance and modulus studies of magnetic ceramic oxide Ba2Co2Fe12O22 (Co2Y). Mater. Chem. Phys. 2010, 123, 35–39. [Google Scholar] [CrossRef]
- Ravikiran, U.; Elizabeth, Z.; Rajashekhar, G.; Sarah, P. Impedance spectroscopy studies on samarium and sodium substituted strontium bismuth titanate (SBTi). Ceram. Int. 2019, 45, 15188. [Google Scholar] [CrossRef]
- Bechera, B.; Nayak, P.; Choudhary, R.N.P. Impedance spectroscopy study of NaBa2V5O15 ceramic. Mater. Res. Bull. 2008, 43, 401. [Google Scholar] [CrossRef]
- Srivastava, K.K.; Kumar, A.; Panwar, O.S.; Lakshminarayan, K.N. Dielectric relaxation study of chalcogenide glasses. Non-Crystalline Solids 1979, 3, 33. [Google Scholar] [CrossRef]
- Omri, A.; Bejar, M.; Dhahri, E.; Es-Souni, M.; Valente, M.A.; Graça, M.P.F.; Costa, L.C. Electrical conductivity and dielectric analysis of La0.75(Ca,Sr)0.25Mn0.85Ga0.15O3 perovskite compound. J. Alloys Compd. 2012, 536, 173–178. [Google Scholar] [CrossRef]
- Mohamed, Z.; Brahem, R.; Dhahri, J.; Khirouni, K.; Hlil, E.K. Electrical properties of La0.67Sr0.16Ca0.17MnO3 perovskite. Phase Transit. 2016, 89, 958–969. [Google Scholar] [CrossRef]
- Gerhardt, R. Impedance and dielectric spectroscopy revisited: Distinguishing localized relaxation from long-rang conductivity. Phys. Chem. Solids 1994, 55, 1491–1506. [Google Scholar] [CrossRef]
- Adrian, R.; Dariusz, L.; Marek, K.; Jaroslaw, M.; Patryk, W. Electrical conduction mechanism and dielectric properties of spherical shaped Fe3O4 nanoparticles synthesized by Co-Precipitation method. Materials 2018, 11, 735. [Google Scholar]
- Kumari, R.; Ahlawat, N.; Agarwal, A.; Sanghi, S.; Sindhu, M. Structural transformation and investigation of dielectric properties of Ca substituted (Na0.5Bi0.5)0.95−xBa0.05CaxTiO3 ceramics. J. Alloys Compd. 2017, 695, 3282–3289. [Google Scholar] [CrossRef]
- Kharrat, A.B.J.; Moutia, N.; Khirouni, K.; Boujelben, W. Tuning the magnetic and magnetotransport properties of Pr0.8Sr0.2MnO3 manganites through Bi-doping. Mater. Res. Bull. 2018, 105, 75–83. [Google Scholar] [CrossRef]
- Rai, A.; Thakur, A.K. Influence of co-substitution driven property tailoring in lanthanum orthoferrites (LaFeO3). Ceram. Int. 2017, 43, 13828–13838. [Google Scholar] [CrossRef]
Figure 1.
XRD pattern of LaFe1−xZrxO3 annealed at 800 °C for 6 h.
Figure 1.
XRD pattern of LaFe1−xZrxO3 annealed at 800 °C for 6 h.
Figure 2.
Raman scattering spectra of LaFe1−xZrxFeO3 ceramics with (a) x = 0.01, and (b) x = 0.05 at room temperature.
Figure 2.
Raman scattering spectra of LaFe1−xZrxFeO3 ceramics with (a) x = 0.01, and (b) x = 0.05 at room temperature.
Figure 3.
SEM-EDX of LaFe1−xZrxO3 annealed at 800 °C for 6 h. (a) and (c) represent SEM images of x = 0.01 and 0.05, respectively. (b) and (d) represent EDX spectrum of x = 0.01 and 0.05, respectively.
Figure 3.
SEM-EDX of LaFe1−xZrxO3 annealed at 800 °C for 6 h. (a) and (c) represent SEM images of x = 0.01 and 0.05, respectively. (b) and (d) represent EDX spectrum of x = 0.01 and 0.05, respectively.
Figure 4.
Nyquist plots of LaFe1−xZrxO3 with (a) x = 0.01 and (b) x = 0.05 annealed at 800 °C for 6 h at different temperatures.
Figure 4.
Nyquist plots of LaFe1−xZrxO3 with (a) x = 0.01 and (b) x = 0.05 annealed at 800 °C for 6 h at different temperatures.
Figure 5.
Bode plots for Z′(f) of LaFe1−xZrxO3 with (a) x = 0.01 and (b) x = 0.05 annealed at 800 °C for 6 h at different temperatures.
Figure 5.
Bode plots for Z′(f) of LaFe1−xZrxO3 with (a) x = 0.01 and (b) x = 0.05 annealed at 800 °C for 6 h at different temperatures.
Figure 6.
Bode plots for Z″(f) of LaFe1−xZrxO3 with (a) x = 0.01 and (b) x = 0.05 annealed at 800 °C for 6 h at different temperatures.
Figure 6.
Bode plots for Z″(f) of LaFe1−xZrxO3 with (a) x = 0.01 and (b) x = 0.05 annealed at 800 °C for 6 h at different temperatures.
Figure 7.
Dielectric constant, ε′(f), of LaFe1−xZrxO3 with (a) x = 0.01 and (b) x = 0.05 annealed at 800 °C for 6 h at different temperatures.
Figure 7.
Dielectric constant, ε′(f), of LaFe1−xZrxO3 with (a) x = 0.01 and (b) x = 0.05 annealed at 800 °C for 6 h at different temperatures.
Figure 8.
Dielectric loss, ε″(f), of LaFe1−xZrxO3 with (a) x = 0.01 and (b) x = 0.05 annealed at 800 °C for 6 h at different temperatures.
Figure 8.
Dielectric loss, ε″(f), of LaFe1−xZrxO3 with (a) x = 0.01 and (b) x = 0.05 annealed at 800 °C for 6 h at different temperatures.
Figure 9.
Complex conductivity, σ(f), of LaFe1−xZrxO3 with (a) x = 0.01 and (b) x = 0.05 annealed at 800 °C for 6 h at different temperatures.
Figure 9.
Complex conductivity, σ(f), of LaFe1−xZrxO3 with (a) x = 0.01 and (b) x = 0.05 annealed at 800 °C for 6 h at different temperatures.
Figure 10.
DC conductivity, σDC, of LaFe1−xZrxO3 with (a) x = 0.01 and (b) x = 0.05 annealed at 800 °C for 6 h at different temperatures.
Figure 10.
DC conductivity, σDC, of LaFe1−xZrxO3 with (a) x = 0.01 and (b) x = 0.05 annealed at 800 °C for 6 h at different temperatures.
Table 1.
Crystallographic parameters of the LaFe1−xZrxO3 annealed at 800 °C for 6 h, obtained by the FullProf 2k programme.
Table 1.
Crystallographic parameters of the LaFe1−xZrxO3 annealed at 800 °C for 6 h, obtained by the FullProf 2k programme.
| x | Parameters |
|---|
| a (Å) | b (Å) | c (Å) | Volume (Å3) | Crystallite Size (nm) |
|---|
| 0.01 | 5.5556(8) | 5.5631(9) | 7.8569(9) | 242.83(9) | 68.7(1) |
| 0.05 | 5.5615(3) | 5.5720(4) | 7.8646(0) | 243.71(7) | 59.9(2) |
Table 2.
Atoms, Wickoff position, and modes representation of LaFe1−xZrxO3 (x = 0.01, 0.05) with Pbnm symmetry.
Table 2.
Atoms, Wickoff position, and modes representation of LaFe1−xZrxO3 (x = 0.01, 0.05) with Pbnm symmetry.
| Atom | Wickoff Position | Modes Representation |
|---|
| La | 4c | 2Ag + B1g + 2B2g + B3g + Au + 2B1u + B2u + 2B3u |
| Fe/Zr | 4a | 3Au + 3B1u + 3B2u + 3B3u |
| O1 | 4c | 2Ag + B1g + 2B2g + B3g + Au + 2B1u + B2u + 2B3u |
| O2 | 8d | 3Ag + 3B1g + 3B2g + 3B3g + 3Au + 3B1u + 3B2u + 3B3u |
Table 3.
Geometrical parameters characterizing the crystal structure of LaFe1−xZrxO3 annealed at 800 °C for 6 h.
Table 3.
Geometrical parameters characterizing the crystal structure of LaFe1−xZrxO3 annealed at 800 °C for 6 h.
| Parameters | x = 0.01 | x = 0.05 |
|---|
| Atomic Position | | |
| La | x | 0.998 | 0.993 |
| y | 0.027 | 0.030 |
| z | 0.25 | 0.25 |
| Fe/Zr | x | 0 | 0 |
| y | 0.5 | 0.5 |
| z | 0 | 0 |
| O1 | x | 0.719 | 0.719 |
| y | 0.302 | 0.302 |
| z | 0.029 | 0.029 |
| O2 | x | 0.023 | 0.08 |
| y | 0.496 | 0.485 |
| z | 0.25 | 0.25 |
| Bond Angle (°) | | |
| Fe/Zr–O2–Fe/Zr | 154.03(8) | 154.08(2) |
| Fe/Zr–O1–Fe/Zr | 157.08(1) | 157.07(3) |
| Bond Length (Å) | | |
| La–O1 (m) | 2.4508(8) | 2.4536(4) |
| La–O1 (l) | 2.7602(1) | 2.7629(1) |
| La–O2 (s) | 2.3812(2) | 2.3859(2) |
| 〈La–O〉 | 2.5307(3) | 2.5341(2) |
| Fe/Zr–O1 (m) | 2.0125(2) | 2.0166(6) |
| Fe/Zr–O1 (s) | 1.9234(4) | 1.9254(3) |
| Fe/Zr–O2 (l) | 2.0859(1) | 2.0890(9) |
| 〈Fe/Zr–O〉 | 2.0073(2) | 2.0104(6) |
| Tolerance Factor | 0.8914(9) | 0.8909(1) |
| Average Tilt Angle 〈φ〉 (°) | 14.923(9) | 14.915(2) |
| R-Factors | | |
| Rp | 5.35 | 5.51 |
| Rwp | 6.99 | 7.44 |
| Rexp | 5.28 | 5.53 |
| χ2 | 1.76 | 1.81 |
Table 4.
Frequency and symmetry assignment of some specific Raman-active phonon modes (ω) observed for LaFe1−xZrxFeO3 (x = 0.01, 0.05) at room temperature. All units are cm−1.
Table 4.
Frequency and symmetry assignment of some specific Raman-active phonon modes (ω) observed for LaFe1−xZrxFeO3 (x = 0.01, 0.05) at room temperature. All units are cm−1.
| | ω1 | ω2 | ω3 | ω4 | ω5 | ω6 | ω7 |
|---|
| x = 0.0 | 150.2 | 173.9 | 288.4 | 428.5 | 637.5 | 1128 | 1304 |
| x = 0.5 | 147.9 | 171.4 | 286.5 | 427.2 | 637.7 | 1133 | 1303 |
| Symmetry | Ag | Ag | Ag | Ag | B1g | Second-order | Second-order |
Table 5.
Activation energy of the LaFe1−xZrxFeO3 (x = 0.01, 0.05) ceramics.
Table 5.
Activation energy of the LaFe1−xZrxFeO3 (x = 0.01, 0.05) ceramics.
| x | |
|---|
| 0.01 | 0.43 |
| 0.05 | 0.51 |
© 2020 by the authors. Licensee MDPI, Basel, Switzerland. This article is an open access article distributed under the terms and conditions of the Creative Commons Attribution (CC BY) license (http://creativecommons.org/licenses/by/4.0/).


