Review

Raman Scattering: From Structural Biology to Medical Applications

by
Alexey V. Vlasov
1,2,
Nina L. Maliar
1,
Sergey V. Bazhenov
1,
Evelina I. Nikelshparg
3,
Nadezda A. Brazhe
3,
Anastasiia D. Vlasova
1,
Stepan D. Osipov
1,
Vsevolod V. Sudarev
1,
Yury L. Ryzhykau
1,
Andrey O. Bogorodskiy
1,
Egor V. Zinovev
1,2,4,
Andrey V. Rogachev
1,5,
Ilya V. Manukhov
1,
Valentin I. Borshchevskiy
1,4,6,
Alexander I. Kuklin
1,5,
Jan Pokorný
7,
Olga Sosnovtseva
8,
Georgy V. Maksimov
3 and
Valentin I. Gordeliy
1,4,6,9,*
1
Research Center for Molecular Mechanisms of Aging and Age-Related Diseases, Moscow Institute of Physics and Technology, 141700 Dolgoprudny, Russia
2
Institute of Crystallography, RWTH Aachen University, 52066 Aachen, Germany
3
Biophysics Department, Biological Faculty, Moscow State University, 119234 Moscow, Russia
4
Institute of Complex Systems (ICS), ICS-6: Structural Biochemistry, Research Centre Jülich, 52425 Jülich, Germany
5
Joint Institute for Nuclear Research, 141980 Dubna, Russia
6
JuStruct: Jülich Center for Structural Biology, Forschungszentrum Jülich, 52425 Jülich, Germany
7
Institute of Physics of the Czech Academy of Sciences, 18221 Prague, Czech Republic
8
Department of Biomedical Sciences, Faculty of Health and Medical Sciences, University of Copenhagen, 2200 Copenhagen, Denmark
9
Institut de Biologie Structurale Jean-Pierre Ebel, Université Grenoble Alpes—Commissariat à l’Energie Atomique et aux Energies Alternatives—CNRS, 38044 Grenoble, France
*
Author to whom correspondence should be addressed.
Crystals 2020, 10(1), 38; https://doi.org/10.3390/cryst10010038
Submission received: 9 December 2019 / Revised: 9 January 2020 / Accepted: 10 January 2020 / Published: 15 January 2020
(This article belongs to the Special Issue Raman Spectroscopy of Crystals)

Abstract

:
This is a review of relevant Raman spectroscopy (RS) techniques and their use in structural biology, biophysics, cells, and tissues imaging towards development of various medical diagnostic tools, drug design, and other medical applications. Classical and contemporary structural studies of different water-soluble and membrane proteins, DNA, RNA, and their interactions and behavior in different systems were analyzed in terms of applicability of RS techniques and their complementarity to other corresponding methods. We show that RS is a powerful method that links the fundamental structural biology and its medical applications in cancer, cardiovascular, neurodegenerative, atherosclerotic, and other diseases. In particular, the key roles of RS in modern technologies of structure-based drug design are the detection and imaging of membrane protein microcrystals with the help of coherent anti-Stokes Raman scattering (CARS), which would help to further the development of protein structural crystallography and would result in a number of novel high-resolution structures of membrane proteins—drug targets; and, structural studies of photoactive membrane proteins (rhodopsins, photoreceptors, etc.) for the development of new optogenetic tools. Physical background and biomedical applications of spontaneous, stimulated, resonant, and surface- and tip-enhanced RS are also discussed. All of these techniques have been extensively developed during recent several decades. A number of interesting applications of CARS, resonant, and surface-enhanced Raman spectroscopy methods are also discussed.

1. Introduction

Raman spectroscopy (RS) is an experimental method for detecting molecular vibrations, or other excitations, such as rotational modes, energy gap in superconductors, etc. It is sensitive to local structure, so it can be used to fine-tune structural data obtained by other methods, such as X-ray diffraction (XRD). RS is based on inelastic scattering of light (Raman scattering). The pioneering works that laid the foundation for research while using the non-Rayleigh scattering method, later called Raman spectroscopy, were published in 1923–1928 [1,2,3]. The theory of Raman scattering in crystals was developed in 1947 [4]. However, RS applications to the studies of biomolecules were demonstrated later. Since the 1960s, laser-excited Raman spectroscopy has been widely used in investigation of both small biomolecules [5] and biopolymers [6,7,8,9].
This review aims to show the potential of RS in applications for structural studies of different biological objects in a range from small peptides to proteins and protein complexes. RS might reveal previously unknown structural peculiarities of these objects and provide insight into their interactions in native and artificial environments. The structural RS studies underlie diverse biotechnology applications in drug design, diagnostic and therapeutic, bioengineering of proteins, and other macromolecules with desirable properties.
The link between structural biology and medical applications is based on understanding the function of membrane proteins—drug targets for certain diseases through the structural studies of these targets at molecular level. In this review, we show that Raman scattering is highly efficient when it is used complementarily with other techniques for structural studies of membrane proteins and protein complexes (X-ray diffraction on synchrotron sources, XFEL, cryo-EM, etc.). One of the bottlenecks of protein crystallography is the detection of membrane protein microcrystals for contemporary protein crystallographic research. The existing methods of imaging crystals are not sensitive enough to detect protein chiral crystals at submicron and micron scale, which are buried in lipid membrane-mimicking crystallization matrices. CARS might solve the problem of microcrystals detection, however, it is more efficient when complementarily used with other methods for imaging crystallization samples (SHG, UV-TPEF, or SONICC technique) [10].
Structural studies of photoactive proteins are another possible application of RS, especially rhodopsins, being used as a core of optogenetics. Optogenetics is a powerful technique that was primarily viewed as a tool for studying neuroscience and brain mapping [11,12]. Nowadays, it has a broad range of applications and it is also used to recover neuronal pathways that are impaired as a result of neurodegenerative diseases, traumas, or stroke [13], studying nociceptive function of peripheral nervous system important for pain treatment [14], engineering retinal implants [15], investigation of cardiac tissue [16], developmental biology [17], and controlling cellular processes with light [18].
However, only a few of these proteins are actually applicable in optogenetics, despite several high-resolution structures of microbial rhodopsins from all domains of life [19]. One of the reasons is that important properties, such as ion selectivity and conductivity of native proteins, are not always suitable for optogenetics applications. High resolution structure in the crystal might differ from actual protein state in nature due to crystallization conditions. RS might fill the gap in our knowledge of protein structure dynamics providing data of light-induced changes of chromophore geometry and conformation [20], consequently giving an insight into protein function.
RS is applied to distinguish between normal tissue and cancer tumor and specify the types of tumors [21]. In modern research, cluster analysis neural networks are often used to analyze RS data [22,23,24]. RS complementarily applied with SHG, UV-TPEF, and other imaging techniques is a promising approach for fast and accurate non-invasive cancer diagnostics [23,25]. In addition, RS can be a useful tool for monitoring cancer cell response for therapy [26,27,28].
The detection of nucleic acids plays an essential role in a number of applications, including clinical diagnostics and food safety monitoring [29,30]. Raman difference spectroscopy (subtraction of spectra) allows for quantitatively characterizing nucleic acid conformational changes that are caused by the addition of binding agents (i.e., ions, proteins, drugs) or induced by altering environmental factors (temperature, pH, salinity, etc.) [31,32,33]. Using surface-enhanced Raman spectroscopy (SERS) makes it possible to identify and classify RNA structures, to recognize fully complementarily duplexes, hairpins, short RNAs, and diversify microRNA, to quantify DNA hybridization events and detect base methylation and single nucleotide mismatch [29,34]. Therefore, methods that are based on SERS underlie third-generation sequencing. A new approach in DNA/RNA sequencing that is based on SERS can detect specific gene in genomic DNA sample with high precision [35].
Raman scattering is a sensitive and selective method for studying molecular bonds, conformation, and environments, and it is also a promising non-invasive technique for biomedical applications [36]. RS proved to be a powerful technique that complements the structural studies of biomolecules and provides an understanding of the connection between structure and function. At the moment, a lot of different variants of RS exist, which allows for widening the number of applications [37].
The ability to probe vibrational spectra of selected chemical bonds makes resonance Raman spectroscopy an excellent tool for studies of biomolecules. RS methods are applied in the studies of disease mechanisms, the associated development and optimization of new drugs, diagnosis, and treatment. The main advantages of these methods are non-invasiveness and possibility of label-free application, no need to transfer the sample to a special solution, and—in the case of diagnosis—the speed. In opposite to FTIR, RS allows for working with highly hydrated biomolecules.
In this review, we discuss RS studies in a wide variety of fields, including protein crystallography, protein, DNA and lipid dynamics, microscopy, cell and tissue imaging, diagnostics, and therapeutic applications, and they provide a background for understanding the fundamentals of RS.

2. Background

2.1. Spontaneous Raman Scattering

In terms of the corpuscular theory of light, the Raman effect is an inelastic collision between a photon and matter, in which the photon loses (Stokes scattering) or acquires (anti-Stokes scattering) one (first-order scattering) or more (higher-order scattering) quanta of vibrational energy of the studied system. The incident photon excites the system to a virtual energy level due to interaction with the electronic cloud of a molecule [38]. The virtual state cannot be occupied, as it is not an eigenstate of the molecule, so the system spontaneously drops to the ground state or to an excited level with a re-emission of a photon. The re-emitted photon exhibits an energy shift to the incident photon if the system makes a downward or upward transition between two discrete energy levels. The effect then would be called Raman scattering while the alternative elastic effect (Rayleigh scattering) occurs without the transition and change of the photon energy. The photon energy decreases (Stokes scattering) during the transition from the ground to a higher vibrational state (through the virtual level). In case of the reverse transition from a higher vibrational state to the ground state, the photon energy increases (anti-Stokes scattering). A pair of corresponding peaks equally shifted from the excitation wavelength appears in the energy spectrum of the scattered light (Figure 1). The probability of the effect to happen, Raman cross-section, depends on the excitation wavelength, temperature, and experimental geometry, i.e., polarization vectors of the incident laser beam and of the scattered light reaching the detector. Polarized Raman spectroscopy means an evaluation of the geometry, i.e., by introducing a polarizer in the optical path of the scattered light to only detect a single polarization component; spectra obtained in different geometries are then compared. Unpolarized Raman spectroscopy means a simple evaluation of the intensities.

2.2. Instrumentation

Inelastic Raman scattering is a very weak phenomenon in comparison with the elastic Rayleigh effect (six to ten orders of magnitude), which requires sophisticated optical filtering to detect extremely weak signals in a close vicinity of an extremely strong signal. For signal detection, a diffraction grating monochromator or a Fourier-transform spectrometer can be used. Lasers are used as the excitation sources with various wavelengths that span from IR to UV region. Raman cross-section is proportional to the fourth power of excitation photon frequency ν4, shorter-wavelength excitation provides higher output signal. On the other hand, high-energy photons can kill living entities, such as cells, so IR excitation is often used. Fluorescence, which is typically present in aromatic compounds, can reach intensities far above Raman signal so that weak Raman signal is completely masked. Techniques for extracting Raman signal in the presence of red-shifted fluorescence involve UV excitation, Fourier-transform detection with near-IR excitation, and coherent multi-photon methods.

2.3. Surface-Enhanced Raman Scattering

Raman scattering that is generated by molecules can be tremendously enhanced. Placing analyzed molecules near a surface of appropriate nanostructured electrically conducting surfaces typically enhances Raman scattering signals by 104–106, and, in some special cases, the enhancement factor could become as high as 1010–1012 [39]. The total enhancement is the result of multiplication of electromagnetic enhancement and non-electromagnetic contribution, referred to as chemical enhancement [40,41,42]. The electromagnetic effect is based on the excitation of surface plasmons that induce a strong spatial localization and, hence, the laser light amplification in so-called hot spots (small spatial regions) and re-radiation by metal surface. The chemical enhancement originates from interaction of analyte with the surface and, thus, a modification of molecular polarizability. The electromagnetic component is major, it could reach values up to 108 in average and 1010 in a hot spot, while the chemical enhancement is 10–104 [43,44]. Electromagnetic enhancement depends on the substrate and it is independent of the type of molecule. Various patterns can be used, both periodic to enhance the signal uniformly and aperiodic to enhance the signal within a certain spot.
Tip-enhanced Raman scattering (TERS) is a special case of SERS. It is an approach where an enhancement of Raman scattering only occurs at the point of a nearly atomically sharp pin, typically coated with gold [45]. TERS is usually coupled with atomic force microscopy or scanning probe microscopy, which allow for simultaneous analysis of topology and Raman characteristics with a lateral resolution of tens of nm [46].

2.4. Coherent Raman Scattering

Multiphoton techniques have received great attention in recent years due to increased signal output and easy three-dimensional (3D) visualization of microscopic objects. In the case of coherent scattering, an additional light beam, where frequency is equal to the frequency of the transition between vibrational and virtual levels, is applied to the sample. In a typical setup, the frequency of the additional beam scans over the studied spectral region. Under resonant conditions, the probability of the transition and thus resulting signal can increase by orders of magnitude. Unlike the spontaneous Raman effect, the scattered light is blue-shifted relative to the excitation light, so that it can be separated from red-shifted fluorescence. Bachler et al. performed a systematic comparison of spontaneous and coherent techniques [47]. The following two spectroscopic methods are based on this effect.

2.5. Stimulated Raman Scattering (SRS)

SRS detects an enhanced Stokes spectral component. The enhancement of the Stokes signal depends on the frequency difference of the additional beam with a scanning frequency νS and a main (pump) beam with a fixed frequency νP. A noticeable increase of the signal, called stimulated Raman gain (SRG), occurs in the case of resonance when the difference between νP and νS corresponds to the difference between energies of the ground and excited levels (νP − νS = Δν) [48]. The main advantage of SRS over spontaneous Raman scattering is its higher intensity of the Stokes signal and insensitivity to electronic nonresonant background effects [49].

2.6. Coherent Anti-Stokes Raman Scattering (CARS)

CARS also uses an additional beam with a scanning frequency νS and a pump beam with a fixed frequency νP, but it detects an enhanced anti-Stokes spectral component. The pump beam is used both jointly with the Stokes beam to establish coupling between the ground state and excited vibrational state, and separately to excite the system to enable anti-Stokes signal emission. Anti-Stokes emission has a blue-shifted frequency, so it is not affected by the presence of single-photon fluorescence. Resonant frequency νAS can be simply found while using the expression νAS = 2νPνS.
There are some useful modifications of the CARS method. First, different scattering geometries can be used. The signal can be collected in the direction of the initial light beam (forward CARS) and in different directions with an angle to pump emission (epi-detected CARS). E-CARS provides dramatically higher sensitivity for submicron scattering objects, i.e., objects that are smaller than the wavelength of light [50]. A polarization-resolved experiment (P-CARS) can bring additional information and even better resolution [51]. There are also some benefits that are connected with alteration of the light’s wavelength, such as broadband CARS [52] and Terahertz CARS [53].
CARS is an alternative to spontaneous or stimulated Raman spectroscopy. It provides enlarged signal intensity with high spatial resolution, fast scanning process enabling imaging at video rates, and no fluorescence background at all [54]. The main difference between CARS and SRS is in their background sensitivity. CARS has a noticeable non-resonant contribution from different molecules and bonds from the sample (especially from solvents), which leads to difficulties in spectrum interpretation. SRS provides a higher signal output when compared to CARS, and the output is linearly proportional to the spontaneous Raman response, as well as to both laser intensities [49] so that interpretation is more straightforward. These features make both SRS and CARS convenient tools for in vivo and in situ research [55,56]. In addition, the SERS technique can be used to enhance the signal of both CARS [57,58] and stimulated Raman scattering (SRS) [59,60].

2.7. Resonance Raman Scattering (RRS)

RRS is a minor modification of spontaneous Raman scattering. The intensity of Raman spectrum components increases by up to six orders of magnitude if the energy of the pump beam coincides with an electronic transition of the molecule (i.e., the difference between the two energy levels involved). The method is described in [61].

2.8. Raman Microscopy

Raman microscopy facilitates investigation of a small scattering volume by focusing the excitation laser beam by a microscopic objective. Confocal Raman microspectroscopy allows making three-dimensional Raman images of the studied object. Incident light is focused on the sample through the microscope objective, which also collects the backscattered light, and a pinhole on the output acts as a spatial filter. The pinhole allows for the propagation of only a part of the backscattered beam generated from a selected scattering volume. Each point of the recorded Raman image represents a Raman spectrum with Raman peaks corresponding to bonds vibrations in the molecules located in the selected volume. Raman mapping is a method of obtaining of two-dimensional (2D) or 3D object images where each point corresponds to the numerical value of the chosen Raman spectral feature (typically integral intensity/maximal intensity of the selected Raman peak or ratio of the intensities of the selected Raman peaks) that were obtained across the sample surface [62].
All of the reviewed RS techniques are used in different studies. Freudiger et al. created a detailed description of SRS application in biology [63]. More information regarding CARS microscopy is contained in a review of Evans and Xie [64]. The SERS microscopy method is described in [65]. TERS technique is described by Xiang Wang et al. [66]. Finally, one can see Paul Rostron et al. for a detailed review on Raman spectroscopy [67].

3. Raman Scattering in Structural Biology and Cell Biophysics

Raman spectroscopy is a widely used technique in structural biology and cell biophysics applied to different studies of lipids, proteins, peptides, DNA and RNA, and small organic molecules in the isolated purified preparations and inside cells and of conformational changes of molecules. In addition, RS allows for one to probe different kinds of protein-protein and protein-lipids interactions under various conditions (in crystals, solution, or lyophilized powder). It is also used to study different properties of lipids, lipid vesicles, lipidic cubic phases, and imaging of protein crystals in them. RS became a widely-used method that has important applications in structural biology and biophysics.

3.1. RS of Lipids and Lipid Structures

Lipids and lipid structures are inherent elements for membrane protein structural studies. Different self-organized structures, such as lipid vesicles, liposomes, bilayers, etc. have specific properties that affect their function and the conformation of membrane and submembrane proteins and protein complexes. Raman scattering investigation of lipids and lipid structures has possible application in developing different membrane-mimicking systems for structural studies of membrane proteins in close to native conditions. Near-infrared Raman spectroscopy (NIRS) was successfully applied to study lipids in brain [68], lipid droplets in skeletal myocytes [69], and special lipid vesicles in algae [70]. While the precise quantitative measurement of different lipid types is complicated, it is possible to evaluate the total amount of lipids, relative amount of cholesterol, its esters and phosphatydilcholine, level of lipid unsaturation, and the relative amount of fatty acid chains in gauche conformation versus trans conformation.
An assessment of changes in RS fingerprints for different lipidic phases (gel, liquid) [71], studying thermodynamic properties of lipid membranes [72,73], can be also performed by the CARS method. CARS also allows for performing experiments with lipid vesicles and liposomes and even in living cells [74], investigating lipid phase transitions and detecting the lipid main phase transition for unilamellar lipid DMPC vesicles [75].

3.2. RS of Proteins, Protein Interactions and Dynamics

Structural investigation of proteins by Raman scattering is a great opportunity to image microcrystals, to study protein-protein interactions, their conformational and functional changes inside organelles, living cells and tissues, or in solutions and in the crystals. Although the method, as any other, has limitations, it has huge advantages and complementarily allows for one to work in some cases with pico and nanomolar protein concentration.
Numerous RS studies are dedicated to investigation of hemoproteins: hemoglobin, myoglobin, and cytochromes in in vitro, in vivo, and in situ conditions. The protein part of these molecules comprises heme of b, c, or a-type having unique RS fingerprints sensitive to the heme type, redox state of the Fe atom, and its coordination bonds with ligands [76,77]. Application of the excitation laser light that is absorbed by the studied hemoprotein results in the resonance Raman conditions that allow for achieving intensive Raman scattering of heme molecules without contribution from aminoacids of hemoprotein or other cell components. Resonance RS was successfully applied for the quantitative study of the oxyhemoglobin amount in vessels of tongue, skin, mucosa, muscles, liver, and brain of anesthetized intubated rats or mice [78,79,80,81], and in blood samples of patients or rats with various cardiovascular pathologies or healthy donors under the application of chemicals [82,83,84,85]. Resonance RS was also proposed for the noninvasive monitoring of blood oxygenation in tissue vessels of neonates [41]. Figure 2 demonstrates the Raman spectra of the mouse blood probes with a different level of oxygenation (Figure 2A) and the typical Raman spectra of isolated purified oxyhemoglobin (red spectrum) and deoxyhemoglobin (blue) (Figure 2B). Red numbers show maximum positions of peaks at 1375, 1585, and 1638 cm−1, corresponding to symmetric vibrations of pyrrol rings (so-called pyrrol breathing) and methine bridges (CaCm bonds). Under hemoglobin deoxygenation, these peaks down-shift to maximum positions at 1355, 1552 and 1602 cm−1, respectively (shown by blue numbers). Black numbers indicate the peak positions that do not depend on hemoglobin oxygenation. It can be seen that the Raman spectra of blood with various levels of oxygenation demonstrate a combination of peaks of oxy-and deoxyhemoglobin.
Multiple studies employ resonance RS to study the redox state of cytochromes in the respiratory chain (electron-transport chain, ETC) of mitochondria in yeasts, cultured cells, isolated cardiomyocytes, or perfused heart under different conditions, including oxidation stress or hypoxia [86,87,88,89,90,91,92,93,94,95]. Relative amount of the reduced cytochromes correlates with the overall ETC loading with electrons and increases under hypoxia, allowing for the monitoring of the mitochondria respiration in heart cells under various pO2 levels, acute hypoxia, and hypoxic preconditioning, under myocardial infarction and heart arrest [91,92,93,94,95]. Most of RS studies of c-and b-type cytochromes are performed with 532 nm laser light ensuring resonance Raman conditions and the excitation of the predominantly heme Raman scattering. The Raman spectra of isolated cardiomyocytes and cardiomyocytes in the heart under rest conditions with normoxia represent a set of peaks that correspond to heme vibrations in the reduced cytochromes c and b (peaks at 750, 1126–1127, 1300, 1313, 1338 cm−1) and to heme vibrations in oxymyoglobin (1375, 1587, and 1640 cm−1) that serve as the temporal storage of O2 releasing under hypoxia (Figure 3). Cardiomyocyte Raman spectra also possess some lipid peaks, e.g., with the maximum at 1450 cm−1. Hypoxic conditions cause an accumulation of the electrons in the respiratory chain due to the absence of O2—their terminal acceptor—that can be seen of RS spectra as an increase in the intensities of cytochrome peaks. Under hypoxia, oxymyoglobin releases O2, which results in the shift of peaks at 1375, 1587, and 1640 cm−1 to 1355, 1556, and 1606 cm−1 (Figure 3). The increase in relative intensities of reduced cytochromes under hypoxia and other conditions correlates with the overall overloading of the respiratory chain with electrons and can be used for the estimation of the mitochondria recovery after restoration of cell supply with O2.
It was also shown, by means of confocal resonance RM, it is possible to study dynamics and location of hemoproteins in cells, e.g., to monitor exit of cytochrome c from mitochondria of cultured cells under apoptosis [87] and visualize the distribution of the reduced cytochrome b558 in neutrophils and eosinophil peroxidase in eosinophils under stimulation of the innate immune response [86].
It also became possible to detect both reduced and oxidized c and b-type cytochromes in cells while using near-infrared RS [69], allowing for recording Raman scattering of various lipids, proteins Fe-S clusters, and ETC cytochromes b and c in oxidized and reduced forms. RS was also used to measure the distribution of oxidized and reduced forms of cytochromes b and c in different compartments of hyphae [89].
Different kinds of protein interactions can be probed with Raman scattering. Protein-protein interactions for LasR proteins—representatives of LuxR family with bacterial quorum sensing modulators—were characterized by SERS at low ~0.5 nanomolar concentrations of the protein [96]. Protein-lipid interactions were analyzed by the CARS approach as a complementary technique used with TEM and SEM that allowed for characterizing protein lysozyme distribution in solid lipid microparticles [97].
Other types of proteins that do not contain specific cofactors or ligands can also be investigated with RS [98]. However, there should be a reference for such RS experiments or database with RS spectra for comparison [99].

3.3. Conformational Changes of Proteins

The crystal packing might somehow influence (disturb) a protein. Therefore, the difference between protein structure in a crystal and solution is one of the important issues for protein crystallography. For instance, Raman signal of amide bonds helps to detect different protein conformations [100], and there are successful cases of qualitative detection of structural differences of lysozymes in crystal and in solution [101] and the phase transition in crystals of lysozyme [102]. However, it is not always possible to probe some protein crystals due to the specificities of the surrounding of the crystals, especially in the case of membrane proteins.
Proteins in solution are usually investigated by small-angle scattering (SAS) method [103,104,105,106,107,108,109] that can be complementarily used with RS technique. An approach to the detection of conformational changes of protein secondary structure by RS was applied to investigations of small molecules, such as proline dipeptides [110] as well as human hairs [111] at the 10–100 μm scale. The detection of unique RS fingerprint of specific amino acids in proteins is a commonly used technique. It can be also applied for tracking their conformational changes [112,113]. Another widely-used approach includes RS amide I band investigation [114]. A protein collagen was studied by RS amide I band [115] and the approach can be complementary to study another RS amide bands (for example, amide III), SHG technique [116], and birefringence [117]. Collagen has an ordered structure, well-known RS fingerprint, great importance for medicine, and it is a good target for RS studies [118,119,120].
Protein folding and unfolding, different protein transient states can also be studied with the help of RS [121,122]. The secondary structure of proteins plays a crucial role when investigating their functional properties under different conditions. The study [123] reveals that changes in the secondary structure of proteins significantly affect their spectra, which could be measured by complementary used RS and FTIR. RS can also noninvasively study secondary structures of proteins. For example, in the work [124], changes in the amount of α-helixes and β-structures during early stages of development were revealed in mouse embryo in vivo. RS can be also used to study peculiarities of the protein secondary structure. Thus, the method of Raman Optical Activity was applied to distinguish two types of α-helixes in proteins. Thus, it was shown that, in peptides, proteins, and viruses Raman peak around 1300–1340 cm−1 (amide III band) depends on the presence of water and hydration of α-helix environment: positive ROA band around 1300 cm−1 dominated in hydrophobic environment, whereas positive ROA bands around 1340 cm−1 dominated in hydrophilic environment [125]. RS can be also applied to study conformational changes in the prosthetic group of proteins under their function, interaction with other molecules, organelles, or under pathological changes. Thus, by means of RS, it was demonstrated that cytochrome c heme underwent changes from the plane to the ruffled conformation under cytochrome c interaction with the inner mitochondrial membrane [126] and under site-directed mutagenesis in the non-ordered Ω-loops [127,128].

3.4. Pigments are Unique Proteins’ Ligands for RS Studies

Many proteins comprise small molecule pigments (retinal, beta-carotene, chlorophyll, CoQn, etc.), which are tightly associated with them. The pigments were found in proteins of the respiratory chain of mitochondria and chloroplasts [129,130,131], photoreceptors in plants and bacteria [132], and in a huge class of photosensitive proteins rhodopsins (Section Raman spectroscopy of photoactive proteins). They are key molecules in the proteins and protein complexes function and make these proteins fully accessible to RS methods.
Protein-ligand interactions (similar to the cytochromes) can be studied with the help of RS [61]. Ligands in different conformations can also be tracked by RS methods in living cells [133,134,135] or in the crystals [136,137]. In this case, RS allows for one to easily detect crystals of protein. However, the approach is not holistic for the detection of protein crystals in general, especially in the case of membrane protein crystals in lipidic cubic phases.

3.5. CARS Imaging of Membrane Protein Crystals

Protein crystallization has a near century history, however it only became widely used a couple of decades ago. Protein crystallography methods such as X-ray diffraction (XRD) on fourth generation synchrotron sources and X-ray free electron lasers (XFEL) opened new horizons in structural biology [138]. In particular, membrane proteins are a challenge of structural biology. New X-ray sources allow for one to work with microcrystals, which is easier to grow. Recent development of XRD sources has led to the XFEL technique, which requires myriads of protein microcrystals. It helped to obtain high-resolution structures of high-priority proteins such as, for example, G-protein coupled receptors (GPCRs)—membrane proteins that are responsible for cell signaling—the largest and most important membrane protein family in eukaryotes [139]. Recent successes of XRD in GPCR field includes inflammation-related CysLT receptors [140,141].
Such powerful X-ray sources for structural biology require new methods of protein microcrystals detection and characterization. It became crucial when the working range of crystals for obtaining the high-resolution structure shifted to the micro and sub micrometer scale. It becomes even more critical in case of membrane proteins crystallized with lipid in meso phases, in particular lipidic cubic phases (LCPs) [142,143], when protein crystals are not well resolved with an optical microscope due to not completely transparent crystallization matrix.
The commonly used methods of detection of protein crystals are: light microscopy, fluorescent microscopy [144], cross-polarized visual light (CP), ultraviolet two-photon excited fluorescence (UV-TPEF), second harmonic generation (SHG), and second-order nonlinear imaging of chiral crystals (SONICC) [10,145,146]—a technique combining UV-TPEF and SHG, allowing for imaging chiral crystals up to the micrometer scale buried in LCP [144].
However, SONICC is not enough to distinguish between salt and protein microcrystals and does not work in the case of high symmetry protein crystal. This implies the necessity of the development of new methods for protein microcrystals detection. A new approach was developed. It is P-CARS [147]—the third order nonlinear technique, which can be used for membrane protein submicrocrystals imaging and 3D characterization. It allows for resolving protein crystals up to less than 1 μm size in the presence of LCP and salt crystals in the probe, and characterize their 3D shape. It also allows for revealing twinning of the crystals and their disordered parts. Moreover, this technique can provide information regarding the state of the proteins in the crystals. There are several trials published to investigate LCPs with additional lysozyme supplements while using RS [148].
Thus, polarized coherent anti-Stokes Raman scattering (P-CARS) [147] is a powerful technique for imaging proteins and studying proteins in crystals. It is extremely useful in the case of membrane protein crystals (Figure 4).
P-CARS detects disordered and ordered parts of protein crystals, even in the case of non-chiral crystals where SHG technique fails. The resolution of the CARS technique can easily reach submicron scale (Figure S6 from [147]), which makes it applicable for the high-throughput detection of protein microcrystals for XFEL experiments.
However, the technique has a limitation—time of measurement, which can be 5–10 min. for one crystallization probe. That is why CARS imaging of microcrystals should be complementarily used with other imaging techniques that are more high-throughput, although not so sensitive.

4. Raman Spectroscopy in DNA Structural Investigations

The applications of RS to DNA initially started in late 1960s. RS was used as an experimental probe of nucleic acid constituents by Richard C. Lord and his co-workers at MIT in 1967 [149]. Soon after their publication, a wide range of nucleic acid structure investigations were done with conventional (off-resonance) RS and a number of Raman signals were identified. The information on RS spectra of nucleobases, nucleosides, nucleotides, sugars, and orthophosphate esters was used to assign RS peaks of nucleic acids. Details of these studies are described in [150].
For nucleic acids structural studies two groups of Raman markers are usually used. Some are sensitive primarily to the structural changes of the phosphodiester bond network of the backbone (-P-O5′-C5′-C4′-C3′-O3′-P-), but they do not strongly depend on the identity of the base attached at C1′, the others are sensitive to nucleoside conformation. DNA has several possible conformations that include right-handed A-DNA and B-DNA, and left-handed Z-DNA forms. RS is applied to distinguish forms of DNA from each other by the appearance of specific bands in spectra (745 ± 2 cm−1 for Z-DNA, 807 ± 3 cm−1 for A-DNA, and 835 ± 7 cm−1 for B-DNA). The intensity of those specific bands makes it possible to calculate the proportion of different DNA forms [151,152,153]. Relatively large deviations for B-DNA reflects the structural complexity and dependency upon AT and GC base pair content [154]. While structures of DNA forms were revealed by X-ray studies, RS allowed for investigating DNA structure not only in crystals, but also in solutions.
Raman difference spectroscopy allows one to quantitatively describe nucleic acid conformational changes induced by an addition of binding agents (ions, proteins, drugs, etc.) or induced by altering environmental factors (temperature, pH, salinity, etc.). For example, Raman difference methods were used for identifying the melting temperatures of DNA and RNA molecules [155] spectroscopy investigation of the phage P22 dsDNA packaging process. It was shown that phosphodiester geometry and glycosyl orientation change while base pairing and sugar pucker stay untouched, and B-DNA form is maintained [32]. In melting experiments with DNA, it was shown that the temperature-dependence of Raman intensity of DNA shows two peaks at 38 and 82 °C in solution [33]. The peak at 38 °C is related to the biologically active region of DNA. Raman difference methods work particularly well for revealing localized interactions in nucleic acid complexes (e.g., with proteins, drugs, etc.), in combination with site-specific labeling [156], residue-specific labeling and single-site mutagenesis [157].
The application of polarized RS provides information about molecular orientation and symmetry of bond vibrations in addition to general chemical identification, which unpolarized Raman scattering provides. For example, relative residue orientation in the filamentous virus or DNA helical conformation was identified [158,159,160]. Polarized RS can determine the relative spatial orientation of DNA residues and drug molecules. In [161], the authors described positioning of EtBr inside the genomic dsDNA by measuring the angles between phenanthridinium ring of EtBr and bases of DNA. For that experiment, Raman tensors were obtained from polarized Raman analyses of oriented specimens of EtBr (single crystal) and DNA (hydrated fiber). Polarized RS is also applied to DNA quadruplexes and telomeres identification and characterization [162].

SERS in Nucleic Acids Detection

A significant breakthrough in the detection and determination of DNA occurred with the development of SERS technology. Great enhancement of the Raman signal from analyte that was fixed on a silver electrode was discovered in the middle of the 1970s. Currently, an array of different nanoparticles with various coating is used for DNA and RNA detection and even sequencing [163,164,165].
The detection of nucleic acids plays an important role in a wide range of applications, including clinical diagnostics and food safety monitoring [30]. In 2014, a group of investigators showed that Ag nanoparticles in SERS measurements enable selective label-free RNA detection [29]. The SERS analysis of RNAs at the ultrasensitive level has also been performed using positively charged spermine-coated silver nanoparticles. The SERS signal with this substrate allows for one to identify and classify RNA structures. It was possible to recognize fully complementarily duplexes, hairpins, short RNAs, and diversify microRNA by individuating chemical differences, like nucleotide modifications and single-base variances [34]. Negatively charged DNA sequences adsorbed on positively charged spermine-coated Au-nanoparticles promoted nanoparticle aggregation into long-term stable clusters with no need for external aggregating reagent, and then made direct SERS analysis of double-stranded DNA possible. This strategy allowed for the quantification of DNA hybridization events and detection of base methylation and single nucleotide mismatch [166,167,168,169]. In addition, SERS enhanced sensitivity was used not only to study ss- and dsDNA, but also such DNA complexes as quadruplexes. The authors of recent work [170] claimed the availability of quantitative assessment of the stability of G-quadruplexes. Qian et al. [171] developed in situ DNA-metallization, while using a glass slide to fasten a peptide nucleic acid as a recognition probe to be used in the detection procedure. Label-free and Raman dye-free SERS can obtain highly reproducible SERS signals with detection limits of 34 pM. Quantitative detection for nucleobases was achieved, even at single base level, using the SERS signals of phosphate backbone as internal standard (Figure 5). This new label-free DNA-detection technology was proved to be able to diagnose nasopharyngeal cancer by analyzing blood circulating DNA with >80% accuracy [172].
Raman labels in combination with surface-enhanced resonance Raman scattering (SERRS) provide a key advantage over fluorescent techniques due to the ability of quantitative detection of multiplexed labeled DNA in one sample [173]. Labeled DNA detection also covers the application of fluorescent-labeled (FAM, ROX, R6G, etc.) DNA-probe immobilized on the surface of nanoparticles. When the target sequence is found, DNA duplex changes conformation and the Raman signal increases significantly. Prostate cancer antigen 3 mimic DNA was detected by hybridization reactions with the detection limit of 2.7 fM, which means that it has a higher sensitivity than conventional polymerase chain reaction [174]. One can find more information on labeled DNA SERS detection in a recent review [35].
A new approach in DNA/RNA sequencing is based on the combination of biological/solid-state nanopores with electrochemical measurements. While the DNA molecule goes through the gold SERS-active nanopore it produces a series of specific Raman signals that correspond to the bases in nanopore [165]. This DNA sequence research tool can be used for third generation sequencing (single-molecule reading), however, at the moment it does not have sufficient resolution to compete with other methods such as Oxford Nanopore, and it is now at the development and optimization stage while using oligonucleotides. This precise tool for molecule manipulations underlies the third-generation sequencing. Another method allows for one to analyze nucleobase content in DNA blocks by means of SERS with Ag nanoparticles. The relative content of each nucleobase is calculated according to intensity of characteristic Raman bands. Such analysis could provide information on the presence of specific gene (e.g., β-lactamase) in genomic DNA sample [175].
SERS was also demonstrated to be an effective and sensitive tool for detecting specific DNA sequences. The novel SERS-based approach was proposed based on the increase in SERS signal intensity when target DNA was present while using a specifically designed SERS primer [176].

5. Raman Scattering Applications for Cancer Research and Diagnostics

Conventional Raman spectroscopy and CARS in a variety of modifications are applied in cancer research and diagnostics. Raman spectra of biological samples are sensitive to biochemical and structural alterations within cells that arise due to malignant cell transformation. The idea to use Raman spectroscopy to differentiate between normal and cancerous tissues is about 30 years old and various reviews describe RS achievements, advantages, and limitations in this field [177,178,179,180,181]. Here, we describe recent advances in the field of RS of solid and hematopoietic tumors. Despite the development of powerful instrumentation, in the last decade, a variety of high-throughput data processing and analysis methods arose and became widespread.
RS is used to analyze the biopsy samples of solid tumors, since the origin of the idea of Raman application to cancer diagnostics. Breast cancer was one of the first cases where differences in Raman spectra of normal and malignant tissues were found. Frank et al. [182] showed that, in 180° backscattered geometry, 784 nm laser wavelength the most noticeable changes between normal and cancerous specimens are in a range of 1654–1439 cm−1 bands of the spectrum. In recent works, different mathematical models and algorithms were applied to spectral analysis. For example, a linear combination model fit of spectral data distinguishes between fibroadenoma (benign), fibrocystic change (age-related structural changes), infiltrating carcinoma (malignant), and normal tissue [183]. A combination of PCA and DFA was used for Raman spectra analysis of breast cancer tissue from a mice model. The data were processed firstly with PCA to reduce the dimensionality. Secondly, DFA was used for sample classification. 91% of tumor spectra were correctly classified [22].
RS was used to study oesophagus pathologies, including pretumor conditions and cancer development. Recently Raman microspectroscopy was applied for the chemical imaging of Barett’s oesophagus—histological sections from the patient subjected to oesophagus biopsy—and the presence of certain cellular and extracellular regions with cancer features were revealed [184].
Recently, K. Aljakouch et al. [23] combined CARS/SHG/TPEF imaging with PCA and DCNNs to distinguish between normal and cancer cells in human cervical cells that were obtained by Papanicolaou (Pap) test. CARS and SHG/TPEF imaged Pap test samples and the identified cells were studied by Raman spectroscopy. DCNNs were trained with spectra that were obtained from the cells. This technology provided a non-invasive, fast and high throughput approach to discriminate cancer cells from normal ones with almost 100% accuracy.
RS could be applied to prostate cancer diagnostics [185,186]. Benign pathologies of bladder and prostate were successfully distinguished from malignancies using fiber-optic (potentially) in vivo applicable near-infrared RS. Significant differences were detected in spectra at 1003, 1083, 1260, 1310, 1446, and 1655 cm−1 wavenumbers [187].
In the case of lung cancer, near-infrared RS provided the ability to distinguish between two types of malignancies: squamous cell carcinoma and adenocarcinoma, as well as normal tissue on histology samples. Major differences in spectra appeared in ranges of 1000–1100, 1200–1400, and 1500–1700 cm−1, which contain peaks that correspond to conformation of proteins and lipids, as well as DNA stretch mode [188].
Near-infrared RS was applied to gastric cancer identification. Authors report that cancerous mucosa samples showed higher intensities at 807 and 1661 cm−1 and lower at 748, 944, and 1520 cm−1 in comparison with normal tissue. Support vector machine algorithms were used to classify the spectral data. 90.3% diagnostic accuracy was achieved [189]. For gastric cancer, noninvasive diagnostic tools which that can be used in endoscopic examinations are important. It was recently suggested that the CARS/TPEF/SHG technique could be applied for noninvasive gastric cancer diagnostics [25]. Raman endoscopy was also applied to control the treatment of colorectal tumors with three anticancer drugs in live mice [190].
It was also demonstrated that RS can be successfully used for the quantitative detection of human tumor necrosis factor α in the enzyme-linked immunosorbent assay (ELISA) instead of the traditional colorimetric detection and RS allowed for achieving 50 times lower detection limit [191].
Various brain tumors could be identified with the help of RS [192,193,194,195,196,197]. Gliomas of various types and one of the most malignant glioma—glioblastoma multiforme could be distinguished from other tumors. For example, the glioblastoma sample Raman spectrum is similar to meningioma, but a band near 719 cm−1 is more intense, which corresponds to phosphatidylcholine accumulation in glioblastoma [198,199]. Raman spectra can also provide useful information regarding tumor structure and boundaries: different groups demonstrated, that vital glioblastoma cells could be distinguished from necrotic regions [200] and dense tumor cells of II-IV type of glioma can be distinguished from normal cells [195,197]. The RS-based approach was already proposed and successfully applied for the intraoperative detection of the dense tumor region [194,197].
It was demonstrated that the main spectral difference between cells in the normal brain region and the dense tumor corresponds to the higher relative intensity of the peak at 2930 cm−1 relating to the vibrations of -CH3 bonds versus intensities of peaks at 2845–2885 cm−1 (vibrations of -CH2- bonds) (Figure 6). This difference was attributed to the higher amount of proteins relative to lipids in tumor when comparing to normal cells [197].
RS could be utilized for diagnostics of melanoma—one of the most aggressive skin cancers. Melanoma skin samples could be distinguished from other tumors while using a neural network approach to sample classification with the sensitivity of 85% and specificity of 99% [24].
RS diagnostics are not limited by solid tumors and they can also be applied for hematopoietic tumors examination. Manago et al. classified B-cell acute lymphoblastic leukemia and then monitored the effects of treatment using Raman microscopy [201]. RS applications for cancer are not limited to diagnostic purposes. This method could also provide important information when used for monitoring cancer cell structure and physiology during treatment in experimental models [26,27,28].

SERS in Cancer Research and Diagnostics

SERS is a promising technique in tumor diagnostics and research [202,203,204,205]. It is necessary to use highly specific nanostructures that interact predominantly with the cancer cells and that possess highly intensive Raman scattering to detect and to visualize tumor cells. To achieve this purpose SERS nanotags should contain organic reporter molecules that possess the intensive specific Raman scattering and adsorbed on the nanoparticles that should be additionally functionalized with antibodies that are specific to tumor antigens. This system is similar to the conventional immunohistochemistry, but the SERS reporter is used instead of dyes or fluorophores. For the first time, Schlücker et al. proposed such an approach in 2006 and named “immuno-Raman” [206] or iSERS [207].
The main complications of immunofluorescence are photobleaching, autofluorescence of tissues, and wide emission spectra of fluorophores which limit the number of fluorescent labels due to the possible spectral overlap. SERS nanotags help to overcome these difficulties. The higher sensitivity and selectivity of golden NIR SERS nanotags with 7-mercapto-4-methylcoumarin as a Raman reporter over AF647 fluorescent dye conjugated to anti-PD-L1 antibody was recently shown recently for single breast cancer cells ex vivo [208]. Another advantage of iSERS is multiplexing capabilities. Many targets can be visualized simultaneously in the same specimen due to the narrow spectra of Raman reporter molecules. Two-color iSERS with malachite green isothiocyanate and Rubpy as reporter molecules was used to co-localize CD24 and CD44 in breast cancer cells [209]. Later, these authors offered a three-color approach with silica-encapsulated hollow nanospheres to visualize and evaluate the expression levels of receptors of epidermal growth factor (EGF), the tyrosine-protein kinase ErbB2, and the insulinlike growth factor-1 (IGF-1) to distinguish different breast cancer cell lines [209]. Up to 10 different SERS probes were simultaneously applied to visualize tissues in vivo. Limited only by the volume that can be injected in a single mouse, authors chose a combination of five optimal SERS probes with minimal spectral overlap to map mouse liver in vivo (Figure 7) [210]. In this work SERS nanotags were injected directly to the organ of interest, and did not contain antibodies, but these results demonstrate the fascinating multiplex capabilities of SERS and seem to be very promising in future specific tumor targeting agents development. Multimodality can be expanded due to the development of novel classes of reporter molecules. Thus, triple bond-containing Raman reporters (4-ethynylbenzenethiol derivatives or 4-mercaptobenzonitrile metal carbonyl compounds) with sharp peaks in the so-called silent region (approximately 1800–2800 cm−1), which does not contain peaks from biological molecules were recently proposed [211]. This might pave the way for the development of more efficient and multiplex iSERS approaches for disease diagnostics and theranostics.
Poor laser penetration into tissues limits in vivo SERS applications. Therefore, it is very important to use reporters with the absorbance in NIR range. In the paper by Zavaleta et al. [210], 785 nm laser was used noninvasively to excite all five SERS probes (Figure 7). NIR laser excitation was also recently applied to detect dual fluorescence-SERS tags in vivo in subcutaneous ovarian cancer xenograft model and an RCAS/TVA glioblastoma mouse model [212].
Developing a Raman endoscope is another way to overcome poor laser light penetration into tissues. For the first time it was done by Gambhir group to detect colon cancer cells and polyps [213]. Later, SERS nanotags specific to EGFR and HER2 were applied for endoscopic detection of esophageal cancer [214] and breast tumor xenografts [215].
The next step is not just to detect and to visualize tumor in vivo, but to remove it. Such an approach is called theranostics. The Vo-Dinh group, together with the Badea group, created multimodal probes based on gold nanostars for SERS detection, x-ray computed tomography, two-photon luminescence imaging, and photothermal therapy to detect and treat primary sarcoma in the mouse model [216]. A very recent paper describes novel SERS nanotags, which consists of hollow CuS nanoparticles with encapsulated NIR Raman reporters. They are photodegradable when exposed to laser irradiation at 980 nm and, therefore, they can be used as an agent in photothermal therapy. As a proof-of-concept, authors used the mouse model with prostate cancer [217].
Each year new sensitive, selective, and multimodal SERS nanotags for cancer detection and therapy appear. We believe that SERS will become a routine method in oncology, like immunohistochemistry, despite several disadvantages (like more complicated data analysis, big size of nanoparticles in the comparison to dyes and fluorophores, the tendency of nanoparticles to aggregate, and the presence of only few commercially available SERS nanotags).

6. RS and SERS for Other Biomedical Applications

6.1. RS in Biomedicine and Diagnostics

RS can be applied for studying disease mechanisms, the associated development and optimization of new drug production, diagnosis and treatment. The main advantages of RS methods are non-invasiveness and possibility of label-free application, no need of transferring the sample to a special solution, and in the case of diagnosis—the speed. In addition, RS allows in situ and in vivo studies. The aggregation of peptides PolyQ during Gettington’s disease was observed [218]. The alternative non-invasive fluorescence microscopy method in this case has a significant drawback. It requires a GFP label, with almost the same size as PolyQ; consequently, it distorts the result as compared to the label-free SRS method [218]. NIR Raman microspectroscopy was also demonstrated to be an effective and promising tool for the differential diagnostics of Alzheimer’s disease while using blood plasma [219].
Imaging samples with RS helps to understand the molecular mechanisms of different diseases more deeply. For example, the structure of the spore wall of pathogenic fungi while using confocal RM was studied [220]. The spore’s cell wall was shown to consist of α-glucan. In contrast, vegetative cells and Asmus walls comprise a mixture of α- and β-glucan. The structure of amyloid-β plaques occurring in Alzheimer’s disease was explored [221] with the application of SRS and CARS. The protein nucleus was found in the center of the plaque and lipidic halo was found around it. In the study [222], the structure of amyloid fibrils, which are an infectious form of prions, was determined while using AFM and TERS. It was shown that it depends on the pH of the environment: at pH 2, the fibrils are folded in β-sheets, and, at pH 5.6, they form a mixture of β-sheets, random coils and α-helices. Carboxyl, amino and imino group distribution within the β-sheet, α-helix, and unordered regions in insulin fibrils were studied [223] with TERS. The propensity of different amino acids to form various protein secondary structures on the fibril surface was demonstrated. In [224], the features of myelin organization in a damaged spinal cord were studied with the help of circularly polarized CARS.
RS also allows for one to study the mechanisms of treatment different diseases in vivo and in situ. The effect of two different drugs (ezetimibe and atorvastatin) on atherosclerotic plaques using fluorescent and RM was investigated [225]. The study confirmed the pharmaceutical effect of both drugs and showed that the drug ezetimibe reduces the deposition of lipids in the vascular walls. Additionally, atorvastatin cleans the vessels and has an antioxidant effect on them. The authors of the work [226] obtain the Raman spectrum of cells (S.nodosus), producing the antifungal antibiotic amphotericin. Analysis of RS spectra helped to select the proper cells.
The study of diseases that are connected with 3D inflammation processes requires corresponding model systems for conducting tests of developed drugs and different kinds of diagnostics. In [227], SERS was used to investigate the spheroid culture of HeLa cells (Au aggregates were inside the spheroid), and the non-invasiveness of the method provided an opportunity of observing the culture in dynamics.
RS has high potential for diagnostics of different diseases. It was used to measure a blood pH with an accuracy of 0.04 and lactate concentration with an accuracy of 20 mM [228]. These parameters are of great importance in the detection of sepsis and hypoxia. The possibility of non-bioptic diagnostics of eosinophilic esophagitis was also studied [229]. The disease is characterized by a large number of eosinophils on the esophageal mucosa. RS helped to identify eosinophils in the esophagus of mice that were suffering from inflammation. However, the accuracy of the method is still insufficient for clinical analysis due to the small size of the eosinophils.
Tissue visualization is another possibility that is offered by RS in terms of medical applications. Thus, an endoscope using CARS for visualization of nerves and nerve plexuses for robot-assisted surgery has been designed [230].
The loss of bone fracture resistance with aging and during osteoporosis is caused not only by decrease of bone mass, but also by changes in bone tissue organization. Current X-ray based techniques for clinical diagnostics allow for one to examine bone strength through analysis of mineral density, bone macrostructure, or microarchitecture. However, these properties do not completely reflect fracture toughness. Polarization RS can be used to complement existing clinical methods [231].
Near-infrared RS was demonstrated to be an excellent sensitive tool in forensic science and medicine [232,233]. Near-infrared Raman spectra that were recorded from small volumes of saliva, blood and blood serum, urine, semen, sweat and vaginal fluid can be discriminated and identified using advanced mathematical approaches. Authors demonstrated that the Raman spectra of these biological substances possessed a similar set of peaks, which corresponded to proteins, Phe residues, lipids, DNA, and RNA. However, the relative input of the peaks into the whole spectrum differed for various preparations in both liquid and dried form, which was proposed to use for the identification of specified biological liquids. The same approach was demonstrated to be successful for the discrimination and identification of races, gender, species and for the determination of the blood age while using blood serum and blood [234,235,236,237].
In general, the methods that are associated with Raman scattering provide extensive opportunities for the development of medicine at all its stages: from understanding of disease mechanisms to assistance in the surgery.

6.2. SERS in Biomedicine and Diagnostics

Each year, the number of publications on various SERS applications in the biomedical research is growing (for review, see [238,239,240,241]). The key point of the successful SERS application in biomedical studies is the right choice of plasmonic nanostructures, usually silver or gold. Properties of Ag and Au nanoparticles should be carefully investigated while taking into account their biocompatibility and possible toxicity. The peculiarities of the application of Ag and Au nanoparticles in biomedical research and especially for in vivo SERS experiments are described in detail in the review [241]. Plasmonic nanostructures that are used in various fundamental biomedical studies and applied diagnostics approaches can be divided into several groups: SERS-sensors, SERS-detectors, and nanostructures for the label-free SERS research.

6.2.1. SERS-Sensors/Nanoprobes

SERS-sensors are applied to quantitative measurements of concentrations of specific ions or small organic biomolecules in living cells and tissues. The common approach is to construct functionalized nanoprobes that consist of Ag or Au nanoparticles covered by the reporter molecules that possess the intensive Raman scattering with the spectrum parameters (peak positions and/or relative intensities), depending on the concentration of the measured ions/molecules. Novel approach is in the development of nanosensors having dual reporters—SERS-active and fluorescence-emitting molecules. SERS-sensors should be delivered to the studied cells or tissues and then excited by the laser light, which results in the enhancement of the reporter molecule Raman scattering due to the nanoparticle. Talley et al. offered using SERS nanotags as intracellular pH sensors [242]. Silver nanoparticles functionalized with 4-mercaptobenzoic acid (pMBA), where Raman scattering depended on the pH value, were internalized into Chinese hamster ovary cells, SERS spectra of pMBA were recorded from intracellular nanoparticles in different cell regions and the pH value was recalculated on the basis of the obtained Raman parameters. Later Kneipp et al. performed SERS imaging of a living cell with endocytosed gold pMBA-modified nanoaggregates [243]. The obtained SERS map of pMBA SERS parameters showed the acidity of different lysosomes, which might be used for the investigation of endosome maturation. Another type of SERS pH-sensor is an optic fiber tip that is coated with Ag nanoparticles with the reporter molecule 4-mercaptopyridine (MPy) immobilized by Ag-S bonds to the Ag naoparticle surface. Coated tip was used for the insertion into living cells or extracellular space in tissue and the optic fiber was used to excite and to collect the SERS signal [244]. Authors successfully tested this system on MCF-7, HepG2, and SGC7901 cancer cell lines to detect the intracellular and extracellular pH.
Another type of SERS-sensors are sensors for the glucose [245,246,247]. There are several types of coating allowing for glucose detection, e.g., silver nanostructure surfaces coated with self-assembled monolayer consisting of decanethiol and mercaptohexanol allowing reversible absorbance of the glucose. It was demonstrated that the difference spectra of glucose, partitioning and departitioning on the SERS-sensor, allow for quantitative estimation of the glucose level in the solution and in the mouse tissues [245].
Au nanoparticles that were modified with oxidized cytochrome c were created as a superoxide anion radical (O2) SERS-sensor with detection limit up to 10−8 M for O2 in living cells [248]. Interaction of oxidized cytochrome c with O2 leads to the reduction of cytochrome c, which results in the change in recorded SERS spectra of cytochrome c, which can be quantitatively recalculated into the O2 concentration. The advantage of the proposed O2 SERS-sensor is its high specificity, whereas all fluorescent probes for reactive oxygen species (ROS) have low selectivity towards O2. The SERS-based approach for measurement of O2 level is very promising for biomedical applications and the detection of early stages of cell pathologies since the elevation of ROS in cells results from many pathological processes in mitochondria and may lead to the oxidative stress and apoptosis [249].

6.2.2. SERS-Detectors

These types of SERS nanostructures are developed to enhance Raman scattering from molecules (toxins, dangerous drugs, etc.) or cells of interest (e.g., bacteria) to detect their presence in cells, tissues, liquids, or bioliquids (lymph or blood) on the basis of specific SERS peaks that corresponded to detected molecules or bacteria [250]. Specific molecules coat Ag or Au nanostructures to detect bacteria, e.g., vancomycin, which ensure bacteria binding to SERS-nanostructures and do not give intensive SERS signal itself. The binding of bacteria to SERS-detector results in the appearance of intensive highly specific SERS peak/peaks [251,252,253,254]. Recently Goodacre et al. proposed a label-free approach to obtain intensive SERS signal from lipids, proteins, nucleic acids, cofactors, etc. in bacteria in situ while using silver NP with external and internal localization [255]. This approach was applied to discriminate the different mutant forms of Campylobacter jejuni, which is a major cause of foodborne gastroenteritis. SERS was also applied to detect and quantify three types of bacterial meningitis pathogens in the cerebral spinal fluid [256]. Masson group developed plasmonic nanosensors to detect metabolites that were secreted from cells, such as pyruvate, lactate, ATP, and urea [257,258], or neurotransmitters (dopamine and glutamate) [259] near living cell surface. SERS-detectors may provide quantitative estimation of the analyte or can give qualitative information regarding analyte presence in the studied medium.

6.2.3. Label-Free SERS Studies of Living Cells and Biological Liquids

There are a growing number of publications regarding the application of the label-free SERS nanostructures to study conformational and functional changes in biomolecules or monitor number of biomolecules under certain conditions in cells. In these cases, the enhancement of Raman scattering might occur for biomolecules in the submembrane regions of cells or cell organelles and cell cytoplasm. Gogotsi group developed an extraordinary approach to visualize different cellular molecules in cytoplasm of living cell [260]. The SERS-sensor is a nanopipette comprised of a glass capillary with a 100–500 nm tip coated with gold nanoparticles. Authors demonstrated different SERS spectra from different compartments of the cell and determined the changes in SERS spectra in response to KCl addition, which led to a change in cellular activity. Later, this group proposed SERS-based approach for the estimation of the amount and the monitoring intracellular distribution and dynamics of second calcium messengers, such as nicotinic acid adenine dinucleotide phosphate (NAADP), cyclic adenine dinucleotide ribose, and inositol trisphosphate. Even 10 nM of NAADP is possible to detect in cell extracts with this approach, which is on the order of basal intracellular levels, so it might pave the way for in vivo applications [261].
SERS was shown to be a highly potential tool for the lab-on-chip diagnostics of different pathologies and diseases. Thus, it was beautifully demonstrated, that SERS can be used for the Alzheimer’s disease diagnostics [262]. In the proposed approach Ag colloids were used for the enhancement of Raman scattering of components of the blood serum and the neural networks-based classification of the SERS spectra that were recorded from the blood serum of patients with Alzheimer’s disease, other neurodegenerative dementias and healthy donors achieved high sensitivity in the differentiating of the samples and in the discriminating of Alzheimer’s disease patients, not only from the healthy donors, but also from patients with other types of dementias.
SERS was also demonstrated to be a highly efficient tool in the detection of biological liquids (blood, blood serum, urea, etc.) and biomacromolecules (DNA and RNA, proteins, and lipids) in the submicromolar concentrations and in tiny volumes, making SERS an invaluable method in the field of the forensics [240].
Nanostructures that do not penetrate cell cytoplasm can be used to enhance Raman scattering of membrane-bound and submembrane molecules. Thus, Ag colloids and Ag nanostructures surfaces were used to studying heme conformation of submembrane hemoglobin molecules in intact erythrocytes [263,264,265,266]. Authors demonstrated that heme conformation of submembrane hemoglobin, which indicated that they possess different O2-binding properties. The study of submembrane hemoglobin can be used as additional diagnostics of cardiovascular pathologies, since properties of plasma membrane and ion concentration in the submembrane region of erythrocytes change under various cardiovascular diseases that affect membrane-bound hemoglobin [267].
Ag nanostructures were also used to study cytochrome c in functional isolated mitochondria [266,268]. It was shown that SERS spectra of mitochondria excited with 532 nm laser light corresponded to the SERS spectra of heme of oxidized cytochrome c and represented various peaks originated from vibrations of pyrrol half-rings and methine bridges in heme c (Figure 8). It is important to note that the Raman scattering intensity of oxidized cytochrome c in mitochondria is very low and cannot be detected by RS. The SERS spectra of oxidized cytochrome c change under application of the ETC substrates, ATP-synthase inhibitor oligomycin and protonophore FCCP demonstrating the dependence of oxidized cytochrome c conformation on the overall activity of the electron transport in mitochondria ETC and to the inner mitochondrial membrane potential. Further SERS-based study of mitochondria can help to uncover the novel mechanisms of ETC activity regulation.
The most sophisticated application of SERS to the study of living biological preparation is in vivo SERS (for review see [241]). Stone and co-authors proposed SERORS—Surface-enhanced spatially offset Raman spectroscopy—to perform SERS imaging of biosamples on various depths from the tissue surface. Authors performed injections of a mixture of four different SERS-active nanoparticles with various Raman reporters into the 20 × 50 × 50 mm porcine tissue and demonstrated that upon near-infrared illumination, the SERS signal could be collected from the samples of 45–50 mm thickness [269]. Another example of in vivo SERS is the glucose SERS-sensor—Ag film over nanosphere surfaces functionalized with a two-component self-assembled monolayer that provided reversible absorption of the glucose [270]. The sensor was implanted in a Sprague−Dawley rat and the glucose concentration of the interstitial fluid was measured according to the SERS signal that was recorded through an optical window. In conclusion, the application of SERS to live cell studies can provide unique information about structure and conformation of cell molecules that cannot be detected under non-SERS conditions. Besides, the SERS-based approach with the advanced data analysis can be used for the development of novel highly sensitive lab-on-chip diagnostical tools. The important methodological peculiarity is the strict requirement for the stability of nanostructures in biological liquids and high stability of the Raman scattering enhancement in the whole studied spectral region.

7. Raman Scattering for Cell Imaging

The implementation of RM for biology can be separated into hyperspectral broadband imaging (BCARS) [271] and single frequency CRS imaging. BCARS [271] allows for spectral separation of different components in range of 500 to 3500 cm−1 for simultaneous multicomponent imaging, but sacrifices signal to noise ratio and speed of imaging—around 3.5 ms pixel dwell time. Slow image acquisition (~2 min.) makes this method more suitable for tissue imaging or fixed sample studies. A more constrained spectral window with multichannel data acquisition [272] allows for one to reduce the pixel dwell time to tens of microseconds bringing RM much closer to confocal laser scanning microscopy (CLSM) speeds.
Single-frequency CARS or SRS, on the other hand, allows for rapid imaging of the cells with pixel dwell times in nanoseconds, but they are restrained to specific bond vibrations and by extension specific molecules inside cell, such as fatty acids/DNA/proteins or special labels/specific proteins, like aforementioned cytochromes/chlorophyll/CoQ. High selectivity of single frequency CRS microscopy allows for the incorporation of extremely small labels when compared to usual fluorescent ones, such as alkynes, diynes, or even the detection of 13C or deuterated samples, which spectrally all fall into relatively “silent” region of a living cell. Labelling by alkynes was first shown in [273] by labelling CoQ analogues and EdU, showing mitochondrial and nuclear colocalization, respectively. Later, the same strategy was adopted to label several other small molecules, such as DNA. RNA, proteins, phospholipids via alkyne labelled metabolic precursors [274,275], and to study cholesterol storage by diyne labels [276]. SRS can be also used for the label-free studies of living cells. Thus, label-free SRS was applied for the sensitive monitoring of the peripheral nerve degeneration in mouse models of amyotrophic lateral sclerosis [277].
Labelling with different isotopes is even more attractive to study metabolism due to near complete unobtrusiveness of such labels for cell processing machinery. Such techniques were used to image protein degradation in vivo by labelling phenylalanine with 13C [278] study deuterium labelled choline metabolism [279] and deuterium labelled fatty acids processing into lipid droplets [280]. The molecular level of insight into cell metabolism finds its niche in medical studies on resistant strains of different infections due to its relative speed when compared to normal 24 h waiting period. Labelling of glucose with deuterium allows for differentiating metabolism in antibiotic-resistant and wild-type bacteria during one cell cycle, which is extremely useful for rapid screening of new antibiotics effectiveness [281]. For similar purpose, SRS imaging of lipogenesis under antimicrobial treatment in c. albicans fungi allows for screening for antibiotic resistance in a matter of hours instead of days [282].
Label-free Raman imaging is mainly applied to study intracellular and tissue distribution of the spectrally unique compounds with the intensive Raman scattering, such as fatty acids (due to abundant C-C, C-H, and C=C bonds), Phe-residues of proteins, cytochromes and/or other hemoproteins, DNA/RNA, and various drugs [87,275,283,284]. These studies may provide valuable and sometimes unexpected insight into the intracellular processes, distribution of various cellular molecules, exogenous drugs and toxins, composition and morphology of organelles, etc. Label-free Raman imaging is widely used to study pharmacokinetics of anticancer drugs in living cells: drug internalization inside cells, its intracellular distribution, and metabolism [27,285,286]. Thus, label-free Raman imaging was applied to monitor intracellular distribution of the anticancer drug topoisomerase I inhibitor CPT-11 and its intracellular conversion to non-toxic SN-38 molecule [285].
Label-free Raman imaging can also be used to discriminate between the healthy and cancer cells, demonstrating difference in the distribution of organelles and the relative amount of various cytosolic molecules [287,288]. Raman imaging was employed to study yeasts and it was shown that yeast death was preceded by the disappearance of the Raman peak that corresponded to semiubiquinone radical and/or ergosterol depletion [289].
Raman imaging was also applied to the study distribution of c and b-type cytochromes in cardiomyocytes [90], cytochrome c release from mitochondria of cultured cells [87]. It was found, that mitochondria in the periphery and in the center of healthy rod-shaped cardiomyocytes differ in the relative amount of reduced b-type cytochromes vs. reduced c-type cytochromes and that round-shaped transformed cardiomyocytes did not possess such mitochondria difference, having a lower relative amount of all reduced cytochromes (Figure 9). The heterogeneity of mitochondria in healthy cardiomyocytes was already shown by biochemical methods with the selective isolation of mitochondria from the peripheral and central cell regions; however, it was never non-invasively demonstrated on living cells.
The visualization of blood vessels and monitoring of hemoglobin oxygenation depending on the activity of the adjacent cells, is another promising biochemical application of Raman imaging. It is possible to perform quantitative Raman measurements and visualization of blood oxygenation in vessels in different organs due to the intensive and highly specific Raman scattering of oxy-and deoxyhemoglobin. It was demonstrated that resonance Raman imaging allows for one monitoring of hemoglobin saturation with O2 in venules and arterioles of cortex of anesthetized intubated mice (Figure 10) [81].

8. Raman Spectroscopy of Photoactive Proteins

Photoactive proteins functioning is based on changes in protein structure that are initiated by light absorption by a chromophore. Initial local photoinduced structural change of the chromophore is then propagated, which leads to protein function. Clarification of the structural dynamics that are associated with the chromophore isomerization is crucial for understanding of photoactive proteins mechanisms [290]. Table 1 shows the main classes of photoactive proteins discussed here and RS techniques that were used to describe them.

8.1. RS of Microbial Rhodopsins

Microbial rhodopsins are canonical photoactive proteins that are present in microscopic organisms from all life domains. They consist of seven transmembrane α-helices (opsin), and a retinal chromophore that was covalently bound to the lysine residue via protonated Schiff-base. The absorption of a photon by the retinal causes its isomerization (Figure 11A). The photoisomerization of the chromophore takes place within sub-picoseconds. The abundance of microbial rhodopsins, their structural and functional diversity, relative simplicity of heterological expression, and stability in artificial membrane mimetics make them excellent model systems for fundamental studies and provide their numerous applications in biotechnology. Most microbial rhodopsins are light-sensitive ion channels, pumps or sensors. The study of one of these light-gated cation channels ChR2 led to the development of optogenetics, a technique that allows for altering neuronal activity by means of light. First one-component optogenetic system was introduced in 2005 and used ChR2 [291]. At this moment, the conception of optogenetics covers a lot of applications, i.e., fundamental study of inner membrane structures of the cell, peripheral nervous system investigation, degenerative retina prosthetics, and a lot more. Robust development in this field opened new era of microbial rhodopsins study [292,293] and generated a tsunami of structural-functional studies of retinal proteins that aimed at the development of new optogenetic tools [19,293,294,295,296,297,298,299,300]. Advanced RS, such as resonance, time-resolved, SRS provide exclusive information regarding their functional and structural peculiarities, thus facilitating the design of novel optogenetic tools.
The best-studied microbial rhodopsin is bacteriorhodopsin (BR), a 27 kDa light-driven proton pump from the purple membrane of Halobacterium salinarum. The absorption of a photon by the retinal prosthetic group in bacteriorhodopsin initiates the cyclic photochemical reaction (photocycle), which correlate with transport of protons across the cell membrane. The resulting electrochemical proton gradient is coupled to ATP synthesis [302]. In the late 1970s, it was confirmed that BR underwent a photocycle leading from the dark state, absorbing at 568 nm, through the K, L, M, N, and O states (discovered later) back to the dark state within about 30 ms [303,304].
Resonance RS was first used in 1970s as an in situ probe of the light-induced structural changes of the retinal during BR photocycle, and it has been reviewed in work [305].
Both frequencies and intensities of the resulting vibrational spectra are highly sensitive to chromophore structure and environment (Figure 11B). The method provided unambiguous information regarding the configuration of the C13=C14 and C=N bonds, and the protonation state of the Schiff base. The vibrational spectra were also used to examine the conformation of the C-C single bonds. Intense hydrogen out-of-plane wagging vibrations in the Raman spectra allowed for identifying conformational distortions of the chromophore in K and O intermediates, direct products of chromophore isomerization.
There were two challenges that were encountered in Raman experiments on photoactive molecules, which stimulated further development of the technique. First, because of the retinal chromophore photosensitivity and its absorption of probe laser light, the sample structure may be altered during the study. Second, the intermediates accumulate with rising times ranging from picoseconds to milliseconds, so one has to obtain Raman spectra with different time resolution. These limitations were overcome by fruitful studies in 1970s–1980s, which resulted in the development of rapid-flow sampling systems, time-resolved resonance RS, and low-temperature set-ups. In the rapid flow experiment, the photosensitive sample was passed through the laser beam in a high-velocity stream, so that photoproducts could not accumulate to a significant level. Most experimental designs for time-resolved resonance RS used a “pump” laser beam to initiate photocycling of BR and a “probe” laser beam to excite the Raman spectrum. The low-temperature methods allowed for obtaining resonance Raman spectra of the primary photoproduct of BR [305,306,307].
The individual resonance Raman spectra of the light-adapted purple membrane from Halobacterium salinarum have been measured while using the low technique in 1977 [308]. The Raman data indicated that Schiff base became unprotonated and then protonated again during photocycle. The spectral features of the two forms are different from each other because of different electron delocalization. The advantage of this technique was that the Raman spectra only characterized the chromophore, not other colorless purple membrane components. Thus, the technique provided specific information regarding the conformation of the in situ chromophore [308].
Another difficulty with studying microbial rhodopsins (and membrane proteins in general) is their amphiphilic nature. However, they could be trapped, for instance, with amphipathic polymers called amphipols (APols), which are low-detergent and have very low critical aggregation concentration. Therefore, proteins are more stable in APols than in most other membrane mimetics and they remain stable and functional when immobilized onto solid surfaces. These properties of APols make them useful in performing SERS studies. Polovinkin et al. used BR amphipole complexes to explore the feasibility of studying APol-trapped membrane proteins by SERS. It was found that amphipole-trapped BR stays native and stable, even in a dried state at low humidity, thus it may be assembled with noble metal nanoparticles (NPs). A dried mixture of BR/amphipole solution and Ag NPs colloids showed a considerable enhancement of Raman signals by at least two orders of magnitude [309]. Thus, BR is also suitable as a model object for testing SERS in potential membrane protein studies.
One of the ways to observe the structural dynamics of specific sites of protein structure is picosecond time-resolved ultraviolet resonance RS [310]. This technique allows for one to enhance the vibrational Raman bands that correspond to aromatic amino acid side chains and polypeptide bonds with high selectivity. Although UVRR spectroscopy application to protein dynamics in the picosecond range is limited due to high requirements of the light source, the proper design of experimental set-up overcomes these difficulties. The developed apparatus consisted of two widely tunable light sources for time-resolved UVRR spectroscopy while using a 1-kHz picosecond Ti:sapphire laser/regenerative amplifier system which allowed for generating independently tunable pump and probe pulses with a high repetition rate [310].
Another common technique in retinal-binding proteins characterization is near-infrared RS due to retinal bands domination in the Raman spectra of rhodopsins, even when the excitation wavelength is far from the wavelength of chromophore absorption maximum. Thus, the use of near-IR excitation allows for one to probe the vibrational spectrum of the retinal chromophore without driving the photocycle or interference from protein bands [311].
Resonance RS was used to study retinal conformation and the environment of a bunch of rhodopsins, including BR, mammalian visual rhodopsin, sensory rhodopsin I and II, halorhodopsin, Anabaena sensory rhodopsin, anion, and cation channelrhodopsins, heliorhodopsins, proteorhodopsins, KR2 sodium pump (Figure 12).
Different methods determined the retinal isomer composition of ChR2 dark state(s). RS showed a mixture of 70:30% all-trans,15-anti and 13-cis,15-syn retinal, the C=N–H vibration was down-shifted and sharpened by H/D exchange [313]. The obtained isomer ratio was extremely important for refining the crystallographic data and revealing high-resolution structure of ChR2 that was elusive for 15 years [314].
Confocal near-infrared resonance Raman spectroscopy (RRS) was recently applied to the studying retinal structure, as well as its interactions with the protein in the unphotolyzed state of an ACR from Guillardia theta (GtACR1) [301].
K. eikastus KR2 is a hybrid outward sodium ion–proton pump in the marine flavobacteria [295,315]. Watermarked, baseline-free femto- to picosecond transient stimulated Raman spectroscopy (TSRS) enabled gathering more information regarding photocycle, excited-state dynamics and the retinal isomerization of KR2 and its mutants. Hontani et al. [315] demonstrated real-time retinal chromophore dynamics with high spectral resolution. The authors proposed a new photocycle model of KR2, evolving to J (formed in B200 fs) − K(B3 ps) − K/L1 (B20 ps) − K/L2 (B30 ns) − L/M (B20 ms), by considering the transient Raman spectra on hydrogen-out-of-plane (HOOP), C–C stretching and C=C stretching modes. Recently, the photochemistry of one more sodium pump IaNaR from Indibacter alkaliphilus was described by transient resonance RS while using the single-beam rapid flow technique discussed earlier. The data provide evidence for a gate structure of NaR during its Na+ pumping process, implying the unusually strong hydrogen bonding environment and the HOOP band at 955 cm−1 in L-state in the Schiff base group [312].
Heliorhodopsins (HeRs) are representatives of a recently discovered class of retinal proteins with yet unclear function featured inverted position in membrane when compared to known rhodopsins and low sequence homology with them [316]. Otomo et al. characterized the RR spectra of HeR 48C12 and HeR T. archaeon SG8-52-1 and demonstrated that a strong hydrogen bond is likely to form to a counter-ion residue in the HeRs. The vibrational coupling of the ν(C=C) and δ(N–H) modes indicates different Schiff base geometry in HeRs and other known microbial rhodopsins. These results agree with structural data, which demonstrated distinct retinal pocket organization of HeRs [296]. Nevertheless, Figure 13 shows that the RR spectra of heliorhodopsin HeR 48C12 have a lot of similarities with other microbial rhodopsin spectra although the protein has unique structural features and unclear function.
The X-ray crystallographic structure showed that Tyr174 might be one of the key residues in the SRII signal transduction pathway, but it did not provide direct evidence of structure and/or environment of Tyr174 changes after retinal photoisomerization [318]. Mizuno et al. applied time-resolved UVRR spectroscopy to study the photochemical characteristics of sensory rhodopsin SRII. The observed reduction of the intensity of Raman bands of tryptophan and tyrosine residues located in the vicinity of the retinal chromophore clearly showed the changes [319]. Another sensory rhodopsin from Anabaena (ASR) has 13C (13-cis, 15-syn) and AT (all-trans) isomers that have structural and dynamical differences in the isomerization. In the recent study, the Raman measurements showed that the longer dynamics that were observed for AT ASR may result both from a barrier in the excited state and the lack of a pre-distortion (compared to 13C isomer) in the ground state [320]. The increase of ground-state C14−HOOP Raman activity of AT and 13C-isomers caused by point mutation showed that localized change in electrostatic interaction mutation might induce a subtle distortion of retinal geometry, which might lead to an accelerated isomerization kinetics [321].
One of the challenges of structural biology is proving that obtained crystal structure is relevant to the actual conformation of functional protein. Morizumi et al. [322] solved the crystal structure of Gloeobacter rhodopsin (GR), cyanobacterial proton pump that can be potentially used in optogenetics and performed RS and time-resolved laser spectroscopy in the visible range to probe the GR dark state and the photocycle in the crystals. The plate-like crystals were grown in bicelles at pH 3.4 in the dark (see below) and then harvested without freezing for spectroscopic studies. The results confirmed the similarity of crystalline GR to the functional state of GR in membranes.
RS was successfully used for identifying the differences between highly homologous proteins. For example, Kralj et al. compared the resonance Raman spectra of the two most investigated representatives of proteorhodopsins, from marine bacteria GPR and BPR. The chromophore structures of these proteorhodopsins were remarkably similar, but resonance RS with near-IR 785 nm was able to reveal minor differences in the environments of the C13 methyl group and of the Schiff base, which may explain different spectral tuning and photocycle rate [311]. In another work, Harris et al. applied Raman spectroscopy for the characterization of PspR from Pseudomonas putida, which is a close homologue of BR from marine proteobacteria and it shows proton activity but possesses unusual proton donor, histidine residue [323]. Raman spectra of PspR in crude E. coli membranes in lysis buffer and reconstituted in proteoliposomes were recorded [323]. The position of the main ethylenic C=C stretch was at 1532 cm−1, which correlated with the absorption maximum in the visible range, while the major fingerprint C–C stretches were at 1200 and 1165 cm−1, respectively, and an observable band at 1184 cm−1 was absent. The authors concluded that PspR mainly contains all-tans-retinal, and the retinal composition has not changed upon light- and dark-adaptation, in great contrast to BR. The observed isotope shift, such as N–D wag vibration at 977 cm−1 and the 21 cm−1 shift of C-N stretch from 1646 to 1625 cm−1, indicated stronger than in BR hydrogen-bonding of the Schiff base. Resonance Raman spectroscopy was used to reveal the properties of the diverse group of channelrhodopsins. While channelrhodopsin-2 from Chlamydomonas reinhardtii (CrChR2) is studied extensively [314], a promising light-gated cation channel channelrhodopsin-1 from Chlamydomonas augustae (CaChR1) is less described. Ogren et al. showed the surprising stability of Raman spectra over the wide pH range, being stronger than in BR hydrogen bonding of protonated Schiff base and distinct retinal composition from ChR2 [324]. Muders et al. recorded the Raman spectrum of the open (conductive) P2 state of a channelrhodopsin and the frequency of the deprotonated RSB, showed ground-state heterogeneity of the CaChR1 retinal chromophore and suggested distinctive structures for the conductive states of two channelrhodopsins. The Raman stretching vibrations of the C = C were determined at 1533 cm−1 for CaChR1 with all-trans retinal (1550 cm−1 for CrChR1 with all-trans retinal) [325].

8.2. RS of Type-2 Microbial Rhodopsins, Bilin- and Flavin-Bound Photoreceptors and Artificial Near-Infrared Rhodopsins

Type-2 (animal) rhodopsins were also extensively studied by Raman spectroscopy techniques. For instance, ultrafast photoisomerization in bovine rhodopsin was confirmed by [326]. Picosecond time-resolved coherent anti-Stokes Raman scattering (CARS) was applied to study the twists in the retinal backbone of bovine rhodopsin intermediates [327].
Chromophore heterogeneity and its relation to signaling is the focus of a number of studies on phytochromes [328]. Phytochromes are biological photoreceptors that can be reversibly photoconverted between a dark and photoactivated state by photoisomerization of a phytochromobilin (P8B) and a phycocyanobilin (PCB) in plant and cyanobacterial phytochromes, respectively. In addition, the photoactivated state, i.e., Pfr in phytochromes, can be thermally reverted to the dark state (Pr). The cofactor structure of various P8B- and PCB-binding phytochromes in the Pfr state was analyzed by vibrational spectroscopic techniques. Resonance Raman spectroscopy (RRS) revealed two Pfr conformers (Pfr-I and Pfr-II) that form a temperature-dependent conformational equilibrium [329]. Spillane et al. studied another cyanobacterial phytochrome Cph1 by Raman spectroscopy [330].
The Raman studies indicate that Meta-Rc in BphP has a deprotonated bilin, which occurs on a millisecond timescale and requires the reprotonation of the bilin to generate Pfr. The transient release of a proton to the solvent during population of the Meta-Rc intermediate was also confirmed [290].
Unno et al. devoted their study to blue-light sensing BLUF domain from flavin-containing photoreceptor family. The BLUF domains are present in various proteins from Bacteria and lower Eukarya. The authors obtain insight into the dynamics of the amino acid side chains that interact with the isoalloxacine ring of FAD (flavin adenine dinucleotide) while using femtosecond stimulated Raman experiments [331].
Near-infrared (NIR)-driven rhodopsins are of great interest for optogenetics. Preresonance watermarked stimulated Raman spectroscopy was applied to the PR:MMAR, a proton pump proteorhodopsin (PR) containing a NIR-active retinal analogue MMAR, a retinal analog containing a methylamino modified β-ionone ring. Various modes (1169, 1191, and 1216 cm−1) comply with C−C stretching modes in the native all-trans retinal chromophore in bacteriorhodopsin and PR. The isolated hydrogen-out-of-plane (HOOP) modes (856 cm−1), coupled HOOPs (947, 957 cm−1), showed increasing distortion of the chromophore upon lowering the pH. The 1250 cm−1 band is assigned to the aromatic amine C−N stretch that is particular to the MMAR chromophore. The study provided the main features of this promising retinal analogue protein system: strong pH-dependent NIR absorbance, fluorescence intensity, and an excitation-wavelength-dependent photocycle [332]. Mei et al. studied the same protein with combination of UV-Vis-NIR absorption and RRS and concluded that the NIR species exhibit spectral features, which are very similar to that of the O photointermediate of the light-adapted BR (BR570) photocycle [333].

8.3. Optogenetics and Physiology in Terms of Raman Spectroscopy Applications

Engineered microbial rhodopsin protein with three states underlie the technique “flash memory”, being designed to record a photochemical imprint of the activity state of a neuron at a particular moment. Two mutants of the fluorescent voltage indicator Arch can be used as flash memory sensors, one of them as a light-gated storing a photochemical record of action potentials in a rat neuron, and the other as a light-gated voltage integrator reporting the number of electrical spikes that had occurred in a HEK cell.
One of the most common methods of investigation of action potential in cells is patch-clamp and other electrophysiological techniques. However, they are invasive, so the next step in optogenetics development might be designing new non-invasive probes of membrane potential that are based on voltage-induced changes in mechanical (such as membrane shift during action potential) and optical (i.e., intensity of scattered light) cell properties [334,335]. The recently developed coherent Raman scattering microscopy, including coherent anti-stokes Raman scattering (CARS) and stimulated Raman scattering (SRS), is promising in biomedical imaging applications and has already been applied to show correlation of membrane spectral profile with transmembrane potential in a model membrane [336]. Recently, Lee et al. identified two potential SRS spectroscopic signatures for transmembrane potential from the near-infrared-absorbing proteorhodopsins and demonstrated the opportunity of quantitative mapping of membrane voltage in living cells [337]. The SRS spectra analysis of neuronal membrane under somatic voltage-clamp control demonstrated that CH3 vibration at 2930 cm−1, which is mainly contributed by proteins, is sensitive to membrane voltage. Thus, SRS allows for the mapping of membrane potential with subcellular resolution and high-speed imaging for multi-neuron analysis in mouse brain slices [338].
Single cell Raman spectroscopy and imaging allows for discovering and explaining other intriguing properties of cells. For example, Song et al. examined the time-dependent assembly of PR in E. coli single cells; they quantified PR production while using mass spectrometry, and then showed that populations of E. coli cells containing PR surprisingly exhibited significantly extended viability Raman spectroscopy that was detected the vibrational fingerprints of PR, nucleic acids, and membrane lipids in nine-month-old cells. This property might be inherent to membrane assemblies of PR, which invests significantly in metabolic resources of marine bacteria extending the survival of their population during periods of severe nutrient limitation [339].

9. Conclusions

The number of applications of RS in structural biology and medicine is amazing. Currently, RS is widely used in protein crystallography and structural biology in general. For example, RS allows for tracking ligand conformations in protein crystal structures, studying the phase transitions in protein crystals, protein and DNA conformational changes and interactions, determination of the secondary structure of proteins, protein folding, comparison of protein structures in crystals, and solutions and protein pharmaceutical studies.
Recent advances in RS open new horizons for biological and medical studies in THz range (<300 cm−1) (THz-CARS) under biologically relevant conditions, detection of isotope-labelled molecules using multimodal CARS technique. The technique is already developing towards covering the cell and tissue scales and even towards applications in surgery.
Obtaining the structure of a membrane protein BR in purple membranes by the electron diffraction method in 1975 greatly inspired further development of structural biology of proteins [293]. Photoactive proteins remain one of the favorite research objects due to their broad range of applications.
The accumulated X-ray structural data help to explain the mechanisms underlying photoreactive protein function, to design and predict novel optogenetic tools. Raman scattering is one of the techniques that has proven to be exclusively informative in understanding protein dynamics upon illumination, including crystalline proteins.
However, RS techniques also have limitations. Simultaneous RS and RRS have relatively low intensity of Raman scattering of most of biological molecules which requires high power of laser excitation. Accordingly, each studied object should be carefully checked for the potential photodamage and some cell types cannot be studied by RS due to this negative effect or the light-induced processes changing the cell state. The limitation of SERS approach is the possible negative effect of nanostructures and nanoparticles or by-products of their synthesis on the morphology and function of cells. Direct interaction of nanoparticles with biomacromolecules (proteins, DNA, RNA) can also result in the change of their conformation. Hence, multiple tests should be applied to be sure in the applicability of the chosen SERS-active structures to the study of biological objects. Another limitation of non-resonance RS studies, including imaging, is complication in the spectral analysis due to the low specificity of Raman peaks of proteins to the certain protein. Thus, it is possible to characterize total changes in the secondary structure of all proteins in the studied cell region, however, without additional studies it is difficult to point out the exact protein that was changed.
Despite the limitations, Raman spectroscopy complemented structural research results in a number of applications for structural biology, biophysics, and optogenetic tools. In the present review, we also discussed the effectiveness of the CARS technique in the detection of small membrane protein crystals, including those that were grown in meso. We believe that it is essential to combine structural studies with Raman scattering techniques to obtain full and unambiguous understanding of protein function.
Thus, a comparison of different imaging techniques shows that each of them has its own advantage. The recently introduced CARS approach certainly enables e.g., imaging of chiral crystals independently of crystals quality, it can identify twinning and be very sensitive to detect small crystals of (submicron) size, hidden into lipidic meso phases, and hardly detectable with other known techniques. CARS allows for overcoming some limitations of RS. In this review, we compared different methods of protein crystals detection, especially in the case of membrane protein microcrystals, which is a real challenge for modern protein crystallography. We showed that P-CARS might be a perspective method of detection of membrane protein microcrystals, serving as an instrument in the commonly used pool of techniques for crystals detection.
Highly sensitive methods of non-resonance Raman spectroscopy helped to work out label-free cell sorters and track changes in the state of cells by their Raman fingerprints. Recent developments in the field of CARS and SERS allowed for high-resolution imaging of cells and cellular structures (for example, the distribution of chromatin in a cell) without the use of specific dyes or other labels that can alter the behavior of a living cell.
Significant progress was made in detecting noticeably small amounts of specific marker molecules, proteins, and nucleic acid fragments. The detection of specific DNA molecules circulating with the bloodstream is already being used to create a personalized medicine [30]. The sensitivity of CARS and SERS biosensors turned out to be significantly higher than that of traditional methods, such as PCR, and help to solve the problems of detection in specific DNA and RNA fragments.
We hope that this review will be helpful due to covering a wide range of RS techniques and approaches, their applications in science and medicine, and will serve as a quick guide to enormously large information ‘hidden’ in the literature.

Author Contributions

A.V.V. was the project administrator, wrote sections “1. Introduction”, “3. Raman Scattering in Structural Biology and Cell Biophysics” and “9. Conclusions”, reviewed and edited the whole text. N.L.M. wrote section “8. Raman Spectroscopy of Photoactive Proteins”, strongly contributed to the sections “1. Introduction” and “9. Conclusions”, reviewed and edited the whole text. S.V.B. wrote section “4. Raman Spectroscopy in DNA Structural Investigations”, reviewed and edited the whole text. E.I.N. wrote sections “6.2. SERS in biomedicine and diagnostics” and “SERS in Cancer Research and Diagnostics”, reviewed and edited the whole text. N.A.B. wrote section “3.1. RS of Lipids and Lipid Structures”, edited and contributed to the section “7. Raman Scattering for Cell Imaging” and contributed to the section “5. Raman Scattering Applications for Cancer Research and Diagnostics”, reviewed and edited the whole text. A.D.V. wrote section “5. Raman Scattering Applications for Cancer Research and Diagnostics”. S.D.O. wrote section “6.1. RS in biomedicine and diagnostics”. V.V.S. wrote section “2. Background”. Y.L.R. strongly contributed to section “2. Background”. E.V.Z. contributed to the section “6.1. RS in biomedicine and diagnostics”. A.O.B. wrote section “7. Raman Scattering for Cell Imaging”. A.V.R. organized funding acquisition, reviewed and edited the whole text. I.V.M. contributed to the section “1. Introduction” and edited section “4. Raman Spectroscopy in DNA Structural Investigations”. V.I.B. contributed to the section “8. Raman Spectroscopy of Photoactive Proteins”, reviewed and edited the whole text. A.I.K. edited the section “3. Raman Scattering in Structural Biology and Cell Biophysics”, reviewed and edited the whole text. J.P. strongly contributed to the sections “1. Introduction” and “2. Background”, reviewed and edited the whole text. O.S. contributed to the sections “6.1. RS in biomedicine and diagnostics”, “3.2. RS of Proteins, Protein Interactions and Dynamics”, “7. Raman Scattering for Cell Imaging”. G.V.M. contributed to the section “3.2. RS of Proteins, Protein Interactions and Dynamics” and “6.1. RS in biomedicine and diagnostics”. V.I.G. supervised the project, strongly contributed to the sections “1. Introduction”, “2. Background”, “3. Raman Scattering in Structural Biology and Cell Biophysics”, “8. Raman Spectroscopy of Photoactive Proteins” and “9. Conclusions”, reviewed and edited the whole text. All authors have read and agreed to the published version of the manuscript.

Funding

A.V.V. was funded by RFBR, grant number 18-34-00256. S.V.B. was funded by RFBR, grant number 20-34-70132. A.O.B. and V.I.B. were funded by Ministry of Science and Higher Education of the Russian Federation, project no. 6.9909.2017/BY. J.P. was funded by Czech Science Foundation, project 16-12757S. E.I.N. was funded by RFBR, grant number 18-34-00503 mol_a. N.A.B. was funded by RSF, grant number 17-74-20089. G.V.M. was funded by RSF, grant number 19-79-30062.

Acknowledgments

We are grateful to Eugene Goodilin and Anna Semenova for discussions of SERS applications to live-cell studies.

Conflicts of Interest

The authors declare no conflict of interest.

Abbreviations

CARScoherent anti-Stokes Raman scattering
DCNNdeep convolutional neural network
DFAdiscriminant function analysis
EMelectron microscopy
LCPlipidic cubic phase
PCAprincipal component analysis
P-CARSPolarized CARS
RMRaman microscopy
RSRaman spectroscopy
RRSresonance Raman spectroscopy
SEMscanning electron microscopy
SERSsurface-enhanced Raman scattering
SHGsecond harmonic generation
SONICCsecond order nonlinear imaging of chiral crystals
SRSstimulated Raman scattering
TEMtransmission electron microscopy
TERStip-enhanced Raman spectroscopy
TPEFtwo-photon excited autofluorescence
XRDX-ray diffraction
XFELX-ray free electron laser

References

  1. Smekal, A. Zur Quantentheorie der Dispersion. Naturwissenschaften 1923, 11, 873–875. [Google Scholar] [CrossRef]
  2. Raman, C.V. A change of wave-length in light scattering. Nature 1928, 121, 619. [Google Scholar] [CrossRef]
  3. Landsberg, G.; Mandelstam, L. Über die Lichtzerstreuung in Kristallen. Zeitschrift für Phys. 1928, 50, 769–780. [Google Scholar] [CrossRef]
  4. Born, M.; Bradburn, M. The theory of the Raman effect in crystals, in particular rocksalt. Proc. R. Soc. Lond. A Math. Phys. Sci. 1947, 188, 161–178. [Google Scholar] [PubMed]
  5. Kashima, T.; Watari, T.; Mikubo, H. Raman spectra and structure of molecular addition compound of aminopyrine and barbital in aqueous solution. Eisei Shikenjo Hokoku 1961, 79, 59–63. [Google Scholar] [PubMed]
  6. Tobin, M.C. Raman spectra of crystalline lysozyme, pepsin, and alpha chymotrypsin. Science 1968, 161, 68–69. [Google Scholar] [CrossRef] [PubMed]
  7. Lord, R.C.; Yu, N.T. Laser-excited Raman spectroscopy of biomolecules. II. Native ribonuclease and α-chymotrypsin. J. Mol. Biol. 1970, 51, 203–213. [Google Scholar] [CrossRef]
  8. Rimai, L.; Kilponen, R.G.; Gill, D. Resonance-enhanced raman spectra of visual pigments in intact bovine retinas at low temperatures. Biochem. Biophys. Res. Commun. 1970, 41, 492–497. [Google Scholar] [CrossRef]
  9. Long, T.V.; Loehr, T.M. Possible determination of iron coordination in nonheme iron proteins using laser-Raman spectroscopy. Rubredoxin. J. Am. Chem. Soc. 1970, 92, 6384–6386. [Google Scholar] [CrossRef]
  10. Kissick, D.J.; Wanapun, D.; Simpson, G.J. Second-order nonlinear optical imaging of chiral crystals. Annu. Rev. Anal. Chem. 2011, 4, 419–437. [Google Scholar] [CrossRef] [Green Version]
  11. Ray, L.B. Silencing neurons using optogenetics. Science 2015, 349, 598. [Google Scholar] [CrossRef]
  12. Shevchenko, V.; Gushchin, I.; Polovinkin, V.; Kovalev, K.; Balandin, T.; Borshchevskiy, V.; Gordeliy, V. Sodium and engineered potassium light-driven pumps. In Optogenetics: From Neuronal Function to Mapping and Disease Biology; Cambridge University Press: Cambridge, UK, 2017; pp. 79–92. ISBN 9-78110-728-1875. [Google Scholar]
  13. Barnett, S.C.; Perry, B.A.L.; Dalrymple-Alford, J.C.; Parr-Brownlie, L.C. Optogenetic stimulation: Understanding memory and treating deficits. Hippocampus 2018, 28, 457–470. [Google Scholar] [CrossRef] [PubMed]
  14. Chang, R.B. Optogenetic Control of the Peripheral Nervous System. Cold Spring Harb. Perspect. Med. 2019, 5, a034397. [Google Scholar] [CrossRef] [PubMed]
  15. Ostrovsky, M.A.; Kirpichnikov, M.P. Prospects of Optogenetic Prosthesis of the Degenerative Retina of the Eye. Biochemistry 2019, 84, 479–490. [Google Scholar] [CrossRef]
  16. Boyle, P.M.; Karathanos, T.V.; Trayanova, N.A. Cardiac Optogenetics 2018. JACC Clin. Electrophysiol. 2018, 4, 155–167. [Google Scholar] [CrossRef]
  17. Johnson, H.E.; Toettcher, J.E. Illuminating developmental biology with cellular optogenetics. Curr. Opin. Biotechnol. 2018, 52, 42–48. [Google Scholar] [CrossRef]
  18. Deiters, A. Special Issue on Optochemical and Optogenetic Control of Cellular Processes. ChemBioChem 2018, 19, 1198–1200. [Google Scholar] [CrossRef] [Green Version]
  19. Shevchenko, V.; Mager, T.; Kovalev, K.; Polovinkin, V.; Alekseev, A.; Juettner, J.; Chizhov, I.; Bamann, C.; Vavourakis, C.; Ghai, R.; et al. Inward H+ pump xenorhodopsin: Mechanism and alternative optogenetic approach. Sci. Adv. 2017, 3, e1603187. [Google Scholar] [CrossRef] [Green Version]
  20. Althaus, T.; Eisfeld, W.; Lohrmann, R.; Stockburger, M. Application of Raman Spectroscopy to Retinal Proteins. Isr. J. Chem. 1995, 35, 227–251. [Google Scholar] [CrossRef]
  21. Singh, N.; Kumar, P.; Riaz, U. Applications of near infrared and surface enhanced Raman scattering techniques in tumor imaging: A short review. Spectrochim. Acta Part A Mol. Biomol. Spectrosc. 2019, 222, 117279. [Google Scholar] [CrossRef]
  22. Kast, R.E.; Serhatkulu, G.K.; Cao, A.; Pandya, A.K.; Dai, H.; Thakur, J.S.; Naik, V.M.; Naik, R.; Klein, M.D.; Auner, G.W.; et al. Raman spectroscopy can differentiate malignant tumors from normal breast tissue and detect early neoplastic changes in a mouse model. Biopolymers 2008, 89, 235–241. [Google Scholar] [CrossRef] [PubMed]
  23. Aljakouch, K.; Hilal, Z.; Daho, I.; Schuler, M.; Krauß, S.D.; Yosef, H.K.; Dierks, J.; Mosig, A.; Gerwert, K.; El-Mashtoly, S.F. Fast and Noninvasive Diagnosis of Cervical Cancer by Coherent Anti-Stokes Raman Scattering. Anal. Chem. 2019, 91, 13900–13906. [Google Scholar] [CrossRef] [PubMed]
  24. Gniadecka, M.; Philipsen, P.A.; Sigurdsson, S.; Wessel, S.; Nielsen, O.F.; Christensen, D.H.; Hercogova, J.; Rossen, K.; Thomsen, H.K.; Gniadecki, R.; et al. Melanoma Diagnosis by Raman Spectroscopy and Neural Networks: Structure Alterations in Proteins and Lipids in Intact Cancer Tissue. J. Investig. Dermatol. 2004, 122, 443–449. [Google Scholar] [CrossRef] [PubMed] [Green Version]
  25. Singh, S.; Jha, H.C. Optical Imaging with Signal Processing for Non-Invasive Diagnosis in Gastric Cancer: Nonlinear Optical Microscopy Modalities. In Advances in Intelligent Systems and Computing; Springer: Berlin, Germany, 2019; Volume 748, pp. 609–619. [Google Scholar]
  26. Liang, L.; Huang, D.; Wang, H.; Li, H.; Xu, S.; Chang, Y.; Li, H.; Yang, Y.-W.; Liang, C.; Xu, W. In Situ Surface-Enhanced Raman Scattering Spectroscopy Exploring Molecular Changes of Drug-Treated Cancer Cell Nucleus. Anal. Chem. 2015, 87, 2504–2510. [Google Scholar] [CrossRef] [PubMed]
  27. El-Mashtoly, S.F.; Yosef, H.K.; Petersen, D.; Mavarani, L.; Maghnouj, A.; Hahn, S.; Kötting, C.; Gerwert, K. Label-Free Raman Spectroscopic Imaging Monitors the Integral Physiologically Relevant Drug Responses in Cancer Cells. Anal. Chem. 2015, 87, 7297–7304. [Google Scholar] [CrossRef] [PubMed]
  28. Deng, R.; Qu, H.; Liang, L.; Zhang, J.; Zhang, B.; Huang, D.; Xu, S.; Liang, C.; Xu, W. Tracing the Therapeutic Process of Targeted Aptamer/Drug Conjugate on Cancer Cells by Surface-Enhanced Raman Scattering Spectroscopy. Anal. Chem. 2017, 89, 2844–2851. [Google Scholar] [CrossRef]
  29. Prado, E.; Colin, A.; Servant, L.; Lecomte, S. SERS Spectra of Oligonucleotides as Fingerprints to Detect Label-Free RNA in Microfluidic Devices. J. Phys. Chem. C 2014, 118, 13965–13971. [Google Scholar] [CrossRef]
  30. Swierczewska, M.; Liu, G.; Lee, S.; Chen, X. High-sensitivity nanosensors for biomarker detection. Chem. Soc. Rev. 2012, 41, 2641–2655. [Google Scholar] [CrossRef]
  31. Kankia, B.I.; Marky, L.A. Folding of the Thrombin Aptamer into a G-Quadruplex with Sr2+: Stability, Heat, and Hydration. J. Am. Chem. Soc. 2001, 123, 10799–10804. [Google Scholar] [CrossRef]
  32. Aubrey, K.L.; Thomas, G.J.; Casjens, S.R. Secondary Structure and Interactions of the Packaged Dsdna Genome of Bacteriophage P22 Investigated by Raman Difference Spectroscopy. Biochemistry 1992, 31, 11835–11842. [Google Scholar] [CrossRef]
  33. Dong, R.; Yan, X.; Pang, X.; Liu, S. Temperature-dependent Raman spectra of collagen and DNA. Spectrochim. Acta Part A Mol. Biomol. Spectrosc. 2004, 60, 557–561. [Google Scholar] [CrossRef]
  34. Morla-Folch, J.; Xie, H.; Alvarez-Puebla, R.A.; Guerrini, L. Fast Optical Chemical and Structural Classification of RNA. ACS Nano 2016, 10, 2834–2842. [Google Scholar] [CrossRef] [PubMed]
  35. Garcia-Rico, E.; Alvarez-Puebla, R.A.; Guerrini, L. Direct surface-enhanced Raman scattering (SERS) spectroscopy of nucleic acids: From fundamental studies to real-life applications. Chem. Soc. Rev. 2018, 47, 4909–4923. [Google Scholar] [CrossRef] [PubMed]
  36. López-Peña, I.; Leigh, B.S.; Schlamadinger, D.E.; Kim, J.E. Insights into Protein Structure and Dynamics by Ultraviolet and Visible Resonance Raman Spectroscopy. Biochemistry 2015, 54, 4770–4783. [Google Scholar] [CrossRef] [PubMed] [Green Version]
  37. Jones, R.R.; Hooper, D.C.; Zhang, L.; Wolverson, D.; Valev, V.K. Raman Techniques: Fundamentals and Frontiers. Nanoscale Res. Lett. 2019, 14, 1–34. [Google Scholar] [CrossRef] [PubMed] [Green Version]
  38. Fang, C.; Wu, G. Temporal electronic structures of nonresonant Raman excited virtual states: A case study of ethylene thiourea. J. Raman Spectrosc. 2007, 38, 1416–1420. [Google Scholar] [CrossRef]
  39. Le Ru, E.C.; Blackie, E.; Meyer, M.; Etchegoin, P.G. Surface Enhanced Raman Scattering Enhancement Factors:  A Comprehensive Study. J. Phys. Chem. C 2007, 111, 13794–13803. [Google Scholar] [CrossRef]
  40. Ding, S.Y.; You, E.M.; Tian, Z.Q.; Moskovits, M. Electromagnetic theories of surface-enhanced Raman spectroscopy. Chem. Soc. Rev. 2017, 46, 4042–4076. [Google Scholar] [CrossRef]
  41. Lombardi, J.R.; Birke, R.L. A Unified View of Surface-Enhanced Raman Scattering. Acc. Chem. Res. 2009, 42, 734–742. [Google Scholar] [CrossRef] [Green Version]
  42. Cardinal, M.F.; Vander Ende, E.; Hackler, R.A.; McAnally, M.O.; Stair, P.C.; Schatz, G.C.; Van Duyne, R.P. Expanding applications of SERS through versatile nanomaterials engineering. Chem. Soc. Rev. 2017, 46, 3886–3903. [Google Scholar] [CrossRef] [Green Version]
  43. Pilot, R.; Signorini, R.; Fabris, L. Surface-enhanced Raman spectroscopy: Principles, substrates, and applications. In Metal Nanoparticles and Clusters: Advances in Synthesis, Properties and Applications; Springer International Publishing: Berlin, Germany, 2017; pp. 89–164. ISBN 9-78331-968-0538. [Google Scholar]
  44. Muniz-Miranda, M.; Muniz-Miranda, F.; Pedone, A. Spectroscopic and computational studies on ligand-capped metal nanoparticles and clusters. In Metal Nanoparticles and Clusters: Advances in Synthesis, Properties and Applications; Springer International Publishing: Berlin, Germany, 2017; pp. 55–87. ISBN 9-78331-968-0538. [Google Scholar]
  45. Sonntag, M.D.; Pozzi, E.A.; Jiang, N.; Hersam, M.C.; Van Duyne, R.P. Recent Advances in Tip-Enhanced Raman Spectroscopy. J. Phys. Chem. Lett. 2014, 5, 3125–3130. [Google Scholar] [CrossRef] [PubMed]
  46. Shao, F.; Zenobi, R. Tip-enhanced Raman spectroscopy: Principles, practice, and applications to nanospectroscopic imaging of 2D materials. Anal. Bioanal. Chem. 2019, 411, 37–61. [Google Scholar] [CrossRef] [PubMed] [Green Version]
  47. Cui, M.; Bachler, B.R.; Nichols, S.R.; Ogilvie, J.P. Comparing coherent and spontaneous Raman scattering under biological imaging conditions. Opt. Lett. 2009, 34, 773–775. [Google Scholar] [CrossRef] [PubMed]
  48. Boudon, V.; Bermejo, D.; Martínez, R.Z. High-resolution stimulated Raman spectroscopy and analysis of the ν1, 2ν1ν1, ν2, 2ν2, and 3ν2ν2 bands of CF4. J. Raman Spectrosc. 2013, 44, 731–738. [Google Scholar] [CrossRef] [Green Version]
  49. Nandakumar, P.; Kovalev, A.; Volkmer, A. Vibrational imaging Based on stimulated Raman scattering microscopy. New J. Phys. 2009, 11, 033026. [Google Scholar] [CrossRef]
  50. Volkmer, A.; Cheng, J.-X.; Sunney Xie, X. Vibrational Imaging with High Sensitivity via Epidetected Coherent Anti-Stokes Raman Scattering Microscopy. Phys. Rev. Lett. 2001, 87, 023901. [Google Scholar] [CrossRef] [Green Version]
  51. Lu, F.; Zheng, W.; Huang, Z. Coherent anti-Stokes Raman scattering microscopy using tightly focused radially polarized light. Opt. Lett. 2009, 34, 1870. [Google Scholar] [CrossRef]
  52. Parekh, S.H.; Lee, Y.J.; Aamer, K.A.; Cicerone, M.T. Label-free cellular imaging by Broadband coherent anti-stokes raman scattering microscopy. Biophys. J. 2010, 99, 2695–2704. [Google Scholar] [CrossRef] [Green Version]
  53. Ren, L.; Hurwitz, I.; Raanan, D.; Oulevey, P.; Oron, D.; Silberberg, Y. Terahertz coherent anti-Stokes Raman scattering microscopy. Optica 2019, 6, 52. [Google Scholar] [CrossRef]
  54. Shen, Y.; Wang, J.; Wang, K.; Sokolov, A.V.; Scully, M.O. Wide-field coherent anti-Stokes Raman scattering microscopy based on picosecond supercontinuum source. APL Photonics 2018, 3, 116104. [Google Scholar] [CrossRef] [Green Version]
  55. Tipping, W.J.; Lee, M.; Serrels, A.; Brunton, V.G.; Hulme, A.N. Stimulated Raman scattering microscopy: An emerging tool for drug discovery. Chem. Soc. Rev. 2016, 45, 2075–2089. [Google Scholar] [CrossRef] [PubMed] [Green Version]
  56. Potma, E.O.; Xie, X.S. CARS Microscopy for Biology and Medicine. Opt. Photonics News 2004, 15, 40. [Google Scholar] [CrossRef]
  57. Ichimura, T.; Hayazawa, N.; Hashimoto, M.; Inouye, Y.; Kawata, S. Local enhancement of coherent anti-Stokes Raman scattering by isolated gold nanoparticles. J. Raman Spectrosc. 2003, 34, 651–654. [Google Scholar] [CrossRef]
  58. Steuwe, C.; Kaminski, C.F.; Baumberg, J.J.; Mahajan, S. Surface Enhanced Coherent Anti-Stokes Raman Scattering on Nanostructured Gold Surfaces. Nano Lett. 2011, 11, 5339–5343. [Google Scholar] [CrossRef]
  59. Frontiera, R.R.; Henry, A.I.; Gruenke, N.L.; Van Duyne, R.P. Surface-enhanced femtosecond stimulated Raman spectroscopy. J. Phys. Chem. Lett. 2011, 2, 1199–1203. [Google Scholar] [CrossRef]
  60. Prince, R.C.; Frontiera, R.R.; Potma, E.O. Stimulated Raman scattering: From bulk to nano. Chem. Rev. 2017, 117, 5070–5094. [Google Scholar] [CrossRef]
  61. Robert, B. Resonance Raman spectroscopy. Photosynth. Res. 2009, 101, 147–155. [Google Scholar] [CrossRef]
  62. Antonio, K.A.; Schultz, Z.D. Advances in biomedical raman microscopy. Anal. Chem. 2014, 86, 30–46. [Google Scholar] [CrossRef]
  63. Freudiger, C.W.; Min, W.; Saar, B.G.; Lu, S.; Holtom, G.R.; He, C.; Tsai, J.C.; Kang, J.X.; Xie, X.S. Label-free biomedical imaging with high sensitivity by stimulated raman scattering microscopy. Science 2008, 322, 1857–1861. [Google Scholar] [CrossRef] [Green Version]
  64. Evans, C.L.; Xie, X.S. Coherent Anti-Stokes Raman Scattering Microscopy: Chemical Imaging for Biology and Medicine. Annu. Rev. Anal. Chem. 2008, 1, 883–909. [Google Scholar] [CrossRef] [Green Version]
  65. Zheng, X.S.; Jahn, I.J.; Weber, K.; Cialla-May, D.; Popp, J. Label-free SERS in biological and biomedical applications: Recent progress, current challenges and opportunities. Spectrochim. Acta Part A Mol. Biomol. Spectrosc. 2018, 197, 56–77. [Google Scholar] [CrossRef] [PubMed]
  66. Wang, X.; Huang, S.C.; Huang, T.X.; Su, H.S.; Zhong, J.H.; Zeng, Z.C.; Li, M.H.; Ren, B. Tip-enhanced Raman spectroscopy for surfaces and interfaces. Chem. Soc. Rev. 2017, 46, 4020–4041. [Google Scholar] [CrossRef] [PubMed]
  67. Rostron, P.; Gaber, S.; Gaber, D. Raman spectroscopy, review. Laser 2016, 21, 24. [Google Scholar]
  68. Krafft, C.; Neudert, L.; Simat, T.; Salzer, R. Near infrared Raman spectra of human brain lipids. Spectrochim. Acta Part A Mol. Biomol. Spectrosc. 2005, 61, 1529–1535. [Google Scholar] [CrossRef] [PubMed]
  69. Brazhe, N.A.; Nikelshparg, E.I.; Prats, C.; Dela, F.; Sosnovtseva, O. Raman probing of lipids, proteins, and mitochondria in skeletal myocytes: A case study on obesity. J. Raman Spectrosc. 2017, 48, 1158–1165. [Google Scholar] [CrossRef]
  70. Wu, H.; Volponi, J.V.; Oliver, A.E.; Parikh, A.N.; Simmons, B.A.; Singh, S. In vivo lipidomics using single-cell Raman spectroscopy. Proc. Natl. Acad. Sci. USA 2011, 108, 3809–3814. [Google Scholar] [CrossRef] [Green Version]
  71. Wampler, R.D.; Kissick, D.J.; Dehen, C.J.; Gualtieri, E.J.; Grey, J.L.; Wang, H.F.; Thompson, D.H.; Cheng, J.X.; Simpson, G.J. Selective detection of protein crystals by second harmonic microscopy. J. Am. Chem. Soc. 2008, 130, 14076–14077. [Google Scholar] [CrossRef]
  72. Müller, M.; Schins, J.M. Imaging the thermodynamic state of lipid membranes with multiplex CARS microscopy. J. Phys. Chem. B 2002, 106, 3715–3723. [Google Scholar] [CrossRef]
  73. Wurpel, G.W.H.; Schins, J.M.; Müller, M. Direct measurement of chain order in single phospholipid mono- and bilayers with multiplex CARS. J. Phys. Chem. B 2004, 108, 3400–3403. [Google Scholar] [CrossRef]
  74. Cheng, J.X.; Volkmer, A.; Book, L.D.; Xie, X.S. Multiplex coherent anti-stokes Raman scattering microspectroscopy and study of lipid vesicles. J. Phys. Chem. B 2002, 106, 8493–8498. [Google Scholar] [CrossRef]
  75. Rinia, H.A.; Bonn, M.; Müller, M.; Vartiainen, E.M. Quantitative CARS spectroscopy using the maximum entropy method: The main lipid phase transition. ChemPhysChem 2007, 8, 279–287. [Google Scholar] [CrossRef] [PubMed]
  76. Spiro, T.G.; Strekas, T.C. Resonance Raman spectra of hemoglobin and cytochrome c: Inverse polarization and vibronic scattering. Proc. Natl. Acad. Sci. USA 1972, 69, 2622–2626. [Google Scholar] [CrossRef] [PubMed] [Green Version]
  77. Spiro, T.G.; Strekas, T.C. Resonance Raman Spectra of Heme Proteins. Effects of Oxidation and Spin State. J. Am. Chem. Soc. 1974, 96, 338–345. [Google Scholar] [CrossRef] [PubMed]
  78. Torres Filho, I.P.; Terner, J.; Pittman, R.N.; Proffitt, E.; Ward, K.R. Measurement of hemoglobin oxygen saturation using Raman microspectroscopy and 532-nm excitation. J. Appl. Physiol. 2008, 104, 1809–1817. [Google Scholar] [CrossRef] [PubMed] [Green Version]
  79. Torres Filho, I.P.; Nguyen, N.M.; Jivani, R.; Terner, J.; Romfh, P.; Vakhshoori, D.; Ward, K.R. Oxygen saturation monitoring using resonance Raman spectroscopy. J. Surg. Res. 2016, 201, 425–431. [Google Scholar] [CrossRef] [Green Version]
  80. Ward, K.R.; Barbee, R.W.; Reynolds, P.S.; Torres Filho, I.P.; Tiba, M.H.; Torres, L.; Pittman, R.N.; Terner, J. Oxygenation Monitoring of Tissue Vasculature by Resonance Raman Spectroscopy. Anal. Chem. 2007, 79, 1514–1518. [Google Scholar] [CrossRef] [Green Version]
  81. Brazhe, N.A.; Thomsen, K.; Lønstrup, M.; Brazhe, A.R.; Nikelshparg, E.I.; Maksimov, G.V.; Lauritzen, M.; Sosnovtseva, O. Monitoring of blood oxygenation in brain by resonance Raman spectroscopy. J. Biophotonics 2018, 11, e201700311. [Google Scholar] [CrossRef]
  82. Wood, B.R.; Caspers, P.; Puppels, G.J.; Pandiancherri, S.; McNaughton, D. Resonance Raman spectroscopy of red blood cells using near-infrared laser excitation. Anal. Bioanal. Chem. 2007, 387, 1691–1703. [Google Scholar] [CrossRef]
  83. Chowdhury, A.; Dasgupta, R.; Majumder, S.K. Changes in hemoglobin–oxygen affinity with shape variations of red blood cells. J. Biomed. Opt. 2017, 22, 1. [Google Scholar] [CrossRef]
  84. Rusciano, G.; De Luca, A.; Pesce, G.; Sasso, A. Raman Tweezers as a Diagnostic Tool of Hemoglobin-Related Blood Disorders. Sensors 2008, 8, 7818–7832. [Google Scholar] [CrossRef] [Green Version]
  85. Atkins, C.G.; Buckley, K.; Blades, M.W.; Turner, R.F.B. Raman Spectroscopy of Blood and Blood Components. Appl. Spectrosc. 2017, 71, 767–793. [Google Scholar] [CrossRef] [PubMed]
  86. Van Manen, H.J.; Kraan, Y.M.; Roos, D.; Otto, C. Intracellular chemical imaging of heme-containing enzymes involved in innate immunity using resonance Raman microscopy. J. Phys. Chem. B 2004, 108, 18762–18771. [Google Scholar] [CrossRef]
  87. Okada, M.; Smith, N.I.; Palonpon, A.F.; Endo, H.; Kawata, S.; Sodeoka, M.; Fujita, K. Label-free Raman observation of cytochrome c dynamics during apoptosis. Proc. Natl. Acad. Sci. USA 2012, 109, 28–32. [Google Scholar] [CrossRef] [PubMed] [Green Version]
  88. Kakita, M.; Kaliaperumal, V.; Hamaguchi, H.O. Resonance Raman quantification of the redox state of cytochromes b and c in-vivo and in-vitro. J. Biophotonics 2012, 5, 20–24. [Google Scholar] [CrossRef]
  89. Yasuda, M.; Takeshita, N.; Shigeto, S. Inhomogeneous Molecular Distributions and Cytochrome Types and Redox States in Fungal Cells Revealed by Raman Hyperspectral Imaging Using Multivariate Curve Resolution–Alternating Least Squares. Anal. Chem. 2019, 91, 12501–12508. [Google Scholar] [CrossRef]
  90. Brazhe, N.A.; Treiman, M.; Brazhe, A.R.; Find, N.L.; Maksimov, G.V.; Sosnovtseva, O.V. Mapping of Redox State of Mitochondrial Cytochromes in Live Cardiomyocytes Using Raman Microspectroscopy. PLoS ONE 2012, 7, e41990. [Google Scholar] [CrossRef]
  91. Brazhe, N.A.; Treiman, M.; Faricelli, B.; Vestergaard, J.H.; Sosnovtseva, O. In Situ Raman Study of Redox State Changes of Mitochondrial Cytochromes in a Perfused Rat Heart. PLoS ONE 2013, 8, e70488. [Google Scholar] [CrossRef] [Green Version]
  92. Nishiki-Muranishi, N.; Harada, Y.; Minamikawa, T.; Yamaoka, Y.; Dai, P.; Yaku, H.; Takamatsu, T. Label-Free Evaluation of Myocardial Infarction and Its Repair by Spontaneous Raman Spectroscopy. Anal. Chem. 2014, 86, 6903–6910. [Google Scholar] [CrossRef]
  93. Ohira, S.; Tanaka, H.; Harada, Y.; Minamikawa, T.; Kumamoto, Y.; Matoba, S.; Yaku, H.; Takamatsu, T. Label-free detection of myocardial ischaemia in the perfused rat heart by spontaneous Raman spectroscopy. Sci. Rep. 2017, 7, 42401. [Google Scholar] [CrossRef] [Green Version]
  94. Perry, D.A.; Salvin, J.W.; Romfh, P.; Chen, P.; Krishnamurthy, K.; Thomson, L.M.; Polizzotti, B.D.; McGowan, F.X.; Vakhshoori, D.; Kheir, J.N. Responsive monitoring of mitochondrial redox states in heart muscle predicts impending cardiac arrest. Sci. Transl. Med. 2017, 9, eaan0117. [Google Scholar] [CrossRef] [Green Version]
  95. Yamamoto, T.; Minamikawa, T.; Harada, Y.; Yamaoka, Y.; Tanaka, H.; Yaku, H.; Takamatsu, T. Label-free Evaluation of Myocardial Infarct in Surgically Excised Ventricular Myocardium by Raman Spectroscopy. Sci. Rep. 2018, 8, 14671. [Google Scholar] [CrossRef] [PubMed]
  96. Costas, C.; López-Puente, V.; Bodelón, G.; González-Bello, C.; Pérez-Juste, J.; Pastoriza-Santos, I.; Liz-Marzán, L.M. Using Surface Enhanced Raman Scattering to Analyze the Interactions of Protein Receptors with Bacterial Quorum Sensing Modulators. ACS Nano 2015, 9, 5567–5576. [Google Scholar] [CrossRef] [PubMed]
  97. Christophersen, P.C.; Birch, D.; Saarinen, J.; Isomäki, A.; Nielsen, H.M.; Yang, M.; Strachan, C.J.; Mu, H. Investigation of protein distribution in solid lipid particles and its impact on protein release using coherent anti-Stokes Raman scattering microscopy. J. Control. Release 2015, 197, 111–120. [Google Scholar] [CrossRef] [PubMed]
  98. Rygula, A.; Majzner, K.; Marzec, K.M.; Kaczor, A.; Pilarczyk, M.; Baranska, M. Raman spectroscopy of proteins: A review. J. Raman Spectrosc. 2013, 44, 1061–1076. [Google Scholar] [CrossRef]
  99. De Gelder, J.; De Gussem, K.; Vandenabeele, P.; Moens, L. Reference database of Raman spectra of biological molecules. J. Raman Spectrosc. 2007, 38, 1133–1147. [Google Scholar] [CrossRef]
  100. Bandekar, J. Amide modes and protein conformation. Biochim. Biophys. Acta BBA Protein Struct. Mol. 1992, 1120, 123–143. [Google Scholar] [CrossRef]
  101. Yu, N.T.; Jo, B.H. Comparison of protein structure in crystals and in solution by laser Raman scattering. I. Lysozyme. Arch. Biochem. Biophys. 1973, 156, 469–474. [Google Scholar] [CrossRef]
  102. Frontzek, A.V.; Paccou, L.; Guinet, Y.; Hédoux, A. Study of the phase transition in lysozyme crystals by Raman spectroscopy. Biochim. Biophys. Acta Gen. Subj. 2016, 1860, 412–423. [Google Scholar] [CrossRef] [Green Version]
  103. Zabelskii, D.V.; Vlasov, A.V.; Ryzhykau, Y.L.; Murugova, T.N.; Brennich, M.; Soloviov, D.V.; Ivankov, O.I.; Borshchevskiy, V.I.; Mishin, A.V.; Rogachev, A.V.; et al. Ambiguities and completeness of SAS data analysis: Investigations of apoferritin by SAXS/SANS EID and SEC-SAXS methods. J. Phys. Conf. Ser. 2018, 994, 012017. [Google Scholar] [CrossRef]
  104. Vlasov, A.V.; Murugova, T.N.; Gruner, S.M.; Ivankov, O.I.; Soloviov, D.V.; Rogachev, A.V.; Round, A.; Ryzhykau, Y.L.; Mishin, A.; Balandin, T.; et al. Protein structure and structural ordering versus concentration dependence. FEBS J. 2014, 281, 593–594. [Google Scholar]
  105. Vlasov, A.V.; Ryzhykau, Y.L.; Gordeliy, V.I.; Kuklin, A.I. Spinach ATP-synthases form dimers in nanodiscs. Small-angle X-ray and neutron scattering investigations. FEBS J. 2017, 284, 87. [Google Scholar]
  106. Kuklin, A.I.; Rogachev, A.V.; Soloviov, D.V.; Ivankov, O.I.; Murugova, T.N.; Chupin, V.V.; Rulev, M.I.; Skoi, V.V.; Kučerka, N.; Vlasov, A.V.; et al. SANS investigations of biological objects on a YuMO spectrometer: Results and possibilities. J. Bioenerg. Biomembr. 2018, 50, 555. [Google Scholar]
  107. Murugova, T.N.; Vlasov, A.V.; Ivankov, O.I.; Rogachev, A.V.; Soloviov, D.V.; Zhigunov, A.; Kovalev, Y.S.; Ryzhykau, Y.L.; Zinovev, E.V.; Round, A.; et al. Low resolution structural studies of apoferritin via SANS and SAXS: The Effect of concentration. J. Optoelectron. Adv. Mater. 2015, 17, 1397–1402. [Google Scholar]
  108. Vlasova, A.D.; Khramtsov, Y.V.; Vlasov, A.V.; Kuklin, A.I.; Gordeliy, V.I.; Sobolev, A.S. Low-resolution structure of modular nanotransporters obtained by small-angle X-ray scattering method. J. Bioenerg. Biomembr. 2018, 50, 593. [Google Scholar]
  109. Kazantsev, A.S.; Vlasov, A.V.; Ryzhykau, Y.L.; Zabelskii, D.V.; Murugova, T.N.; Ivankov, O.I.; Rogachev, A.V.; Zinovev, E.V.; Kurbatov, N.M.; Gordeliy, V.I.; et al. SAXS studies of apoferritin in different pH with consideration of dimers. J. Bioenerg. Biomembr. 2018, 50, 548. [Google Scholar]
  110. Das, S.; Pal, U.; Chatterjee, M.; Pramanik, S.K.; Banerji, B.; Maiti, N.C. Envisaging Structural Insight of a Terminally Protected Proline Dipeptide by Raman Spectroscopy and Density Functional Theory Analyses. J. Phys. Chem. A 2016, 120, 9829–9840. [Google Scholar] [CrossRef]
  111. Bito, K.; Okuno, M.; Kano, H.; Tokuhara, S.; Naito, S.; Masukawa, Y.; Leproux, P.; Couderc, V.; Hamaguchi, H.O. Protein secondary structure imaging with ultrabroadband multiplex coherent anti-Stokes Raman scattering (CARS) microspectroscopy. J. Phys. Chem. B 2012, 116, 1452–1457. [Google Scholar] [CrossRef]
  112. Asamoto, D.A.K.; Kim, J.E. UV Resonance Raman Spectroscopy as a Tool to Probe Membrane Protein Structure and Dynamics. In Methods in Molecular Biology; Humana Press Inc.: Totowa, NJ, USA, 2019; Volume 2003, pp. 327–349. [Google Scholar]
  113. Lippert, J.L.; Tyminski, D.; Desmeules, P.J. Determination of the Secondary Structure of Proteins by Laser Raman Spectroscopy. J. Am. Chem. Soc. 1976, 98, 7075–7080. [Google Scholar] [CrossRef]
  114. Sane, S.U.; Cramer, S.M.; Przybycien, T.M. A holistic approach to protein secondary structure characterization using amide I band Raman spectroscopy. Anal. Biochem. 1999, 269, 255–272. [Google Scholar] [CrossRef]
  115. Masic, A.; Bertinetti, L.; Schuetz, R.; Galvis, L.; Timofeeva, N.; Dunlop, J.W.C.; Seto, J.; Hartmann, M.A.; Fratzl, P. Observations of Multiscale, Stress-Induced Changes of Collagen Orientation in Tendon by Polarized Raman Spectroscopy. Biomacromolecules 2011, 12, 3989–3996. [Google Scholar] [CrossRef]
  116. Van Gulick, L.; Saby, C.; Morjani, H.; Beljebbar, A. Age-related changes in molecular organization of type I collagen in tendon as probed by polarized SHG and Raman microspectroscopy. Sci. Rep. 2019, 9, 7280. [Google Scholar] [CrossRef] [PubMed] [Green Version]
  117. Silva, D.F.T.; Gomes, A.S.L.; de Campos Vidal, B.; Ribeiro, M.S. Birefringence and Second Harmonic Generation on Tendon Collagen Following Red Linearly Polarized Laser Irradiation. Ann. Biomed. Eng. 2013, 41, 752–762. [Google Scholar] [CrossRef] [PubMed]
  118. Frushour, B.G.; Koenig, J.L. Raman scattering of collagen, gelatin, and elastin. Biopolymers 1975, 14, 379–391. [Google Scholar] [CrossRef] [PubMed]
  119. Makowski, A.J.; Granke, M.; Uppuganti, S.; Mahadevan-Jansen, A.; Nyman, J.S. Bone Tissue Heterogeneity is Associated with Fracture Toughness: A Polarization Raman Spectroscopy Study. In Photonic Therapeutics and Diagnostics XI; Choi, B., Kollias, N., Zeng, H., Kang, H.W., Wong, B.J.F., Ilgner, J.F., Nuttal, A., Richter, C.-P., Skala, M.C., Dewhirst, M.W., et al., Eds.; SPIE: Washington, DC, USA, 2015; p. 930341. [Google Scholar]
  120. Galvis, L.; Dunlop, J.W.C.; Duda, G.; Fratzl, P.; Masic, A. Polarized Raman Anisotropic Response of Collagen in Tendon: Towards 3D Orientation Mapping of Collagen in Tissues. PLoS ONE 2013, 8, e63518. [Google Scholar] [CrossRef] [PubMed]
  121. Balakrishnan, G.; Weeks, C.L.; Ibrahim, M.; Soldatova, A.V.; Spiro, T.G. Protein dynamics from time resolved UV Raman spectroscopy. Curr. Opin. Struct. Biol. 2008, 18, 623–629. [Google Scholar] [CrossRef] [PubMed] [Green Version]
  122. Tuma, R. Raman spectroscopy of proteins: From peptides to large assemblies. J. Raman Spectrosc. 2005, 36, 307–319. [Google Scholar] [CrossRef]
  123. Balakhnina, I.A.; Brandt, N.N.; Chikishev, A.Y.; Mankova, A.A.; Shpachenko, I.G. Low-frequency vibrational spectroscopy of proteins with different secondary structures. J. Biomed. Opt. 2017, 22, 091509. [Google Scholar] [CrossRef]
  124. Ishigaki, M.; Hashimoto, K.; Sato, H.; Ozaki, Y. Non-destructive monitoring of mouse embryo development and its qualitative evaluation at the molecular level using Raman spectroscopy. Sci. Rep. 2017, 7, 43942. [Google Scholar] [CrossRef] [Green Version]
  125. McColl, I.H.; Blanch, E.W.; Hecht, L.; Barron, L.D. A Study of α-Helix Hydration in Polypeptides, Proteins, and Viruses Using Vibrational Raman Optical Activity. J. Am. Chem. Soc. 2004, 126, 8181–8188. [Google Scholar] [CrossRef]
  126. Berezhna, S.; Wohlrab, H.; Champion, P.M. Resonance Raman Investigations of Cytochrome c Conformational Change upon Interaction with the Membranes of Intact and Ca2+-Exposed Mitochondria. Biochemistry 2003, 42, 6149–6158. [Google Scholar] [CrossRef]
  127. Sun, Y.; Benabbas, A.; Zeng, W.; Kleingardner, J.G.; Bren, K.L.; Champion, P.M. Investigations of heme distortion, low-frequency vibrational excitations, and electron transfer in cytochrome c. Proc. Natl. Acad. Sci. USA 2014, 111, 6570–6575. [Google Scholar] [CrossRef] [PubMed] [Green Version]
  128. Chertkova, R.V.; Brazhe, N.A.; Bryantseva, T.V.; Nekrasov, A.N.; Dolgikh, D.A.; Yusipovich, A.I.; Sosnovtseva, O.; Maksimov, G.V.; Rubin, A.B.; Kirpichnikov, M.P. New insight into the mechanism of mitochondrial cytochrome c function. PLoS ONE 2017, 12, e0178280. [Google Scholar] [CrossRef] [PubMed]
  129. Varco-Merth, B.; Fromme, R.; Wang, M.; Fromme, P. Crystallization of the c14-rotor of the chloroplast ATP synthase reveals that it contains pigments. Biochim. Biophys. Acta Bioenerg. 2008, 1777, 605–612. [Google Scholar] [CrossRef] [PubMed] [Green Version]
  130. Malone, L.A.; Qian, P.; Mayneord, G.E.; Hitchcock, A.; Farmer, D.A.; Thompson, R.F.; Swainsbury, D.J.K.; Ranson, N.A.; Hunter, C.N.; Johnson, M.P. Cryo-EM structure of the spinach cytochrome b6 f complex at 3.6 Å resolution. Nature 2019, 575, 535–539. [Google Scholar] [CrossRef] [PubMed]
  131. Vlasov, A.V.; Kovalev, K.V.; Marx, S.-H.; Round, E.S.; Gushchin, I.Y.; Polovinkin, V.A.; Tsoy, N.M.; Okhrimenko, I.S.; Borshchevskiy, V.I.; Büldt, G.D.; et al. Unusual features of the c-ring of F1FO ATP synthases. Sci. Rep. 2019, 9, 18547. [Google Scholar] [CrossRef] [Green Version]
  132. Nazarenko, V.V.; Remeeva, A.; Yudenko, A.; Kovalev, K.; Dubenko, A.; Goncharov, I.M.; Kuzmichev, P.; Rogachev, A.V.; Buslaev, P.; Borshchevskiy, V.; et al. A thermostable flavin-based fluorescent protein from Chloroflexus aggregans: A framework for ultra-high resolution structural studies. Photochem. Photobiol. Sci. 2019, 18, 1793–1805. [Google Scholar] [CrossRef]
  133. Pacia, M.Z.; Turnau, K.; Baranska, M.; Kaczor, A. Interplay between carotenoids, hemoproteins and the “life band” origin studied in live Rhodotorula mucilaginosa cells by means of Raman microimaging. Analyst 2015, 140, 1809–1813. [Google Scholar] [CrossRef]
  134. Nishida, T.; Kaino, T.; Ikarashi, R.; Nakata, D.; Terao, K.; Ando, M.; Hamaguchi, H.O.; Kawamukai, M.; Yamamoto, T. The effect of coenzyme Q10 included by γ-cyclodextrin on the growth of fission yeast studied by microscope Raman spectroscopy. J. Mol. Struct. 2013, 1048, 375–381. [Google Scholar] [CrossRef]
  135. Slepkov, A.D.; Barlow, A.M.; Ridsdale, A.; McGinn, P.J.; Stolow, A. In vivo hyperspectral CARS and FWM microscopy of carotenoid accumulation in H. Pluvialis. In Proceedings of the Multimodal Biomedical Imaging IX, San Francisco, CA, USA, 1–6 February 2014; SPIE: San Francisco, CA, USA, 2014; Volume 8937, p. 893709. [Google Scholar]
  136. Røhr, Å.K.; Hersleth, H.P.; Kristoffer Andersson, K. Tracking flavin conformations in protein crystal structures with raman spectroscopy and QM/MM calculations. Angew. Chem. Int. Ed. 2010, 49, 2324–2327. [Google Scholar] [CrossRef]
  137. Altose, M.D.; Zheng, Y.; Dong, J.; Palfey, B.A.; Carey, P.R. Comparing protein-ligand interactions in solution and single crystals by Raman spectroscopy. Proc. Natl. Acad. Sci. USA 2001, 98, 3006–3011. [Google Scholar] [CrossRef] [Green Version]
  138. Mishin, A.; Gusach, A.; Luginina, A.; Marin, E.; Borshchevskiy, V.; Cherezov, V. An outlook on using serial femtosecond crystallography in drug discovery. Expert Opin. Drug Discov. 2019, 1–13. [Google Scholar] [CrossRef] [PubMed]
  139. Baltoumas, F.A.; Theodoropoulou, M.C.; Hamodrakas, S.J. Interactions of the α-subunits of heterotrimeric G-proteins with GPCRs, effectors and RGS proteins: A critical review and analysis of interacting surfaces, conformational shifts, structural diversity and electrostatic potentials. J. Struct. Biol. 2013, 182, 209–218. [Google Scholar] [CrossRef] [PubMed]
  140. Gusach, A.; Luginina, A.; Marin, E.; Brouillette, R.L.; Besserer-Offroy, É.; Longpré, J.; Ishchenko, A.; Popov, P.; Patel, N.; Fujimoto, T.; et al. Structural basis of ligand selectivity and disease mutations in cysteinyl leukotriene receptors. Nat. Commun. 2019, 10, 1–9. [Google Scholar] [CrossRef] [PubMed]
  141. Luginina, A.; Gusach, A.; Marin, E.; Mishin, A.; Brouillette, R.; Popov, P.; Shiriaeva, A.; Besserer-Offroy, É.; Longpré, J.M.; Lyapina, E.; et al. Structure-based mechanism of cysteinyl leukotriene receptor inhibition by antiasthmatic drugs. Sci. Adv. 2019, 5, eaax2518. [Google Scholar] [CrossRef] [PubMed] [Green Version]
  142. Cherezov, V. Lipidic cubic phase technologies for membrane protein structural studies. Curr. Opin. Struct. Biol. 2011, 21, 559–566. [Google Scholar] [CrossRef] [PubMed] [Green Version]
  143. Ishchenko, A.; Peng, L.; Zinovev, E.; Vlasov, A.; Lee, S.C.; Kuklin, A.; Mishin, A.; Borshchevskiy, V.; Zhang, Q.; Cherezov, V. Chemically Stable Lipids for Membrane Protein Crystallization. Cryst. Growth Des. 2017, 17, 3502–3511. [Google Scholar] [CrossRef] [PubMed]
  144. Bogorodskiy, A.; Frolov, F.; Mishin, A.; Round, E.; Polovinkin, V.; Cherezov, V.; Gordeliy, V.; Büldt, G.; Gensch, T.; Borshchevskiy, V. Nucleation and Growth of Membrane Protein Crystals in Meso—A Fluorescence Microscopy Study. Cryst. Growth Des. 2015, 15, 5656–5660. [Google Scholar] [CrossRef]
  145. Newman, J.A.; Simpson, G.J. Nonlinear optical characterization of membrane proteinmicrocrystals and nanocrystals. Adv. Exp. Med. Biol. 2016, 922, 91–103. [Google Scholar]
  146. Closser, R.G.; Gualtieri, E.J.; Newman, J.A.; Simpson, G.J. Characterization of salt interferences in second-harmonic generation detection of protein crystals. J. Appl. Crystallogr. 2013, 46, 1903–1906. [Google Scholar] [CrossRef] [Green Version]
  147. Arzumanyan, G.; Doroshkevich, N.V.; Mamatkulov, K.; Shashkov, S.; Zinovev, E.V.; Vlasov, A.; Round, E.; Gordeliy, V. Highly Sensitive Coherent anti-Stokes Raman Scattering Imaging of Protein Crystals. J. Am. Chem. Soc. 2016, 138, 13457–13460. [Google Scholar] [CrossRef]
  148. Razumas, V.; Talaikyte, Z.; Barauskas, J.; Larsson, K.; Miezis, Y.; Nylander, T. Effects of distearoylphosphatidylglycerol and lysozyme on the structure of the monoolein-water cubic phase: X-ray diffraction and Raman scattering studies. Chem. Phys. Lipids 1996, 84, 123–138. [Google Scholar] [CrossRef]
  149. Lord, R.C.; Thomas, G.J. Raman spectral studies of nucleic acids and related molecules-I Ribonucleic acid derivatives. Spectrochim. Acta Part A Mol. Spectrosc. 1967, 23, 2551–2591. [Google Scholar] [CrossRef]
  150. Thomas, G.J.; Wang, A.H.-J. Laser Raman Spectroscopy of Nucleic Acids. In Nucleic Acids and Molecular Biology; Springer: Berlin, Germany, 1988; pp. 1–30. [Google Scholar]
  151. Benevides, J.M.; Thomas, G.J. Characterization of DNA structures by Raman spectroscopy: High-salt and low-salt forms of double helical poly(dG-dC) in H2O and D2O solutions and application to B, Z and A-DNA. Nucleic Acids Res. 1983, 11, 5747–5761. [Google Scholar] [CrossRef] [PubMed] [Green Version]
  152. Nishimura, Y.; Tsuboi, M.; Sato, T.; Aoki, K. Conformation-sensitive Raman lines of mononucleotides and their use in a structure analysis of polynucleotides: Guanine and cytosine nucleotides. J. Mol. Struct. 1986, 146, 123–153. [Google Scholar] [CrossRef]
  153. Serban, D.; Benevides, J.M.; Thomas, G.J. DNA secondary structure and Raman markers of supercoiling in Escherichia coli plasmid pUC19. Biochemistry 2002, 41, 847–853. [Google Scholar] [CrossRef]
  154. Deng, H.; Bloomfield, V.A.; Benevides, J.M.; Thomas, G.J. Dependence of the raman signature of genomic B-DNA on nucleotide base sequence. Biopolymers 1999, 50, 656–666. [Google Scholar] [CrossRef]
  155. Pagba, C.V.; Lane, S.M.; Wachsmann-Hogiu, S. Conformational changes in quadruplex oligonucleotide structures probed by Raman spectroscopy. Biomed. Opt. Express 2011, 2, 207. [Google Scholar] [CrossRef] [Green Version]
  156. Thorogood, H.; Waters, T.R.; Parker, A.W.; Wharton, C.W.; Connolly, B.A. Resonance Raman spectroscopy of 4-thiothymidine and oligodeoxynucleotides containing this base both free in solution and bound to the restriction endonuclease EcoRV. Biochemistry 1996, 35, 8723–8733. [Google Scholar] [CrossRef]
  157. Toyama, A.; Miyagawa, Y.; Yoshimura, A.; Fujimoto, N.; Takeuchi, H. Characterization of individual adenine residues in DNA by a combination of site-selective C8-deuteration and UV resonance raman difference spectroscopy. J. Mol. Struct. 2001, 598, 85–91. [Google Scholar] [CrossRef]
  158. Tsuboi, M.; Kubo, Y.; Ikeda, T.; Overman, S.A.; Osman, O.; Thomas, G.J. Protein and DNA residue orientations in the filamentous virus Pf1 determined by polarized Raman and polarized FTIR spectroscopy. Biochemistry 2003, 42, 940–950. [Google Scholar] [CrossRef]
  159. Benevides, J.M.; Overman, S.A.; Thomas, G.J. Raman, polarized Raman and ultraviolet resonance Raman spectroscopy of nucleic acids and their complexes. J. Raman Spectrosc. 2005, 36, 279–299. [Google Scholar] [CrossRef]
  160. Thomas, G.J.; Benevides, J.M.; Overman, S.A.; Ueda, T.; Ushizawa, K.; Saitoh, M.; Tsuboi, M. Polarized Raman spectra of oriented fibers of A DNA and B DNA: Anisotropic and isotropic local Raman tensors of base and backbone vibrations. Biophys. J. 1995, 68, 1073–1088. [Google Scholar] [CrossRef] [Green Version]
  161. Tsuboi, M.; Benevides, J.M.; Thomas, G.J. The complex of ethidium bromide with genomic DNA: Structure analysis by polarized Raman spectroscopy. Biophys. J. 2007, 92, 928–934. [Google Scholar] [CrossRef] [PubMed] [Green Version]
  162. Friedman, S.J.; Terentis, A.C. Analysis of G-quadruplex conformations using Raman and polarized Raman spectroscopy. J. Raman Spectrosc. 2016, 47, 259–268. [Google Scholar] [CrossRef]
  163. Wu, C.Y.; Lo, W.Y.; Chiu, C.R.; Yang, T.S. Surface enhanced Raman spectra of oligonucleotides induced by spermine. J. Raman Spectrosc. 2006, 37, 799–807. [Google Scholar] [CrossRef]
  164. Chen, C.; Li, Y.; Kerman, S.; Neutens, P.; Willems, K.; Cornelissen, S.; Lagae, L.; Stakenborg, T.; Van Dorpe, P. High spatial resolution nanoslit SERS for single-molecule nucleobase sensing. Nat. Commun. 2018, 9, 1733. [Google Scholar] [CrossRef]
  165. Yang, J.M.; Jin, L.; Pan, Z.Q.; Zhou, Y.; Liu, H.L.; Ji, L.N.; Xia, X.H.; Wang, K. Surface-Enhanced Raman Scattering Probing the Translocation of DNA and Amino Acid through Plasmonic Nanopores. Anal. Chem. 2019, 91, 6275–6280. [Google Scholar] [CrossRef]
  166. Li, Y.; Gao, T.; Xu, G.; Xiang, X.; Zhao, B.; Han, X.X.; Guo, X. Direct Approach toward Label-Free DNA Detection by Surface-Enhanced Raman Spectroscopy: Discrimination of a Single-Base Mutation in 50 Base-Paired Double Helixes. Anal. Chem. 2019, 91, 7980–7984. [Google Scholar] [CrossRef] [Green Version]
  167. Chen, C.; Liu, W.; Tian, S.; Hong, T. Novel surface-enhanced raman spectroscopy techniques for DNA, protein and drug detection. Sensors 2019, 19, 1712. [Google Scholar] [CrossRef] [Green Version]
  168. Masetti, M.; Xie, H.; Krpetić, Ž.; Recanatini, M.; Alvarez-Puebla, R.A.; Guerrini, L. Revealing DNA Interactions with Exogenous Agents by Surface-Enhanced Raman Scattering. J. Am. Chem. Soc. 2015, 137, 469–476. [Google Scholar] [CrossRef]
  169. Guerrini, L.; Krpetić, Ž.; van Lierop, D.; Alvarez-Puebla, R.A.; Graham, D. Direct Surface-Enhanced Raman Scattering Analysis of DNA Duplexes. Angew. Chem. Int. Ed. 2015, 54, 1144–1148. [Google Scholar] [CrossRef] [PubMed]
  170. Li, Y.; Han, X.; Zhou, S.; Yan, Y.; Xiang, X.; Zhao, B.; Guo, X. Structural Features of DNA G-Quadruplexes Revealed by Surface-Enhanced Raman Spectroscopy. J. Phys. Chem. Lett. 2018, 9, 3245–3252. [Google Scholar] [CrossRef] [PubMed]
  171. Qian, Y.; Fan, T.; Yao, Y.; Shi, X.; Liao, X.; Zhou, F.; Gao, F. Label-free and Raman dyes-free surface-enhanced Raman spectroscopy for detection of DNA. Sens. Actuators B Chem. 2018, 254, 483–489. [Google Scholar] [CrossRef]
  172. Lin, D.; Wu, Q.; Qiu, S.; Chen, G.; Feng, S.; Chen, R.; Zeng, H. Label-free liquid biopsy based on blood circulating DNA detection using SERS-based nanotechnology for nasopharyngeal cancer screening. Nanomed. Nanotechnol. Biol. Med. 2019, 22, 102100. [Google Scholar] [CrossRef] [PubMed]
  173. Li, X.; Yang, T.; Li, C.S.; Song, Y.; Lou, H.; Guan, D.; Jin, L. Surface Enhanced Raman Spectroscopy (SERS) for the multiplex detection of Braf, Kras, and Pik3ca mutations in plasma of colorectal cancer patients. Theranostics 2018, 8, 1678–1689. [Google Scholar] [CrossRef] [PubMed]
  174. Yu, J.; Jeon, J.; Choi, N.; Lee, J.O.; Kim, Y.P.; Choo, J. SERS-based genetic assay for amplification-free detection of prostate cancer specific PCA3 mimic DNA. Sens. Actuators B Chem. 2017, 251, 302–309. [Google Scholar] [CrossRef]
  175. Korshoj, L.E.; Nagpal, P. Diagnostic Optical Sequencing. ACS Appl. Mater. Interfaces 2019, 11, 35587–35596. [Google Scholar] [CrossRef]
  176. van Lierop, D.; Faulds, K.; Graham, D. Separation Free DNA Detection Using Surface Enhanced Raman Scattering. Anal. Chem. 2011, 83, 5817–5821. [Google Scholar] [CrossRef]
  177. Mahadevan-Jansen, A.; Richards-Kortum, R. Raman spectroscopy for cancer detection: A review. In Proceedings of the 19th Annual International Conference of the IEEE Engineering in Medicine and Biology Society. ‘Magnificent Milestones and Emerging Opportunities in Medical Engineering’, Chicago, IL, USA, 30 October–2 November 1997; Volume 6, pp. 2722–2728. [Google Scholar]
  178. Liu, C.H.; Das, B.B.; Glassman, W.L.S.; Tang, G.C.; Yoo, K.M.; Zhu, H.R.; Akins, D.L.; Lubicz, S.S.; Cleary, J.; Prudente, R.; et al. Raman, fluorescence, and time-resolved light scattering as optical diagnostic techniques to separate diseased and normal biomedical media. J. Photochem. Photobiol. B Biol. 1992, 16, 187–209. [Google Scholar] [CrossRef]
  179. Kallaway, C.; Almond, L.M.; Barr, H.; Wood, J.; Hutchings, J.; Kendall, C.; Stone, N. Advances in the clinical application of Raman spectroscopy for cancer diagnostics. Photodiagn. Photodyn. Ther. 2013, 10, 207–219. [Google Scholar] [CrossRef]
  180. Almond, L.M.; Hutchings, J.; Shepherd, N.; Barr, H.; Stone, N.; Kendall, C. Raman spectroscopy: A potential tool for early objective diagnosis of neoplasia in the oesophagus. J. Biophotonics 2011, 4, 685–695. [Google Scholar] [CrossRef] [PubMed]
  181. Old, O.J.; Fullwood, L.M.; Scott, R.; Lloyd, G.R.; Almond, L.M.; Shepherd, N.A.; Stone, N.; Barr, H.; Kendall, C. Vibrational spectroscopy for cancer diagnostics. Anal. Methods 2014, 6, 3901–3917. [Google Scholar] [CrossRef]
  182. Frank, C.J.; McCreery, R.L.; Redd, D.C.B. Raman Spectroscopy of Normal and Diseased Human Breast Tissues. Anal. Chem. 1995, 67, 777–783. [Google Scholar] [CrossRef] [PubMed]
  183. Haka, A.S.; Shafer-Peltier, K.E.; Fitzmaurice, M.; Crowe, J.; Dasari, R.R.; Feld, M.S. Diagnosing breast cancer by using Raman spectroscopy. Proc. Natl. Acad. Sci. USA 2005, 102, 12371–12376. [Google Scholar] [CrossRef] [PubMed] [Green Version]
  184. Palombo, F.; Madami, M.; Fioretto, D.; Nallala, J.; Barr, H.; David, A.; Stone, N. Chemico-mechanical imaging of Barrett’s oesophagus. J. Biophotonics 2016, 9, 694–700. [Google Scholar] [CrossRef] [PubMed]
  185. Kast, R.E.; Tucker, S.C.; Killian, K.; Trexler, M.; Honn, K.V.; Auner, G.W. Emerging technology: Applications of Raman spectroscopy for prostate cancer. Cancer Metastasis Rev. 2014, 33, 673–693. [Google Scholar] [CrossRef]
  186. Devpura, S.; Thakur, J.S.; Sarkar, F.H.; Sakr, W.A.; Naik, V.M.; Naik, R. Detection of benign epithelia, prostatic intraepithelial neoplasia, and cancer regions in radical prostatectomy tissues using Raman spectroscopy. Vib. Spectrosc. 2010, 53, 227–232. [Google Scholar] [CrossRef]
  187. Crow, P.; Molckovsky, A.; Stone, N.; Uff, J.; Wilson, B.; Wongkeesong, L.M. Assessment of fiberoptic near-infrared raman spectroscopy for diagnosis of bladder and prostate cancer. Urology 2005, 65, 1126–1130. [Google Scholar] [CrossRef]
  188. Huang, Z.; McWilliams, A.; Lui, H.; McLean, D.I.; Lam, S.; Zeng, H. Near-infrared Raman spectroscopy for optical diagnosis of lung cancer. Int. J. Cancer 2003, 107, 1047–1052. [Google Scholar] [CrossRef]
  189. Xu, M.; Ma, J.; Qu, Y.; Mao, W.; Zheng, R. Recognition of gastric cancer by Raman spectroscopy. In Proceedings of the 8th International Conference on Photonics and Imaging in Biology and Medicine (PIBM 2009), Wuhan, China, 8–10 August 2009; SPIE: San Francisco, CA, USA, 2009; Volume 7519, p. 75191H. [Google Scholar]
  190. Taketani, A.; Andriana, B.B.; Matsuyoshi, H.; Sato, H. Raman endoscopy for monitoring the anticancer drug treatment of colorectal tumors in live mice. Analyst 2017, 142, 3680–3688. [Google Scholar] [CrossRef]
  191. Laing, S.; Hernandez-Santana, A.; Sassmannshausen, J.; Asquith, D.L.; McInnes, I.B.; Faulds, K.; Graham, D. Quantitative Detection of Human Tumor Necrosis Factor α by a Resonance Raman Enzyme-Linked Immunosorbent Assay. Anal. Chem. 2011, 83, 297–302. [Google Scholar] [CrossRef] [PubMed]
  192. Zhang, J.; Fan, Y.; He, M.; Ma, X.; Song, Y.; Liu, M.; Xu, J. Accuracy of Raman spectroscopy in differentiating brain tumor from normal brain tissue. Oncotarget 2017, 8, 36824. [Google Scholar] [CrossRef] [PubMed] [Green Version]
  193. Garzon-Muvdi, T.; Kut, C.; Li, X.; Chaichana, K.L. Intraoperative imaging techniques for glioma surgery. Future Oncol. 2017, 13, 1731–1745. [Google Scholar] [CrossRef] [PubMed]
  194. Hollon, T.; Lewis, S.; Freudiger, C.W.; Xie, X.S.; Orringer, D.A. Improving the accuracy of brain tumor surgery via Raman-based technology. J. Neurosurg. 2016, 40, E9. [Google Scholar] [CrossRef]
  195. Jermyn, M.; Mok, K.; Mercier, J.; Desroches, J.; Pichette, J.; Saint-Arnaud, K.; Bernstein, L.; Guiot, M.C.; Petrecca, K.; Leblond, F. Intraoperative brain cancer detection with Raman spectroscopy in humans. Sci. Transl. Med. 2015, 7, 274ra19. [Google Scholar] [CrossRef]
  196. Jermyn, M.; Desroches, J.; Mercier, J.; Tremblay, M.-A.; St-Arnaud, K.; Guiot, M.-C.; Petrecca, K.; Leblond, F. Neural networks improve brain cancer detection with Raman spectroscopy in the presence of operating room light artifacts. J. Biomed. Opt. 2016, 21, 094002. [Google Scholar] [CrossRef] [Green Version]
  197. Desroches, J.; Jermyn, M.; Pinto, M.; Picot, F.; Tremblay, M.A.; Obaid, S.; Marple, E.; Urmey, K.; Trudel, D.; Soulez, G.; et al. A new method using Raman spectroscopy for in vivo targeted brain cancer tissue biopsy. Sci. Rep. 2018, 8, 1792. [Google Scholar] [CrossRef]
  198. Krafft, C.; Sobottka, S.B.; Schackert, G.; Salzer, R. Raman and infrared spectroscopic mapping of human primary intracranial tumors: A comparative study. J. Raman Spectrosc. 2006, 37, 367–375. [Google Scholar] [CrossRef]
  199. Krafft, C.; Bergner, N.; Romeike, B.; Reichart, R.; Kalff, R.; Geiger, K.; Kirsch, M.; Schackert, G.; Popp, J. Raman spectroscopic imaging as complementary tool for histopathologic assessment of brain tumors. In Proceedings of the Photonic Therapeutics and Diagnostics VIII, San Francisco, CA, USA, 21–26 January 2012; SPIE: San Francisco, CA, USA, 2012; Volume 8207, p. 82074I. [Google Scholar]
  200. Koljenović, S.; Choo-Smith, L.P.; Schut, T.C.B.; Kros, J.M.; Van den Berge, H.J.; Puppels, G.J. Discriminating vital tumor from necrotic tissue in human glioblastoma tissue samples by Raman spectroscopy. Lab. Investig. 2002, 82, 1265–1277. [Google Scholar] [CrossRef]
  201. Managò, S.; Valente, C.; Mirabelli, P.; Circolo, D.; Basile, F.; Corda, D.; De Luca, A.C. A reliable Raman-spectroscopy-based approach for diagnosis, classification and follow-up of B-cell acute lymphoblastic leukemia. Sci. Rep. 2016, 6, 24821. [Google Scholar] [CrossRef] [Green Version]
  202. Fabris, L. SERS Tags: The Next Promising Tool for Personalized Cancer Detection? ChemNanoMat 2016, 2, 249–258. [Google Scholar] [CrossRef]
  203. Cialla-May, D.; Zheng, X.S.; Weber, K.; Popp, J. Recent progress in surface-enhanced Raman spectroscopy for biological and biomedical applications: From cells to clinics. Chem. Soc. Rev. 2017, 46, 3945–3961. [Google Scholar] [CrossRef] [PubMed]
  204. Zhang, Y.; Schlücker, S. ISERS microscopy for tissue-based cancer diagnostics with SERS nanotags. In Springer Series in Surface Sciences; Springer: Berlin, Germany, 2018; Volume 66, pp. 347–379. [Google Scholar]
  205. Guerrini, L.; Alvarez-Puebla, R.A. Surface-Enhanced Raman Spectroscopy in Cancer Diagnosis, Prognosis and Monitoring. Cancers 2019, 11, 748. [Google Scholar] [CrossRef] [PubMed] [Green Version]
  206. Schlücker, S.; Küstner, B.; Punge, A.; Bonfig, R.; Marx, A.; Ströbel, P. Immuno-Raman microspectroscopy: In situ detection of antigens in tissue specimens by surface-enhanced Raman scattering. J. Raman Spectrosc. 2006, 37, 719–721. [Google Scholar] [CrossRef]
  207. Wang, X.P.; Zhang, Y.; König, M.; Papadopoulou, E.; Walkenfort, B.; Kasimir-Bauer, S.; Bankfalvi, A.; Schlücker, S. ISERS microscopy guided by wide field immunofluorescence: Analysis of HER2 expression on normal and breast cancer FFPE tissue sections. Analyst 2016, 141, 5113–5119. [Google Scholar] [CrossRef] [Green Version]
  208. Stepula, E.; König, M.; Wang, X.; Levermann, J.; Schimming, T.; Kasimir-Bauer, S.; Schilling, B.; Schlücker, S. Localization of PD-L1 on single cancer cells by iSERS microscopy with Au/Au core/satellite nanoparticles. J. Biophotonics 2019. [Google Scholar] [CrossRef]
  209. Lee, S.; Chon, H.; Yoon, S.Y.; Lee, E.K.; Chang, S.I.; Lim, D.W.; Choo, J. Fabrication of SERS-fluorescence dual modal nanoprobes and application to multiplex cancer cell imaging. Nanoscale 2012, 4, 124–129. [Google Scholar] [CrossRef]
  210. Zavaleta, C.L.; Smith, B.R.; Walton, I.; Doering, W.; Davis, G.; Shojaei, B.; Natan, M.J.; Gambhir, S.S. Multiplexed imaging of surface enhanced Raman scattering nanotags in living mice using noninvasive Raman spectroscopy. Proc. Natl. Acad. Sci. USA 2009, 106, 13511–13516. [Google Scholar] [CrossRef] [Green Version]
  211. Zeng, Y.; Koo, K.M.; Trau, M.; Shen, A.G.; Hu, J.M. Watching SERS glow for multiplex biomolecular analysis in the clinic: A review. Appl. Mater. Today 2019, 15, 431–444. [Google Scholar] [CrossRef]
  212. Pal, S.; Ray, A.; Andreou, C.; Zhou, Y.; Rakshit, T.; Wlodarczyk, M.; Maeda, M.; Toledo-Crow, R.; Berisha, N.; Yang, J.; et al. DNA-enabled rational design of fluorescence-Raman bimodal nanoprobes for cancer imaging and therapy. Nat. Commun. 2019, 10. [Google Scholar] [CrossRef]
  213. Zavaleta, C.L.; Garai, E.; Liu, J.T.C.; Sensarn, S.; Mandella, M.J.; Van De Sompel, D.; Friedland, S.; Van Dam, J.; Contag, C.H.; Gambhira, S.S. A Raman-based endoscopic strategy for multiplexed molecular imaging. Proc. Natl. Acad. Sci. USA 2013, 110, E2288–E2297. [Google Scholar] [CrossRef] [PubMed] [Green Version]
  214. Wang, Y.W.; Kang, S.; Khan, A.; Bao, P.Q.; Liu, J.T.C. In vivo multiplexed molecular imaging of esophageal cancer via spectral endoscopy of topically applied SERS nanoparticles. Biomed. Opt. Express 2015, 6, 3714. [Google Scholar] [CrossRef] [PubMed] [Green Version]
  215. Jeong, S.; Kim, Y.I.; Kang, H.; Kim, G.; Cha, M.G.; Chang, H.; Jung, K.O.; Kim, Y.H.; Jun, B.H.; Hwang, D.W.; et al. Fluorescence-Raman Dual Modal Endoscopic System for Multiplexed Molecular Diagnostics. Sci. Rep. 2015, 5, 9455. [Google Scholar] [CrossRef] [PubMed] [Green Version]
  216. Liu, Y.; Ashton, J.R.; Moding, E.J.; Yuan, H.; Register, J.K.; Fales, A.M.; Choi, J.; Whitley, M.J.; Zhao, X.; Qi, Y.; et al. A plasmonic gold nanostar theranostic probe for in vivo tumor imaging and photothermal therapy. Theranostics 2015, 5, 946–960. [Google Scholar] [CrossRef] [PubMed] [Green Version]
  217. Qiu, Y.; Lin, M.; Chen, G.; Fan, C.; Li, M.; Gu, X.; Cong, S.; Zhao, Z.; Fu, L.; Fang, X.; et al. Photodegradable CuS SERS Probes for Intraoperative Residual Tumor Detection, Ablation, and Self-Clearance. ACS Appl. Mater. Interfaces 2019, 11, 23436–23444. [Google Scholar] [CrossRef] [PubMed]
  218. Miao, K.; Wei, L. Live-Cell Imaging and Quantification of PolyQ Aggregates by Stimulated Raman Scattering of Selective Deuterium Labeling. bioRxiv 2019. bioRxiv:820217. [Google Scholar]
  219. Ryzhikova, E.; Kazakov, O.; Halamkova, L.; Celmins, D.; Malone, P.; Molho, E.; Zimmerman, E.A.; Lednev, I.K. Raman spectroscopy of blood serum for Alzheimer’s disease diagnostics: Specificity relative to other types of dementia. J. Biophotonics 2015, 8, 584–596. [Google Scholar] [CrossRef] [Green Version]
  220. Noothalapati, H.; Sasaki, T.; Kaino, T.; Kawamukai, M.; Ando, M.; Hamaguchi, H.O.; Yamamoto, T. Label-free Chemical Imaging of Fungal Spore Walls by Raman Microscopy and Multivariate Curve Resolution Analysis. Sci. Rep. 2016, 6, 27789. [Google Scholar] [CrossRef] [Green Version]
  221. Schweikhard, V.; Baral, A.; Krishnamachari, V.; Hay, W.C.; Fuhrmann, M. Label-free characterization of Amyloid-β-plaques and associated lipids in brain tissues using stimulated Raman scattering microscopy. bioRxiv 2019. bioRxiv:789248. [Google Scholar]
  222. Krasnoslobodtsev, A.V.; Deckert-Gaudig, T.; Zhang, Y.; Deckert, V.; Lyubchenko, Y.L. Polymorphism of amyloid fibrils formed by a peptide from the yeast prion protein Sup35: AFM and Tip-Enhanced Raman Scattering studies. Ultramicroscopy 2016, 165, 26–33. [Google Scholar] [CrossRef] [Green Version]
  223. Kurouski, D.; Deckert-Gaudig, T.; Deckert, V.; Lednev, I.K. Structure and Composition of Insulin Fibril Surfaces Probed by TERS. J. Am. Chem. Soc. 2012, 134, 13323–13329. [Google Scholar] [CrossRef] [PubMed] [Green Version]
  224. Bae, K.; Zheng, W.; Huang, Z. Quantitative assessment of spinal cord injury using circularly polarized coherent anti-Stokes Raman scattering microscopy. Appl. Phys. Lett. 2017, 111, 063704. [Google Scholar] [CrossRef]
  225. Yang, Y.C.; Chang, W.T.; Huang, S.K.; Liau, I. Characterization of the pharmaceutical effect of drugs on atherosclerotic lesions in vivo using integrated fluorescence imaging and raman spectral measurements. Anal. Chem. 2014, 86, 3863–3868. [Google Scholar] [CrossRef] [PubMed]
  226. Miyaoka, R.; Hosokawa, M.; Ando, M.; Mori, T.; Hamaguchi, H.O.; Takeyama, H. In situ detection of antibiotic amphotericin B produced in Streptomyces nodosus using Raman microspectroscopy. Mar. Drugs 2014, 12, 2827–2839. [Google Scholar] [CrossRef] [PubMed] [Green Version]
  227. Altunbek, M.; Çetin, D.; Suludere, Z.; Çulha, M. Surface-enhanced Raman spectroscopy based 3D spheroid culture for drug discovery studies. Talanta 2019, 191, 390–399. [Google Scholar] [CrossRef]
  228. Olaetxea, I.; Lopez, E.; Valero, A.; Seifert, A. Determination of physiological lactate and pH by Raman spectroscopy*. In Proceedings of the 41st Annual International Conference of the IEEE Engineering in Medicine and Biology Society (EMBC), Berlin, Germany, 23–27 July 2019; pp. 475–481. [Google Scholar]
  229. Noothalapati, H.; Uemura, S.; Ohshima, N.; Kinoshita, Y.; Ando, M.; Hamaguchi, H.O.; Yamamoto, T. Towards the development of a non-bioptic diagnostic technique for eosinophilic esophagitis using Raman spectroscopy. Vib. Spectrosc. 2016, 85, 7–10. [Google Scholar] [CrossRef]
  230. Hirose, K.; Aoki, T.; Furukawa, T.; Fukushima, S.; Niioka, H.; Deguchi, S.; Hashimoto, M. Coherent anti-Stokes Raman scattering rigid endoscope toward robot-assisted surgery. Biomed. Opt. Express 2018, 9, 387. [Google Scholar] [CrossRef] [Green Version]
  231. Makowski, A.J.; Pence, I.J.; Uppuganti, S.; Zein-Sabatto, A.; Huszagh, M.C.; Mahadevan-Jansen, A.; Nyman, J.S. Polarization in Raman spectroscopy helps explain bone brittleness in genetic mouse models. J. Biomed. Opt. 2014, 19, 117008. [Google Scholar] [CrossRef] [Green Version]
  232. Virkler, K.; Lednev, I.K. Raman spectroscopy offers great potential for the nondestructive confirmatory identification of body fluids. Forensic Sci. Int. 2008, 181, e1–e5. [Google Scholar] [CrossRef]
  233. Muro, C.K.; Doty, K.C.; de Souza Fernandes, L.; Lednev, I.K. Forensic body fluid identification and differentiation by Raman spectroscopy. Forensic Chem. 2016, 1, 31–38. [Google Scholar] [CrossRef]
  234. Mistek, E.; Halámková, L.; Doty, K.C.; Muro, C.K.; Lednev, I.K. Race Differentiation by Raman Spectroscopy of a Bloodstain for Forensic Purposes. Anal. Chem. 2016, 88, 7453–7456. [Google Scholar] [CrossRef] [PubMed] [Green Version]
  235. Sikirzhytskaya, A.; Sikirzhytski, V.; Lednev, I.K. Determining Gender by Raman Spectroscopy of a Bloodstain. Anal. Chem. 2017, 89, 1486–1492. [Google Scholar] [CrossRef] [PubMed]
  236. McLaughlin, G.; Doty, K.C.; Lednev, I.K. Raman Spectroscopy of Blood for Species Identification. Anal. Chem. 2014, 86, 11628–11633. [Google Scholar] [CrossRef] [PubMed]
  237. Doty, K.C.; McLaughlin, G.; Lednev, I.K. A Raman “spectroscopic clock” for bloodstain age determination: The first week after deposition. Anal. Bioanal. Chem. 2016, 408, 3993–4001. [Google Scholar] [CrossRef]
  238. Langer, J.; Novikov, S.M.; Liz-Marzán, L.M. Sensing using plasmonic nanostructures and nanoparticles. Nanotechnology 2015, 26, 322001. [Google Scholar] [CrossRef]
  239. Eremina, O.E.; Semenova, A.A.; Sergeeva, E.A.; Brazhe, N.A.; Maksimov, G.V.; Shekhovtsova, T.N.; Goodilin, E.A.; Veselova, I.A. Surface-enhanced Raman spectroscopy in modern chemical analysis: Advances and prospects. Russ. Chem. Rev. 2018, 87, 741–770. [Google Scholar] [CrossRef]
  240. Fikiet, M.A.; Khandasammy, S.R.; Mistek, E.; Ahmed, Y.; Halámková, L.; Bueno, J.; Lednev, I.K. Surface enhanced Raman spectroscopy: A review of recent applications in forensic science. Spectrochim. Acta Part A Mol. Biomol. Spectrosc. 2018, 197, 255–260. [Google Scholar] [CrossRef]
  241. Laing, S.; Jamieson, L.E.; Faulds, K.; Graham, D. Surface-enhanced Raman spectroscopy for in vivo biosensing. Nat. Rev. Chem. 2017, 1, 0060. [Google Scholar] [CrossRef]
  242. Talley, C.E.; Jusinski, L.; Hollars, C.W.; Lane, S.M.; Huser, T. Intracellular pH Sensors Based on Surface-Enhanced Raman Scattering. Anal. Chem. 2004, 76, 7064–7068. [Google Scholar] [CrossRef]
  243. Kneipp, J.; Kneipp, H.; Wittig, B.; Kneipp, K. One- and Two-Photon Excited Optical pH Probing for Cells Using Surface-Enhanced Raman and Hyper-Raman Nanosensors. Nano Lett. 2007, 7, 2819–2823. [Google Scholar] [CrossRef]
  244. Wang, J.; Geng, Y.; Shen, Y.; Shi, W.; Xu, W.; Xu, S. SERS-active fiber tip for intracellular and extracellular pH sensing in living single cells. Sens. Actuators B Chem. 2019, 290, 527–534. [Google Scholar] [CrossRef]
  245. Lyandres, O.; Yuen, J.M.; Shah, N.C.; VanDuyne, R.P.; Walsh, J.T.; Glucksberg, M.R. Progress toward an in vivo surface-enhanced Raman spectroscopy glucose sensor. Diabetes Technol. Ther. 2008, 10, 257–265. [Google Scholar] [CrossRef] [PubMed] [Green Version]
  246. Qi, G.; Wang, Y.; Zhang, B.; Sun, D.; Fu, C.; Xu, W.; Xu, S. Glucose oxidase probe as a surface-enhanced Raman scattering sensor for glucose. Anal. Bioanal. Chem. 2016, 408, 7513–7520. [Google Scholar] [CrossRef] [PubMed]
  247. Fu, C.; Jin, S.; Oh, J.; Xu, S.; Jung, Y.M. Facile detection of glucose in human serum employing silver-ion-guided surface-enhanced Raman spectroscopy signal amplification. Analyst 2017, 142, 2887–2891. [Google Scholar] [CrossRef] [PubMed]
  248. Qu, L.-L.; Li, D.-W.; Qin, L.-X.; Mu, J.; Fossey, J.S.; Long, Y.-T. Selective and Sensitive Detection of Intracellular O 2 •− Using Au NPs/Cytochrome c as SERS Nanosensors. Anal. Chem. 2013, 85, 9549–9555. [Google Scholar] [CrossRef] [PubMed]
  249. Zorov, D.B.; Juhaszova, M.; Sollott, S.J. Mitochondrial reactive oxygen species (ROS) and ROS-induced ROS release. Physiol. Rev. 2014, 94, 909–950. [Google Scholar] [CrossRef] [Green Version]
  250. Lenzi, E.; Jimenez de Aberasturi, D.; Liz-Marzán, L.M. Surface-Enhanced Raman Scattering Tags for Three-Dimensional Bioimaging and Biomarker Detection. ACS Sens. 2019, 4, 1126–1137. [Google Scholar] [CrossRef]
  251. Mosier-Boss, P. Review on SERS of Bacteria. Biosensors 2017, 7, 51. [Google Scholar] [CrossRef] [Green Version]
  252. Pang, Y.; Wan, N.; Shi, L.; Wang, C.; Sun, Z.; Xiao, R.; Wang, S. Dual-recognition surface-enhanced Raman scattering(SERS)biosensor for pathogenic bacteria detection by using vancomycin-SERS tags and aptamer-Fe3O4@Au. Anal. Chim. Acta 2019, 1077, 288–296. [Google Scholar] [CrossRef]
  253. Yuan, K.; Zheng, J.; Yang, D.; Jurado Sánchez, B.; Liu, X.; Guo, X.; Liu, C.; Dina, N.E.; Jian, J.; Bao, Z.; et al. Self-Assembly of Au@Ag Nanoparticles on Mussel Shell To Form Large-Scale 3D Supercrystals as Natural SERS Substrates for the Detection of Pathogenic Bacteria. ACS Omega 2018, 3, 2855–2864. [Google Scholar] [CrossRef]
  254. Liu, T.Y.; Tsai, K.T.; Wang, H.H.; Chen, Y.; Chen, Y.H.; Chao, Y.C.; Chang, H.H.; Lin, C.H.; Wang, J.K.; Wang, Y.L. Functionalized arrays of Raman-enhancing nanoparticles for capture and culture-free analysis of bacteria in human blood. Nat. Commun. 2011, 2, 538. [Google Scholar] [CrossRef] [PubMed]
  255. Chisanga, M.; Linton, D.; Muhamadali, H.; Ellis, D.I.; Kimber, R.L.; Mironov, A.; Goodacre, R. Rapid differentiation of Campylobacter jejuni cell wall mutants using Raman spectroscopy, SERS and mass spectrometry combined with chemometrics. Analyst 2020. [Google Scholar] [CrossRef] [PubMed]
  256. Gracie, K.; Correa, E.; Mabbott, S.; Dougan, J.A.; Graham, D.; Goodacre, R.; Faulds, K. Simultaneous detection and quantification of three bacterial meningitis pathogens by SERS. Chem. Sci. 2014, 5, 1030–1040. [Google Scholar] [CrossRef] [Green Version]
  257. Lussier, F.; Brulé, T.; Vishwakarma, M.; Das, T.; Spatz, J.P.; Masson, J.F. Dynamic-SERS optophysiology: A nanosensor for monitoring cell secretion events. Nano Lett. 2016, 16, 3866–3871. [Google Scholar] [CrossRef]
  258. Lussier, F.; Missirlis, D.; Spatz, J.P.; Masson, J.-F. Machine-Learning-Driven Surface-Enhanced Raman Scattering Optophysiology Reveals Multiplexed Metabolite Gradients Near Cells. ACS Nano 2019, 13, 1403–1411. [Google Scholar] [CrossRef]
  259. Zhu, H.; Lussier, F.; Ducrot, C.; Bourque, M.-J.; Spatz, J.P.; Cui, W.; Yu, L.; Peng, W.; Trudeau, L.-É.; Bazuin, C.G.; et al. Block Copolymer Brush Layer-Templated Gold Nanoparticles on Nanofibers for Surface-Enhanced Raman Scattering Optophysiology. ACS Appl. Mater. Interfaces 2019, 11, 4373–4384. [Google Scholar] [CrossRef]
  260. Vitol, E.A.; Orynbayeva, Z.; Bouchard, M.J.; Azizkhan-Clifford, J.; Friedman, G.; Gogotsi, Y. In Situ Intracellular Spectroscopy with Surface Enhanced Raman Spectroscopy (SERS)-Enabled Nanopipettes. ACS Nano 2009, 3, 3529–3536. [Google Scholar] [CrossRef]
  261. Vitol, E.A.; Brailoiu, E.; Orynbayeva, Z.; Dun, N.J.; Friedman, G.; Gogotsi, Y. Surface-Enhanced Raman Spectroscopy as a Tool for Detecting Ca 2+ Mobilizing Second Messengers in Cell Extracts. Anal. Chem. 2010, 82, 6770–6774. [Google Scholar] [CrossRef]
  262. Ryzhikova, E.; Ralbovsky, N.M.; Halámková, L.; Celmins, D.; Malone, P.; Molho, E.; Quinn, J.; Zimmerman, E.A.; Lednev, I.K. Multivariate Statistical Analysis of Surface Enhanced Raman Spectra of Human Serum for Alzheimer’s Disease Diagnosis. Appl. Sci. 2019, 9, 3256. [Google Scholar] [CrossRef] [Green Version]
  263. Brazhe, N.A.; Abdali, S.; Brazhe, A.R.; Luneva, O.G.; Bryzgalova, N.Y.; Parshina, E.Y.; Sosnovtseva, O.V.; Maksimov, G.V. New insight into erythrocyte through in vivo surface-enhanced Raman spectroscopy. Biophys. J. 2009, 97, 3206–3214. [Google Scholar] [CrossRef] [Green Version]
  264. Semenova, A.A.; Goodilin, E.A.; Brazhe, N.A.; Ivanov, V.K.; Baranchikov, A.E.; Lebedev, V.A.; Goldt, A.E.; Sosnovtseva, O.V.; Savilov, S.V.; Egorov, A.V.; et al. Planar SERS nanostructures with stochastic silver ring morphology for biosensor chips. J. Mater. Chem. 2012, 22, 24530–24544. [Google Scholar] [CrossRef]
  265. Brazhe, N.A.; Parshina, E.Y.; Khabatova, V.V.; Semenova, A.A.; Brazhe, A.R.; Yusipovich, A.I.; Sarycheva, A.S.; Churin, A.A.; Goodilin, E.A.; Maksimov, G.V.; et al. Tuning SERS for living erythrocytes: Focus on nanoparticle size and plasmon resonance position. J. Raman Spectrosc. 2013, 44, 686–694. [Google Scholar] [CrossRef]
  266. Sarycheva, A.S.; Brazhe, N.A.; Baizhumanov, A.A.; Nikelshparg, E.I.; Semenova, A.A.; Garshev, A.V.; Baranchikov, A.E.; Ivanov, V.K.; Maksimov, G.V.; Sosnovtseva, O.; et al. New nanocomposites for SERS studies of living cells and mitochondria. J. Mater. Chem. B 2016, 4, 539–546. [Google Scholar] [CrossRef]
  267. Luneva, O.G.; Brazhe, N.A.; Maksimova, N.V.; Rodnenkov, O.V.; Parshina, E.Y.; Bryzgalova, N.Y.; Maksimov, G.V.; Rubin, A.B.; Orlov, S.N.; Chazov, E.I. Ion transport, membrane fluidity and haemoglobin conformation in erythrocyte from patients with cardiovascular diseases: Role of augmented plasma cholesterol. Pathophysiology 2007, 14, 41–46. [Google Scholar] [CrossRef] [PubMed]
  268. Brazhe, N.A.; Evlyukhin, A.B.; Goodilin, E.A.; Semenova, A.A.; Novikov, S.M.; Bozhevolnyi, S.I.; Chichkov, B.N.; Sarycheva, A.S.; Baizhumanov, A.A.; Nikelshparg, E.I.; et al. Probing cytochrome c in living mitochondria with surface-enhanced Raman spectroscopy. Sci. Rep. 2015, 5, 13793. [Google Scholar] [CrossRef] [Green Version]
  269. Stone, N.; Kerssens, M.; Lloyd, G.R.; Faulds, K.; Graham, D.; Matousek, P. Surface enhanced spatially offset Raman spectroscopic (SESORS) imaging—The next dimension. Chem. Sci. 2011, 2, 776–780. [Google Scholar] [CrossRef]
  270. Stuart, D.A.; Yuen, J.M.; Shah, N.; Lyandres, O.; Yonzon, C.R.; Glucksberg, M.R.; Walsh, J.T.; Van Duyne, R.P. In Vivo Glucose Measurement by Surface-Enhanced Raman Spectroscopy. Anal. Chem. 2006, 78, 7211–7215. [Google Scholar] [CrossRef]
  271. Camp, C.H.; Lee, Y.J.; Heddleston, J.M.; Hartshorn, C.M.; Walker, A.R.H.; Rich, J.N.; Lathia, J.D.; Cicerone, M.T. High-speed coherent Raman fingerprint imaging of biological tissues. Nat. Photonics 2014, 8, 627–634. [Google Scholar] [CrossRef] [Green Version]
  272. Liao, C.S.; Slipchenko, M.N.; Wang, P.; Li, J.; Lee, S.Y.; Oglesbee, R.A.; Cheng, J.X. Microsecond scale vibrational spectroscopic imaging by multiplex stimulated Raman scattering microscopy. Light Sci. Appl. 2015, 4, e265. [Google Scholar] [CrossRef] [Green Version]
  273. Yamakoshi, H.; Dodo, K.; Palonpon, A.; Ando, J.; Fujita, K.; Kawata, S.; Sodeoka, M. Alkyne-tag Raman imaging for visualization of mobile small molecules in live cells. J. Am. Chem. Soc. 2012, 134, 20681–20689. [Google Scholar] [CrossRef]
  274. Wei, L.; Hu, F.; Shen, Y.; Chen, Z.; Yu, Y.; Lin, C.C.; Wang, M.C.; Min, W. Live-cell imaging of alkyne-tagged small biomolecules by stimulated Raman scattering. Nat. Methods 2014, 11, 410–412. [Google Scholar] [CrossRef] [PubMed] [Green Version]
  275. Hosokawa, M.; Ando, M.; Mukai, S.; Osada, K.; Yoshino, T.; Hamaguchi, H.O.; Tanaka, T. In vivo live cell imaging for the quantitative monitoring of lipids by using raman microspectroscopy. Anal. Chem. 2014, 86, 8224–8230. [Google Scholar] [CrossRef] [PubMed]
  276. Lee, H.J.; Zhang, W.; Zhang, D.; Yang, Y.; Liu, B.; Barker, E.L.; Buhman, K.K.; Slipchenko, L.V.; Dai, M.; Cheng, J.X. Assessing Cholesterol Storage in Live Cells and C. elegans by Stimulated Raman Scattering Imaging of Phenyl-Diyne Cholesterol. Sci. Rep. 2015, 5, 7930. [Google Scholar] [CrossRef] [PubMed] [Green Version]
  277. Tian, F.; Yang, W.; Mordes, D.A.; Wang, J.Y.; Salameh, J.S.; Mok, J.; Chew, J.; Sharma, A.; Leno-Duran, E.; Suzuki-Uematsu, S.; et al. Monitoring peripheral nerve degeneration in ALS by label-free stimulated Raman scattering imaging. Nat. Commun. 2016, 7, 13283. [Google Scholar] [CrossRef] [PubMed]
  278. Shen, Y.; Xu, F.; Wei, L.; Hu, F.; Min, W. Live-cell quantitative imaging of proteome degradation by stimulated raman scattering. Angew. Chem. Int. Ed. 2014, 53, 5596–5599. [Google Scholar] [CrossRef] [Green Version]
  279. Hu, F.; Wei, L.; Zheng, C.; Shen, Y.; Min, W. Live-cell vibrational imaging of choline metabolites by stimulated Raman scattering coupled with isotope-based metabolic labeling. Analyst 2014, 139, 2312–2317. [Google Scholar] [CrossRef] [Green Version]
  280. Zhang, D.; Slipchenko, M.N.; Cheng, J.X. Highly sensitive vibrational imaging by femtosecond pulse stimulated raman loss. J. Phys. Chem. Lett. 2011, 2, 1248–1253. [Google Scholar] [CrossRef] [Green Version]
  281. Hong, W.; Karanja, C.W.; Abutaleb, N.S.; Younis, W.; Zhang, X.; Seleem, M.N.; Cheng, J.X. Antibiotic Susceptibility Determination within One Cell Cycle at Single-Bacterium Level by Stimulated Raman Metabolic Imaging. Anal. Chem. 2018, 90, 3737–3743. [Google Scholar] [CrossRef]
  282. Karanja, C.W.; Hong, W.; Younis, W.; Eldesouky, H.E.; Seleem, M.N.; Cheng, J.X. Stimulated Raman Imaging Reveals Aberrant Lipogenesis as a Metabolic Marker for Azole-Resistant Candida albicans. Anal. Chem. 2017, 89, 9822–9829. [Google Scholar] [CrossRef]
  283. Palonpon, A.F.; Sodeoka, M.; Fujita, K. Molecular imaging of live cells by Raman microscopy. Curr. Opin. Chem. Biol. 2013, 17, 708–715. [Google Scholar] [CrossRef]
  284. Klein, K.; Gigler, A.M.; Aschenbrenner, T.; Monetti, R.; Bunk, W.; Jamitzky, F.; Morfill, G.; Stark, R.W.; Schlegel, J. Label-free live-cell imaging with confocal Raman microscopy. Biophys. J. 2012, 102, 360–368. [Google Scholar] [CrossRef] [PubMed] [Green Version]
  285. Harada, Y.; Dai, P.; Yamaoka, Y.; Ogawa, M.; Tanaka, H.; Nosaka, K.; Akaji, K.; Takamatsu, T. Intracellular dynamics of topoisomerase i inhibitor, CPT-11, by slit-scanning confocal Raman microscopy. Histochem. Cell Biol. 2009, 132, 39–46. [Google Scholar] [CrossRef] [PubMed]
  286. El-Mashtoly, S.F.; Petersen, D.; Yosef, H.K.; Mosig, A.; Reinacher-Schick, A.; Kötting, C.; Gerwert, K. Label-free imaging of drug distribution and metabolism in colon cancer cells by Raman microscopy. Analyst 2014, 139, 1155–1161. [Google Scholar] [CrossRef] [PubMed]
  287. Harkness, L.; Novikov, S.M.; Beermann, J.; Bozhevolnyi, S.I.; Kassem, M. Identification of Abnormal Stem Cells Using Raman Spectroscopy. Stem Cells Dev. 2012, 21, 2152–2159. [Google Scholar] [CrossRef] [PubMed]
  288. Vanna, R.; Ronchi, P.; Lenferink, A.T.M.; Tresoldi, C.; Morasso, C.; Mehn, D.; Bedoni, M.; Picciolini, S.; Terstappen, L.W.M.M.; Ciceri, F.; et al. Label-free imaging and identification of typical cells of acute myeloid leukaemia and myelodysplastic syndrome by Raman microspectroscopy. Analyst 2015, 140, 1054–1064. [Google Scholar] [CrossRef]
  289. Kaliaperumal, V.; Hamaguchi, H.O. Casting new physicochemical light on the fundamental biological processes in single living cells by using Raman microspectroscopy. Chem. Rec. 2012, 12, 567–580. [Google Scholar] [CrossRef]
  290. Kottke, T.; Xie, A.; Larsen, D.S.; Hoff, W.D. Photoreceptors Take Charge: Emerging Principles for Light Sensing. Annu. Rev. Biophys. 2018, 47, 291–313. [Google Scholar] [CrossRef]
  291. Boyden, E.S.; Zhang, F.; Bamberg, E.; Nagel, G.; Deisseroth, K. Millisecond-timescale, genetically targeted optical control of neural activity. Nat. Neurosci. 2005, 8, 1263–1268. [Google Scholar] [CrossRef]
  292. Ernst, O.P.; Lodowski, D.T.; Elstner, M.; Hegemann, P.; Brown, L.S.; Kandori, H. Microbial and Animal Rhodopsins: Structures, Functions, and Molecular Mechanisms. Chem. Rev. 2014, 114, 126–163. [Google Scholar] [CrossRef]
  293. Gushchin, I.; Gordeliy, V. Microbial rhodopsins. In Subcellular Biochemistry; Springer: New York, NY, USA, 2018; Volume 87, pp. 19–56. [Google Scholar]
  294. Bratanov, D.; Kovalev, K.; Machtens, J.P.; Astashkin, R.; Chizhov, I.; Soloviov, D.; Volkov, D.; Polovinkin, V.; Zabelskii, D.; Mager, T.; et al. Unique structure and function of viral rhodopsins. Nat. Commun. 2019, 10, 1–13. [Google Scholar] [CrossRef] [Green Version]
  295. Kovalev, K.; Polovinkin, V.; Gushchin, I.; Alekseev, A.; Shevchenko, V.; Borshchevskiy, V.; Astashkin, R.; Balandin, T.; Bratanov, D.; Vaganova, S.; et al. Structure and mechanisms of sodium-pumping KR2 rhodopsin. Sci. Adv. 2019, 5, eaav2671. [Google Scholar] [CrossRef] [PubMed] [Green Version]
  296. Kovalev, K.; Volkov, D.; Astashkin, R.; Alekseev, A.; Gushchin, I.; Haro-Moreno, J.M.; Rogachev, A.; Balandin, T.; Borshchevskiy, V.; Popov, A.; et al. High Resolution Structural Insights into Heliorhodopsin Family. bioRxiv 2019. bioRxiv:767665. [Google Scholar]
  297. Ishchenko, A.; Round, E.; Borshchevskiy, V.; Grudinin, S.; Gushchin, I.; Klare, J.P.; Remeeva, A.; Polovinkin, V.; Utrobin, P.; Balandin, T.; et al. New Insights on Signal Propagation by Sensory Rhodopsin II/Transducer Complex. Sci. Rep. 2017, 7, 41811. [Google Scholar] [CrossRef] [Green Version]
  298. Gushchin, I.; Shevchenko, V.; Polovinkin, V.; Borshchevskiy, V.; Buslaev, P.; Bamberg, E.; Gordeliy, V. Structure of the light-driven sodium pump KR2 and its implications for optogenetics. FEBS J. 2016, 283, 1232–1238. [Google Scholar] [CrossRef] [PubMed]
  299. Gushchin, I.; Shevchenko, V.; Polovinkin, V.; Kovalev, K.; Alekseev, A.; Round, E.; Borshchevskiy, V.; Balandin, T.; Popov, A.; Gensch, T.; et al. Crystal structure of a light-driven sodium pump. Nat. Struct. Mol. Biol. 2015, 22, 390–395. [Google Scholar] [CrossRef] [PubMed]
  300. Borshchevskiy, V.; Round, E.; Erofeev, I.; Weik, M.; Ishchenko, A.; Gushchin, I.; Mishin, A.; Willbold, D.; Büldt, G.; Gordeliy, V. Low-dose X-ray radiation induces structural alterations in proteins. Acta Crystallogr. Sect. D Biol. Crystallogr. 2014, 70, 2675–2685. [Google Scholar] [CrossRef] [PubMed]
  301. Yi, A.; Mamaeva, N.; Li, H.; Spudich, J.L.; Rothschild, K.J. Resonance Raman Study of an Anion Channelrhodopsin: Effects of Mutations near the Retinylidene Schiff Base. Biochemistry 2016, 55, 2371–2380. [Google Scholar] [CrossRef] [Green Version]
  302. Stoeckenius, W.; Bogomolni, R.A. Bacteriorhodopsin and Related Pigments of Halo Bacteria. Ann. Rev. Biochem. 1982, 51, 587–616. [Google Scholar] [CrossRef]
  303. Dencher, N.; Wilms, M. Flash photometric experiments on the photochemical cycle of bacteriorhodopsin. Biophys. Struct. Mech. 1975, 1, 259–271. [Google Scholar] [CrossRef]
  304. Lozier, R.H.; Bogomolni, R.A.; Stoeckenius, W. Bacteriorhodopsin: A light-driven proton pump in Halobacterium Halobium. Biophys. J. 1975, 15, 955–962. [Google Scholar] [CrossRef] [Green Version]
  305. Smith, S.O.; Lugtenburg, J.; Mathies, R.A. Determination of retinal chromophore structure in bacteriorhodopsin with resonance Raman spectroscopy. J. Membr. Biol. 1985, 85, 95–109. [Google Scholar] [CrossRef] [PubMed]
  306. Lewis, A.; Spoonhower, J.; Bogomolni, R.A.; Lozier, R.H.; Stoeckenius, W. Tunable Laser Resonance Raman Spectroscopy of Bacteriorhodopsin. Proc. Natl. Acad. Sci. USA 1974, 71, 4462–4466. [Google Scholar] [CrossRef] [PubMed] [Green Version]
  307. Braiman, M.; Mathies, R. Resonance Raman spectra of bacteriorhodopsin’s primary photoproduct: Evidence for a distorted 13-cis retinal chromophore. Proc. Natl. Acad. Sci. USA 1982, 79, 403–407. [Google Scholar] [CrossRef] [PubMed] [Green Version]
  308. Aton, B.; Doukas, A.G.; Callender, R.H.; Becher, B.; Ebrey, T.G. Resonance Raman studies of the purple membrane. Biochemistry 1977, 16, 2995–2999. [Google Scholar] [CrossRef] [PubMed]
  309. Polovinkin, V.; Balandin, T.; Volkov, O.; Round, E.; Borshchevskiy, V.; Utrobin, P.; von Stetten, D.; Royant, A.; Willbold, D.; Arzumanyan, G.; et al. Nanoparticle Surface-Enhanced Raman Scattering of Bacteriorhodopsin Stabilized by Amphipol A8-35. J. Membr. Biol. 2014, 247, 971–980. [Google Scholar] [CrossRef] [PubMed]
  310. Mizuno, M.; Mizutani, Y. Protein Response to Chromophore Isomerization in Microbial Rhodopsins Revealed by Picosecond Time-Resolved Ultraviolet Resonance Raman Spectroscopy: A Review. In Recent Progress in Colloid and Surface Chemistry with Biological Applications; American Chemical Society: Washington, DC, USA, 2015; pp. 329–353. [Google Scholar]
  311. Kralj, J.M.; Spudich, E.N.; Spudich, J.L.; Rothschild, K.J. Raman Spectroscopy Reveals Direct Chromophore Interactions in the Leu/Gln105 Spectral Tuning Switch of Proteorhodopsins. J. Phys. Chem. B 2008, 112, 11770–11776. [Google Scholar] [CrossRef] [Green Version]
  312. Kajimoto, K.; Kikukawa, T.; Nakashima, H.; Yamaryo, H.; Saito, Y.; Fujisawa, T.; Demura, M.; Unno, M. Transient Resonance Raman Spectroscopy of a Light-Driven Sodium-Ion-Pump Rhodopsin from Indibacter alkaliphilus. J. Phys. Chem. B 2017, 121, 4431–4437. [Google Scholar] [CrossRef]
  313. Nack, M.; Radu, I.; Bamann, C.; Bamberg, E.; Heberle, J. The retinal structure of channelrhodopsin-2 assessed by resonance Raman spectroscopy. FEBS Lett. 2009, 583, 3676–3680. [Google Scholar] [CrossRef] [Green Version]
  314. Volkov, O.; Kovalev, K.; Polovinkin, V.; Borshchevskiy, V.; Bamann, C.; Astashkin, R.; Marin, E.; Popov, A.; Balandin, T.; Willbold, D.; et al. Structural insights into ion conduction by channelrhodopsin 2. Science 2017, 358, eaan8862. [Google Scholar] [CrossRef]
  315. Hontani, Y.; Inoue, K.; Kloz, M.; Kato, Y.; Kandori, H.; Kennis, J.T.M. The photochemistry of sodium ion pump rhodopsin observed by watermarked femto- to submillisecond stimulated Raman spectroscopy. Phys. Chem. Chem. Phys. 2016, 18, 24729–24736. [Google Scholar] [CrossRef] [Green Version]
  316. Pushkarev, A.; Inoue, K.; Larom, S.; Flores-Uribe, J.; Singh, M.; Konno, M.; Tomida, S.; Ito, S.; Nakamura, R.; Tsunoda, S.P.; et al. A distinct abundant group of microbial rhodopsins discovered using functional metagenomics. Nature 2018, 558, 595–599. [Google Scholar] [CrossRef] [PubMed]
  317. Otomo, A.; Mizuno, M.; Singh, M.; Shihoya, W.; Inoue, K.; Nureki, O.; Béjà, O.; Kandori, H.; Mizutani, Y. Resonance Raman Investigation of the Chromophore Structure of Heliorhodopsins. J. Phys. Chem. Lett. 2018, 9, 6431–6436. [Google Scholar] [CrossRef]
  318. Gordeliy, V.I.; Labahn, J.; Moukhametzianov, R.; Efremov, R.; Granzin, J.; Schlesinger, R.; Büldt, G.; Savopol, T.; Scheidig, A.J.; Klare, J.P.; et al. Molecular basis of transmembrane signalling by sensory rhodopsin II–transducer complex. Nature 2002, 419, 484–487. [Google Scholar] [CrossRef] [PubMed]
  319. Mizuno, M.; Sudo, Y.; Homma, M.; Mizutani, Y. Direct Observation of the Structural Change of Tyr174 in the Primary Reaction of Sensory Rhodopsin II. Biochemistry 2011, 50, 3170–3180. [Google Scholar] [CrossRef] [PubMed]
  320. Roy, P.P.; Kato, Y.; Abe-Yoshizumi, R.; Pieri, E.; Ferré, N.; Kandori, H.; Buckup, T. Mapping the ultrafast vibrational dynamics of all-: Trans and 13- cis retinal isomerization in Anabaena Sensory Rhodopsin. Phys. Chem. Chem. Phys. 2018, 20, 30159–30173. [Google Scholar] [CrossRef] [PubMed] [Green Version]
  321. Roy, P.P.; Abe-Yoshizumi, R.; Kandori, H.; Buckup, T. Point Mutation of Anabaena Sensory Rhodopsin Enhances Ground-State Hydrogen Out-of-Plane Wag Raman Activity. J. Phys. Chem. Lett. 2019, 10, 1012–1017. [Google Scholar] [CrossRef] [PubMed]
  322. Morizumi, T.; Ou, W.L.; Van Eps, N.; Inoue, K.; Kandori, H.; Brown, L.S.; Ernst, O.P. X-ray Crystallographic Structure and Oligomerization of Gloeobacter Rhodopsin. Sci. Rep. 2019, 9, 11283. [Google Scholar] [CrossRef] [Green Version]
  323. Harris, A.; Ljumovic, M.; Bondar, A.N.; Shibata, Y.; Ito, S.; Inoue, K.; Kandori, H.; Brown, L.S. A new group of eubacterial light-driven retinal-binding proton pumps with an unusual cytoplasmic proton donor. Biochim. Biophys. Acta Bioenerg. 2015, 1847, 1518–1529. [Google Scholar] [CrossRef] [Green Version]
  324. Ogren, J.I.; Mamaev, S.; Russano, D.; Li, H.; Spudich, J.L.; Rothschild, K.J. Retinal Chromophore Structure and Schiff Base Interactions in Red-Shifted Channelrhodopsin-1 from Chlamydomonas augustae. Biochemistry 2014, 53, 3961–3970. [Google Scholar] [CrossRef] [Green Version]
  325. Muders, V.; Kerruth, S.; Lórenz-Fonfría, V.A.; Bamann, C.; Heberle, J.; Schlesinger, R. Resonance Raman and FTIR spectroscopic characterization of the closed and open states of channelrhodopsin-1. FEBS Lett. 2014, 588, 2301–2306. [Google Scholar] [CrossRef]
  326. Kukura, P.; McCamant, D.W.; Yoon, S.; Wandschneider, D.B.; Mathies, R.A. Chemistry: Structural observation of the primary isomerization in vision with femtosecond-stimulated Raman. Science 2005, 310, 1006–1009. [Google Scholar] [CrossRef] [PubMed] [Green Version]
  327. Popp, A.; Ujj, L.; Atkinson, G.H. Bathorhodopsin structure in the room-temperature rhodopsin photosequence: Picosecond time-resolved coherent anti-stokes Raman scattering. Proc. Natl. Acad. Sci. USA 1996, 93, 372–376. [Google Scholar] [CrossRef] [Green Version]
  328. Matysik, J.; Hildebrandt, P.; Schlamann, W.; Braslavsky, S.E.; Schaffner, K. Fourier-Transform Resonance Raman Spectroscopy of Intermediates of the Phytochrome Photocycle. Biochemistry 1995, 34, 10497–10507. [Google Scholar] [CrossRef] [PubMed]
  329. Velazquez Escobar, F.; von Stetten, D.; Günther-Lütkens, M.; Keidel, A.; Michael, N.; Lamparter, T.; Essen, L.-O.; Hughes, J.; Gärtner, W.; Yang, Y.; et al. Conformational heterogeneity of the Pfr chromophore in plant and cyanobacterial phytochromes. Front. Mol. Biosci. 2015, 2, 37. [Google Scholar] [CrossRef] [PubMed] [Green Version]
  330. Spillane, K.M.; Dasgupta, J.; Lagarias, J.C.; Mathies, R.A. Homogeneity of Phytochrome Cph1 Vibronic Absorption Revealed by Resonance Raman Intensity Analysis. J. Am. Chem. Soc. 2009, 131, 13946–13948. [Google Scholar] [CrossRef] [PubMed] [Green Version]
  331. Unno, M.; Kikuchi, S.; Masuda, S. Structural refinement of a key tryptophan residue in the BLUF photoreceptor AppA by ultraviolet resonance raman spectroscopy. Biophys. J. 2010, 98, 1949–1956. [Google Scholar] [CrossRef] [Green Version]
  332. Hontani, Y.; Ganapathy, S.; Frehan, S.; Kloz, M.; de Grip, W.J.; Kennis, J.T.M. Strong pH-Dependent Near-Infrared Fluorescence in a Microbial Rhodopsin Reconstituted with a Red-Shifting Retinal Analogue. J. Phys. Chem. Lett. 2018, 9, 6469–6474. [Google Scholar] [CrossRef] [Green Version]
  333. Mei, G.; Mamaeva, N.; Ganapathy, S.; Wang, P.; DeGrip, W.J.; Rothschild, K.J. Raman spectroscopy of a near infrared absorbing proteorhodopsin: Similarities to the bacteriorhodopsin O photointermediate. PLoS ONE 2018, 13, e0209506. [Google Scholar] [CrossRef]
  334. Gonzalez-Perez, A.; Mosgaard, L.D.; Budvytyte, R.; Villagran-Vargas, E.; Jackson, A.D.; Heimburg, T. Solitary electromechanical pulses in lobster neurons. Biophys. Chem. 2016, 216, 51–59. [Google Scholar] [CrossRef] [Green Version]
  335. Graf, B.W.; Ralston, T.S.; Ko, H.-J.; Boppart, S.A. Detecting intrinsic scattering changes correlated to neuron action potentials using optical coherence imaging. Opt. Express 2009, 17, 13447. [Google Scholar] [CrossRef] [Green Version]
  336. Liu, B.; Lee, H.J.; Zhang, D.; Liao, C.S.; Ji, N.; Xia, Y.; Cheng, J.X. Label-free spectroscopic detection of membrane potential using stimulated Raman scattering. Appl. Phys. Lett. 2015, 106, 173704. [Google Scholar] [CrossRef] [Green Version]
  337. Lee, H.J.; Cheng, J.-X.; Huang, K.-C.; Mei, G.; Mamaeva, N.; de Grip, W.J.; Rothschild, K.J. Pre-resonance stimulated Raman scattering spectroscopy and imaging of membrane potential using near-infrared rhodopsins. In Proceedings of the Multiphoton Microscopy in the Biomedical Sciences XIX, San Francisco, CA, USA, 2–7 February 2019; SPIE: San Francisco, CA, USA, 2019; p. 81. [Google Scholar]
  338. Lee, H.J.; Jiang, Y.; Cheng, J.-X. Label-free Optical Imaging of Membrane Potential. Curr. Opin. Biomed. Eng. 2019, 12, 118–125. [Google Scholar] [CrossRef]
  339. Huang, W. Overproduction of proteorhodopsin enhances long-term viability of Escherichia coli. Appl. Environ. Microbiol. 2019. [Google Scholar] [CrossRef] [Green Version]
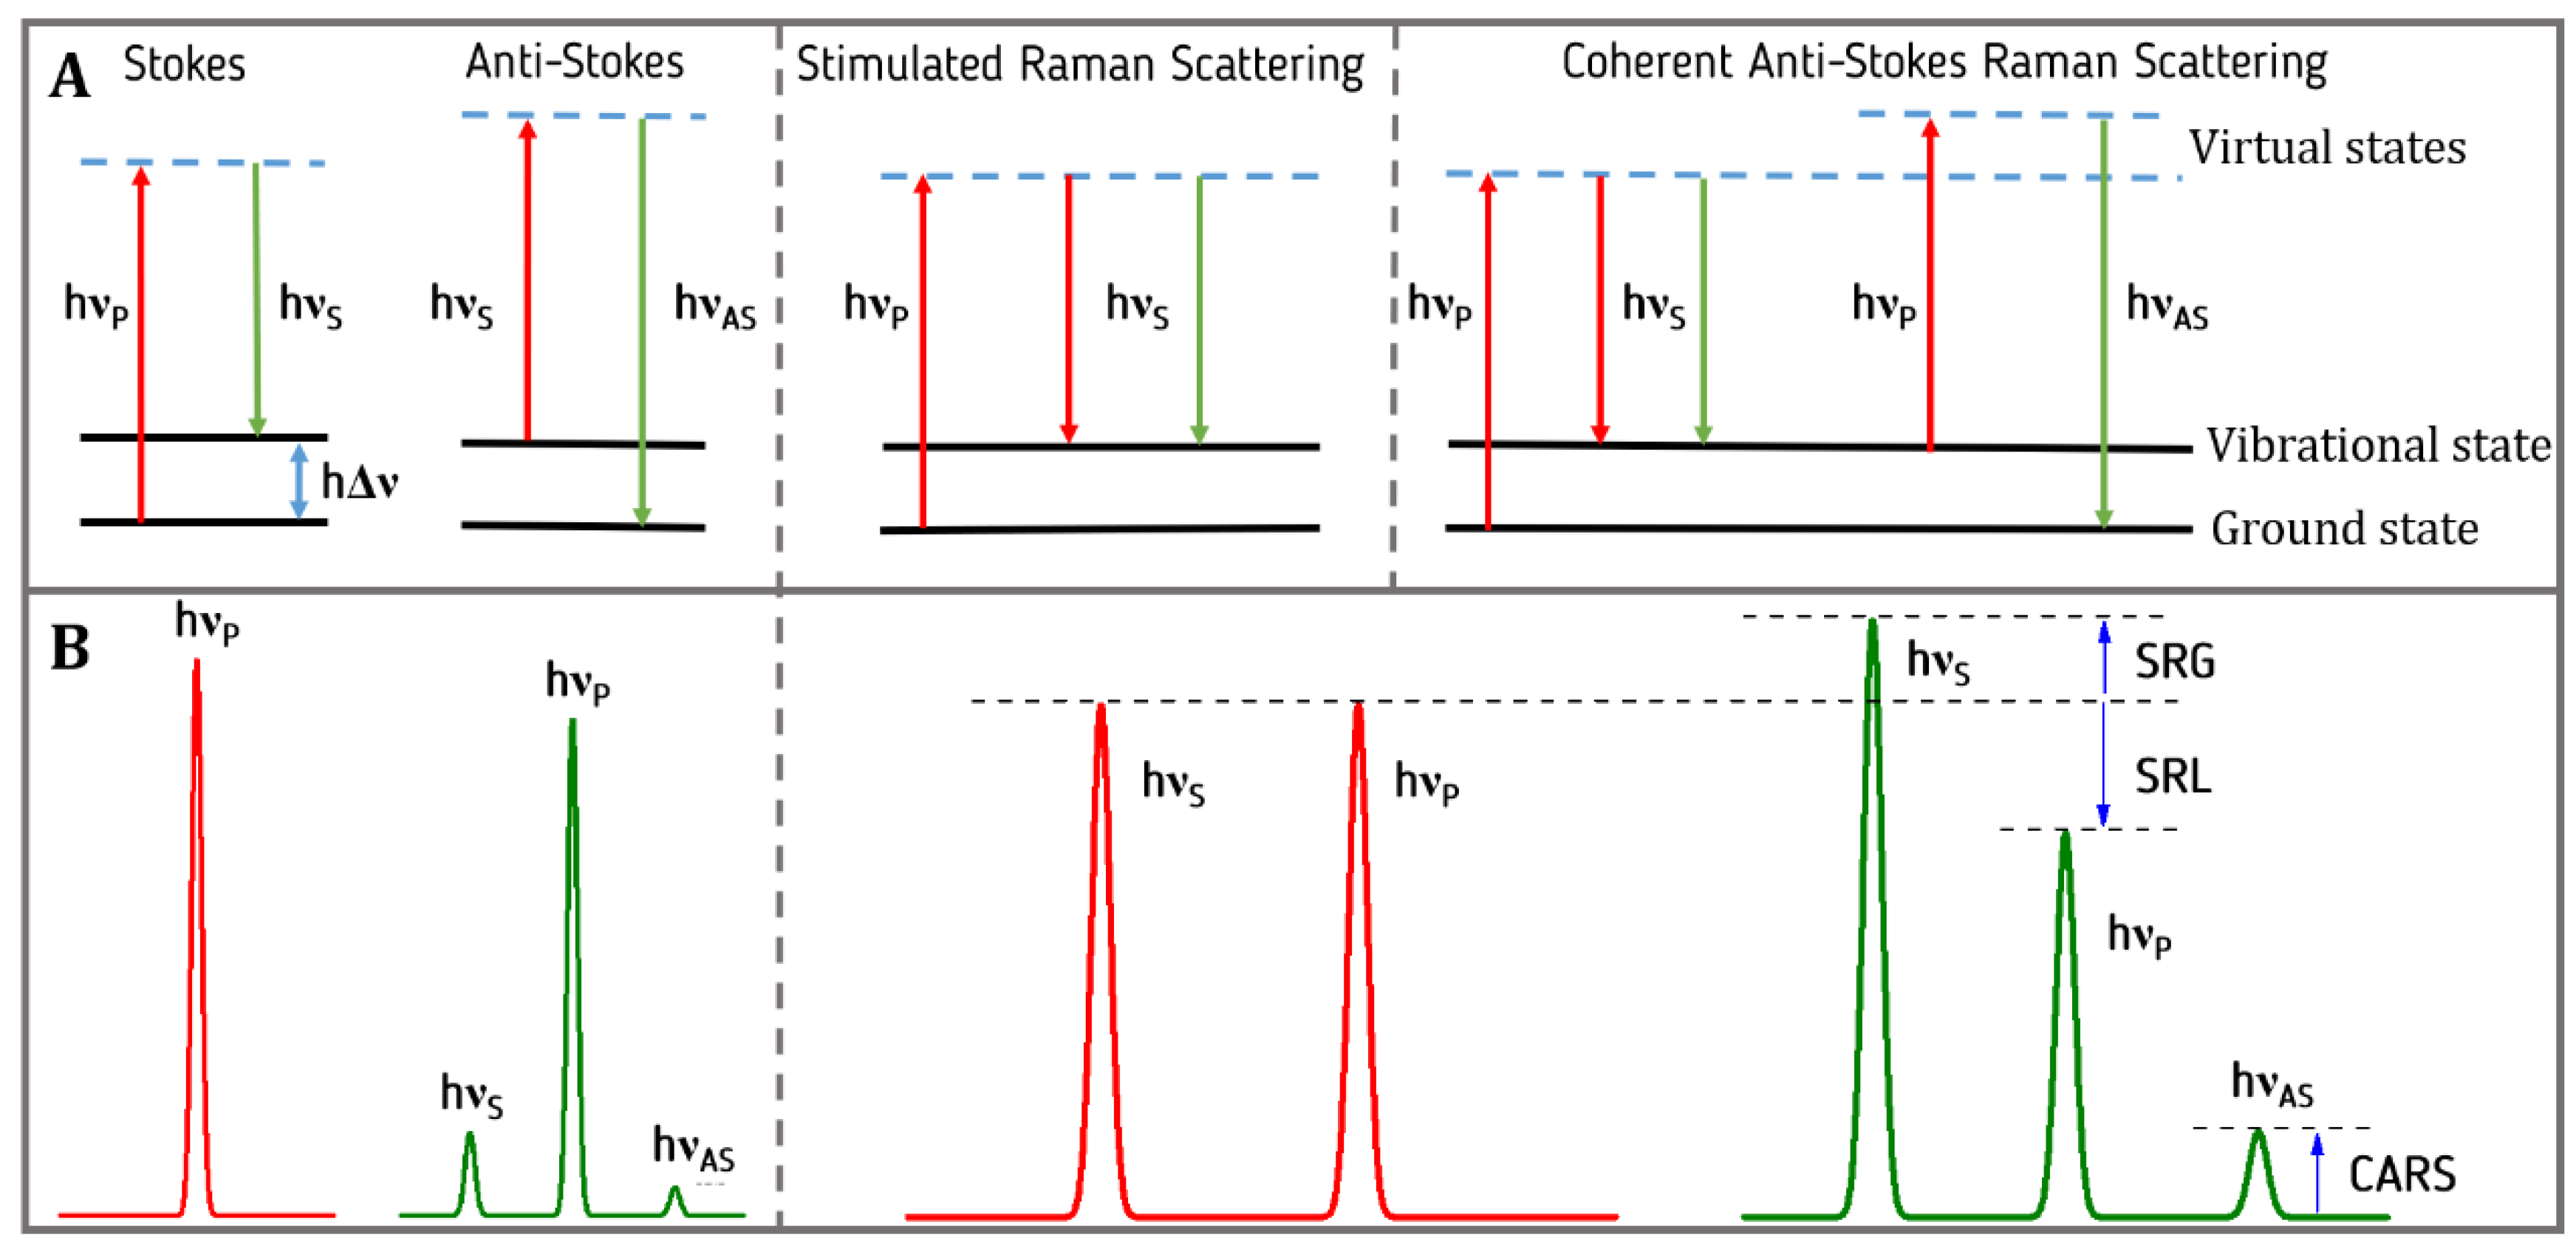
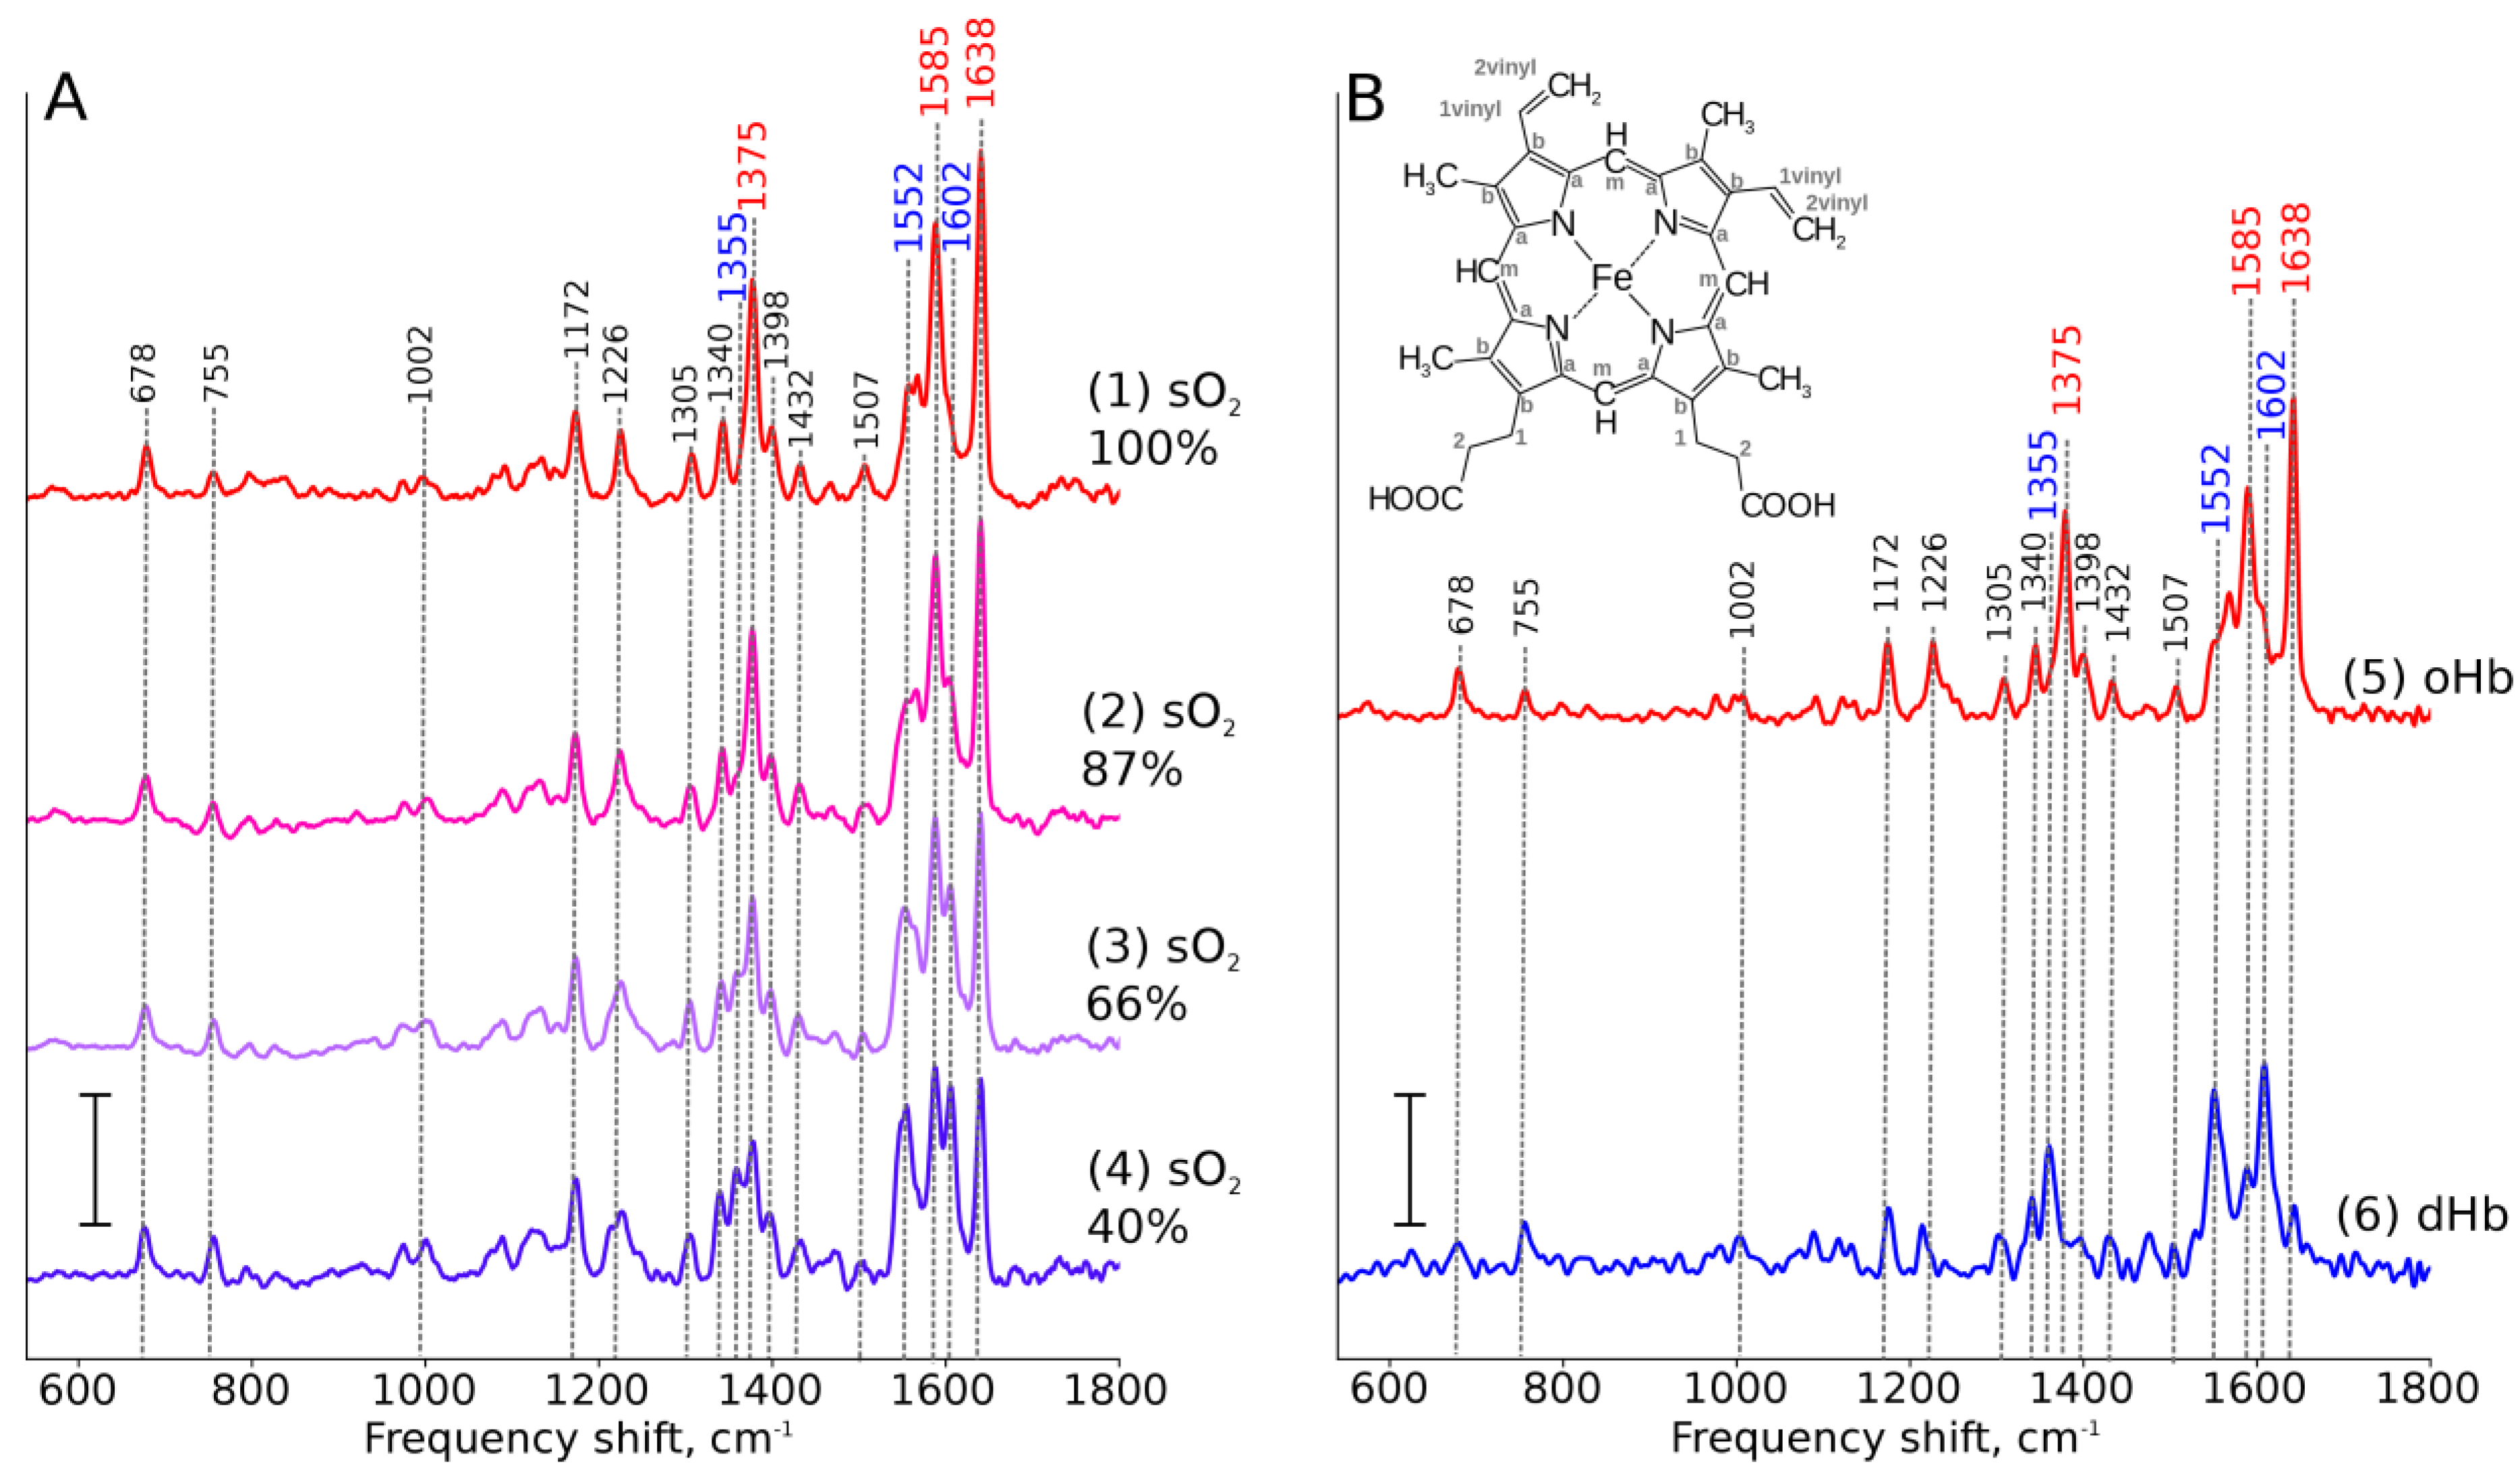
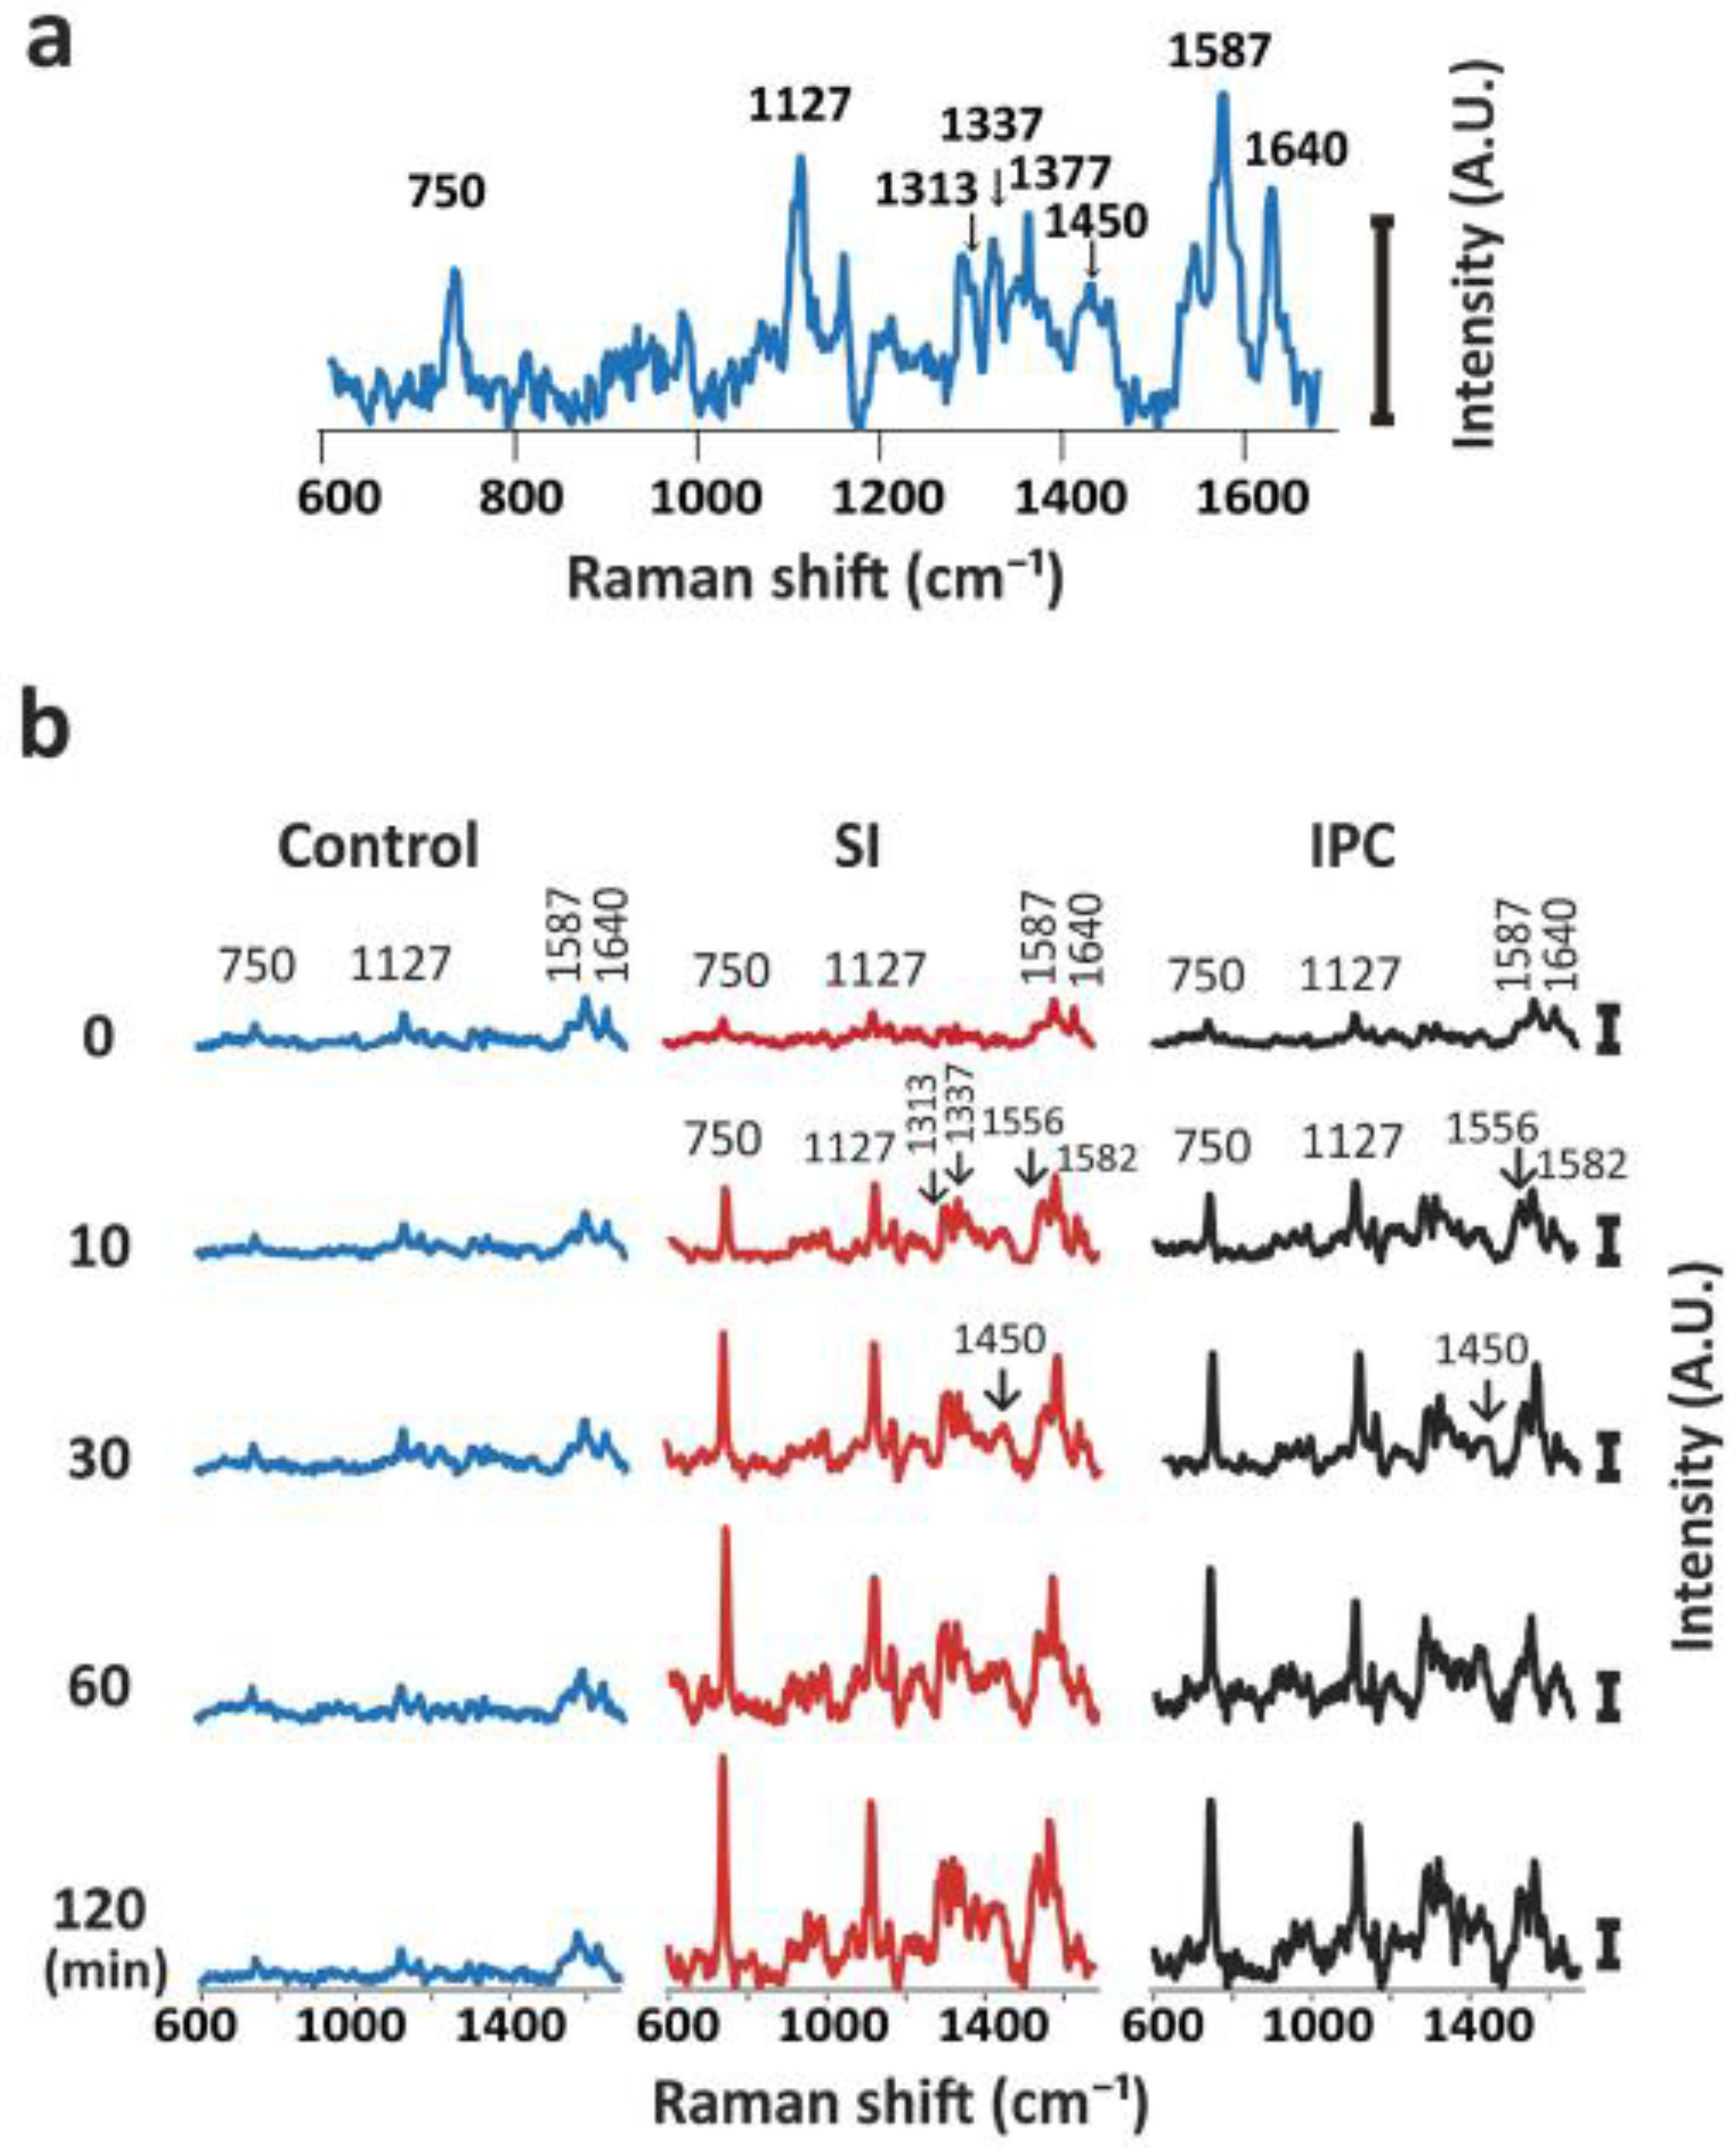
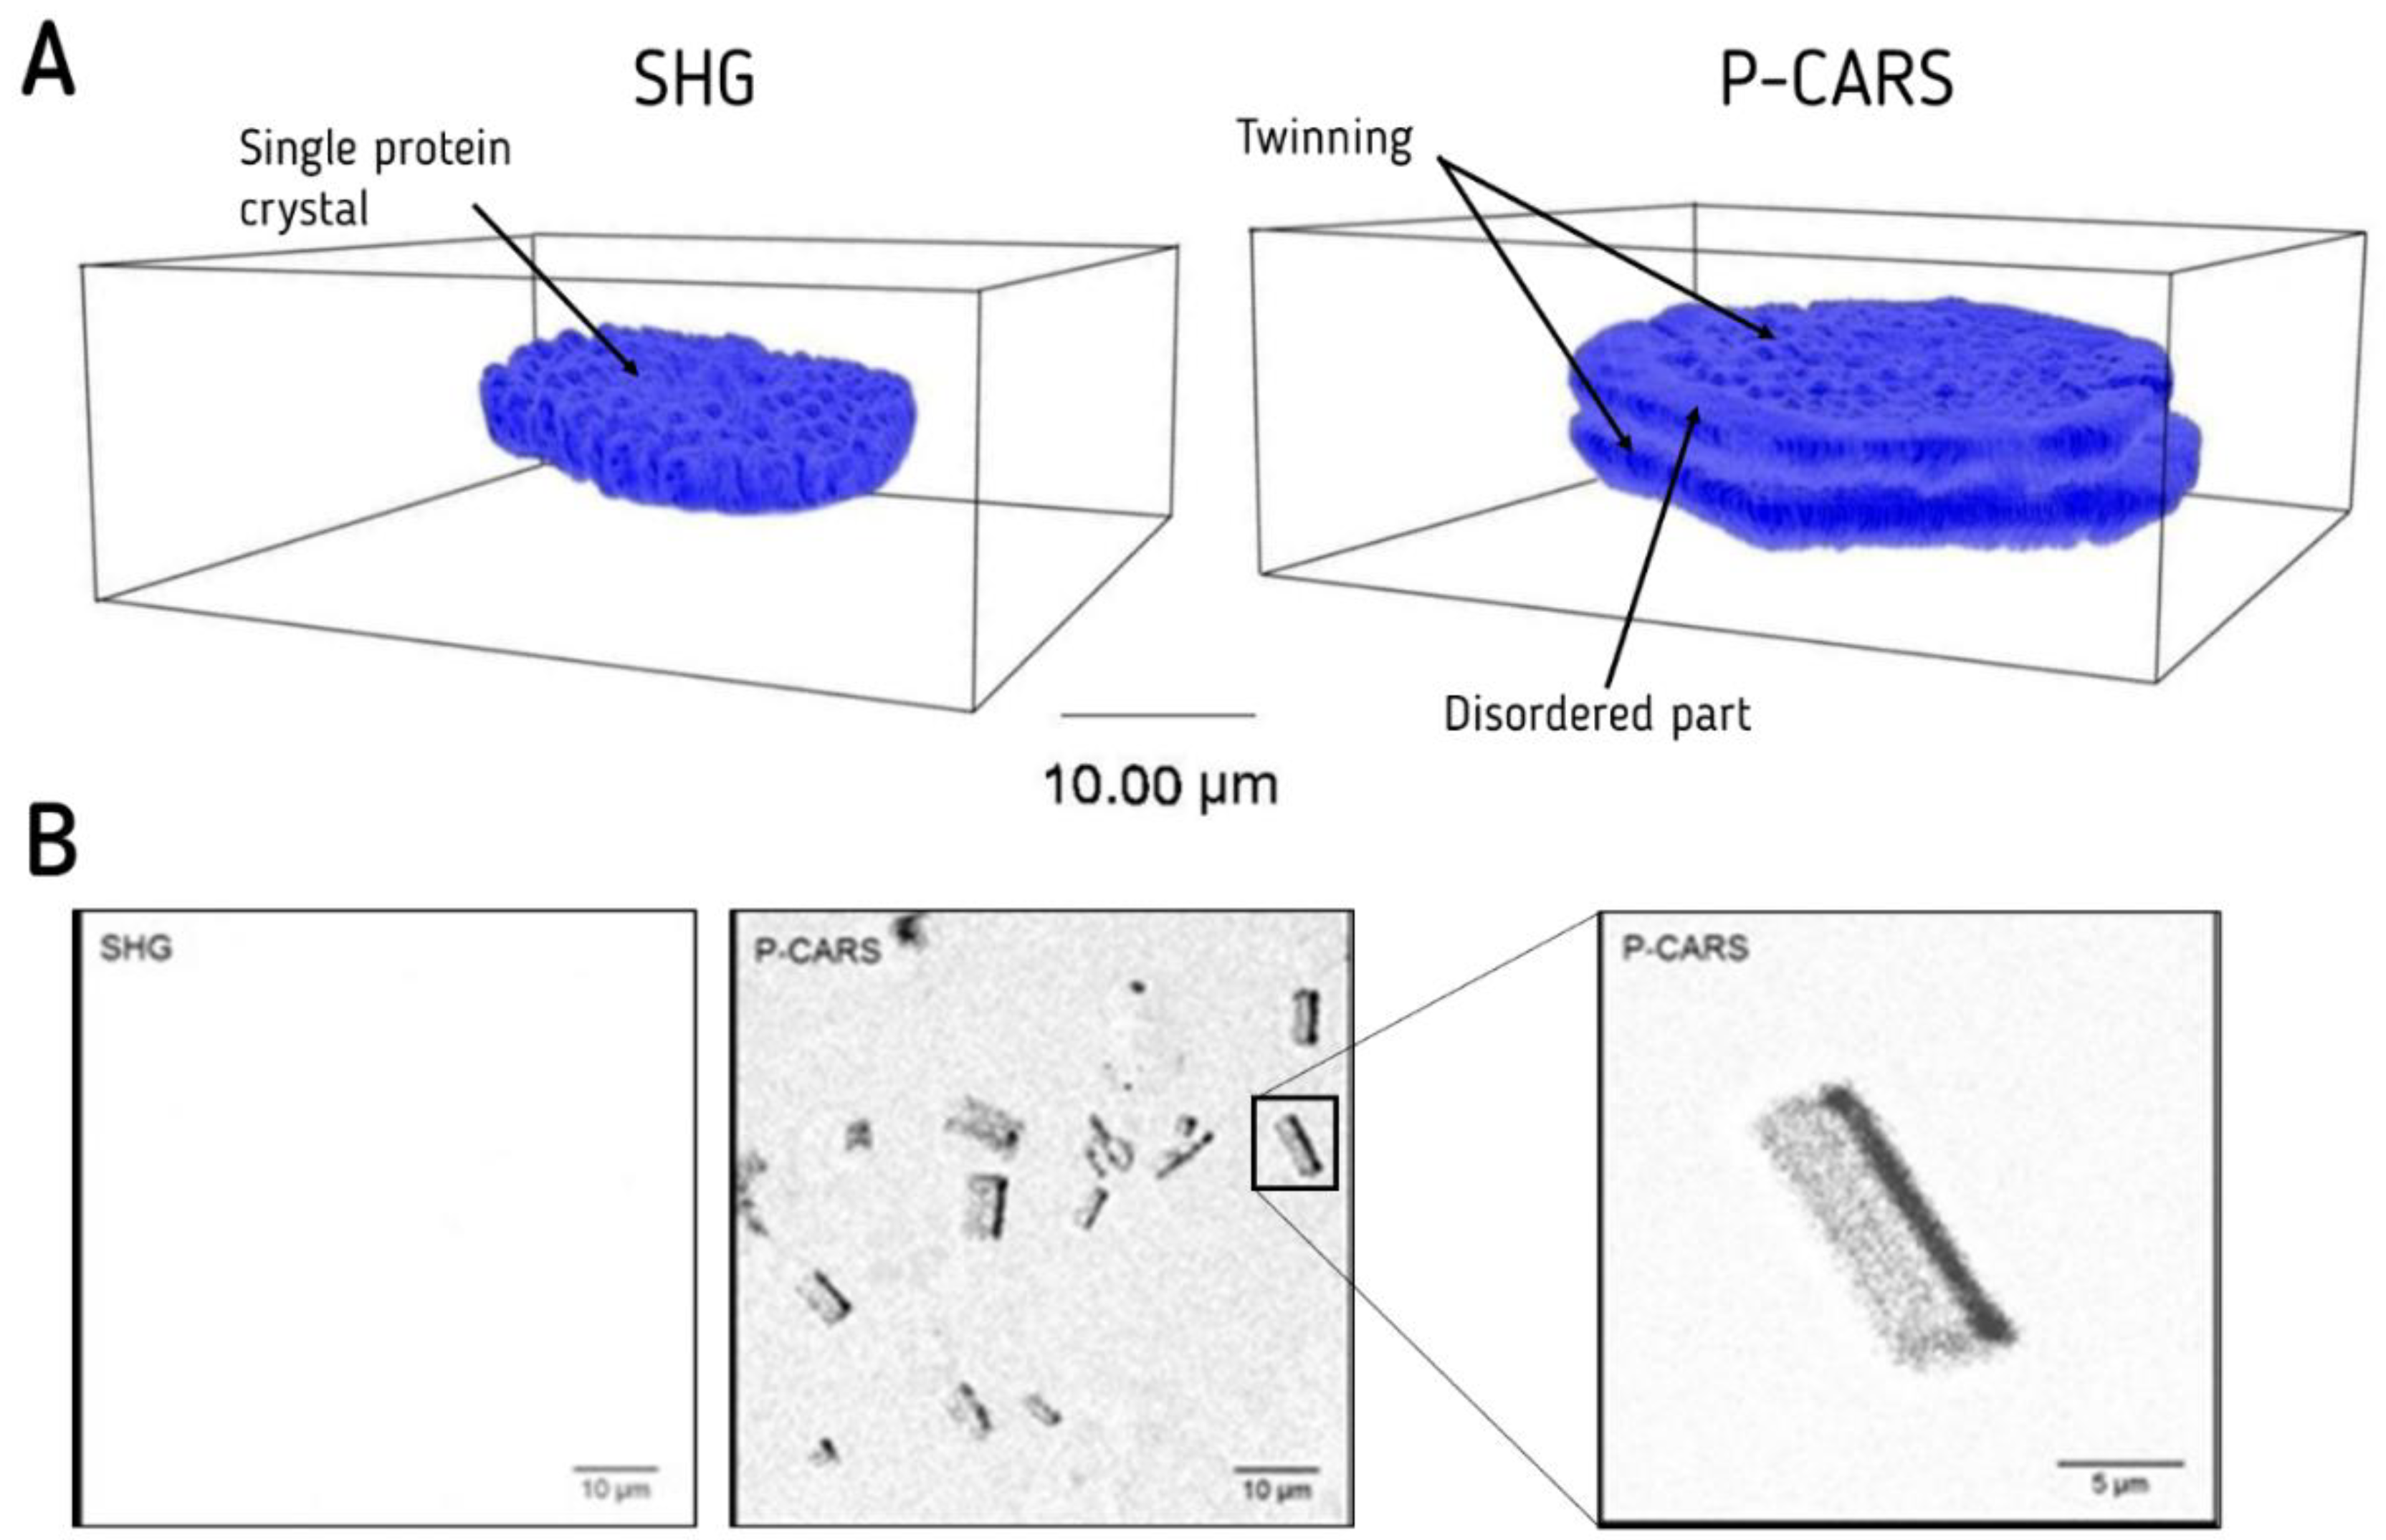
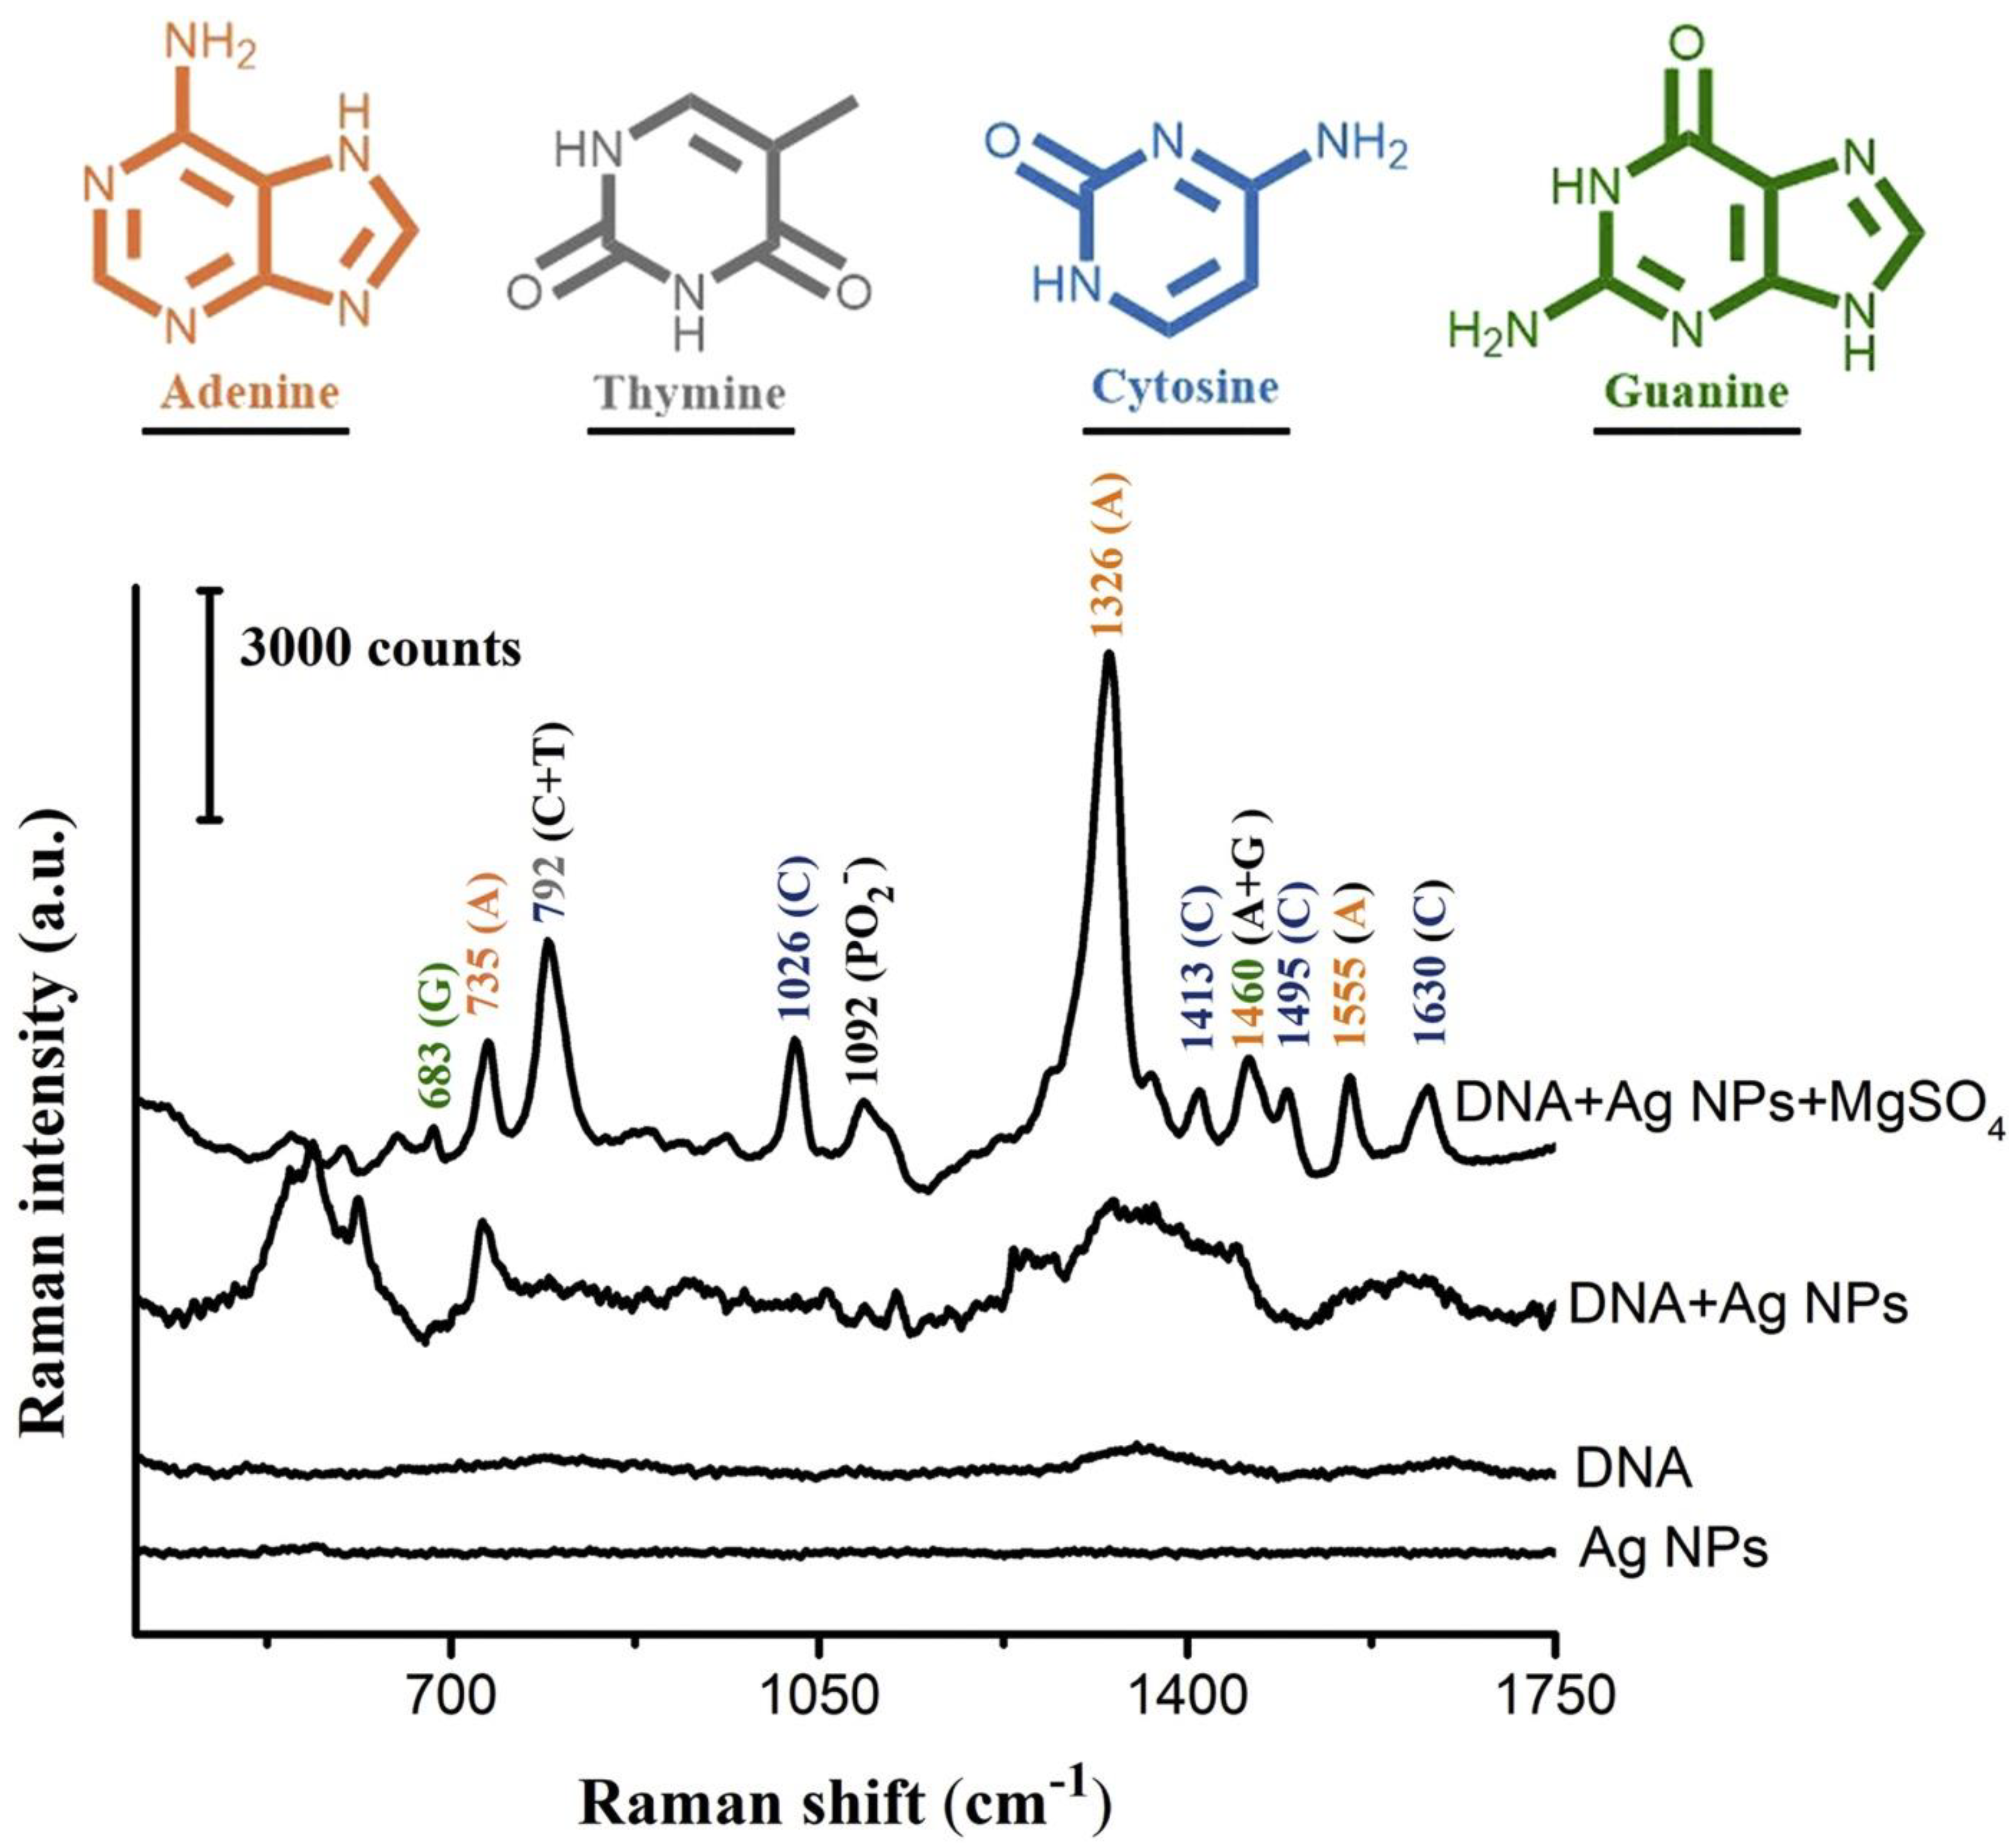
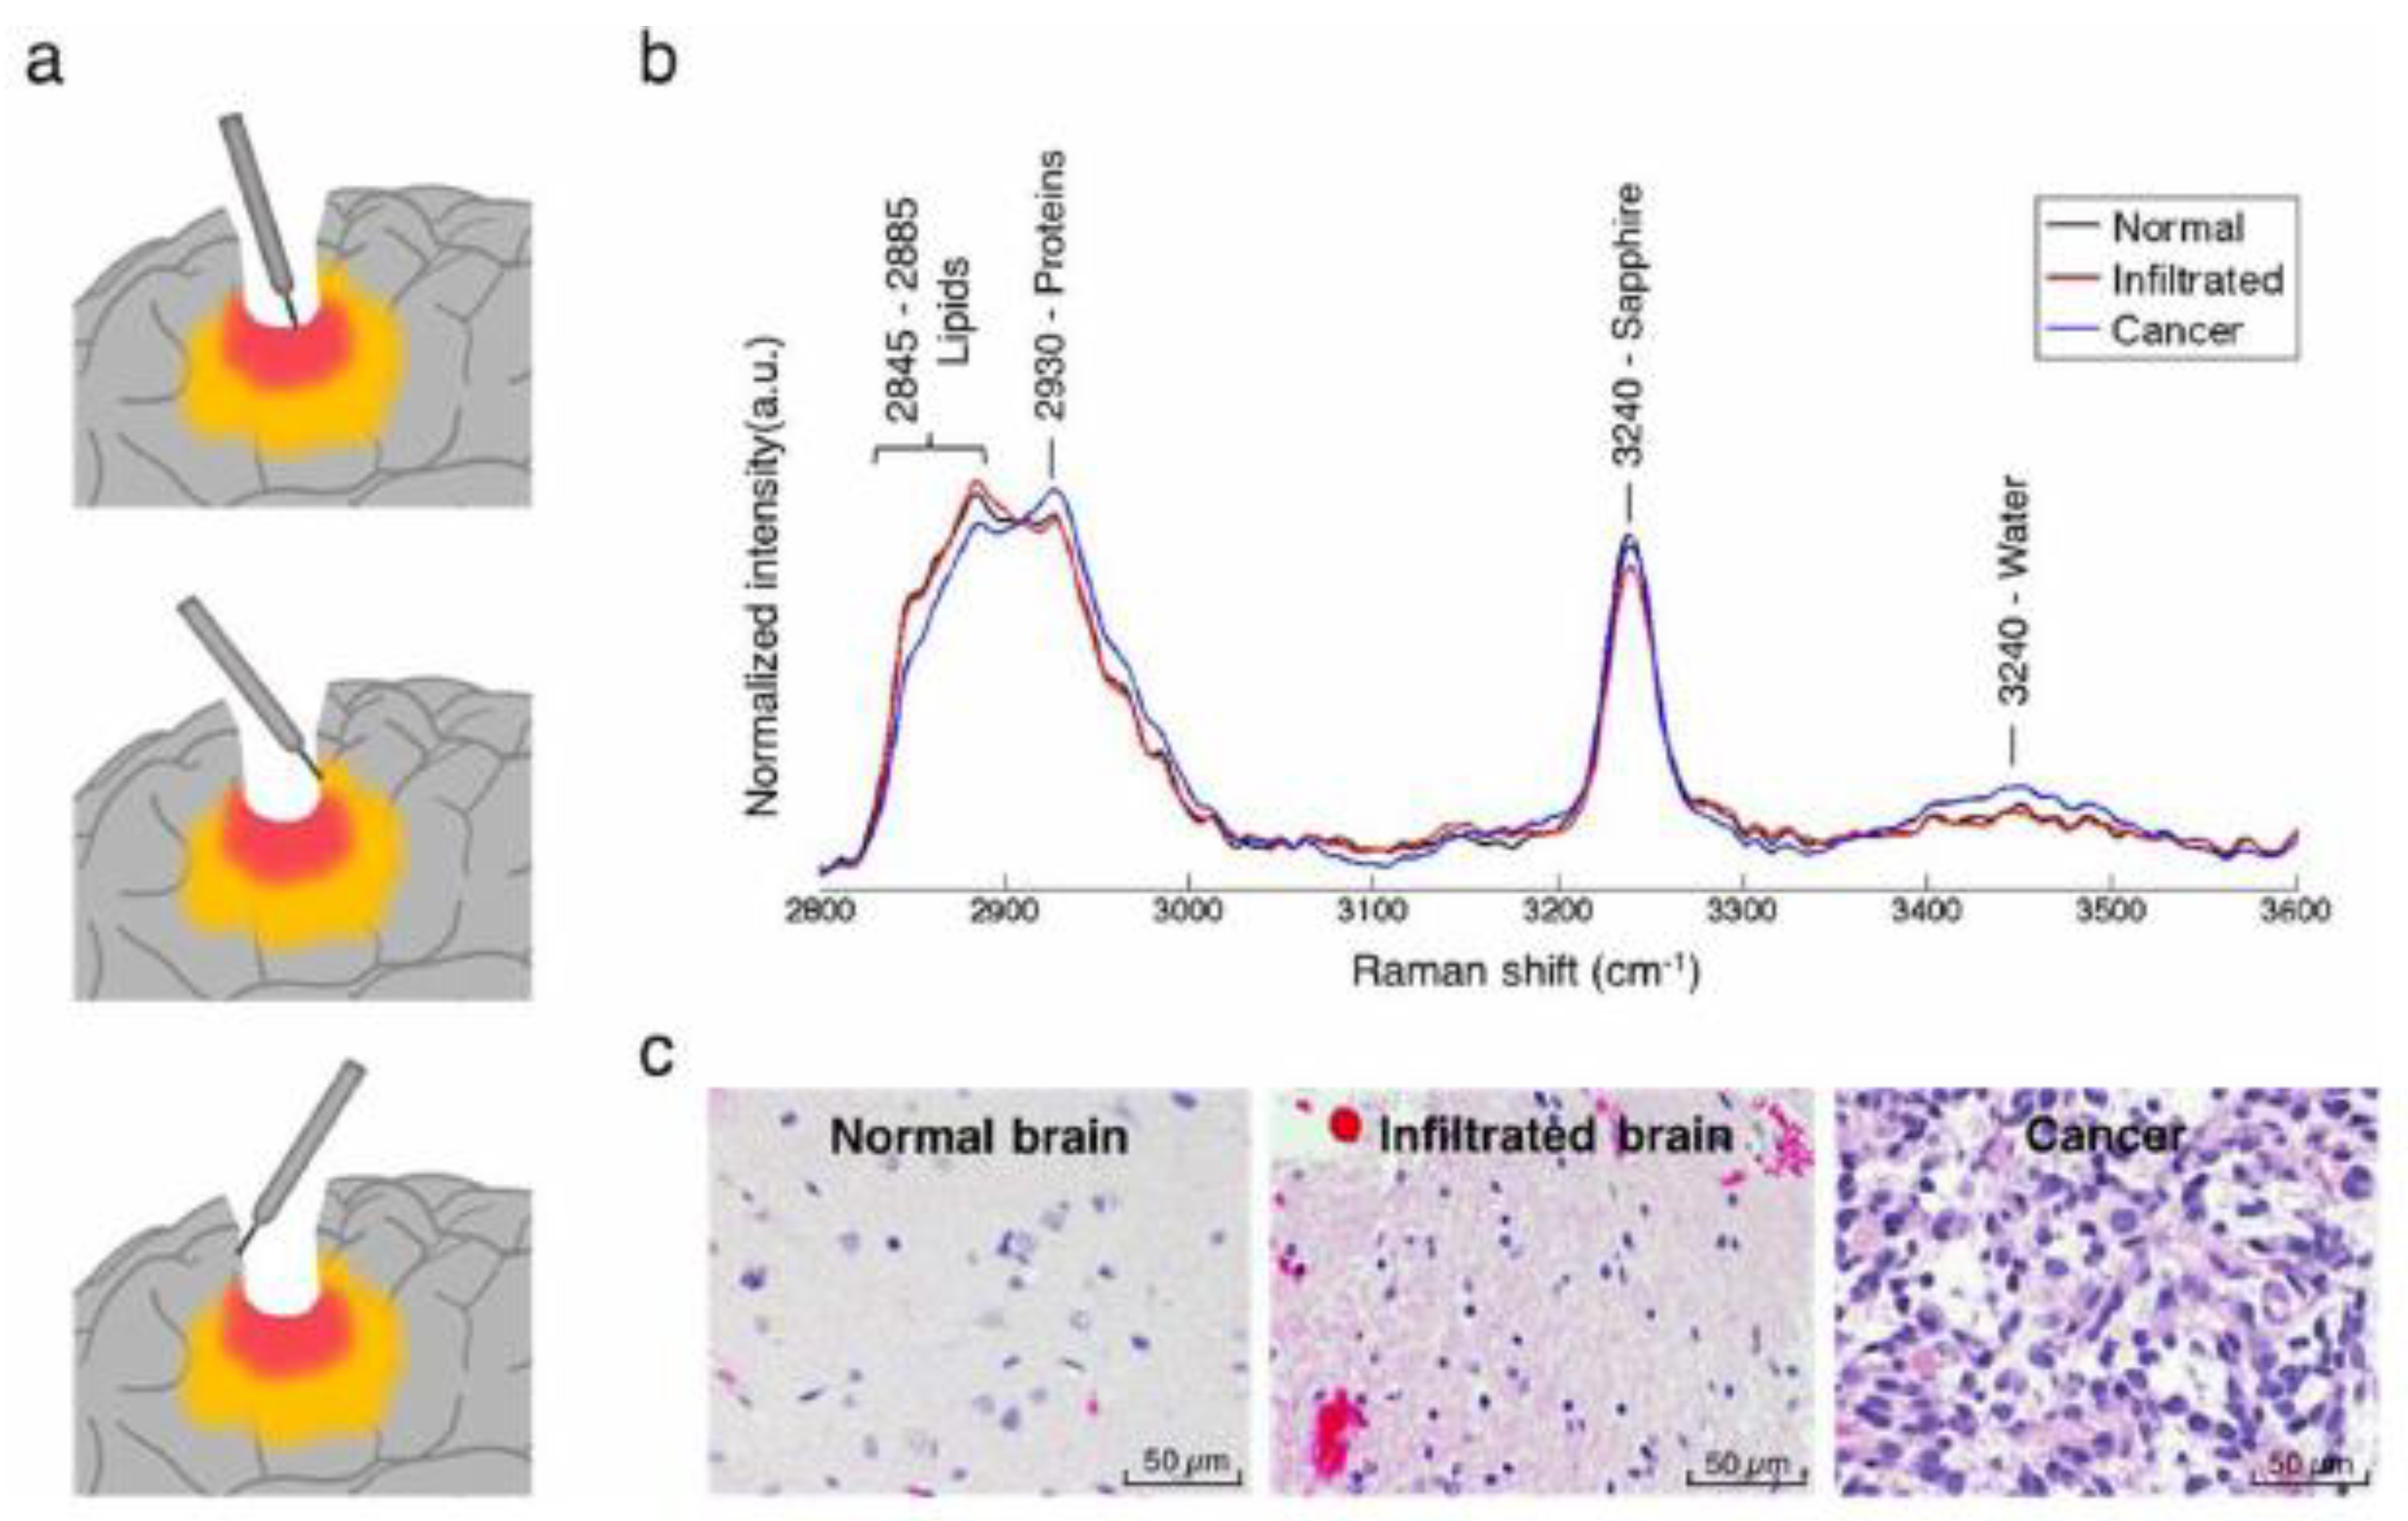
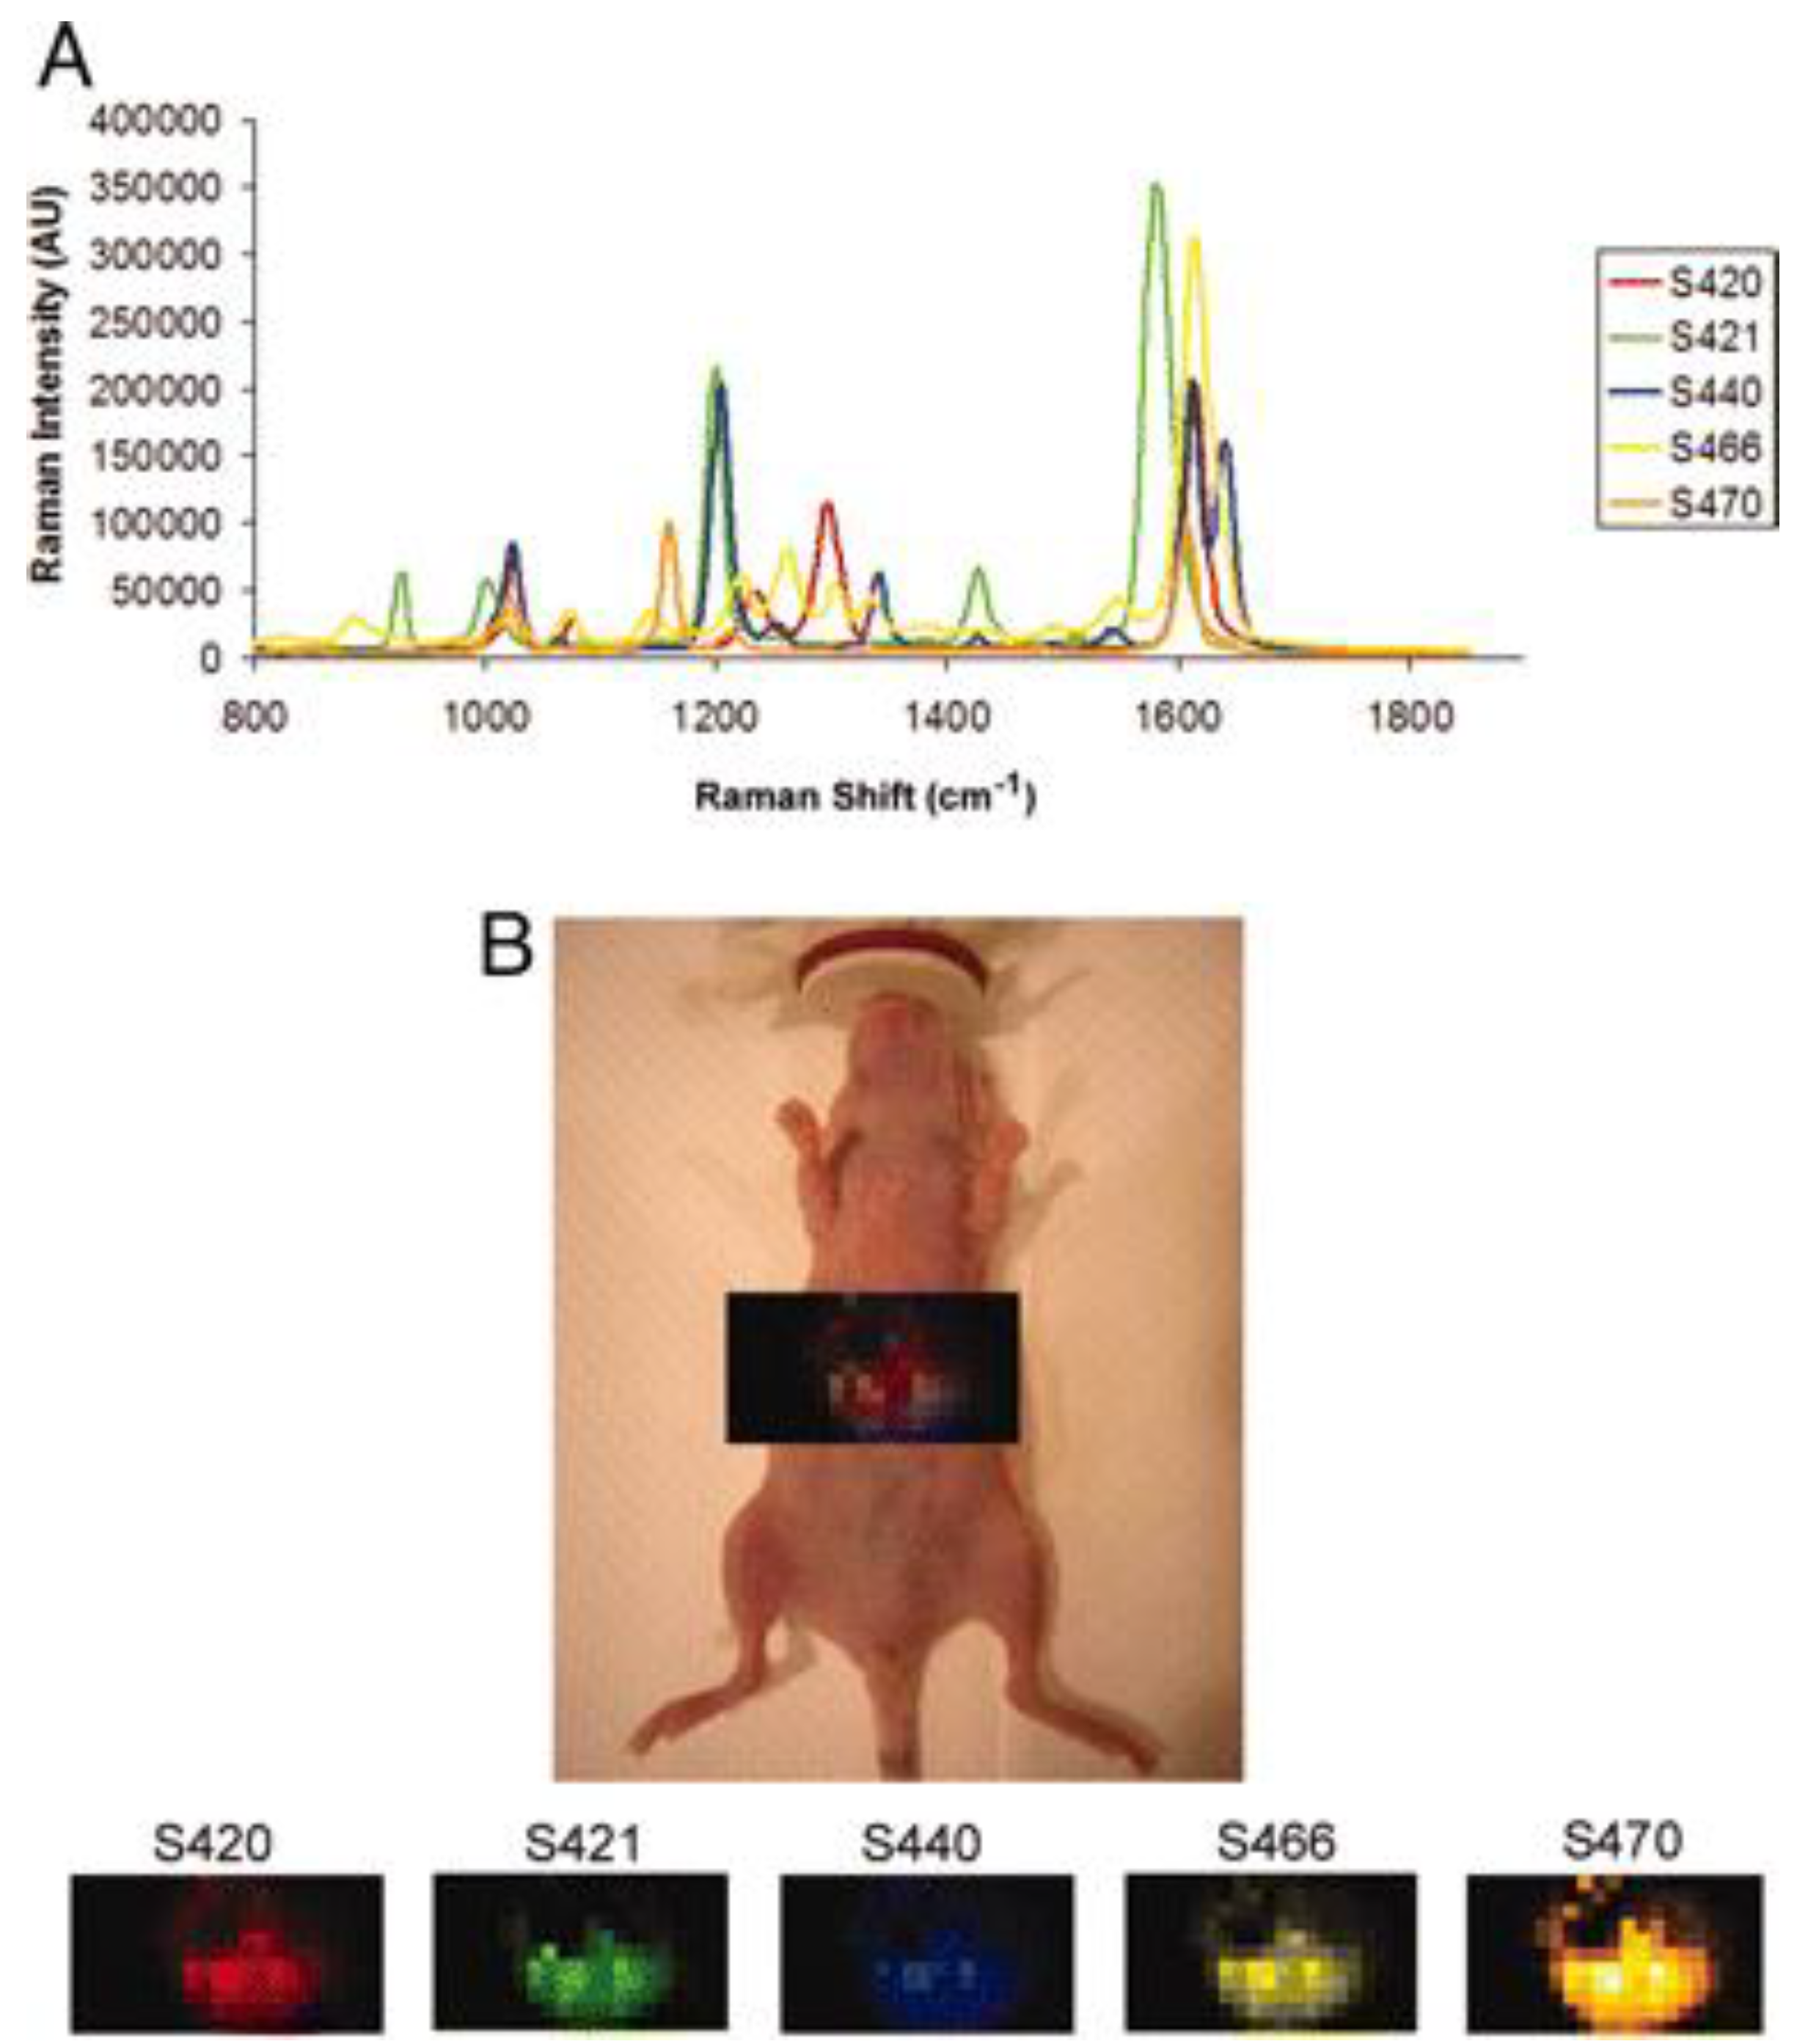
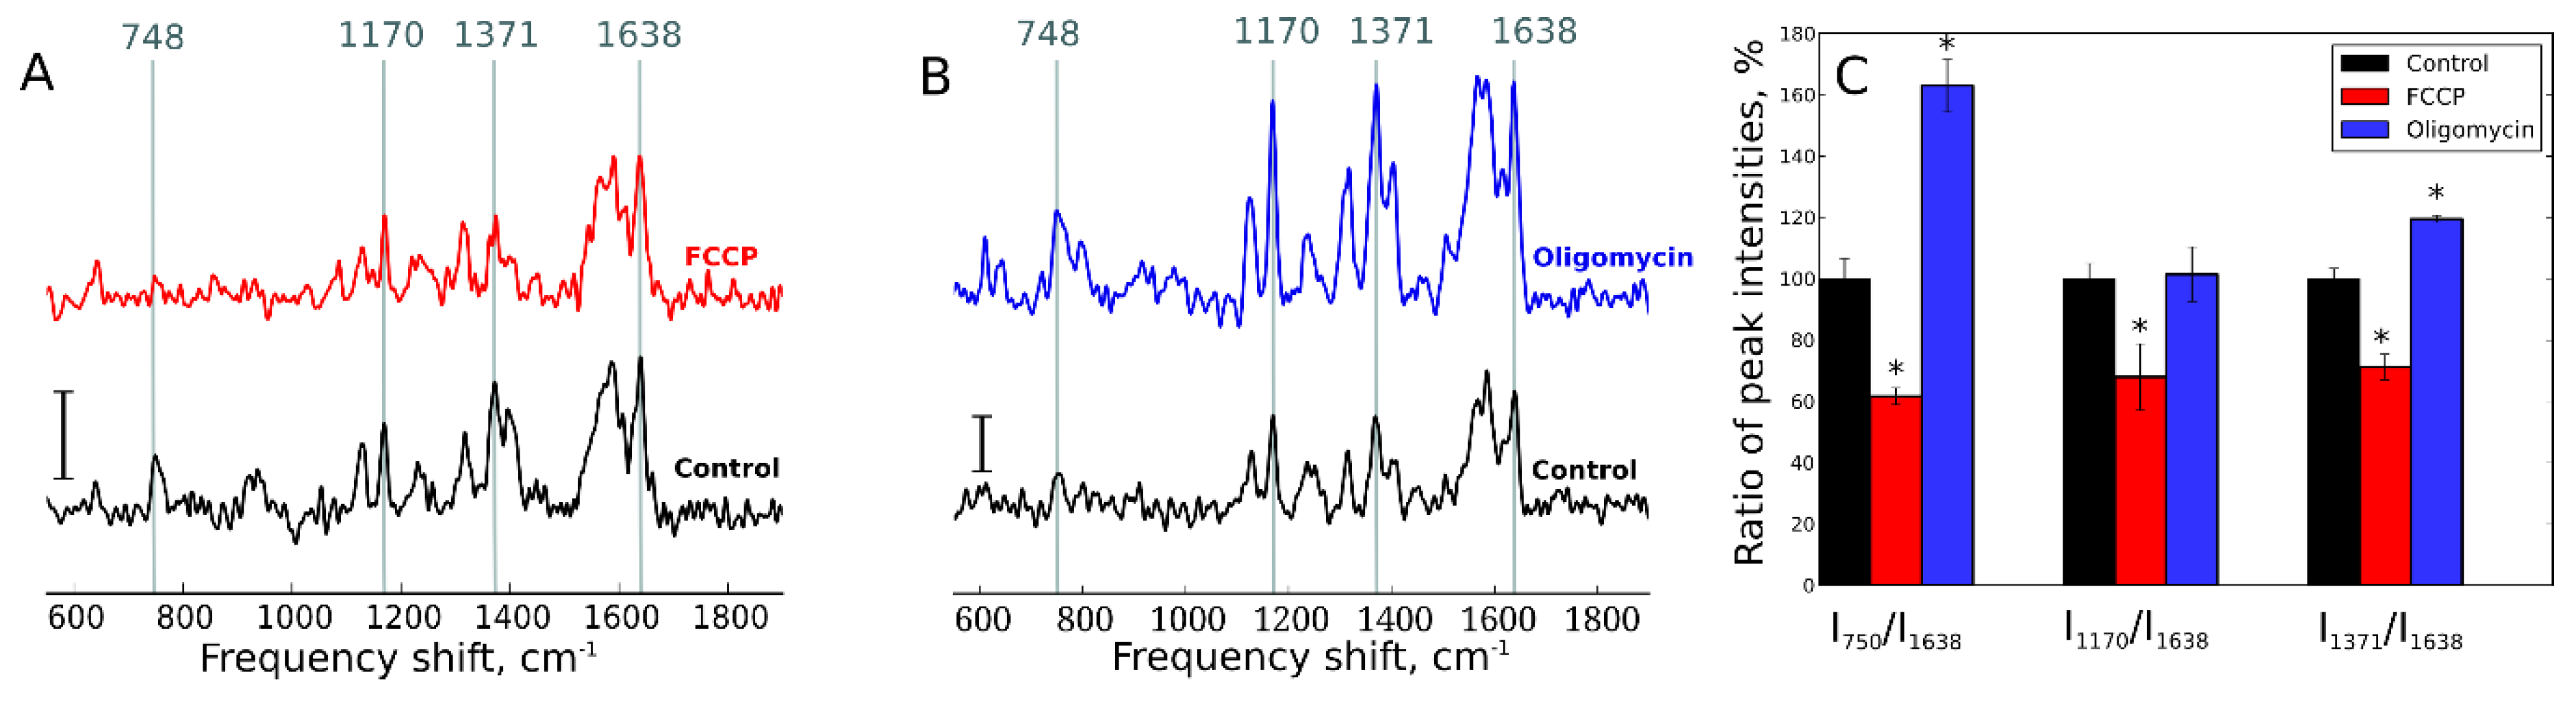
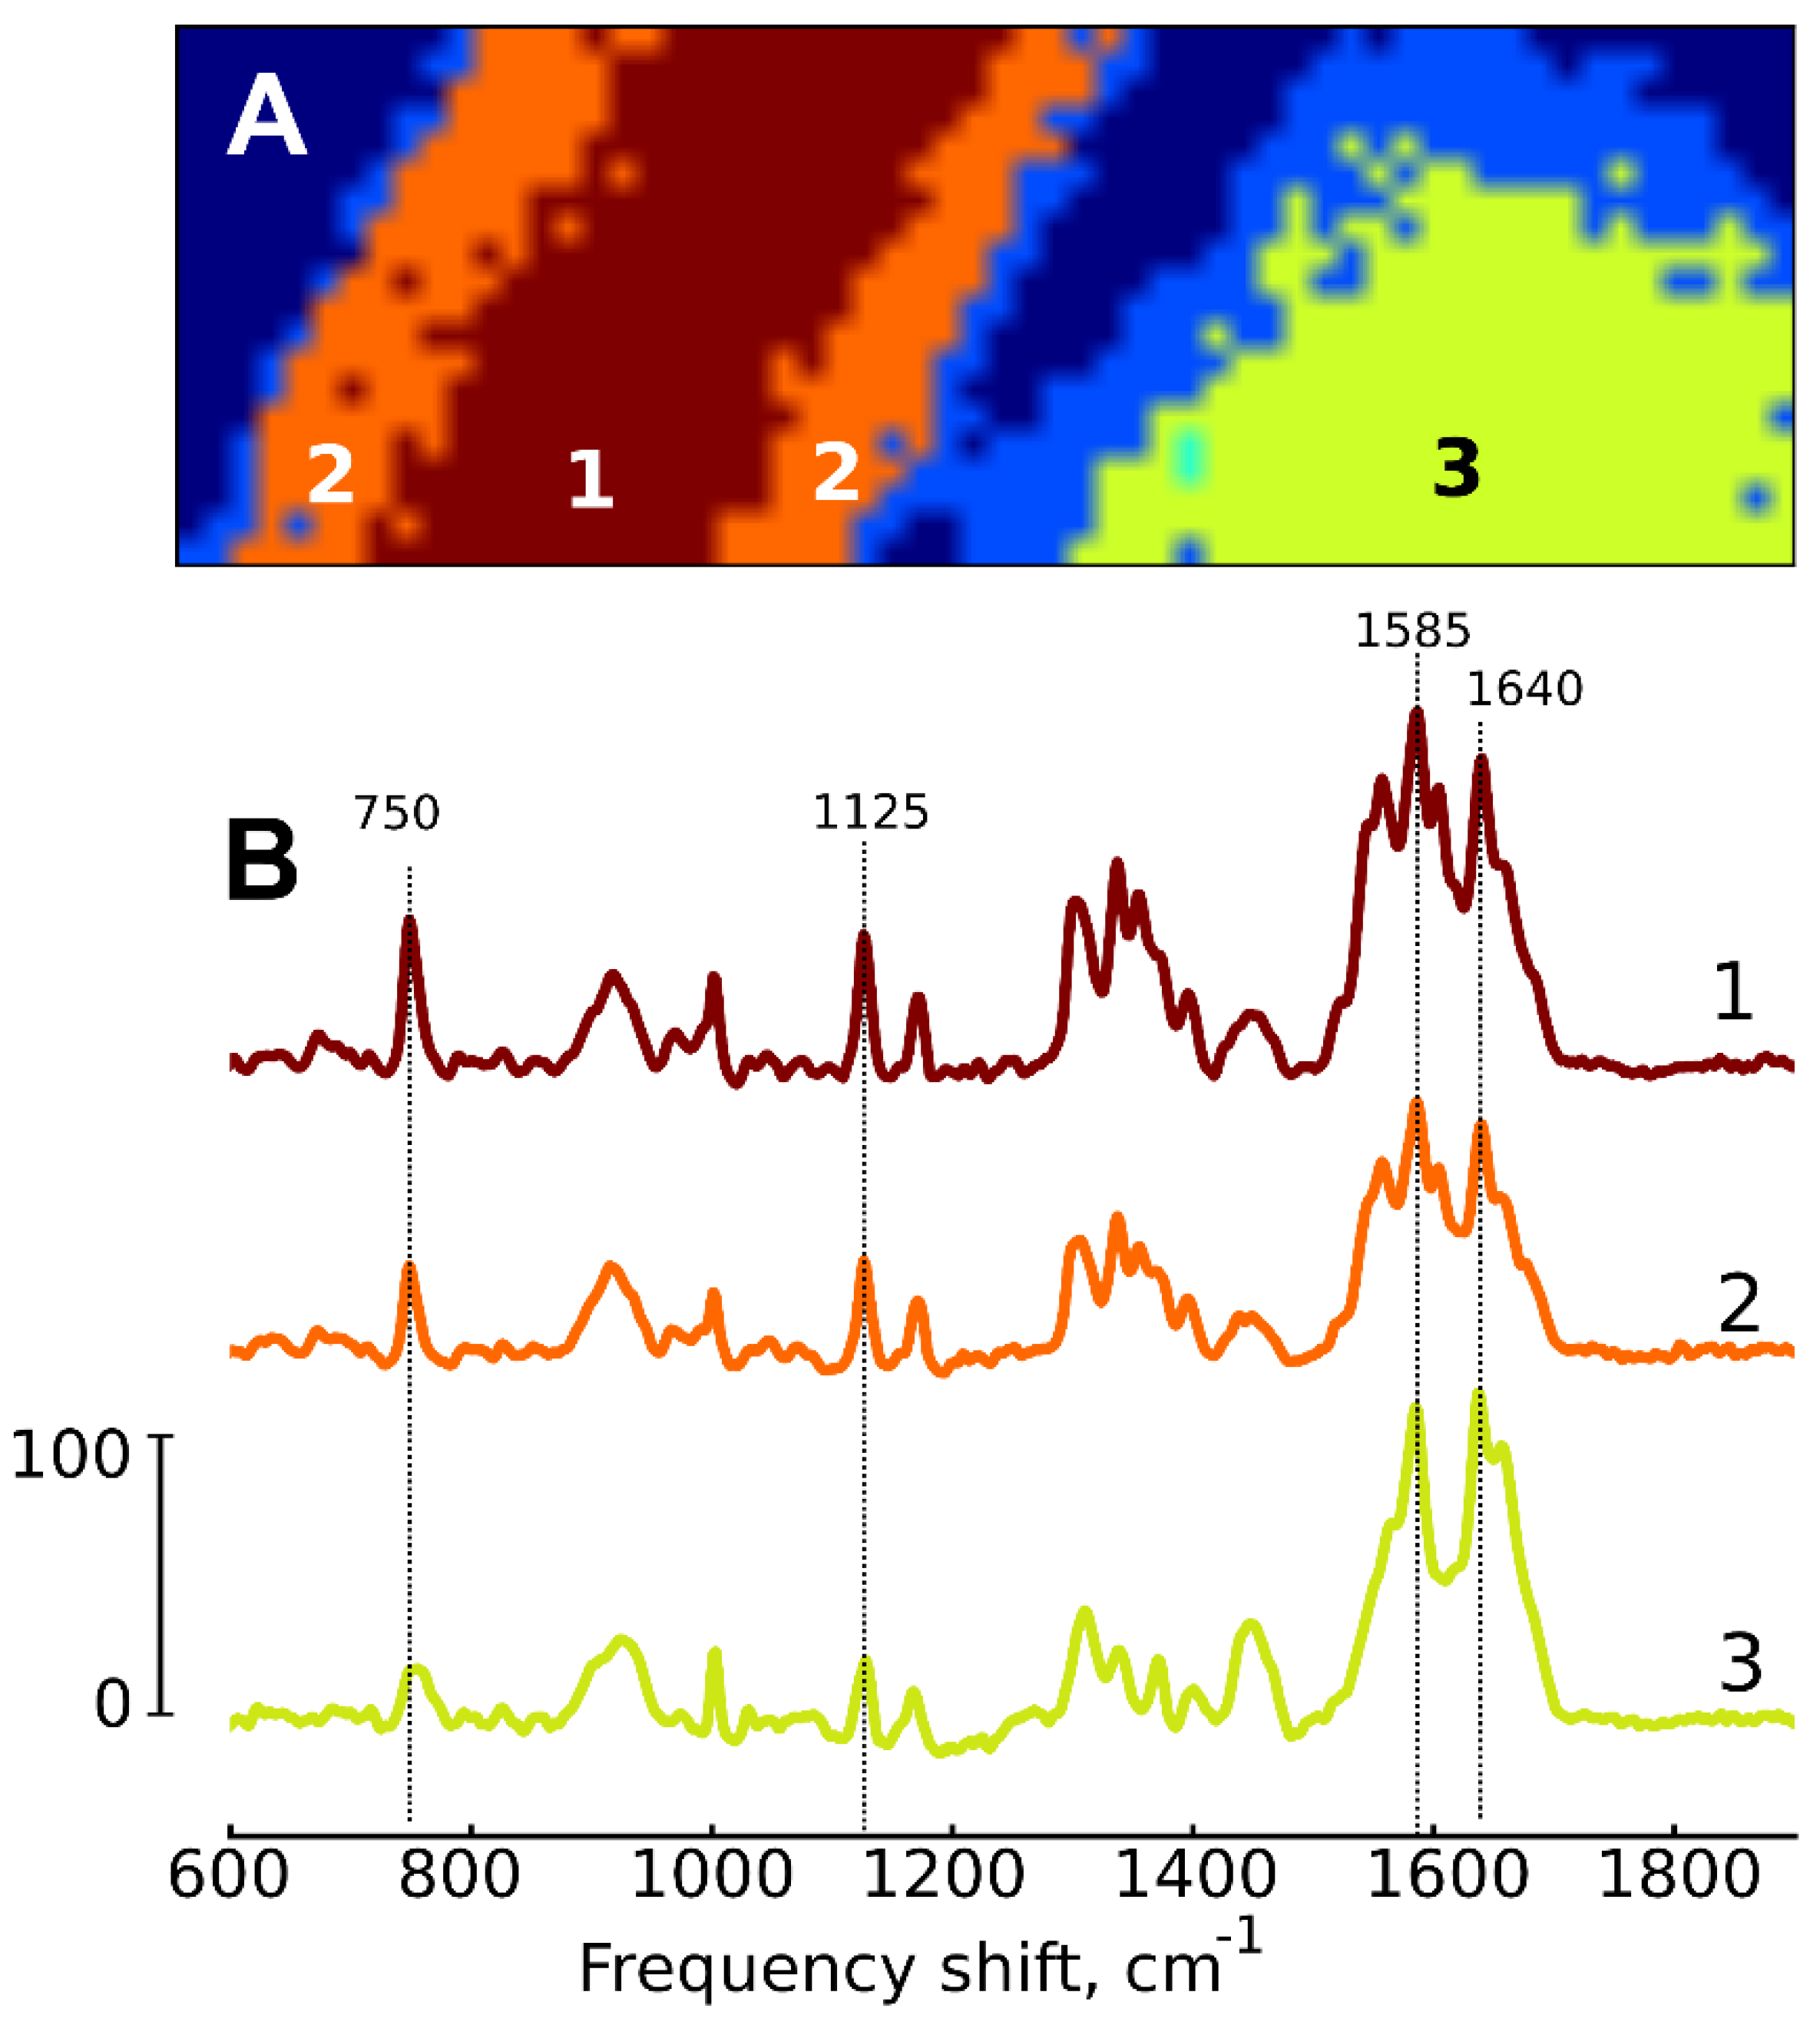
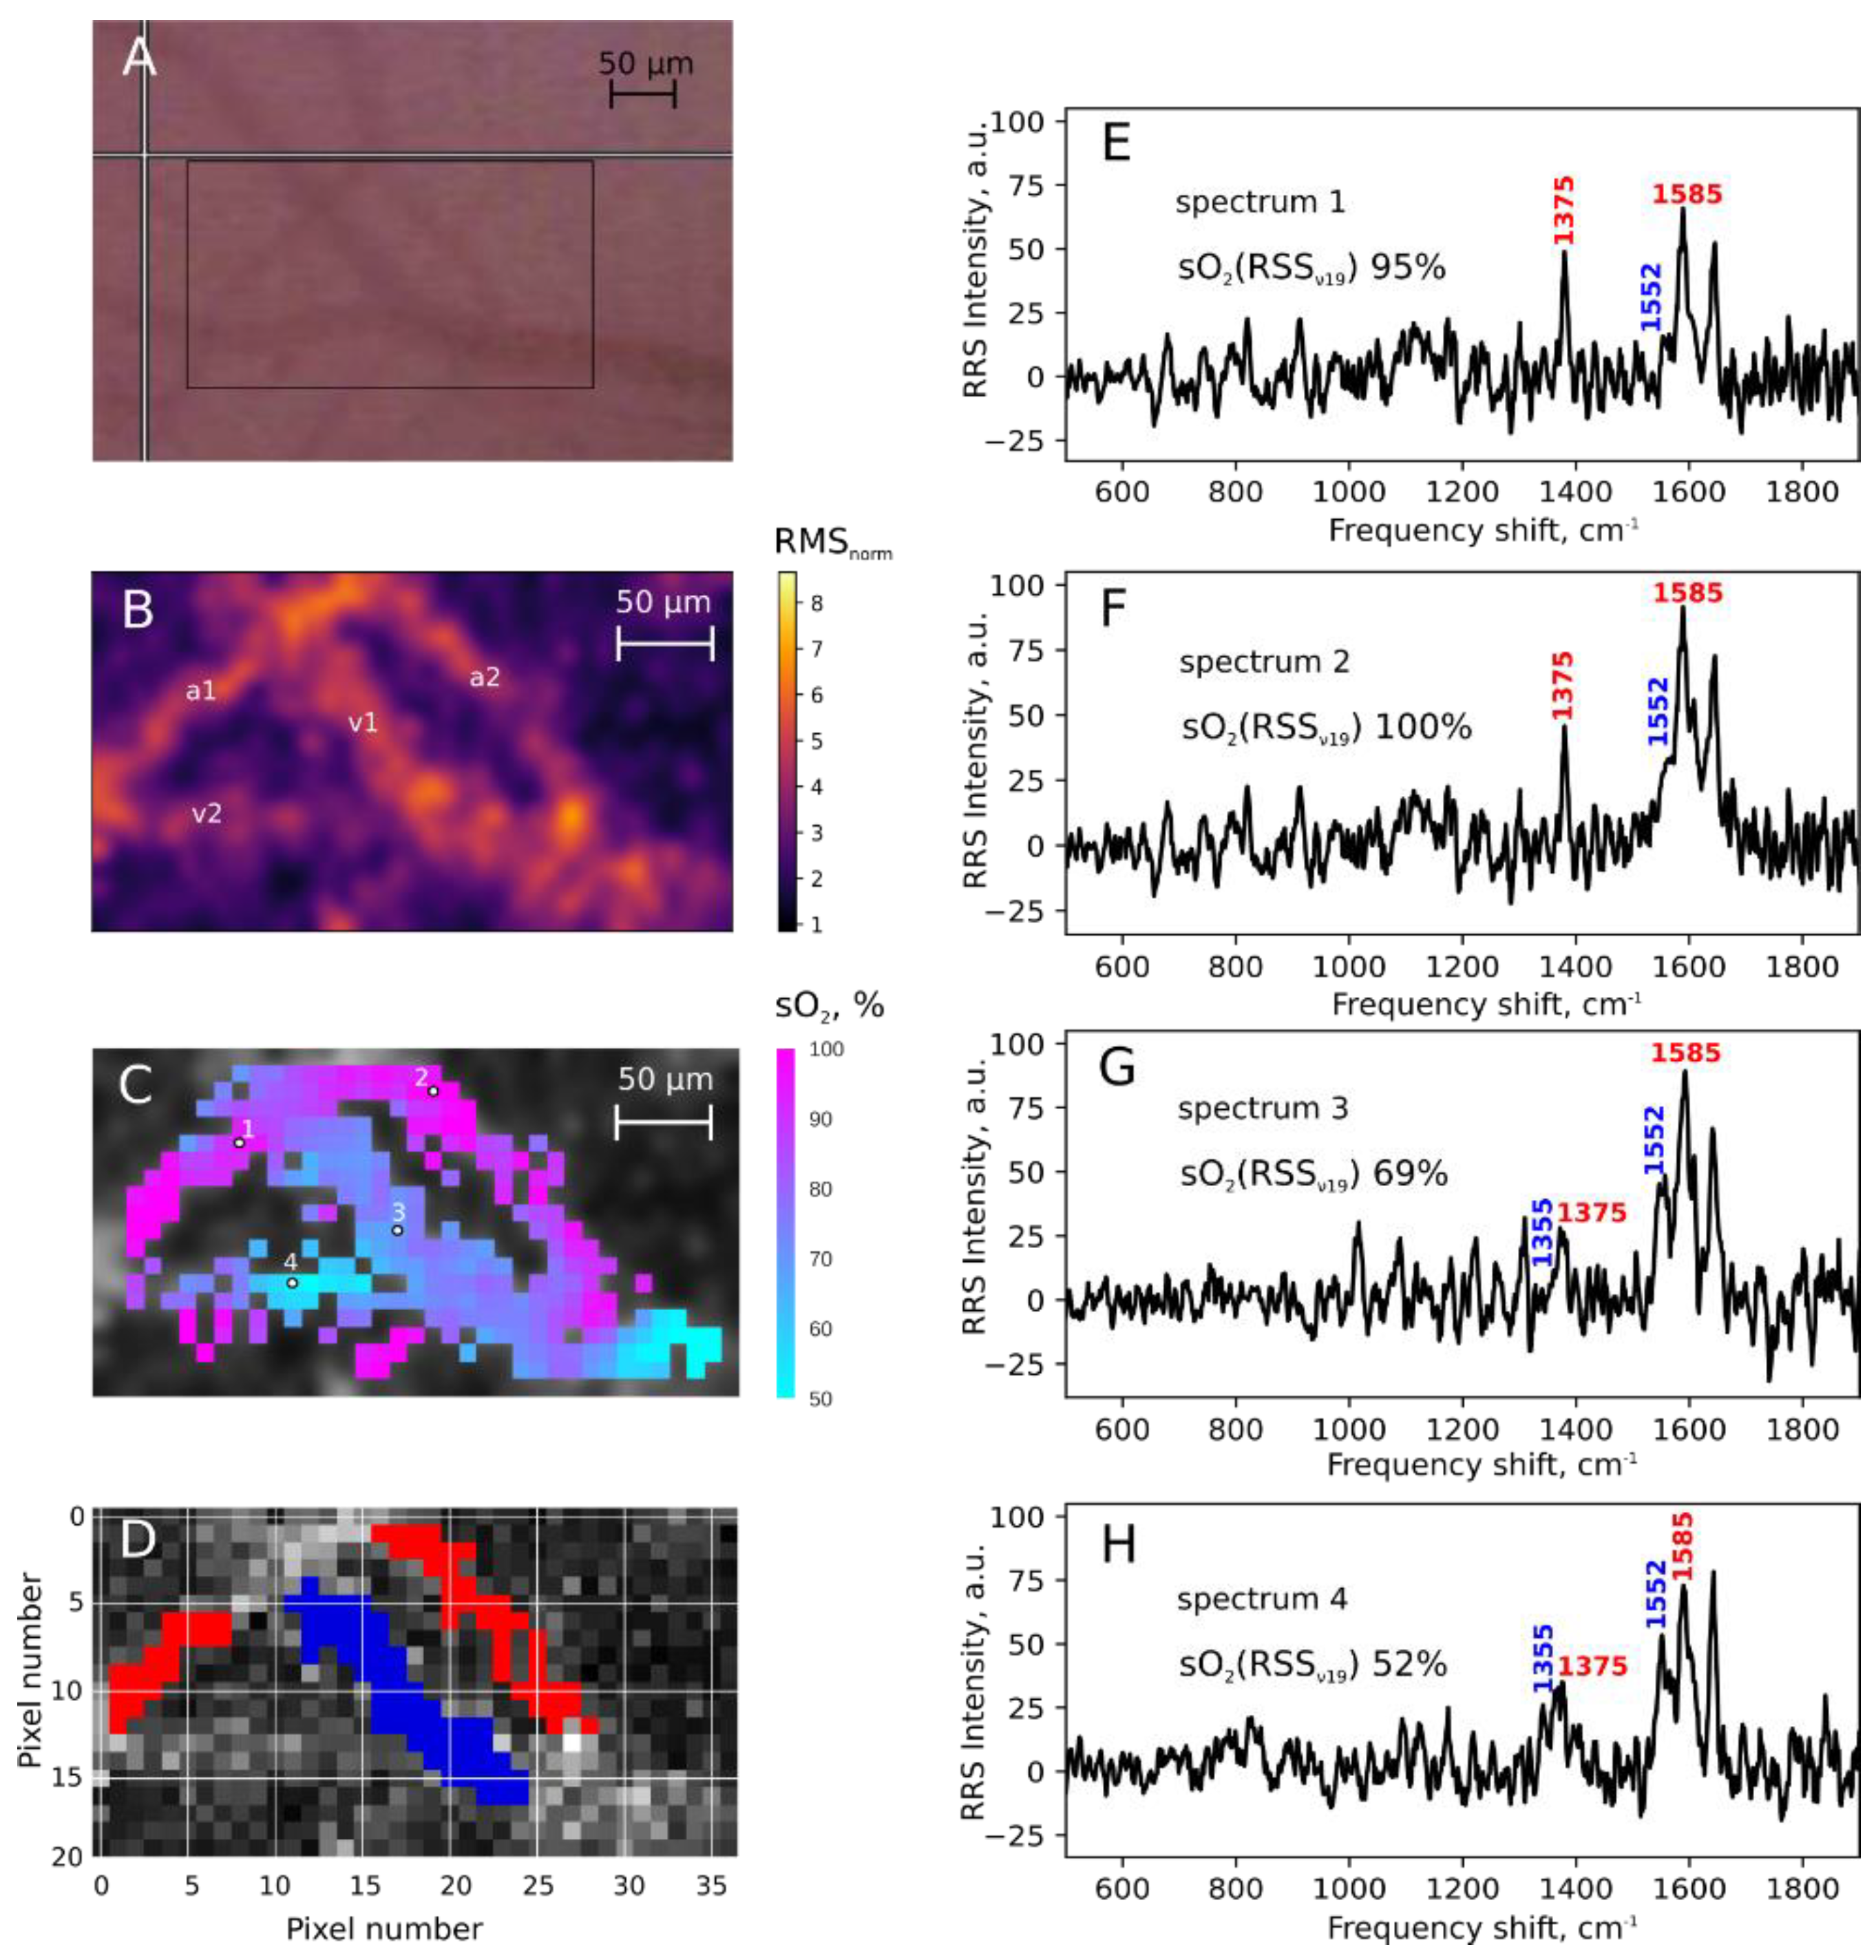
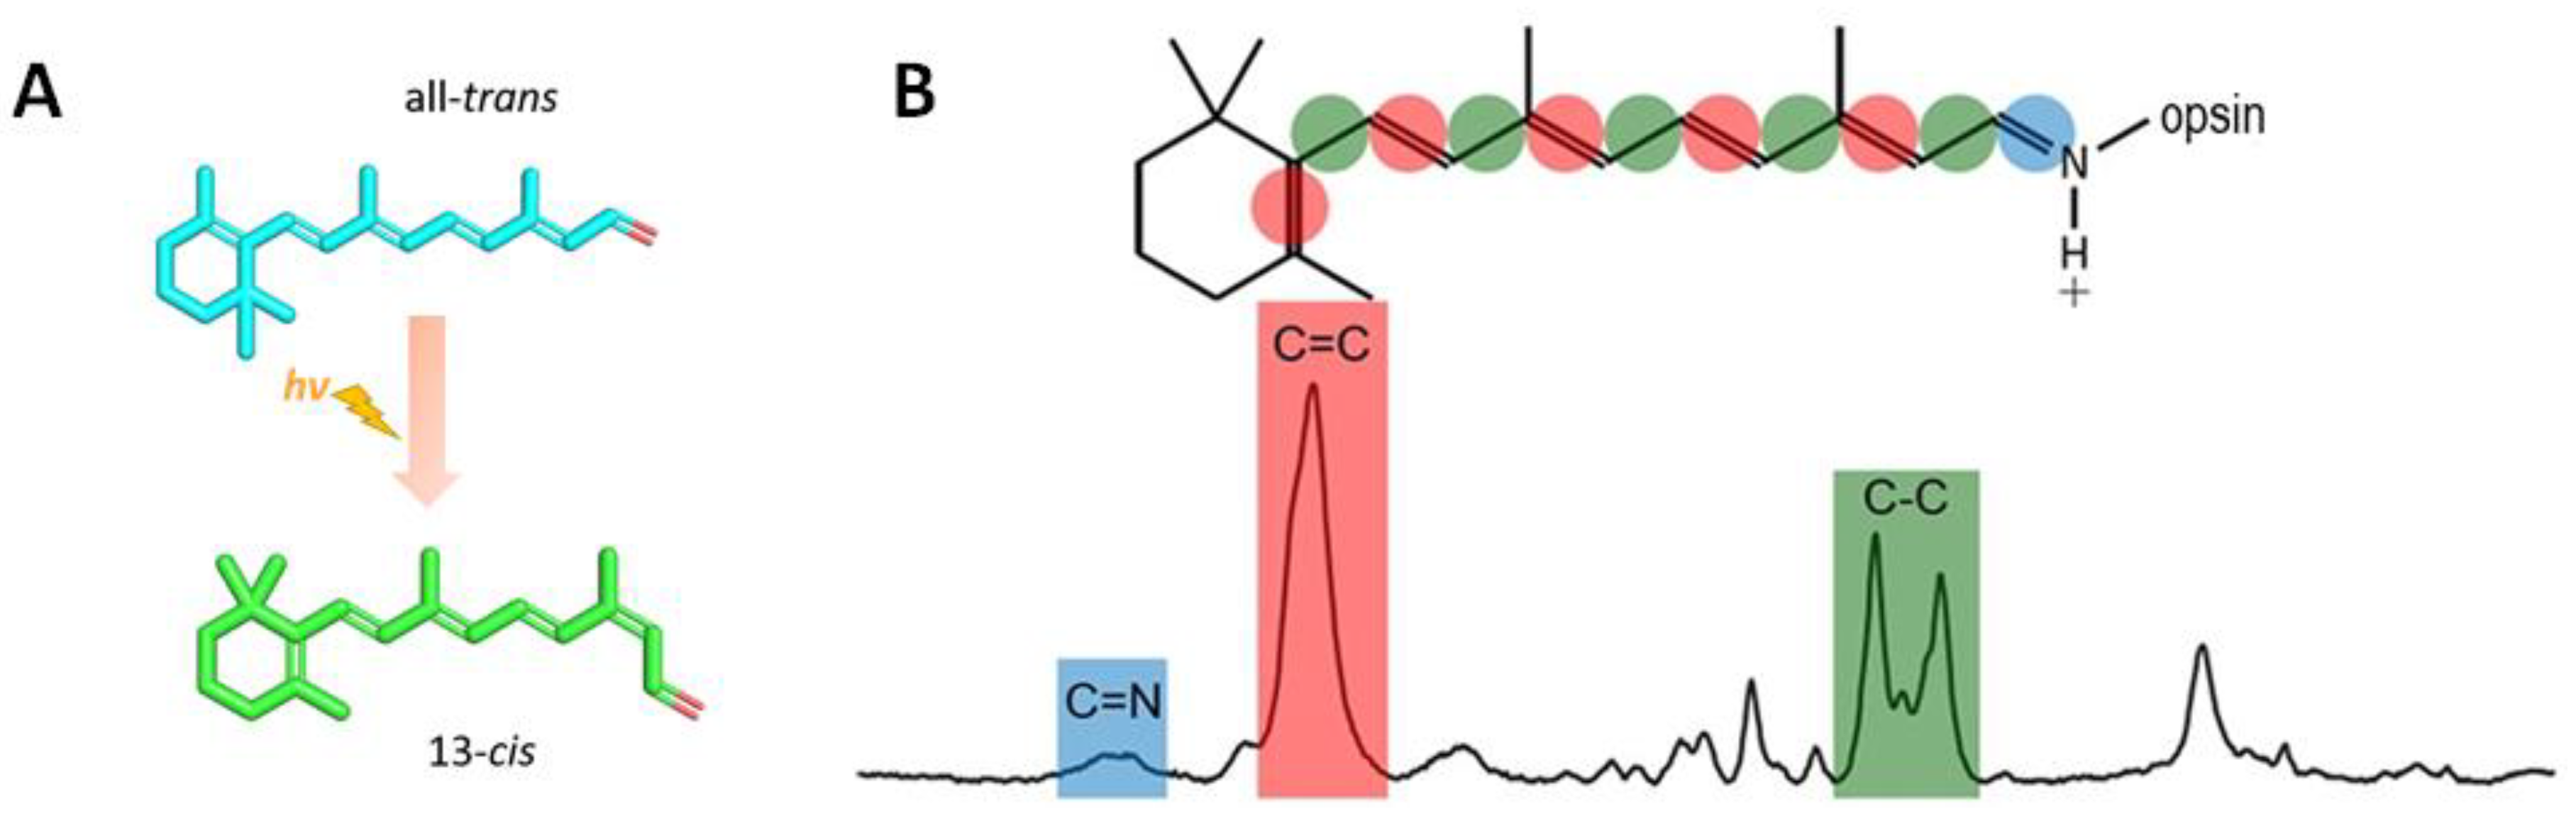
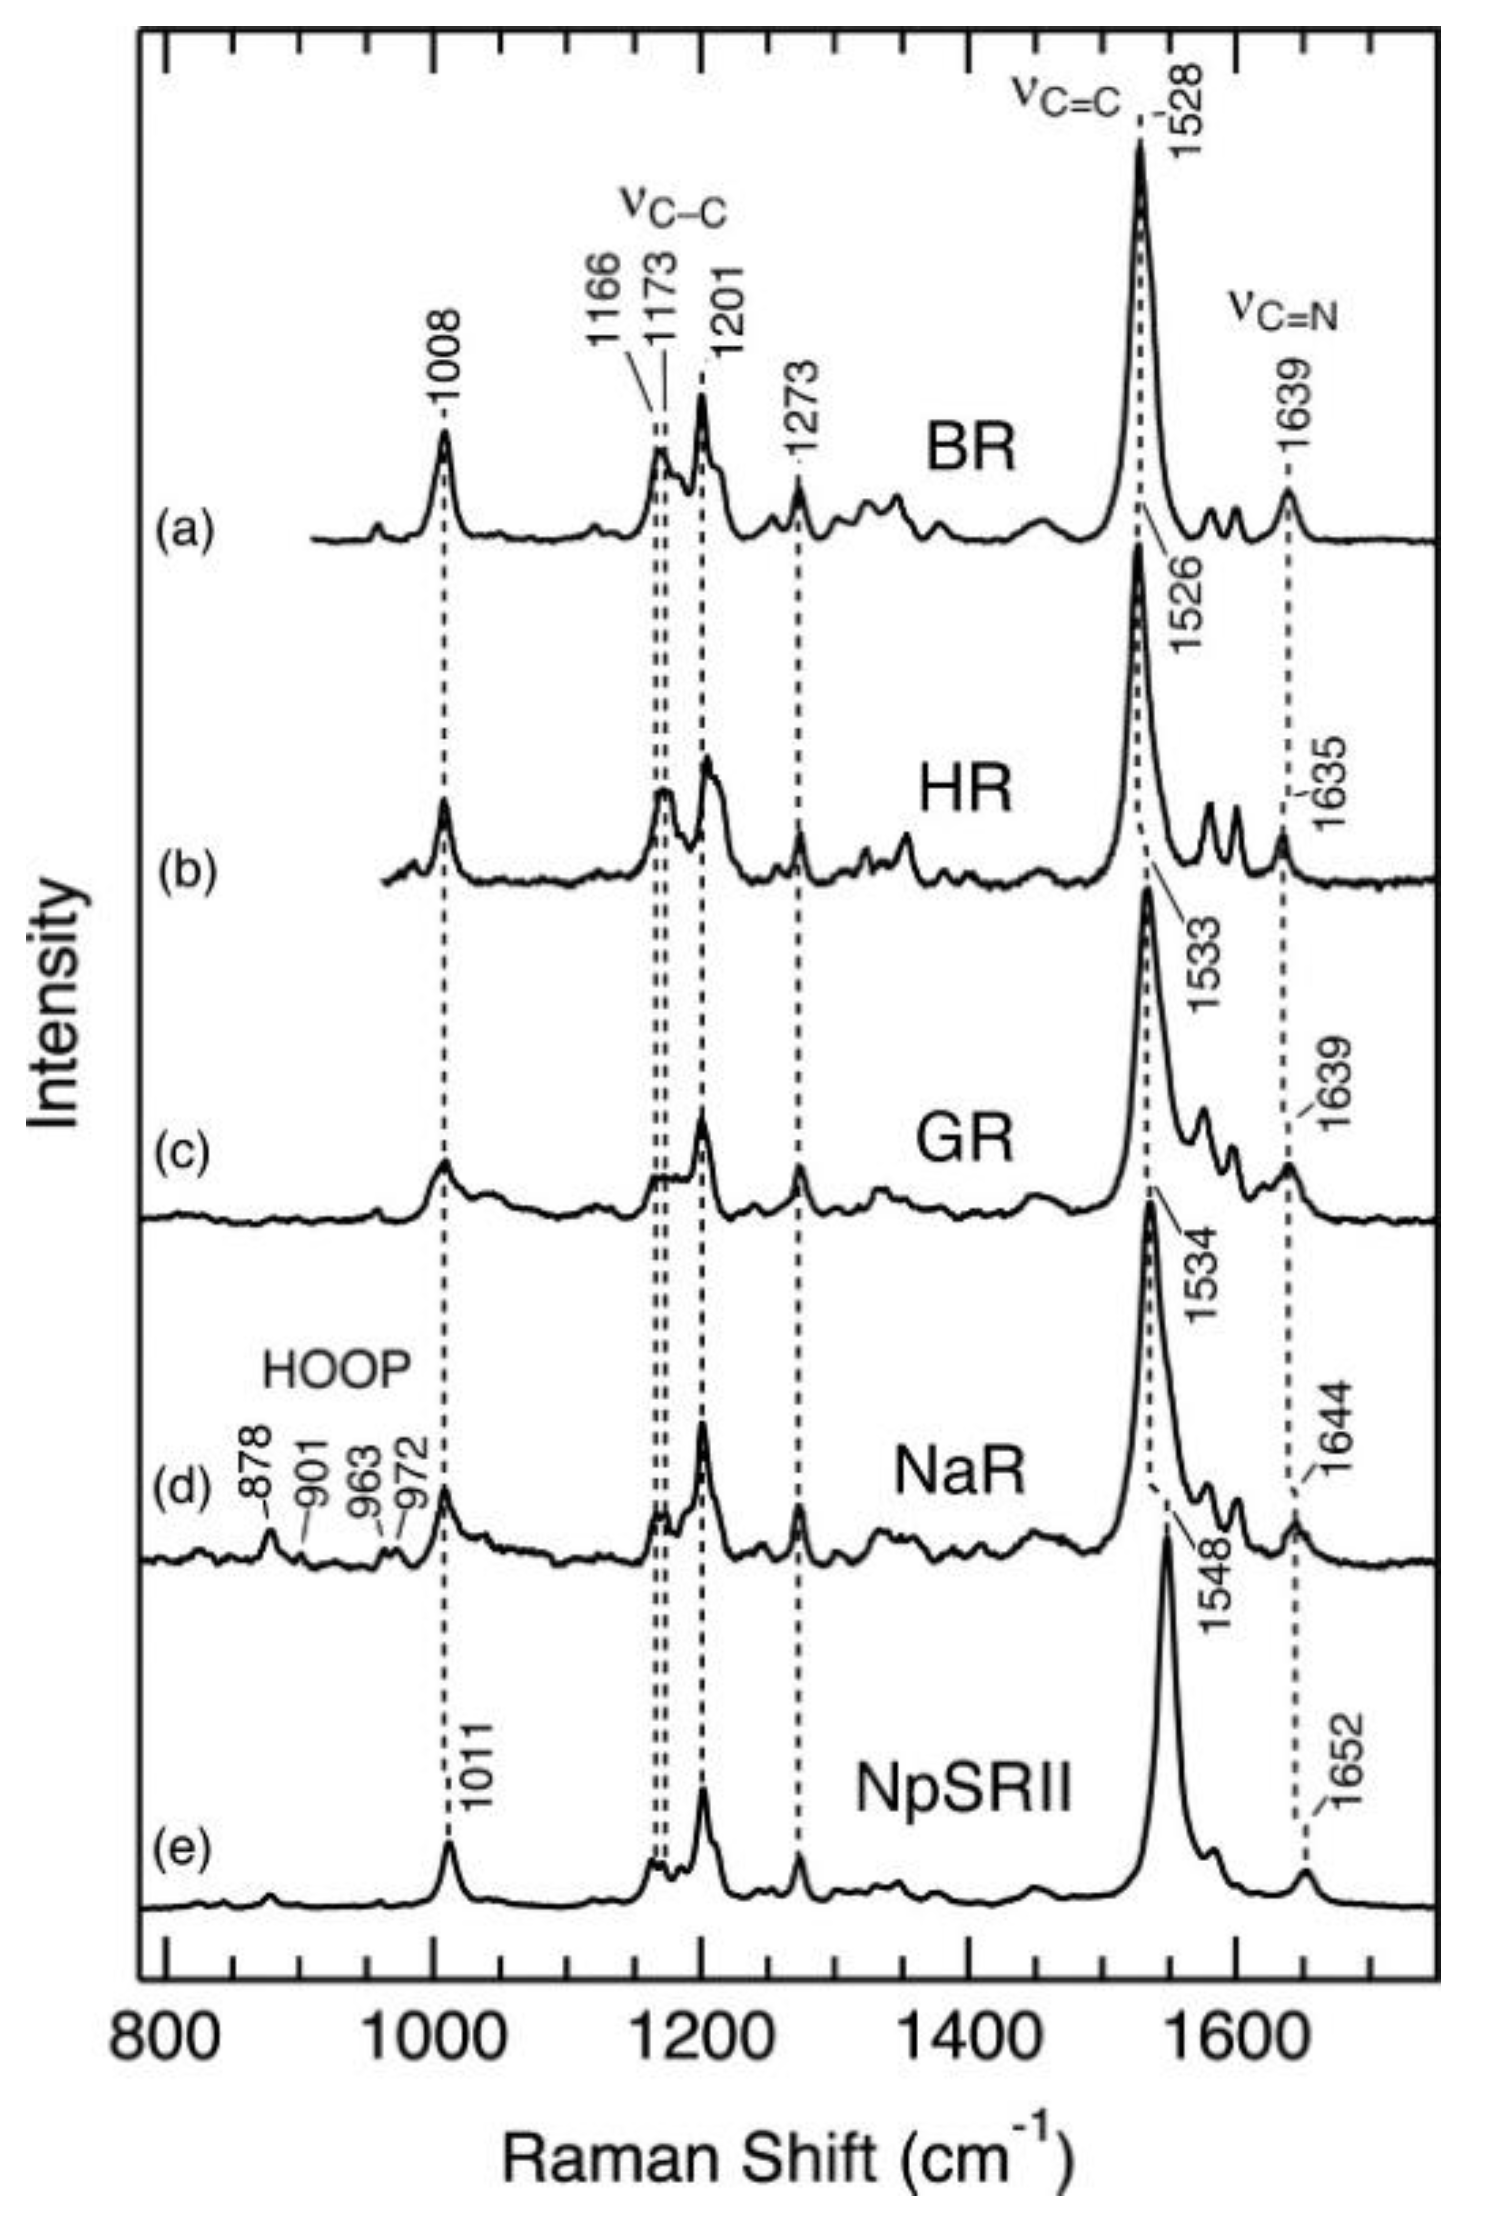
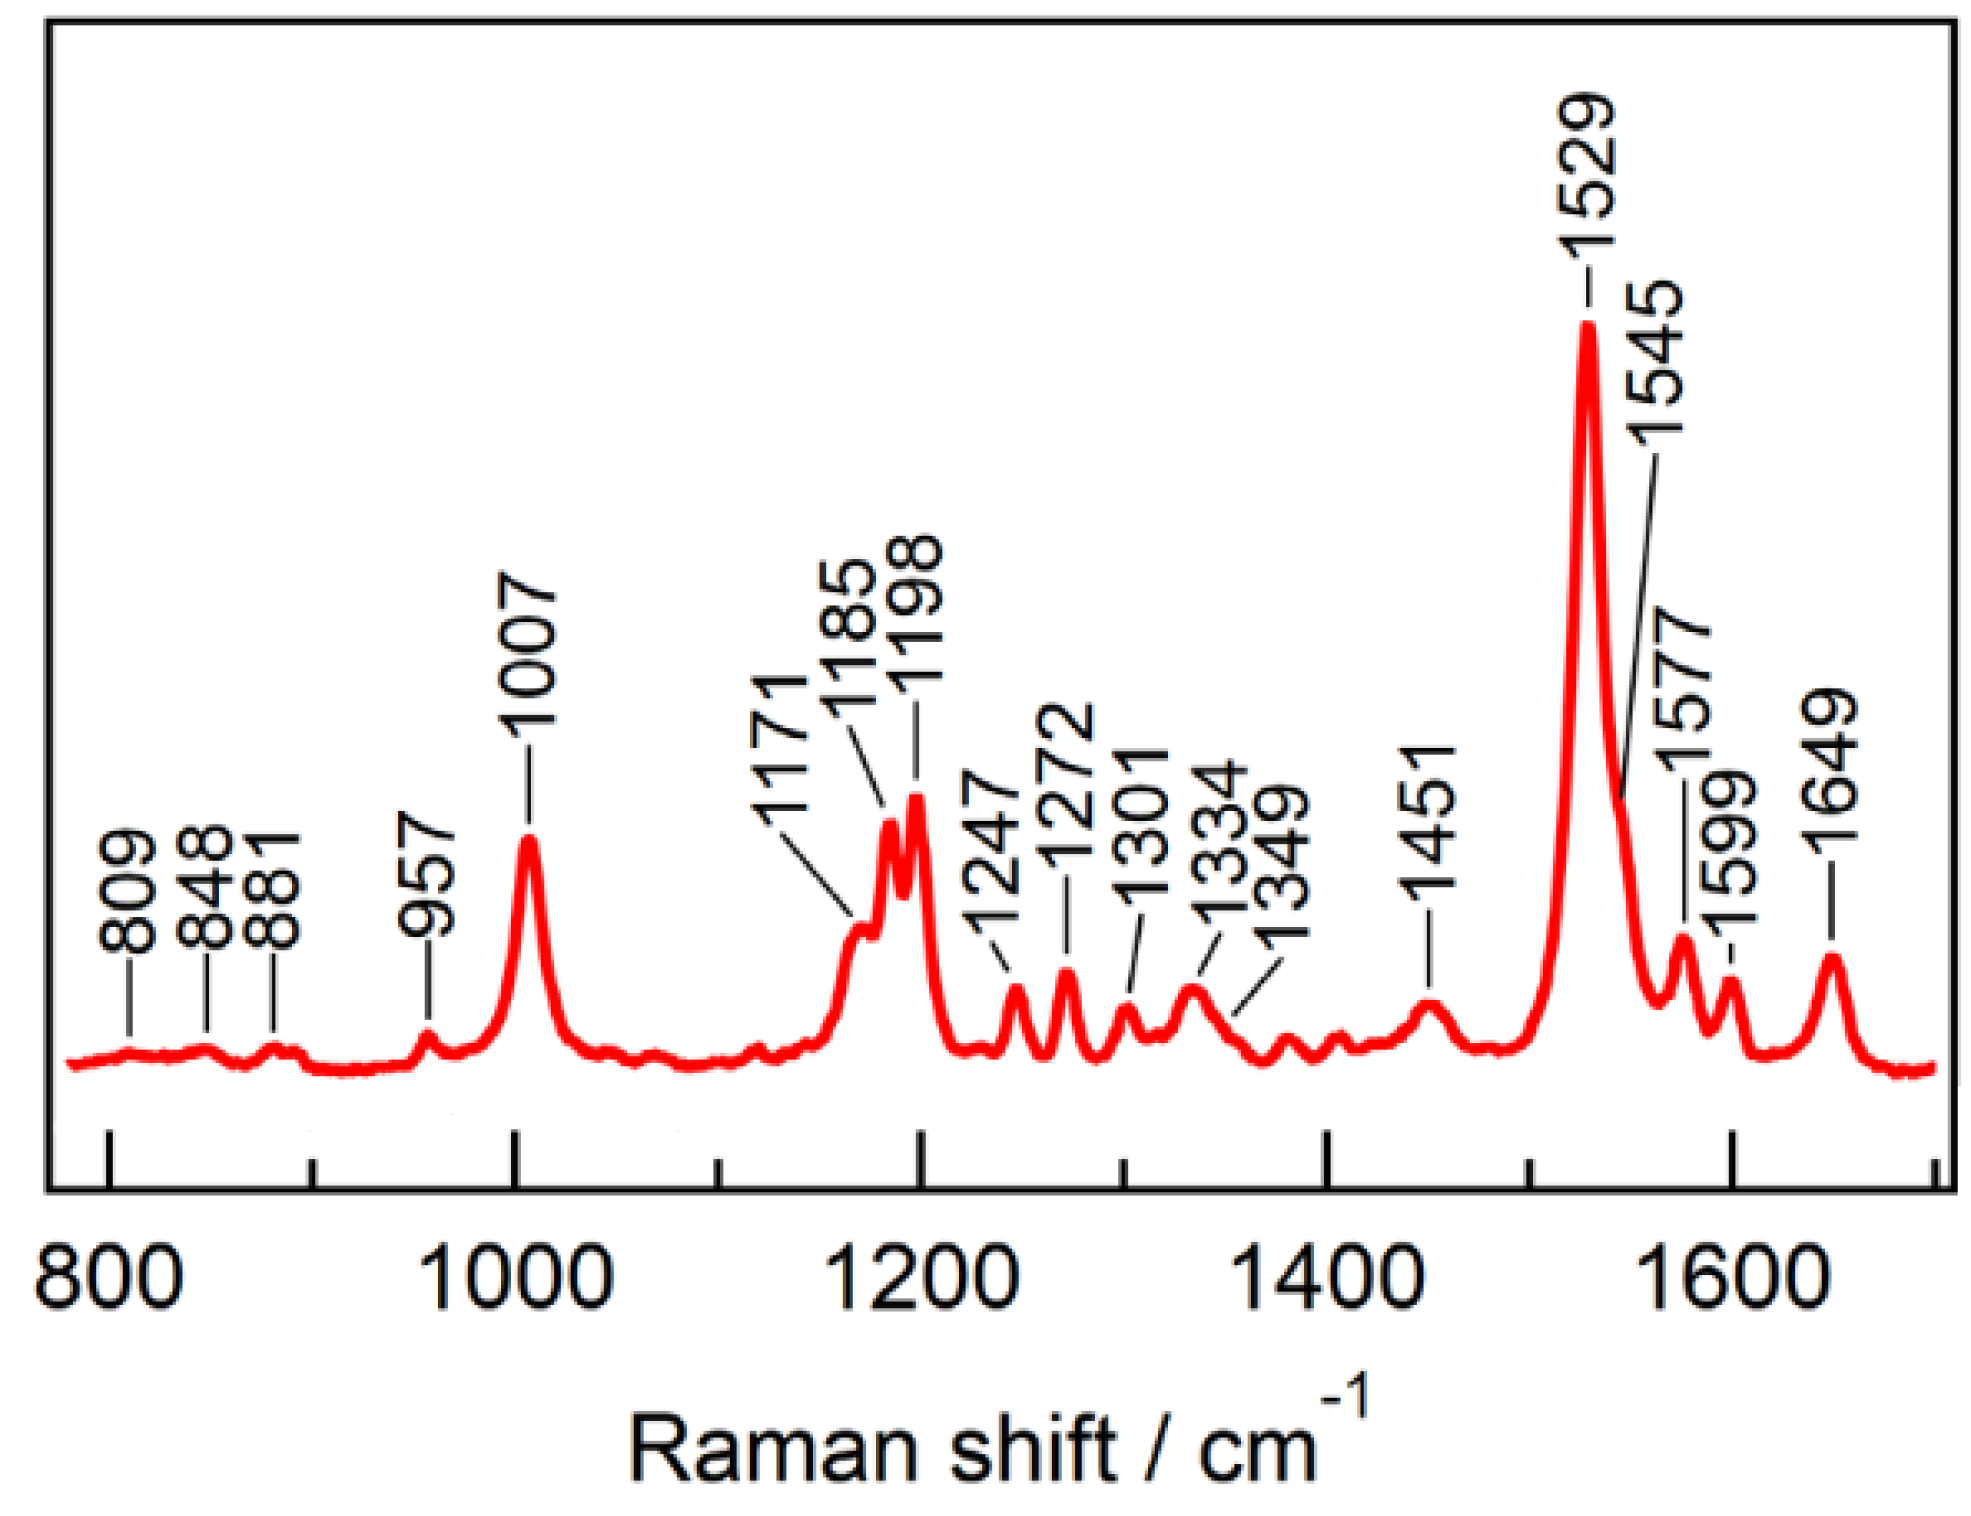
Figure 1. Comparison of the different Raman scattering methods. (A) Energy level diagrams of spontaneous Stokes and anti-Stokes Raman Scattering (on the left), Stimulated Raman Scattering (in the middle) and Coherent Anti-Stokes Raman scattering (on the right). For Stimulated Raman Scattering (SRS) and Coherent Anti-Stokes Raman Scattering (CARS), the case of νPνS = Δν is shown (i.e., νAS = 2νPνS), that corresponds to the coherence condition, where hΔν is an energy difference between the ground state and the first vibrational energy level for selected molecular bond. (B) On the left—the spectra of non-scattered (red) and scattered pump laser beam (green) in case of Spontaneous Stokes (νS) and Anti-Stokes (νAS) Raman Scattering. On the right—the spectra of both pump beam (νP), Stokes beam in the case of SRS and anti-Stokes beam in the case of CARS before (red) and after (green) interaction with the sample containing molecules with selected molecular bond.
Crystals 10 00038 g001
Figure 2. (A) Resonance Raman spectra of the blood samples taken from the mouse tail artery under various pO2 resulting in different oxygenation of hemoglobin (sO2); (B) resonance Raman spectra of isolated purified oxyhemoglobin (red spectrum) and deoxyhemoglobin (blue spectrum). Inset figure shows structural formula of b-type heme. Reprinted from [81] with permission of Wiley.
Crystals 10 00038 g002
Figure 3. (a) Raman spectrum of the perfused rat heart under rest conditions with normoxia. (b) Raman spectra of rat hearts under perfusion (blue spectra), under 120 min. of global heart ischemia (red spectra) and under 120 min. of global hypoxia with the ischemic preconditioning (black spectra). Reprinted from [93] with permission by Creative Commons License.
Crystals 10 00038 g003
Figure 4. Comparison of second harmonic generation (SHG) and polarized coherent anti-Stokes Raman scattering (P-CARS) (A) detection of hexagonal bacteriorhodopsin crystal with twinning and contouring disordered part. (B) lysozyme microcrystals. Panels A and B were redrawn from Figure 2 and Figure S9 [147], respectively with permission from ACS Publications.
Crystals 10 00038 g004
Figure 5. Comparison of surface-enhanced Raman spectroscopy (SERS) spectra of Ag nanoparticles (NPs), DNA, DNA + Ag NPs and DNA + Ag NPs + MgSO4. Intensities of Raman peaks allow quantitative analysis of nucleobase content in DNA molecule with PO2 signal as reference. Reprinted from [172] with permission from Elsevier.
Crystals 10 00038 g005
Figure 6. (a) The scheme of the Raman measurements from various brain regions with the dense tumor, peritumor with infiltrating tumor cells and without cancer cells recorded during brain surgery. (b) Raman spectra of cancer cells, peritumoral region with infiltrated tumor cells and of normal brain region. (c) Microphotographs for each brain tissue type. Reprinted from [197] with permission by Creative Commons License.
Crystals 10 00038 g006
Figure 7. (A). Raman spectra of Raman reporters. (B). in vivo imaging of mouse liver after simultaneous injection of SERS nanotags with five different Raman reporters. Redrawn from Figure 3 [210] with permission from PNAS.
Crystals 10 00038 g007
Figure 8. SERS study of functioning mitochondria. (A,B): SERS spectra of mitochondria suspension placed on Ag nanostructured surface under conditions ensuring electron transport in ETC and ATP synthesis (black spectra) and after FCCP or oligomycin applications (red and blue spectra, respectively). (C): ratios of chosen peak intensities under control conditions, depolarization of the inner mitochondrial membrane and proton gradient dissipation (FCCP) and inhibition of ATP synthesis (oligomycin). Reprinted from [268] with permission by Creative Commons License.
Crystals 10 00038 g008
Figure 9. (A) Cluster maps of rod-shaped (range and brown colors) and round-shaped (yellow) cardiomyocytes. Each color corresponds to the individual cluster consisting of pixels that were defined to have similar Raman spectra. (B) Averaged Raman spectra for each cluster. Spectrum color and number correspond to the color and number of its cluster in panel A. For clearer representation spectra are vertically shifted. Peaks with the maximum positions at 750 and 1125 cm−1 correspond to heme vibrations in c-and b-type cytochromes of mitochondria; peaks at 1585 and 1640 cm−1 correspond to heme vibrations in oxymyoglobin in cardiomyocyte cytoplasm. Reprinted from [90] with permission by Creative Commons License.
Crystals 10 00038 g009
Figure 10. (A) Microphotograph of the cortex region in the reflected light with two arterioles and two venules, marked as a1, a2, v1, v2, respectively. (B) Raman image of the chosen region and (C) Raman map obtained on the basis of (B) and showing level of blood saturation with O2 calculated from Raman spectra in each point of the recorded Raman image (B). (D) Visualization of regions that were used to calculate average values of blood saturation in arterioles and venules. (EH) Resonance Raman spectra from the points of interest marked by white circles 1–4 in (C) on arterioles and venules. Reprinted from [81] with permission from Wiley.
Crystals 10 00038 g010
Figure 11. Resonance Raman spectroscopy (RRS) applied to determine chromophore structure in rhodopsins. (A) Retinal chromophore photoisomerization in microbial rhodopsins. It should be noted that animal (Type-2) rhodopsins typically utilize 11-cis/all-trans retinal configurations in the ground state. (B) Typical RRS spectra of a microbial rhodopsin. Adapted from [301] with permission from ACS Publications.
Crystals 10 00038 g011
Figure 12. RR spectra of selected microbial rhodopsins. (a) BR (light-adapted state) in the purple membrane of Halobacterium salinarum, 532 nm excitation. (b) HR from Natronomonas pharaonis, 532 nm excitation. (c) GR, 441.6 nm excitation. (d) NaR from I. alkaliphilus, 441.6 nm excitation. (e) SRII from N. pharaonis, 441.6 nm excitation. Reprinted from [312] with permission from ACS Publications.
Crystals 10 00038 g012
Figure 13. RR spectra of HeR 48C12 obtained using a 532 nm probe laser for 60 min accumulation. The emission background and the spectral component of the buffer were subtracted in the spectra. Reprinted from [317] with permission from ACS Publications.
Crystals 10 00038 g013
Table 1. RS relevant techniques applied to the most studied classes of photoactive proteins.
Retinal
Crystals 10 00038 i001
FAD
Crystals 10 00038 i002
Bilin
Crystals 10 00038 i003
Vertebrate RhodopsinsChannel RhodopsinsSensory RhodopsinsProteo-RhodopsinsBRHeRsNaRBLUFPhytochrome
fs SRS
ps TR-CARS
RRS
Confocal near-IR RRS
UVRR
DFWM
Near-IR RRRS
RRS
SERS
CARS
TR-UVRR
Near-IR RRS
RRSRS
Transient RRS
UVRRFourier transform RRS
RRS
Abbreviations not introduced earlier: fs, ps—femto- and picosecond, IR—infrared, DFWM—nonresonant degenerate four- wave mixing, TR—time-resolved, UVRR—ultraviolet resonance Raman spectroscopy.

