Article

Stability and Phase Transitions of Nontoxic γ-Cyclodextrin-K+ Metal-Organic Framework in Various Solvents

by
Kristīne Krūkle-Bērziņa
,
Sergey Belyakov
,
Anatoly Mishnev
and
Kirill Shubin
*
Latvian Institute of Organic Synthesis, Aizkraukles iela 21, LV-1006 Riga, Latvia
*
Author to whom correspondence should be addressed.
Crystals 2020, 10(1), 37; https://doi.org/10.3390/cryst10010037
Submission received: 21 November 2019 / Revised: 8 January 2020 / Accepted: 13 January 2020 / Published: 15 January 2020
(This article belongs to the Section Crystalline Materials)

Abstract

:
Cyclodextrin (CD) has been used to prepare biocompatible and nontoxic metal-organic frameworks (MOFs) suitable for biomedical applications as drug carriers. In this study, γ-CD/K-based MOF (γ-CD-MOF-1-α) was synthesized and its stability in various solvents was explored by single-crystal X-ray diffractometry (SCXRD) and powder X-ray diffractometry (PXRD). As a result of solvent-induced phase transformations, two novel crystalline phases of γ-CD-MOF-1 were discovered. The newly formed ε- and δ-phases crystallize in orthorhombic and tetragonal symmetry, respectively. In ε-phase, toluene was determined as a guest molecule by SCXRD. Interactions between γ-cyclodextrin and solvent molecules in ε-phase were evaluated using Hirshfeld surface analysis. The thermal stability of the new crystal forms of γ-CD-MOF-1 was analyzed by differential scanning calorimetry and thermogravimetric analysis.

Graphical Abstract

1. Introduction

Over the last two decades, metal-organic frameworks (MOFs) have attracted increased attention due to their diverse properties and tunable structure [1,2]. Porous biocompatible MOFs inherit many useful features of the class of crystalline coordination polymers simultaneously providing a key advantage, such as low toxicity, which makes them ideal candidates for biomedical applications [3,4]. In particular, the host–guest chemistry of many MOFs allows using them for drug delivery [5].
To ensure the biocompatibility of MOFs, both components of the framework—metal and bridging polydentate ligand—should be nontoxic [6]. Several potential drug carrier candidates are already known [2,3,7,8,9,10], with one of the promising classes of such MOFs that meet such criteria being based on a combination of cyclodextrin (CD) molecules and an alkali metal. CD is a nontoxic cyclic oligosaccharide consisting of six, seven, eight, or more D-glucopyranose units, traditionally designated as α-, β-, γ-, etc. [6]. In 2010, Stoddart et al. reported the first CD-based MOF (CD-MOF) [11]. This MOF (named γ-CD-MOF-1) consists of γ-CD and potassium cations and can be obtained by crystallization from water by the slow vapor diffusion of MeOH. It is known to exist in two crystalline phases, alpha (α) [11] and beta (β) [12]. In addition, α-phase of γ-CD-MOF-1 crystallizes in cubic symmetry with the I432 space group [11], whereas β-phase crystallizes in trigonal symmetry with R32 the space group [12]. Crystal structures of both phases are represented in Figure 1.
It is well known that, under appropriate conditions, one crystal phase can transform into another. Fujita’s and Suh’s groups reported the first single-crystal to single-crystal (SCSC) transformation phenomenon of coordination polymers [13,14]. Numerous other examples of SCSC transformation have been demonstrated afterward. It was shown that SCSC transformation can occur during the removal of guests [15] or the guest exchange process [16] and can be induced by temperature [16], solvent [17], or ligand exchange [18]. Over the last five years, the chemical stability of MOFs has been receiving more and more attention. Therefore, insights into CD-MOF crystal properties are a prerequisite for the successful preparation of host–guest complexes and their application in drug delivery, as well as for understanding the stability of such complexes in various conditions [19].
Herein, we present two new crystal phases of γ-CD-MOF-1, prepared by solvent-induced transformations. The new crystal forms have been compared to already known α- and β-phases of γ-CD-MOF-1, and structural changes have been discussed. In addition, the thermal stability of the obtained crystalline phases has been evaluated by differential scanning calorimetry (DSC) and thermogravimetric analysis (TGA). In one of the new crystal phases, toluene was confirmed to be the guest molecule.

2. Materials and Methods

Designation of the crystalline forms used in this paper:
  • γ-CD-MOF-1-α [11] – α-phase;
  • γ-CD-MOF-1-β [12] – β-phase;
  • γ-CD-MOF-1-δ – δ-phase;
  • γ-CD-MOF-1-ε – ε-phase;
  • γ-CD-MOF-1-ε·tol – ε·tol-phase (crystalline phase, in which toluene molecules are located in γ-CD cavities).

2.1. Materials and Measurements

All solvents and chemicals were obtained from commercial sources and were used without additional purification. Single-crystal X-ray diffraction studies were performed on an XtaLAB Synergy-S Dualflex diffractometer (Rigaku Europe SE, Neu-Isenburg, Germany). DSC and TG analyses were conducted on a TGA/DSC2 (Mettler Toledo, Greifensee, Switzerland) analyzer.
Powder X-ray diffraction (PXRD) patterns were measured at ambient temperature on a D8 Advance (BRUKER Company, Karlsruhe, Germany) diffractometer using copper radiation (CuKα) at the wavelength of 1.54180 Å, equipped with a LynxEye position sensitive detector. The tube voltage and current were set to 40 kV and 40 mA. The divergence slit was set at 0.6 mm and the antiscatter slit was set at 8.0 mm. The diffraction patterns were recorded using a 0.2 s/0.02° scanning speed from 3° to 35° on a 2θ scale.
1H NMR spectra were recorded on Bruker Avance 400 (400 MHz) (BRUKER Nordic AB, Solna, Sweden) spectrometer in CD2Cl2, Toluene-d8, THF-d8, CDCl3, and cyclohexane-d12 with chemical shift values (δ) in parts per million using the residual solvent signal as an internal standard.

2.2. Synthesis of α-Phase

α-Phase was prepared according to a previously reported procedure [11]. γ-CD (1.30 g) and KOH (0.45 g) were mixed and dissolved in distilled water (20 mL). The flask containing this solution was placed into a sealable container filled with MeOH and crystals were obtained by vapor diffusion method. Colorless cubic crystals, suitable for SCXRD and PXRD analyses, were isolated (see crystallographic data and structure refinement details in Table 1, PXRD patterns in Supplementary Materials Figures S1 and S2, and TGA/DSC analysis data in Figure 9). PXRD data for this material shows a lower crystallinity with broader and lower intensity peaks. It can be a result of a loss of long-range crystallinity due to grinding, which was used during the PXRD sample preparation.

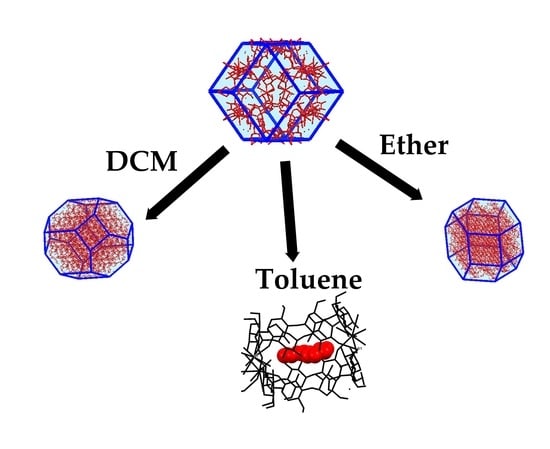
2.3. Synthesis of New Phases

To obtain ε and ε·tol phases first α-phase was prepared according to the synthesis description, given in Section 2.2. After obtaining the α-phase, it was immersed in dichloromethane (DCM) or toluene until it was confirmed by X-ray analyses methods that phase transformation took place. Colorless crystals, suitable for SCXRD and PXRD, analyses were isolated (see crystallographic data and structure refinement details in Table 1, PXRD patterns in Supplementary Materials Figures S3 and S4, and TGA/DSC analysis data in Figure 9). Unit cell composition based on SCXRD analysis can be represented by the formula: [(C48H80O40)4·(KOH)6·(H2O)34]·(CH2Cl2)n, where DCM molecules are completely disordered and their exact number is not known. Elemental analysis was inconclusive as a result of weight fluctuations due to the solvent constantly degassing from MOF pores. In order to obtain a stable sample, prior to elemental analysis a powder of ε-phase was ground and dried at room temperature and atmospheric pressure in a desiccator over P2O5 for 16 h. Elemental analysis (%) calculated for [(C48H80O40)2·(KOH)3·(H2O)14]n·(CH2Cl2)2: C 36.98%, H 6.17%; found: C 37.14%, H 6.01%.

2.4. Evaluation of Stability of α-Phase in Various Solvents

To evaluate the stability of α-phase in various solvents, crystals of α-phase were immersed in DCM, cyclohexane, diethyl ether, toluene, tetrahydrofuran (THF), chloroform, or methyl tert-butyl ether (MTBE) for 2 weeks. For each solvent, two parallel experiments in separate vials were performed. During the stability experiment, the respective solvent was exchanged every day [20]. Every 3 days, the crystal structure of γ-CD-MOF-1 was analyzed by single-crystal X-ray diffraction (SCXRD).

2.5. Crystal Structure Determination

For every measurement, we randomly selected new single crystals from each vial after every three days. Diffraction data were collected on an XtaLAB Synergy-S Dualflex diffractometer (Rigaku Oxford Diffraction) equipped with a HyPix6000 detector and microfocus sealed X-ray tube with CuKα radiation (λ = 1.54184 Å). During data collection, crystals were kept at a temperature of 150/170 K. Structures were solved by direct methods with ShelXT program using intrinsic phasing [21] and refined by full-matrix least-squares techniques on F2 with SHELXL [22] package. For two of the analyzed structures, diffraction peaks of disordered solvent were taken into account by SQUEEZE procedure of PLATON [23]. PLATON was also used to calculate the packing index. Crystallographic data and structure refinement details for α-, β-, δ-, ε-, and ε·tol phases are presented in Table 1. Full data set is available in form of CIF files, deposited with the CCDC (1967053, 1967054, 1967055), and may be obtained free of charge via https://www.ccdc.cam.ac.uk/structures. The full crystal data and structure refinement details for ε-, ε·tol-, and δ-phases are available in Supplementary Materials Table S1.

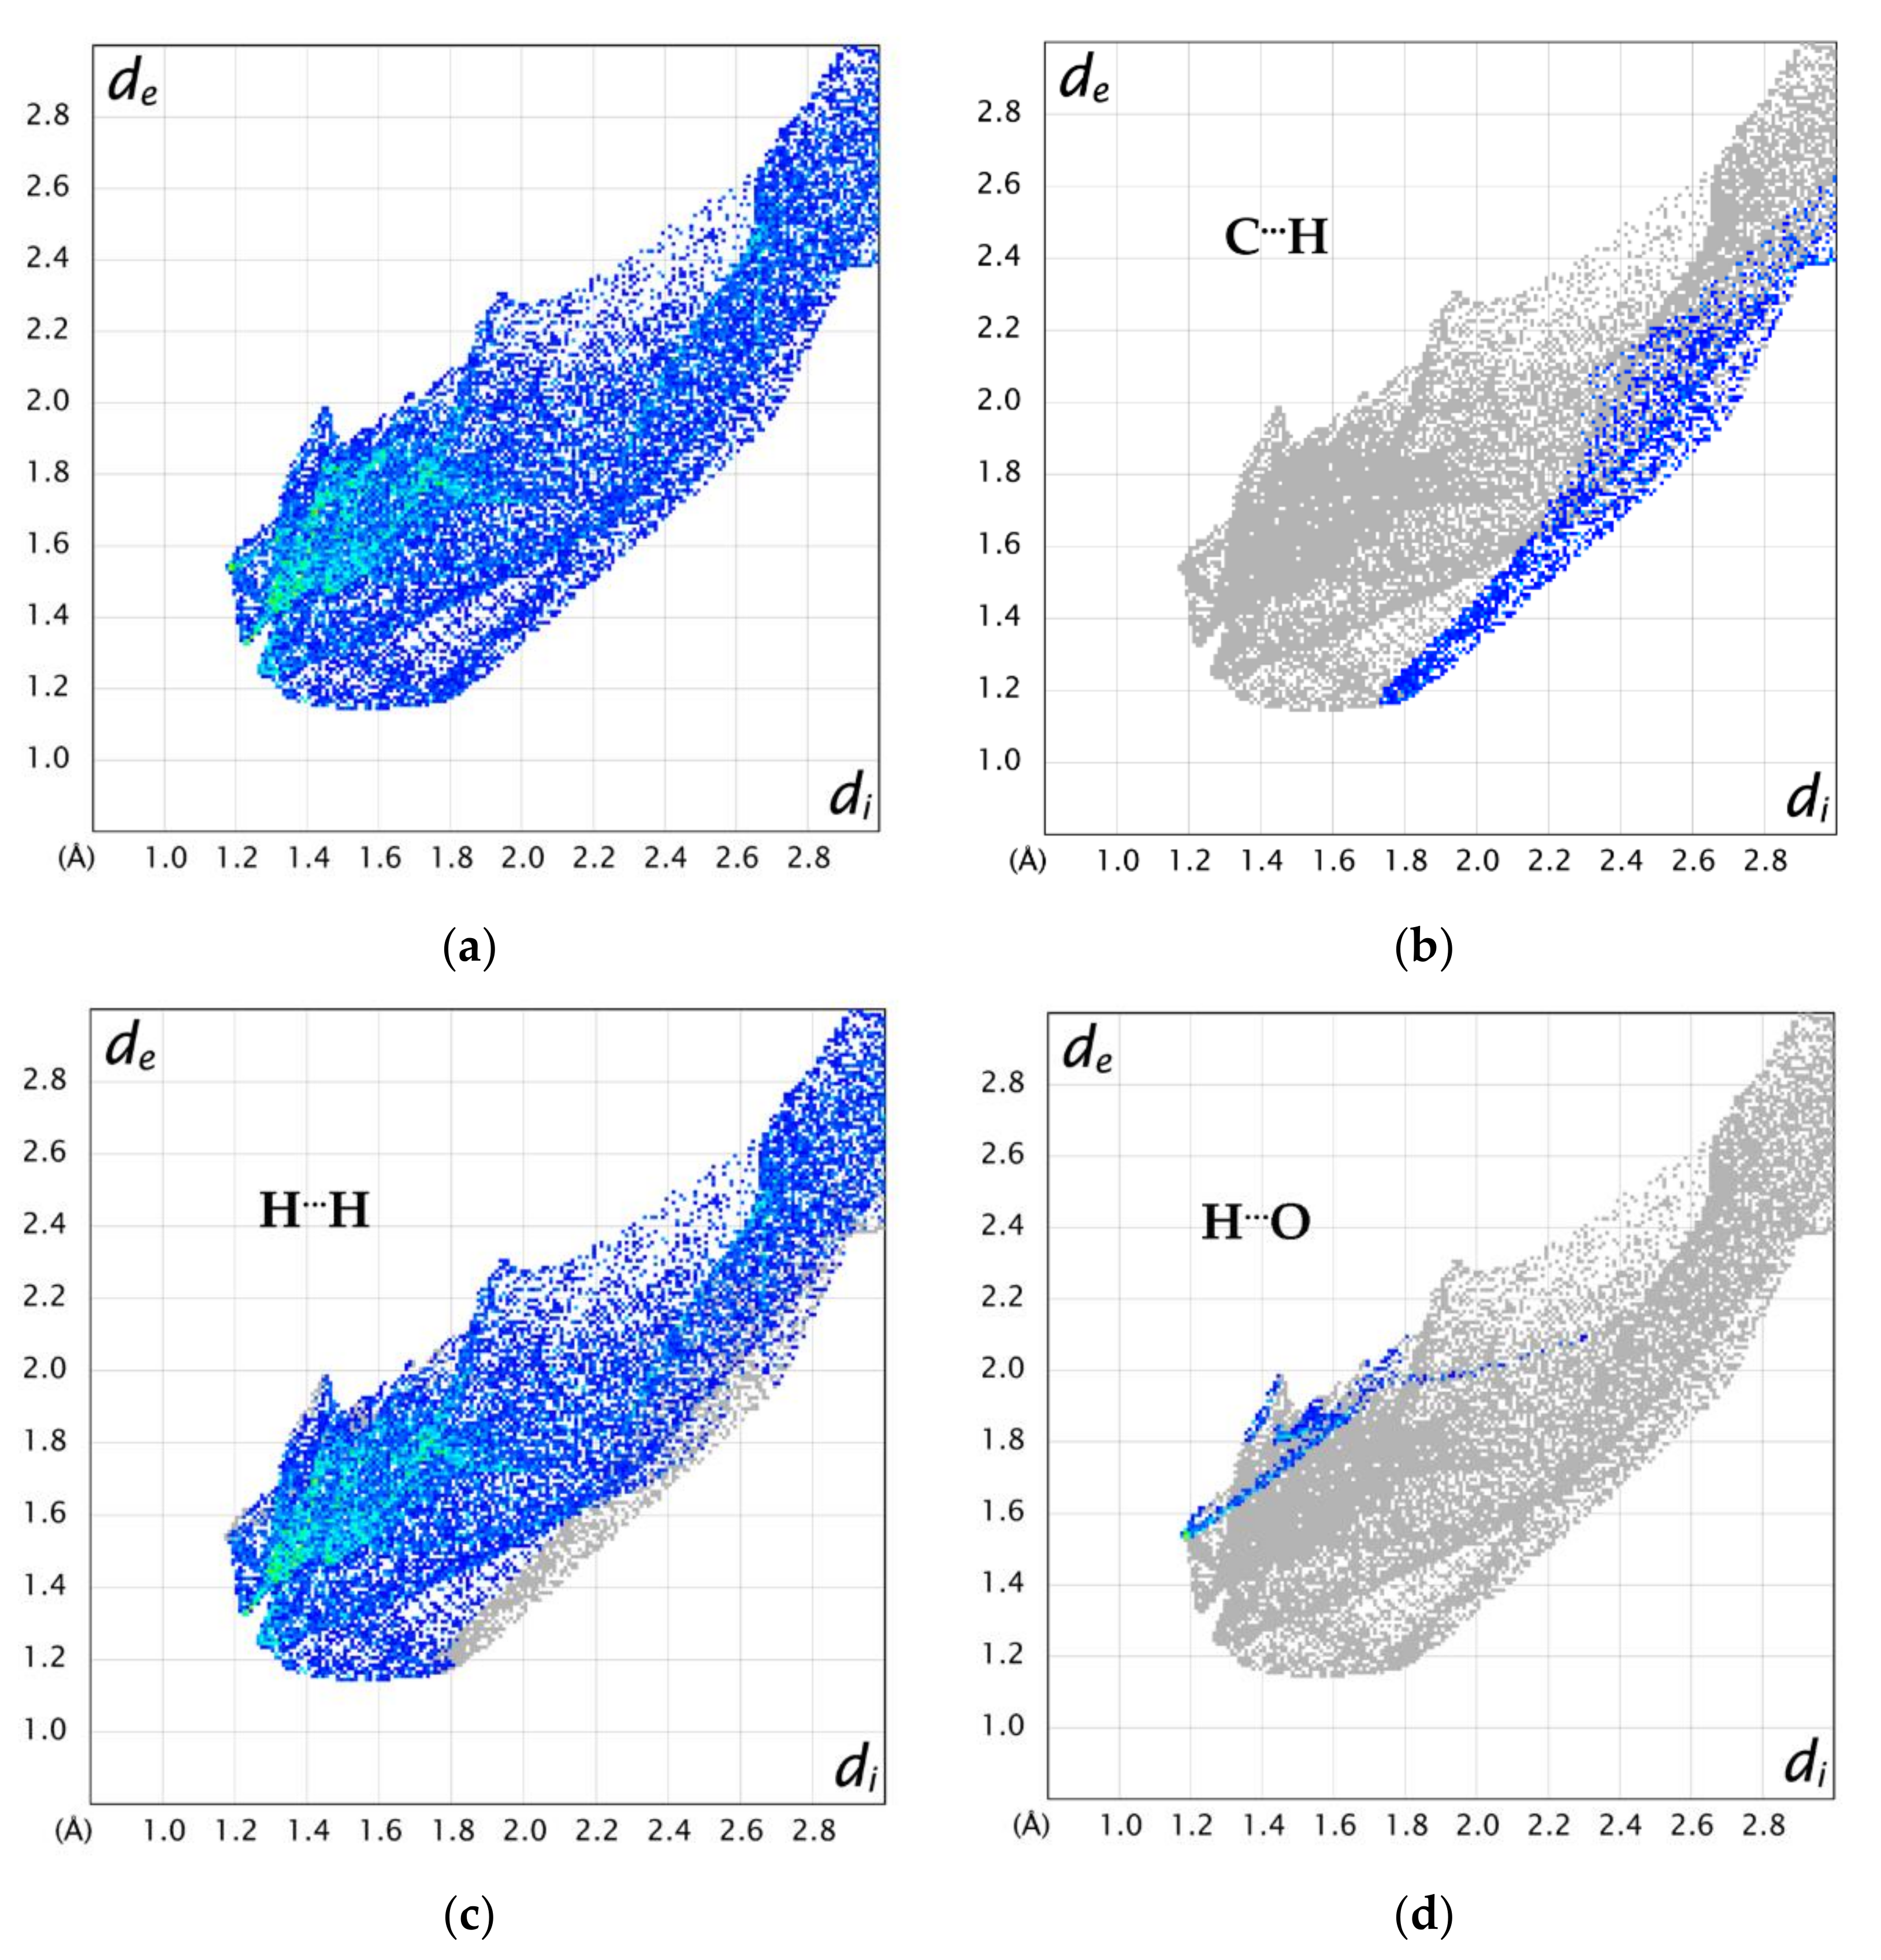
2.6. Hirshfeld Surface Analysis

Hirshfeld surface analysis was performed using CrystalExplorer 17.5 [24] program. Hirshfeld surfaces were mapped over dnorm and based on de and di values, where de is the distance between a point and the nearest nucleus, external to the surface, and di is defined as the distance between a point and the nearest nucleus, internal to the surface [24].

2.7. Thermal Stability Measurements

Differential scanning calorimetry/thermogravimetric (DSC/TG) analyses were performed on a TGA/DSC2 apparatus (Mettler Toledo) using open 100 µL aluminum pans. Samples with a mass of 3–10 mg were heated under nitrogen atmosphere (flow rate 100 ± 10 mL·min−1) at a temperature range of 25–450 °C (heating rate 10°·min−1).

3. Results

The solubility of γ-CD-MOF-1 in selected solvents was assessed by 1H NMR spectra (Supplementary Materials Figures S10–S14) [14]. Crystalline powder of this material is practically insoluble in solvents, which we have selected for stability screening. Separately, the solubility of γ-CD in the same solvents was assessed (for experimental conditions see Supplementary Materials, Section 3). A 1H NMR peak pattern was obtained only in the THF/DMSO mixture. Its comparison with other 1H NMR spectra confirms extremely low solubility of γ-CD.
Evaluation of the stability of α-phase in various solvents (the solvents have been listed in Table 2) resulted in the discovery of two new crystalline phases: ε- and δ-phase. In ε- and ε·tol, crystallinity was retained, which is characteristic for a solvent-induced bulk single-crystal to single-crystal (bSCSC) transformations. In a typical procedure for characterization of such transformations, only one single crystal is used for SCXRD measurement of changes before and after the phase transition. In our experiments, solvent-induced transformations also take place in a solid phase without the dissolution of components, which is typical for SCSC processes in general. However, we employed a different methodology, where randomly selected crystals were analyzed every three days (Table 2). A set of auxilliary methods is utilized for the control of phase homogeneity, solubility, etc. In order to distinguish between these two types of experiments, we use the term “bulk single-crystal to single-crystal transformation” in the discussion for ε and ε·tol phases.
Phase transitions from α-phase to another crystal phase were observed in almost all selected solvents. In the case of MTBE, α-phase was stable and phase transition was not observed. The results of these experiments are summarized in Table 2, while full crystallographic data (including cell parameters), obtained in each SCXRD measurement, are presented in Supplementary Materials Tables S2–S8.
The most rapid bSCSC transformation from α-phase to new crystalline ε-phase occurred in DCM. In one of the vials, ε-phase appeared after three days, and after six days in the second vial (see Table 2). It is worth mentioning that DCM was used for the activation of γ-CD-MOF-1 samples to remove interstitial solvents. However, no changes in crystalline phase were reported [11]. The same new crystalline phase with identical cell parameters was also obtained in toluene after nine days. Before the appearance of ε-phase, the formation of the intermediate phase was observed (see Supplementary Materials Table S4). Unfortunately, cell parameters of this phase could not be associated with the cell parameters of already known phases or both new phases (see Table 1). The PXRD bulk sample analysis showed that the samples contain mainly ε-phase and a small amount of the α-phase (Figures S3 and S4) after six days in DCM and toluene. The obtained results indicate that bSCSC transformation is taking place from α-phase to ε-phase.
In diethyl ether, β-phase was obtained in six days (see Supplementary Materials Table S8) and further exposure to diethyl ether resulted in the appearance of a new crystalline form: δ-phase. The bulk sample PXRD analysis showed that the sample contains an α- and β-phase mixture and a characteristic peak for δ-phase at 7.42° on a 2θ scale (Supplementary Materials Figures S5 and S6) after six days. The obtained results indicate several phase transitions options: (1) the α-phase transforms to δ-phase; (2) α-phase transforms first to β-phase and after that from β-phase to δ-phase; (3) there can be parallel phase transformations: α-phase transforms to β-phase and to δ-phase simultaneously. It should be noted that, in two parallel stability screening experiments using diethyl ether as a solvent, δ-phase was obtained only once and any repeated attempts to acquire δ-phase were unsuccessful.
In THF and chloroform, similar results were obtained. After six days (Table 2), one vial of each solvent contained β-phase. After nine days, β-phase was detected in all vials. Finally, after two weeks, the reappearance of α-phase in the samples was observed (in each experiment, several crystals were analyzed). Only one vial still solely contained β-phase. It should be noted that several crystals were present in each vial and every time a new crystal was used for the measurements. Therefore, it is possible that a complete phase transition from α- to β-phase requires a longer time. The bulk sample PXRD analysis showed that it contains an α- and β-phase mixture (Supplementary Materials Figures S5 and S6) after six days in THF. The obtained results indicate that phase transition takes place in THF from α-phase to β-phase. The obtained powder pattern of the sample in chloroform has a bad quality with a low intensity of peaks over the background, therefore it is very hard to make a conclusion about the phase type in the bulk sample. Some peaks correspond to α- and β-phase mixture, but the pattern is incomplete (Supplementary Materials Figures S7 and S8). Probably, lattice parameters are affected by solvent molecules that are included in MOF pores or the sample preparation (grinding) may lead to the loss of long-range crystallinity, therefore producing displacements in peak positions and their broadening. In cyclohexane, β-phase formed in six days (Table 2), and such a crystalline form remained unchanged throughout the rest of the incubation period. The bulk sample PXRD analyses (Supplementary Materials Figure S9) showed that the sample contained α-phase after six days in cyclohexane, but it is difficult to determine because the sample became more brittle and it also lost its crystallinity after grinding. Due to the similarity of peak positions in α- and β-phases, they are difficult to distinguish in poor quality samples and there is no unequivocal conclusion.
Overall, the symmetry of the new crystalline phases of γ-CD-MOF-1 are lowered from cubic (α-phase) to orthorhombic (ε-phase) or tetragonal (δ-phase) symmetry (see Table 1).

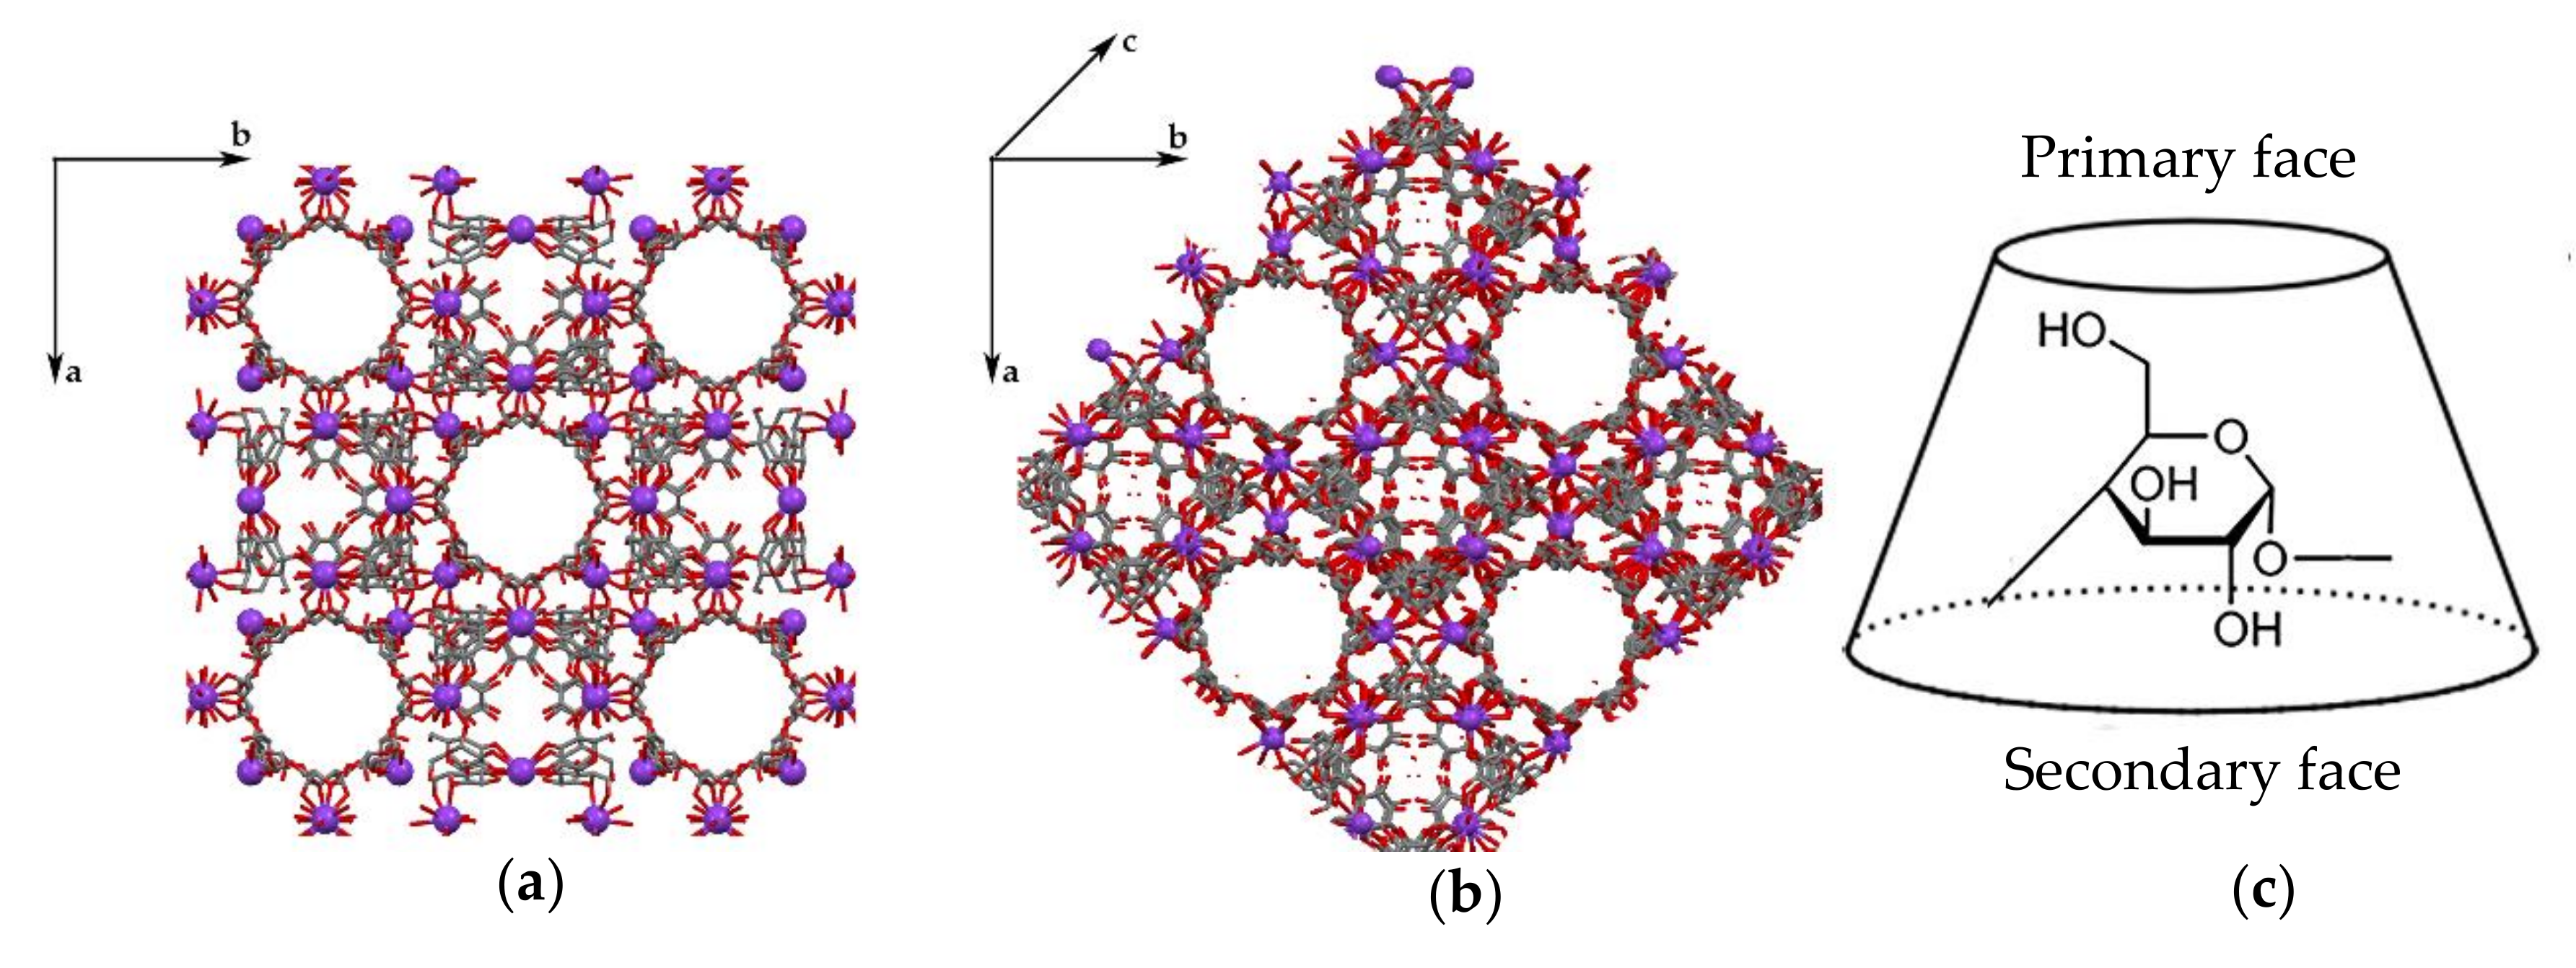
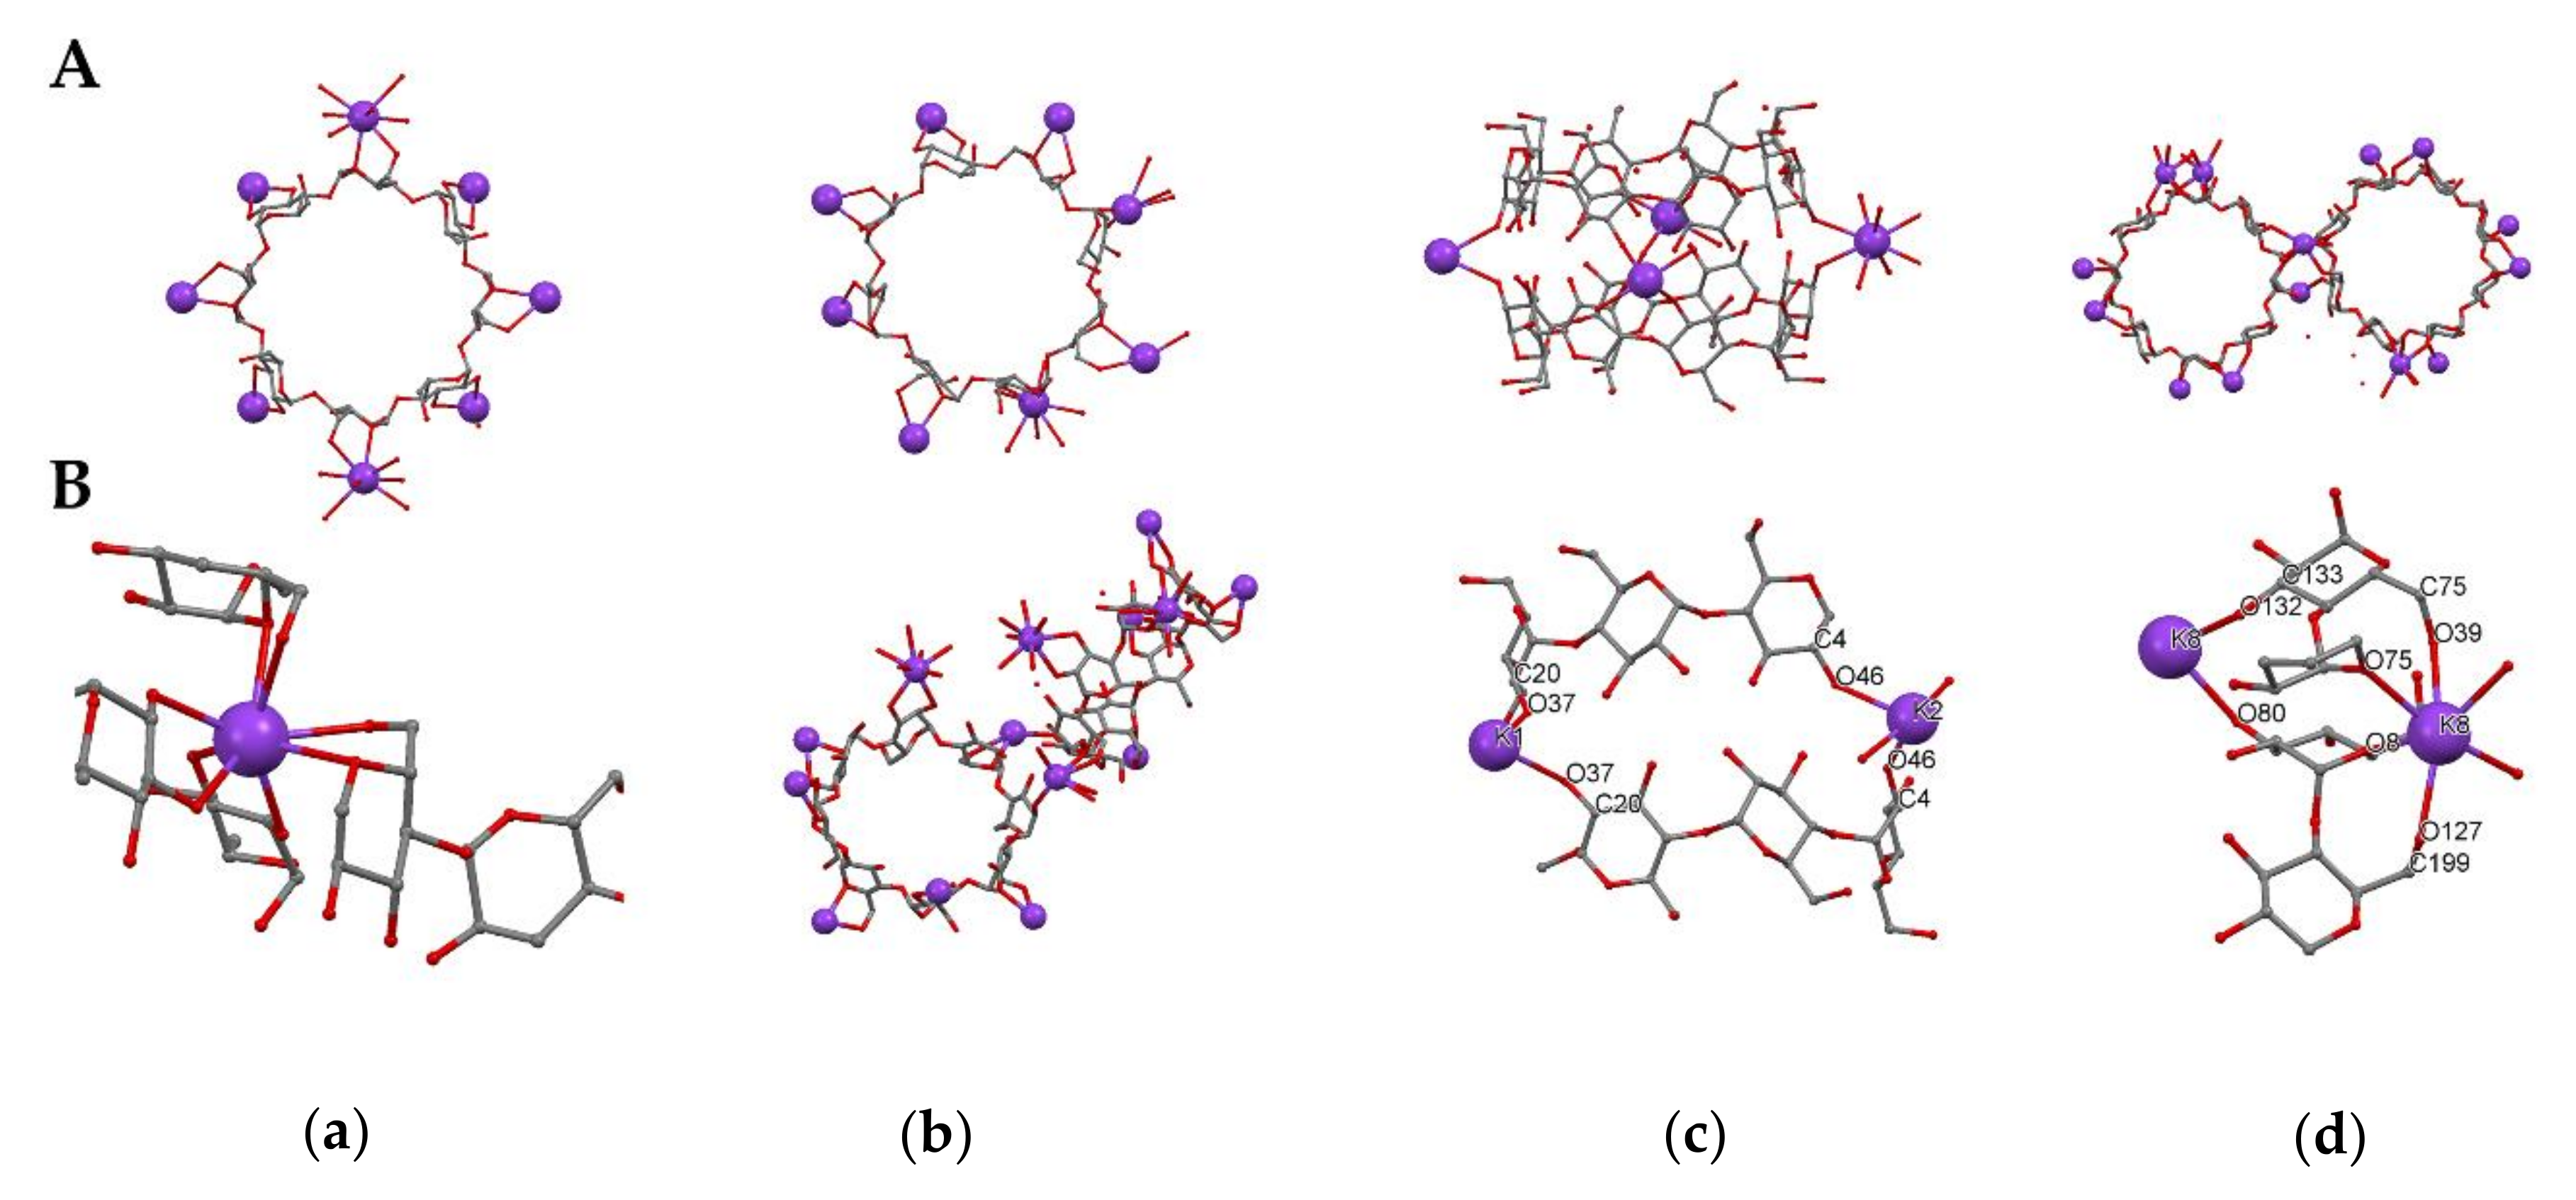
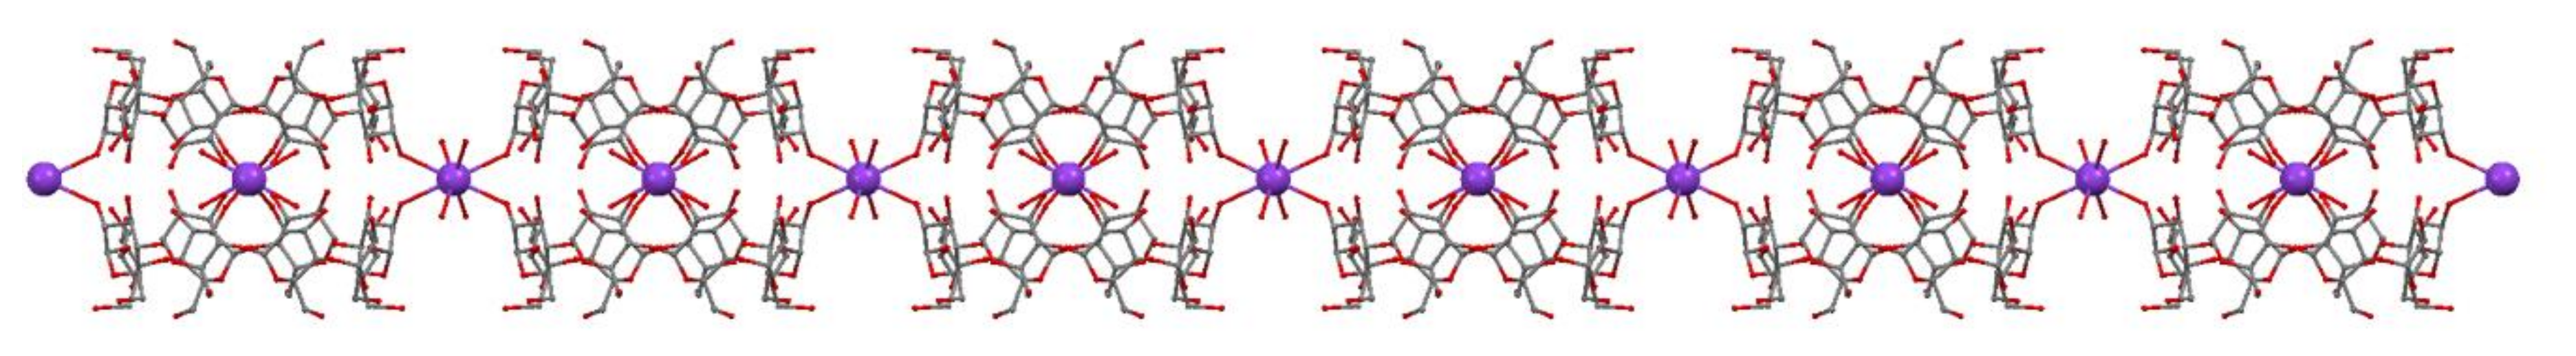
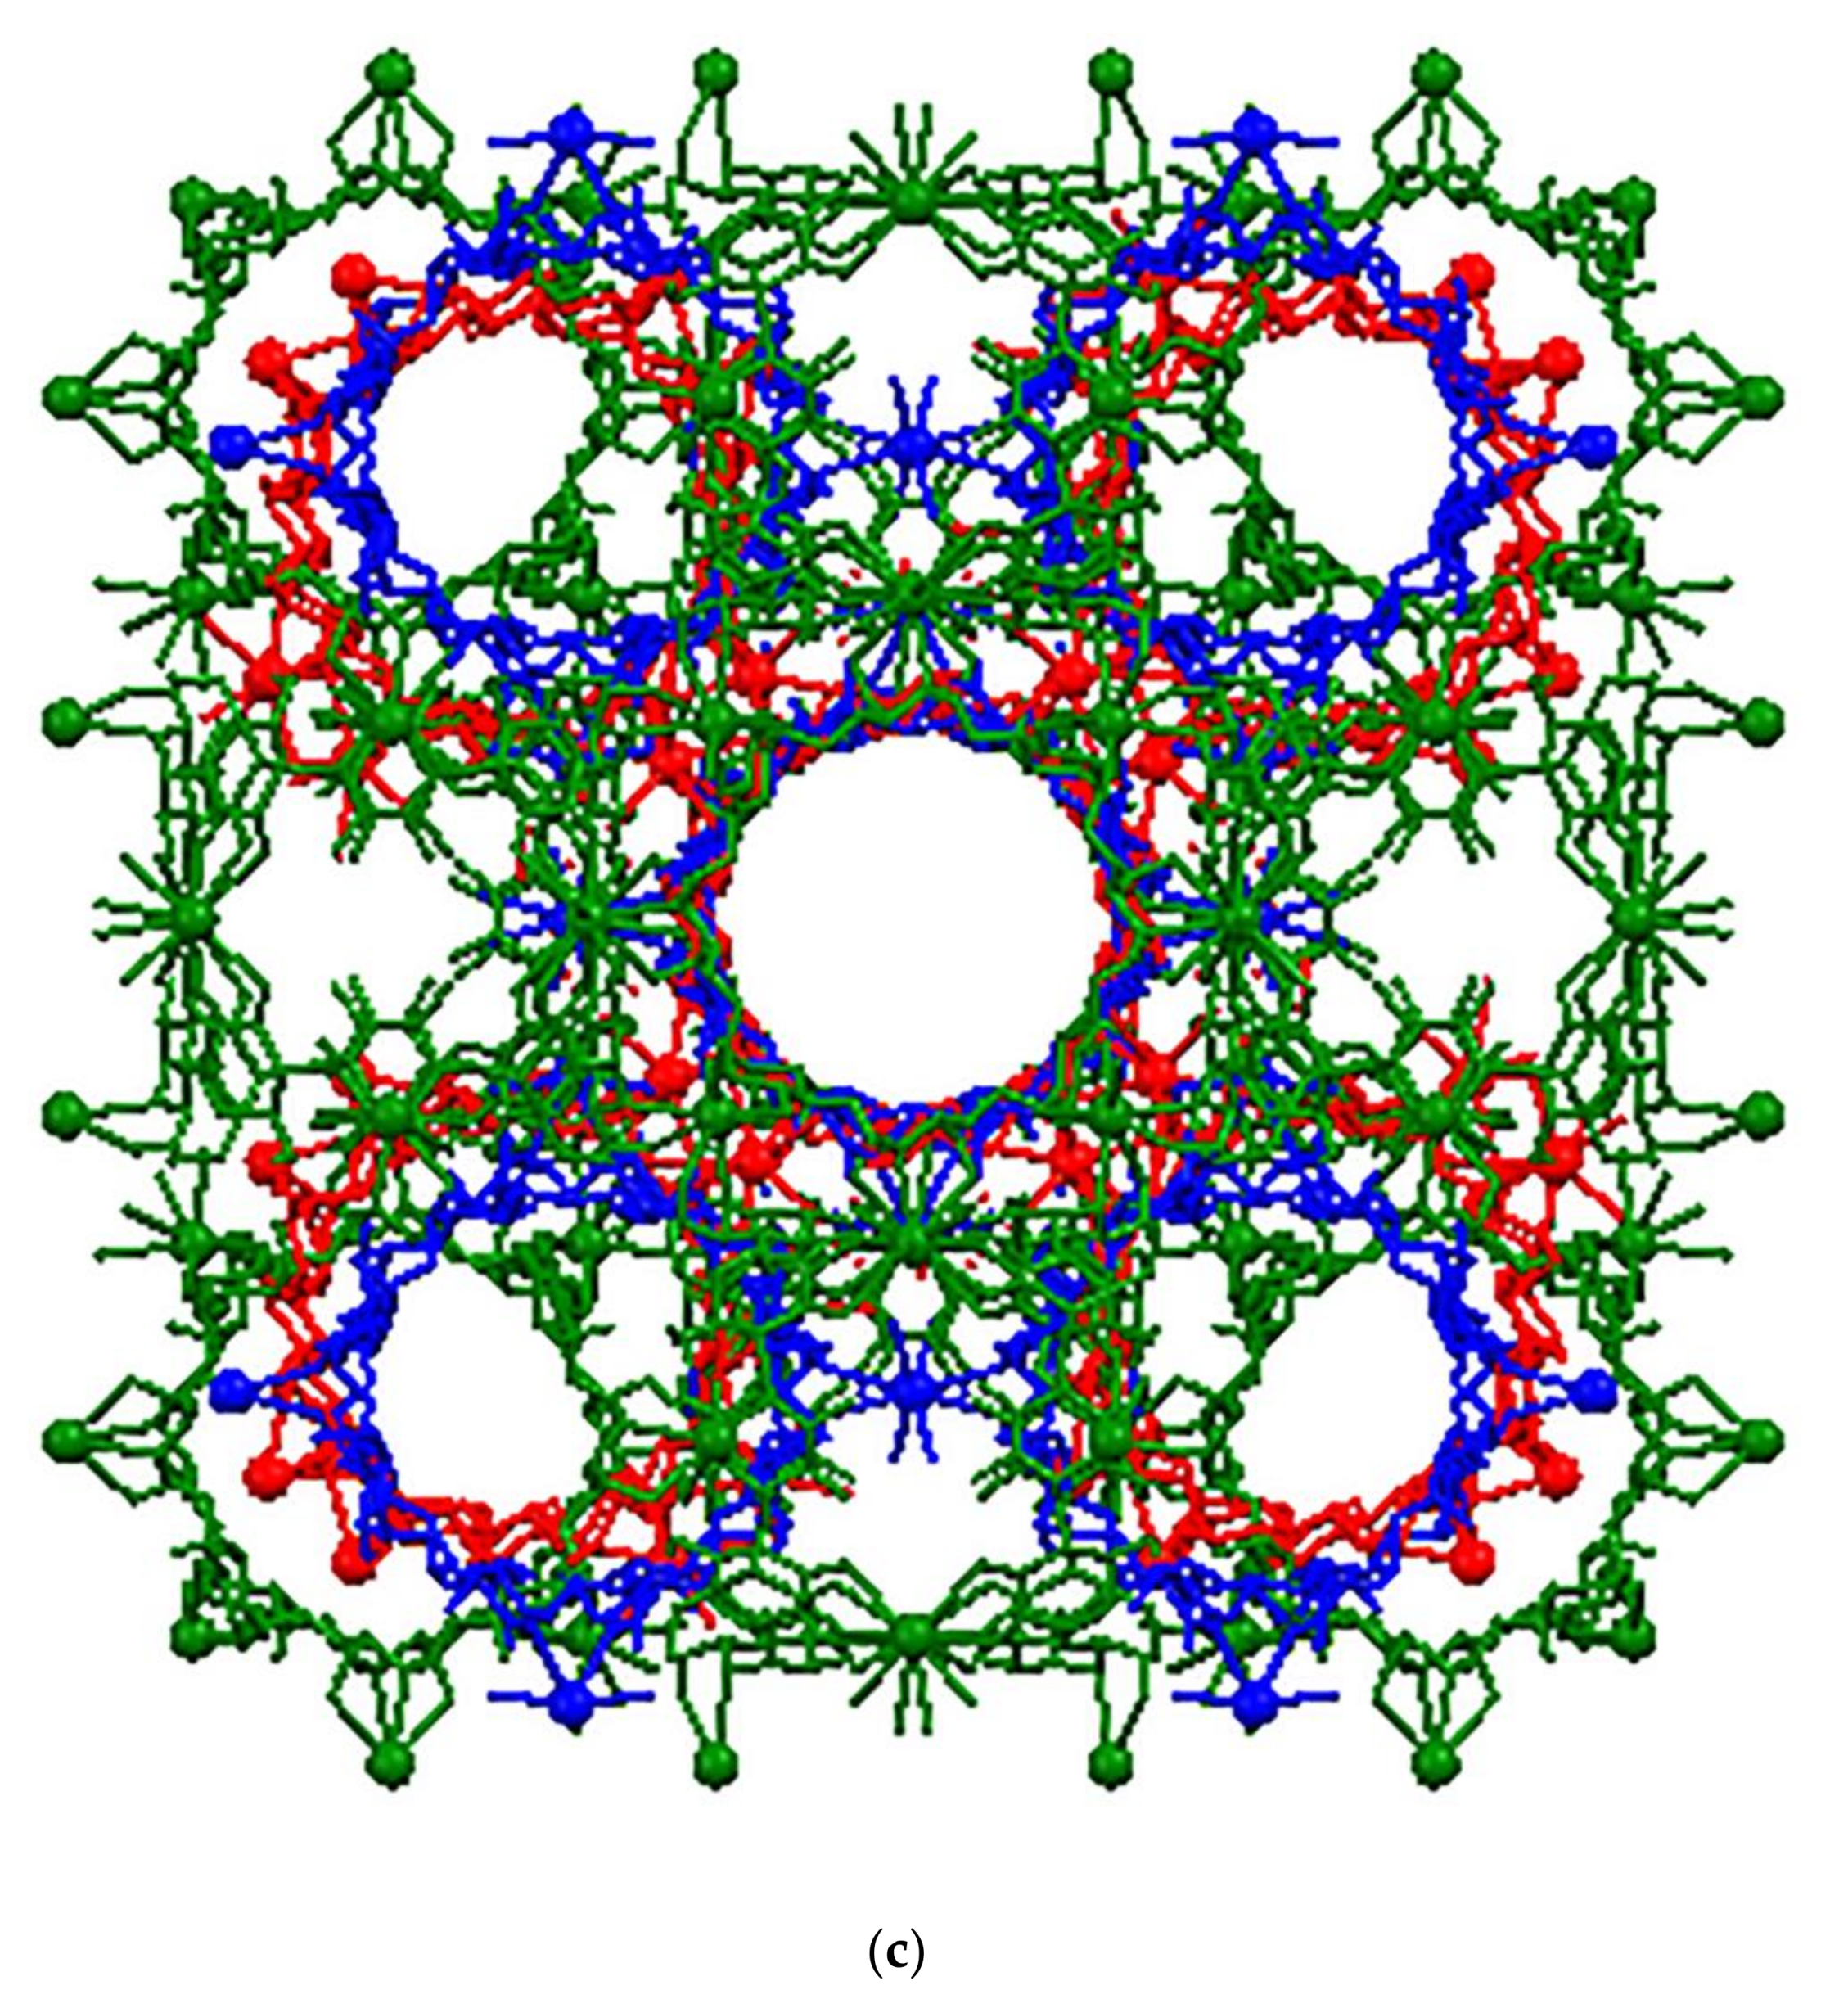
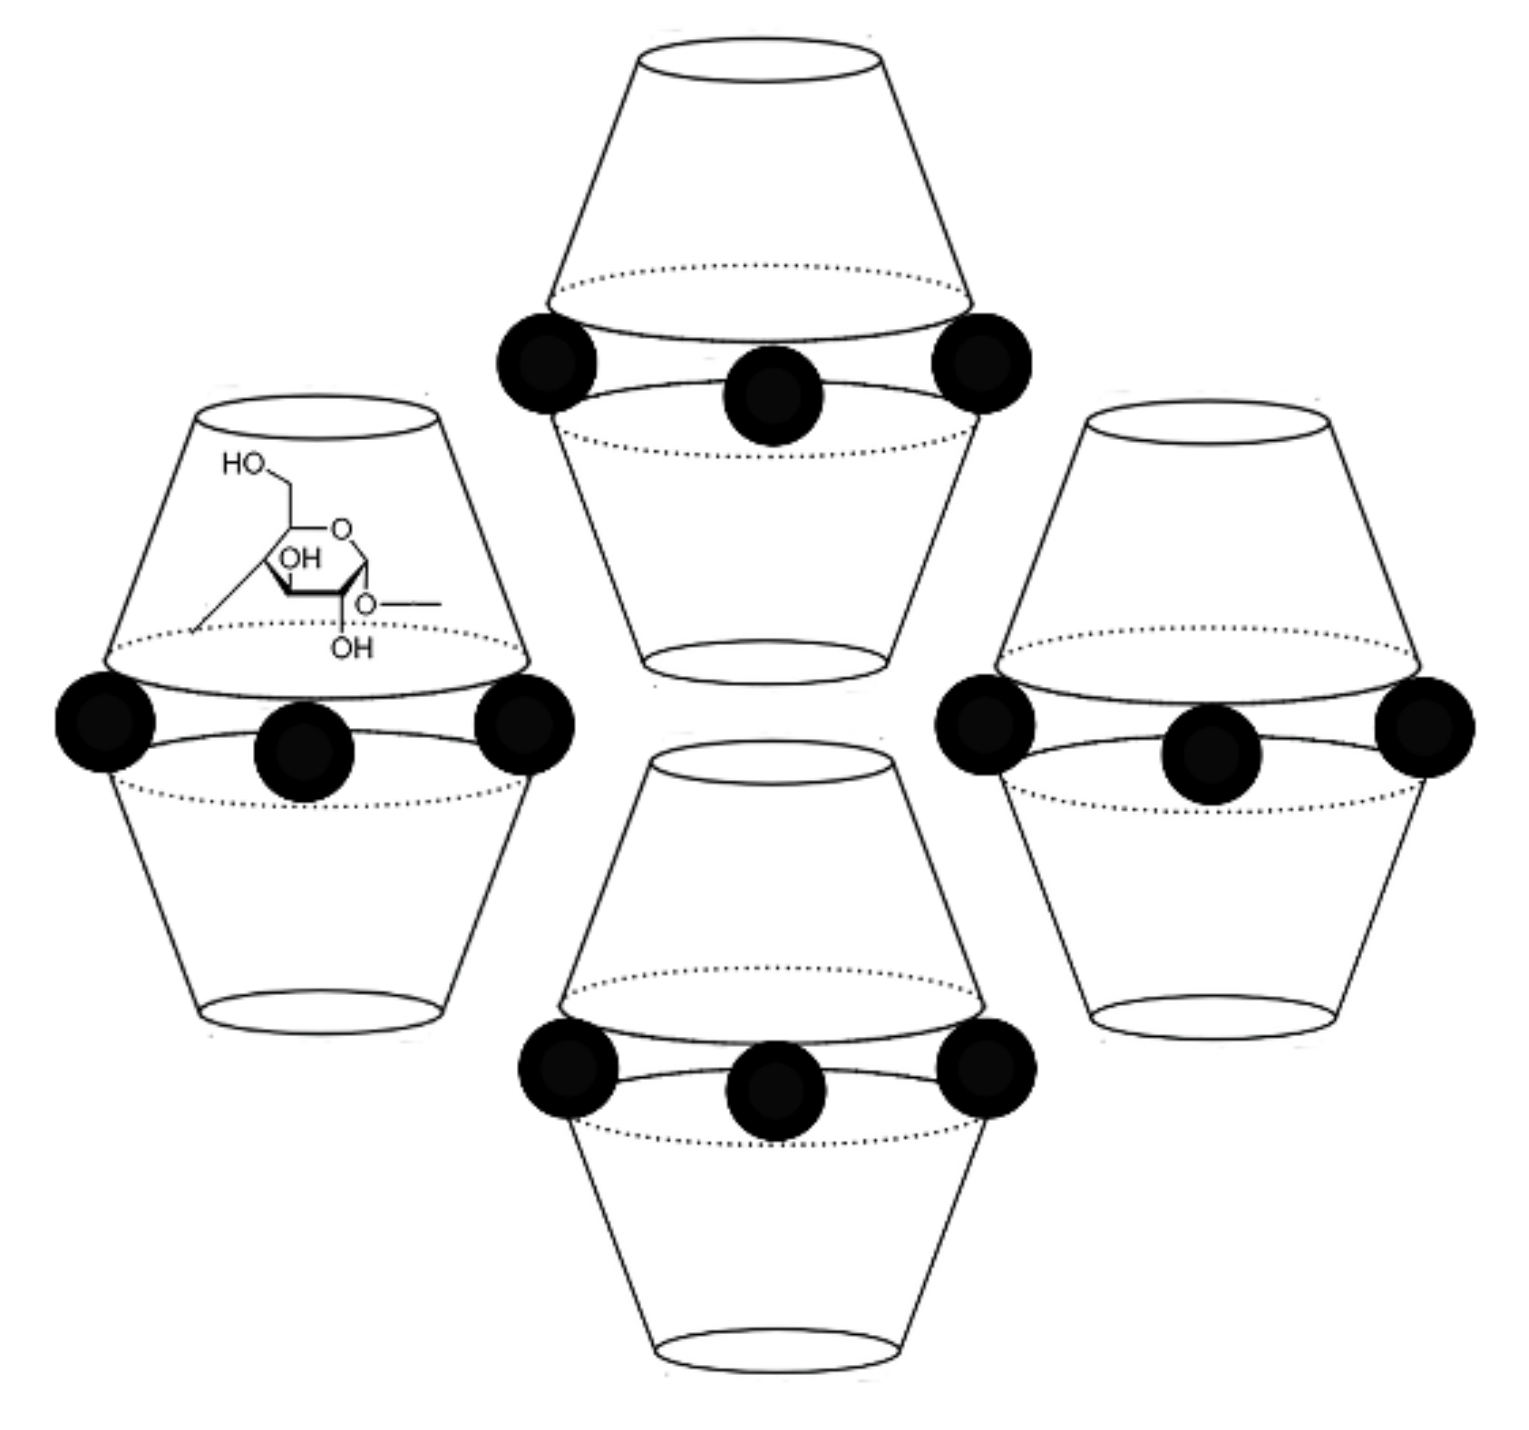
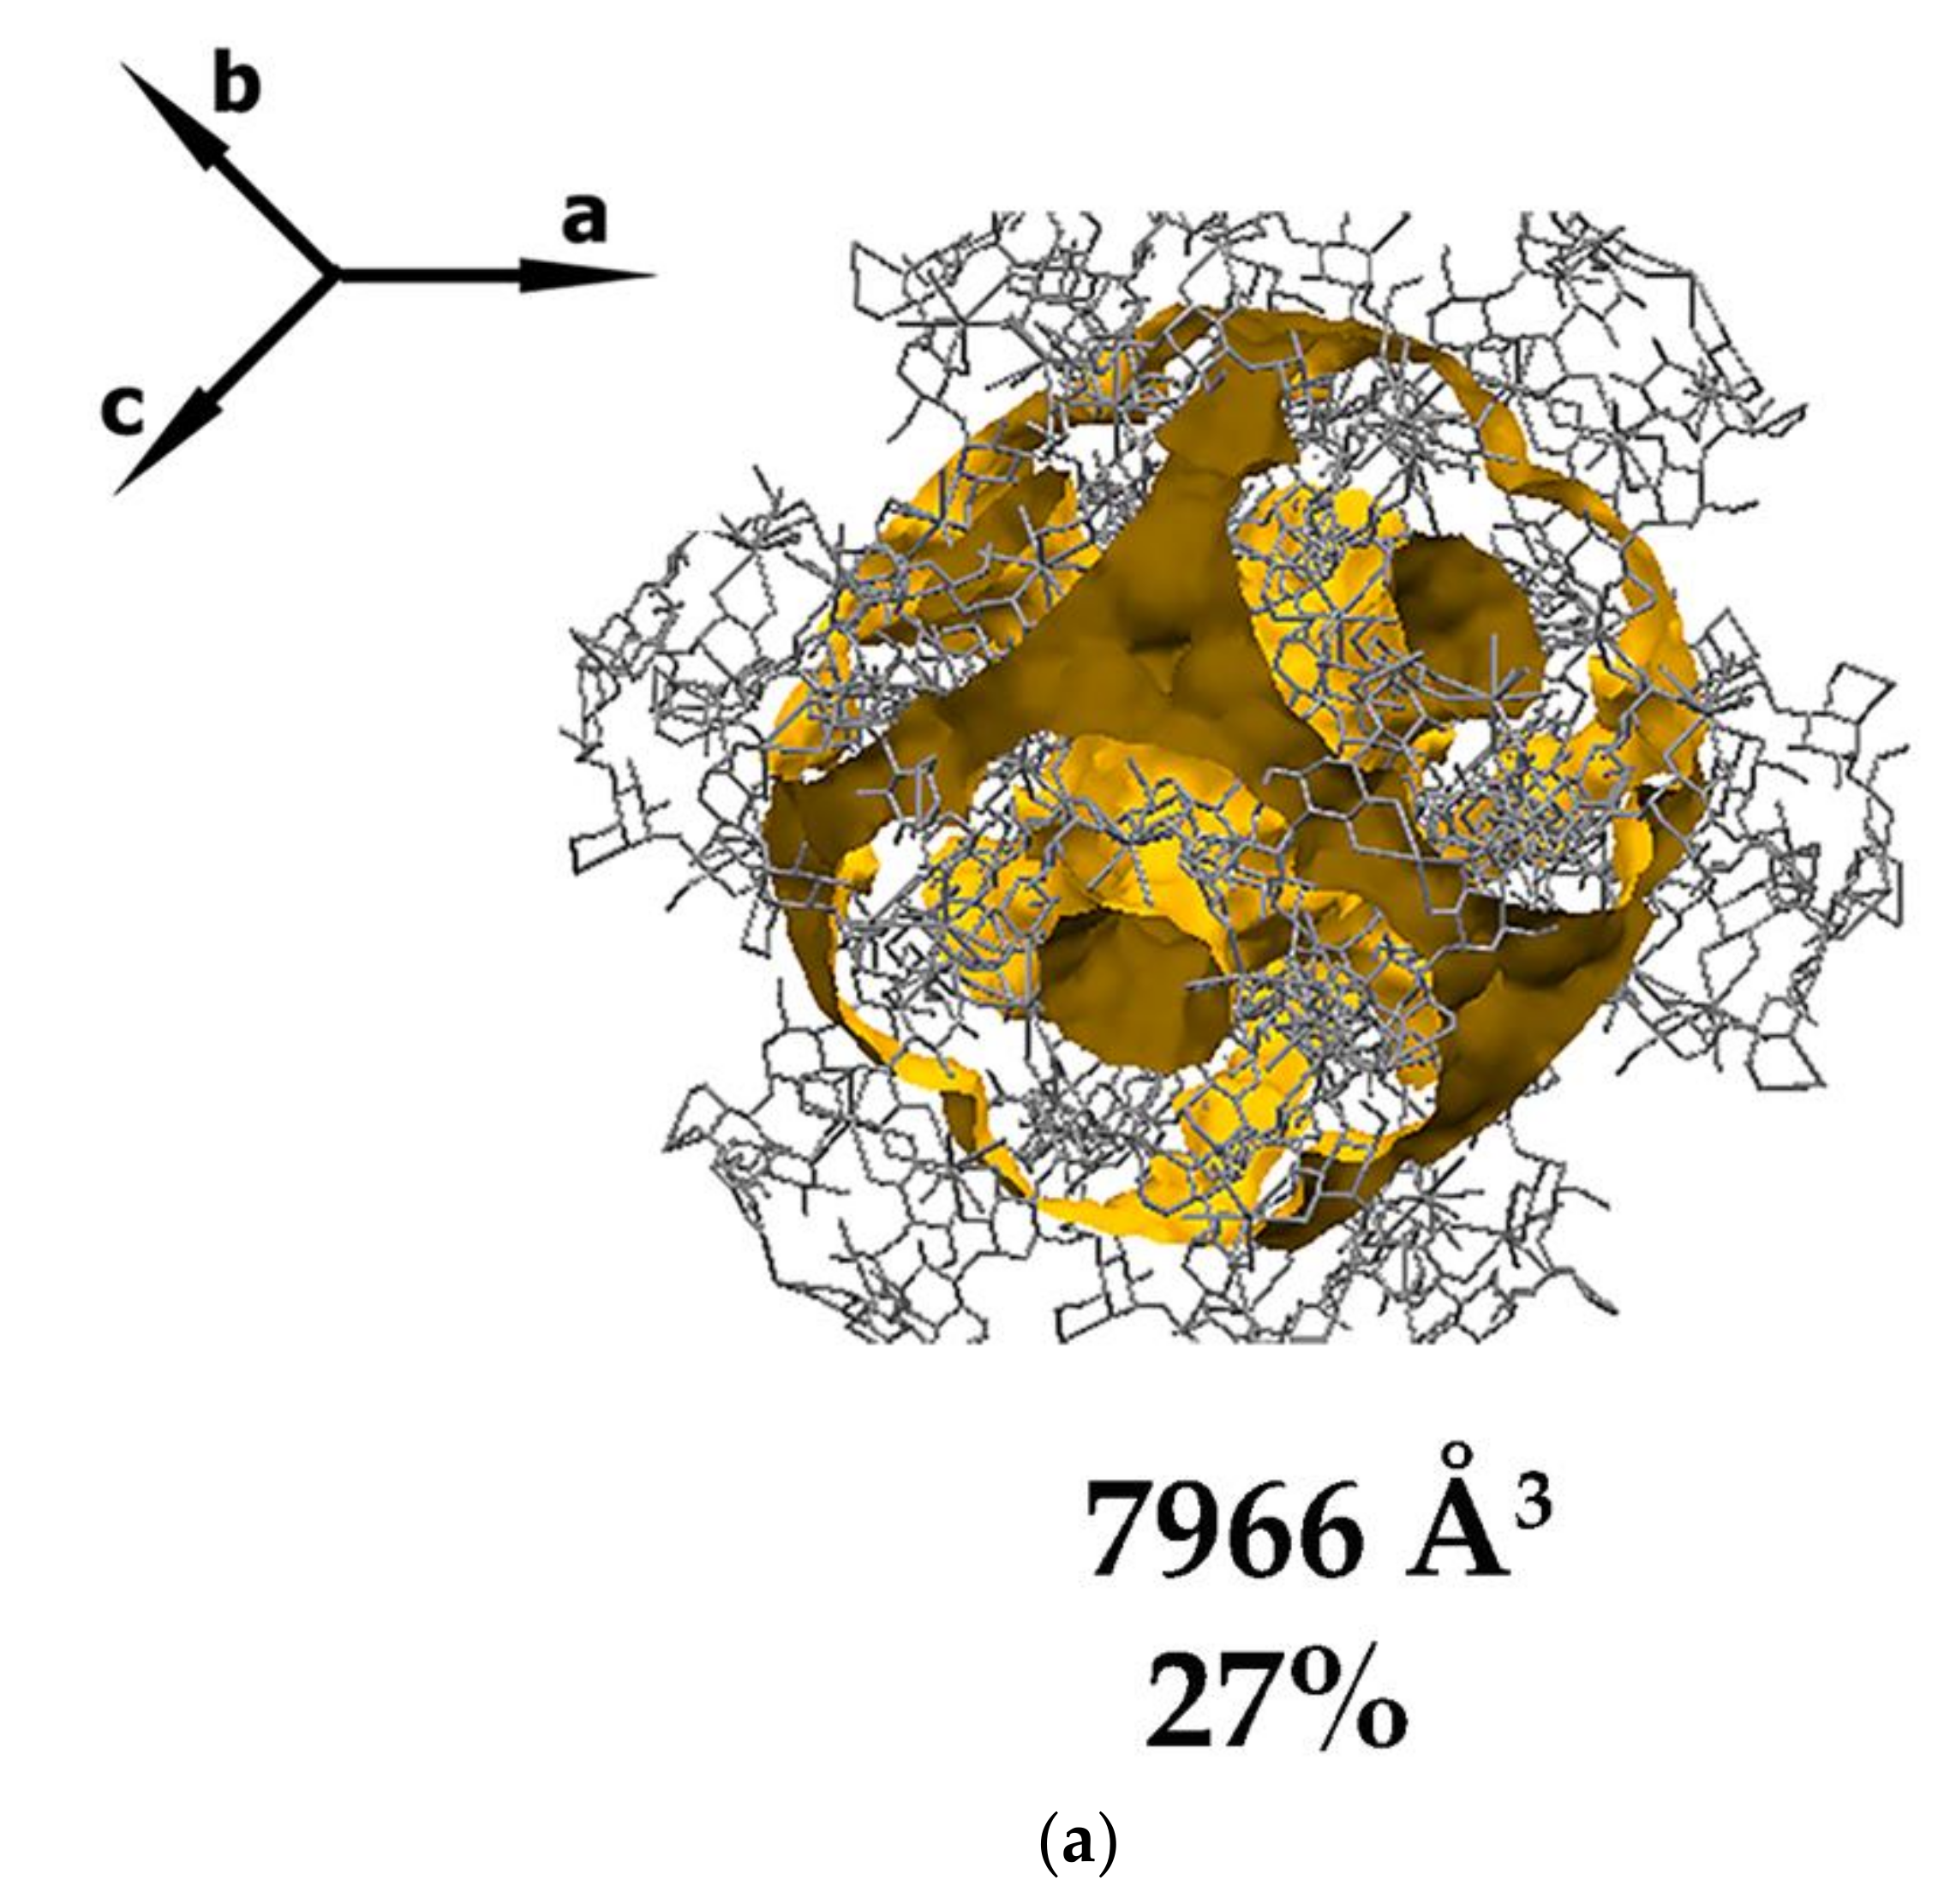
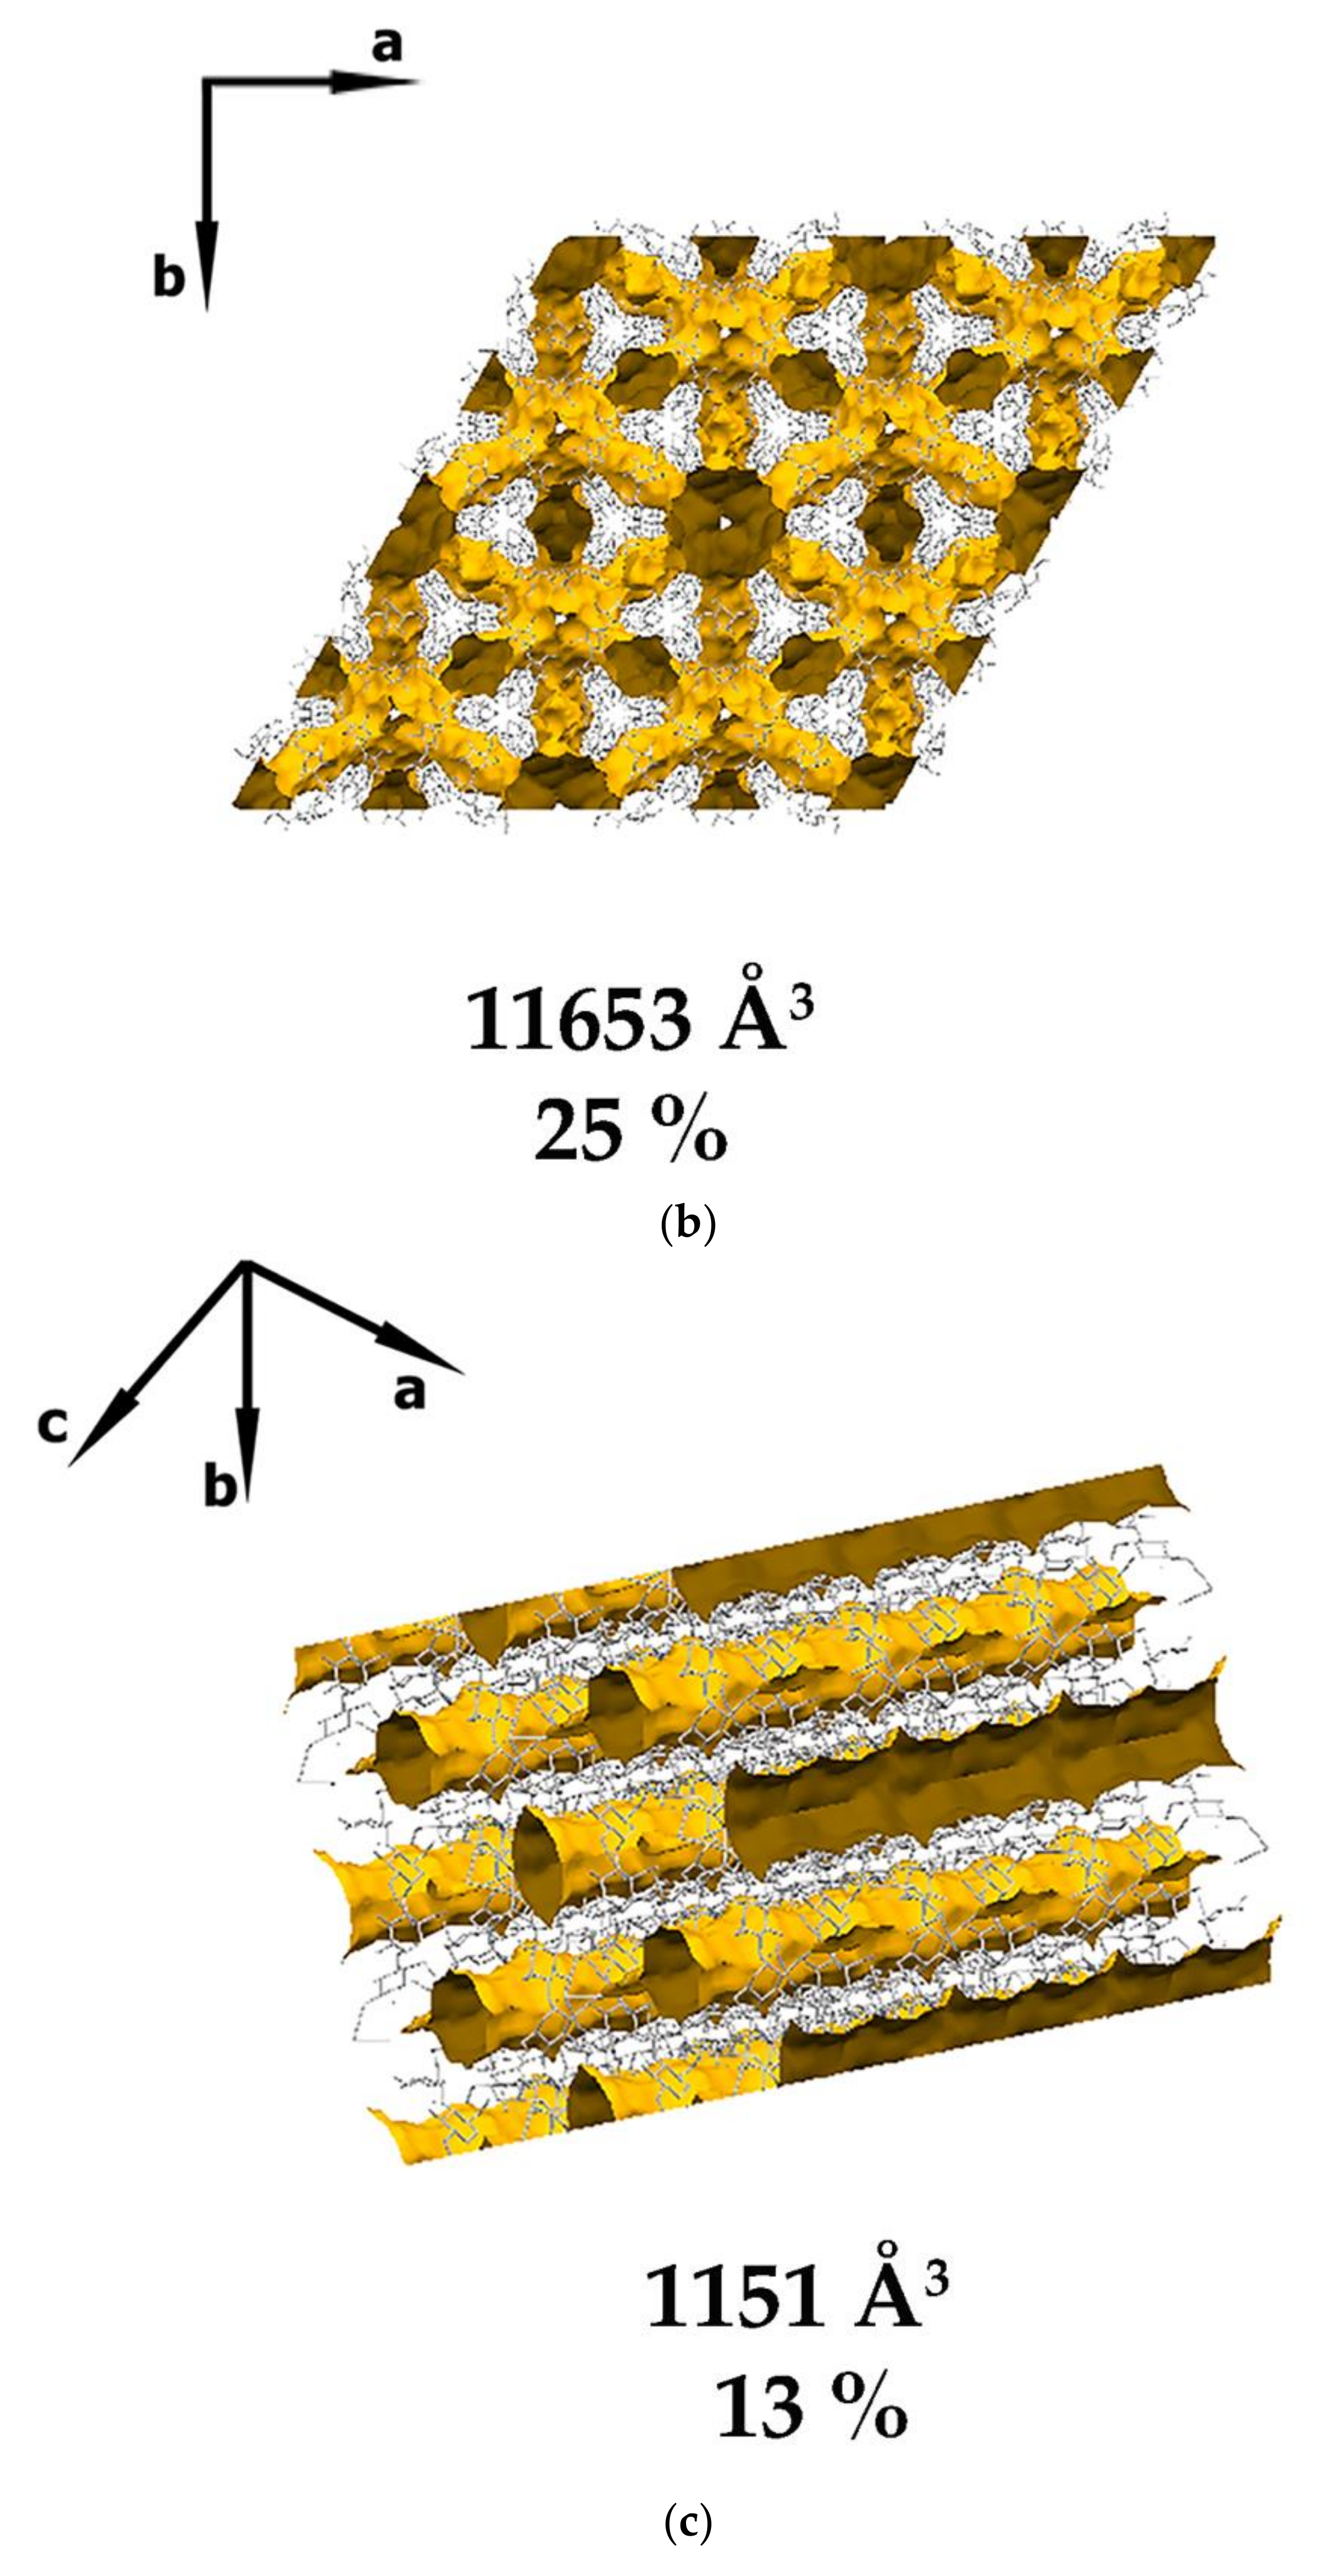
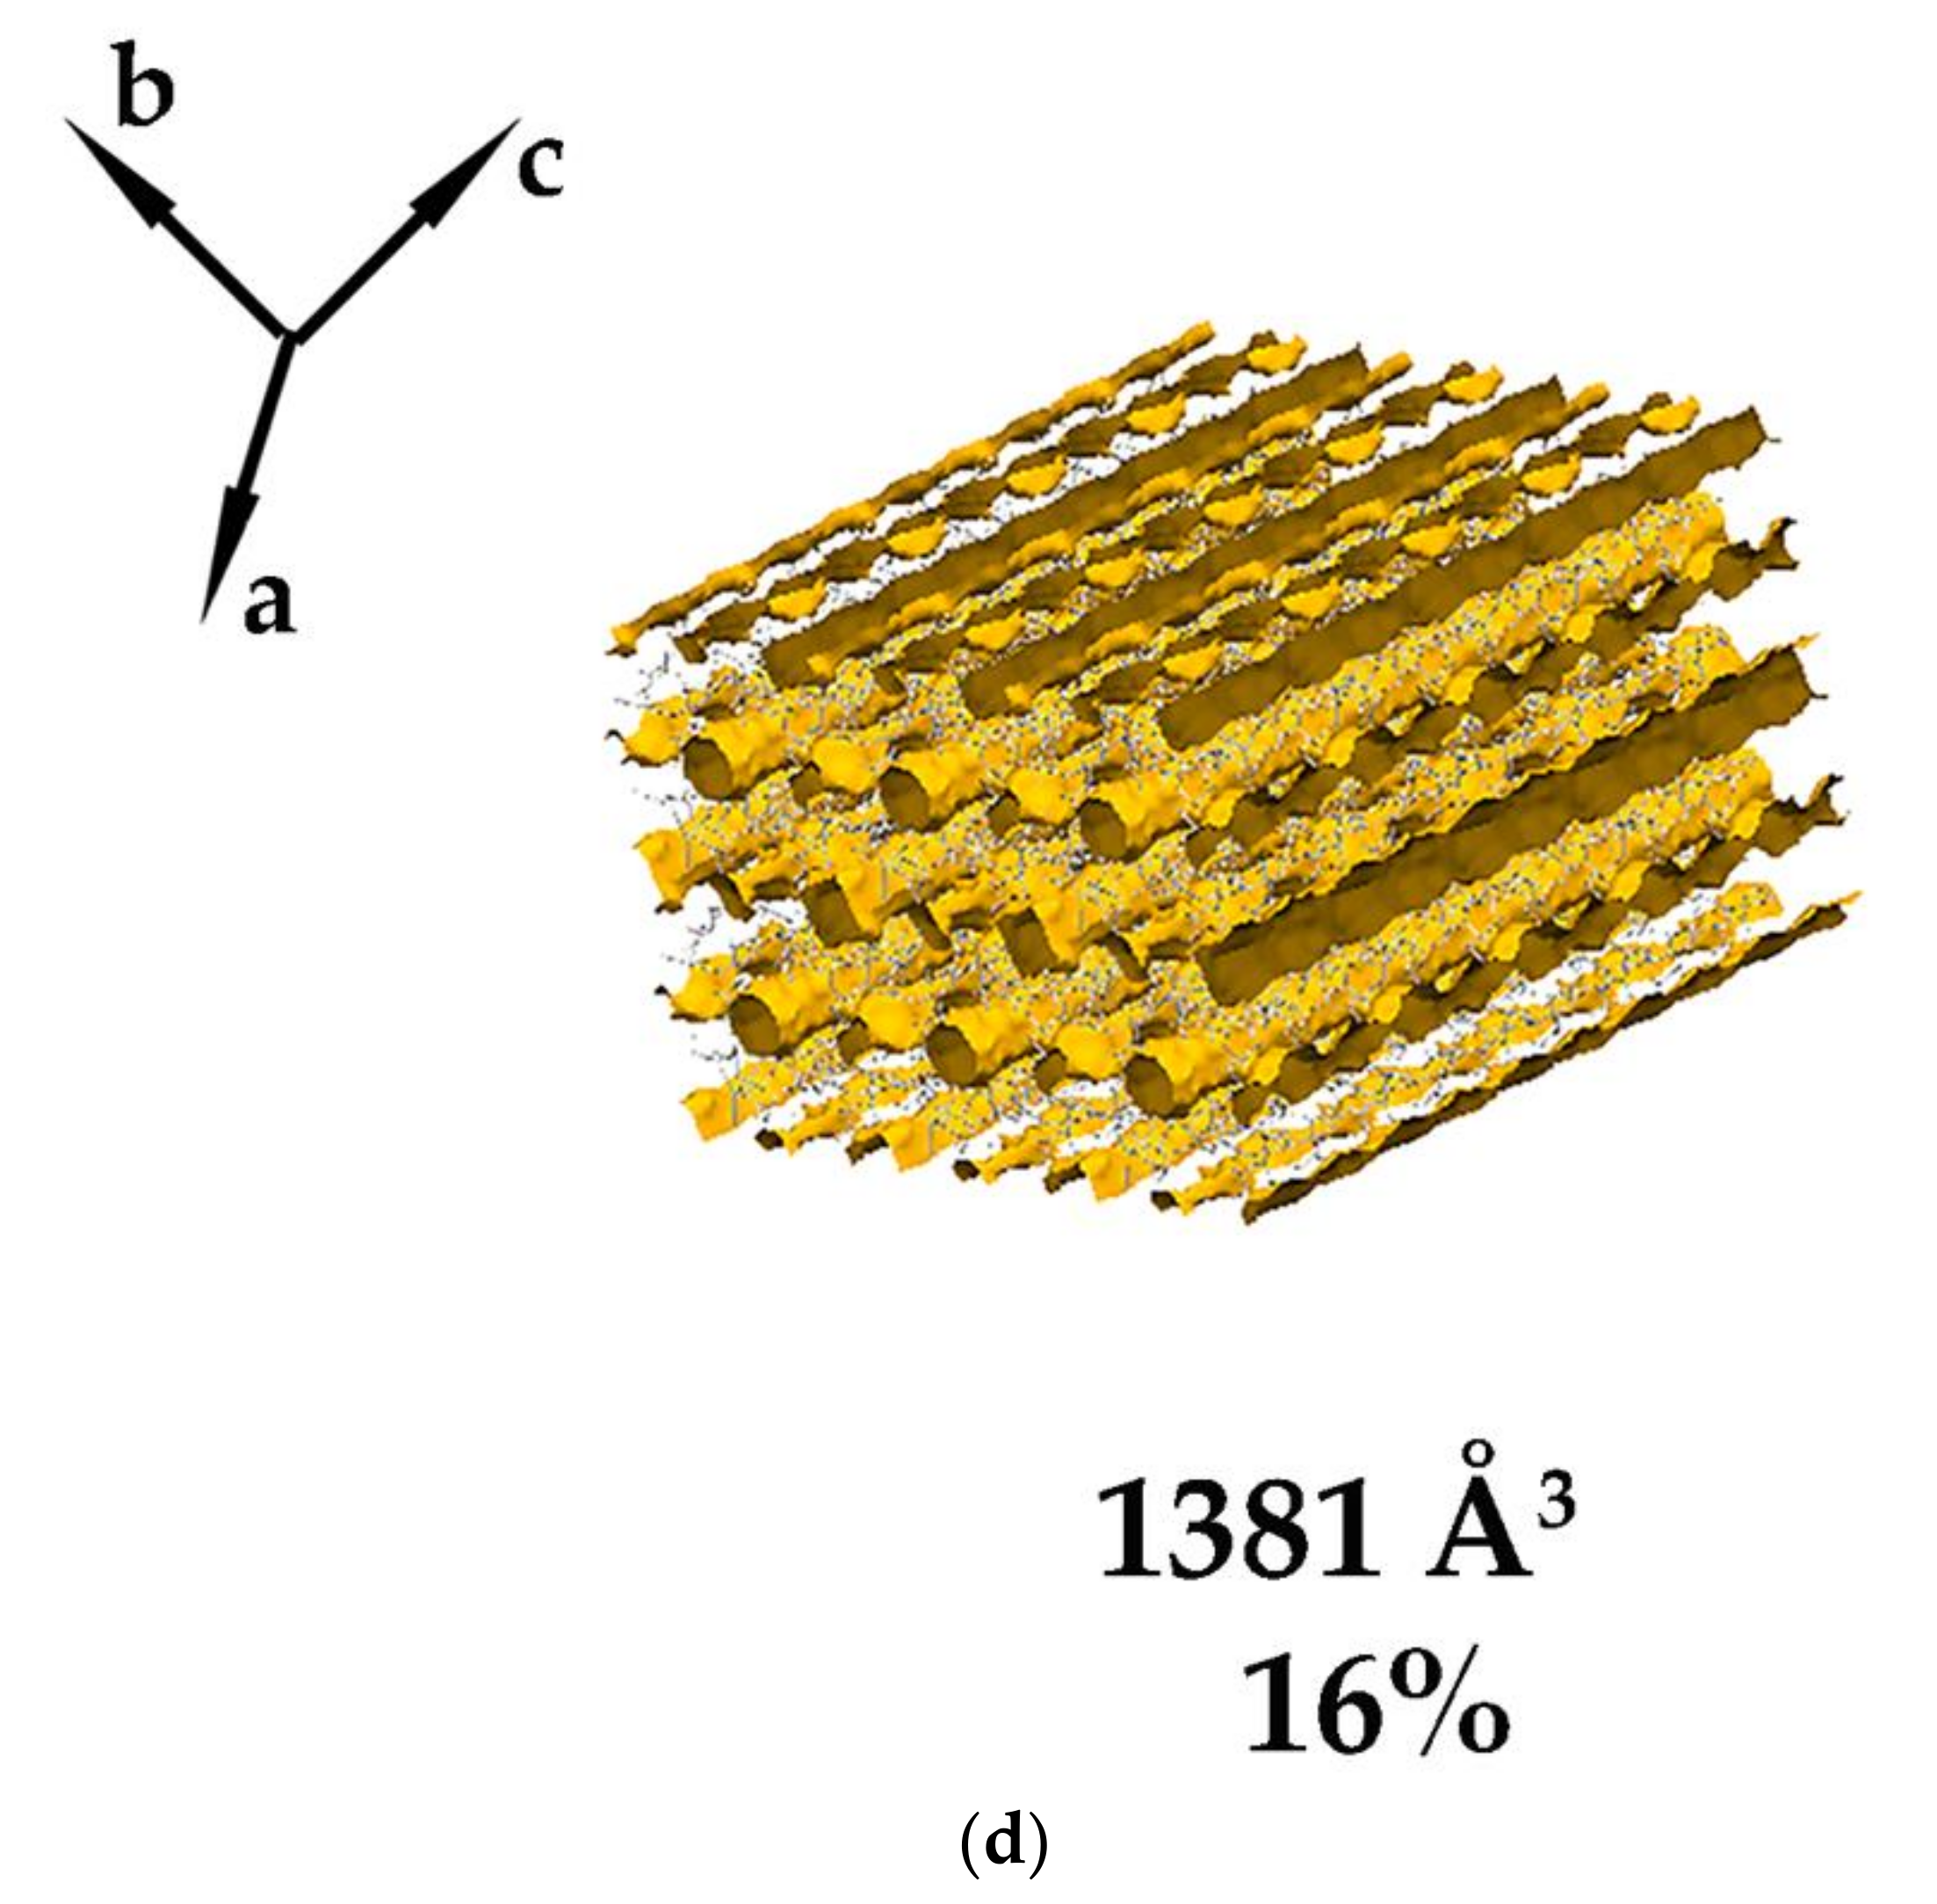
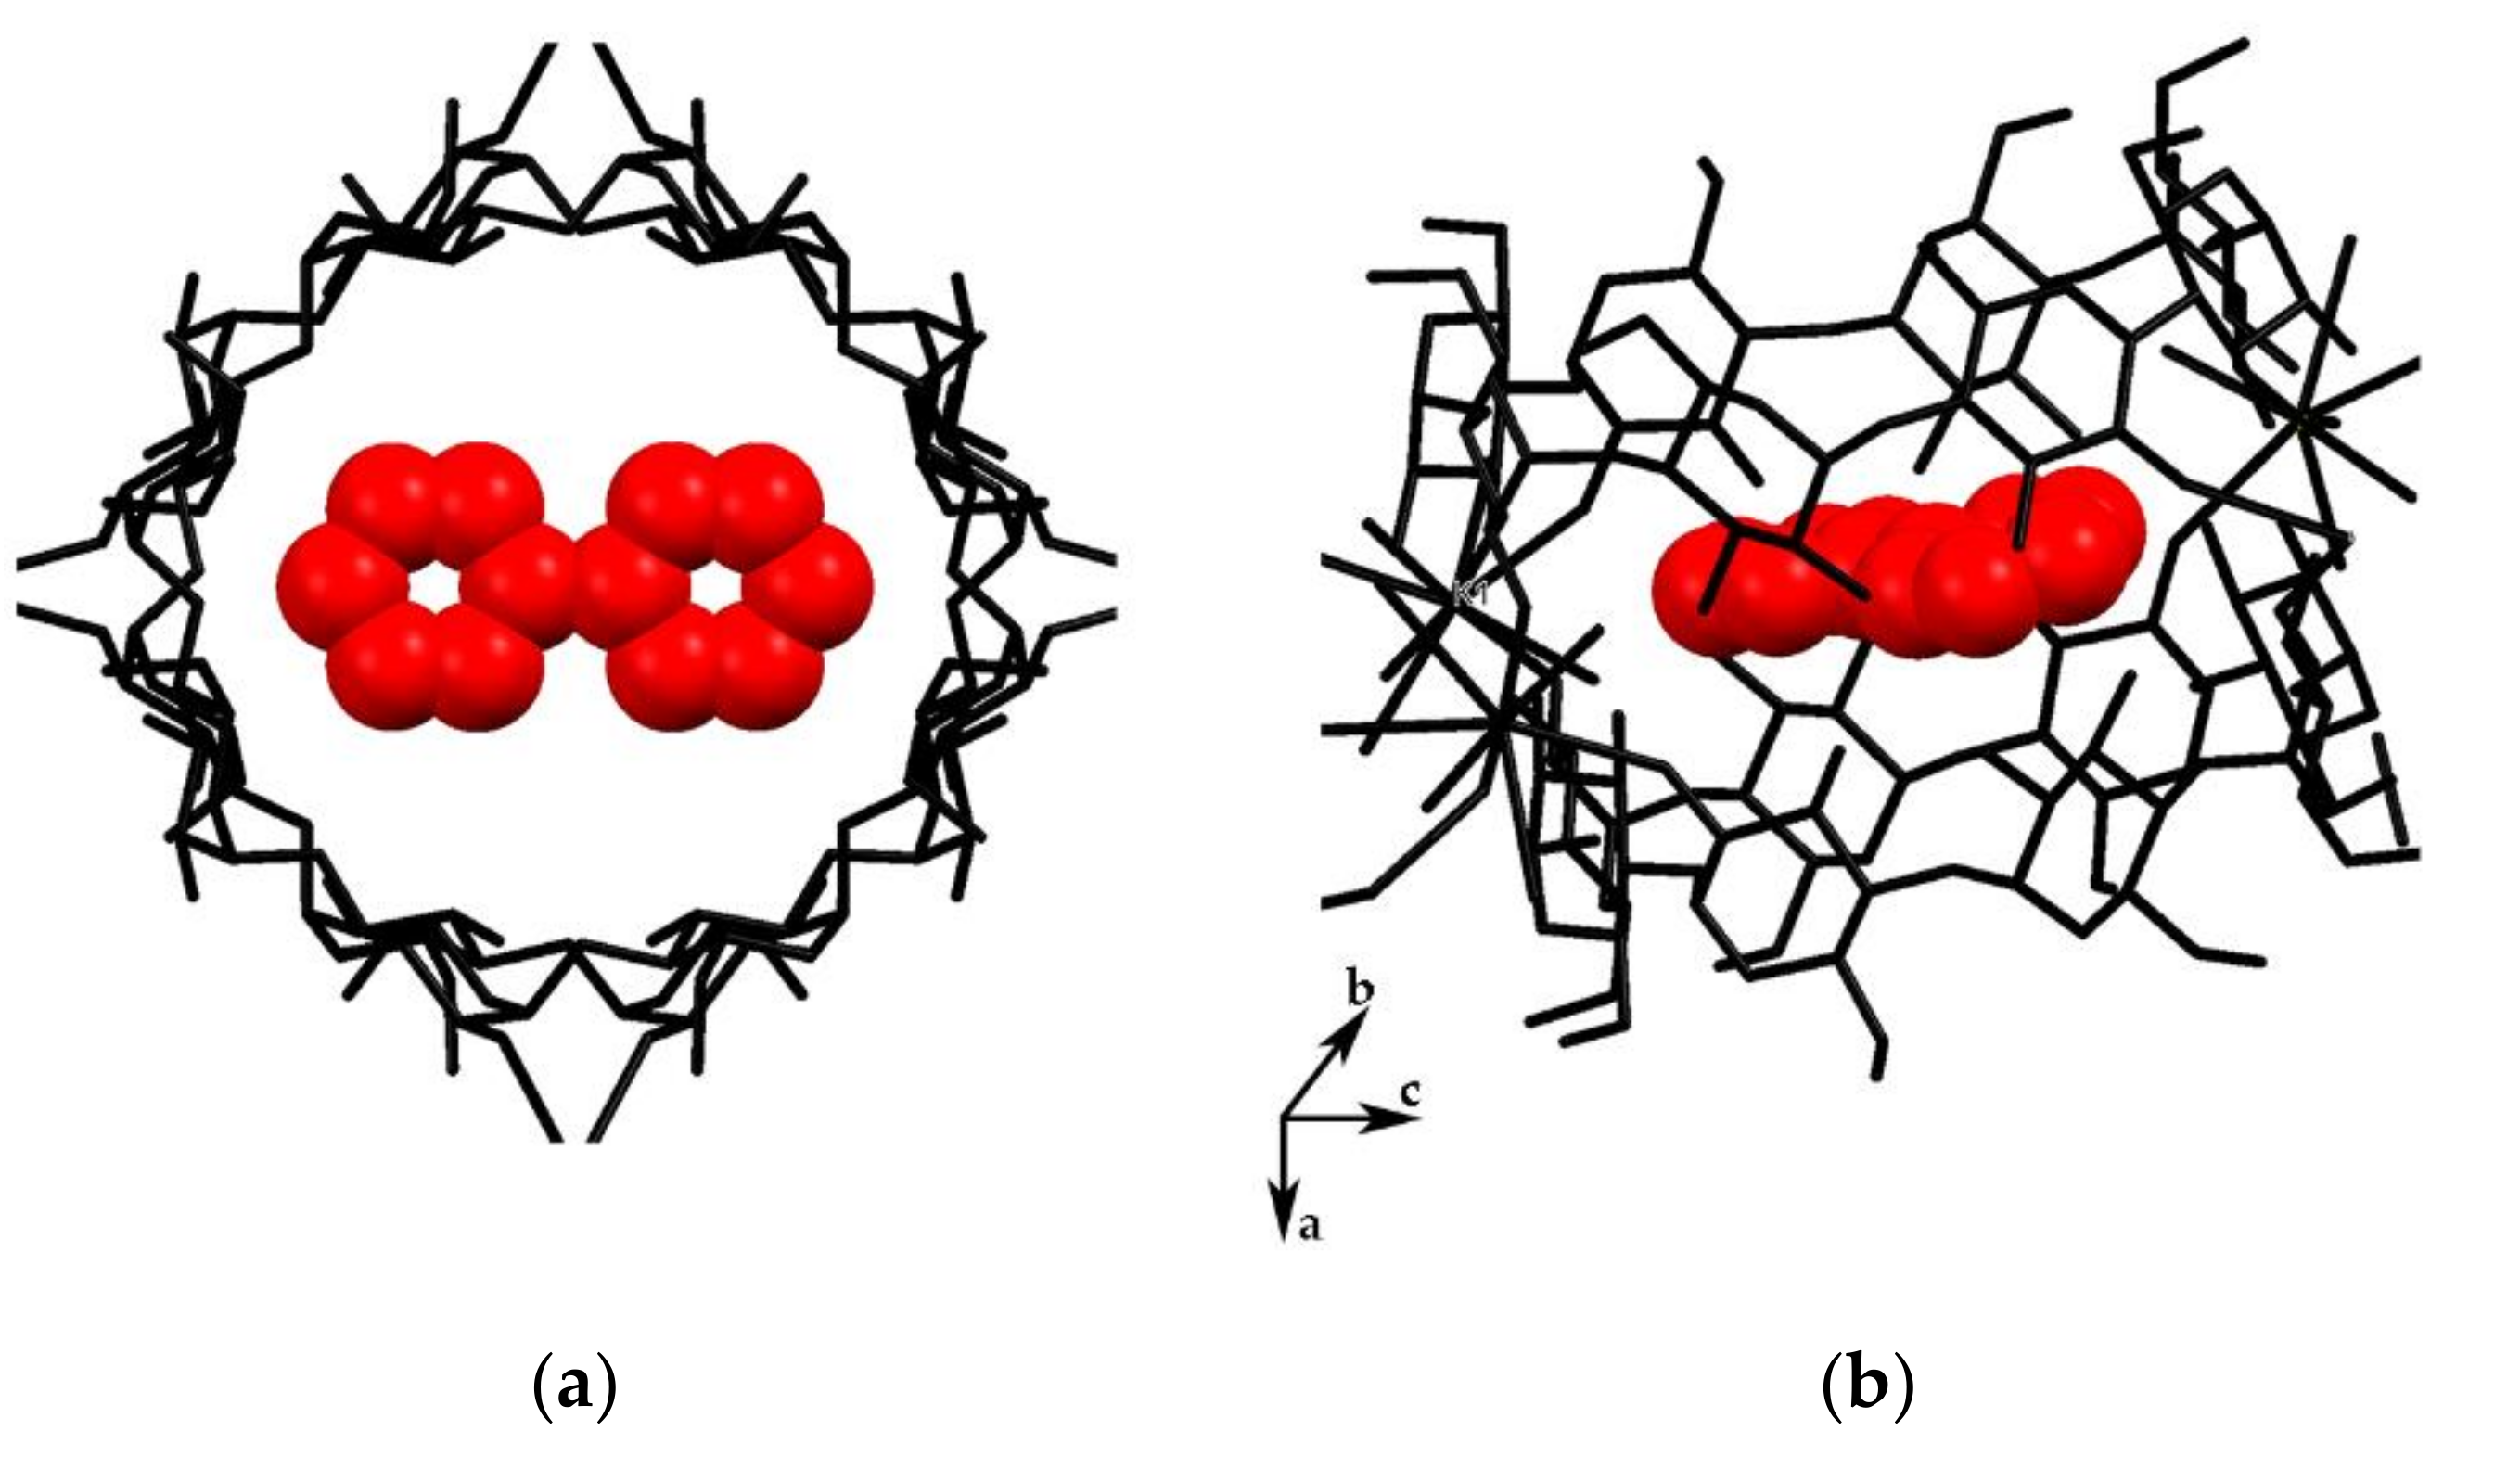
3.1. Crystal Structure Analysis of the New Phases of γ-CD-MOF-1

The X-ray crystal structure of ε-phase reveals that it consists of two symmetrically independent K+ ions and γ-CD ring with four symmetrically independent glucose units. Therefore, the γ-CD ring lies twofold (C2) in the symmetry arrangement. Furthermore, δ-phase contains one symmetrically independent K+ ion and two glucose moieties. According to this, γ-CD ring lies fourfold (C4) in the symmetry arrangement, which is similar to α-phase with the difference only in coordination the between K+ ions and γ-CD rings.
As depicted in Figure 2A,c ε-phase is formed by two γ-CD rings, which are coordinated to four K+ ions, and these γ-CD tori are fused together with the secondary faces of γ-CD rings (see faces of γ-CD in Figure 1c). All four K+ ions are located between these two γ-CD rings forming a sandwich-type dimer. K+ ions are coordinated by one oxygen atom of each glucose unit of γ-CD through C4–OH (K2–O46 2.821 Å) and C20–OH (K1–O37 2.980 Å) groups (see Figure 2B,c). Each K1 ion is also coordinated by the assembly of a pair of adjacent sandwich-type dimers, thereby forming a chain of these dimers when viewed along the b-axis (see Figure 3).
In δ-phase, each γ-CD ring is coordinated to eight K+ ions (see Figure 2A,d). As in the case of α- and β-phases, four K+ ions are coordinated by the oxygen atoms of the primary face, the remaining four by the oxygen atoms of the secondary face of γ-CD ring, and two adjacent γ-CD rings share two K+ ions. One of these shared K+ ions of the primary face is coordinated by two oxygen atoms of two glucose moieties from each γ-CD unit through the C75–OH group (K–O 2.808 Å) and O75 atom (K–O 2.951 Å), as well as the C199–OH group (K–O 2.887 Å) and O8 atom (K–O 2.949 Å). The other K+ ion of the secondary face is coordinated by one oxygen atom of glucose moiety from each γ-CD unit through the O80 (K–O 2.758 Å) and O132 (K–O 2.748 Å) atoms. The established distances between K+ ion and oxygen atoms indicate that stronger interaction exists between K+ ion and oxygen atoms of γ-CD secondary face. In α-phase, each K+ ion is coordinated by four oxygen atoms, every two oxygen atoms are provided by four glucose moieties, from both the secondary and primary face of γ-CD rings. Therefore, adjacent γ-CD rings, coordinated to K+ ions in δ-phase, lie twofold (C2) in the symmetry arrangement. As mentioned above, δ-phase was obtained only once and repeated attempts to achieve the respective transformation of α-phase were unsuccessful, which encourages us to attribute this example to disappearing polymorphs [25].
As can be seen from Figure 4b, the molecular packing of δ-phase consists of infinite layers down the direction of the a-axis. A similar arrangement is also presented down the direction of the b-axis. There are two intermittent layers, one containing γ-CD rings and the other containing K+ ions. The γ-CD tori in the adjacent layers are oriented in the same direction but the position of the adjacent γ-CD rings is not the same. The arrangement of γ-CD rings repeats in every second layer. As with the δ-phase, the molecular packing of the ε-phase (see Figure 4a) also consists of infinite layers (in this case, down the direction of the b- or c-axis) with γ-CD rings in one layer and K+ ions in the other. Down the direction of the b-axis, the adjacent layers are not identical and the arrangement of γ-CD rings repeats in every second layer. Such layers are not present in α- and β-phases. As can be seen in Figure 4c, crystal packing down the direction of the a-axis in ε-phase and the c-axis in δ-phase is similar to that of α-phase.
In ε-phase, neighboring γ-CD units within one layer are oriented in the opposite directions forming a dimeric cluster (see Figure 5). Moreover, γ-CD rings of adjacent layers are also oriented in opposite directions above each other. As described above, γ-CD units form sandwich-type dimers via secondary faces. Similar arrangement of γ-CD rings, coordinated to four lithium and four copper ions, was reported [26].
As illustrated in Figure 6, the solvent-accessible surface in both new crystalline phases of γ-CD-MOF-1 is significantly reduced in comparison with the surface in α- and β-phases. In addition, Figure 6 represents reduced void space volume and the relative amount of void space in the unit cell of ε- and δ-phases. At the same time, the pore size of ε- and δ-phases is still suitable for incorporation of solvent or other organic molecules and it was possible to detect toluene molecules in the γ-CD cavities of ε·tol-phase by SCXRD.
Some water molecules are localized in the crystal structure of γ-CD-MOF-1, as well as evidences for disordered solvent molecules in the unit cell. However, disordered solvent molecules were not recognized in the electron density map and their diffraction was modeled by the SQUEEZE procedure of the PLATON program. The number of electrons found in solvent-accessible regions is 951 electrons. With 42 electrons per DCM molecule, it is 22.6 DCM molecules per unit cell. In a crystal, the DCM molecule occupies 75.5 Å3 [27]. If packed, this number of DCM molecules will occupy 22.6 × 75.5 = 1706 Å3. This fits very well to the solvent-accessible volume = 2340 Å3 (determined by SQUEEZE), with enough space for disorder. The notable exception is ε·tol-phase, where toluene molecules were observed in SCXRD (Figure 7). The occupation of toluene is 50% for one and the remaining 50% for the opposite direction. Additionally, the toluene molecule is slightly twisted from the equatorial plane of the γ-CD dimer. Inside these dimers, toluene molecules are located with the methyl group facing toward one of the K1 ions. Inclusion of the toluene molecule does not affect the crystal parameters of ε-phase, and the framework arrangement, identical to that observed in experiments using DCM, is maintained (see Table 1).
Guest molecules mainly interact with the host frameworks through noncovalent binding [28]. Intermolecular interactions of toluene and γ-CD molecules in ε·tol-phase were quantified using Hirshfeld surface analysis. This approach provides a graphical tool for the visualization and understanding of intermolecular interactions. The estimated intermolecular contacts are shown in Figure 8. As expected, the contribution of inter-contacts to the Hirshfeld surfaces between toluene and γ-CD molecules is significantly dominated by H⋯H (92%) and C⋯H (7%) interactions. The main inter-contacts are between hydrogen atoms of toluene and γ-CD as well as carbon atoms of toluene and hydrogen atoms of γ-CD, and only narrow stripe is observed for H⋯O interaction between toluene and γ-CD molecules.

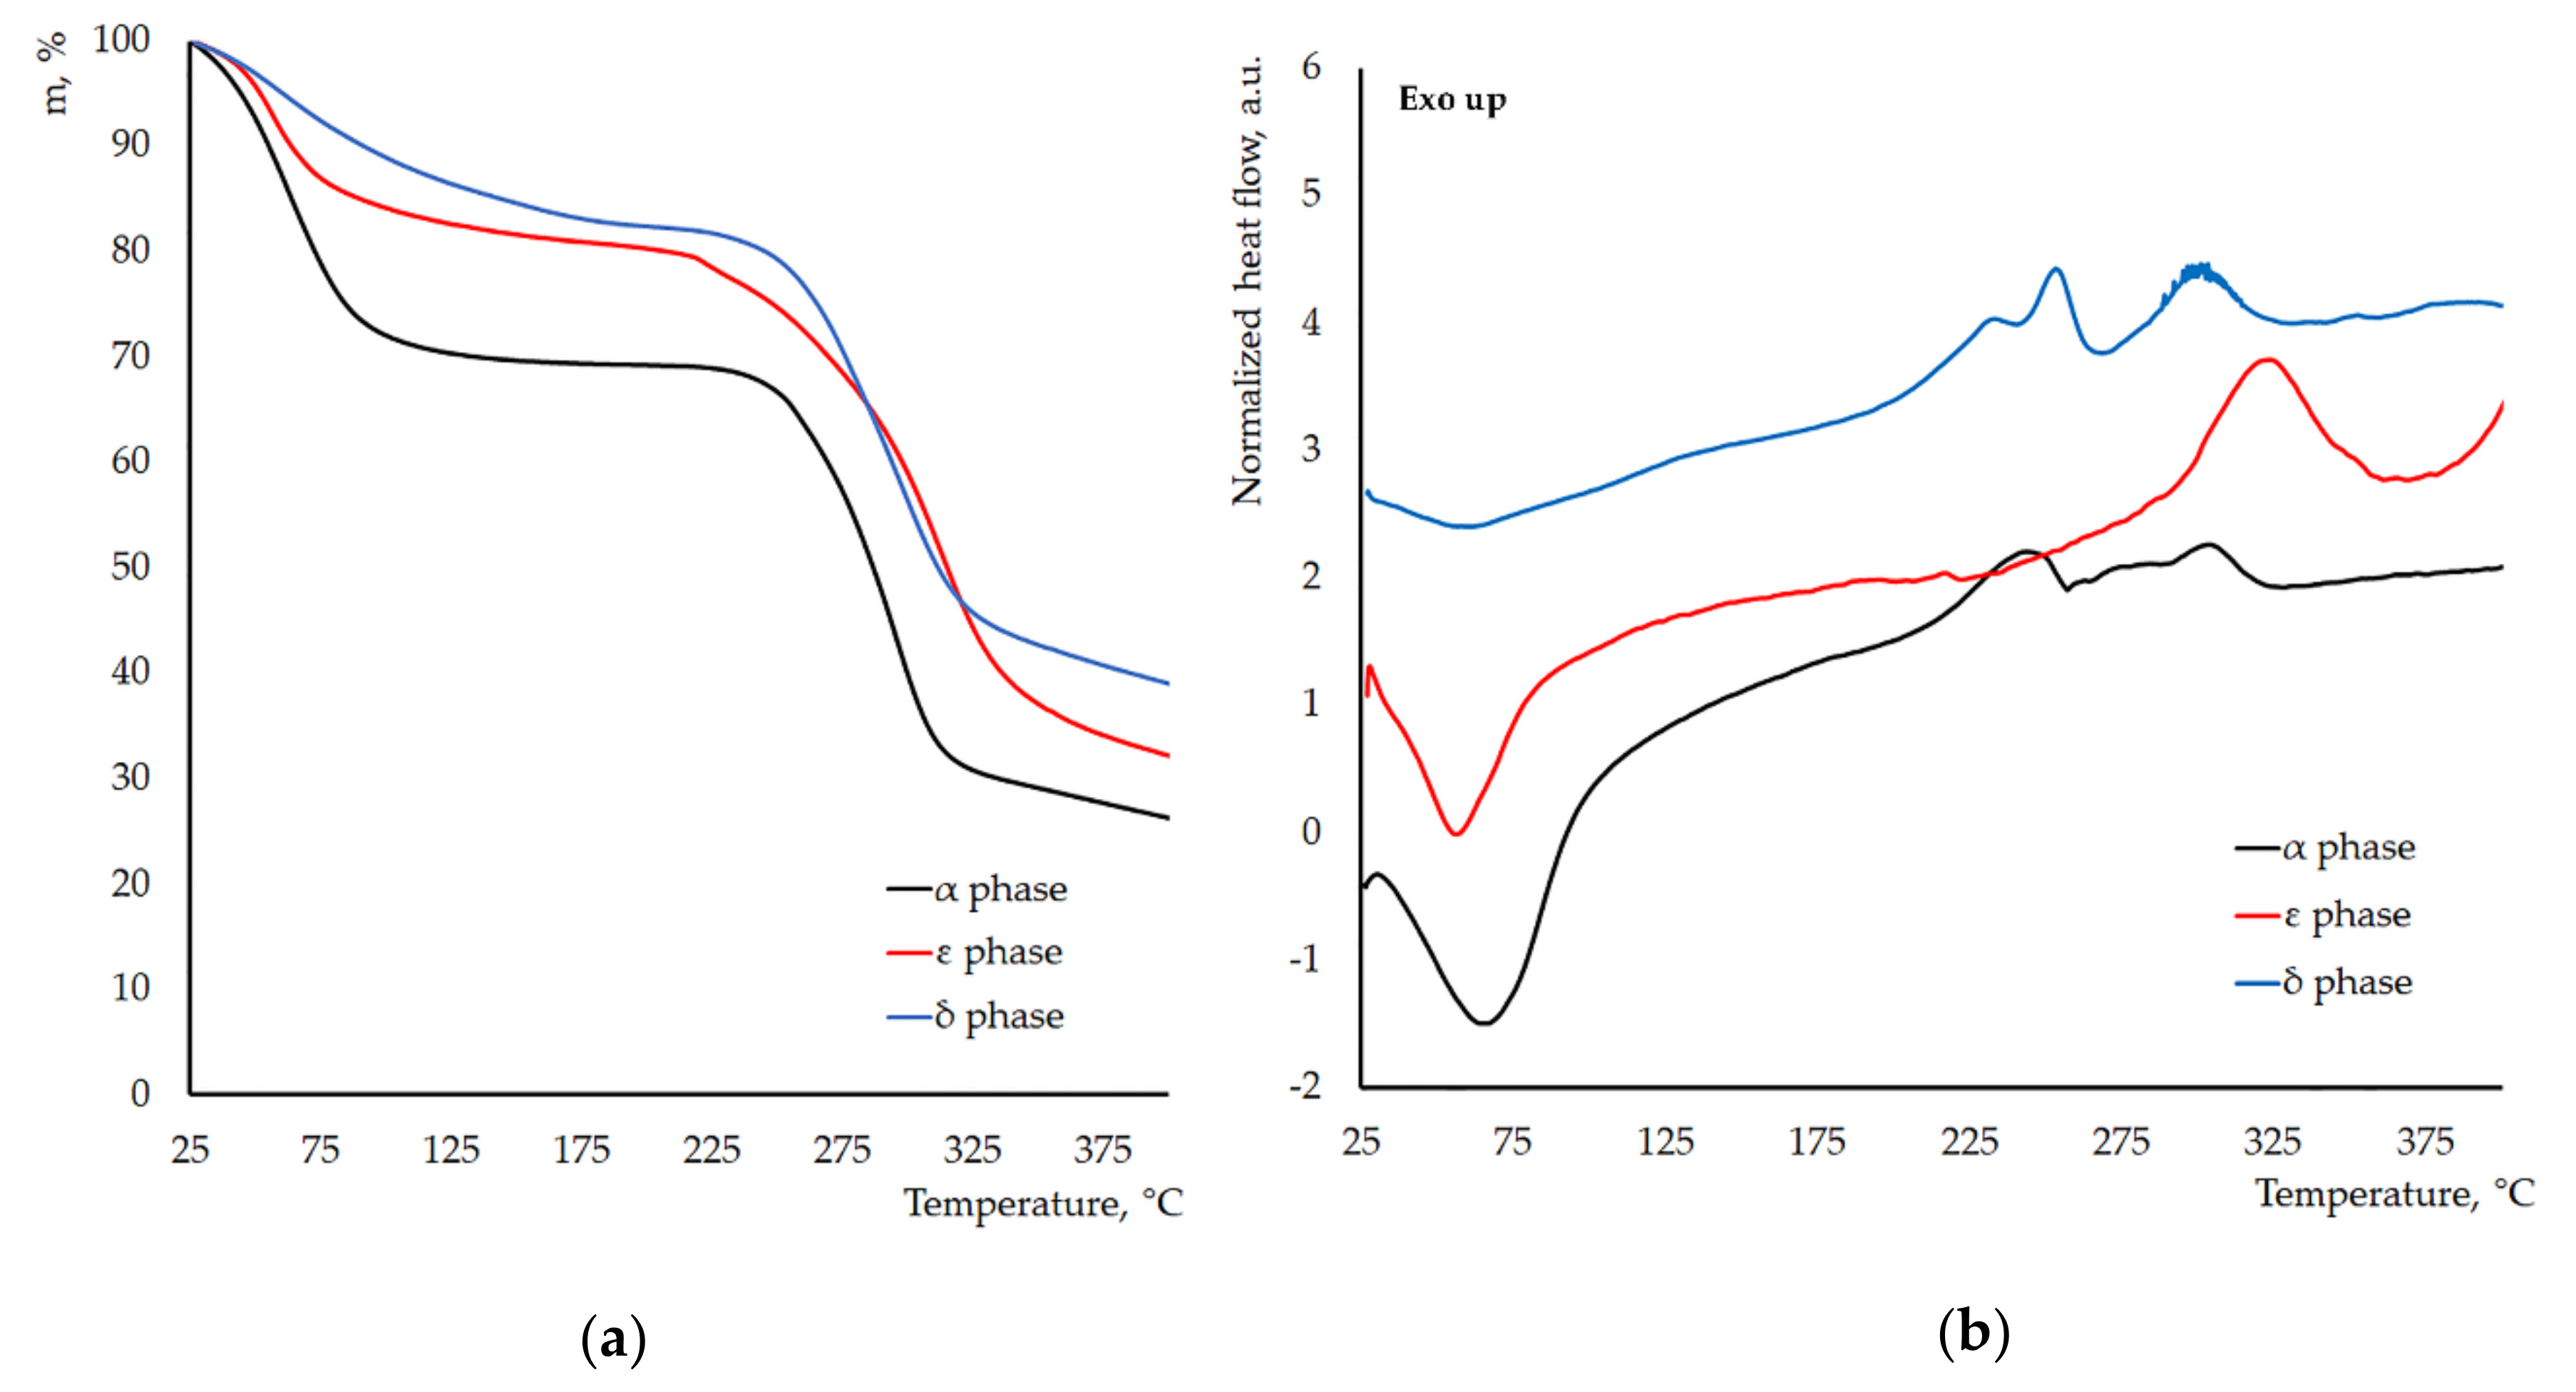
3.2. Thermal Stability of the New Crystal Phases of γ-CD-MOF-1

Thermal stability of the new crystalline ε- and δ-phases was examined by DSC/TG analysis and was compared to the stability of mother crystals (α-phase). As can be seen in Figure 9, DSC and TGA curves of all analyzed phases are similar. First, weight loss over similar ranges of temperature is observed (the onset temperature of the first peak Tδ = 25 °C, Tε = 28 °C, and Tα = 34 °C) and it can primarily be associated with the loss of solvent molecules residing in pores. The ε-phase experiences a weight loss of 18% in the temperature range of 25–180 °C. Taking into account its crystal structure and unit cell composition (see Section 2.3), there is sufficient space for disordered solvent molecules in the MOF pores. Presuming it is all DCM, the measured weight loss is equivalent to the loss of 16 molecules per unit cell. Experimental data indicates that α-, δ-, and ε-phases of γ-CD-MOF-1 are thermally stable up to 250 °C. At higher temperatures, a partial decomposition of the ligand takes place. According to the DSC curves, the onset temperatures of decomposition are as follows: Tδ = 270 °C, Tε = 292 °C, and Tα = 275 °C (however, the exact limits of the heat flow peak are difficult to define). The weight loss for ε- and α-phases is 48%–49% and 42% for δ-phase, and it can be related to the elimination of hydroxyl groups present in γ-CD and further destruction of glucose units [29,30,31,32]. The decomposition of δ-phase occurs at a higher temperature compared to that of ε- and α-phases. Furthermore, DSC results show a possible phase transition of δ-phase with an exothermic peak at Tonset = 195 °C. Overall, α-, δ-, and ε-phases of γ-CD-MOF-1 have similar thermal stability.

4. Conclusions

In summary, evaluation of the stability of γ-CD-MOF-1-α in various solvents has been performed, and two new crystalline phases of γ-CD-MOF-1 (δ- and ε-phase) have been identified. These phases are formed in solvent-promoted phase transformations of γ-CD-MOF-1-α. As a result, the symmetry of the new crystalline phases of γ-CD-MOF-1 is lowered from cubic (α-phase) to orthorhombic (ε-phase) and tetragonal (δ-phase) symmetry. SCXRD measurements reveal that γ-CD ring lies fourfold (C2) in the symmetry arrangement in ε-phase and fourfold (C4) in the symmetry arrangement in δ-phase. In the crystal structure of ε-phase, K+ ions and secondary faces of γ-CD rings form sandwich-type dimers. The molecular packing of δ- and ε-phases consists of infinite layers. The pore size of ε-phase is suitable for solvent molecules to be incorporated in this crystalline phase. According to SCXRD measurements, toluene was confirmed to be a guest molecule in ε-phase. The inter-contacts between toluene and γ-CD molecules are largely dominated by H⋯H (92%) interactions. All crystalline phases of γ-CD-MOF-1 have similar thermal stability.

Supplementary Materials

The following are available online at https://www.mdpi.com/2073-4352/10/1/37/s1, Figure S1: Powder pattern of γ-CD-MOF-α from 3 till 35 2θ, °; Figure S2: Powder pattern of γ-CD-MOF-α from 3 till 15 2θ, °; Figure S3: Powder pattern of γ-CD-MOF-1 in DCM and toluene from 3 till 35 2θ, °; Figure S4: Powder pattern of γ-CD-MOF-1 in DCM and toluene from 3 till 15 2θ, °; Figure S5: Powder pattern of γ-CD-MOF-1 in THF and diethyl ether from 3 till 35 2θ, °; Figure S6: Powder pattern of γ-CD-MOF-1 in THF and diethyl ether from 3 till 15 2θ, °; Figure S7: Powder pattern of γ-CD-MOF-1 in chloroform from 3 till 35 2θ, °; Figure S8: Powder pattern of γ-CD-MOF-1 in chloroform from 3 till 15 2θ, °; Figure S9: Powder pattern of γ-CD-MOF-1 in cyclohexane from 3 till 35 2θ, °; Figure S10: 400 MHz FT-NMR of CDCl3-d solution after crystals of γ-CD-MOF-1 α-phase were immersed for 24 h; Figure S11: 400 MHz FT-NMR of CD2Cl2-d2 solution after crystals of γ-CD-MOF-1 α-phase were immersed for 24 h; Figure S12: 400 MHz FT-NMR of THF-d8 solution after crystals of γ-CD-MOF-1 α-phase were immersed for 24 h; Figure S13: 400 MHz FT-NMR of toluene-d8 solution after crystals of γ-CD-MOF-1 α-phase were immersed for 24 h; Figure S14: 400 MHz FT-NMR of cycloheaxane-d12 solution after crystals of γ-CD-MOF-1 α-phase were immersed for 24 h; Figure S15: 400 MHz 1H NMR of the γ-cyclodextrin dissolved in DMSO-d6 and diluted by the indicated solvent.; Figure S16: 400 MHz 1H NMR of the γ-cyclodextrin dissolved in DMSO-d6 solution and diluted by the indicated solvent: region from 3.0 till 8.0 ppm; Table S1: Full crystal data and structure refinement for ε-, ε·tol-, and δ-phases; Table S2: Measured lattice parameter of γ-CD-MOF-1 in DCM; Table S3: Measured lattice parameter of γ-CD-MOF-1 in chloroform; Table S4: Measured lattice parameter of γ-CD-MOF-1 in THF; Table S5: Measured lattice parameter of γ-CD-MOF-1 in toluene; Table S6: Measured lattice parameter of γ-CD-MOF-1 in cyclohexane; Table S7: Measured lattice parameter of γ-CD-MOF-1 in MTBE; Table S8: Measured lattice parameter of γ-CD-MOF-1 in diethyl ether.

Author Contributions

K.K.-B. conceived and designed the experiments, conceptualized the work, and prepared the manuscript for publication; A.M. and S.B. conducted the X-ray analysis, reviewed, and edited the manuscript; K.S. provided acquisition of funding and supervision of the research, reviewed, and edited the manuscript. All authors discussed the contents of the manuscript.

Funding

This work was supported by the European Regional Development Fund, agreement No.1.1.1.1/16/A/288.

Conflicts of Interest

The authors have declared that there are no conflicts of interests.

References

  1. Cook, T.R.; Zheng, Y.R.; Stang, P.J. Metal-organic frameworks and self-assembled supramolecular coordination complexes: Comparing and contrasting the design, synthesis, and functionality of metal-organic materials. Chem. Rev. 2013, 113, 734–777. [Google Scholar] [CrossRef] [PubMed] [Green Version]
  2. McKinlay, A.C.; Morris, R.E.; Horcajada, P.; Férey, G.; Gref, R.; Couvreur, P.; Serre, C. BioMOFs: Metal-organic frameworks for biological and medical applications. Angew. Chem. Int. Ed. 2010, 49, 6260–6266. [Google Scholar] [CrossRef] [PubMed]
  3. Chen, Q.; Chen, Q.W.; Zhuang, C.; Tang, P.P.; Lin, N.; Wei, L.Q. Controlled release of drug molecules in metal–organic framework material HKUST-1. Inorg. Chem. Commun. 2017, 79, 78–81. [Google Scholar] [CrossRef]
  4. Li, H.; Lv, N.; Li, X.; Liu, B.; Feng, J.; Ren, X.; Guo, T.; Chen, D.; Fraser Stoddart, J.; Gref, R.; et al. Composite CD-MOF nanocrystals-containing microspheres for sustained drug delivery. Nanoscale 2017, 9, 7454–7463. [Google Scholar] [CrossRef] [Green Version]
  5. Sun, Y.; Xi, H.; Chen, S.; Ediger, M.D.; Yu, L. Crystallization near glass transition: Transition from diffusion-controlled to diffusionless crystal growth studied with seven polymorphs. J. Phys. Chem. B 2008, 112, 5594–5601. [Google Scholar] [CrossRef]
  6. Han, Y.; Liu, W.; Huang, J.; Qiu, S.; Zhong, H.; Liu, D.; Liu, J. Cyclodextrin-Based Metal-Organic Frameworks (CD-MOFs) in Pharmaceutics and Biomedicine. Pharmaceutics 2018, 10, 271. [Google Scholar] [CrossRef] [Green Version]
  7. Huxford, R.C.; Della Rocca, J.; Lin, W. Metal-organic frameworks as potential drug carriers. Curr. Opin. Chem. Biol. 2010, 14, 262–268. [Google Scholar] [CrossRef] [Green Version]
  8. Almáši, M.; Zeleňák, V.; Palotai, P.; Beňová, E.; Zeleňáková, A. Metal-organic framework MIL-101(Fe)-NH2 functionalized with different long-chain polyamines as drug delivery system. Inorg. Chem. Commun. 2018, 93, 115–120. [Google Scholar] [CrossRef]
  9. Rojas, S.; Colinet, I.; Cunha, D.; Hidalgo, T.; Salles, F.; Serre, C.; Guillou, N.; Horcajada, P. Toward Understanding Drug Incorporation and Delivery from Biocompatible Metal-Organic Frameworks in View of Cutaneous Administration. ACS Omega 2018, 3, 2994–3003. [Google Scholar] [CrossRef]
  10. Rojas, S.; Devic, T.; Horcajada, P. Metal organic frameworks based on bioactive components. J. Mater. Chem. B 2017, 5, 2560–2573. [Google Scholar] [CrossRef]
  11. Smaldone, R.A.; Forgan, R.S.; Furukawa, H.; Gassensmith, J.J.; Slawin, A.M.Z.; Yaghi, O.M.; Stoddart, J.F. Metalorganic frameworks from edible natural products. Angew. Chem. Int. Ed. 2010, 49, 8630–8634. [Google Scholar] [CrossRef] [PubMed]
  12. Patyk-Kaźmierczak, E.; Warren, M.R.; Allan, D.R.; Katrusiak, A. Pressure inverse solubility and polymorphism of an edible γ-cyclodextrin-based metal-organic framework. Phys. Chem. Chem. Phys. 2017, 19, 9086–9091. [Google Scholar] [CrossRef] [PubMed] [Green Version]
  13. Chem, A.; Ed, I.; Biradha, K.; Hongo, Y.; Fujita, M. for Crystal-to-Crystal Sliding of Two-Dimensional Coordination Layers Triggered by Guest Exchange. Angew. Chem. Int. Ed. 2002, 41, 3395–3398. [Google Scholar]
  14. Suh, M.P.; Ko, J.W.; Choi, H.J. A Metal−Organic Bilayer Open Framework with a Dynamic Component: Single-Crystal-to-Single-Crystal Transformations. J. Am. Chem. Soc. 2002, 124, 10976–10977. [Google Scholar] [CrossRef]
  15. Suh, M.P.; Moon, H.R.; Lee, E.Y.; Jang, S.Y. A Redox-Active Two-Dimensional Coordination Polymer: Preparation of Silver and Gold Nanoparticles and Crystal Dynamics on Guest Removal. J. Am. Chem. Soc. 2006, 128, 4710–4718. [Google Scholar] [CrossRef]
  16. Park, H.J.; Lim, D.; Yang, W.S.; Oh, T.; Suh, M.P. A Highly Porous Metal–Organic Framework: Structural Transformations of a Guest-Free MOF Depending on Activation Method and Temperature. Chem. A Eur. J. 2011, 17, 7251–7260. [Google Scholar] [CrossRef]
  17. Lee, J.H.; Kim, T.K.; Suh, M.P.; Moon, H.R. Solvent-induced single-crystal to single-crystal transformation of a Zn 4 O-containing doubly interpenetrated metal–organic framework with a pcu net. Cryst. Eng. Commun. 2015, 17, 8807–8811. [Google Scholar] [CrossRef]
  18. Park, H.J.; Cheon, Y.E.; Suh, M.P. Post-Synthetic Reversible Incorporation of Organic Linkers into Porous Metal-Organic Frameworks through Single-Crystal-to-Single-Crystal Transformations and Modification of Gas-Sorption Properties. Chem. A Eur. J. 2010, 16, 11662–11669. [Google Scholar] [CrossRef]
  19. Yuan, S.; Feng, L.; Wang, K.; Pang, J.; Bosch, M.; Lollar, C.; Sun, Y.; Qin, J.; Yang, X.; Zhang, P.; et al. Stable Metal–Organic Frameworks: Design, Synthesis, and Applications. Adv. Mater. 2018, 30, 1–35. [Google Scholar] [CrossRef] [Green Version]
  20. Inokuma, Y.; Yoshioka, S.; Ariyoshi, J.; Arai, T.; Fujita, M. Preparation and guest-uptake protocol for a porous complex useful for “crystal-free” crystallography. Nat. Protoc. 2014, 9, 246–252. [Google Scholar] [CrossRef]
  21. Sheldrick, G.M. A short history of SHELX. Acta Cryst. Sect. A 2008, 64, 112–122. [Google Scholar] [CrossRef] [PubMed] [Green Version]
  22. Bourhis, L.J.; Dolomanov, O. V; Gildea, R.J.; Howard, J.A.K.; Puschmann, H. The anatomy of a comprehensive constrained, restrained refinement program for the modern computing environment – Olex2 dissected. Acta Cryst. Sect. A Found. Adv. 2015, 71, 59–75. [Google Scholar] [CrossRef] [PubMed] [Green Version]
  23. Spek, A.L. Structure validation in chemical crystallography. Acta Cryst. Sect. D Biol. Cryst. 2009, 65, 148–155. [Google Scholar] [CrossRef] [PubMed]
  24. Turner, M.J.; McKinnon, J.J.; Wolff, S.K.; Grimwood, D.J.; Spackman, P.R.; Jayatilaka, D.; Spackman, M.A. CrystalExplorer17; University of Western Australia: Pert, Australia, 2017. [Google Scholar]
  25. Bučar, D.-K.; Lancaster, R.W.; Bernstein, J. Disappearing Polymorphs Revisited. Angew. Chem. Int. Ed. 2015, 54, 6972–6993. [Google Scholar] [CrossRef] [PubMed] [Green Version]
  26. Bagabas, A.A.; Frasconi, M.; Iehl, J.; Hauser, B.; Farha, O.K.; Hupp, J.T.; Hartlieb, K.J.; Botros, Y.Y.; Stoddart, J.F. γ-Cyclodextrin cuprate sandwich-type complexes. Inorg. Chem. 2013, 52, 2854–2861. [Google Scholar] [CrossRef] [PubMed] [Green Version]
  27. Hofmann, D.W.M. Fast estimation of crystal densities. Acta Cryst. Sect. B Struct. Sci. 2002, 58, 489–493. [Google Scholar] [CrossRef] [PubMed]
  28. Yu, G.; Chen, X. Host-Guest Chemistry in Supramolecular Theranostics. Theranostics 2019, 9, 3041–3074. [Google Scholar] [CrossRef]
  29. Kathuria, A.; Pauwels, A.K.; Buntinx, M.; Shin, J.; Harding, T. Inclusion of ethanol in a nano-porous, bio-based metal organic framework. J. Incl. Phenom. Macrocycl. Chem. 2019, 95, 91–98. [Google Scholar] [CrossRef]
  30. Kritskiy, I.; Volkova, T.; Surov, A.; Terekhova, I. γ-Cyclodextrin-metal organic frameworks as efficient microcontainers for encapsulation of leflunomide and acceleration of its transformation into teriflunomide. Carbohydr. Polym. 2019, 216, 224–230. [Google Scholar] [CrossRef]
  31. Liu, B.; He, Y.; Han, L.; Singh, V.; Xu, X.; Guo, T.; Meng, F.; Xu, X.; York, P.; Liu, Z.; et al. Microwave-Assisted Rapid Synthesis of γ-Cyclodextrin Metal-Organic Frameworks for Size Control and Efficient Drug Loading. Cryst. Growth Des. 2017, 17, 1654–1660. [Google Scholar] [CrossRef]
  32. Al-Ghamdi, S.; Kathuria, A.; Abiad, M.; Auras, R. Synthesis of nanoporous carbohydrate metal-organic framework and encapsulation of acetaldehyde. J. Cryst. Growth 2016, 451, 72–78. [Google Scholar] [CrossRef] [Green Version]
Figure 1. Crystal structure of (a) α- and (b) β-phase of γ-CD-MOF-1 (crystal structures were redrawn from the Cambridge Crystallographic Data Centre (CCDC) deposits LAJLAL [11] and LAJLAL2 [12]); (c) representation of 3D structure of γ-CD.
Crystals 10 00037 g001
Figure 2. A—Arrangement of γ-CD ring in (a) α-, (b) β-, (c) ε-, and (d) δ-phase. B—Coordination of K+ ion in (a) α-, (b) β-, (c) ε-, and (d) δ-phase. Hydrogen atoms are omitted for clarity.
Crystals 10 00037 g002
Figure 3. Sandwich-type dimer chain in ε-phase along the b-axis. Hydrogen atoms are omitted for clarity.
Crystals 10 00037 g003
Figure 4. Molecular packing of (a) ε- and (b) δ-phase; (c) crystal packing overlay of α- (green), δ- (blue), and ε- (red) phases. Hydrogen atoms are omitted for clarity.
Crystals 10 00037 g004aCrystals 10 00037 g004b
Figure 5. Side view of ε-phase sandwich-type dimers along the b-axis.
Crystals 10 00037 g005
Figure 6. Solvent-accessible surface of (a) α-, (b) β-, (c) ε-, and (d) δ-phase, calculated in mercury (probe radius, 1.2 Å; approximate grid spacing, 0.7 Å).
Crystals 10 00037 g006aCrystals 10 00037 g006bCrystals 10 00037 g006c
Figure 7. (a) Arrangement of γ-CD and toluene molecules in ε·tol-phase along a-axis. (b) Arrangement of toluene molecules between two γ-CD rings leading to sandwich-type dimer.
Crystals 10 00037 g007
Figure 8. Two-dimensional fingerprint plot for toluene molecule in ε·tol-phase showing contributions of individual types of interactions: (a) all interactions plot, (b) C⋯H, (c) H⋯H, and (d) H⋯O interactions plot.
Crystals 10 00037 g008
Figure 9. (a) TGA and (b) DSC curves of γ-CD-MOF-1 crystalline phases.
Crystals 10 00037 g009
Table 1. Crystallographic data and structure refinement details for crystal phases of γ-CD-MOF-1.
ParameterKnown PhasesNew Phases
α [11]β [12]εε·tolδ
a31.006(8)43.6764(14)15.7898(1)15.8765(1) 23.80929(17)
b31.006(8)43.6764(14)20.2381(1)20.1735(1) 23.80929(17)
c31.006(8)28.1864(9)28.1282(2)28.1409(2) 15.26298(14)
α = β = γ = 90°α = β ≠ γ = 120°α = β = γ = 90°α = β = γ = 90°α = β = γ = 90°
V/Å329807(14)46565(3)8988.52(10)9013.1(1)8652.31(15)
Space groupI432R32I222I222I4
Dcalc/g·cm−30.9620.9031.1221.2451.112
Packing Index/%4543546353
Table 2. Summary of the results from the stability evaluation of γ-CD-MOF-1 crystals in various solvents during two weeks.
Time/Days36914
Solvent
MTBE-1,2αααα
DCM-1εεεε
DCM-2 1αεεε
Toluene-1,2αx 2ε·tolε·tol
Diethyl ether-1,2αββδ
THF-1ααβα
THF-2 1αββα
Chloroform-1ααβα
Chloroform-2 1αβββ
Cyclohexane-1,2αβββ
1 For each solvent, parallel experiments were performed using two separate vials. 2 Cell parameters could not be associated with any of the already known phases.

