Article

Raman Spectra of Quartz and Pb4+-Doped SiO2 Crystals at Different Temperature and Pressure

1
College of Physics Science and Technology, Shenyang Normal University, Shenyang 110034, China
2
Experimental Teaching Center, Shenyang Normal University, Shenyang 110034, China
*
Authors to whom correspondence should be addressed.
Crystals 2019, 9(11), 569; https://doi.org/10.3390/cryst9110569
Submission received: 9 October 2019 / Revised: 27 October 2019 / Accepted: 28 October 2019 / Published: 30 October 2019
(This article belongs to the Special Issue Raman Spectroscopy of Crystals)

Abstract

:
In order to seek for new Raman crystals, the manuscript presented the discussion on the Raman frequency of α-quartz, β-quartz, as well as Pb4+-doped SiO2 crystals at different temperature and pressure. The results demonstrated that as the pressure increased, the Raman lines shifted towards higher frequency for α-SiO2 crystal, while for β-SiO2 crystals, the main lines moved to lower frequency. Several new peaks were generated from the Pb4+-doped α-SiO2 crystals. The Pb4+-doped β-SiO2 crystals presented strong and ample Raman beams in the low-frequency range. The airfoil-shaped spectra appeared and broadened at high temperature and pressure. It could be inferred that the Pb4+-doped SiO2 crystals were excellent Raman crystal candidates.

Graphical Abstract

1. Introduction

Raman and Brillouin technology were both famous methods to explore material structure and characteristic by nonlinear frequency conversion [1]. In one hand, they could provide quick, simple, repeatable, and more importantly, nondestructive qualitative and quantitative analysis [2], on the other hand, they would extend the range of laser wavelength and greatly promote the development of laser technology, such as solid-state Raman lasers and fiber lasers [3,4,5]. In addition, they were also applied to study crystals. This manuscript adopted the Raman scattering to discuss and seek for Raman crystals.
SiO2 and PbWO4 crystals were famous Raman crystals. The former crystal SiO2, owing to its temperature and pressure sensitive characteristics, was not only applied for oscillators and filters, but also for the thermo detector and criteria for pressure correction. Thus, many results had been obtained in the past, for almost 90 years. [6,7,8,9,10]. Some were the influence of temperature on the Raman spectrums of α-quartz or β-quartz crystals, some were high-pressure Raman study of SiO2, and some were the α–β transition [11,12]. There was little research which took factors of both temperature and pressure into account at the same time.
The latter crystal, PbWO4, had diversified Raman spectra according to its four different geometric configurations, which provided guarantee for Raman lasers [13,14]. However, its luminescence mechanism was always controversial, that was, it was not clear whether Pb2+ or WQ42− made contribution to the Raman spectrums.
According to the above statement, in this manuscript, the Raman spectrums of α-quartz and β-quartz crystals were simulated by the MS (Material Studio) software under different levels of temperature and pressure, and on this basis, Pb4+-doped α-quartz and β-quartz crystals were constructed and their Raman spectrums were calculated. The effect of Pb4+ on SiO2 crystal’s Raman character was analyzed, which not only expanded the quartz crystal’s application, provided a new crystal type, but also demonstrated the function of Pb4+ for Raman frequency shift, which might present a new Raman crystal for lasers.

2. Materials and Methods

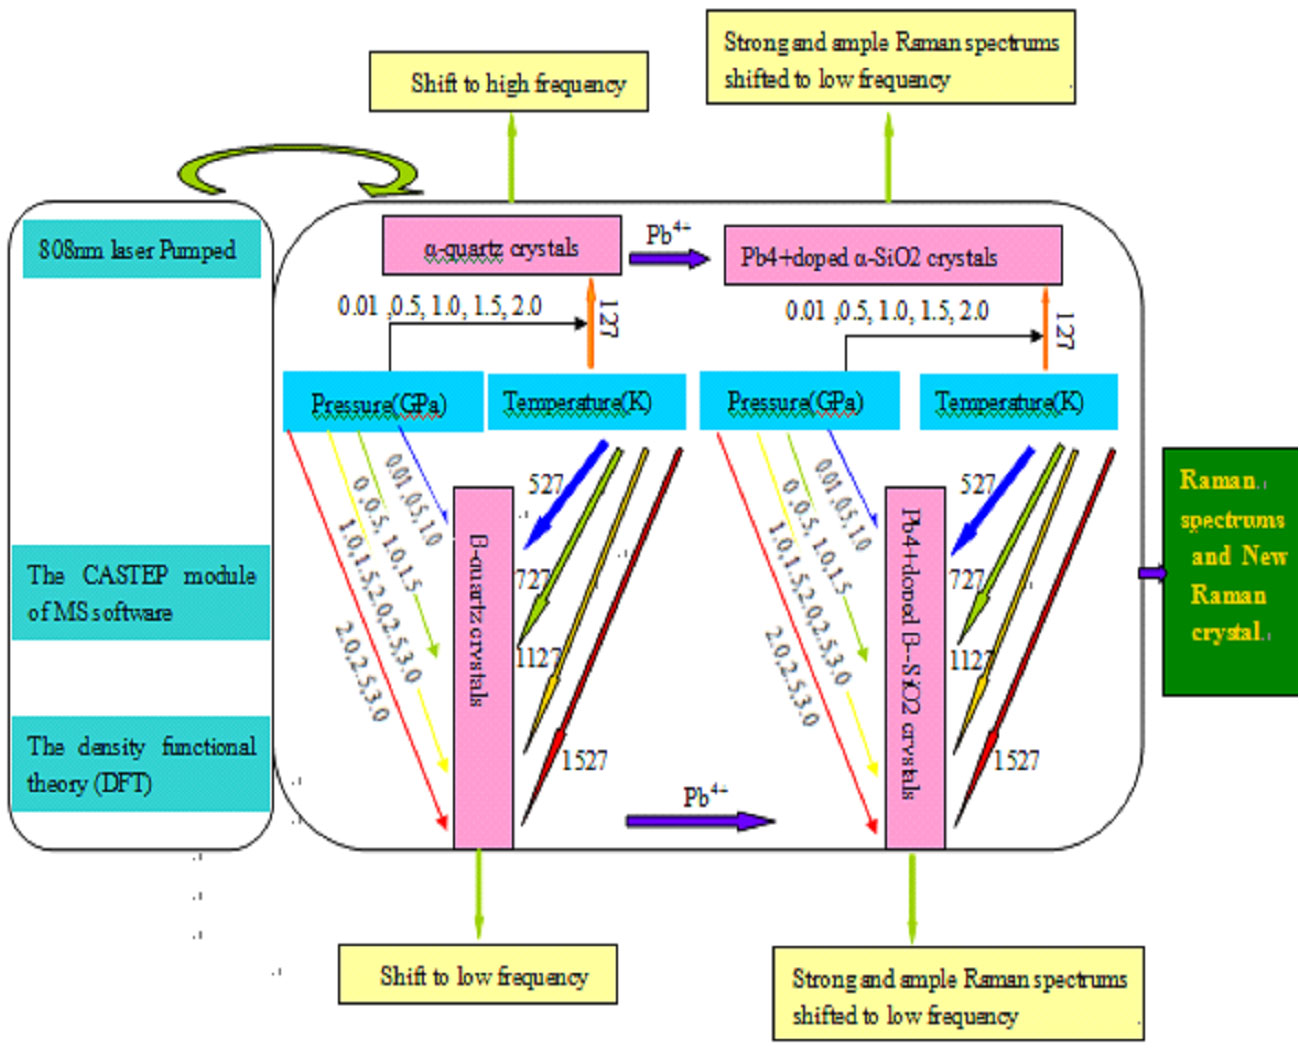
2.1. The Structures of Raman Crystals

The structures of α-SiO2 and β-SiO2 crystals are shown in Figure 1a,b. Each included nine atoms, and the space groups were No.152 (P312) and No.180 (P6222), respectively. In α-SiO2, six Oxygen atoms occupied the site (0.4108, 0.2739, 0.2201) and three Silicon atoms occupied the site (0.4661, 0.0000, 0.3333). In β-SiO2, the occupied sites of Oxygen atoms and Silicon atoms were (0.2039, 0.4078, 1.5000) and (0.500, 0.5000, 0.3333), respectively. The optimized lattice parameters of α-SiO2 at 0 GP was a = b = 5.00621 Å, c = 5.49535 Å, which for the β-SiO2 crystal were a’ = b’ = 5.10360 Å, c’ = 5.58330 Å.
The Pb4+ ions were doped into α-SiO2 and β-SiO2 crystals respectively, and the structure was also shown in Figure 1c,d. Though Pb4+ and Si4+ were both positive tetravalent ions, it was still not random for them to substitute with each other in both α-quartz and β- quartz crystals. The replacement must guarantee the structure stability.
When the pressure was put on the crystals, their structures and the lattice parameters would be changed. In order to provide effective data for calculation, it was necessary to present the normalized lattice parameters a/a0, c/c0, and v/v0 of α-SiO2, β-SiO2, and their Pb4+-doped crystals, respectively, where a0, c0, and v0 were the parameters at 0 GPa. From the Figure 2, it can be seen that all the parameters decreased when the pressure increased, which demonstrated that the atoms became closer so as to interact with each other powerfully. Comparing α-quartz crystal with β- quartz crystal, it was found that the latter’s parameters were always larger than the former ‘s, even the pressure was added to 3.0 GPa on the β-crystal. Thus, β-quartz crystal’s compressibility was smaller than that of the α-quartz crystals. When the Pb4+ replaced some Si4+ ions and was doped into the α-SiO2, the lattice parameters became small, especially for the x-direction and the whole volume, which indicated that Pb4+ shortened the bond length and increased inter-atomic interaction, which would evidently influence the Raman spectrums. The Pb4+-doped β-SiO2 had the same variation trends, and there was a large percentage of reduction for the lattice a/a0 and v/v0, which reached 3.33% and 5.28% respectively, and would greatly influenced the spectrum characteristics.
According to the curve-fitting, the equations of parameters varying with pressure “p” were obtained as follows.
α-SiO2:
a / a 0 = 1.00053 0.00702 p 6.15345 × 10 4 p 2
c / c 0 = 1.00036 0.00466 p 9.04206 × 10 4 p 2
v / v 0 = 1.00141 0.01867 p 0.00199 p 2
β-SiO2:
a / a 0 = 1.00006 0.00229 p 5.58773 × 10 5 p 2
c / c 0 = 1.00000 0.00225 p + 1.66900 × 10 4 p 2
v / v 0 = 1.00013 0.00682 p + 6.81266 × 10 5 p 2
Pb4+-doped α-SiO2:
a / a 0 = 0.99991 0.01328 p + 4.91712 × 10 4 p 2
c / c 0 = 0.99994 0.00862 p + 0.00177 p 2
v / v 0 = 1.00034 0.03050 p + 0.00112 p 2
Pb4+-doped β-SiO2:
a / a 0 = 1.00043 0.01287 p + 5.74314 × 10 4 p 2
c / c 0 = 0.99990 0.00193 p + 7.95283 × 10 5 p 2
v / v 0 = 1.00049 0.02030 p + 8.59420 × 10 4 p 2
According to the above equations, the crystal’s lattice parameters could be obtained under any pressure.

2.2. Computational Methods for Raman Spectrum

The MS software was adopted to calculate by means of the CASTEP module on the basis of the Density Functional Theory (DFT). The light source was an 808 nm laser. The terms associated with the plane wave pseudopotential method and the exchange of electron–electron interactions were processed in a generalized gradient approximation (GGA) projection patch (PW91) version. The cut-off energy of plane wave was set to 750 eV. The k-points of Monkhost–Pack scheme were set to 3 × 3 × 4 for structural optimization and Raman calculations. The total energy convergence value was 1.0 × 10⁻⁵ eV/atom, and the tolerance displacement was within 0.001 Å. The force on all atoms was less than 0.03 eV/nm, and the stress deviation was within 0.005 GPa.

3. Results

There were about 23 types of variant for SiO2 and 20 crystal forms included. The conversion between different crystalline forms could be realized by means of load pressure and environment temperature, which was demonstrated in Figure 3 [15]. In this manuscript, only the α-quartz and β-quartz crystals were chosen to be discussed.

3.1. The Raman Spectrums of SiO2 Crystals

Because the MS software did not provide the calculation with sub-zero Kelvin temperature, according to Figure 3, the α-SiO2 crystal’s Raman spectrum was simulated only at the temperature of 400 °C (127 K), and the pressures put on the crystal were from 0 GPa to 2 GPa. The results were shown in Figure 4.
It could be seen from Figure 4a that there was hardly change when the pressure was 0.1 GPa and 0.5 GPa, compared with no pressure 0 GPa, and the energy was mainly focused on 119 cm−1, however, two small spectrums at 1042 cm−1 and 1139 cm−1 emerged at these two low pressures. As the pressure increased up to 1.0 GPa, 1.5 GPa, and 2.0 GPa, two new Raman spectrums emerged from 115 cm−1 to 260 cm−1, and the second peak value moved to the high frequency which also existed in the range from 1000 cm−1 to 1200cm−1. Furthermore, if the spectrogram observation was enlarged, small Raman spectrums appeared, as shown in Figure 4b, those were near about 340 cm−1, 445 cm−1, 682 cm−1, and 780 cm−1, respectively. As the pressure increased, the near-infrared light lines shifted towards higher frequency. All these indicated that α-SiO2 crystal had nine sets of Raman spectrums, but some were of quite small intensity.
For β-SiO2 crystal, the temperature shown in Figure 3 did not increase linearly with the pressure. Therefore, the pressure values of β-SiO2 were not completely the same with each other at different temperatures (527 K, 727 K, 1127 K, 1527 K). Its Raman spectrums were quite different from those of α-SiO2 crystal, which was shown in Figure 5. When the surrounding temperature changed from 527 K to 1527 K, the intensity distinctly increased. They had their own changing laws. When the temperature was 527 K, the Raman lines at 0 GPa and 0.5 GPa were the same at 255 cm−1, 473 cm−1, and 1193 cm−1, however the 1.0 GPa pressure made the Raman spectrums move to 303 cm−1, 527 cm−1, and 1202 cm−1, respectively. When the temperature was 727 K, the lines at pressure 0.5 GPa and 1.0 GPa were the same with that at 527 K, and the new ones at 1.5 GPa appeared at 304 cm−1, 531 cm−1, and 1204 cm−1. On the above two cases, all the Raman spectrums shifted to higher frequency when the pressure increased.
When the temperature was raised to 1127 K and 1527 K, the modes would be changed. The main spectrums shifted to the lower frequency, and the intensity became stronger as more pressure added, which was presented in Figure 5c,d. The 532 cm−1 line at 1.0 GPa would shift to 459 cm−1 at 3.0 GPa at 1127 K, and the 516 cm−1 line at 2.0 GPa moved to 459 cm−1 at 1527 K. Another spectrum also shifted from 304 cm−1 to 221 cm−1 at 1127 K and from 288 cm−1 to 221 cm−1 at 1527 K. However, the near-infrared spectrums from 1190 cm−1 to 1224 cm−1 were hardly changed at 1527 K and shifted slightly to high frequency at 1127 K.

3.2. The Raman Spectrums of Pb4+-Doped SiO2 Crystals

Furthermore, the Raman spectrums of new Pb4+-doped SiO2 crystals were discussed as follows, according to the rule that the configurations were the most stable. It was assumed that the Pb4+-doped crystals were of the same temperature and pressure variation ranges as undoped α-quartz and β-quartz crystals.
For the Pb4+-doped SiO2 crystal, the Raman spectrums were provided by Pb4+ and Si4+ ions together, which was shown in Figure 6. The light intensity of doped α-quartz crystal was larger than that of undoped α-SiO2, and there were four main lines located at 119 cm−1, 266 cm−1, 379 cm−1, and 508 cm−1 and three small lines at about 598 cm−1, 934 cm−1, and 1045 cm−1. Compared with Figure 4, it was hard to find that Raman lights were the same frequency as those of the previous one, which was not doped by Pb4+, except 119 cm−1 and 1045 cm−1 lines. Some may have contributed by Pb4+ ion, and some by Si4+, but the energy levels were changed. In addition, the ways of Raman frequency shift were opposite for α-SiO2 and Pb4+-doped α-SiO2, as the pressure enhanced, the former shifted to high frequency while the latter was opposite.
Pb4+-doped β-SiO2 crystals had several of their own characteristics, as shown in Figure 7.
Firstly, compared with β-SiO2 and Pb4+-doped β-SiO2, they had more abundant Raman beams in the low-frequency range. The light intensity was the strongest among all kinds of crystals discussed in this manuscript. Secondly, as the pressure strengthened, the main energy and frequency shifted to lower frequency, and this phenomenon became more evident at temperatures 1127 K and 1527 K. Thirdly, in the frequency range of 100 cm−1 to 250 cm−1, airfoil-shaped spectrums still existed, and the symmetry was the best at 2.0 GPa, especially for 1127 K and 1527 K. Furthermore, these types of spectrums would be broadened as pressure increased, which demonstrated that a new mode would appear and energy would be transferred. Finally, the spectrum at about 900 cm−1 was the main Raman light in PbWO4 crystal, however, this line did not appear in α-SiO2 and β-SiO2 crystals but was observed in Pb4+-doped α-SiO2 and β-SiO2 crystals from 930 to 952 cm−1, and the higher the pressure and temperature were, the higher the frequency was moved to. It could be inferred that the spectrum at about 930 cm−1 was generated by Pb4+ ion, but the emission intensity was quite small. Partial Raman spectra are listed in Table 1. Very few light lines still existed when Pb4+ was doped into SiO2 crystals, and the strong new lines appeared by Pb4+ ions and the interaction of Pb, Si, and O atoms. Maybe other small beams still could not be seen in these conditions.

4. Discussion and Conclusions

According to the results stated above, an 808 nm laser was firstly adopted as a pumping source for quartz crystals’ Raman frequency shift, and the temperature and pressure were commonly considered at the same time in this manuscript, which was different from other referenced researches on a relatively single condition [16]. Though the number of Raman lines matched with previous study, the peak value maybe was not the same; there were several reasons, analyzed as follows:
(1) The pumping light 808 nm laser was firstly used as pumping source, and the relationship of the polarization vs. incidence direction was not set clearly in MS software.
(2) In the experiment carried out before, methanol and ethanol were usually used as assistant measurement, but in this calculation, any aided materials were not taken into account.
(3) The direction of pressure put on the crystals was not specifically demonstrated in this software, which also affected the results.
(4) Under the action of pressure and temperature, the ranges of phase transition need further verification, especially for the Pb4+-doped SiO2 crystals; because it was a new constructive crystal, there was no literature to refer to.
(5) The MS software was hardly adopted to calculate the Raman spectrums, and the accuracy needs to be explored.
In summary, when the Pb4+ replaced some Si4+ ions and doped into the SiO2 crystals, the lattice parameters became small, especially for the x-direction and the whole volume, which indicated that Pb4+ ions shortened the bond length and increased interatomic interaction, therefore, the vibration of atoms and the polarizability would change, even some energy levels were varied or new ones were generated by the atomic interaction. Thus, the new lines in Raman spectra appeared. That was inferred according to the lattice parameters and the simulated results. The specific analysis needs to be carried out in the follow-up study. There were still many problems which needed to be discussed, both for SiO2 and Pb4+-doped crystals. In any case, the strong and ample spectrums of Pb4+-doped α-SiO2 and Pb4+-doped β-SiO2 crystals provided Raman lasers with a new possibility, which needs further research in the future.

Author Contributions

Conceptualization, X.C.; methodology, X.C., Y.G. and G.Z; software, W.F. and Y.G. and G.Z.; validation, X.C. and Y.G.; formal analysis, X.C.; investigation, X.C. and Y.G.; resources, X.C.; data curation, Y.G.; writing—original draft preparation, X.C.; writing—review and editing, X.C.; supervision, X.C., Y.G. and W.F.; project administration, X.C. and W.F.; funding acquisition, X.C.

Funding

This research was funded by Innovative Talent Program of Shenyang Normal University, grant number 222-51300417; the Nation Science Foundation Project, grant number 61603265; Natural Science Foundation of Liaoning Province, grant number 20180550055.

Acknowledgments

It is a great pleasure to thank all persons who gave us the uttermost help in completing this manuscript a success. We sincerely thank for all the help, support and encouragement given by the collage of physics science and technology of SYNU. Furthermore, we would like to thank Ms. Sasikala Abeysinghe who helped us to check the manuscript and especially thank the editors for their help with the paper.

Conflicts of Interest

The authors declare no conflict of interest.

References

  1. Dick, S.; Bell, S. Quantitative surface-enhanced Raman spectroscopy of single bases in oligodeoxynucleotides. Faraday Discuss. 2017, 37, 1012–1024. [Google Scholar] [CrossRef] [PubMed]
  2. Ding, S.Y.; You, E.M.; Tian, Z.Q.; Moskovits, M. Electromagnetic theories of surface-enhanced Raman spectroscopy. Chem. Soc. Rev. 2017, 46, 4042–4076. [Google Scholar] [CrossRef] [PubMed]
  3. Nishizawa, J.; Suto, K. Semiconductor Raman laser. J. Appl. Phys. 1980, 51, 2429–2431. [Google Scholar] [CrossRef]
  4. Basiev, T.T.; Zverev, P.G.; Karasik, A.Y.; Osiko, V.V.; Sobol, A.A.; Chunaev, D.S. Picosecond stimulated Raman scattering in crystals. J. Exp. Theor. Phys. 2005, 99, 934–941. [Google Scholar] [CrossRef]
  5. Frank, M.; Snetanin, S.N.; Jelinek, M.; Vyhlidal, D.; Shukshin, V.E.; Ivleva, L.I.; Zverev, P.G.; Kubecek, V. Efficient synchronously-pumped all-solid-state Raman laser at 1178 and 1227 nm on stretching and bending anionic group vibrations in a SrWO4 crystal with pulse shortening down to 1.4 ps. Opt. Laser Technol. 2019, 119, 105660. [Google Scholar] [CrossRef]
  6. Shinya, I.; Jun, S.; Tsutomu, S.; Yushi, S. Lattice dynamics and temperature dependence of the first-order Raman spectra for α-SiO2 crystals. J. Raman Spectrosc. 2003, 34, 135–141. [Google Scholar]
  7. Guo, J.; Ma, L. Atomic simulation of basic properties forα-SiO2 crystal. Mater. Sci. 2019, 9, 355–360. [Google Scholar]
  8. Krishnana, R.S. The scattering of light in fused quartz and its Raman spectrum. Proc. Math. Sci. 1953, 37, 377–384. [Google Scholar] [CrossRef]
  9. Nitin, R.K.; James, R.C. Structural properties of nine silica polymorphs. Phys. Rev. B 1992, 46, 1. [Google Scholar]
  10. Bishambhar, D.S. Calculation of the elastic constants of quartz at room temperature from the Raman effect data. Proc. Indian Acad. Sci.-Sect. A 1944, 19, 367–369. [Google Scholar]
  11. Jayaraman, A.; Wood, D.L.; Maines, R.G. High-Pressure Raman study of the vibrational modes in AIPO4 and SiO2 (α-quartz). Phys. Rev. Lett. 1987, 35, 8316–8321. [Google Scholar]
  12. Nedungadi, T.M.K. Effect of temperature on the Raman spectrum of quartz. Proc. Indian Acad. Sci.-Sect. A 1940, 11, 86–95. [Google Scholar] [CrossRef]
  13. Chen, W.B.; Inagawa, Y.J.; Omatsu, T.; Tateda, M.; Takeuchi, N.; Usuki, Y. Diode-Pumped, self-stimulating, passively Q-switched Nd3+: PbWO4 Raman laser. Opt. Commun. 2001, 194, 401–407. [Google Scholar] [CrossRef]
  14. Jia, H.X.; Ding, S.H.; Liu, J.J.; Ding, Z. Laser-diode-pumped Cr4+: YAG passively Q-switched Intracavity PbWO4 mode-locked Raman laser. Chin. J. Lasers 2014, 41, 7. [Google Scholar]
  15. Baidu Wenku. Available online: https://wenku.baidu.com/view/af779d3a87c24028915fc3f6.html (accessed on 25 July 2019).
  16. Li, Y.; Yan, S.Y.; Chen, Y. Study of quartz Raman spectrum at high pressure and room temperature. Spectrosc. Spectr. Anal. 2011, 31, 2120–2122. [Google Scholar]
Figure 1. The structures of Raman crystals (a) α-SiO2, (b) β-SiO2, (c) Pb4+-doped α-SiO2, (d) Pb4+-doped β-SiO2.
Crystals 09 00569 g001
Figure 2. The crystals’ lattice parameters (a) α-SiO2, (b) β-SiO2, (c) Pb4+-doped α-SiO2, (d) Pb4+-doped β-SiO2.
Crystals 09 00569 g002
Figure 3. The variants for SiO2.
Crystals 09 00569 g003
Figure 4. The Raman spectrums of α-SiO2 crystal under different pressure. (a) Raman frequency shifted from 0 to 1400 cm−1, (b) Raman frequency shifted from 200 cm−1 to 900 cm−1.
Crystals 09 00569 g004
Figure 5. The Raman spectrums of β-SiO2 crystal under different pressure and temperature. (a) 527 K, (b) 727 K, (c) 1127 K, (d) 1527 K.
Crystals 09 00569 g005aCrystals 09 00569 g005b
Figure 6. The Raman spectrums of Pb4+-doped α-SiO2 crystal under different pressure at 127 K.
Crystals 09 00569 g006
Figure 7. The Raman spectrums of Pb4+-doped β-SiO2 crystal under different pressure and temperature. (a) 527 K, (b) 727 K, (c) 1127 K, (d) 1527 K.
Crystals 09 00569 g007
Table 1. Partial Raman spectrums.
CrystalsTemperature/KRaman Spectrums/cm−1
α-SiO2127117, 135, 241, 343, 686, 782, 1055, 1144
β-SiO21527221, 458, 1101, 1206
Pb4+-doped α-SiO2127270, 382, 532, 600, 938, 1055
Pb4+-doped β-SiO2527148, 107 216, 282, 381, 445, 487, 559, 930
Pb4+-doped β-SiO272775, 102, 145, 183, 278, 396, 446, 502, 558, 936, 1161
Pb4+-doped β-SiO211278, 29, 75, 121, 176, 282, 382, 448, 492, 555, 937, 1168
Pb4+-doped β-SiO215277, 28, 75, 121, 173, 295, 381,440, 492, 558, 933, 1166

