Article

Microalgae Cultivation for the Biotransformation of Birch Wood Hydrolysate and Dairy Effluent

1
Department of Forest Biomaterials and Technology, Swedish University of Agricultural Sciences, 90183 Umeå, Sweden
2
Department of Wildlife, Fish and Environmental Studies, Swedish University of Agricultural Sciences, 90183 Umeå, Sweden
3
Department of Chemistry, Umeå University, 90187 Umeå, Sweden
4
Biochemical Process Engineering, Division of Chemical Engineering, Department of Civil, Environmental and Natural Resources Engineering, Luleå University of Technology, 97187 Luleå, Sweden
*
Author to whom correspondence should be addressed.
The authors contributed equally to the work.
Catalysts 2019, 9(2), 150; https://doi.org/10.3390/catal9020150
Submission received: 12 December 2018 / Revised: 24 January 2019 / Accepted: 30 January 2019 / Published: 2 February 2019
(This article belongs to the Special Issue Environmental Biocatalysis: From Remediation to Waste Valorization)

Abstract

:
In order to investigate environmentally sustainable sources of organic carbon and nutrients, four Nordic green microalgal strains, Chlorella sorokiniana, Chlorella saccharophila, Chlorella vulgaris, and Coelastrella sp., were grown on a wood (Silver birch, Betula pendula) hydrolysate and dairy effluent mixture. The biomass and lipid production were analysed under mixotrophic, as well as two-stage mixotrophic/heterotrophic regimes. Of all of the species, Coelastrella sp. produced the most total lipids per dry weight (~40%) in the mixture of birch hydrolysate and dairy effluent without requiring nutrient (nitrogen, phosphorus, and potassium—NPK) supplementation. Overall, in the absence of NPK, the two-stage mixotrophic/heterotrophic cultivation enhanced the lipid concentration, but reduced the amount of biomass. Culturing microalgae in integrated waste streams under mixotrophic growth regimes is a promising approach for sustainable biofuel production, especially in regions with large seasonal variation in daylight, like northern Sweden. To the best of our knowledge, this is the first report of using a mixture of wood hydrolysate and dairy effluent for the growth and lipid production of microalgae in the literature.

1. Introduction

Microalgal mass culture has been carried out mainly under photoautotrophic conditions, using light as energy and CO2 as a carbon source [1]. Although metabolite production is relatively high, this cultivation method is frequently associated with low biomass concentrations as a result of the light limitations in the major part of the algal culture [2,3]. Self-shading and/or photoinhibition are common problems in culturing photosynthetic organisms [2,3]. To eliminate the light requirement, microalgae can instead be heterotrophically cultivated to increase cell density and biomass production [4,5]. Additionally, heterotrophic cultivation promotes the accumulation of lipids at the expense of proteins in the biomass, which is a desired feature for biodiesel production from microalgae [6,7,8]. Species of the genera Chlorella, Tetraselmis, and Nitzschia were shown to grow at higher rates under heterotrophic conditions compared with photoautotrophic systems [9,10,11,12]. However, not all microalgae can grow in total darkness. In order to perform heterotrophic growth, microalgal species require special physiological abilities to divide and metabolize in darkness, as they have to rapidly adapt to the new environment and withstand hydrodynamic stresses. For large scale biomass generation, growth in inexpensive and easily sterilized medium is required [12]. A drawback of heterotrophic cultivation is the high production cost of the organic carbon source, a weakness that can be overcome by the use of organic carbon sources recovered from waste streams [13,14].
In mixotrophy, microalgae use light as the main energy source to perform photosynthesis, but both CO2 and organic compounds are equally essential as a carbon source. Depending on the light intensity, concentration of CO2, and availability of organic compounds, the microalgae will either grow photoautotrophically or heterotrophically [15]. Mixotrophy is a suitable culture method for microalgal species that are not able to grow in complete darkness. Although this growth regime is less studied, most microalgal species investigated so far have been shown to produce higher biomass yields along with higher lipid, starch, and protein productivities compared with photoautotrophic regimes [11,16,17]. Therefore, the production of mixotrophic microalgae allows for the integration of photosynthetic and heterotrophic metabolisms during the diurnal cycle, thus reducing the impact of biomass loss during dark-respiration, and decreasing the costs of the organic substances utilised during growth in daylight [18]. For these reasons, mixotrophic cultivation should be preferred within the microalgae-to-biofuels process. Notwithstanding, the cost of the organic carbon source, such as glucose, can account up to 79.3% of the total raw material cost during biodiesel production [14]. To investigate alternative, cheaper carbon and nutrient sources, in this study, we tested a mixture of wood hydrolysate and dairy effluent as a growth medium for the microalgae. The nutrients existing in the dairy effluent can serve as a source of medium nutrient, and the glucose present in the wood hydrolysate can function as an organic carbon source. Dairy effluents and wood hydrolysates are available waste streams in Sweden, and can easily be used as a substrate for the cultivation of microalgae. The dairy industry is generally considered to generate the highest amount of wastewater among the various food processing industries. It is estimated that the production of one litre of milk generates on average between 6 and 10 litres of wastewater [19,20]. The highly diversified processes of this industry, leads to the generation of wastes of diverse quality and quantity. Even though dairy pollutants mainly consist of organic compounds [21], their discharge into freshwater streams can cause pollution problems [20]. Considering that lignocellulose biomasses represents about 50% of the total amount of biomass worldwide [22], it is very relevant from an environmental point of view to recycle different forest residues, such as wood hydrolysate, that consist of sugar-rich fractions comprising derivatives of hemicellulose and cellulose by-products, which can be reused and valorised in a safe and environmental-friendly way [23].
The objectives of this study were as follows: (1) to develop a cheap and effective growth regime (mixotrophic and a two stage mixotrophic/heterotrophic process) for the local green microalgae Chlorella sorokiniana, Chlorella saccharophila, Chlorella vulgaris, and Coelastrella sp.; (2) to enhance biomass and lipid production; and (3) to investigate the simultaneous treatment of dairy wastewater and to valorise the hydrolysate from birch wood chips. Although various sources of plant biomass have already been investigated in the literature [24,25], only a few studies have assessed the potential of wood hydrolysate as an organic carbon source for microalgae cultivation [26,27]. To date, the present study is the first to evaluate the feasibility of a mixture of wood hydrolysate and dairy effluent for the growth and lipid production of microalgae.

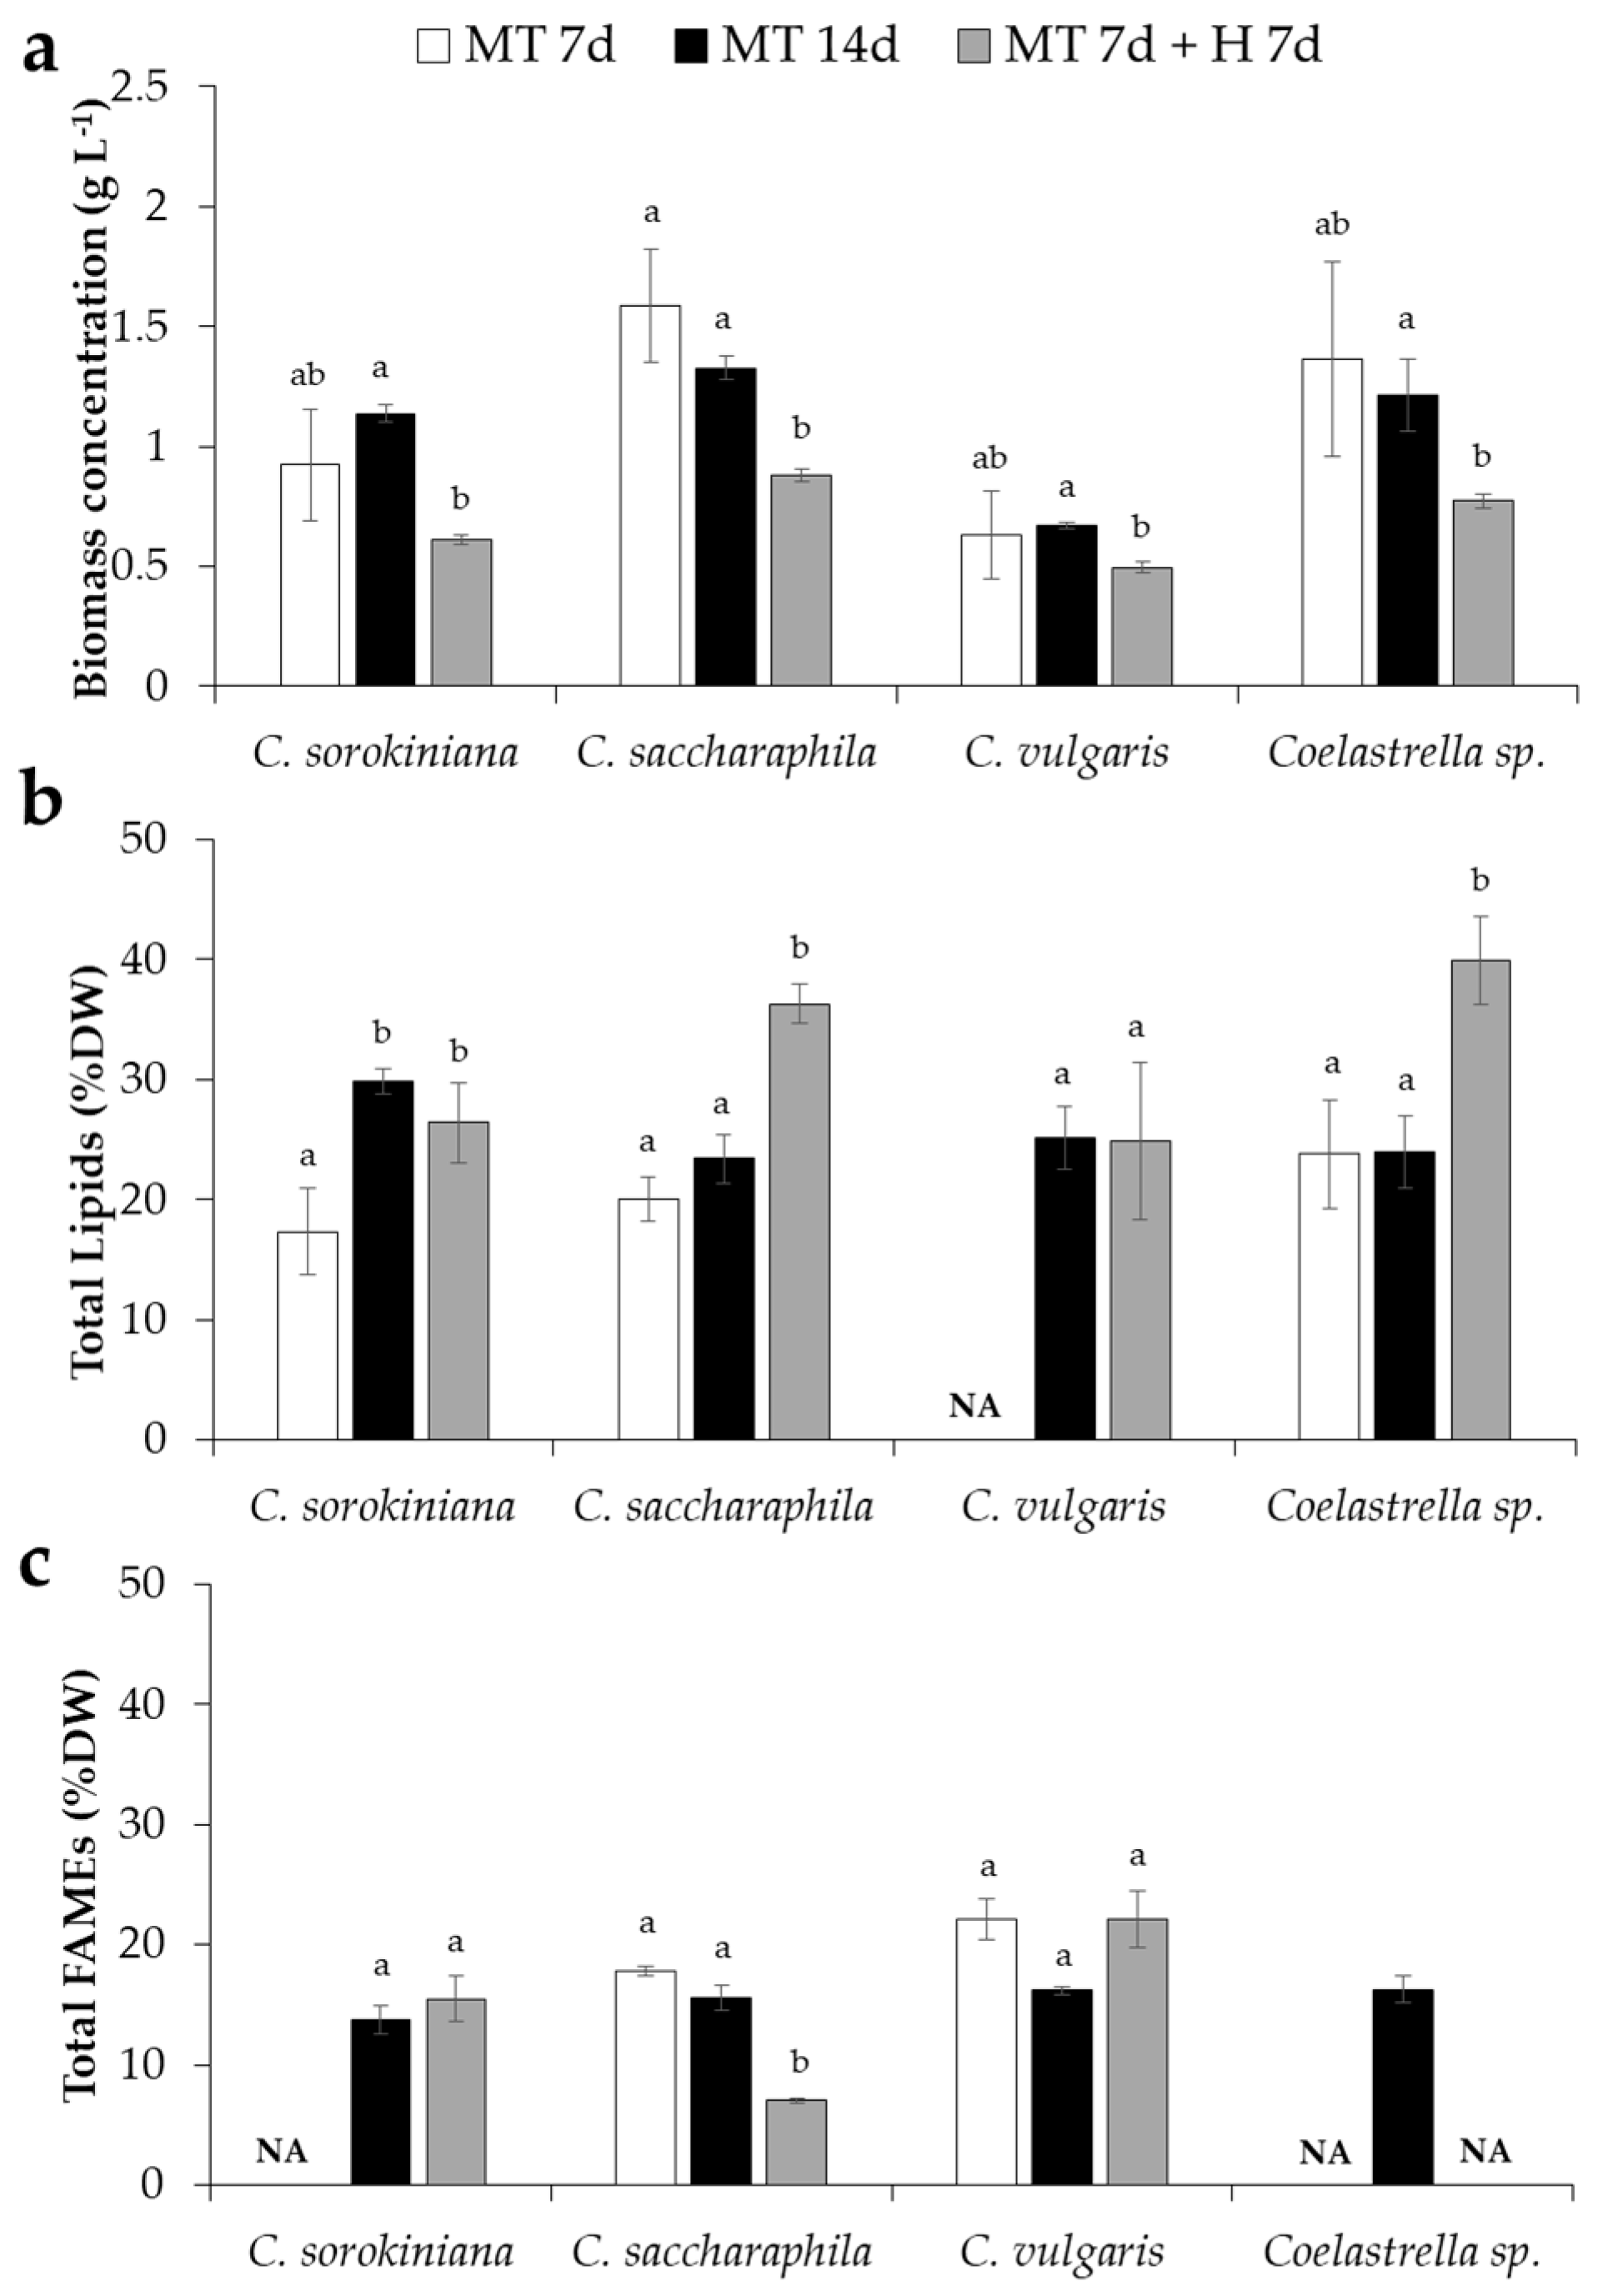
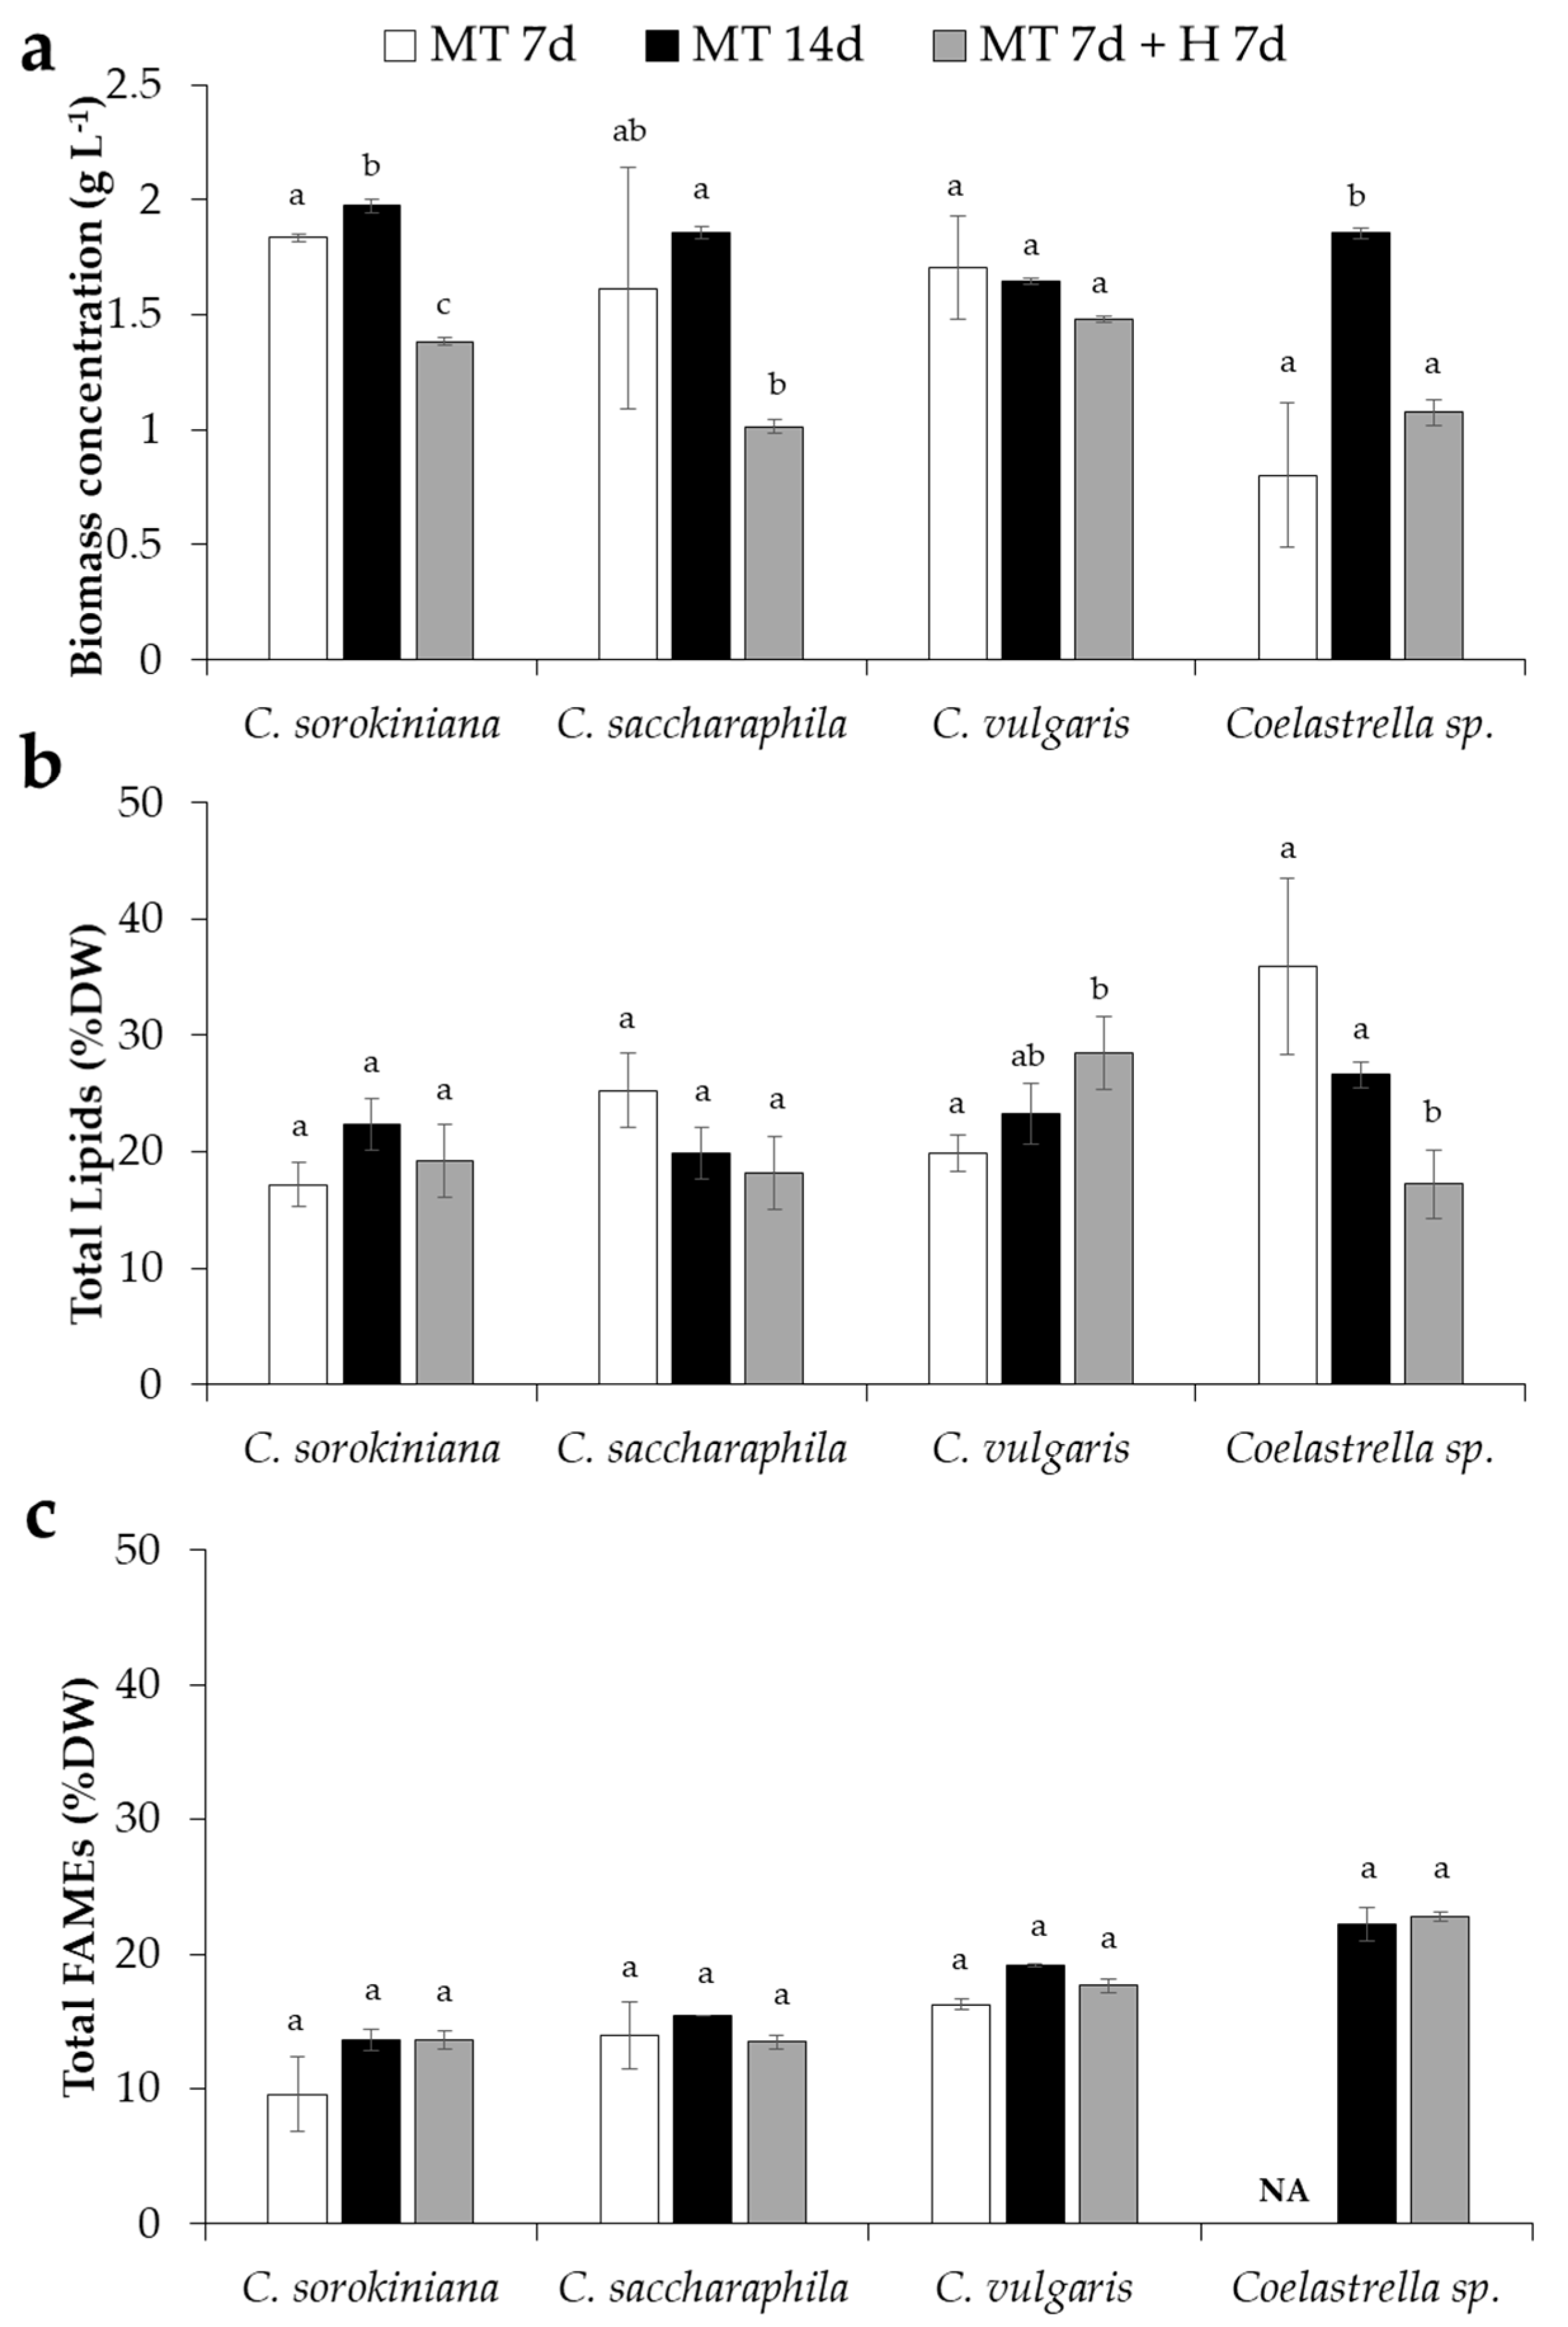
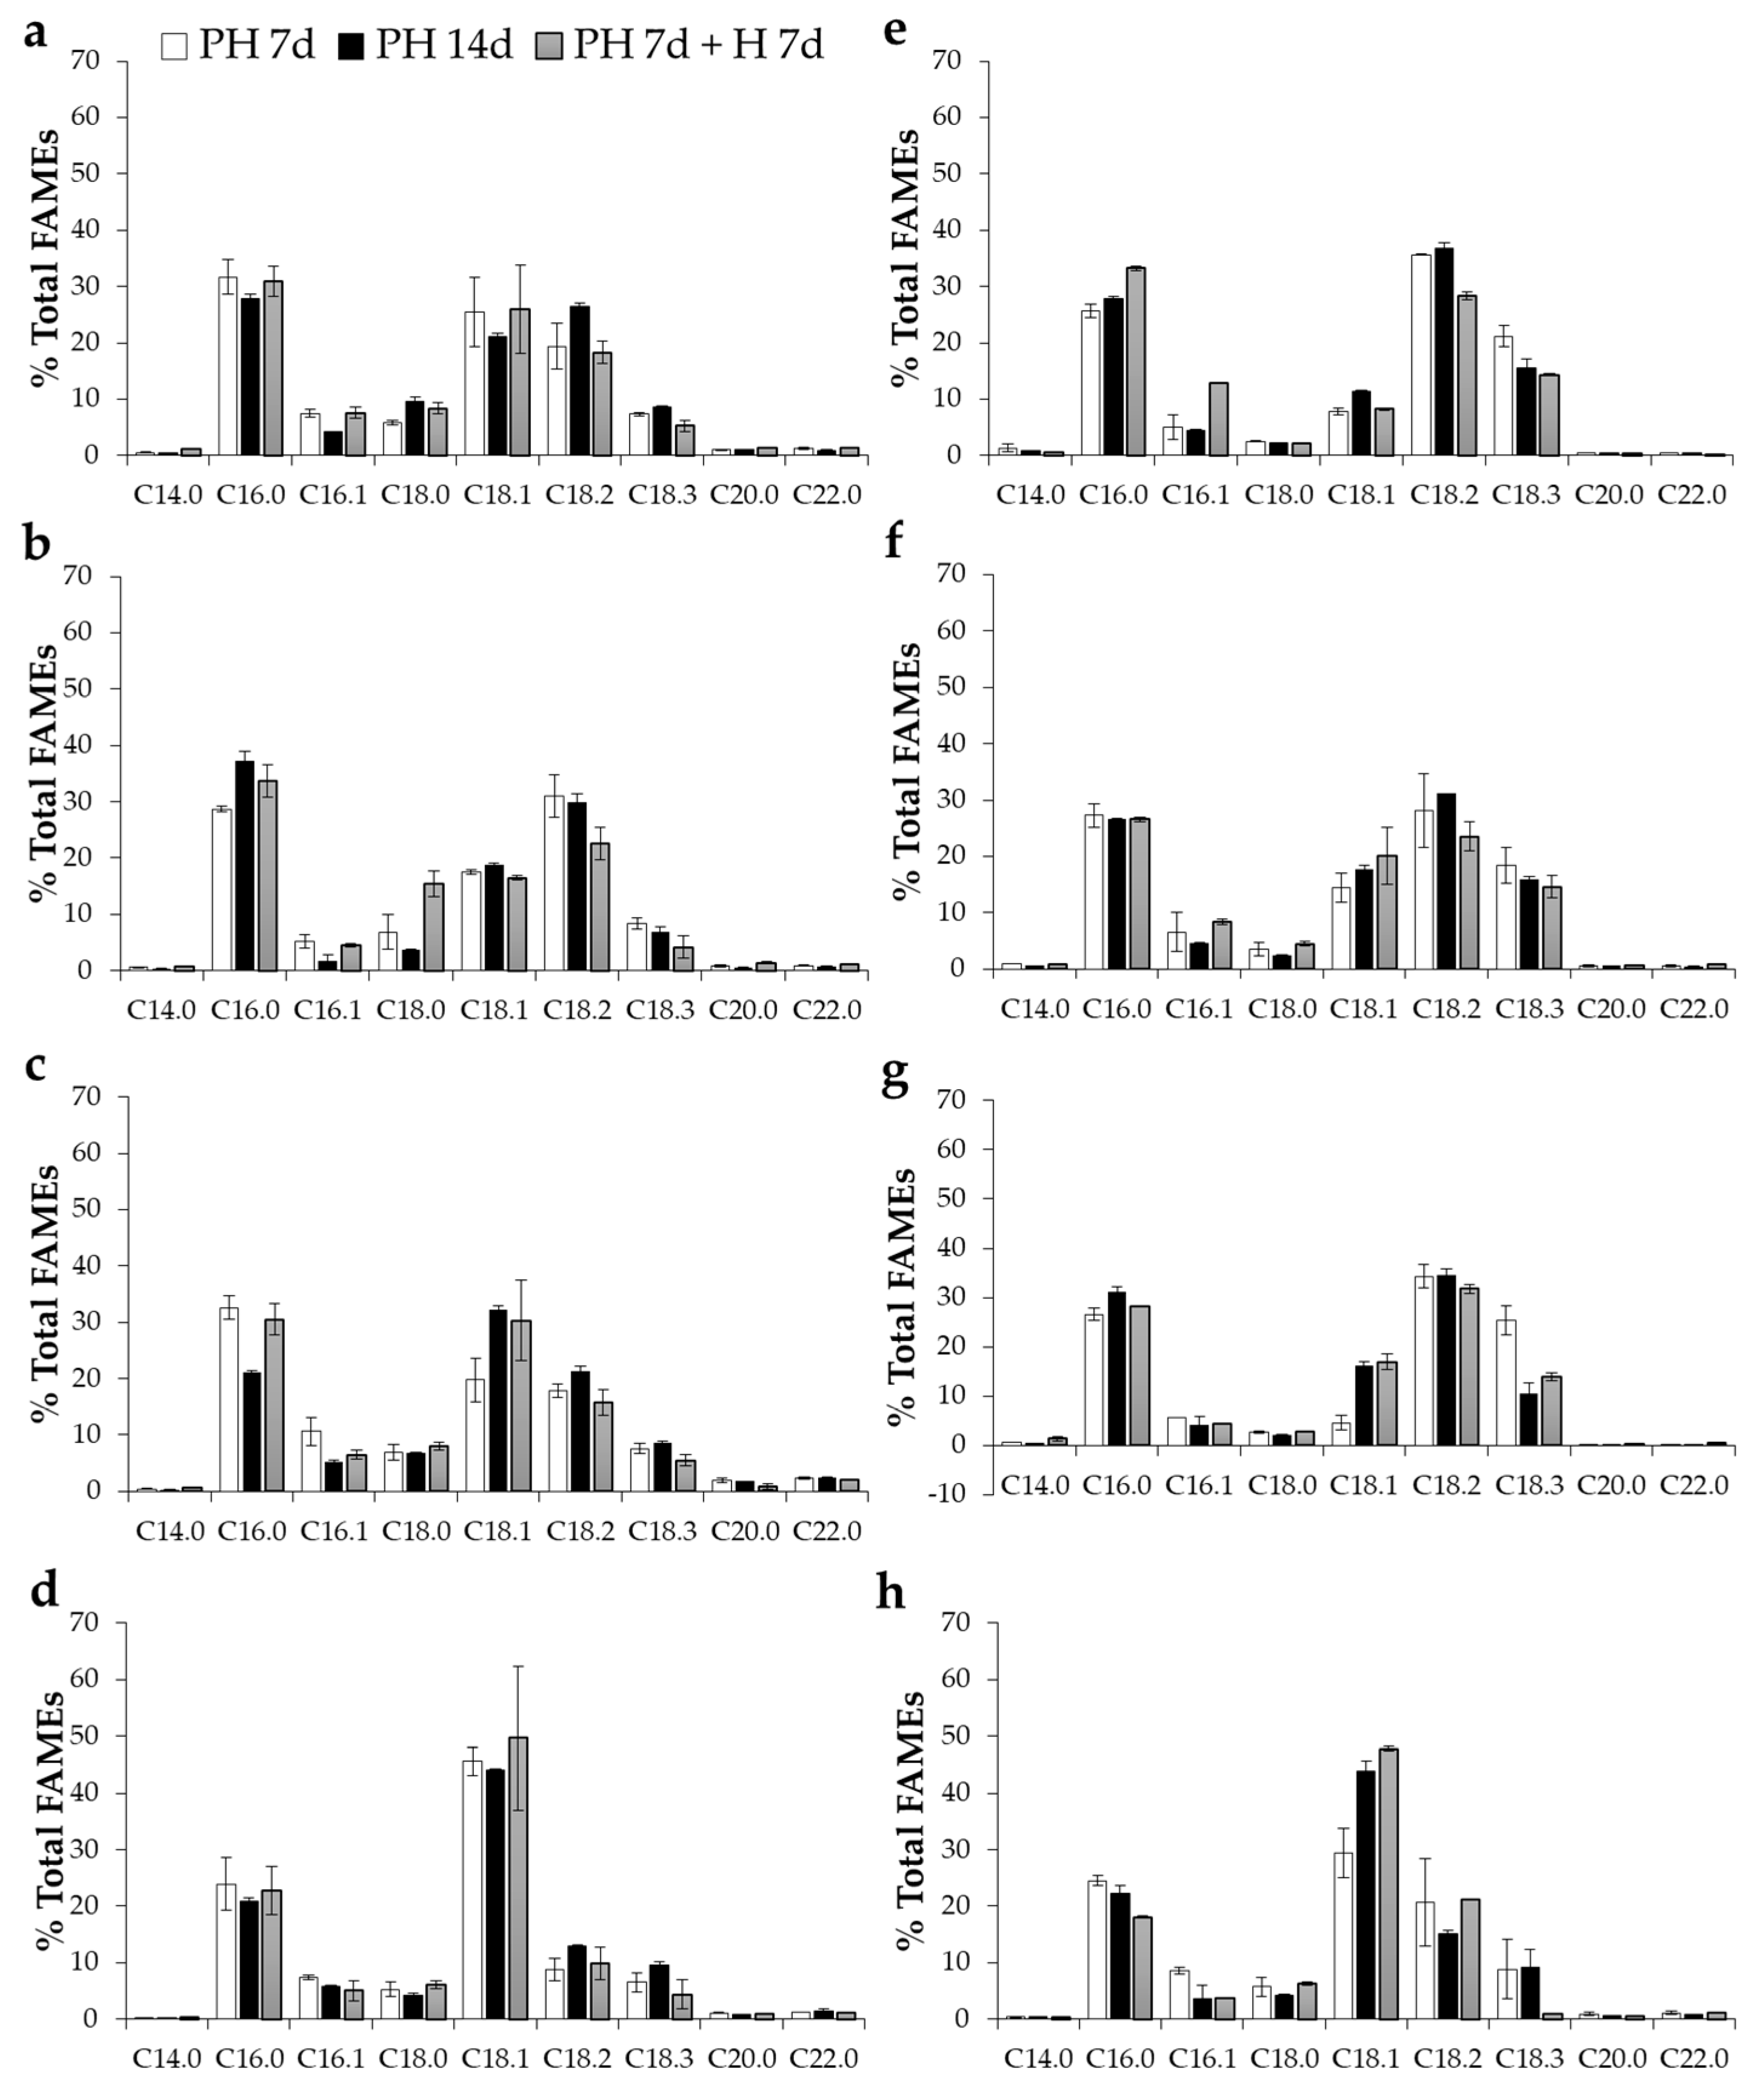
2. Results and Discussion

Four locally isolated microalgal strains (i.e., C. sorokiniana, C. saccharophila, C. vulgaris, and Coelastrella sp.) [27] were cultivated in a medium containing birch wood hydrolysate and dairy effluent in the presence or absence of NPK (nitrogen, phosphorus, and potassium) supplementation. The dilution ratio of the birch hydrolysate with dairy effluent was selected in order to provide an adequate nutrient supply to the growth medium (Table 1), and to achieve about a 2 g L−1 glucose concentration. Although the microalgae biomass increases when the glucose concentration is increased from 0 to 10 g L−1, high glucose concentrations have been shown to negatively affect the lipid accumulation of Chlorella species under a mixotrophic condition [28,29]. In addition, when high glucose concentrations are used, most of the glucose is not consumed by the microalgae and remains instead in the medium [29]. For instance, C. sorokiniana cultured in a mixotrophic regime for 12 days with 5, 10, and 15 g L−1 of glucose produced 0.57 ± 0.06, 0.67 ± 0.07, and 0.53 ± 0.06 g L−1 of lipids, respectively, and utilized 93 ± 6, 73 ± 2, and 36 ± 2% (w/w) of the glucose added [29].
The microalgae production of biomass, lipids, and fatty acid methyl esters (FAMEs) were tested in mixotrophic growth for 7 and 14 days (MT 7d and MT 14d), or during a two-stage growth regime including mixotrophic growth for 7 days, followed by heterotrophic growth (H) for 7 days (MT 7d + H 7d). The two stages’ cultivation strategies, including separate steps for growth and for cell stress, have been shown to enhance lipid accumulation in microalgae [30,31,32]. Therefore, during the first 7 days in mixotrophy, the microalgae were expected to use most of the nutrients and organic carbon, and during the following H 7 days, they were hypothesized to use the remaining organic carbon for lipid accumulation. In MT 14 days, however, the microalgae can photosynthesise during the entire period of time. Both the nutrient and organic carbon limitation in the last 7 days of culture (MT 14d and MT 7d + H 7d) represent a stress factor (Table 1). In medium lacking algae inoculation (control), the total suspended solids were very low (Table 2).
All of the microalgal strains cultivated in the birch hydrolysate and dairy effluent had significantly higher biomass concentrations under MT 14d than under the two-stage mixotrophic/heterotrophic growth, independent of the presence of NPK, with the exception of C. vulgaris, where, in the presence of NPK, no statistically significant difference was observed (Figure 1A and Figure 2A), resulting in higher biomass productivities (Table 3). The biomass production during the mixotrophic regime for 7 days (MT 7d), was higher than the mixotrophic regime for 14 days (MT 14d) and of the MT 7d + H 7d, independent of the presence of NPK. The algae already consumed between 50% and 60% of the total organic carbon (TOC) during MT 7d (Table 1), and the TOC consumption was only slightly changed over time. Hence, we speculate that the remaining sugars (i.e., xylose) were not available to algae. Generally, the heterotrophic step had a detrimental effect on the algal biomass, resulting in a lower biomass production, which was particularly evident in C. sorokiniana and C. saccharophila (Figure 1A and Figure 2A). As observed by others, the dual carbon assimilation (inorganic atmospheric CO2 and organic carbon uptake from the medium) of the mixotrophic microalgae resulted in a higher biomass productivity, which subsequently might lead to the formation of energy storage products as a result of the increased availability of carbon [15,28,30]. Accordingly, the percentage of carbon in the biomass of all of the microalgae strains was slightly higher at MT 14d than at MT 7d + H 7d, which was mainly noticed in the cultures without NPK (Table 3). During MT 7d, a rapid growth of microalgal biomass was facilitated by the presence of sufficient nutrients and carbon (Table 1), while at the stress phase of H 7d, a trophic–metabolic change from a mixotrophic to a heterotrophic process, as well as a potential depletion in organic carbon, resulted in a decrease of biomass production [32]. In the mixotrophic stress phase of MT 14d, in the absence of NPK supplementation, the results were species dependent. NPK supplementation led to higher biomass productivities, independent of the growth regime (Table 3). In the presence of NPK, C. sorokiniana produced the highest biomass (Figure 2A, 1.84 ± 0.02 (MT 7d), 1.97 ± 0.03 (MT 14d), and 1.38 ± 0.02 g L−1 (MT 7d + H 7d)).
In contrast to biomass, the total lipid contents of all of the four strains were generally slightly higher in the absence of NPK than in its presence, independent of the growth regime (Figure 1B and Figure 2B). Nutrient limitation without NPK (Table 1), particularly nitrogen, is known to result in the cessation of microalgal growth, and subsequently, a low biomass content [33,34], but it stimulates the accumulation of reserve lipids, mainly in the form of triacylglicerols (TAGs) [8,30,35]. During photoautotrophic and mixotrophic photosynthesis, the algae assimilate CO2, which is used for growth (proteins) or is stored as carbohydrates, under nutrient limiting conditions. However, TAGs accumulated [30] as nitrogen are not available for protein synthesis [36]. These data are corroborated by the lower total nitrogen content measured in our microalgae grown in the absence of NPK (Table 3), with the exception of C. vulgaris at MT 7d + H 7d; and by the nitrogen concentrations in the medium at the end of the experiments (Table 1). Our results further support the connection between microalgal lipid-production and nitrogen availability. However, the microalgal response to nitrogen deficiency is highly variable and strain-specific. Microalgal strains can respond to nutrient starvation by either a several folds increase of lipids, or no change at all, or they can even slightly reduce their lipid amount. Some strains of Chlorella were found to accumulate starch during nitrogen starvation, whereas others accumulated mainly neutral lipids [37]. Although, in the absence of NPK, the two-stage MT 7d+ H 7d and MT 14d cultivations resulted in an equal or higher lipid concentration than the MT 7d (not significant for all strains and growth regimes), as reported in the literature [30,31,32]; the lipid productivities of the MT 7d+ H 7d and MT 14d cultivations were lower than MT 7d. The reduction of lipid productivity for MT 7d+ H 7d and MT 14d was more noticeable in the presence of NPK. The lipid productivities of MT 7d+ H 7d and MT 14d were equivalent, suggesting that the low lipid productivities were a consequence of the low biomass produced during the last 7 days of culture. In the absence of NPK, the prolonged mixotrophic growth for 14 days instead of 7 days only led to a significant increase of lipid content in C. sorokiniana; its FAMEs content increased as well, but it was not statistically significant (Figure 1B,C). Again, as observed for the lipids, an increase in FAMEs content did not result in higher FAMEs productivities (Table 3). C. saccharophila and Coelastrella sp., however, accumulated significantly more lipids in the two-stage mixotrophic/heterotrophic cultivation system (36.32% ± 1.67% and 39.92% ± 3.68% DW, respectively) than in restricted mixotrophic regimes (MT 7d: 20.01% ± 1.87% and 23.77% ± 4.49%; MT 14d: 23.77% ± 4.49% and 23.93% ± 2.99% DW) (Figure 1B). The switch from mixotrophic to heterotrophic metabolism, which induces FAMEs production, is associated with the degradation of structural membranes, photosynthetic proteins, and chlorophylls in the chloroplast [38,39]. In C. saccharophila grown in the absence of NPK, the FAMEs’ concentration at MT 7d + H 7d was significantly lower than both of the mixotrophic regimes.
Notably, in the presence of NPK, the lipid contents of Coelastrella sp. were significantly lower during the two-stage mixotrophic/heterotrophic growth compared with the mixotrophic growth (Figure 2B). Thus, this suggests that the excess of carbon absorbed by dual carbon assimilation during mixotrophy resulted in a higher lipid production in the Coelastrella sp. mixotrophic cultures [28]. Accordingly, the percentage of carbon in Coelastrella sp. was 3% higher in the MT 14d than in the biomass after the MT 7d + H 7d growth. The total lipid content of the C. vulgaris biomass was significantly higher after the two-stage growth than in MT 7d in the presence of NPK. However, the C. vulgaris FAMEs’ concentrations remained unchanged under this condition (Figure 2B,C).
At the end of MT 7d, all of the microalgae strains cultured without NPK were nitrogen-limited, that is, NH4+-N was reduced 91 to 99% after 7 days of mixotrophic growth (Table 1). NH4+-N is the preferred nitrogen source for microalgae, mainly because it is the most energetically efficient source, as less energy is required for its uptake. When NH4+-N and NO3-N are supplied together, Chlorella sp. uses NH4+-N first, which is incorporated into the organic compounds produced [9]. In the absence of NPK, the total phosphorous (TP) used for the all microalgae strains growth and development was between 81% and 84% at MT 7d, 45% and 60% at MT 14d, and 74% and 81% at MT 7d + H 7d. In the presence of NPK, the nutrients were also consumed to a great extent in the first 7 days of mixotrophic growth in all of the strains, the NH4+-N concentration was reduced by 86% to 93%, and NO3-N by 98%, and the TP content depleted by between 74% and 82% (Table 1). Nitrogen accounts for 1%–10% of the dry matter in microalgae, and is the most important nutrient affecting growth and lipid accumulation [40]. The nitrogen content in the biomass of the investigated Nordic species was the lowest in the Coelastrella sp. grown mixotrophically in the absence of NPK (MT 14d: 3.38% ± 0.11% DW) and highest in C. vulgaris grown without NPK in the mixo-/hetero-trophic two-stage regime (MT 7d + H 7d: 11.04% ± 0.03% DW) (Table 4). It is interesting to notice that independent of NPK addition, the algae grown under MT 7d + H 7d had a higher nitrogen concentration and a lower C/N ratio than the algae grown at a mixotrophic condition (MT 14; Table 4). The algal nitrogen content therefore seems to be linked not only to the amount of available nitrogen in the medium (Table 1), but also to the growth regime. Concerning the total carbon content, only slight variations were observed in the different growth regimes in the presence NPK. The highest carbon content was measured in the mixotrophic algal cultures (MT 14d) in the absence of NPK (Table 4). Phosphorous, another essential component for microalgal growth and development, only accounts for about 1% of the total microalgal biomass (approximately 0.3%–0.6%) [41]. The results obtained in the present study are in agreement with previous studies on microalgae grown on a different lignocellulosic biomass [24,27]. C. sorokiniana grown in 12% beech (Fagus sylvatica) wood acid hydrolysate, with approximately 0.37 g L−1 organic carbon (glucose + acetate), produced 0.33 ± 0.01 and 0.22 ± 0.01 g L−1 biomass in 32.5 h, under mixotrophic and heterotrophic regimes, respectively [27]. The total fatty acid content was 5.20% ± 0.18% and 4.44% ± 0.24% DW under mixotrophic and heterotrophic regimes, respectively [27]. C. protothecoides has been found to produce 2.83 g L−1 of biomass with a 56.3% DW lipid content after 60 h of mixotrophic cultivation on a plant biomass (rice straw, Oryza sativa) hydrolysate (10 g L−1 glucose concentration) [24]. In comparison, this microalgae, grown heterotrophically in another plant (cassava, Manihot esculenta), a hydrolysate (10 g L−1 glucose concentration), for 240 h, produced approximately 7 g L−1 of biomass, but only a 22% DW lipid content [25]. In another study of heterotrophic cultivation, Auxenochlorella protothecoides was grown for 120 h using Silver birch (Betula pendula) and Norway spruce (Picea abies) hydrolysates, with a 10 times higher glucose concentration than in the present study. The biomass concentration and lipid content were 8.56 ± 0.21 and 8.37 ± 0.13 g L−1, and 66.00% ± 0.33% and 63.08% ± 0.71% DW for the birch and spruce hydrolysate, respectively [26].
Similar to the FAMEs yields, the FAMEs compositions did also not vary significantly in dependence to the growth regime (Figure 3); the dominant FAMEs were C16:0, C18:1, and C18:2 in all four of the strains, with the amount of C18:3 lower than expected. Generally, the FAMEs’ composition of the three Chlorella strains was similar, with some minor differences in the C18 FAMEs proportions (Figure 3). C16:0 was the dominant FAME in the three Chlorella strains (on average 32% of total FAMEs); in Coelastrella sp., methyl oleate (C18:1) was the dominant fatty acid (on average 43%). Interestingly, substantial differences in the FAME composition were observed upon the availability of NPK. In the presence of NPK, the amount of C18:2 increased in all of the strains and growth regimes (Figure 3). Decreased nutrient availability in the absence of NPK (Table 1), and two-stage mixo-/hetero-trophic growth, resulted in a higher relative content of C16:0 and C18:1, while the relative content of C18:3, and potentially other n-3 polyunsaturated fatty acids [42], was lower (Figure 3).

3. Materials and Methods

3.1. Collection and Cultivation of Microalgal Strains

Four microalgal strains were isolated from the municipal wastewater (Vakin AB) located in Umeå (63°86′ N), northern Sweden, and were genetically identified as Chlorella sorokiniana, Chlorella saccharophila, Chlorella vulgaris, and Coelastrella sp. [27]. The microalgal strains were grown for 7 days in a BG11 medium with 1.5% agar [43] under a 16:8 h light–dark cycle at 22 °C (light) and 16 °C (dark) in a growth cabinet (Conviron A1000 IN, Winnipeg, MB, Canada). Light intensity, expressed as PAR (photosynthetic active radiation), was ≈ 150 µmol m−2 s−1. Liquid cultures were prepared by inoculating two loops (2-mm diameter loop) of microalgae in Erlenmeyer flasks of 250 mL total volume, containing 150 mL of mixed birch hydrolysate and dairy effluent (see below for preparation), under the same culture conditions described above, and kept under continuous magnetic stirring at 100 rpm. The Erlenmeyer flasks were covered with aluminium foil. Glassware and the substrate were sterilized by autoclaving them at 120 °C for 20 min.

3.2. Assessment of Birch Hydrolysate and Dairy Effluent as Growth Medium

Wood chips from Silver birch (Betula pendula) were pre-treated with acid catalysed assisted hydrothermal pre-treatment [43]. Briefly, the pre-treatment took place at 190 °C at a holding time of 4–6 min, and sulfur dioxide at a concentration of 0.025 kg kgbiomass−1, was used as catalyst. As a result, a slurry of approximately 21.69% (w/w) solid content [43] was produced. The pH of the slurry was adjusted to 5 prior to enzymatic saccharification, and the slurry was diluted to a solid concentration of 20% (w/w) with a concentrated Na2HPO4–citric acid buffer, to achieve a final buffer concentration of 50 mM in the diluted slurry. For the enzymatic saccharification, the enzyme solution Cellic® CTec2 (with an enzyme activity of 238 FPU/ml (filter paper unit; [44])) from Novozymes A/S (Bagsværd, Denmark), was used at an enzyme load corresponding to 15 FPU g−1 of solids. Saccharification took place in an orbital shaker at 50 °C and 160 rpm for 24 h. At the end of the saccharification, the sugar concentration in the slurry was determined by high-performance liquid chromatography (HPLC; PerkinElmer, Waltham, MA, USA) equipped with a refractive index detector, and a Bio-Rad Aminex HPX-87P column (BioRad, Hercules, CA, USA) operating at 85 °C with 0.6 mL/min of ultrapure water. The sugars’ concentration was to be 61.7 g L−1 glucose and 42.4 g L−1 xylose. The undiluted hydrolysates contained 14.7 g L−1 acetic acid, 1.7 g L−1 furfural, 0.2 g L−1 HMF (determined by HPLC equipped with RI and a Bio-Rad Aminex HPX-87H column operating at 65 °C with 0.6 mL/min of 5 mM H2SO4), and 4.7 g L−1 phenols (determined with the Folin–Ciocalteu method with gallic acid as standard, as described before [45]). The dairy effluent had a glucose concentration of 0.05 g L−1, which was also determined by HPLC.
After saccharification, the birch hydrolysate possessed a very dark brown colour, which limited light penetration, and subsequently microalgae photosynthetic activity (data not shown). Additionally, a previous study determined that wood hydrolysate loadings up to 48% inhibited C. sorokiniana growth, potentially because of the toxicity of wood hydrolysates towards microalgae [27]. Therefore, the birch hydrolysate was diluted with deionized water, at a dilution ratio of 1:6 (v/v). After dilution, the pH was adjusted to 7. The diluted birch hydrolysate was mixed with dairy effluent (Norrmejerier, Umeå, Sweden) so as to provide an adequate nutrient supply to the growth medium (Table 1), and to achieve about a 2 g L−1 glucose concentration. The birch hydrolysate and dairy effluent mixture was subsequently filtered at room temperature with two layers of paper towel (100% cellulose), with a water filtration velocity of about 1.3 mL cm−2 min−1 to remove the largest particles, followed by overnight sedimentation at 4 °C. The feasibility of a birch hydrolysate and dairy effluent mixture as a growth medium for microalgae was investigated in the presence or absence of NPK, which was added as sodium nitrate (NaNO3) and dipotassium phosphate (K2HPO4) to a final concentration of 1.5 and 0.04 g L−1, respectively (Table 1).
The four microalgal strains, Coelastrella sp., C. sorokiniana, C. saccharophila, and C. vulgaris, were cultivated under either mixotrophic culture conditions, samples were taken after 7 and 14 days (designated as MT 7d and MT 14d, respectively), or for 7 days under mixotrophic, followed by 7 days under heterotrophic culture conditions (designated as MT 7d and H 7d). The cultures were kept with continuous magnetic stirring at 100 rpm and a 16:8 h light–dark cycle at 22 °C (light) and 16 °C (dark) in a growth cabinet (Conviron A1000 IN, Winnipeg, MB, Canada), with PAR of ≈ 150 µmol m−2 s−1 for the mixotrophic conditions, or total darkness for the heterotrophic conditions. Samples of 10 mL were harvested by centrifugation at 3520 g for 5 min, and the obtained pellets were used to analyse the biomass, total lipids, and FAMEs. The supernatants were stored at −20 °C for nutrient analysis. The control samples deficient of microalgae were taken at MT 7d, MT 14d, and MT 7d + H 7d time points from both mediums of birch hydrolysate/dairy effluent, in the presence or absence of NPK, and were processed similar to the samples. The biomass and total lipid analyses were performed in four replicates, and FAMEs and nutrients analyses in duplicates. The total nitrogen (N) and carbon (C) were determined in triplicates.

3.3. Analytical Methods

3.3.1. Nutrients Analyses

The nutrients—ammonium (NH4+-N), nitrate (NO3-N), total phosphorus (TP), and total organic carbon (TOC)—were analysed using the commercially available nutrient analyses kits, according to the manufactures’ instructions (Hach Lange, Germany). The absorbance measurements were performed using a DR3900 spectrophotometer (Hach Lange, Germany). All of the supernatant samples were thawed at room temperature before the analyses and were diluted, when necessary, to achieve the concentrations within the kit range.

3.3.2. Biomass Concentration

The microalgal biomass concentration was determined in all of the culture conditions immediately after harvesting. The dry weight of the microalgal pellets was determined gravimetrically after oven drying (Memmert, Schwabach, Germany) at 65 °C overnight. The microalgal biomass concentration was expressed as dry weight g L−1.

3.3.3. Total Lipids Extraction

The total lipids were extracted from a fresh microalgal biomass using the method of Folch et al. [46], simplified as described in Axelsson and Gentili [47]. The lipids were extracted using a mixture of chloroform, methanol, and NaCl (0.73% in water) (2:1:0.8 v/v/v). The recovered lipid phase was vacuum dried in a multi-evaporator (Syncore® Polyvap, Büchi Labortechnik AB, Flawil, Switzerland) at 40 °C, 120 rpm, and 275 mbar for 3 h. The quantity of total lipids was measured gravimetrically, and was expressed as a dry weight percentage.

3.3.4. Fatty Acid Methyl Esters Analysis

The fresh microalgal cells were pelletized and boiled immediately after harvesting in 2 mL of isopropanol at 80 °C for 10 min under gaseous nitrogen atmosphere, and were stored at −20 °C until further analyses. After the total lipid extraction, the fatty acids were isolated and purified on thin layer chromatography (TLC), and subsequently transmethylated into FAMEs according to Lage and Gentili [48], based on Christie and Han [49]. The FAMEs extracts were re-suspended with heptane and injected into a TRACE™ 1310 (Thermo Fisher Scientific, Hägersten, Sweden) GC system equipped with flame ionization detector, and a 30 m FAMEWAX column (Restek Corporation, Bellefonte, Pennsylvania, USA) [48]. The FAMEs were identified by comparison of the retention times with authentic standards. The FAMEs’ concentrations were calculated as weight percent by applying theoretical correction factors, and being normalized against the internal standard pentadecanoic acid methyl ester (C15:0).

3.3.5. Total N and Total C Analyses

The total nitrogen and total carbon measurements were performed at the Department of Forest Ecology and Management, Swedish University of Agricultural Sciences (Umeå, Sweden), as described by Werner et al. [50]. The samples were analysed by elemental analyser-isotope ratio mass spectrometry (EA-IRMS). The instrumental setup consisted of an elemental analyser (Flash EA 2000) connected to a continuous flow isotope ratio mass spectrometer (DeltaV), both of which were from Thermo Fisher Scientific (Bremen, Germany). Each sequence of samples was analysed together with two in-house standards in several replicates. The accepted standard deviation of the in-house laboratory standards was <0.15%. The data were corrected for drift and size before the final results were given.

3.4. Statistical Analysis

In order to investigate the statistical differences between the biomass, total lipid, and FAMEs’ concentrations means of different medium and growth regimes, analysis of variance (one-way ANOVA) followed by post-hoc Student’s t-test with Bonferroni correction was applied. Analyses were performed with Microsoft Office Excel 2013 Analysis ToolPak.

4. Conclusions

This study shows, for the first time, that birch hydrolysate and dairy effluent can be used, in combination, as an organic carbon and nutrient source for cultivating microalgae in order to produce lipids. All of the microalgae tested, namely C. sorokiniana, C. saccharophila, C. vulgaris, and Coelastrella sp., could grow in this medium mixture, under both mixotrophic and two-stage mixotrophic/heterotrophic regimes, independently of NPK supplementation. In comparison to the growth phase alone (MT 7d), the prolonged (14 days instead of 7 days) two-stage cultivation strategy (growth phase followed by stress phase), that is, MT 7d + H 7d and MT 14d, generally resulted in a reduction of the biomass, lipids, and FAMEs’ productivity. An exception was C. saccharophila, which had a slightly higher lipid productivity at MT 7d + H 7d. For instance, Coelastrella sp., the highest lipid producer of this study, accumulated up to 40% DW of the total lipids in the absence of NPK. In the presence of NPK, the nutrient replete condition of the medium impaired the effect of the stress phase. In conclusion, culturing microalgae in waste streams under mixotrophy has the potential to become a successful strategy for microalgal cultivation in northern Sweden; a region with large seasonal variation in daylight availability.

Author Contributions

S.L. carried out the analytical and statistical analysis and wrote the original draft. N.P.K. performed the experiment and wrote part of the manuscript. L.F. isolated and genetically identified the local microalgal strains. L.M. prepared the birch hydrolysate and performed glucose HPLC analysis. C.F., U.R., and F.G.G. supervised different aspects of the study. F.G.G. conceived and designed the experiments. All of the authors contributed to the manuscript reviewing and editing. All of the authors have read and approved the final manuscript.

Funding

This research was funded by the Kempe foundation (JCK-1512), the Swedish Energy Agency (project number. 38239-1), the Formas–Swedish Research Council for Sustainable Development (Project number 942-2015-92), the Interreg programme Botnia-Atlantica (TransAlgae project), and Bio4Energy—a strategic research environment appointed by the Swedish government.

Acknowledgments

The authors are thankful to the technical staff at Norrmejerier for providing the dairy wastewater.

Conflicts of Interest

The authors declare no conflict of interest. The funders had no role in the design of the study; in the collection, analyses, or interpretation of data; in the writing of the manuscript; or in the decision to publish the results.

References

  1. Gouveia, L.; Oliveira, A.C. Microalgae as a raw material for biofuels production. J. Ind. Microbiol. Biotechnol. 2009, 36, 269–274. [Google Scholar] [CrossRef] [PubMed]
  2. Chen, G.Q.; Chen, F. Growing phototrophic cells without light. Biotechnol. Lett. 2006, 28, 607–616. [Google Scholar] [CrossRef] [PubMed]
  3. Tredici, M.R. Photobiology of microalgae mass cultures: Understanding the tools for the next green revolution. Biofuels 2010, 1, 143–162. [Google Scholar] [CrossRef]
  4. Huang, G.; Chen, F.; Wei, D.; Zhang, X.; Chen, G. Biodiesel production by microalgal biotechnology. Appl. Energy 2010, 87, 38–46. [Google Scholar] [CrossRef]
  5. Tabernero, A.; del Valle, E.M.M.; Galán, M.A. Evaluating the industrial potential of biodiesel from a microalgae heterotrophic culture: Scale-up and economics. Biochem. Eng. J. 2012, 63, 104–115. [Google Scholar] [CrossRef]
  6. Molina Grima, E.; Belarbi, E.H.; Acién Fernández, F.G.; Robles Medina, A.; Chisti, Y. Recovery of microalgal biomass and metabolites: Process options and economics. Biotechnol. Adv. 2003, 20, 491–515. [Google Scholar] [CrossRef]
  7. Olaizola, M. Commercial development of microalgal biotechnology: From the test tube to the marketplace. Biomol. Eng. 2003, 20, 459–466. [Google Scholar] [CrossRef]
  8. Miao, X.; Wu, Q. Biodiesel production from heterotrophic microalgal oil. Bioresour. Technol. 2006, 97, 841–846. [Google Scholar] [CrossRef]
  9. Shi, X.M.; Jiang, Y.; Chen, F. High-yield production of lutein by the green microalga Chlorella protothecoides in heterotrophic fed-batch culture. Biotechnol. Prog. 2002, 18, 723–727. [Google Scholar] [CrossRef]
  10. Qtae, J.; Eun, J.C.; Doo, W.P.; Benoît, V. Sterol dynamics of heterotrophic Tetraselmis suecica and its nutritional implication in the bivalve aquaculture. Aquac. Res. 2004, 35, 371–377. [Google Scholar] [CrossRef]
  11. Wen, Z.-Y.; Chen, F. Production potential of eicosapentaenoic acid by the diatom Nitzschia laevis. Biotechnol. Lett. 2000, 22, 727–733. [Google Scholar] [CrossRef]
  12. Wen, Z.Y.; Chen, F. Heterotrophic production of eicosapentaenoic acid by microalgae. Biotechnol. Adv. 2003, 21, 273–294. [Google Scholar] [CrossRef]
  13. Perez-Garcia, O.; Escalante, F.M.; de-Bashan, L.E.; Bashan, Y. Heterotrophic cultures of microalgae: Metabolism and potential products. Water Res. 2011, 45, 11–36. [Google Scholar] [CrossRef] [PubMed]
  14. Koutinas, A.A.; Chatzifragkou, A.; Kopsahelis, N.; Papanikolaou, S.; Kookos, I.K. Design and techno-economic evaluation of microbial oil production as a renewable resource for biodiesel and oleochemical production. Fuel 2014, 116, 566–577. [Google Scholar] [CrossRef]
  15. Chojnacka, K.; Marquez-Rocha, F.J. Kinetic and stoichiometric relationships of the energy and carbon metabolism in the culture of microalgae. Biotechnology 2004, 3, 21–34. [Google Scholar]
  16. Heredia-Arroyo, T.; Wei, W.; Ruan, R.; Hu, B. Mixotrophic cultivation of Chlorella vulgaris and its potential application for the oil accumulation from non-sugar materials. Biomass Bioenergy 2011, 35, 2245–2253. [Google Scholar] [CrossRef]
  17. Heredia-Arroyo, T.; Wei, W.; Hu, B. Oil accumulation via heterotrophic/mixotrophic Chlorella protothecoides. Appl. Biochem. Biotechnol. 2010, 162, 1978–1995. [Google Scholar] [CrossRef]
  18. Bassi, A.; Saxena, P.; Aguirre, A.-M. Mixotrophic algae cultivation for energy production and other applications. In Algal Biorefineries; Springer: Dordrecht, The Netherlands, 2014; pp. 177–202. [Google Scholar]
  19. Kaur, A.; Vats, S.; Rekhi, S.; Bhardwaj, A.; Goel, J.; Goel, J.; Tanwar, R.S.; Gaur, K.K. Physico-chemical analysis of the industrial effluents and their impact on the soil microflora. Procedia Environ. Sci. 2010, 2, 595–599. [Google Scholar] [CrossRef] [Green Version]
  20. Russell, P. Effluent and waste water treatment. Milk Ind. Int. 1998, 100, 36–39. [Google Scholar]
  21. Kushwaha, J.P.; Srivastava, V.C.; Mall, I.D. An overview of various technologies for the treatment of dairy wastewaters. Crit. Rev. Food Sci. Nutr. 2011, 51, 442–452. [Google Scholar] [CrossRef]
  22. Mancini, G.; Papirio, S.; Lens, P.N.L.; Esposito, G. Solvent Pretreatments of Lignocellulosic Materials to Enhance Biogas Production: A Review. Energy Fuels 2016, 30, 1892–1903. [Google Scholar] [CrossRef]
  23. Saadatmand, S.; Edlund, U.; Albertsson, A.-C.; Danielsson, S.; Dahlman, O.; Karlstrom, K. Turning hardwood dissolving pulp polysaccharide residual material into barrier packaging. Biomacromolecules 2013, 14, 2929–2936. [Google Scholar] [CrossRef]
  24. Li, P.; Miao, X.; Li, R.; Zhong, J. In situ biodiesel production from fast-growing and high oil content Chlorella pyrenoidosa in rice straw hydrolysate. BioMed Res. Int. 2011, 2011, 141207. [Google Scholar]
  25. Wei, A.; Zhang, X.; Wei, D.; Chen, G.; Wu, Q.; Yang, S.-T. Effects of cassava starch hydrolysate on cell growth and lipid accumulation of the heterotrophic microalgae Chlorella protothecoides. J. Ind. Microbiol. Biotechnol. 2009, 36, 1383. [Google Scholar] [CrossRef]
  26. Patel, A.; Matsakas, L.; Rova, U.; Christakopoulos, P. Heterotrophic cultivation of Auxenochlorella protothecoides using forest biomass as a feedstock for sustainable biodiesel production. Biotechnol. Biofuels 2018, 11, 169. [Google Scholar] [CrossRef]
  27. Miazek, K.; Remacle, C.; Richel, A.; Goffin, D. Beech wood Fagus sylvatica dilute-acid hydrolysate as a feedstock to support Chlorella sorokiniana biomass, fatty acid and pigment production. Bioresour. Technol. 2017, 230, 122–131. [Google Scholar] [CrossRef]
  28. Cheirsilp, B.; Torpee, S. Enhanced growth and lipid production of microalgae under mixotrophic culture condition: Effect of light intensity, glucose concentration and fed-batch cultivation. Bioresour. Technol. 2012, 110, 510–516. [Google Scholar] [CrossRef] [PubMed]
  29. Wan, M.; Liu, P.; Xia, J.; Rosenberg, J.N.; Oyler, G.A.; Betenbaugh, M.J.; Nie, Z.; Qiu, G. The effect of mixotrophy on microalgal growth, lipid content, and expression levels of three pathway genes in Chlorella sorokiniana. Appl. Microbiol. Biotechnol. 2011, 91, 835–844. [Google Scholar] [CrossRef]
  30. Devi, M.P.; Subhash, G.V.; Mohan, S.V. Heterotrophic cultivation of mixed microalgae for lipid accumulation and wastewater treatment during sequential growth and starvation phases: Effect of nutrient supplementation. Renew. Energy 2012, 43, 276–283. [Google Scholar] [CrossRef]
  31. Farooq, W.; Lee, Y.C.; Ryu, B.G.; Kim, B.H.; Kim, H.S.; Choi, Y.E.; Yang, J.W. Two-stage cultivation of two Chlorella sp. strains by simultaneous treatment of brewery wastewater and maximizing lipid productivity. Bioresour. Technol. 2013, 132, 230–238. [Google Scholar] [CrossRef] [PubMed]
  32. Chiranjeevi, P.; Venkata Mohan, S. Diverse acidogenic effluents as feedstock for microalgae cultivation: Dual phase metabolic transition on biomass growth and lipid synthesis. Bioresour. Technol. 2017, 242, 191–196. [Google Scholar] [CrossRef] [PubMed]
  33. Mata, T.M.; Martins, A.A.; Caetano, N.S. Microalgae for biodiesel production and other applications: A review. Renew. Sustain. Energy Rev. 2010, 14, 217–232. [Google Scholar] [CrossRef] [Green Version]
  34. Minhas, A.K.; Hodgson, P.; Barrow, C.J.; Sashidhar, B.; Adholeya, A. The isolation and identification of new microalgal strains producing oil and carotenoid simultaneously with biofuel potential. Bioresour. Technol. 2016, 211, 556–565. [Google Scholar] [CrossRef] [PubMed]
  35. Juneja, A.; Ceballos, R.M.; Murthy, G.S. Effects of environmental factors and nutrient availability on the biochemical composition of algae for biofuels production: A review. Energies 2013, 6, 4607–4638. [Google Scholar] [CrossRef]
  36. Fábregas, J.; Maseda, A.; Domínguez, A.; Ferreira, M.; Otero, A. Changes in the cell composition of the marine microalga, Nannochloropsis gaditana, during a light: Dark cycle. Biotechnol. Lett. 2002, 24, 1699–1703. [Google Scholar] [CrossRef]
  37. Hu, Q.; Richmond, A. Handbook of Microalgal Culture: Biotechnology and Applied Phycology; Blackwell Science: Oxford, UK, 2004. [Google Scholar]
  38. Aoki, S.; Matsuka, M.; Hase, E. De-and re-generation of chloroplasts in the cells of Chlorella protothecoides: V. Degeneration of chloroplasts induced by different carbon sources, and effects of some antimetabolites upon the process induced by glucose. Plant Cell Physiol. 1965, 6, 487–498. [Google Scholar]
  39. Hörtensteiner, S.; Chinner, J.; Matile, P.; Thomas, H.; Donnison, I.S. Chlorophyll breakdown in Chlorella protothecoides: Characterization of degreening and cloning of degreening-related genes. Plant Mol. Biol. 2000, 42, 439–450. [Google Scholar] [CrossRef]
  40. Wijffels, R.H.; Barbosa, M.J.; Eppink, M.H. Microalgae for the production of bulk chemicals and biofuels. Biofuelsbioproducts Biorefining 2010, 4, 287–295. [Google Scholar] [CrossRef] [Green Version]
  41. Hannon, M.; Gimpel, J.; Tran, M.; Rasala, B.; Mayfield, S. Biofuels from algae: Challenges and potential. Biofuels 2010, 1, 763–784. [Google Scholar] [CrossRef]
  42. Reitan, K.I.; Rainuzzo, J.R.; Olsen, Y. Effect of nutrient limitation on fatty acid and lipid content of marine microalgae. J. Phycol. 1994, 30, 972–979. [Google Scholar] [CrossRef]
  43. Matsakas, L.; Rova, U.; Christakopoulos, P. Sequential parametric optimization of methane production from different sources of forest raw material. Front. Microbiol. 2015, 6. [Google Scholar] [CrossRef] [PubMed]
  44. Matsakas, L.; Nitsos, C.; Vörös, D.; Rova, U.; Christakopoulos, P. High-Titer Methane from Organosolv-Pretreated Spruce and Birch. Energies 2017, 10, 263. [Google Scholar] [CrossRef]
  45. Matsakas, L.; Novak, K.; Enman, J.; Christakopoulos, P.; Rova, U. Acetate-detoxification of wood hydrolysates with alkali tolerant Bacillus sp. as a strategy to enhance the lipid production from Rhodosporidium toruloides. Bioresour. Technol. 2017, 242, 287–294. [Google Scholar] [CrossRef] [PubMed]
  46. Folch, J.; Lees, M.; Sloane Stanley, G. A simple method for the isolation and purification of total lipids from animal tissues. J. Biol. Chem. 1957, 226, 497–509. [Google Scholar] [PubMed]
  47. Axelsson, M.; Gentili, F. A single-step method for rapid extraction of total lipids from green microalgae. PLoS ONE 2014, 9, e89643. [Google Scholar] [CrossRef] [PubMed]
  48. Lage, S.; Gentili, F.G. Quantification and characterisation of fatty acid methyl esters in microalgae: Comparison of pretreatment and purification methods. Bioresour. Technol. 2018, 257, 121–128. [Google Scholar] [CrossRef] [PubMed]
  49. Christie, W.; Han, X. Lipid Analysis-Isolation, Separation, Identification and Lipidomic Analysis; Oily Press: Bridgwater, UK, 2010; 446p. [Google Scholar]
  50. Werner, R.A.; Bruch, B.A.; Brand, W.A. ConFlo III—An interface for high precision δ13C and δ15N analysis with an extended dynamic range. Rapid Commun. Mass Spectrom. 1999, 13, 1237–1241. [Google Scholar] [CrossRef]
Figure 1. (a) Biomass concentration (g L−1) (n = 4); (b) total lipids (% dry weight–DW), n = 4; and (c) total fatty acid methyl esters (FAMEs) (%DW) (n = 2), of C. sorokiniana, C. saccharophila, C. vulgaris, and Coelastrella sp., grown in a birch hydrolysate and dairy effluent mixture without nitrogen, phosphorus, and potassium (NPK) supplementation. The cells were cultured mixotrophic (MT) for 7 and 14 days (MT 7d and MT 14d), or mixotrophic for 7 days, and then heterotrophic (H) for another 7 days (MT 7d + H 7d). Error bars express the standard deviation of the mean. The different letters above the bars of the same microalgae indicate a significant difference (p < 0.05). NA—not available.
Catalysts 09 00150 g001
Figure 2. (a) Biomass concentration (g L−1) (n = 4); (b) total lipids (%DW) (n = 4); and (c) total FAMEs (%DW) (n = 2), of C. sorokiniana, C. saccharophila, C. vulgaris, and Coelastrella sp. grown in a birch hydrolysate and dairy effluent with NPK supplementation. The cells were cultured as mixotrophic for 7 and 14 days (MT 7d and MT 14d), or mixotrophic for 7 days, and then heterotrophic for another 7 days (MT 7d + H 7d). Error bars express the standard deviation of the mean. Different letters above the bars of the same microalgae indicate a significant difference (p < 0.05). NA—not available.
Catalysts 09 00150 g002
Figure 3. FAMEs composition (% total FAMEs) of C. sorokiniana, C. saccharophila, C. vulgaris, and Coelastrella sp. grown in birch hydrolysate and dairy effluent, either in the absence (ad) or presence (eh) of NPK. Cells were grown mixotrophic for 7 and 14 days (MT 7d and MT 14d), or first mixotrophic for 7 days, and then heterotrophic for another 7 days (MT 7d + H 7d). Error bars express the standard deviation of the mean (n = 2).
Catalysts 09 00150 g003
Table 1. Nutrients, ammonium (NH4+-N), nitrate (NO3-N), total phosphorous (TP), and total organic carbon (TOC), concentrations (mg L−1) in the birch hydrolysate and dairy effluent medium, with and without nitrogen, phosphorus, and potassium (NPK) supplementation, at day 0, day 7 (mixotrophic growth—MT 7d), and day 14 (mixotrophic and two stage mixotrophic/heterotrophic growth (H)—MT 14d and MT 7d + H 7d) in the cultures of C. sorokiniana, C. saccharophila, C. vulgaris, and Coelastrella sp. Values are expressed as mean ± standard deviation (n = 2).
Without NPK SupplementationWith NPK Supplementation
NH4+-NNO3-NTPTOC (mg/L)TOC Reduction (%)NH4+-NNO3-NTPTOC (mg/L)TOC Reduction (%)
Day 072.70 ± 0.00≤0.50 8.56 ± 0.01663 ± 89-98.40 ± 1.60247.60 ± 2.0016.15 ± 0.15654 ± 66-
C. sorokinianaMT 7d0.85 ± 0.007.07 ± 0.071.58 ± 0.04282 ± 2057.56.58 ± 0.035.48 ± 0.124.15 ± 0.00250 ± 2761.8
MT 14d2.12 ± 0.035.85 ± 0.194.49 ± 0.07232.5 ± 23.564.91.67 ± 0.015.00 ± 0.016.15 ± 0.04198 ± 369.7
MT 7d + H 7d1.47 ± 0.006.10 ± 0.532.20 ± 0.09245 ± 306339.15 ± 0.154.91 ± 0.164.00 ± 0.01202 ± 869.1
C. saccharophilaMT 7d0.33 ± 0.006.64 ± 0.151.52 ± 0.03312 ± 3852.913.65 ± 0.055.50 ± 0.133.67 ± 0.02234.5 ± 14.564.1
MT 14d1.52 ± 0.055.82 ± 0.243.81 ± 0.09258 ± 2261.11.28 ± 0.024.86 ± 0.136.97 ± 0.30269 ± 1158.9
MT 7d + H 7d0.84 ± 0.005.68 ± 0.521.87 ± 0.20241.5 ± 2.563.654.70 ± 0.404.76 ± 0.065.63 ± 0.01229 ± 18.565.0
C. vulgarisMT 7d6.69 ± 0.027.00 ± 0.201.65 ± 0.06298 ± 3255.18.88 ± 0.036.89 ± 0.203.05 ± 0.00221.5 ± 7.566.1
MT 14d0.96 ± 0.005.39 ± 0.224.70 ± 0.12239.5 ± 0.563.920.05 ± 0.156.30 ± 0.158.03 ± 0.67200.5 ± 9.569.3
MT 7d + H 7d0.42 ± 0.006.10 ± 0.571.64 ± 0.22268.5 ± 9.559.515.35 ± 0.055.08 ± 0.023.43 ± 0.04187.5 ± 13.571.3
Coelastrella sp.MT 7d0.41 ± 0.006.88 ± 0.141.37 ± 0.04304 ± 23.554.19.30 ± 0.0442.95 ± 0.552.98 ± 0.01258.5 ± 2.560.5
MT 14d0.42 ± 0.005.86 ± 0.223.44 ± 0.08274 ± 2258.73.92 ± 0.0416.15 ± 1.956.75 ± 0.12227.5 ± 2.565.2
MT 7d + H 7d1.97 ± 0.015.47 ± 0.442.15 ± 0.21231.5 ± 17.565.10.78 ± 0.005.12 ± 0.035.31 ± 0.01197 ± 969.9
Table 2. Total suspended solids (TSS) concentration (mg L−1) of controls, that is, a birch hydrolysate and dairy effluent medium without microalgae inoculation, with and without NPK supplementation, cultivated for 7 and 14 days mixotrophically (MT 7d and MT 14d, respectively), or for 7 days mixotrophically and then another 7 days heterotrophically (MT 7d + H 7d). Values are expressed as mean ± standard deviation (n = 4).
SupplementationGrowth RegimeTSS (mg L−1)
With NPKMT 7d15 ± 0.0
MT 14d27 ± 1.0
MT 7d + H 7d16 ± 0.0
Without NPKMT 7d16 ± 1.0
MT 14d15 ± 0.0
MT 7d + H 7d27 ± 1.0
Table 3. Biomass (g L−1 d−1), lipids (mg L−1 d−1), and fatty acid methyl esters’ (FAMEs) (mg L−1 d−1) productivities of C. sorokiniana, C. saccharophila, C. vulgaris, and Coelastrella sp. cultured in a birch hydrolysate and dairy effluent medium, with and without NPK supplementation (mixotrophic growth, MT 7d, and 14 days of mixotrophic and two stage mixotrophic/heterotrophic growth, MT 14d and MT 7d + H 7d). Values are expressed as mean ± standard deviation (n = 4 (biomass and lipids) and n = 2 (FAMEs)). NA—not available.
Without NPK SupplementationWith NPK Supplementation
BiomassLipidsFAMEsBiomassLipidsFAMEs
C. sorokinianaMT 7d0.13 ± 0.0324.75 ± 4.16NA0.26 ± 0.0024.50 ± 2.3313.71 ± 3.94
MT 14d0.06 ± 0.0421.36 ± 0.66 9.79 ± 0.820.14 ± 0.0015.97 ± 1.409.75 ± 0.56
MT 7d + H 7d0.04 ± 0.00 18.85 ± 2.07 11.03 ± 1.360.10 ± 0.0013.77 ± 1.94 9.74 ± 0.48
C. saccharophilaMT 7d0.23 ± 0.2925.58 ± 2.3125.37 ± 0.560.23 ± 0.0631.51 ± 8.6619.96 ± 3.50
MT 14d0.09 ± 0.05 16.73 ± 1.2511.09 ± 0.730.13 ± 0.0014.21 ± 1.3511.05 ± 0.00
MT 7d + H 7d0.06 ± 0.00 25.94 ± 1.035.00 ± 0.150.07 ± 0.0012.98 ± 1.939.61 ± 0.38
C. vulgarisMT 7d0.09 ± 0.02NA31.57 ± 2.390.24 ± 0.0328.36 ± 1.9723.20 ± 0.58
MT 14d0.05 ± 0.00 17.98 ± 1.60 11.54 ± 0.250.12 ± 0.0016.63 ± 1.6113.70 ± 0.10
MT 7d + H 7d0.04 ± 0.0017.76 ± 4.0815.83 ± 1.690.11 ± 0.0020.33 ± 1.9512.60 ± 0.34
Coelastrella sp.MT 7d0.19 ± 0.0533.95 ± 5.56NA0.11 ± 0.0441.80 ± 8.13NA
MT 14d0.09 ± 0.0117.10 ± 1.8511.63 ± 0.790.13 ± 0.0019.02 ± 0.7015.89 ± 0.90
MT 7d + H 7d0.06 ± 0.0028.51 ± 2.27NA0.08 ± 0.0012.30 ± 1.8216.28 ± 0.22
Table 4. Percentage of total nitrogen (N) and total carbon (C) per DW, as well as the C/N ratio of C. sorokiniana, C. saccharophila, C. vulgaris, and Coelastrella sp. grown in a birch hydrolysate and dairy effluent with or without NPK supplementation. The species were cultivated for 14 days mixotrophically (MT 14d), or for 7 days mixotrophically, and then another 7 days heterotrophically (MT 7d + H 7d). Values are expressed as mean ± standard deviation (n = 3).
SpeciesSupplementationGrowth RegimeN%C%C/N Ratio
C. sorokinianaWith NPKMT 14d6.90 ± 0.3450.73 ± 0.457.37 ± 0.41
MT 7d + H 7d9.04 ± 0.5749.81 ± 2.065.52 ± 0.18
Without NPKMT 14d3.89 ± 0.8856.03 ± 1.3715.34 ± 4.23
MT 7d + H 7d8.13 ± 0.1051.10 ± 1.356.28 ± 0.09
C. saccharophilaWith NPKMT 14d6.84 ± 0.1451.50 ± 0.467.53 ± 0.18
MT 7d + H 7d9.33 ± 0.0650.27 ± 0.065.38 ± 0.03
Without NPKMT 14d3.77 ± 0.1756.34 ± 0.0614.98 ± 0.69
MT 7d + H 7d5.54 ± 1.0155.99 ± 0.3310.42 ± 1.70
C. vulgarisWith NPKMT 14d7.15 ± 0.0752.86 ± 0.217.39 ± 0.10
MT 7d + H 7d8.70 ± 0.1952.59 ± 1.026.05 ± 0.01
Without NPKMT 14d7.21 ± 0.3453.82 ± 0.147.49 ± 0.33
MT 7d + H 7d11.04 ± 0.0352.47 ± 0.154.73 ± 0.02
Coelastrella sp.With NPKMT 14d6.75 ± 0.1450.66 ± 0.917.51 ± 0.12
MT 7d + H 7d7.59 ± 0.3452.47 ± 0.726.93 ± 0.40
Without NPKMT 14d3.38 ± 0.1158.18 ± 0.6217.21 ± 0.17
MT 7d + H 7d5.87 ± 0.2255.27 ± 1.579.43 ± 0.64

