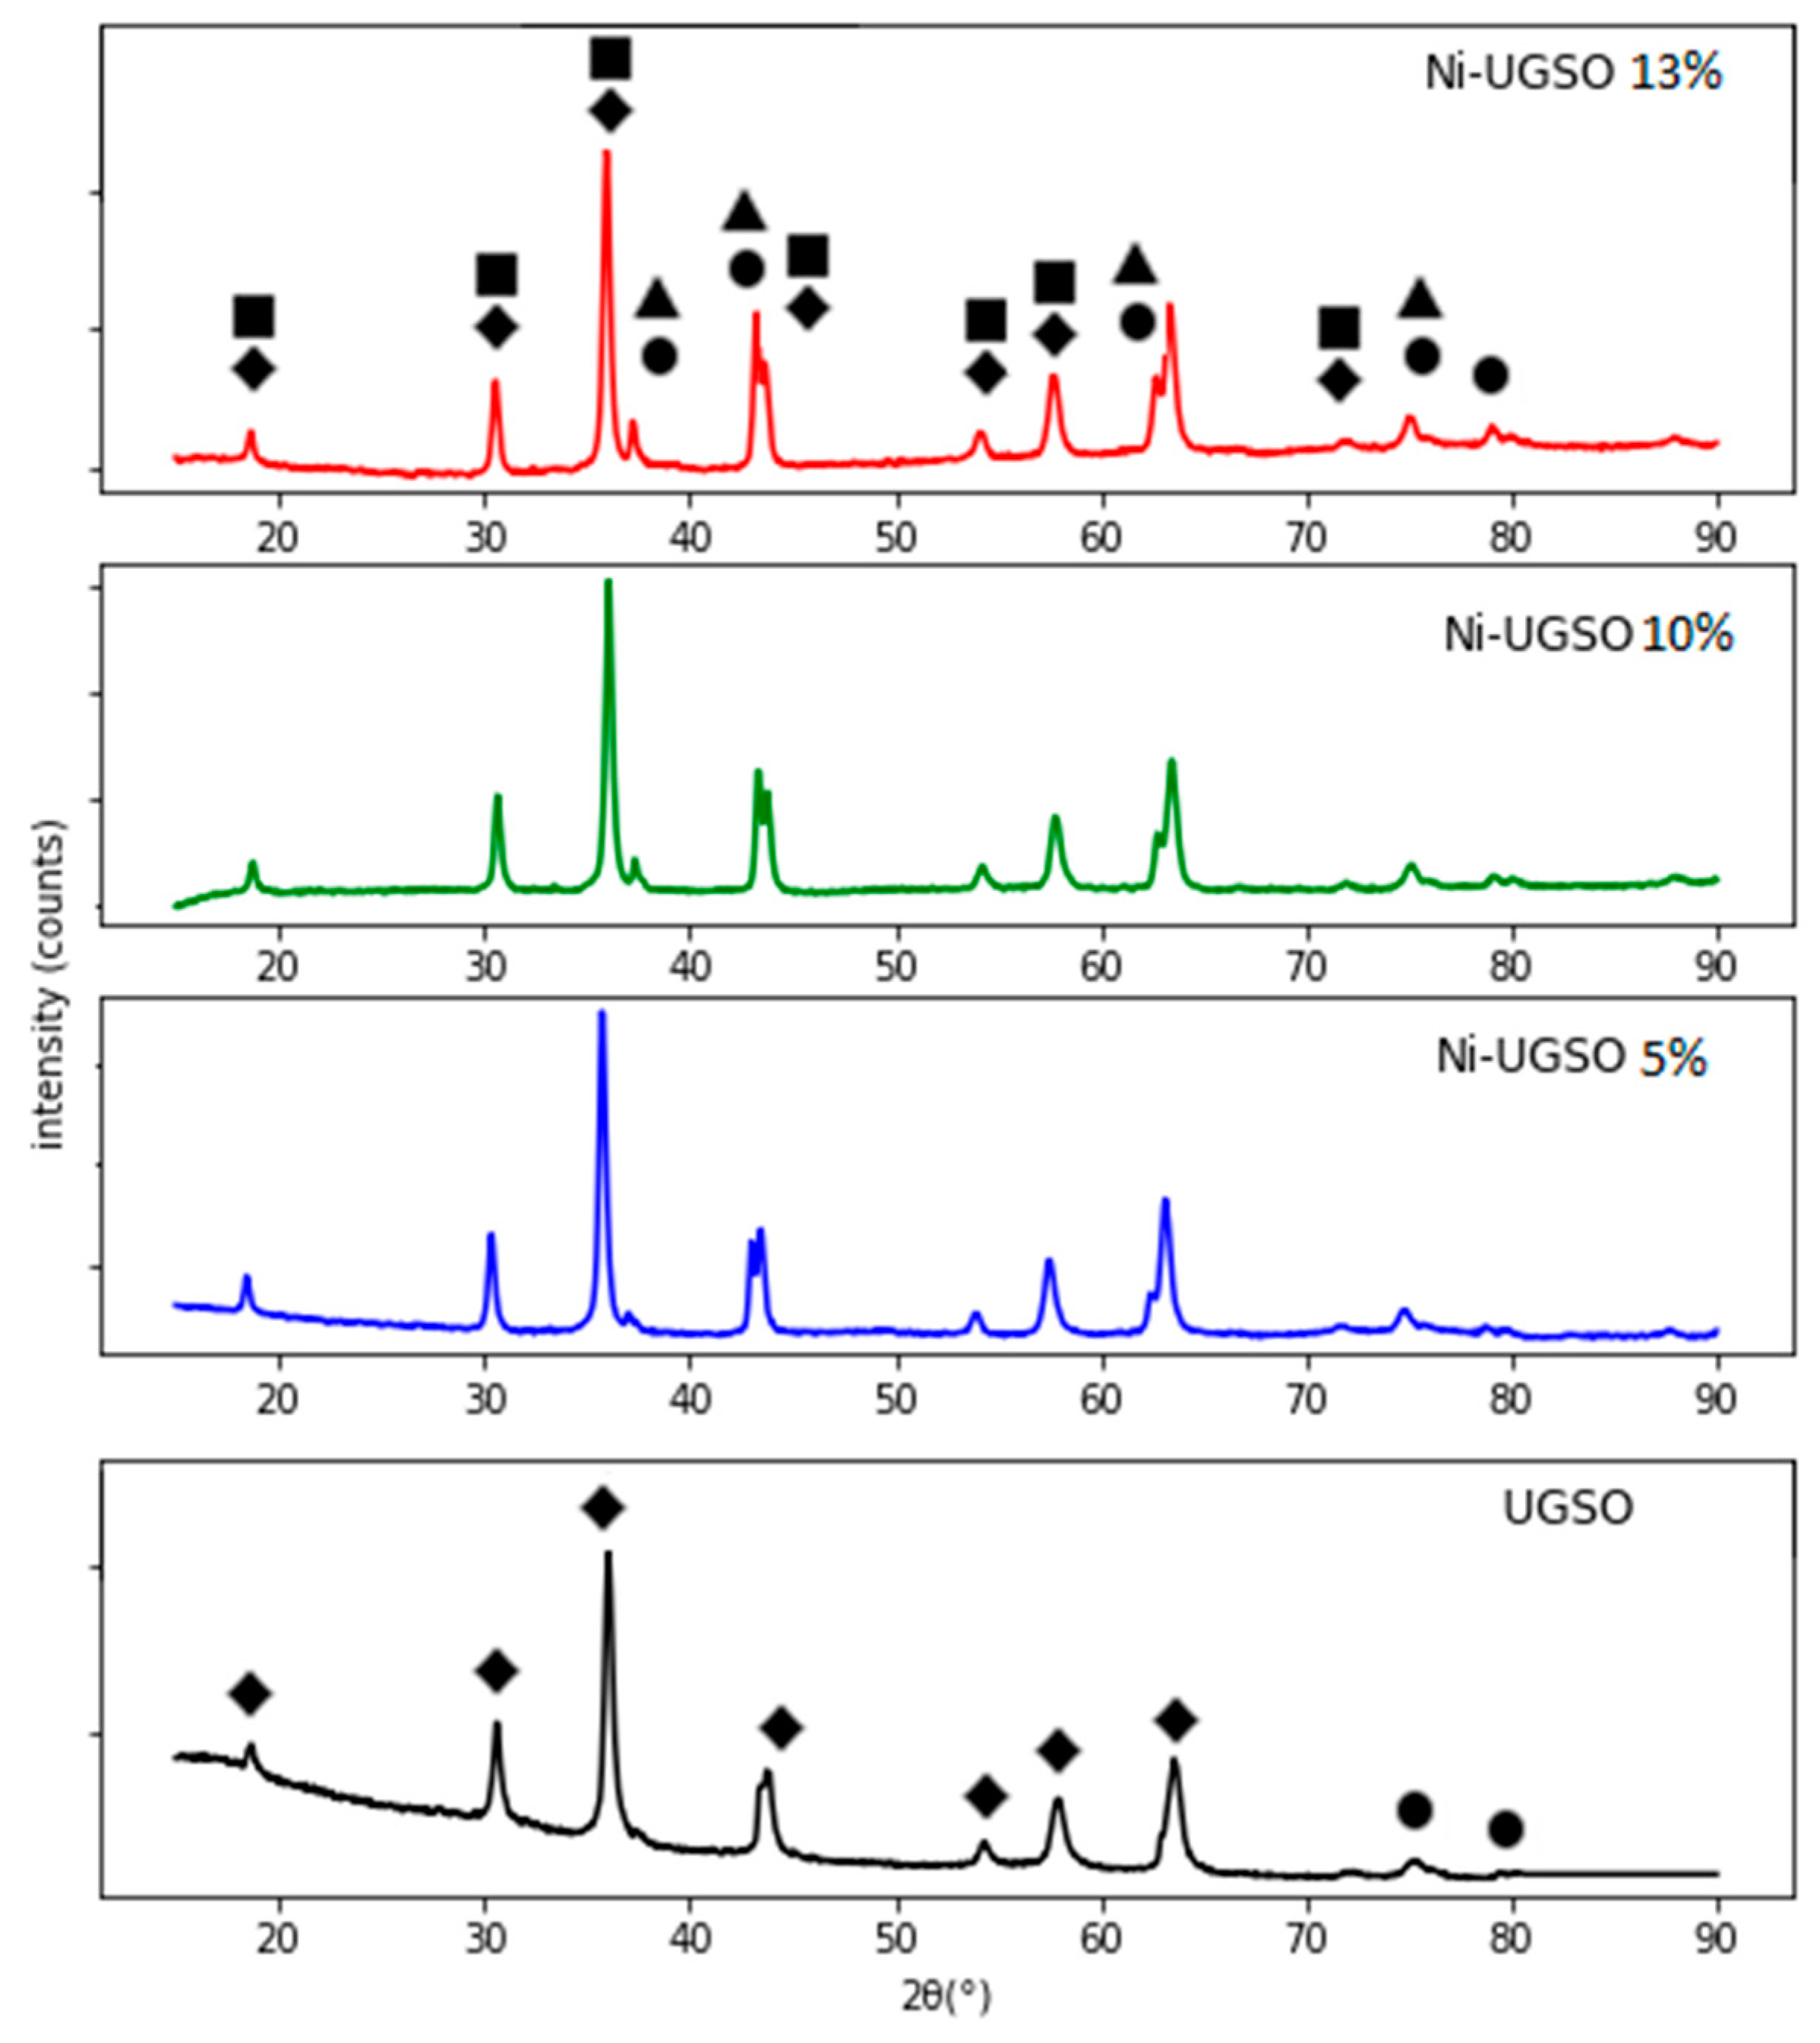
Figure 1.
XRD analysis of Ni-UGSO with different Ni contents (0, 5, 10, and 13 wt.%).
Figure 1.
XRD analysis of Ni-UGSO with different Ni contents (0, 5, 10, and 13 wt.%).
Figure 2.
TEM analysis of Ni-UGSO 13% (a,c) and its corresponding selected area electron diffraction (SAED) (b,d).
Figure 2.
TEM analysis of Ni-UGSO 13% (a,c) and its corresponding selected area electron diffraction (SAED) (b,d).
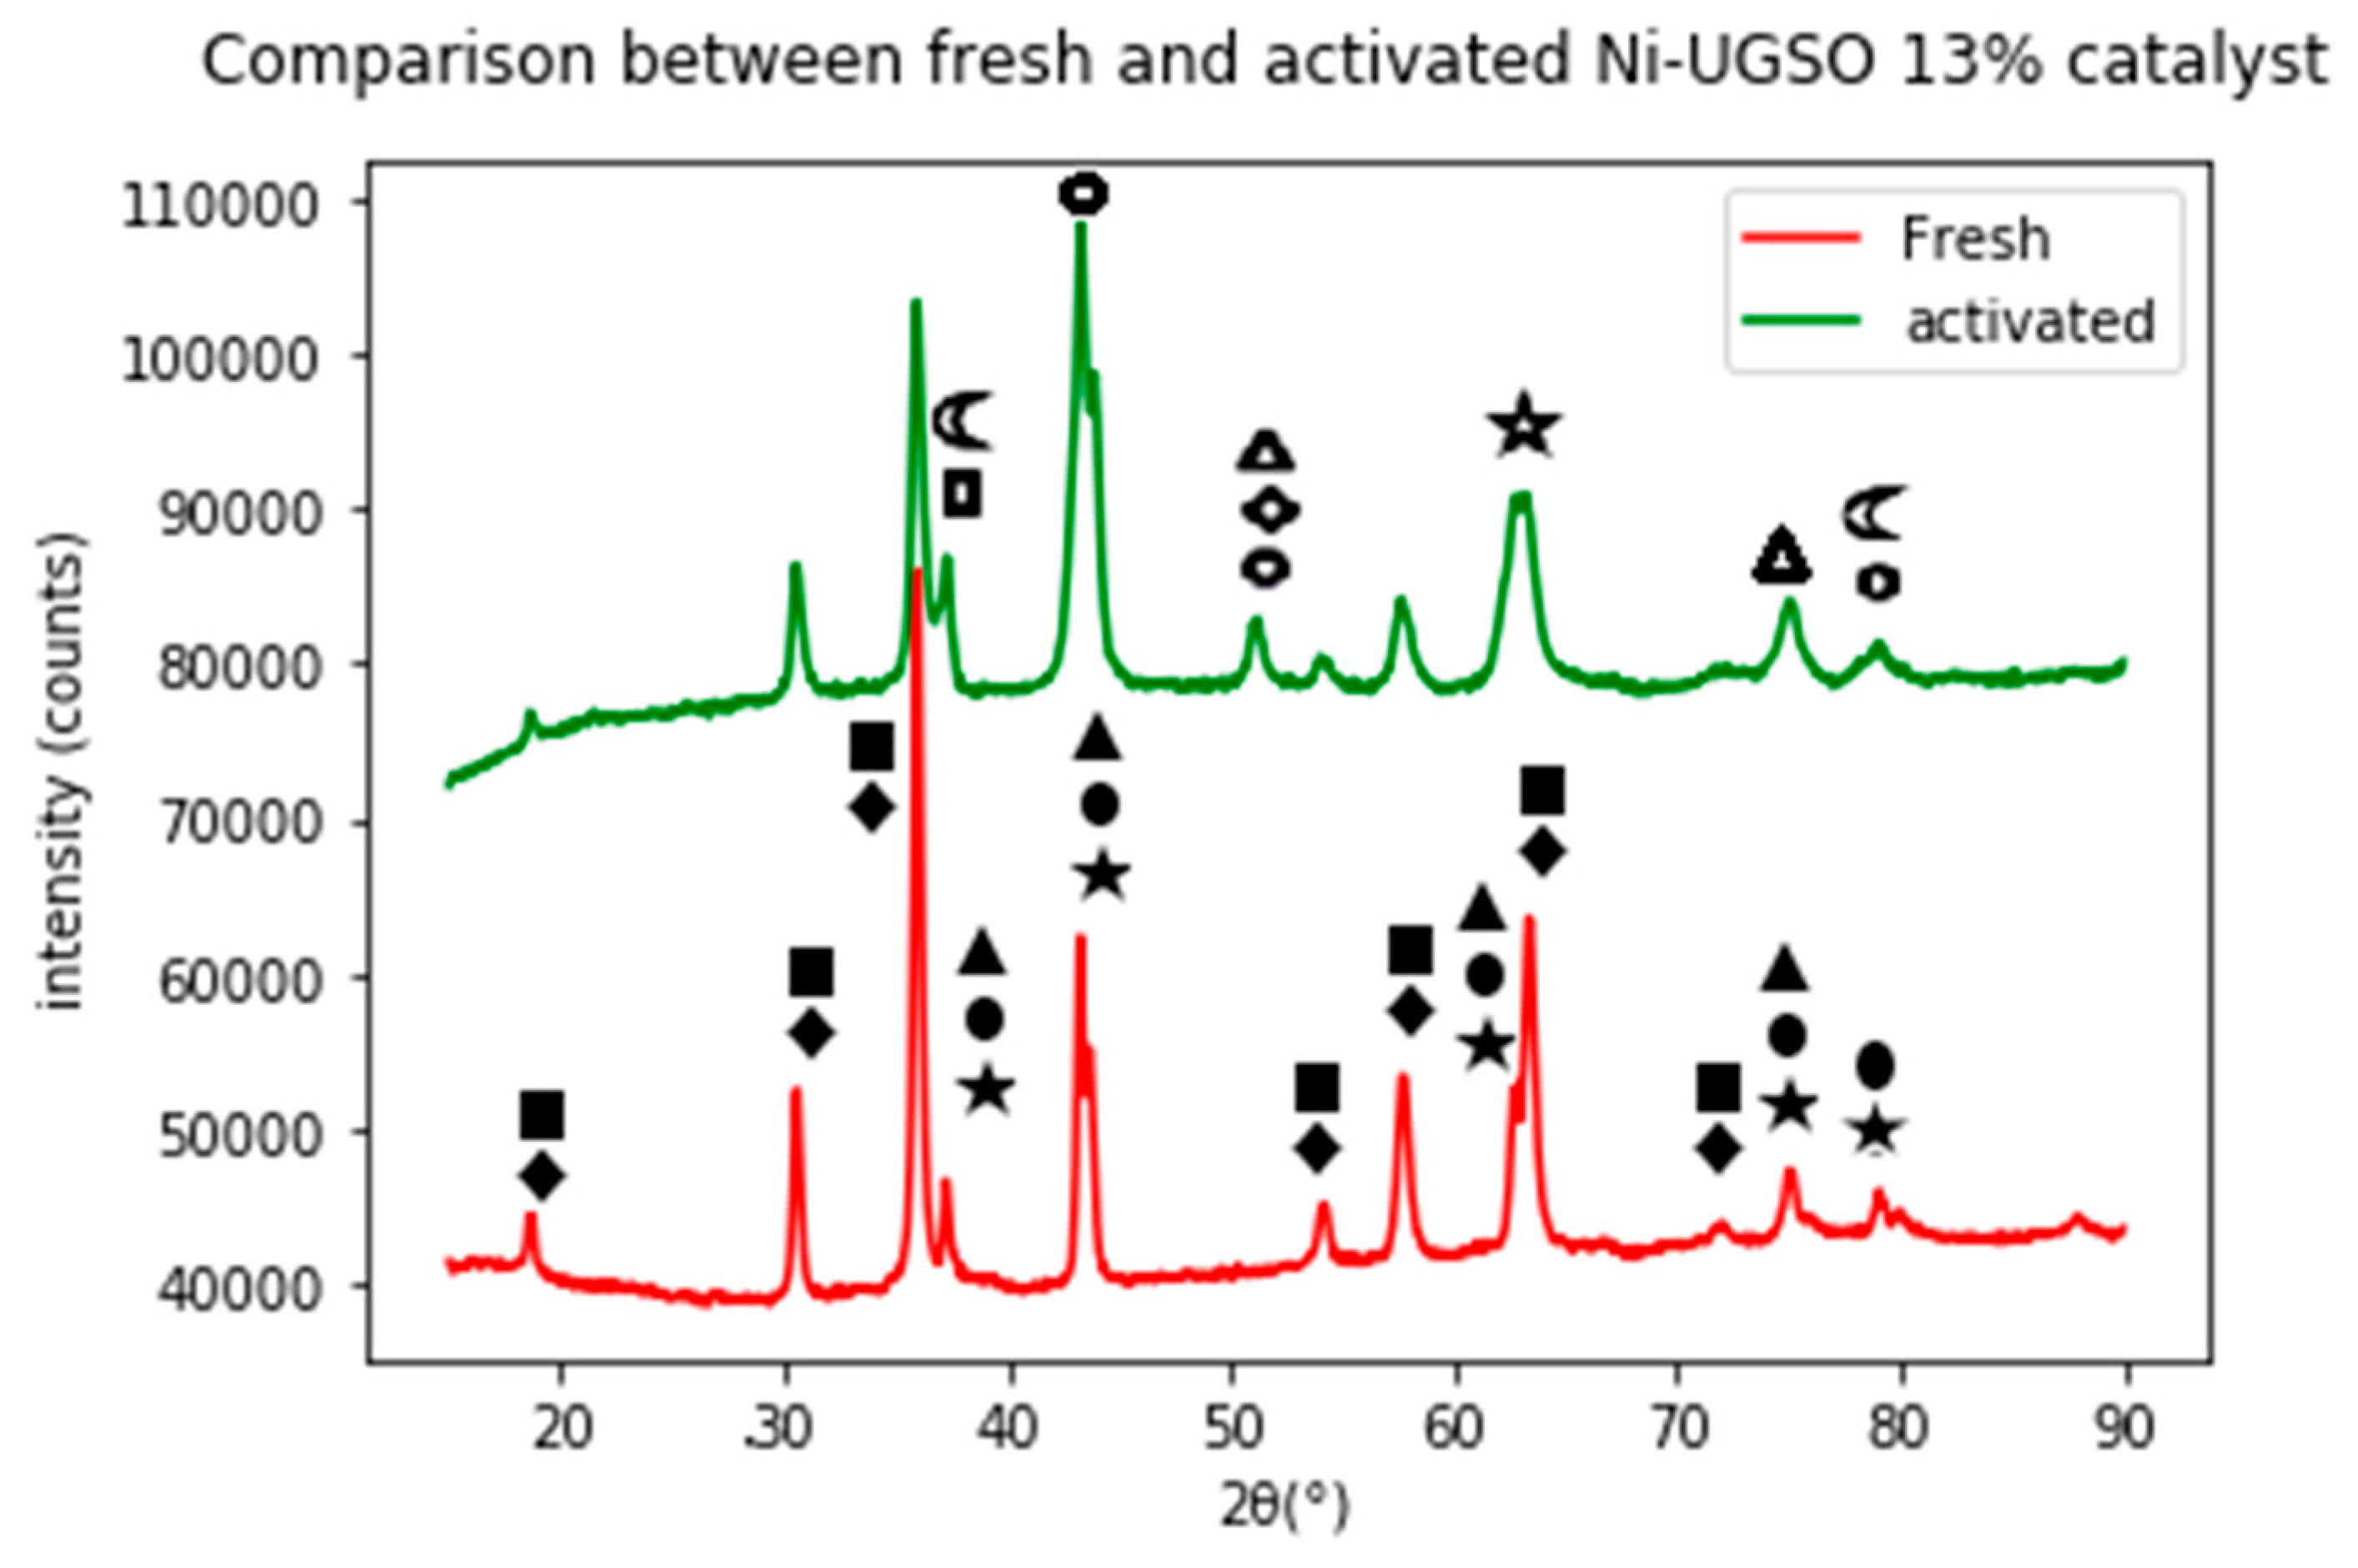
Figure 3.
XRD analysis of Ni-UGSO 13% before and after activation.
Figure 3.
XRD analysis of Ni-UGSO 13% before and after activation.
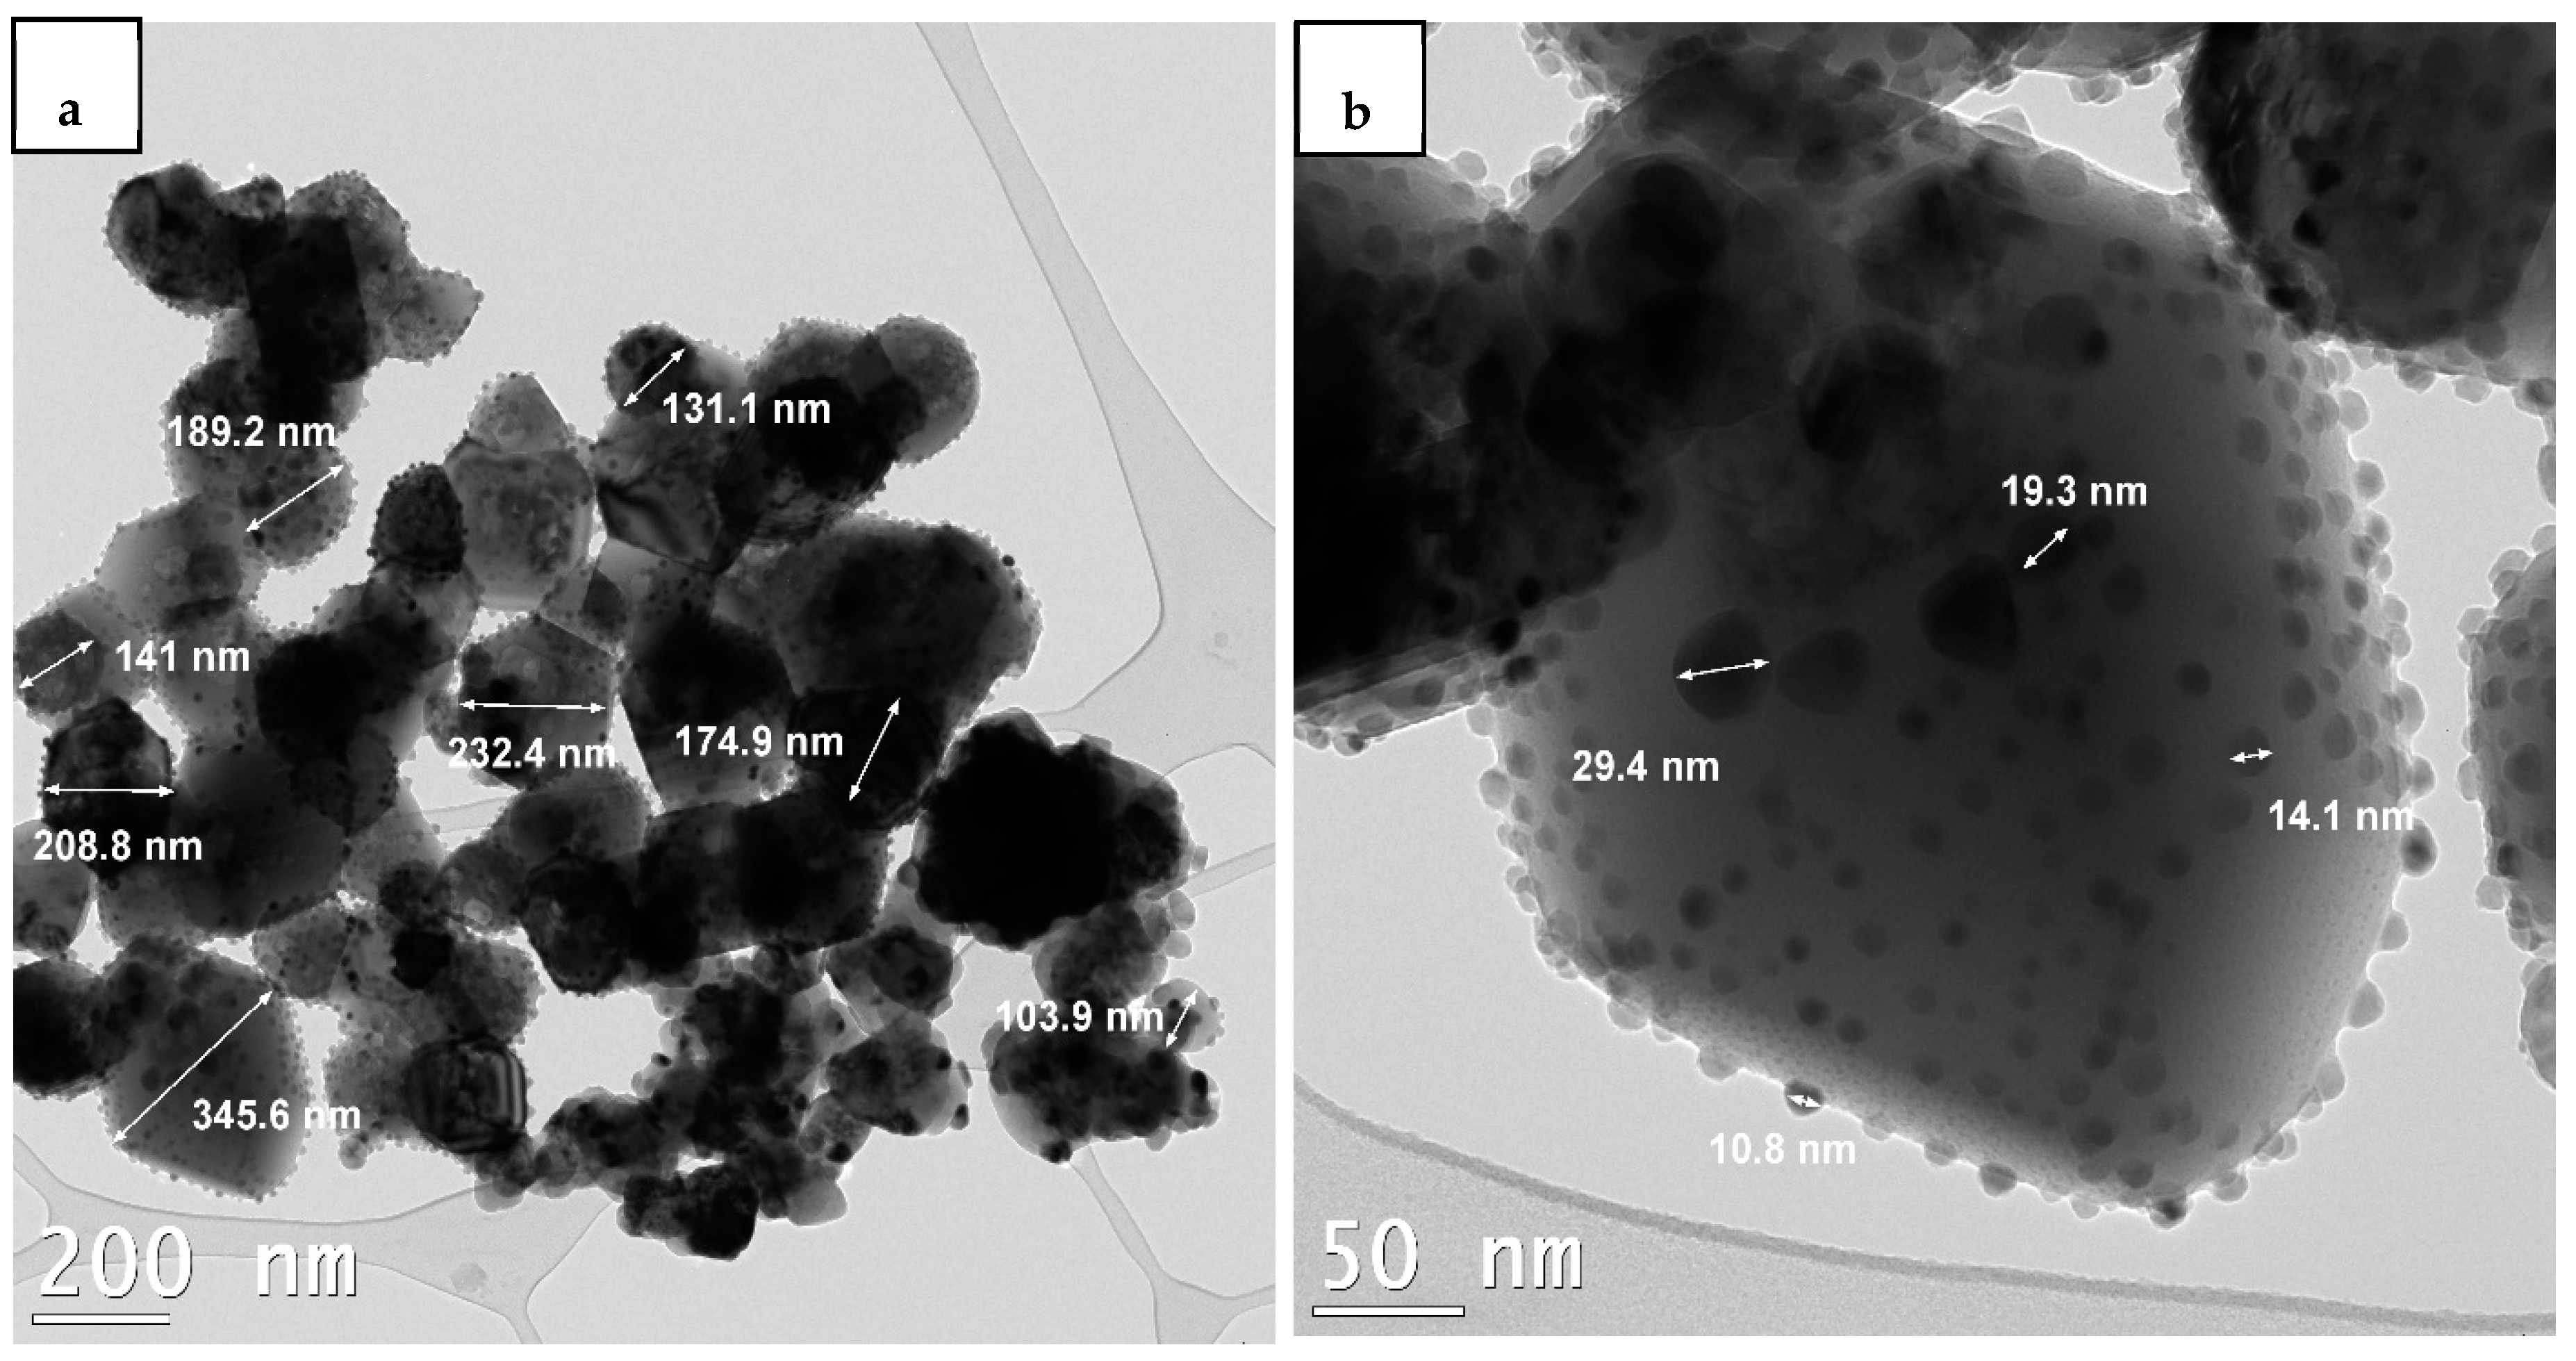
Figure 4.
TEM analysis of activated Ni-UGSO 13%, (a) support particle size and (b) crystallite size.
Figure 4.
TEM analysis of activated Ni-UGSO 13%, (a) support particle size and (b) crystallite size.
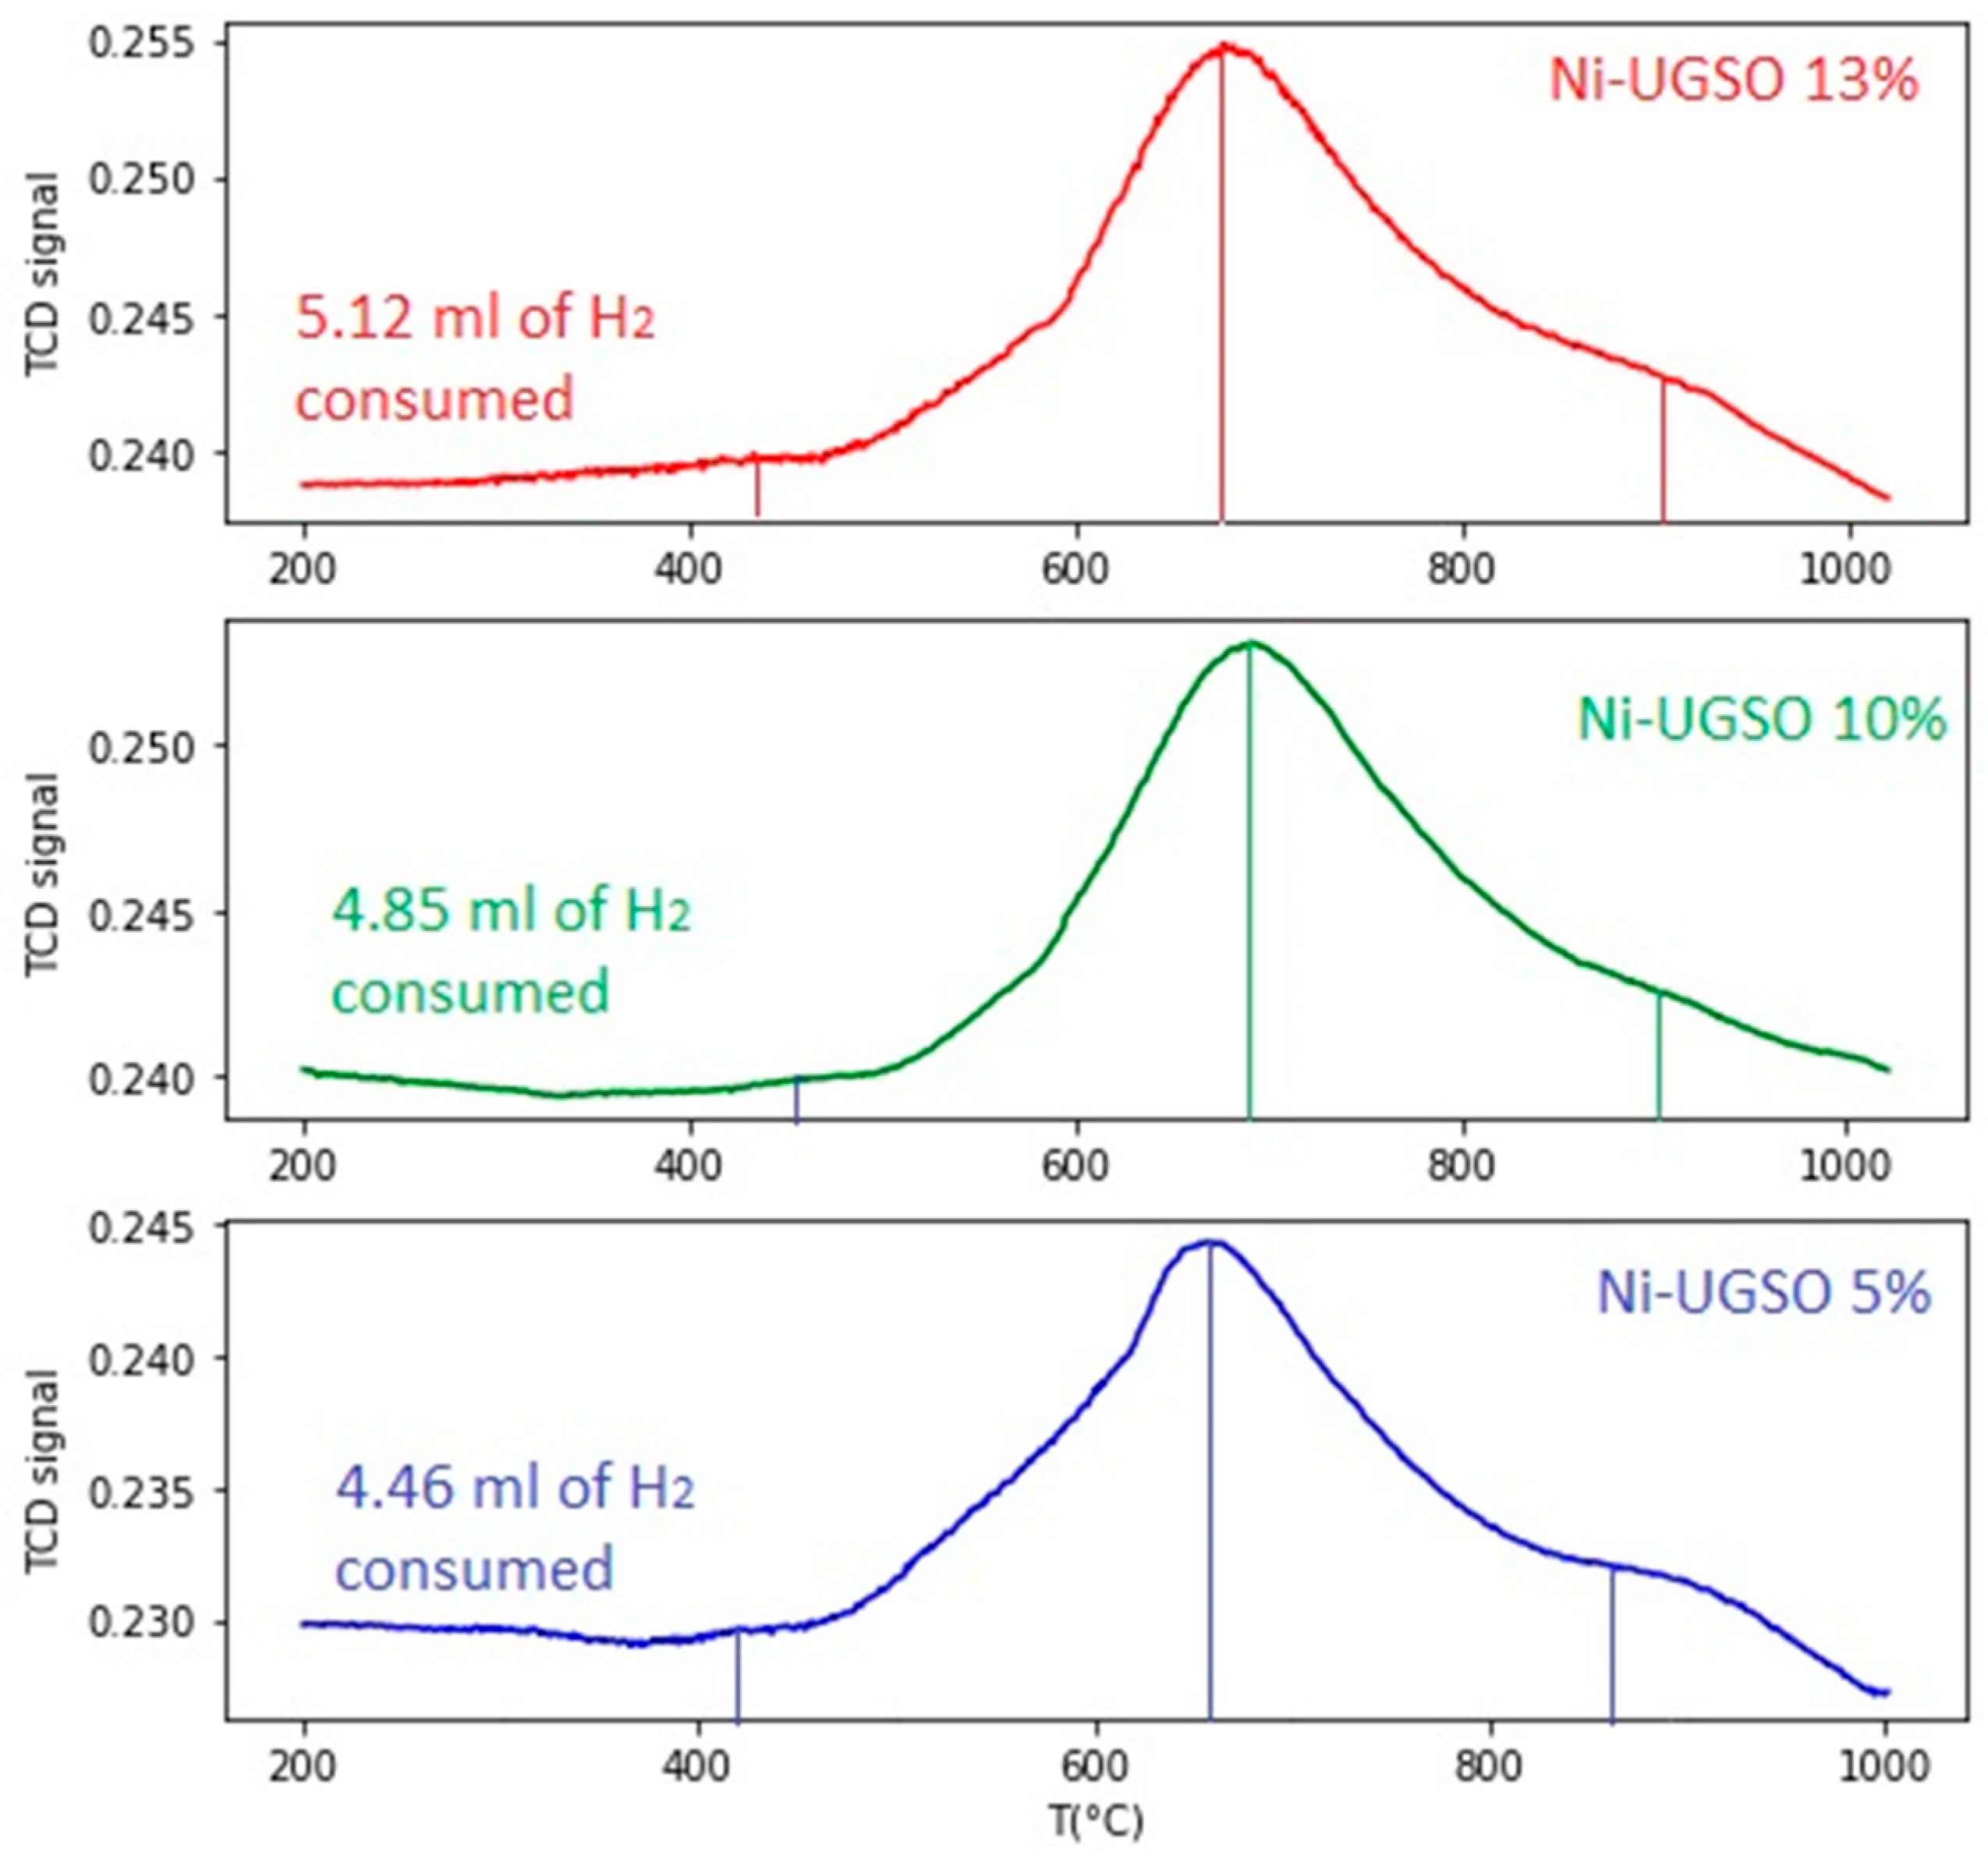
Figure 5.
TPR analysis for Ni-UGSO with different Ni contents (5, 10, and 13 wt.%).
Figure 5.
TPR analysis for Ni-UGSO with different Ni contents (5, 10, and 13 wt.%).
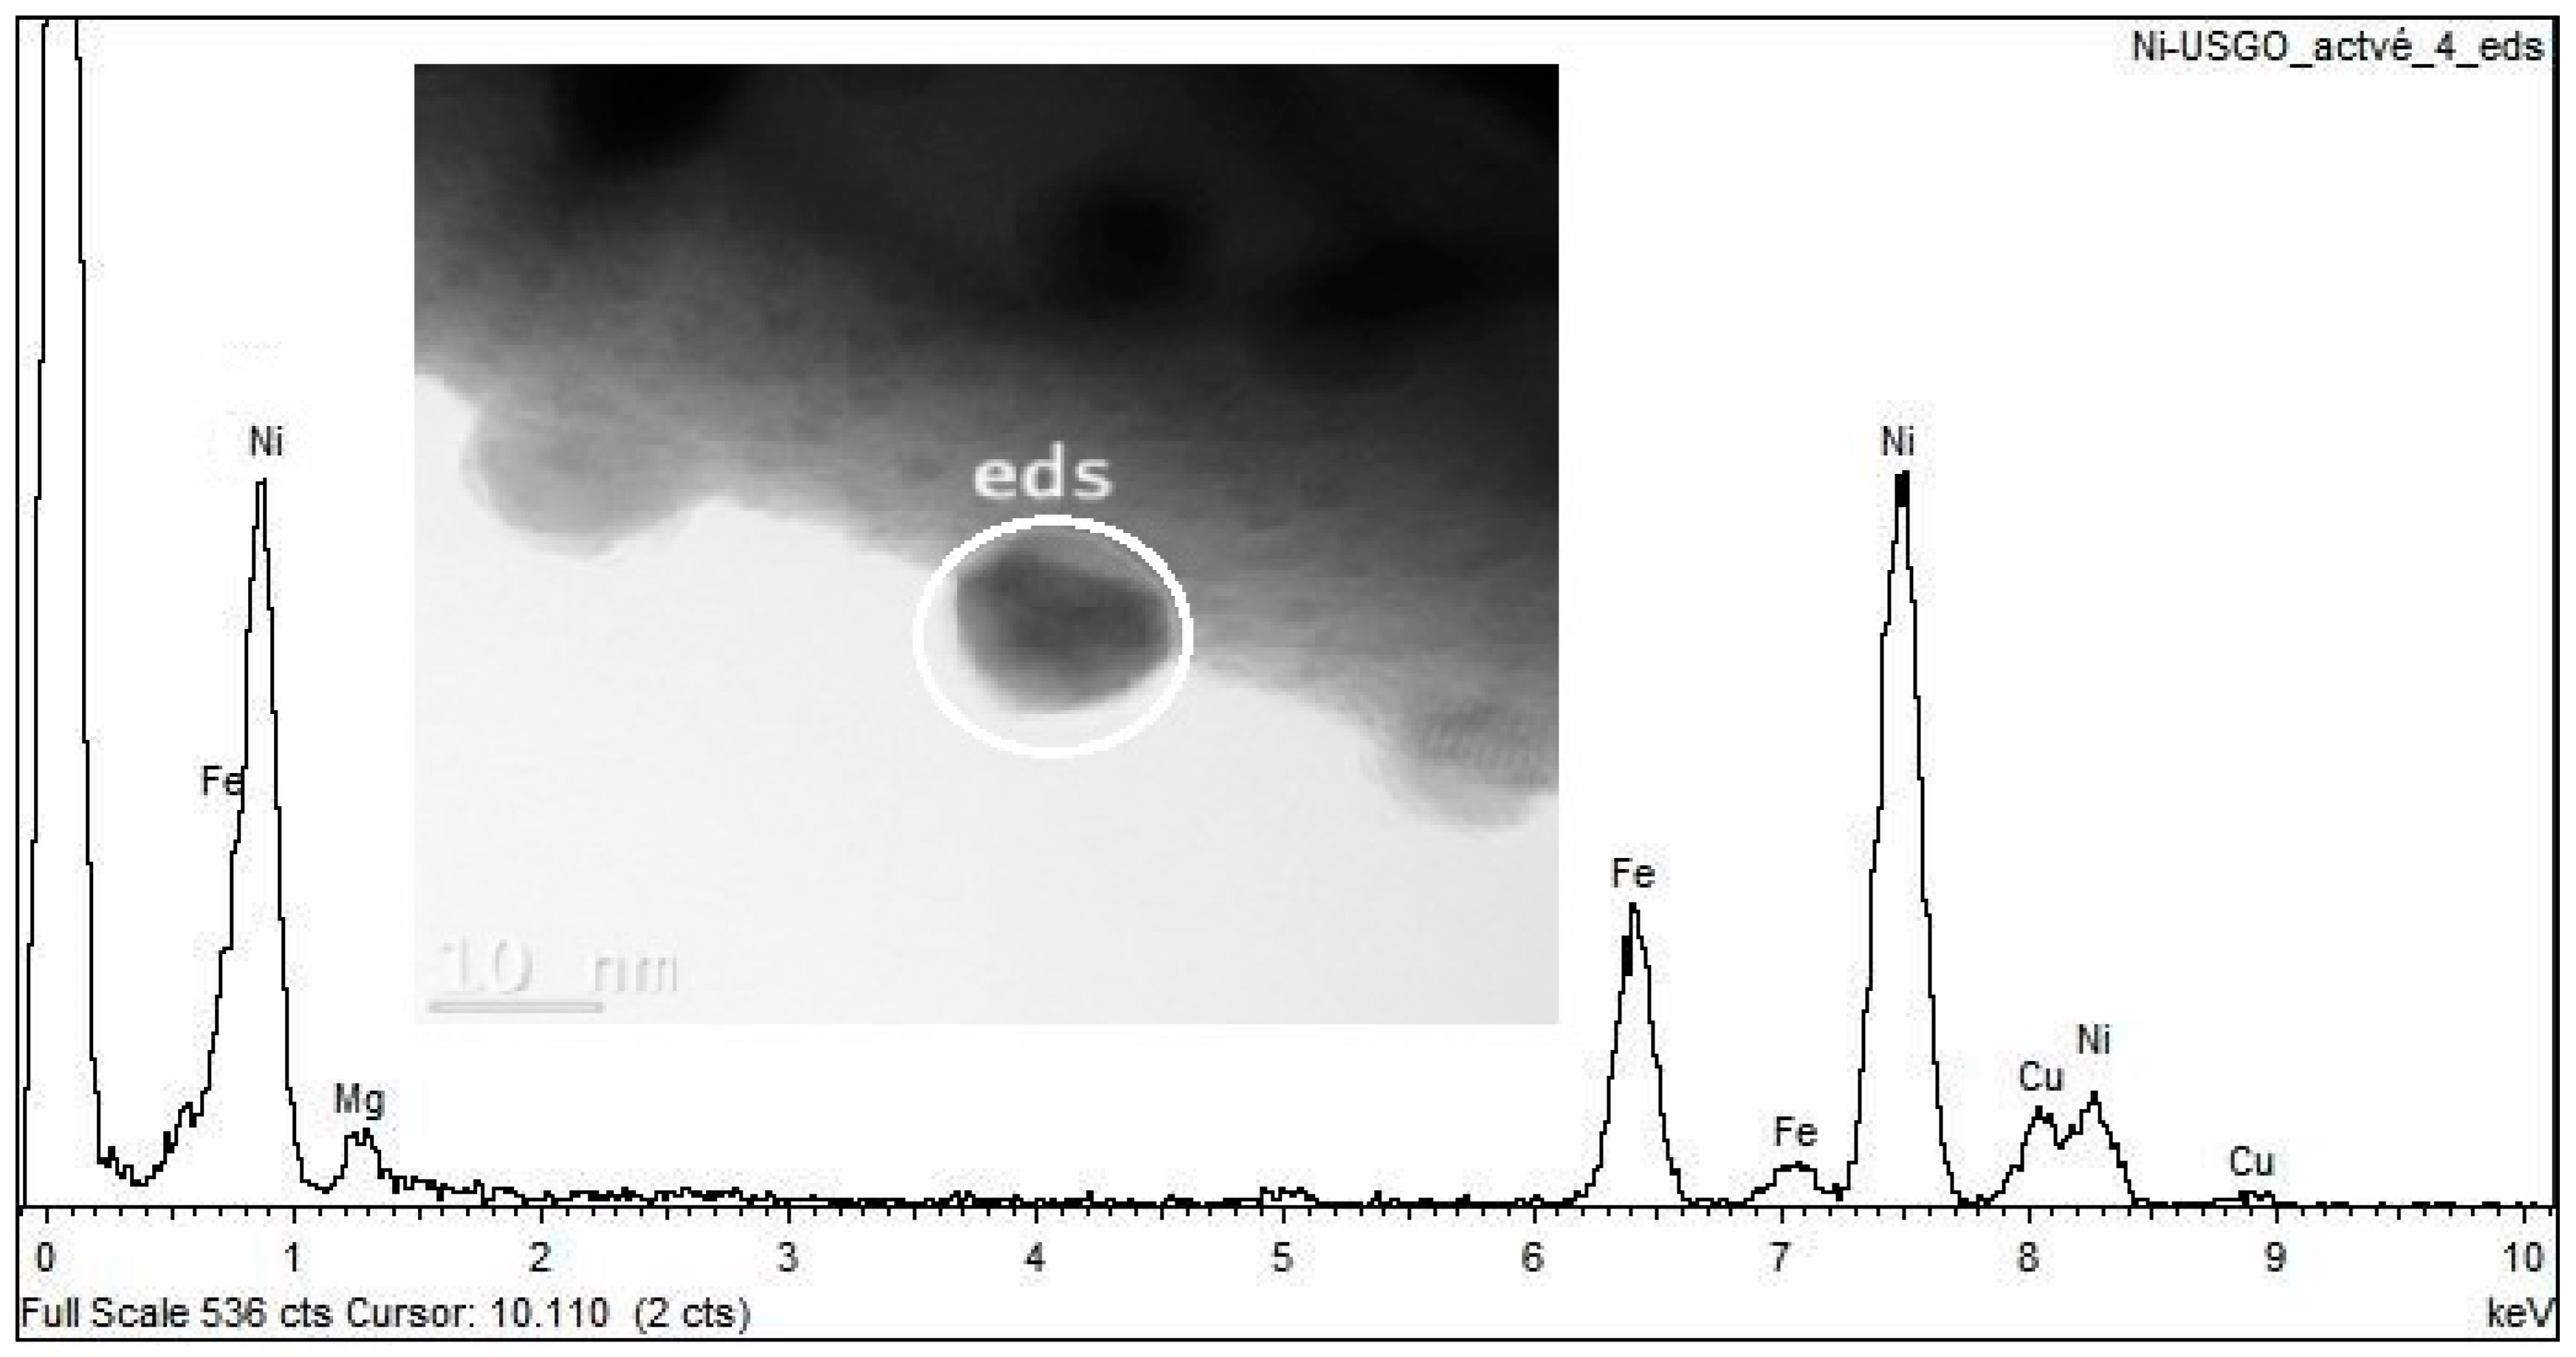
Figure 6.
EDX analysis of activated Ni-UGSO 13%.
Figure 6.
EDX analysis of activated Ni-UGSO 13%.
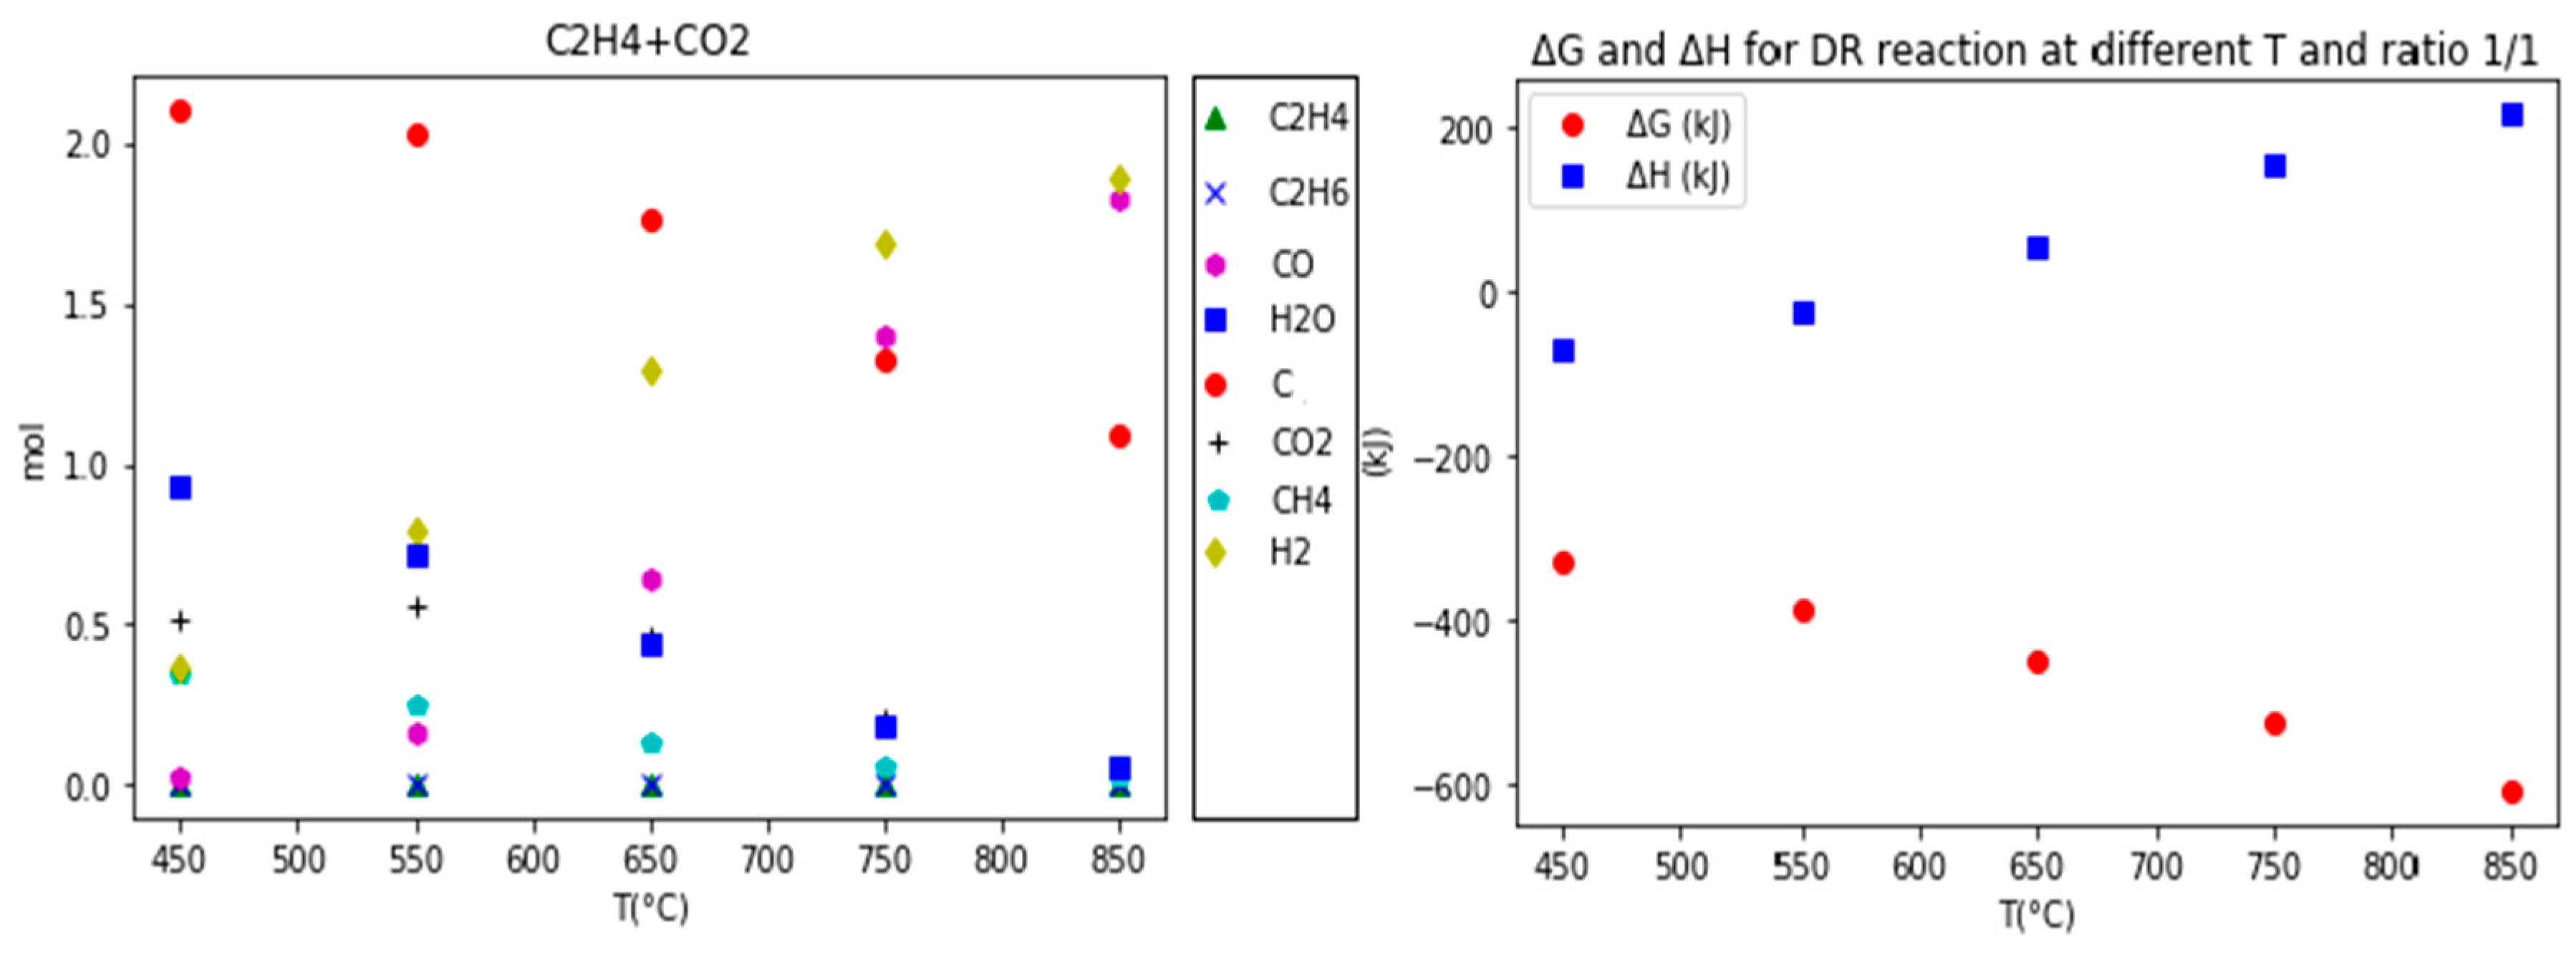
Figure 7.
Thermodynamic study of DR reaction at different temperature at ratio 1/1.
Figure 7.
Thermodynamic study of DR reaction at different temperature at ratio 1/1.
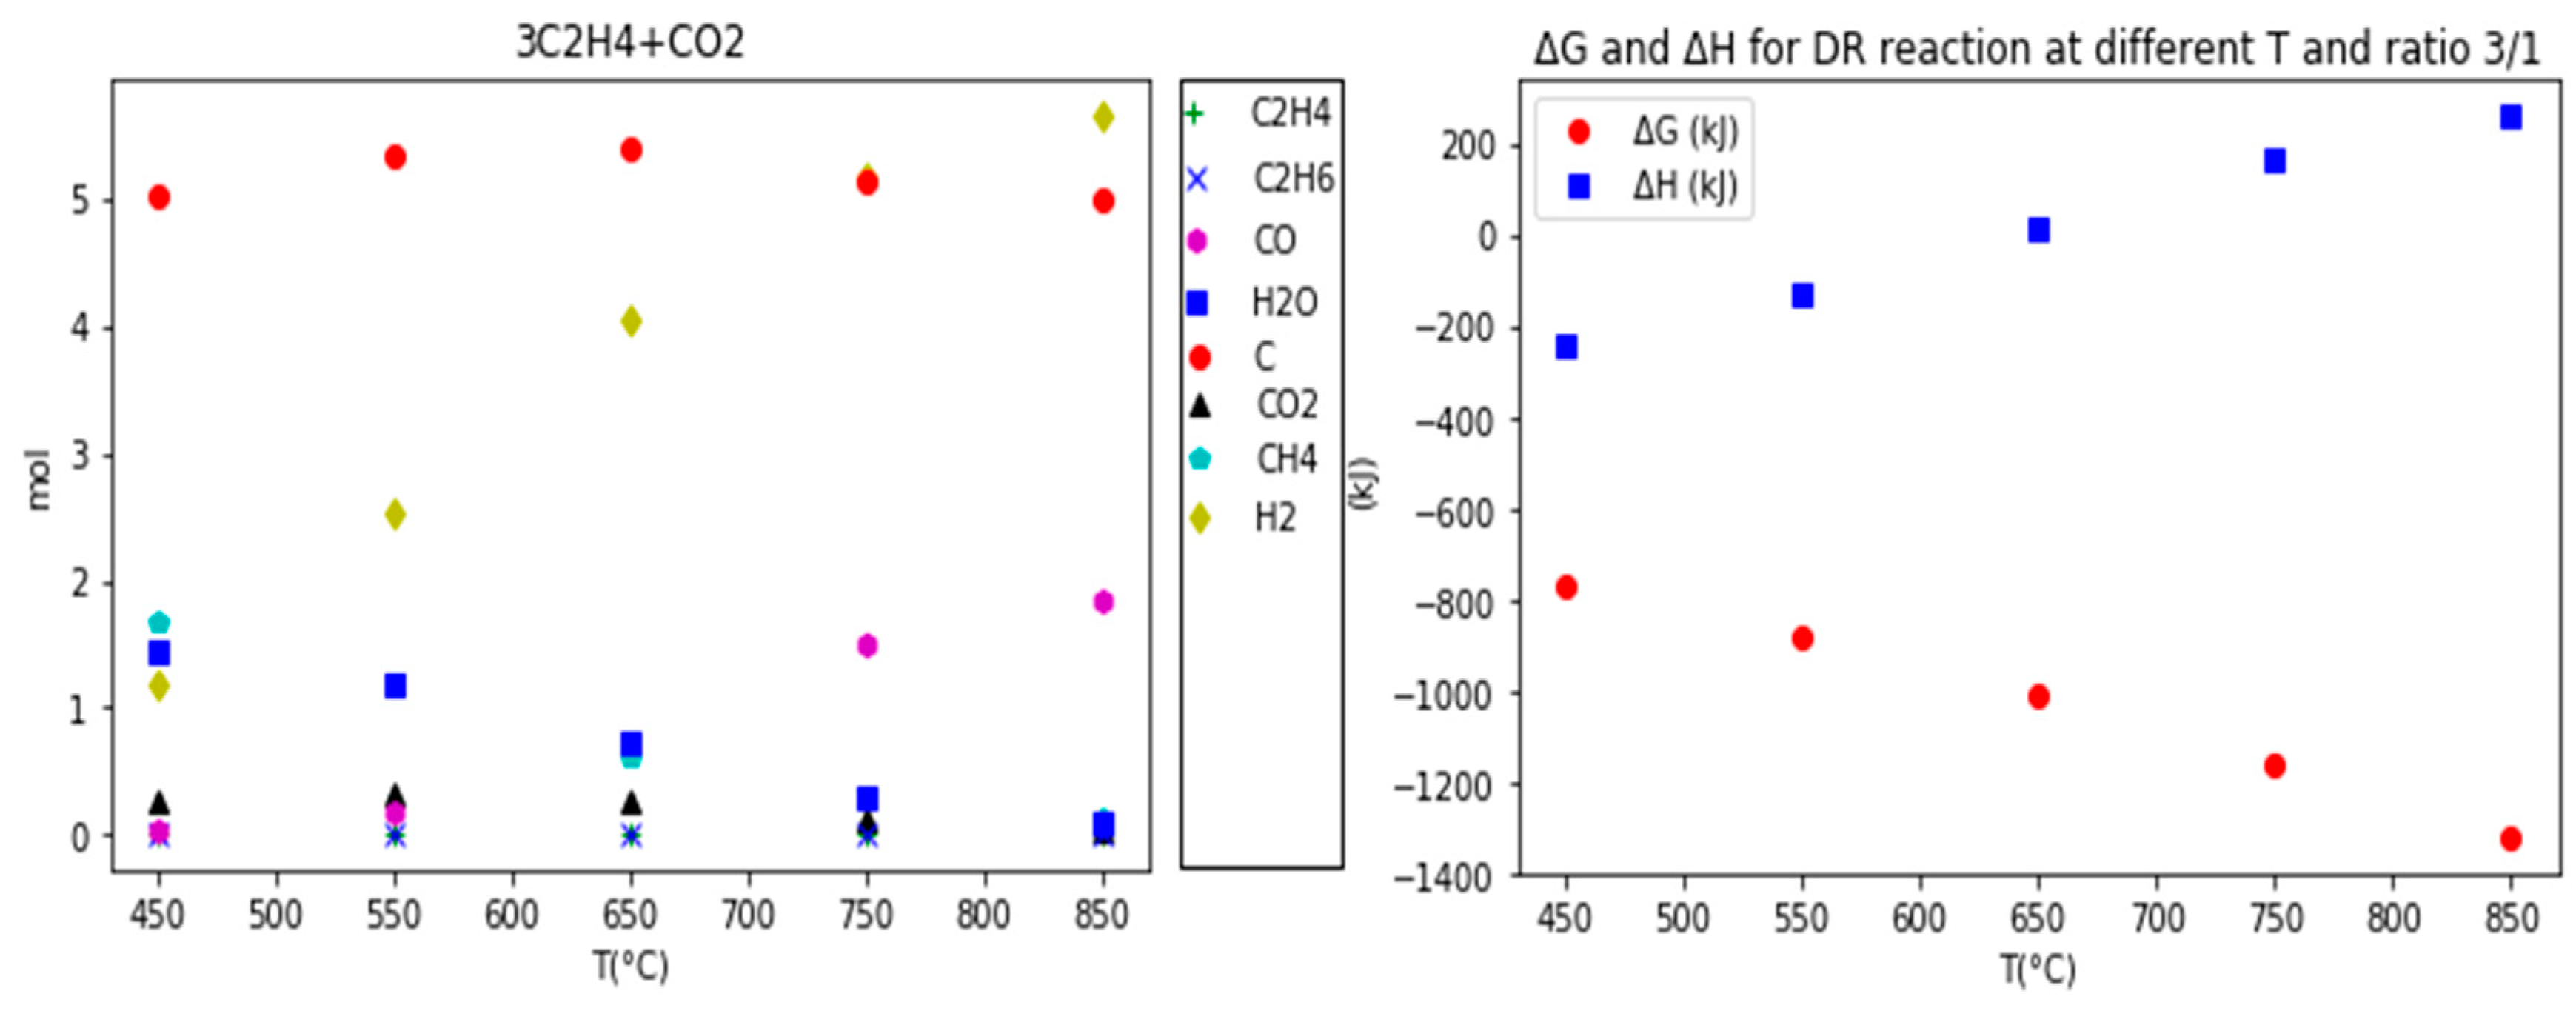
Figure 8.
Thermodynamic study of DR reaction at different temperature at ratio 3/1.
Figure 8.
Thermodynamic study of DR reaction at different temperature at ratio 3/1.
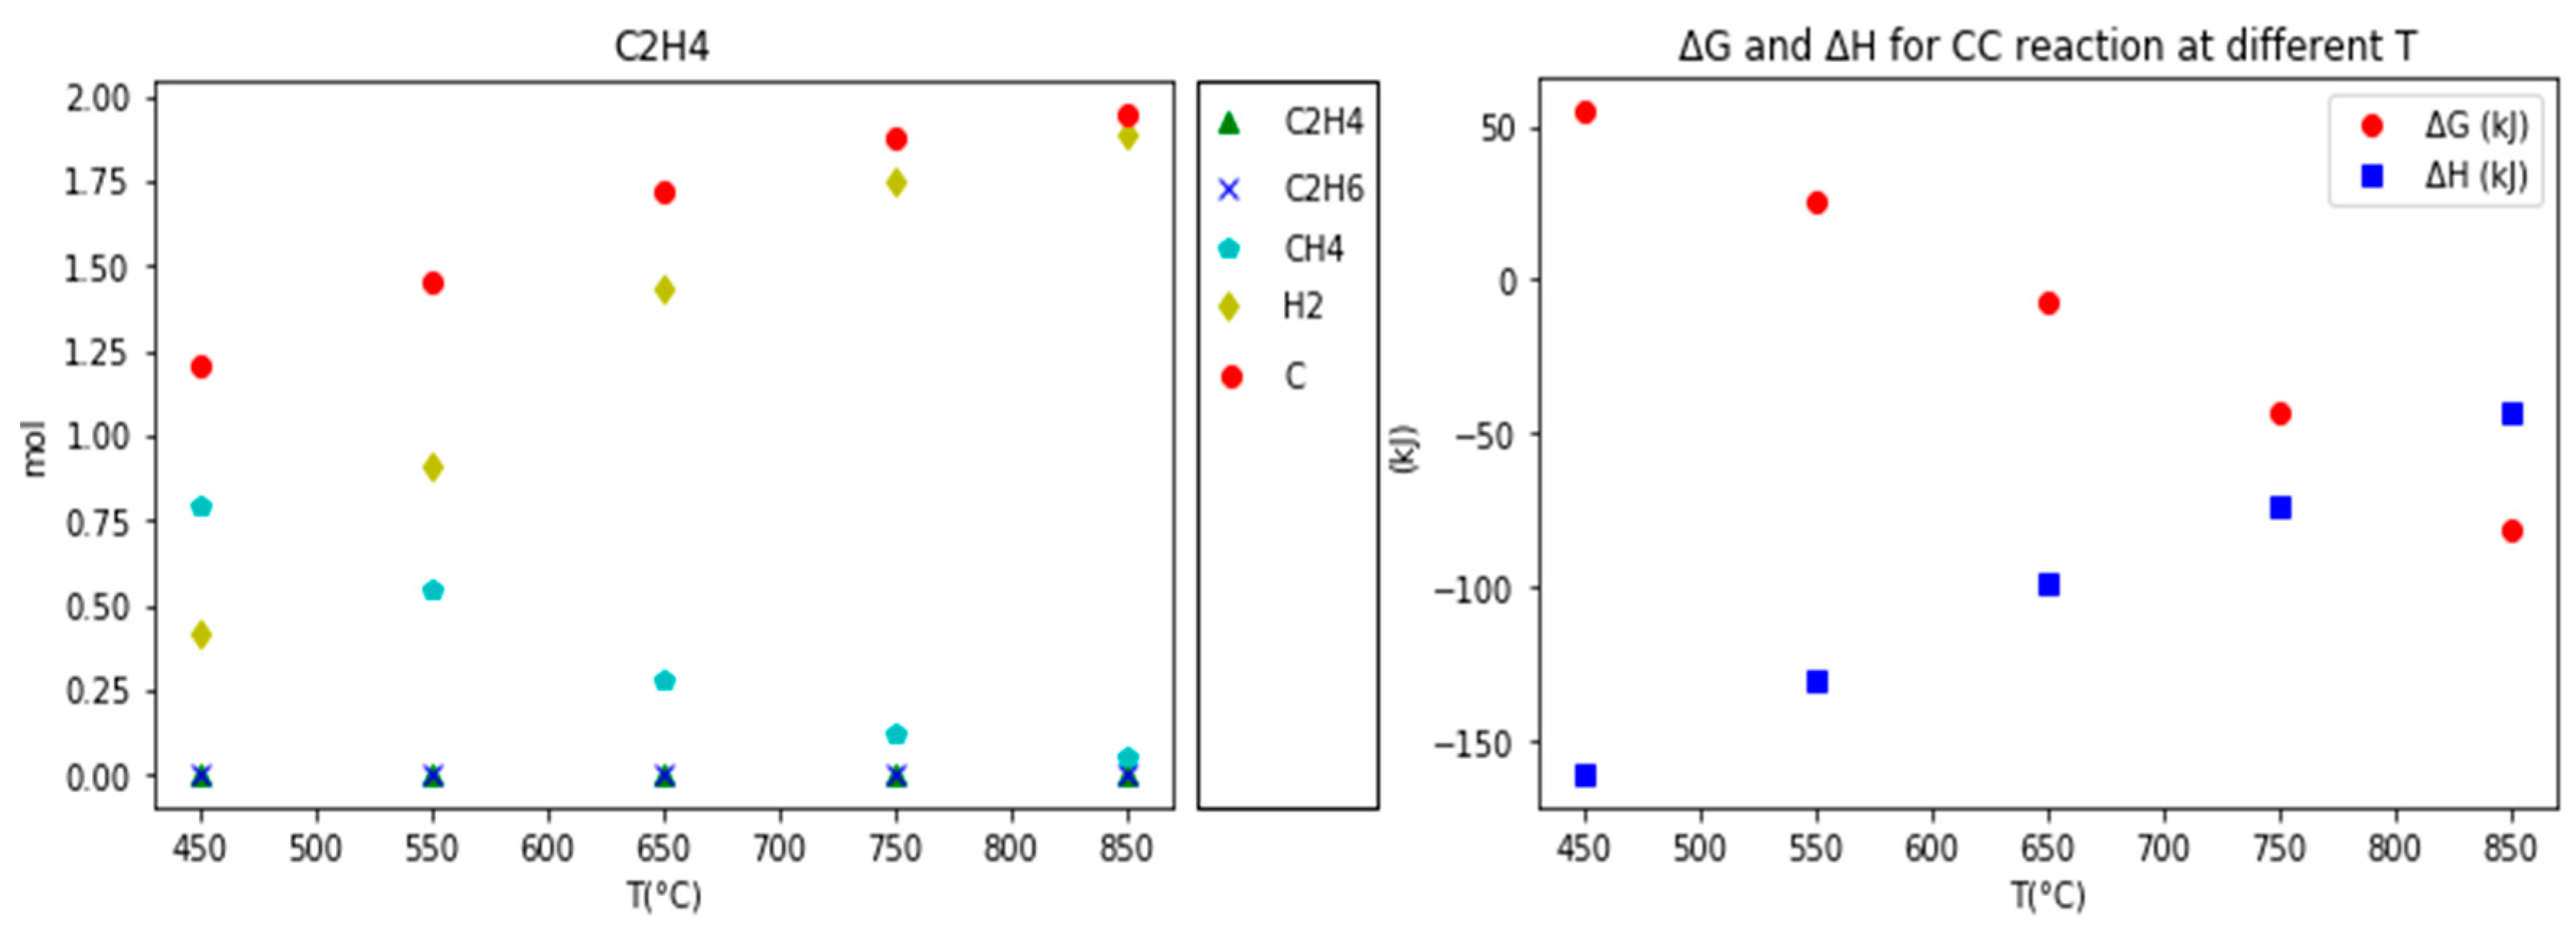
Figure 9.
Thermodynamic study of CC reaction at different temperature.
Figure 9.
Thermodynamic study of CC reaction at different temperature.
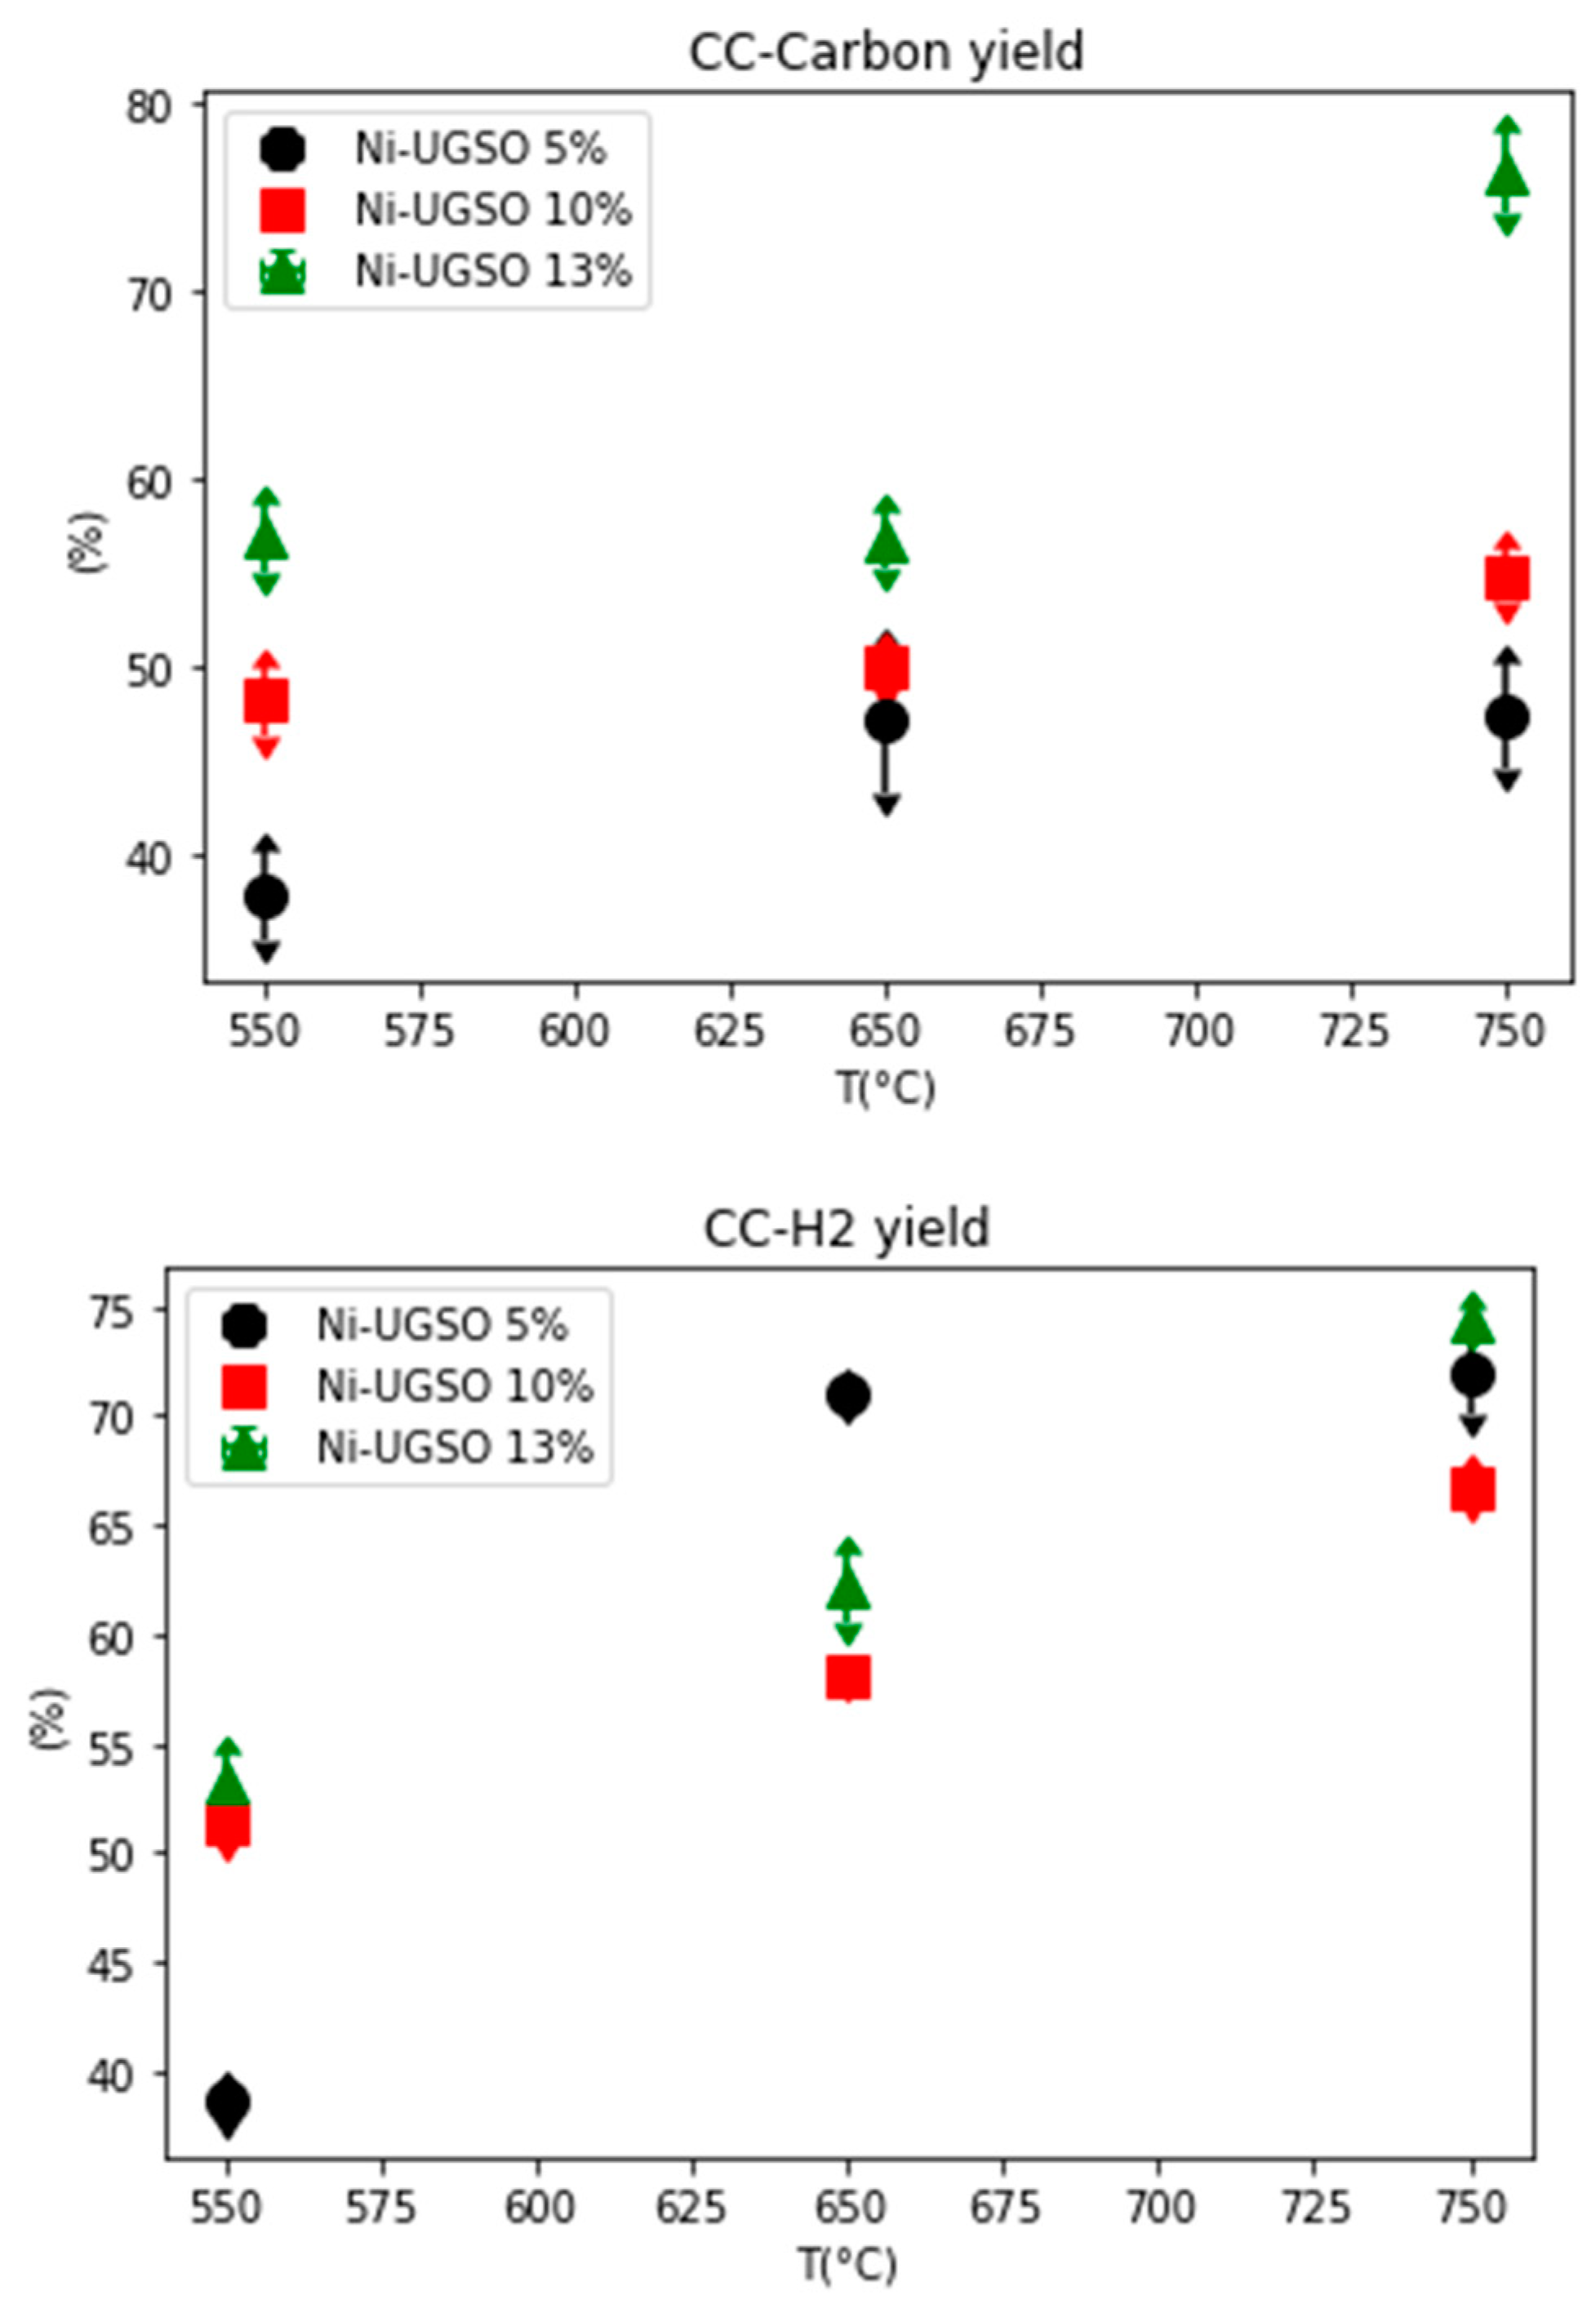
Figure 10.
Carbon and H2 yields for the CC reaction using Ni-UGSO with different Ni wt.% (5, 10, and 13) at T = 550 °C, 650 °C, and 750 °C for 2 h time-on-stream (TOS).
Figure 10.
Carbon and H2 yields for the CC reaction using Ni-UGSO with different Ni wt.% (5, 10, and 13) at T = 550 °C, 650 °C, and 750 °C for 2 h time-on-stream (TOS).
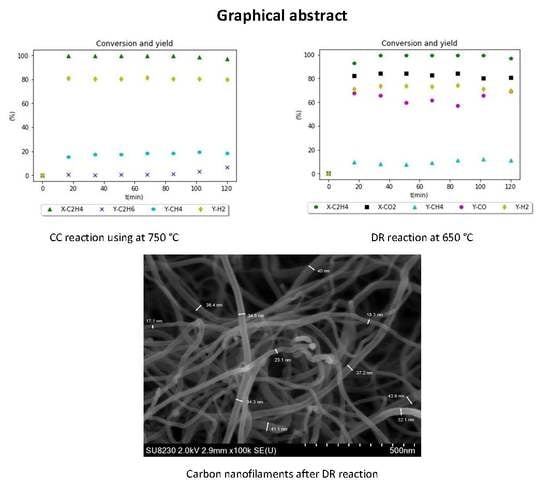
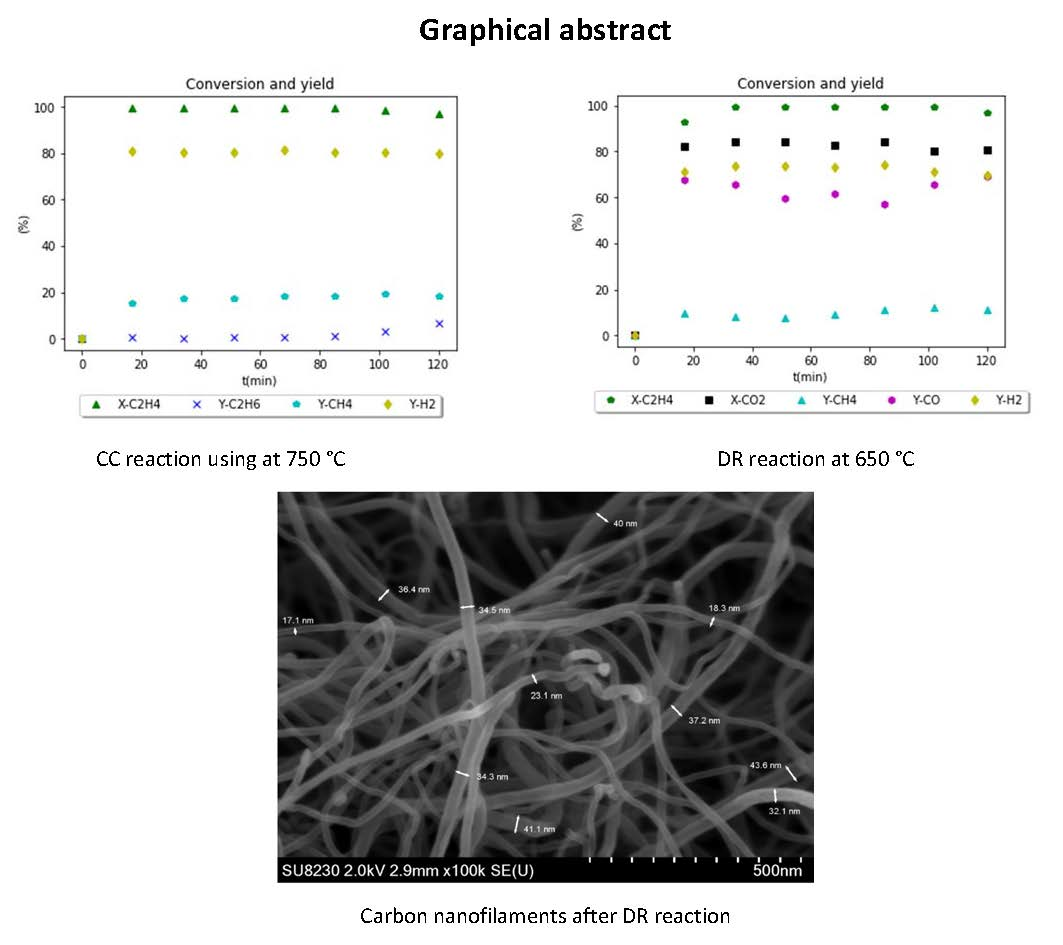
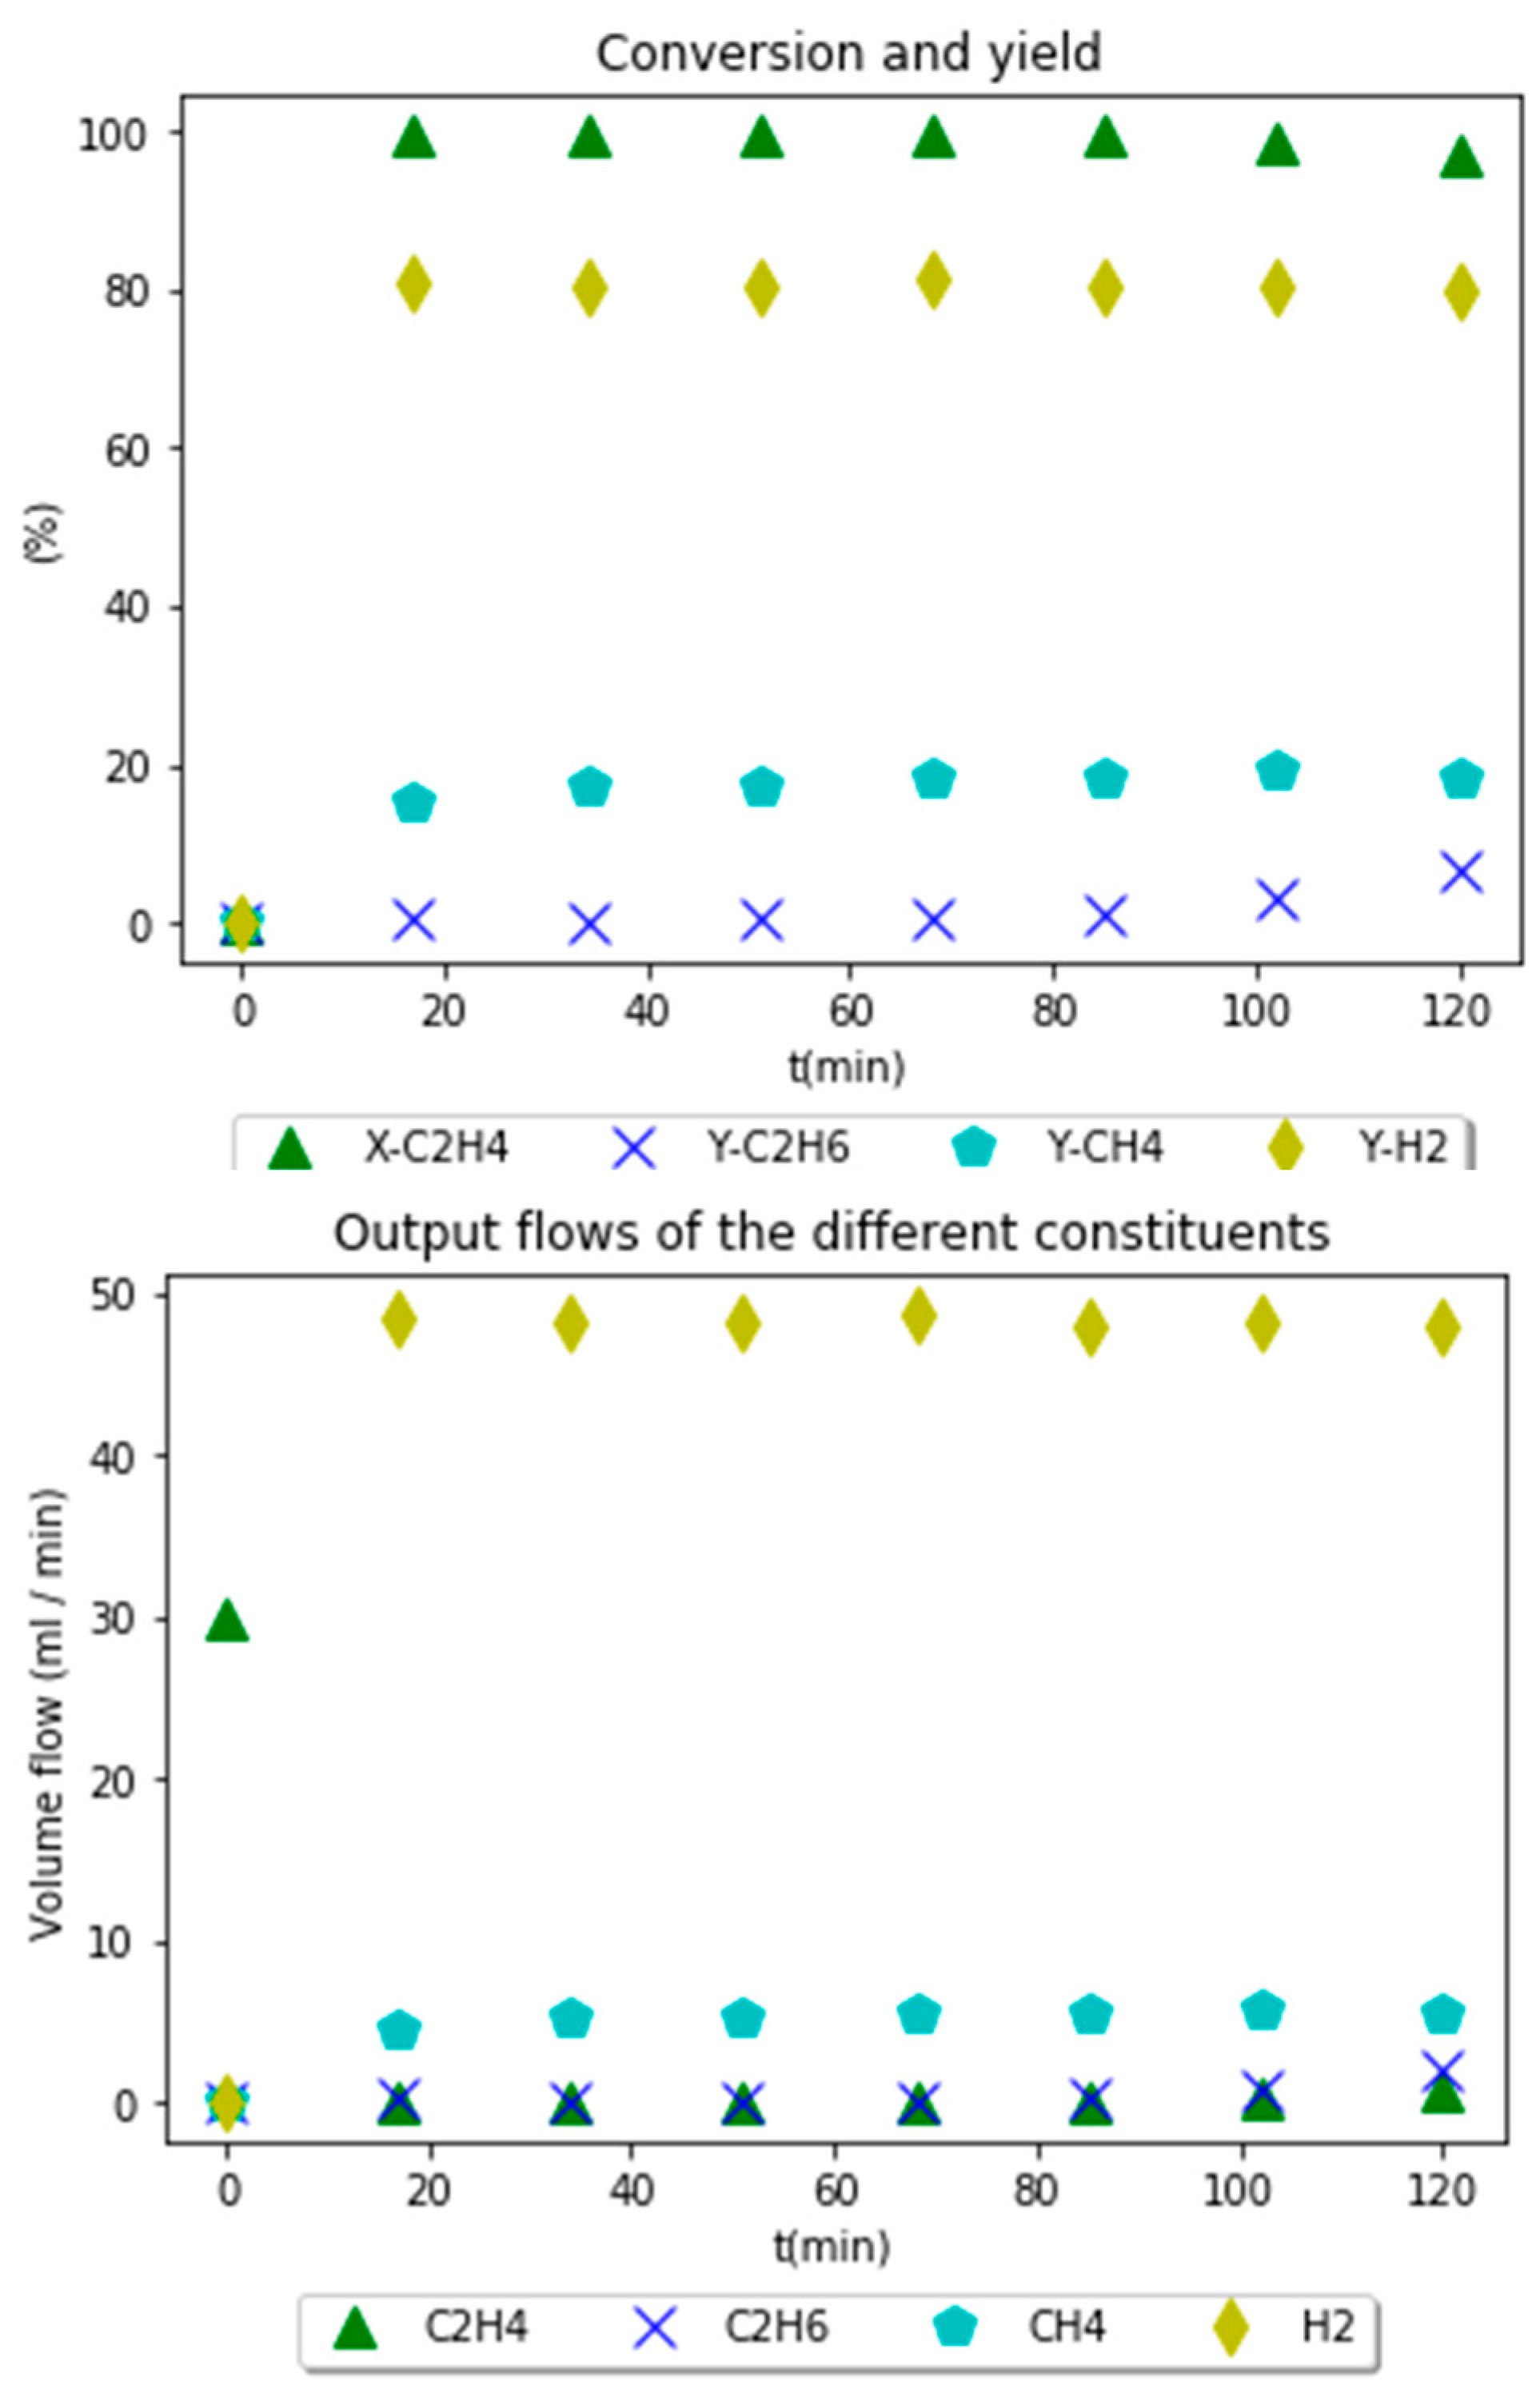
Figure 11.
Experimental results for CC reaction using Ni-UGSO 13% at 750 °C.
Figure 11.
Experimental results for CC reaction using Ni-UGSO 13% at 750 °C.
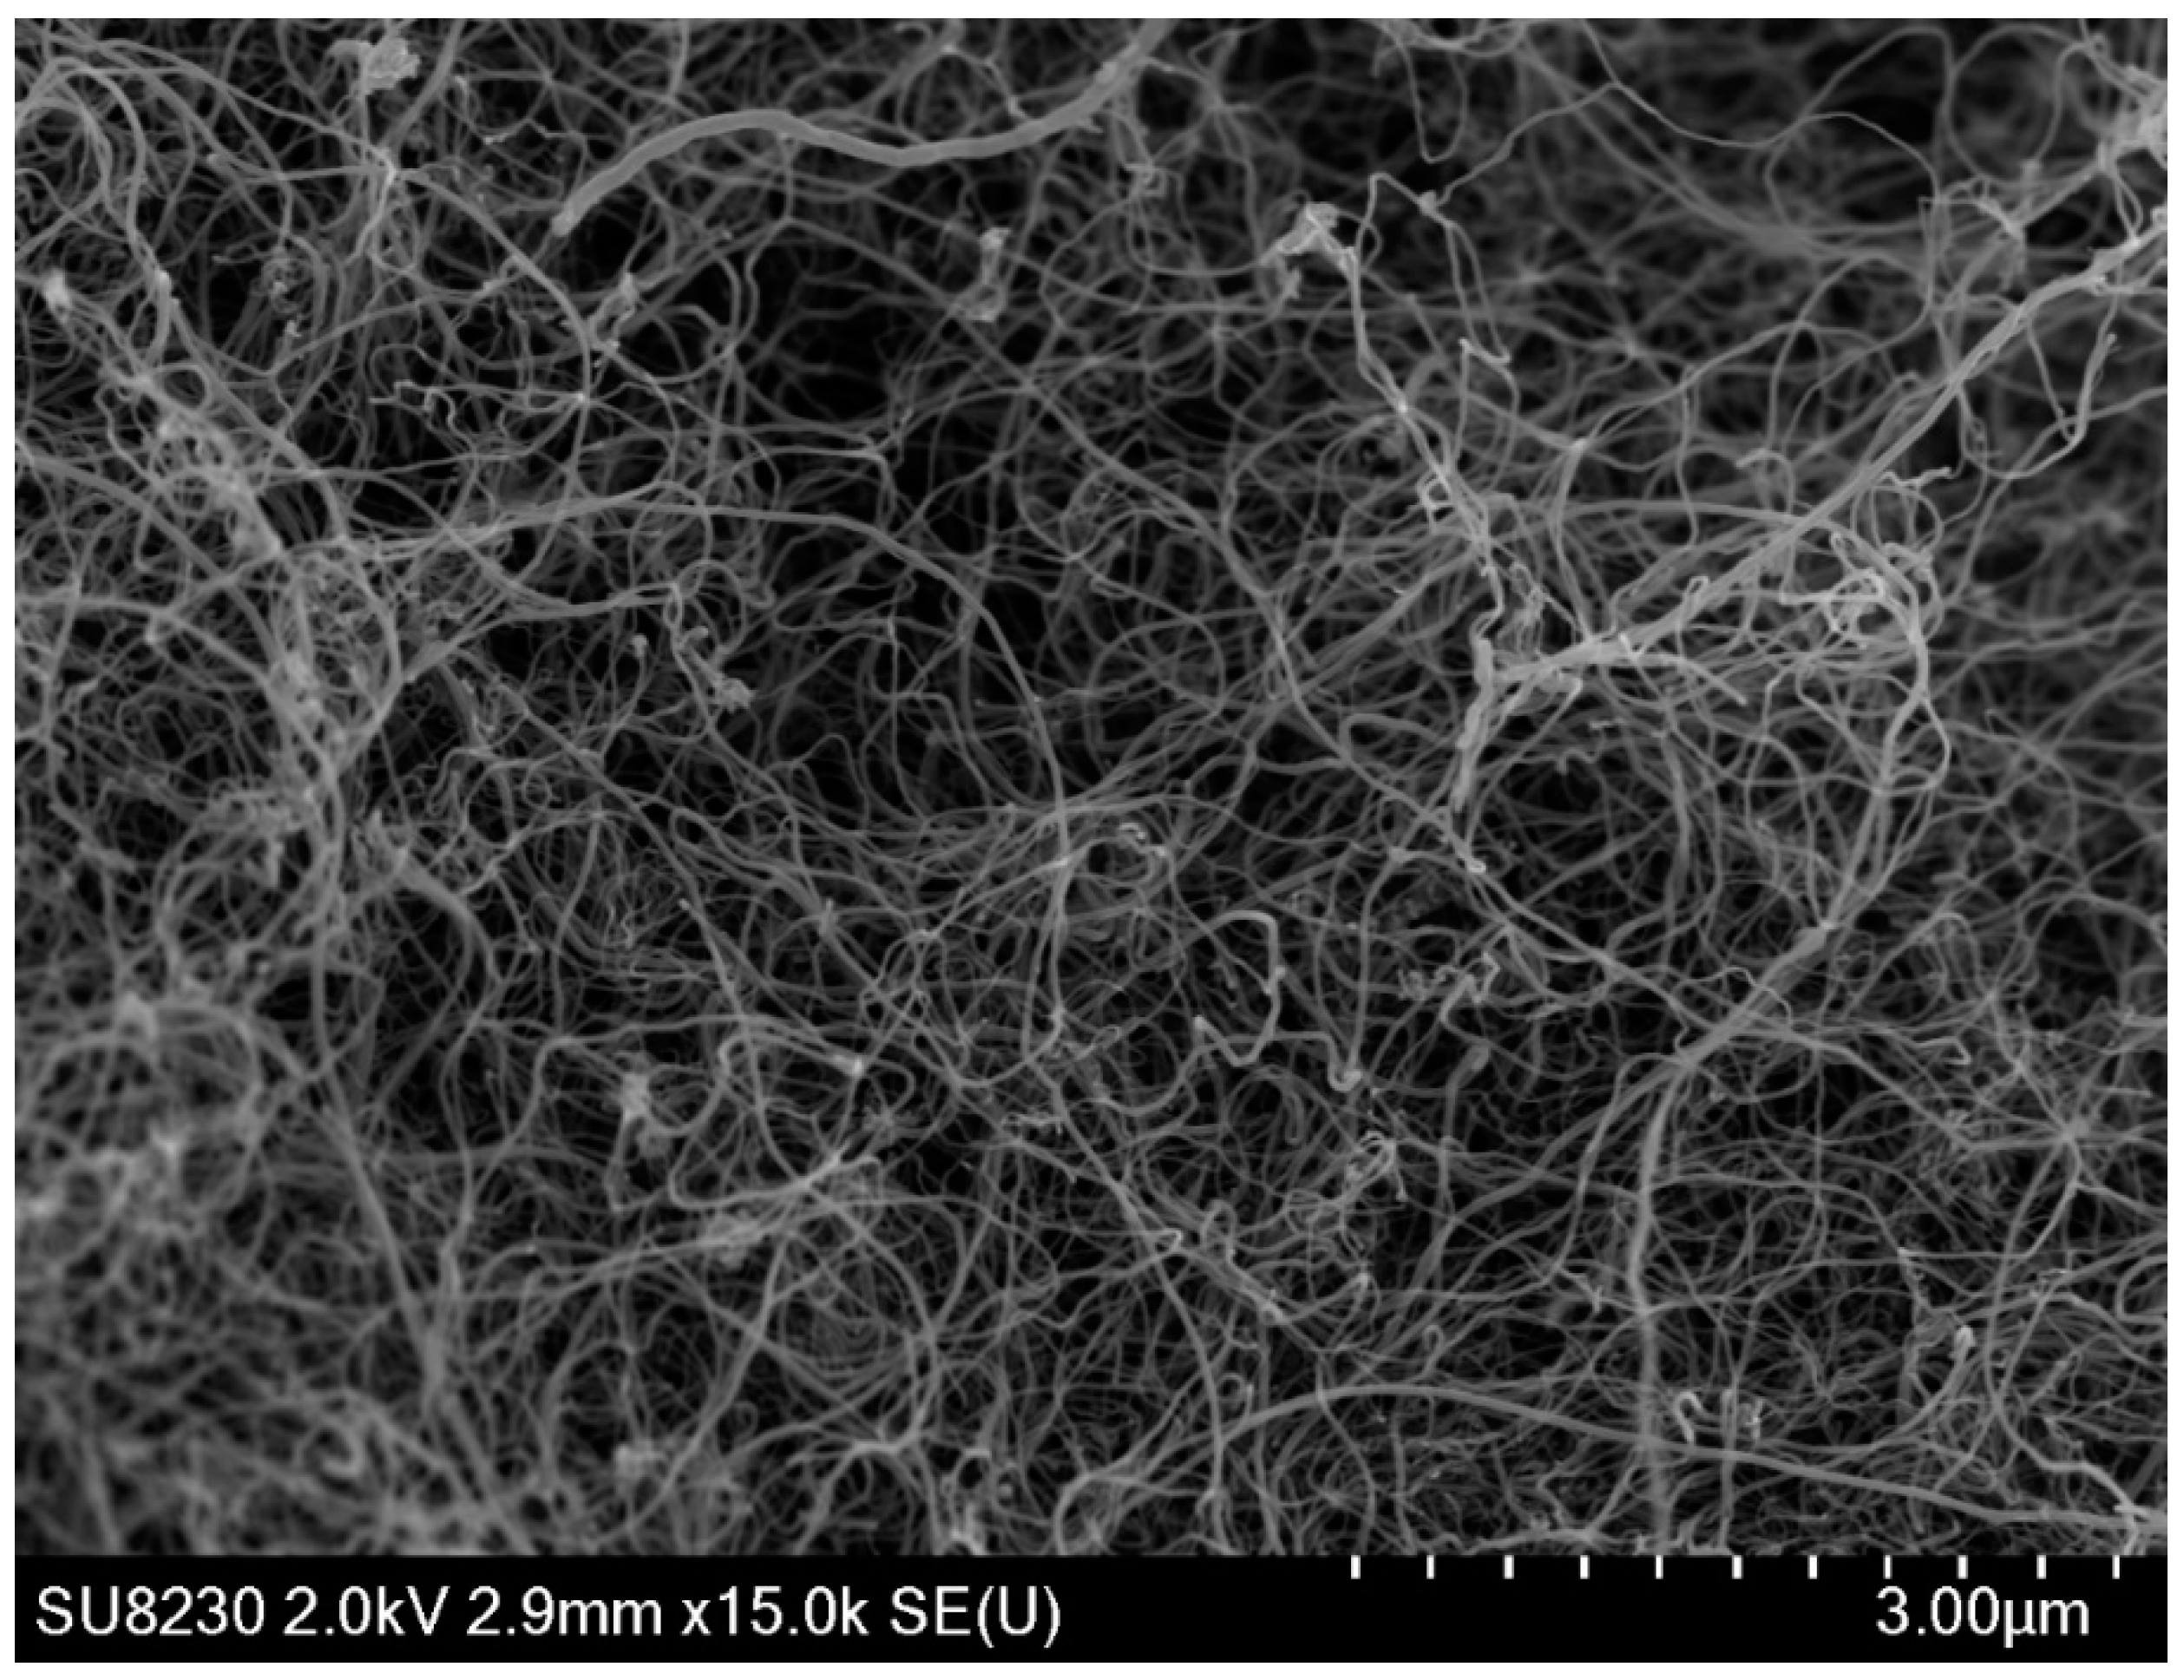
Figure 12.
SEM analysis of CNF produced at 750 °C using Ni-UGSO 13% for CC reaction.
Figure 12.
SEM analysis of CNF produced at 750 °C using Ni-UGSO 13% for CC reaction.
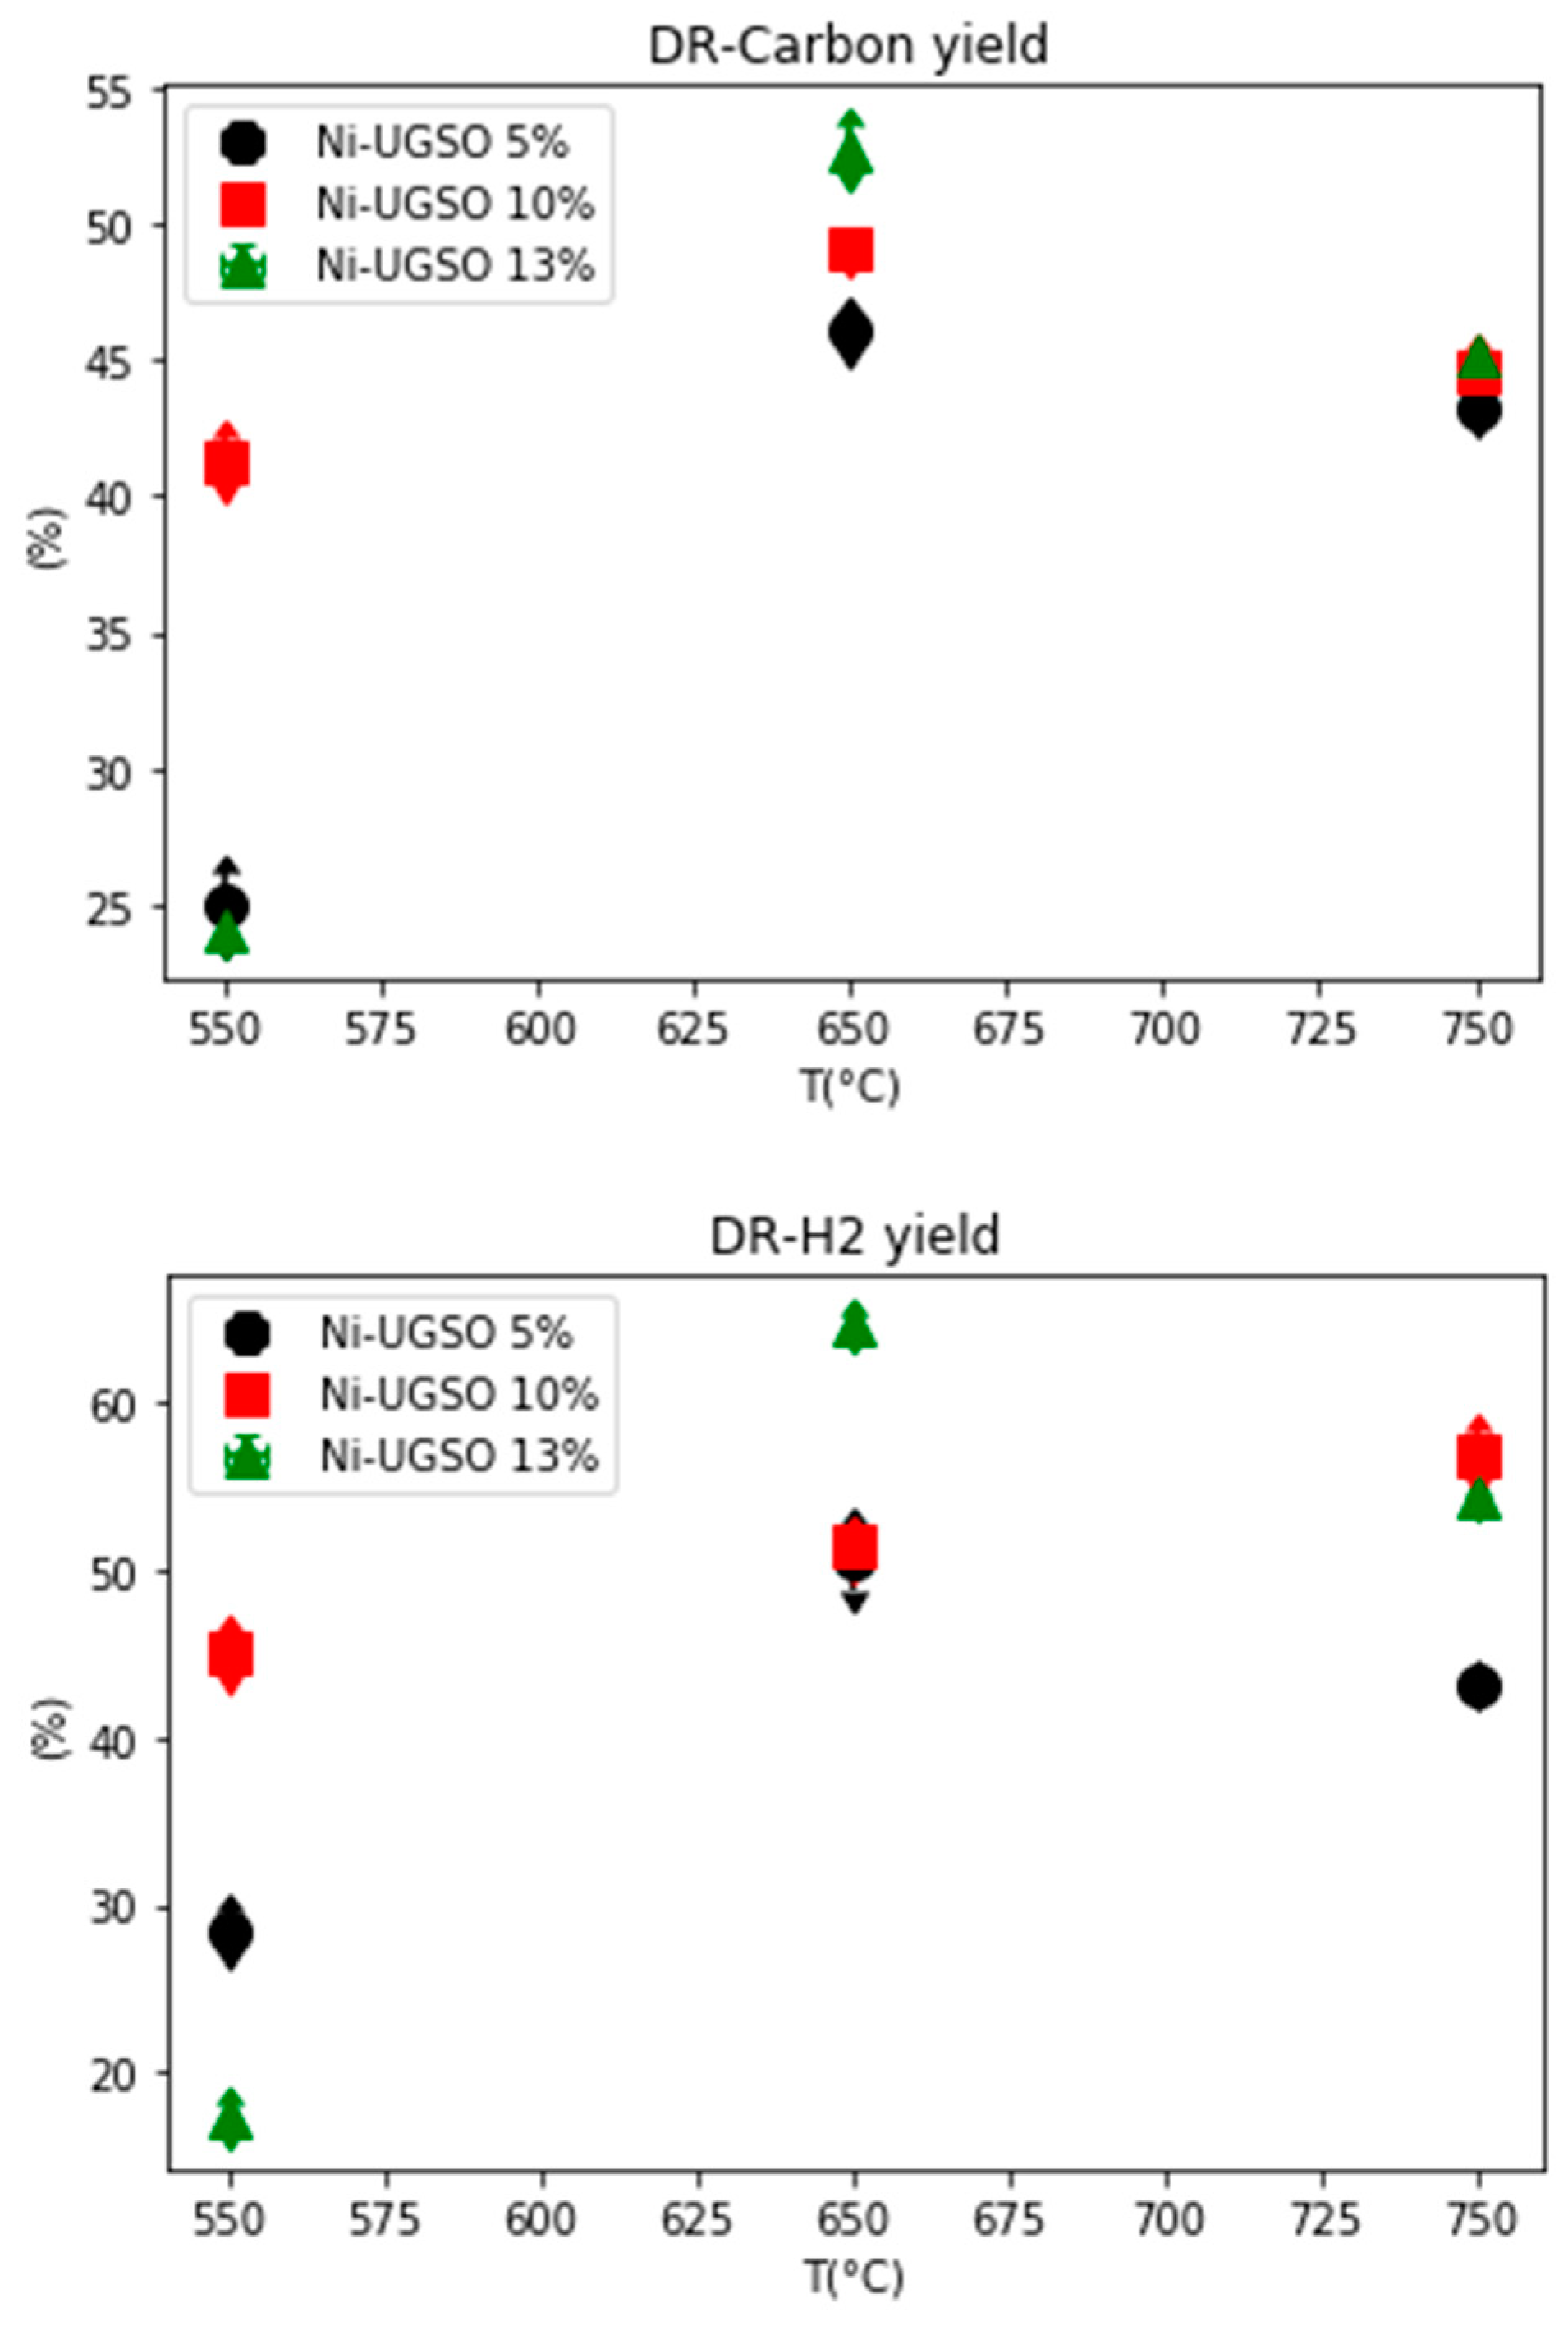
Figure 13.
Carbon and H2 yield for the DR reaction using Ni-UGSO with different Ni wt.% (5, 10, and 13) at T = 550 °C, 650 °C, and 750 °C for 2 h TOS.
Figure 13.
Carbon and H2 yield for the DR reaction using Ni-UGSO with different Ni wt.% (5, 10, and 13) at T = 550 °C, 650 °C, and 750 °C for 2 h TOS.
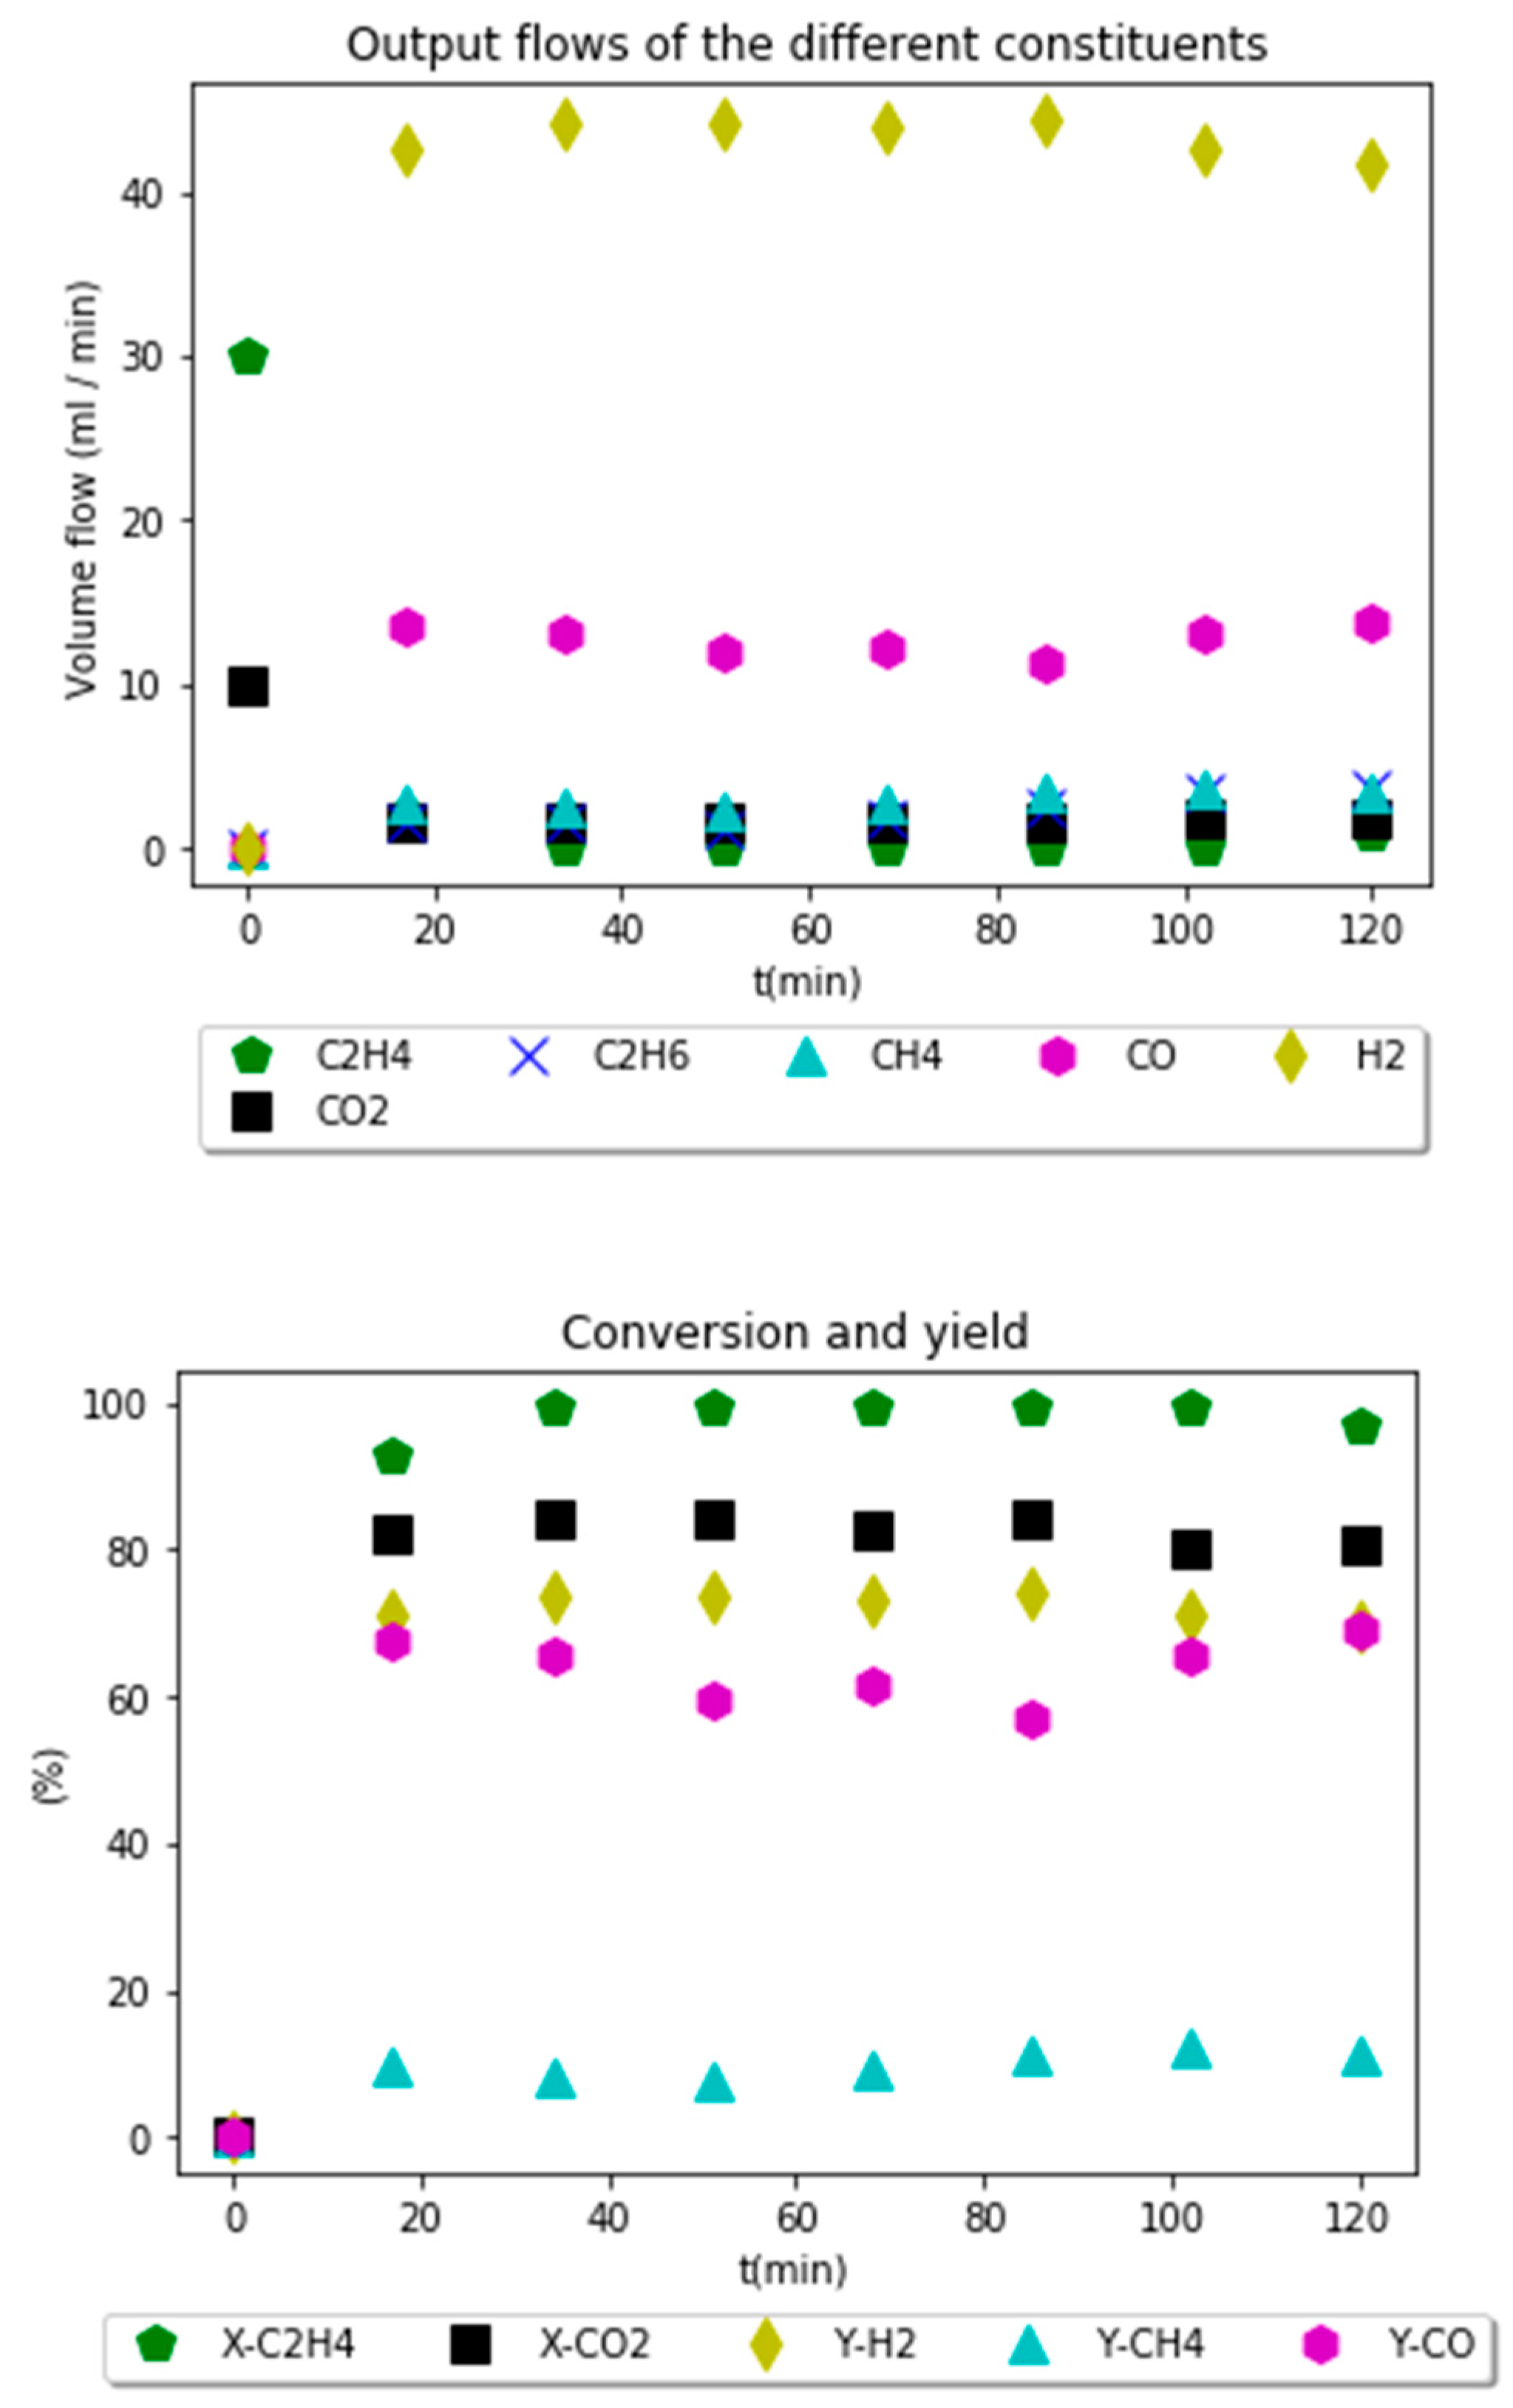
Figure 14.
Experimental results for DR reaction using Ni-UGSO 13% at 650 °C for 2 h TOS.
Figure 14.
Experimental results for DR reaction using Ni-UGSO 13% at 650 °C for 2 h TOS.
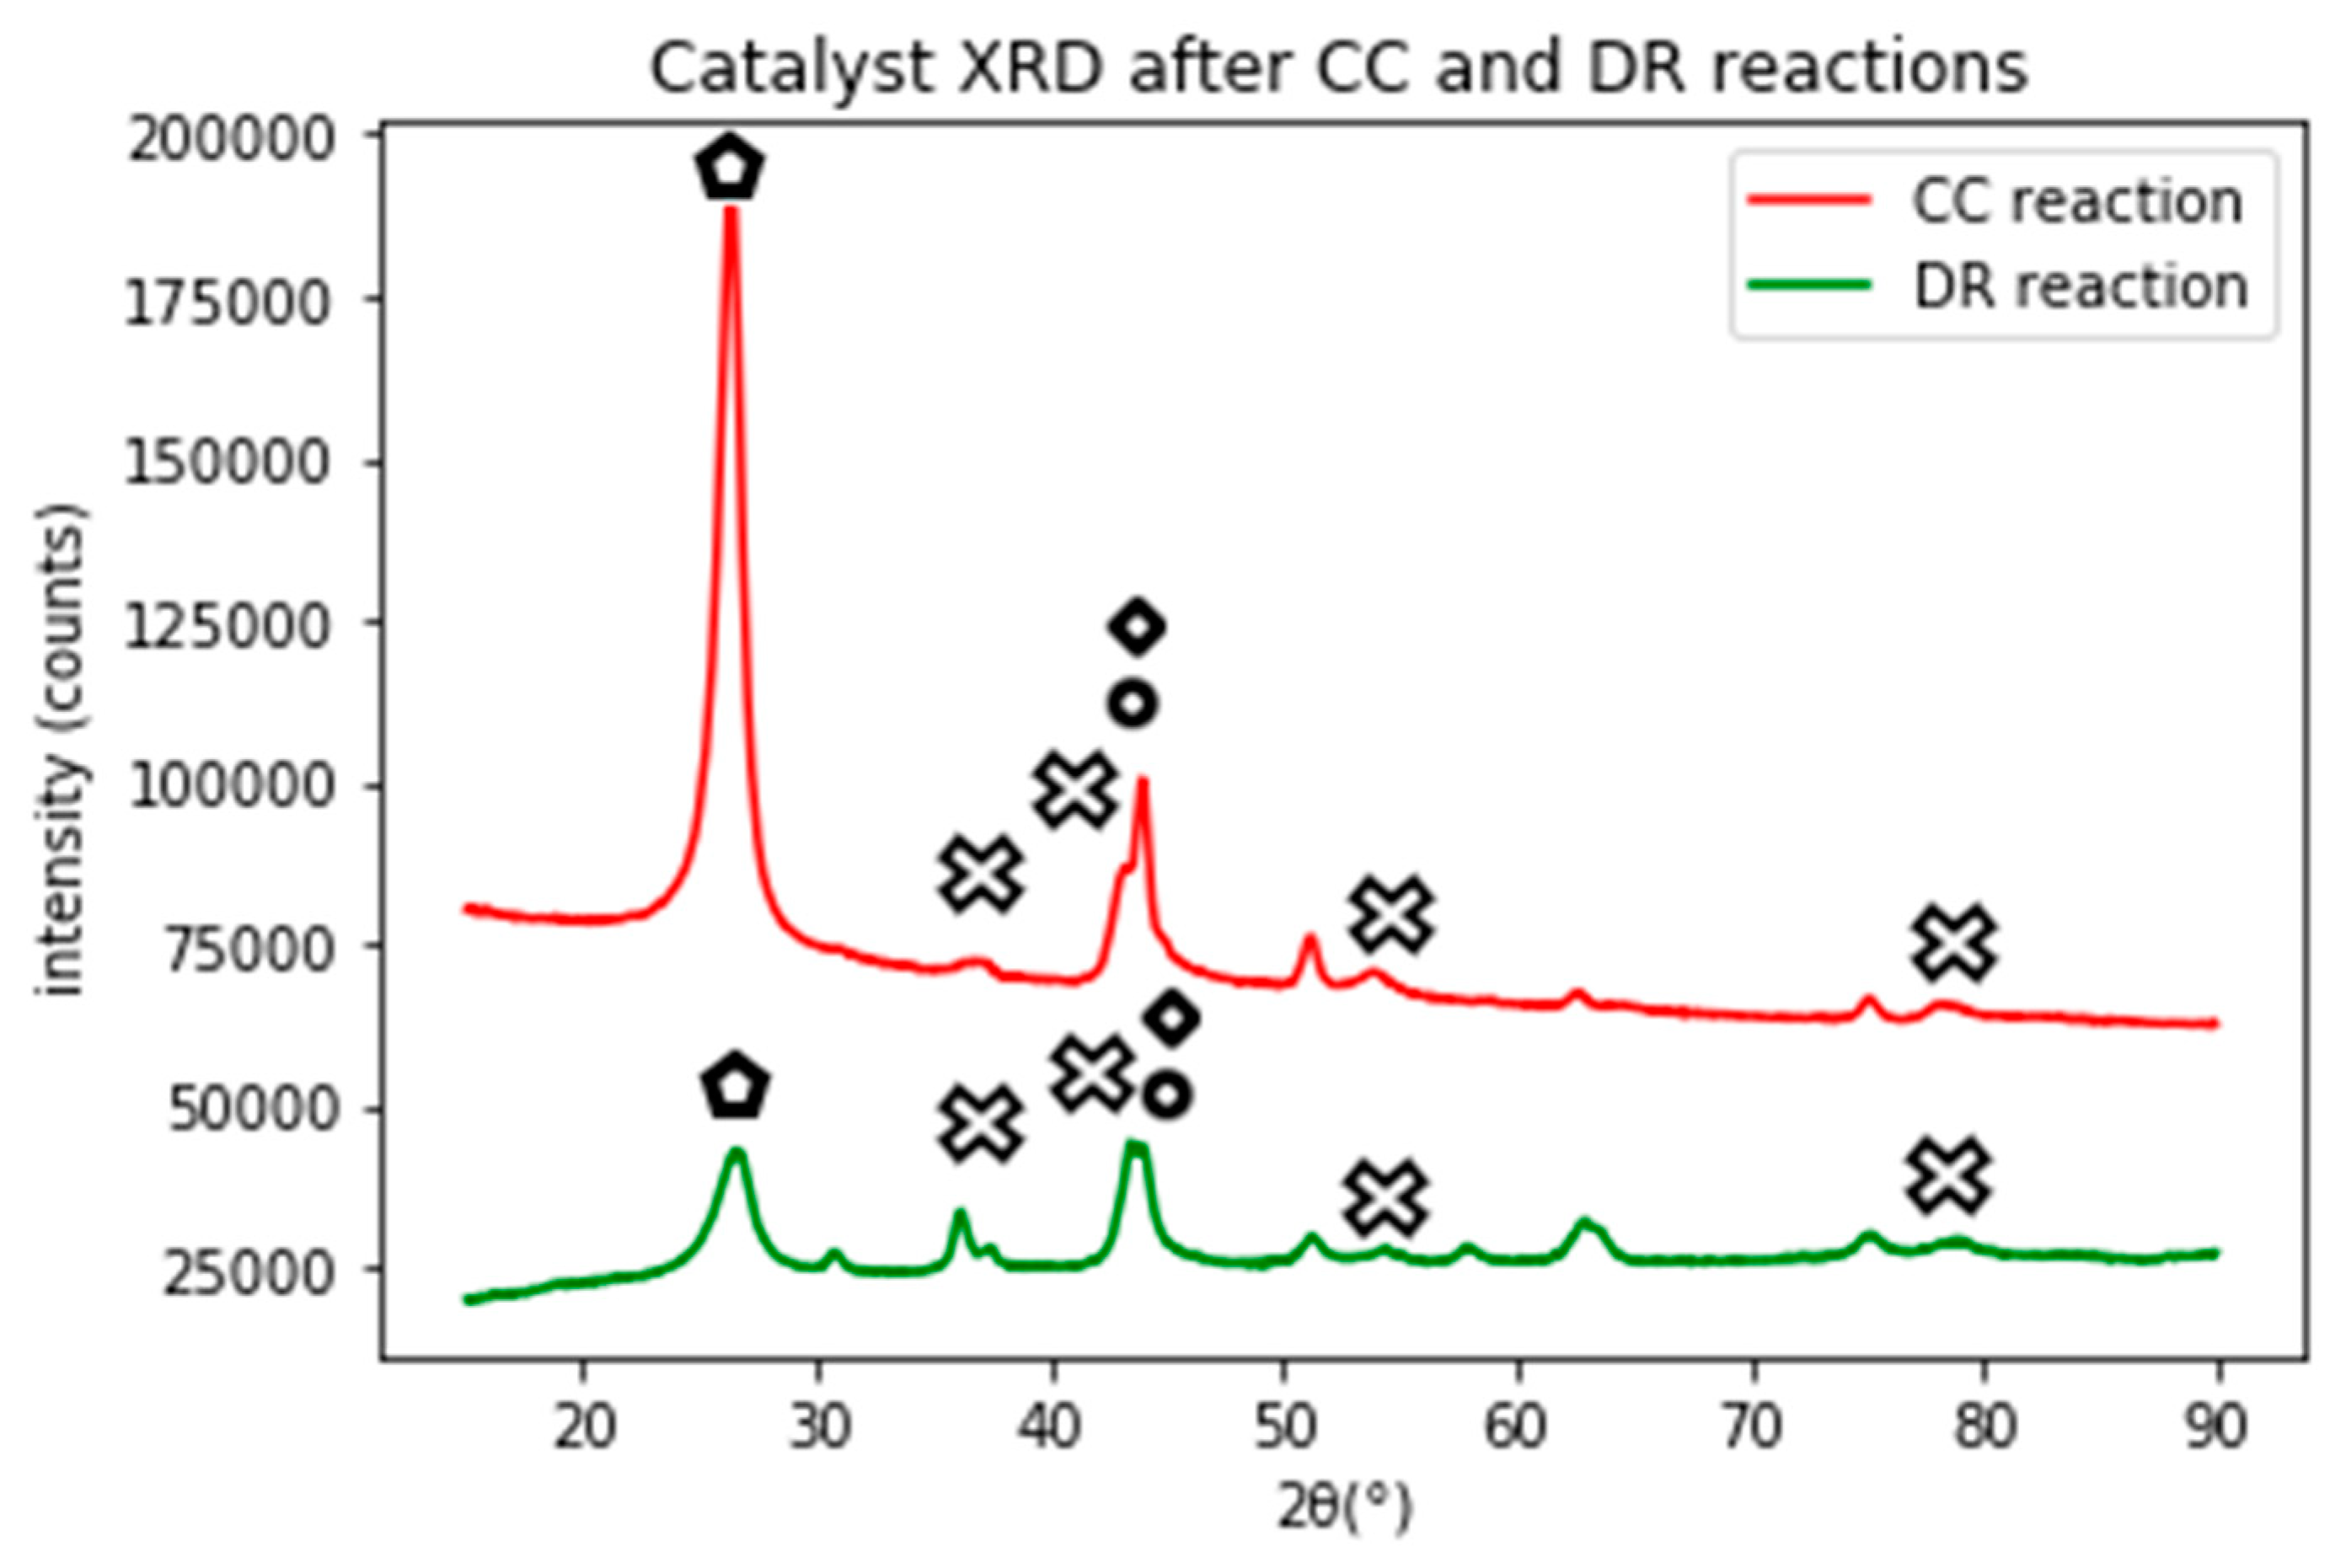
Figure 15.
XRD analysis of Ni-UGSO 13% after the CC reaction at 750 °C and after the DR reaction at 650 °C for 2 h TOS.
Figure 15.
XRD analysis of Ni-UGSO 13% after the CC reaction at 750 °C and after the DR reaction at 650 °C for 2 h TOS.
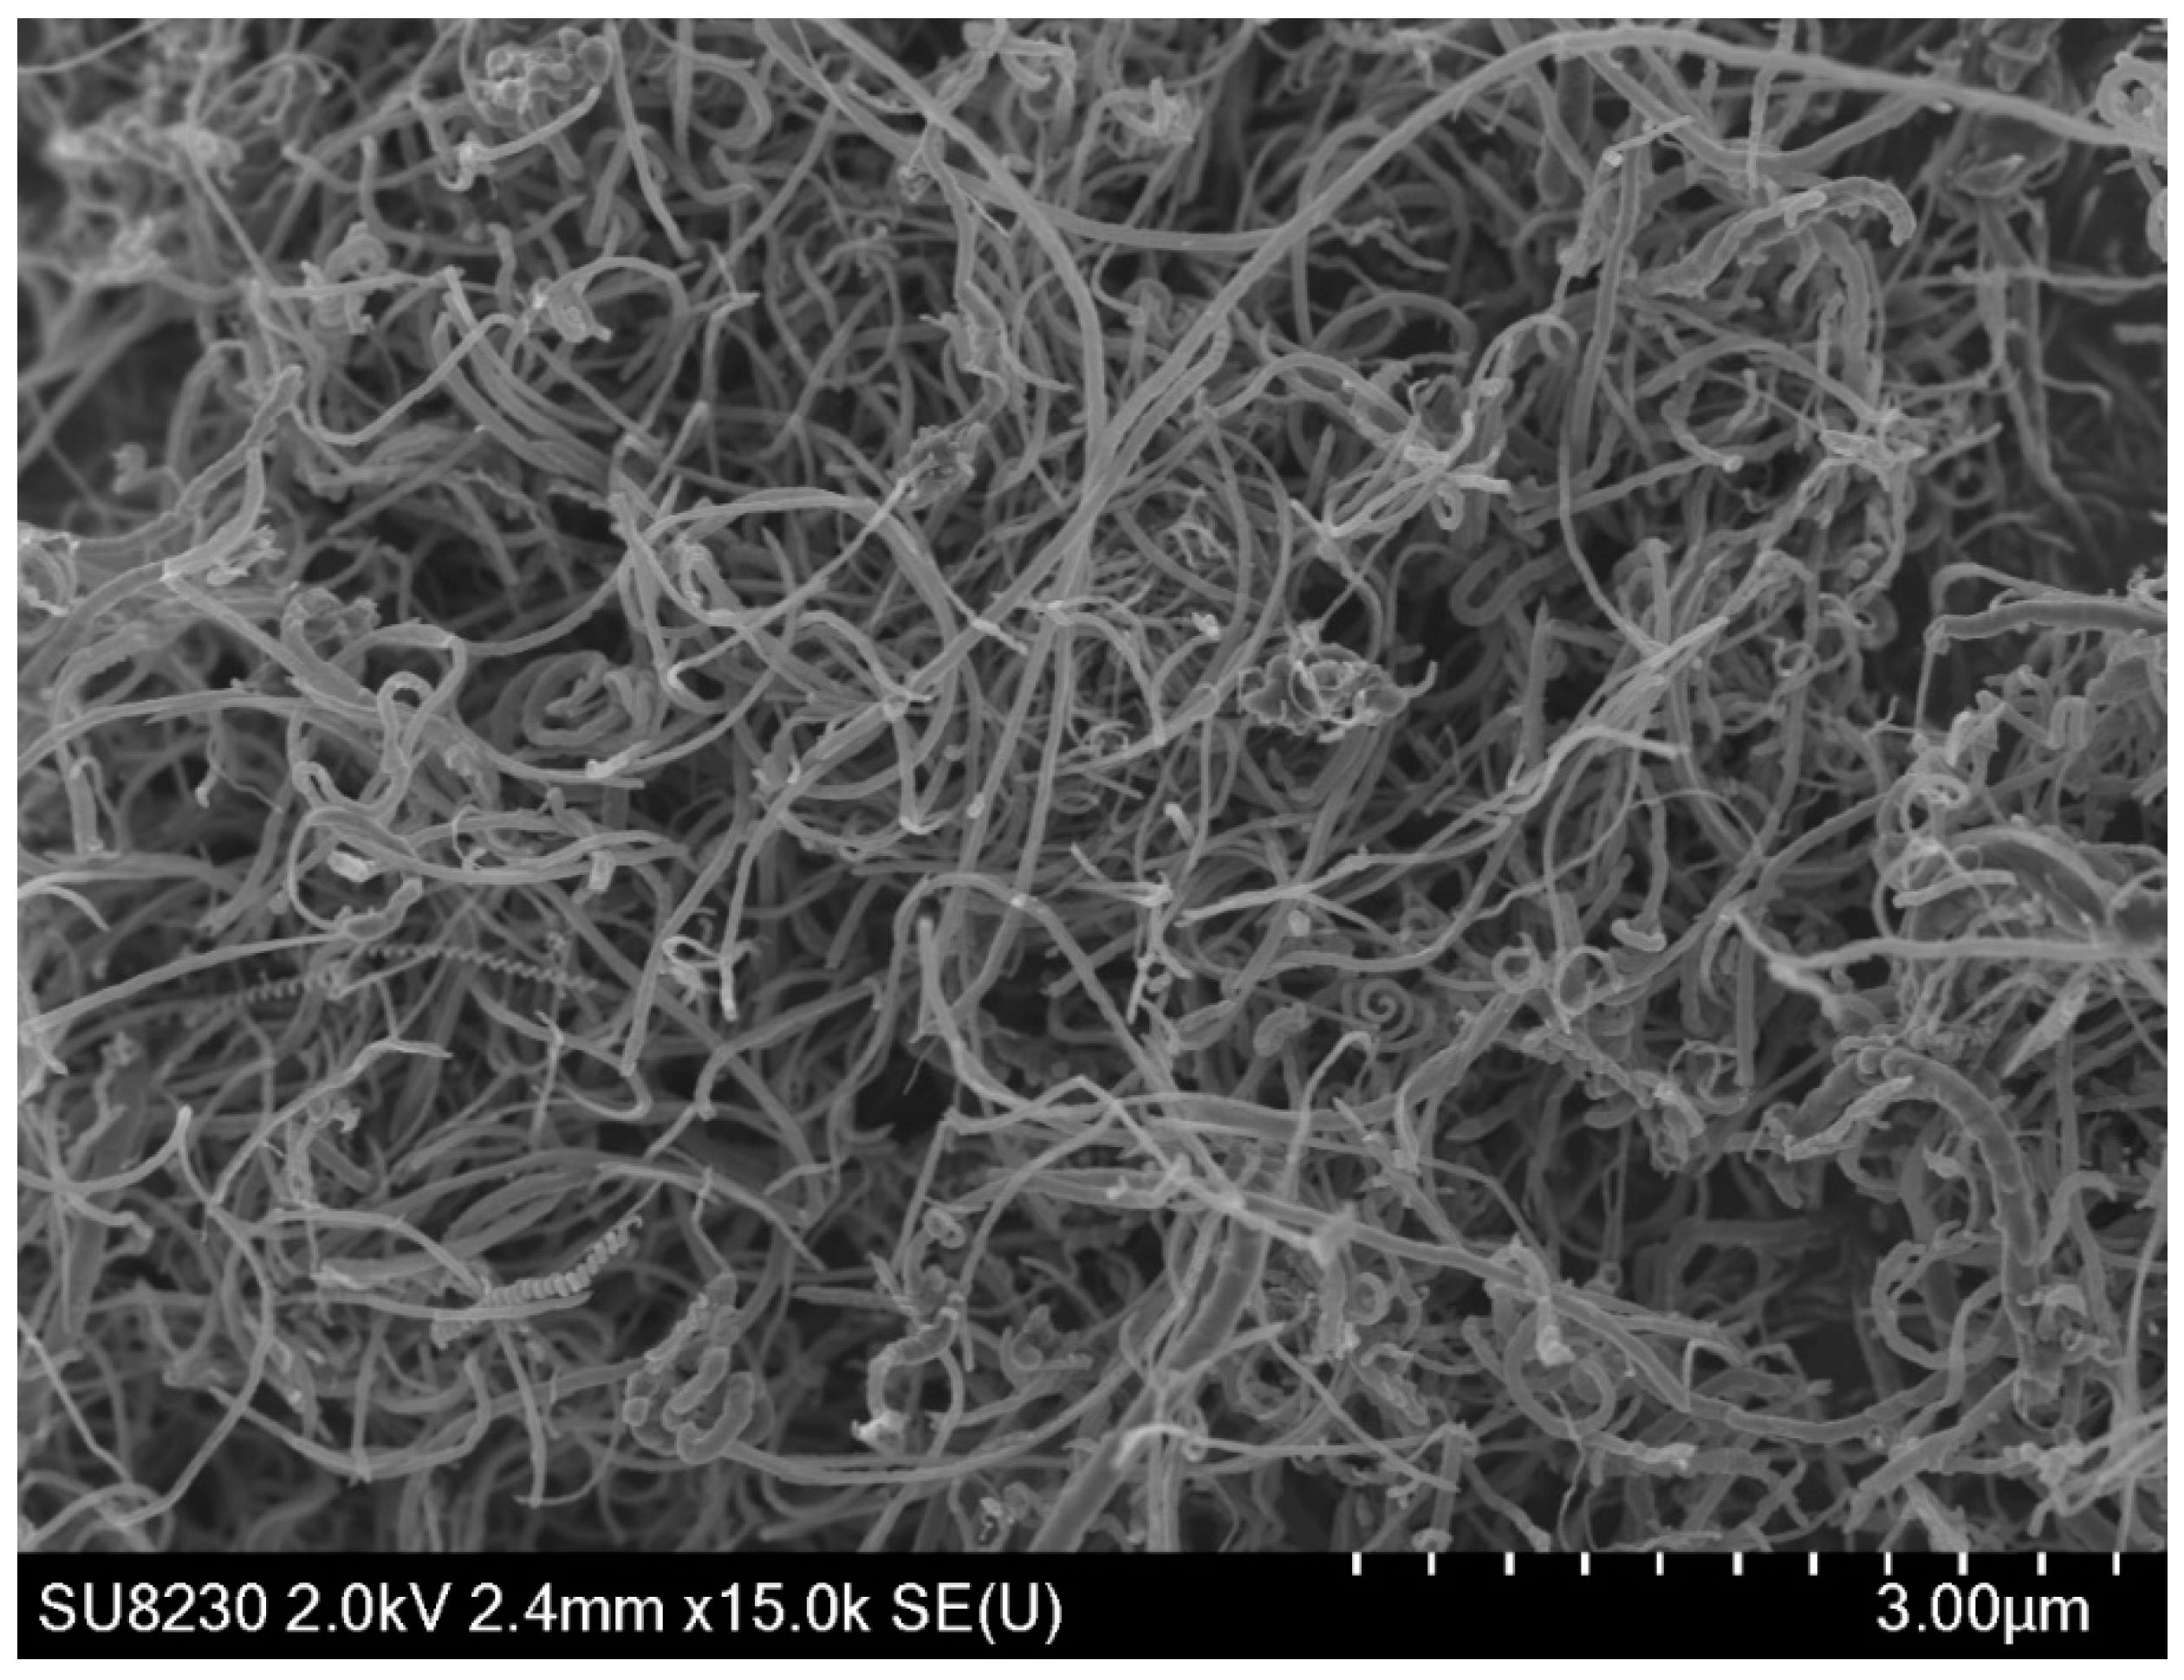
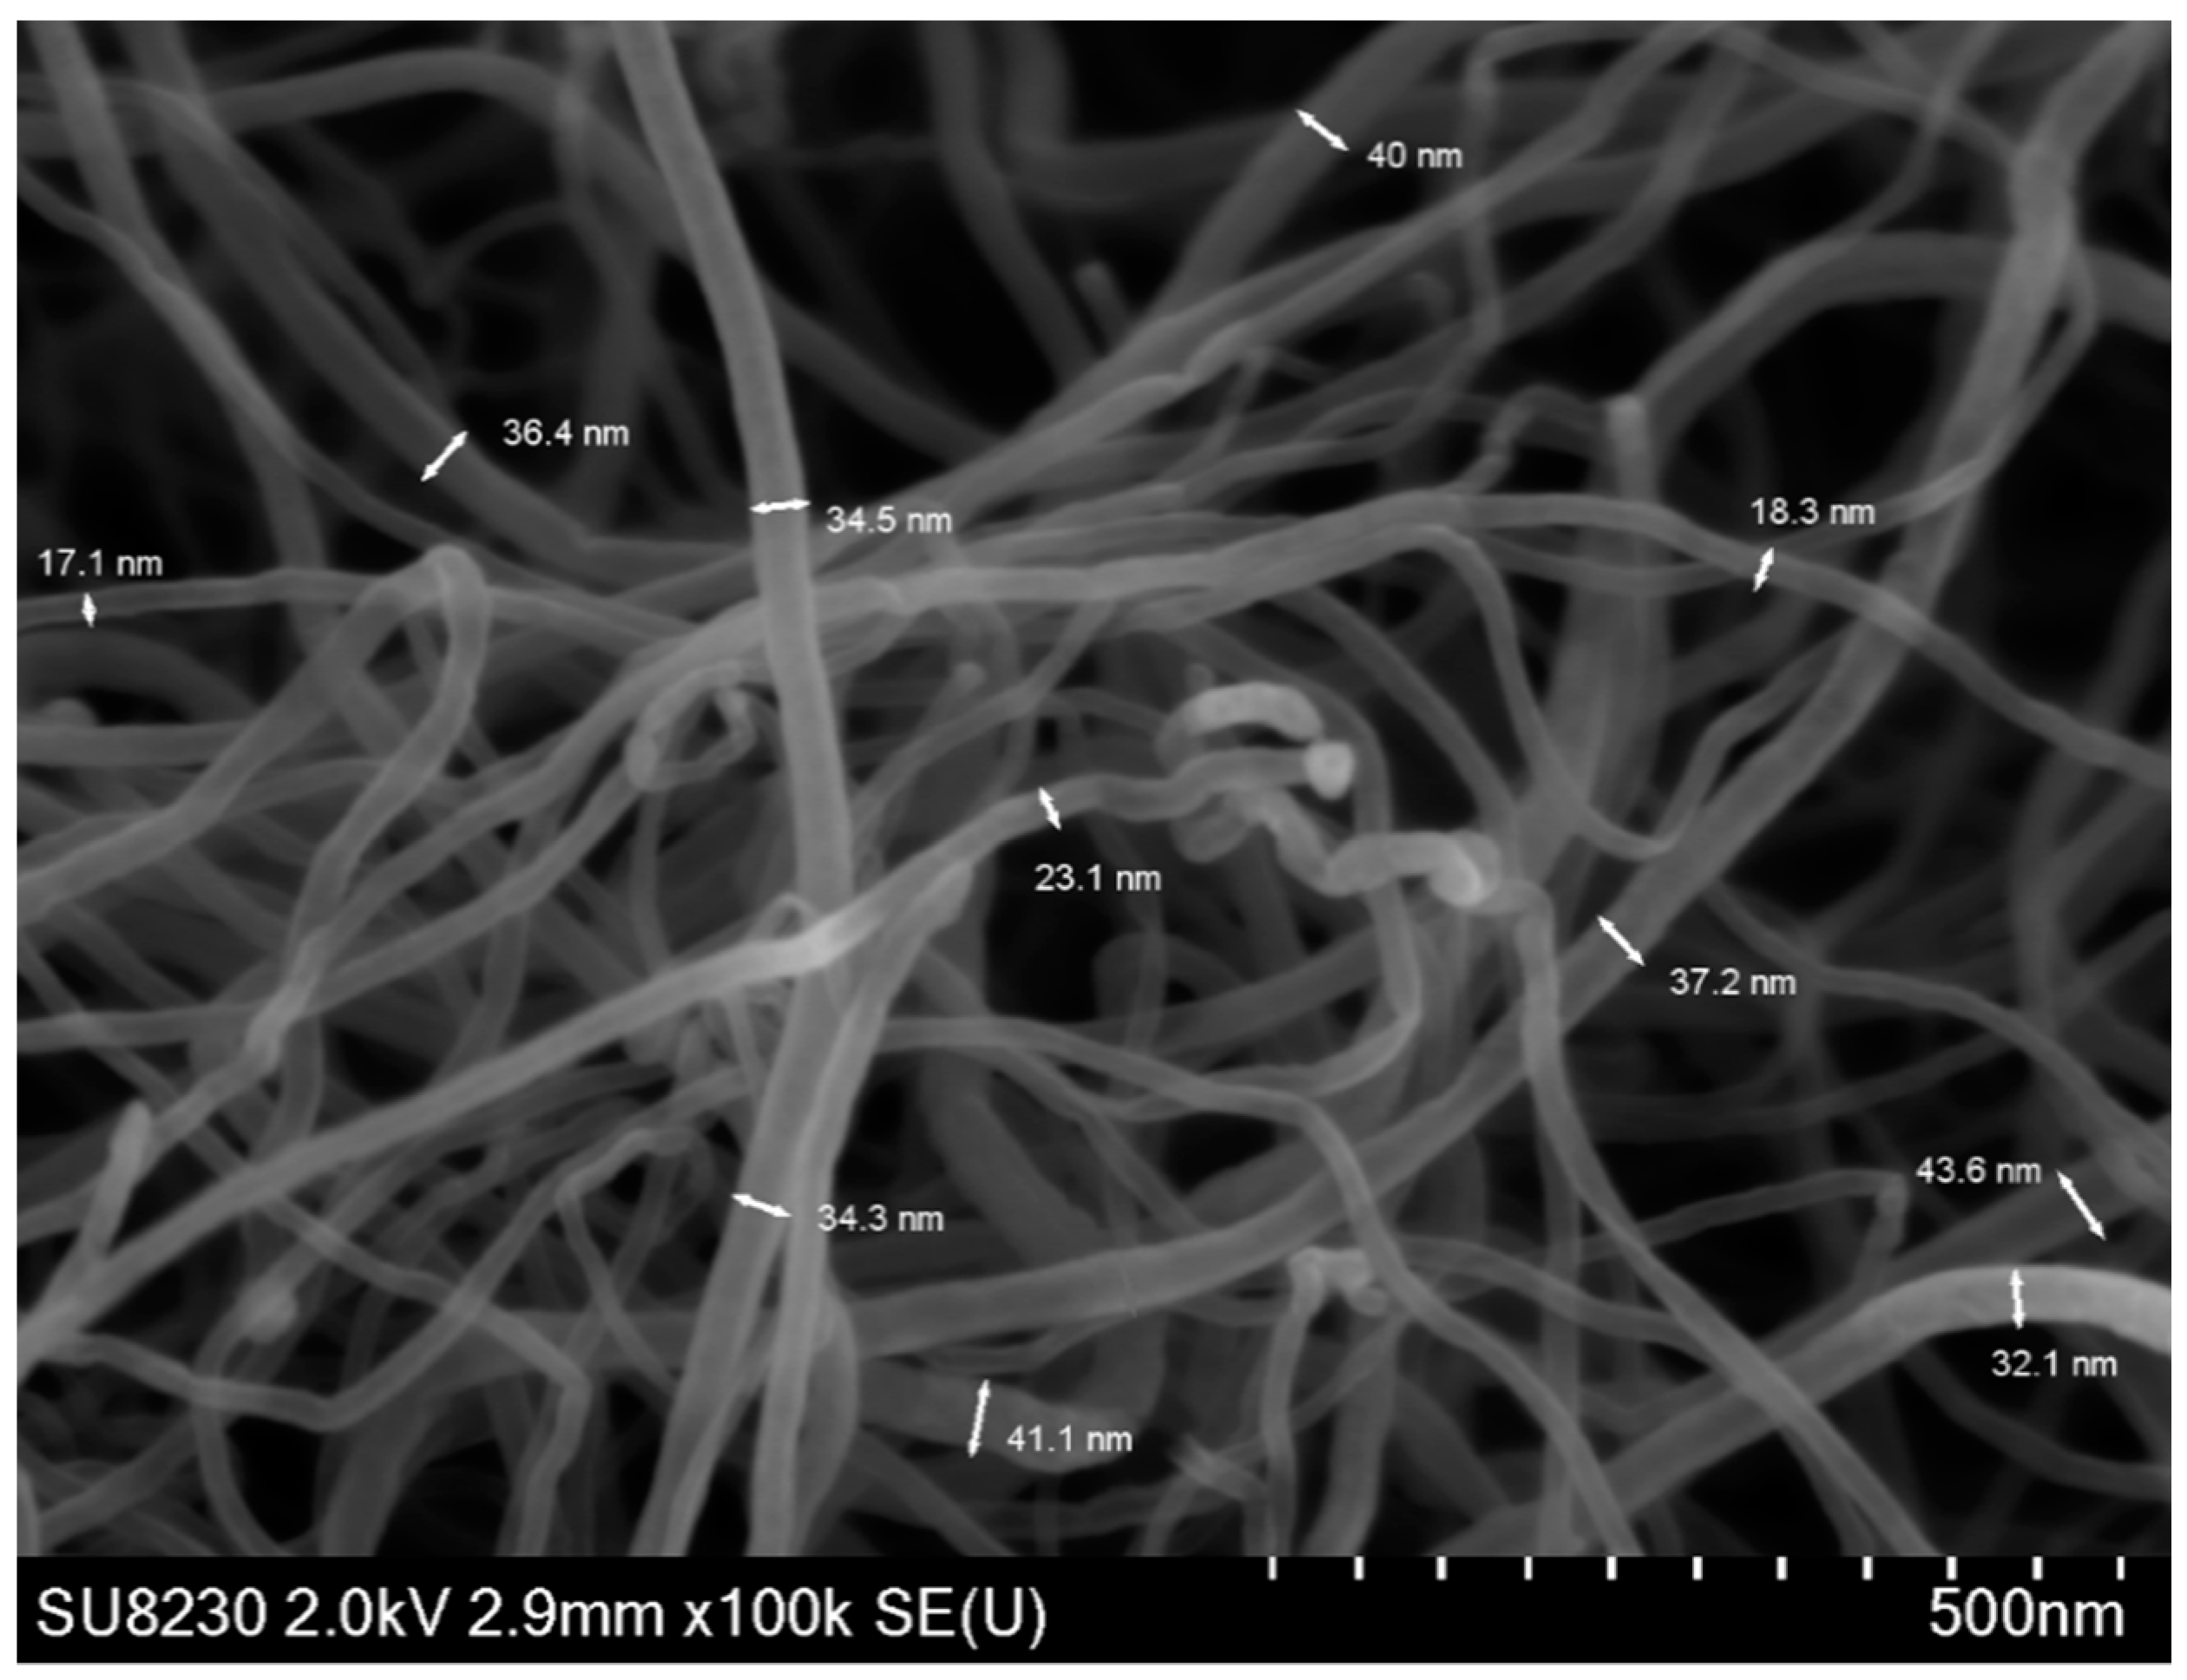
Figure 16.
SEM analysis of CNF produced at 650 °C using Ni-UGSO 13% for DR reaction for 2 h TOS.
Figure 16.
SEM analysis of CNF produced at 650 °C using Ni-UGSO 13% for DR reaction for 2 h TOS.
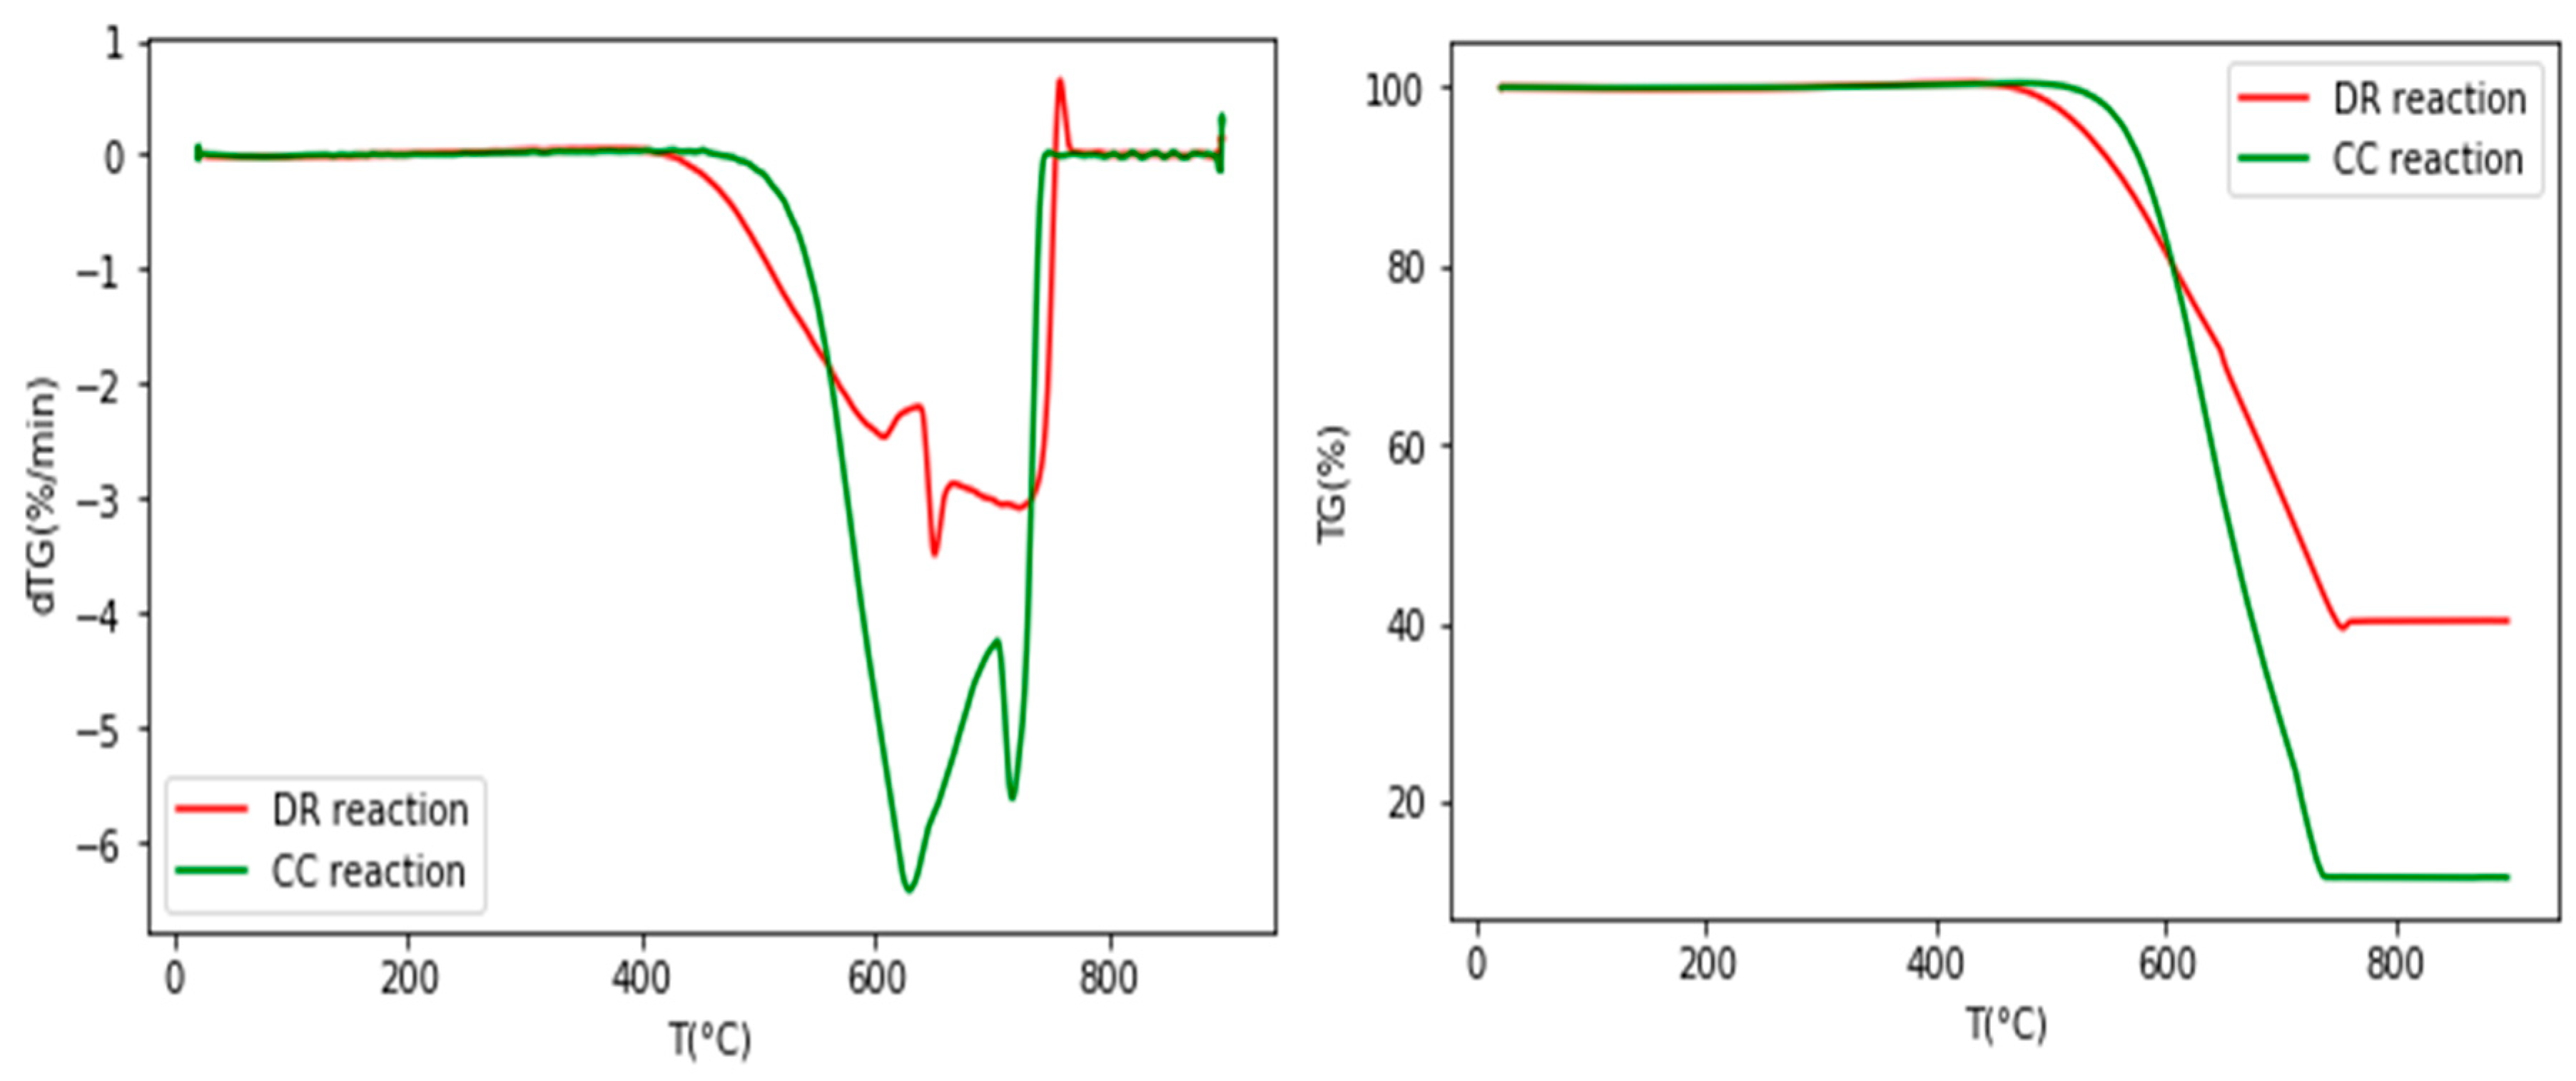
Figure 17.
TGA analysis of Ni-UGSO 13% after CC reaction at 750 °C and after DR reaction at 650 °C for 2 h TOS.
Figure 17.
TGA analysis of Ni-UGSO 13% after CC reaction at 750 °C and after DR reaction at 650 °C for 2 h TOS.
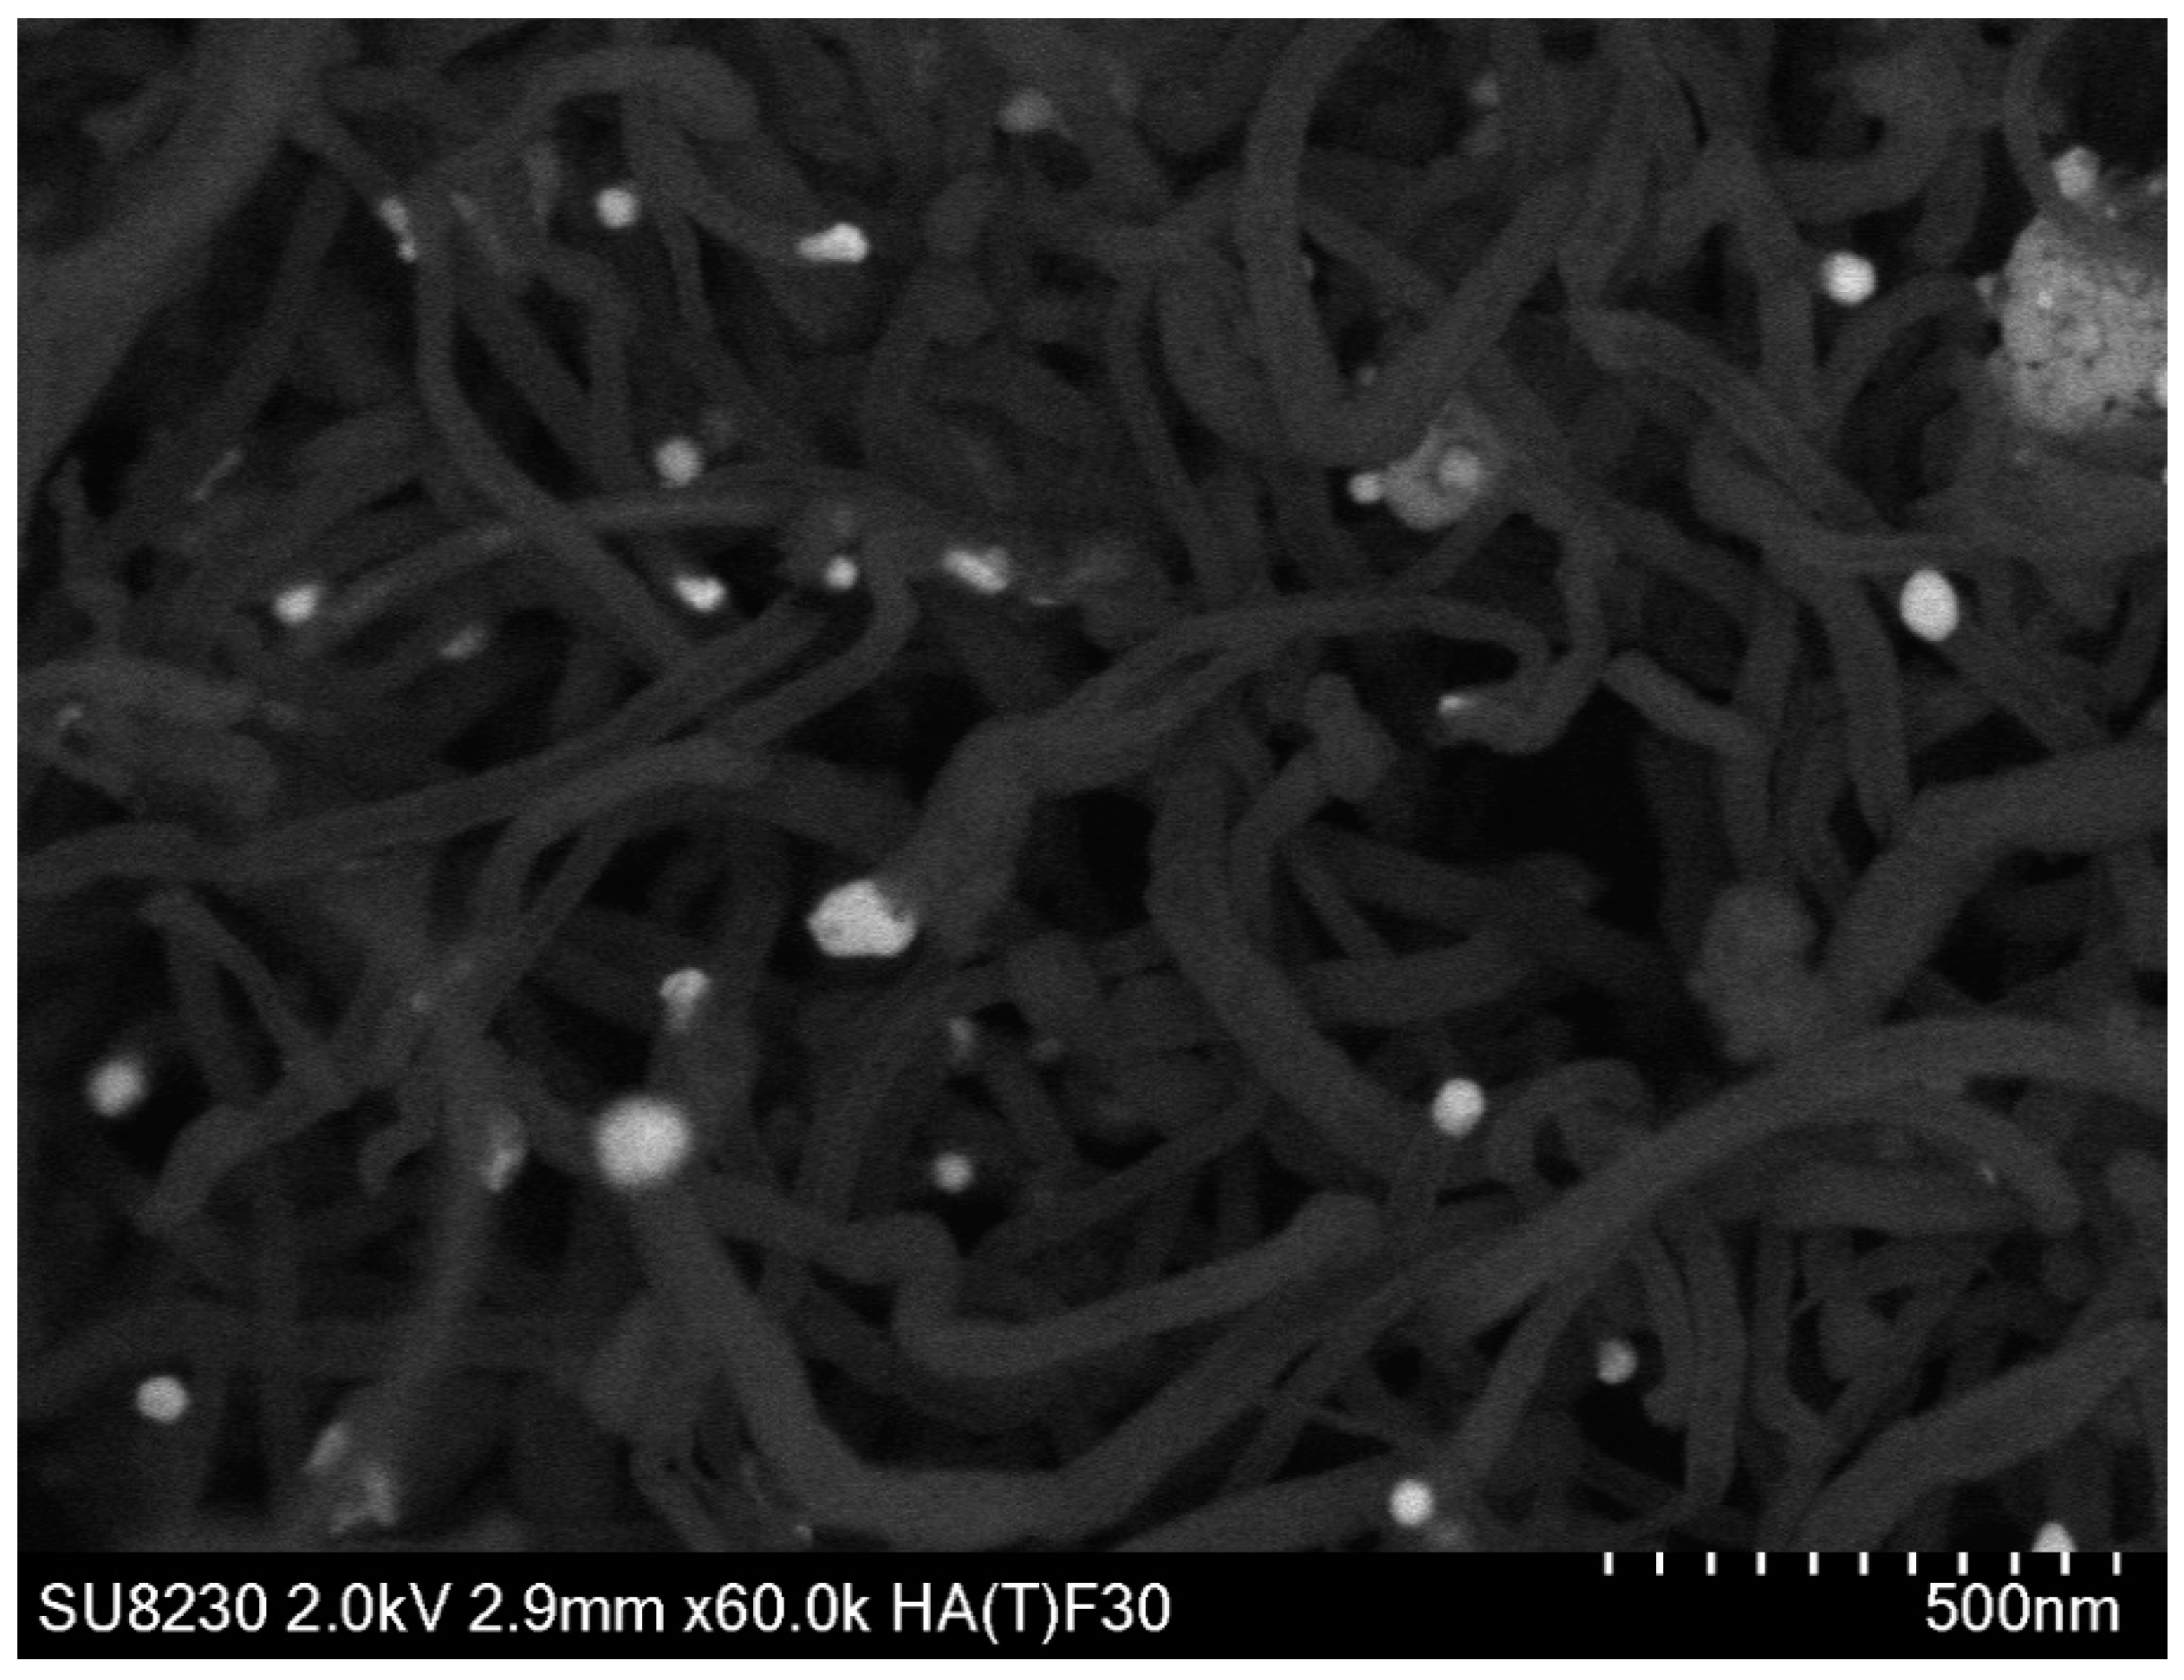
Figure 18.
SEM analysis of carbon deposited on Ni-UGSO 13% after DR reaction at 650 °C for 2 h TOS.
Figure 18.
SEM analysis of carbon deposited on Ni-UGSO 13% after DR reaction at 650 °C for 2 h TOS.
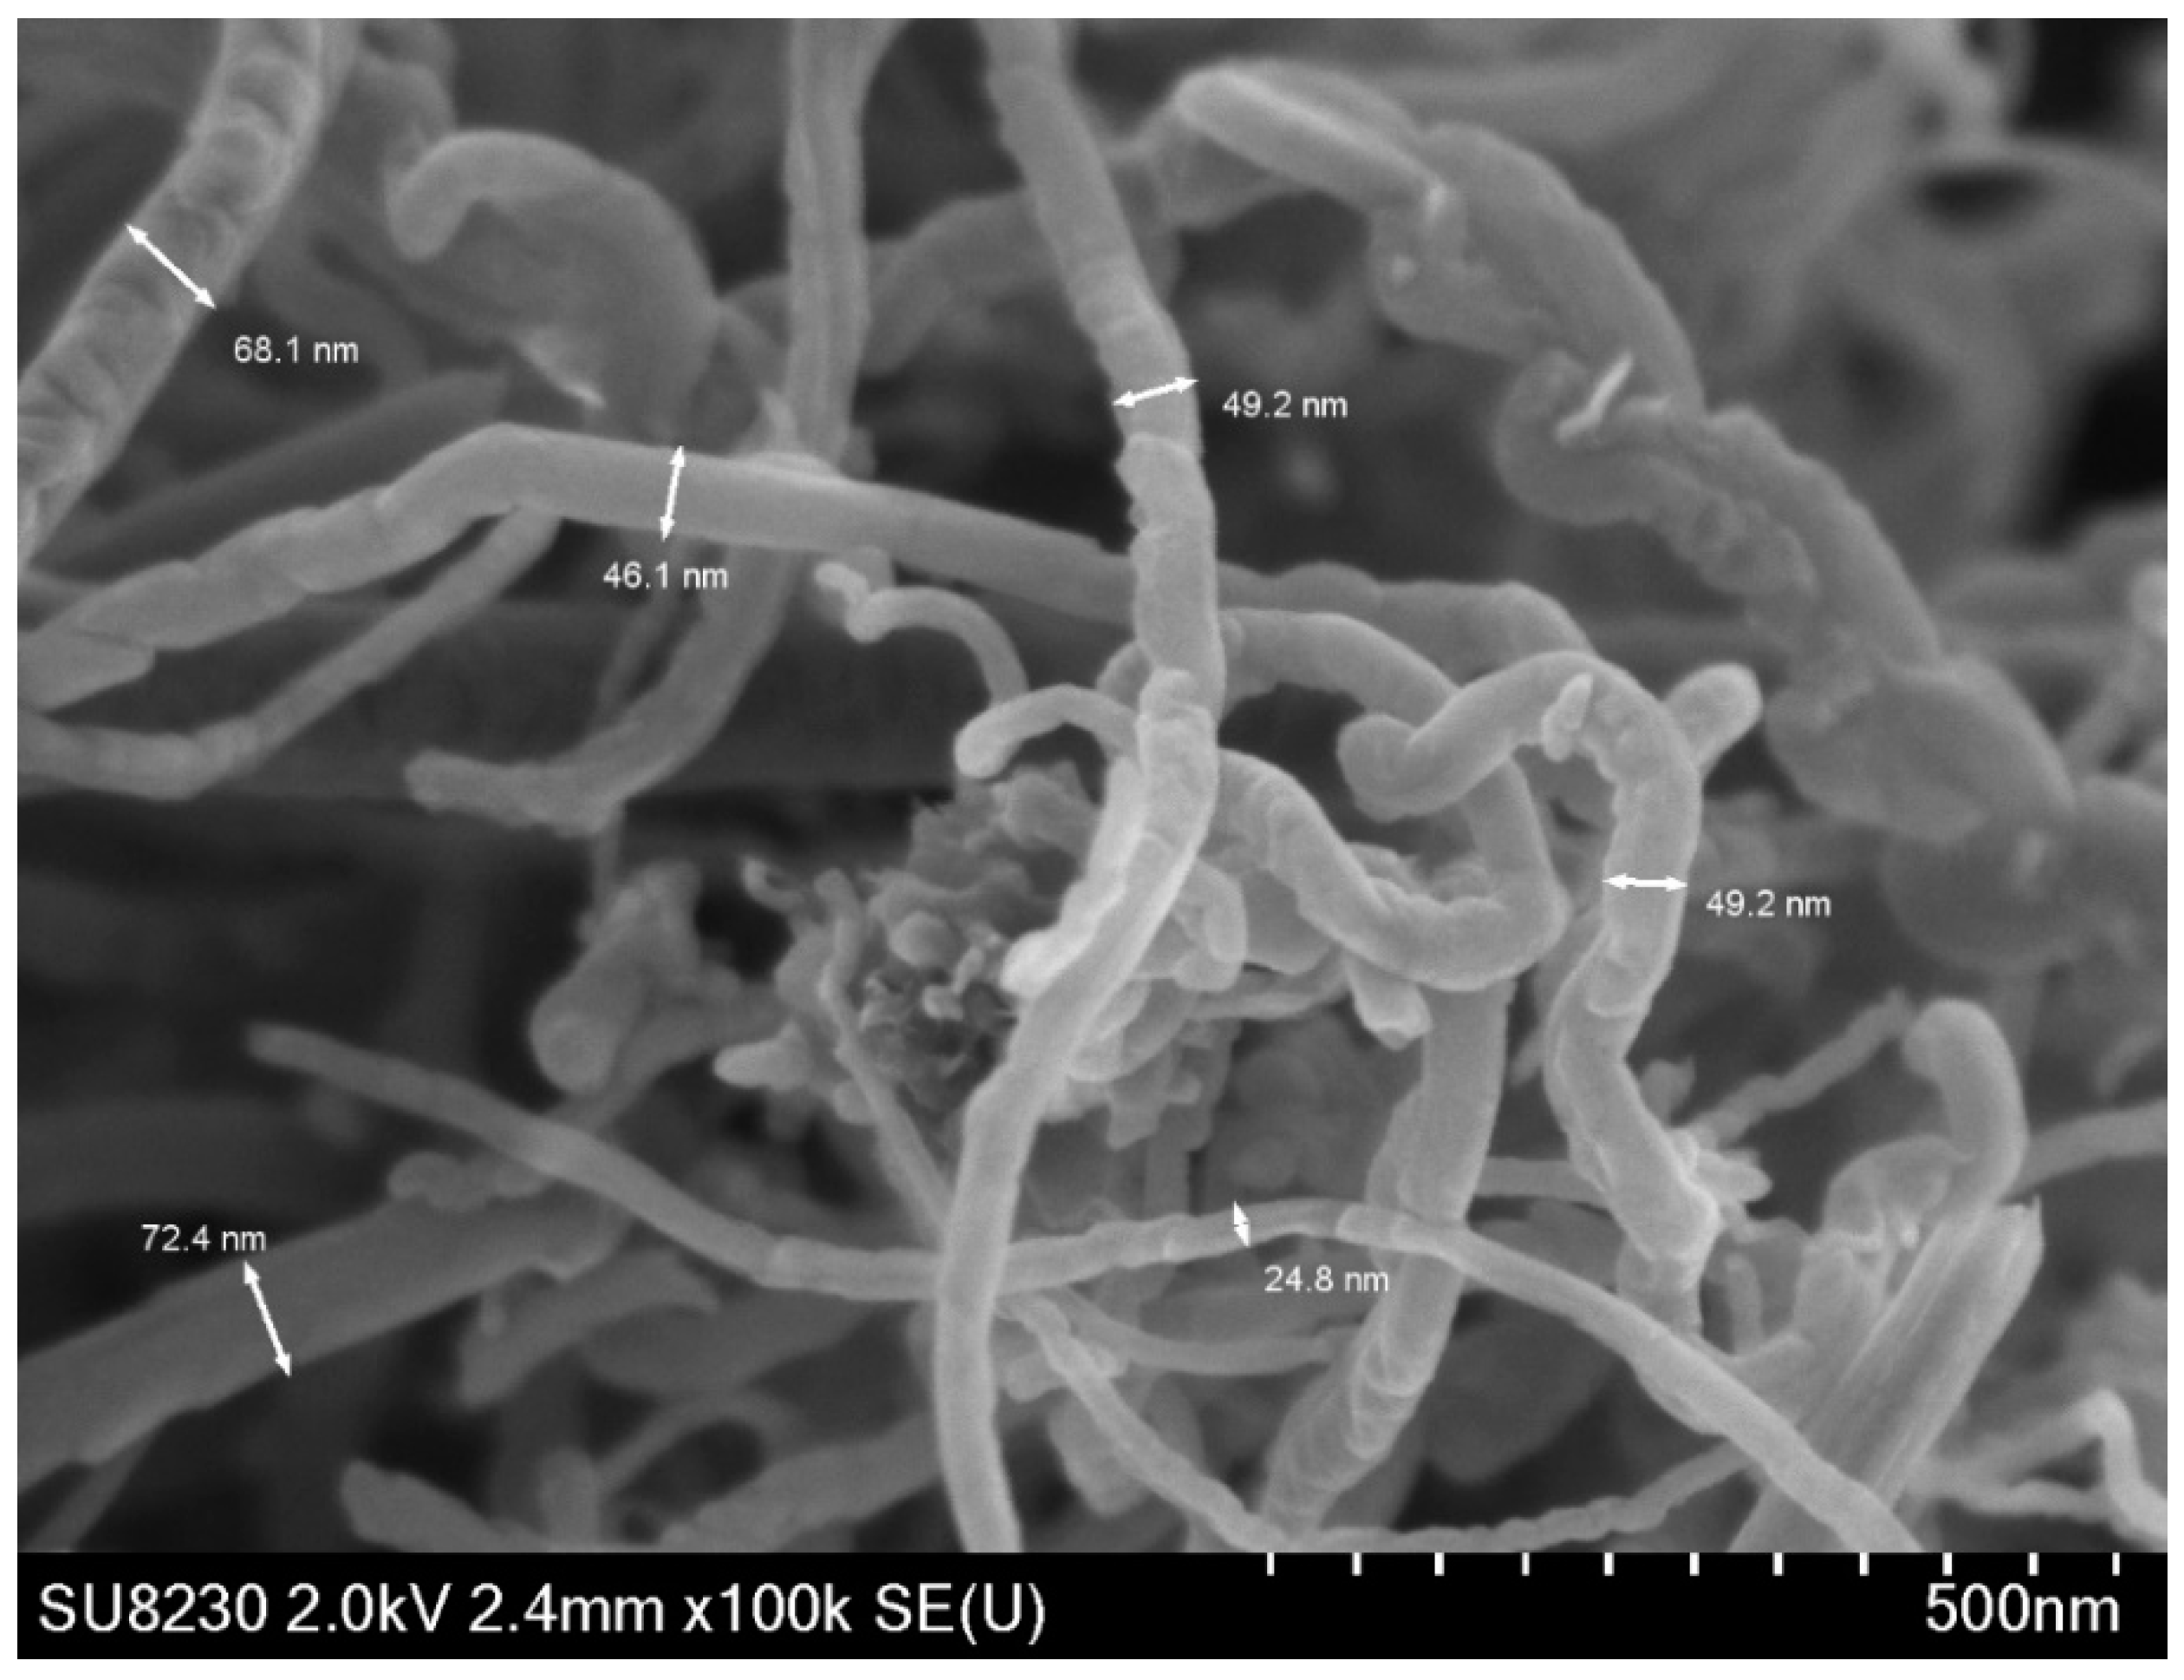
Figure 19.
SEM analysis of carbon deposited on Ni-UGSO 13% after the CC reaction at 750 °C for 2 h TOS.
Figure 19.
SEM analysis of carbon deposited on Ni-UGSO 13% after the CC reaction at 750 °C for 2 h TOS.
Figure 20.
SEM analysis (using backscattered electron imaging) of carbon deposited on Ni-UGSO 13% after DR reaction at 650 °C for 2 h TOS.
Figure 20.
SEM analysis (using backscattered electron imaging) of carbon deposited on Ni-UGSO 13% after DR reaction at 650 °C for 2 h TOS.
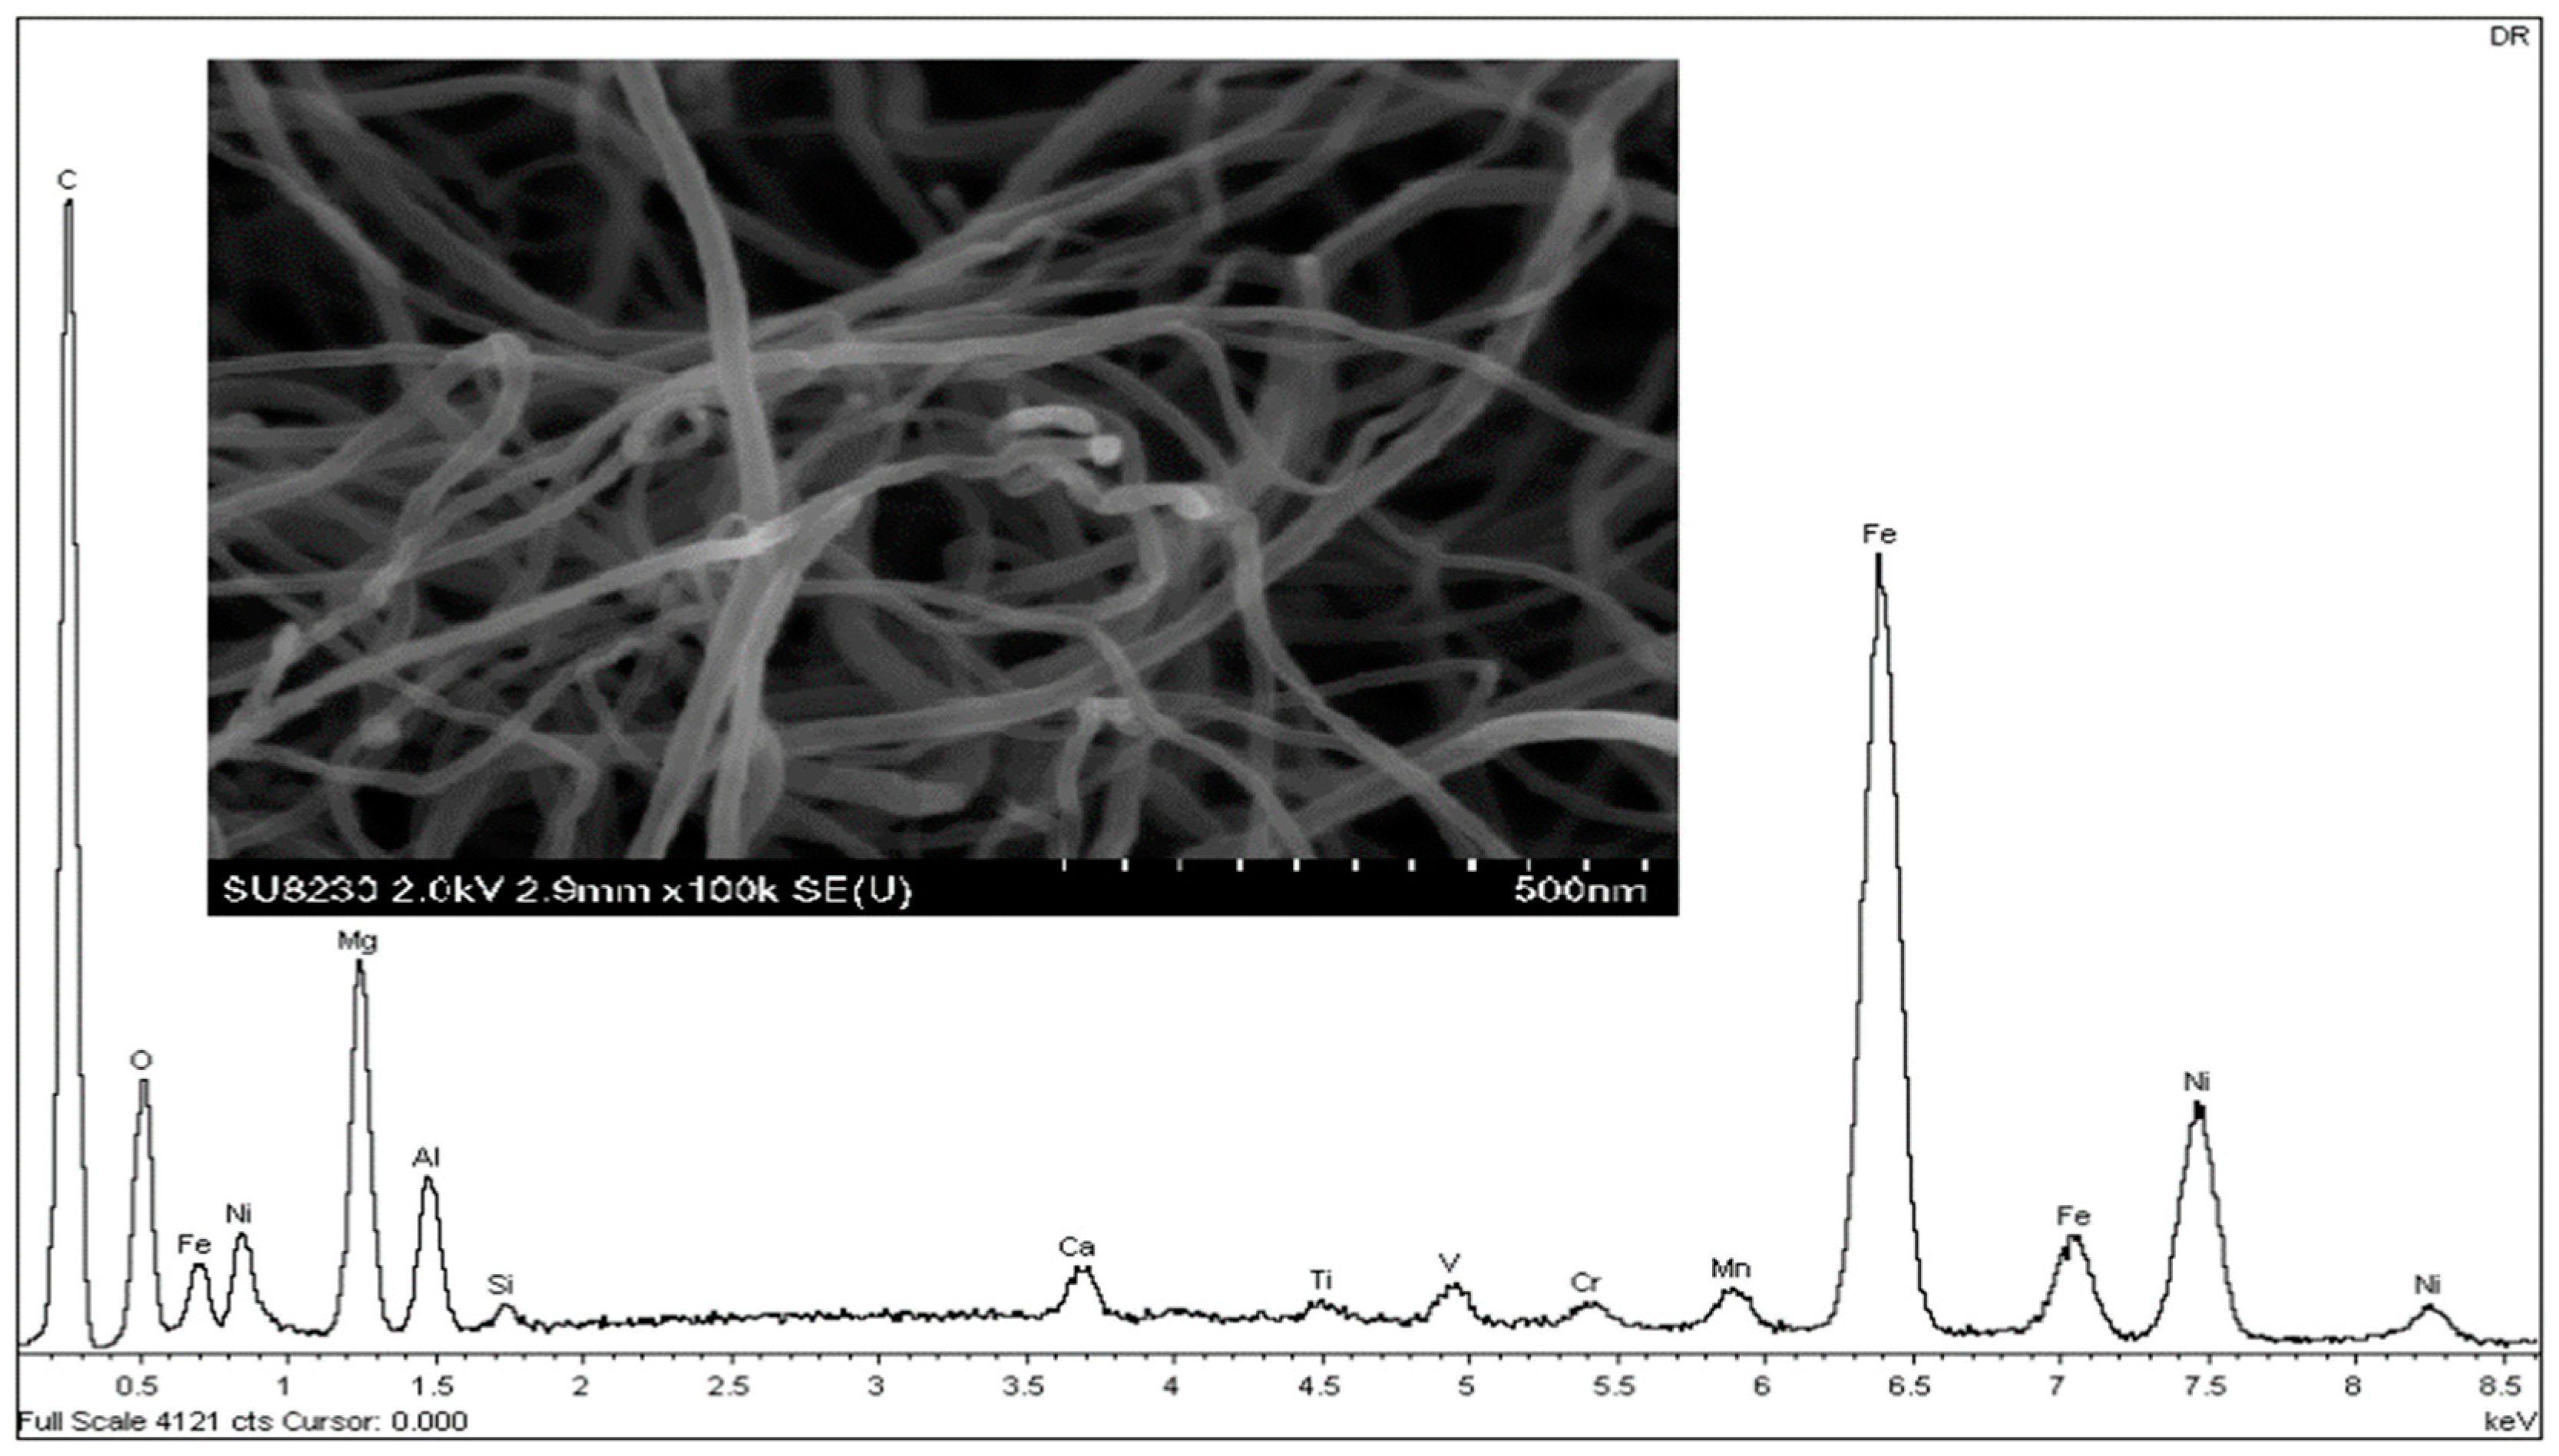
Figure 21.
EDX analysis of carbon deposited on Ni-UGSO 13% after the DR reaction at 650 °C for 2 h TOS.
Figure 21.
EDX analysis of carbon deposited on Ni-UGSO 13% after the DR reaction at 650 °C for 2 h TOS.
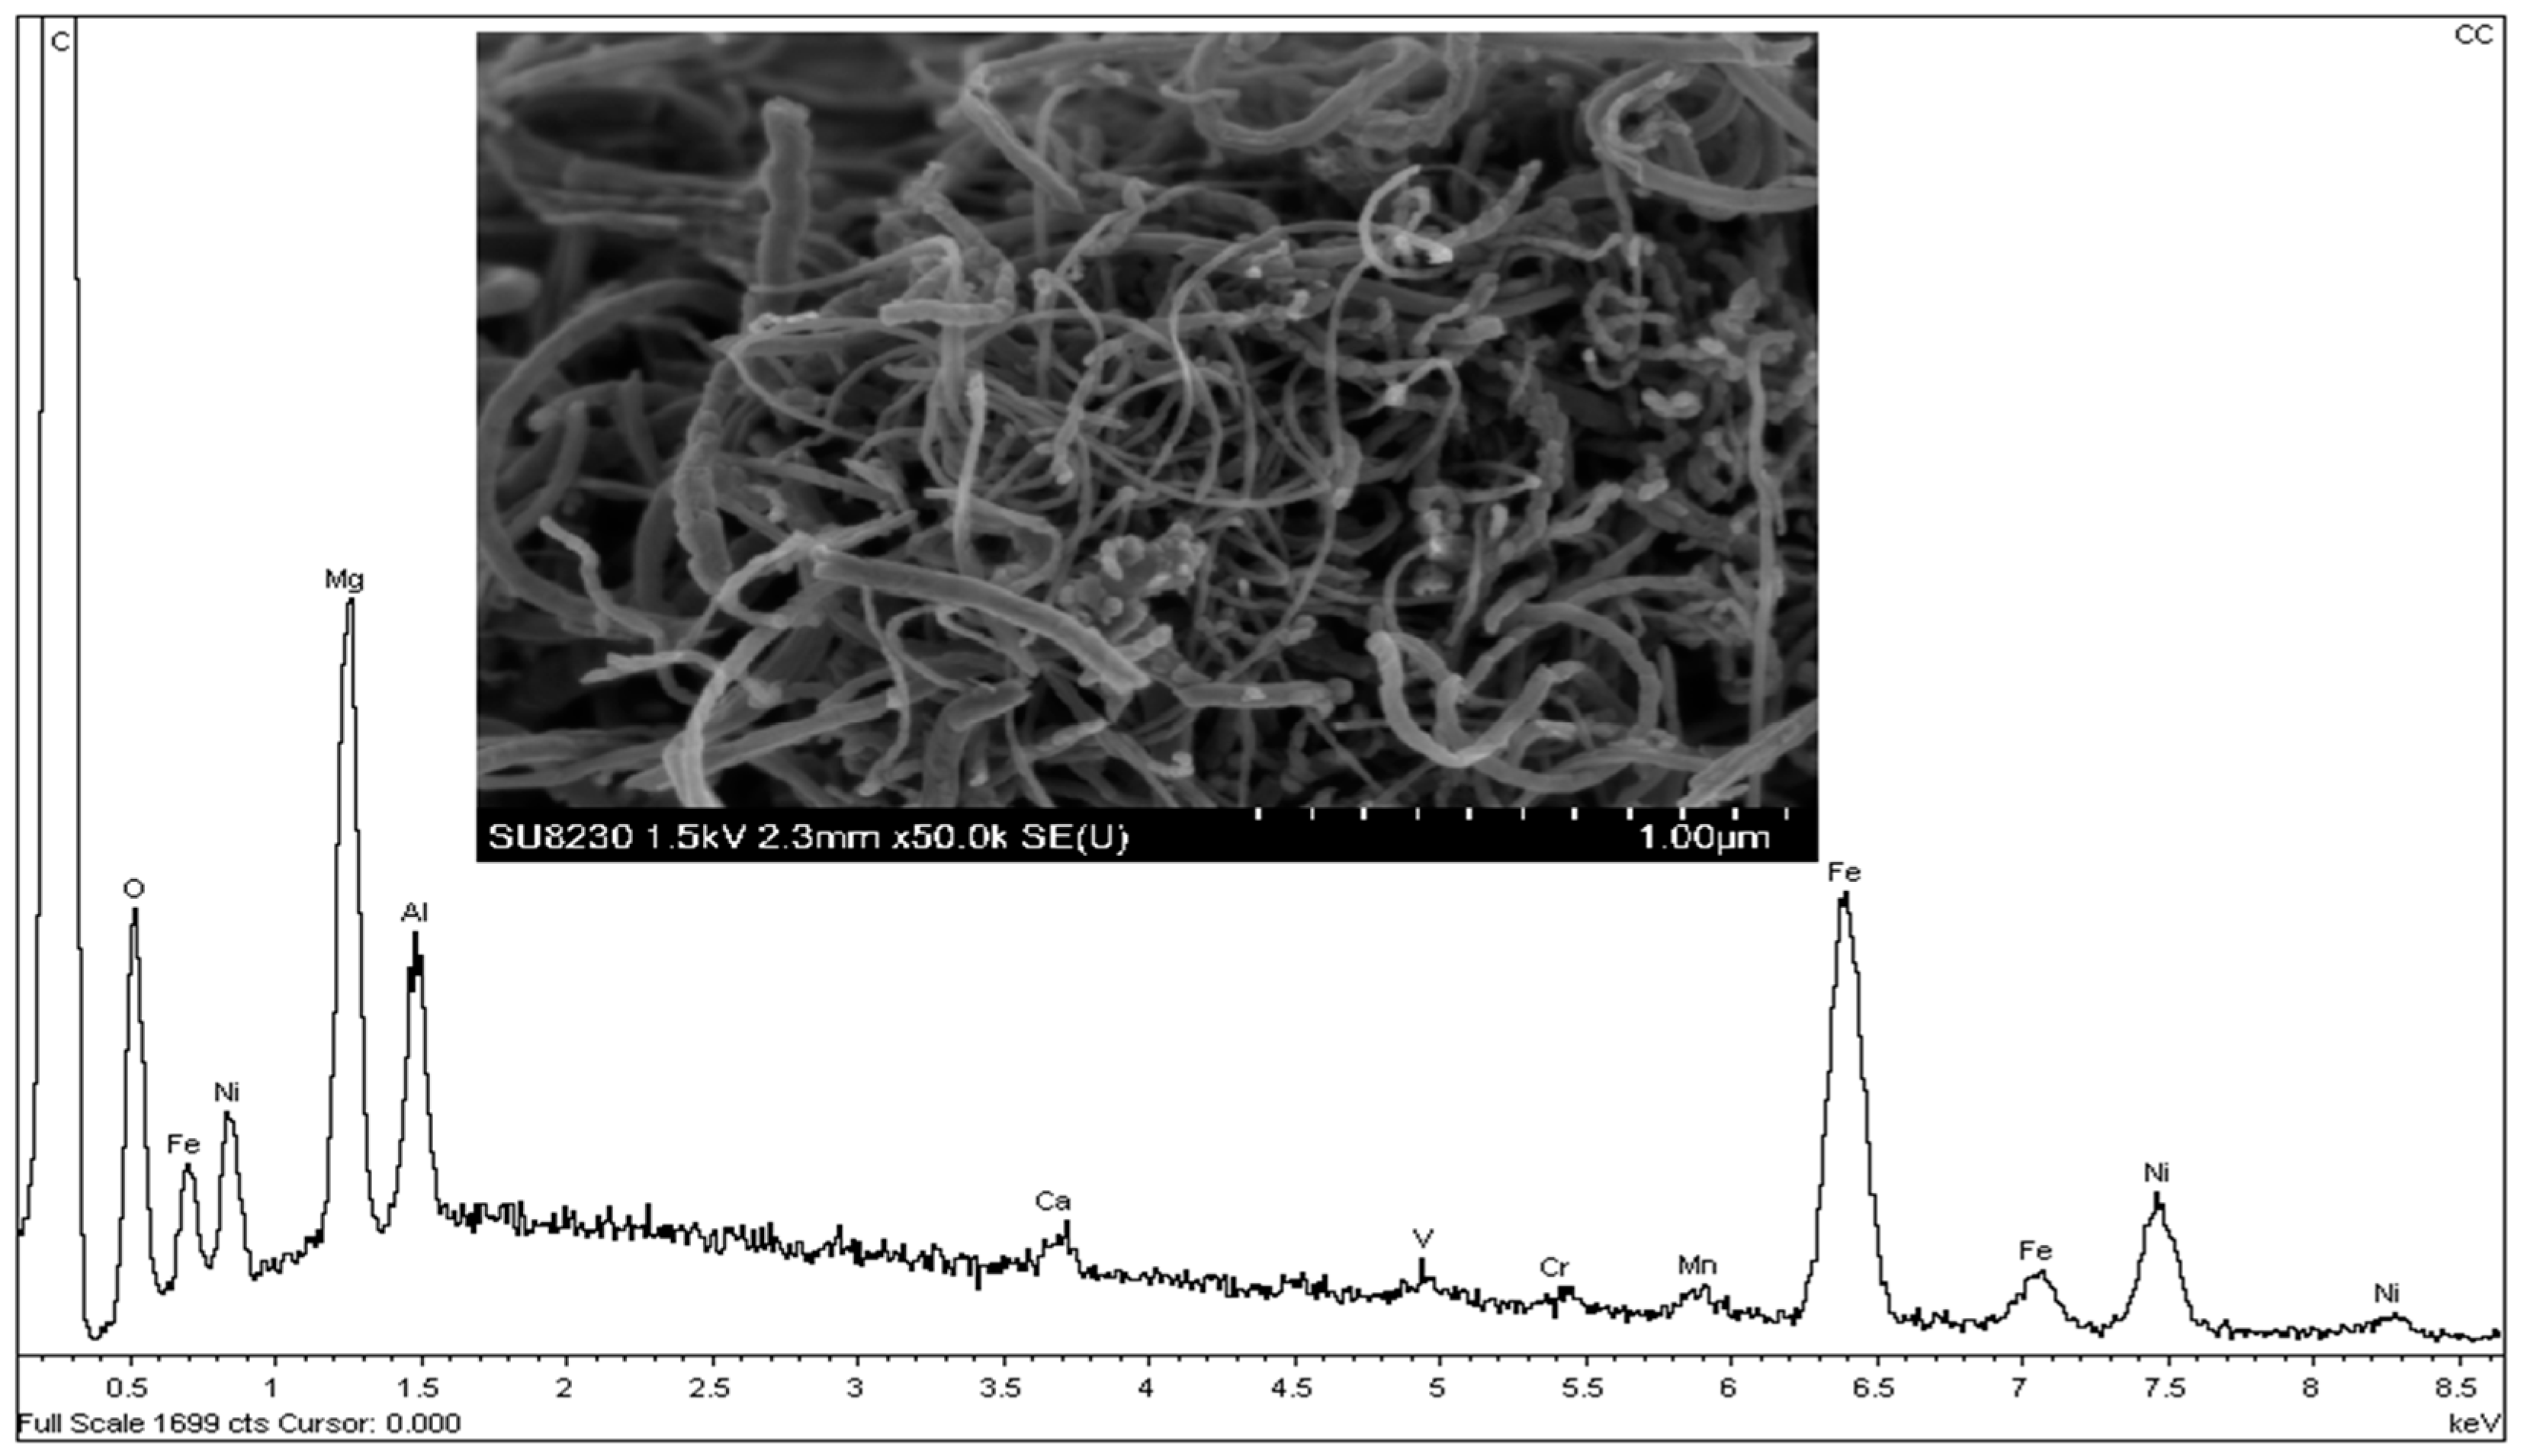
Figure 22.
EDX analysis of carbon deposited on Ni-UGSO 13% after the CC reaction at 750 °C for 2 h TOS.
Figure 22.
EDX analysis of carbon deposited on Ni-UGSO 13% after the CC reaction at 750 °C for 2 h TOS.
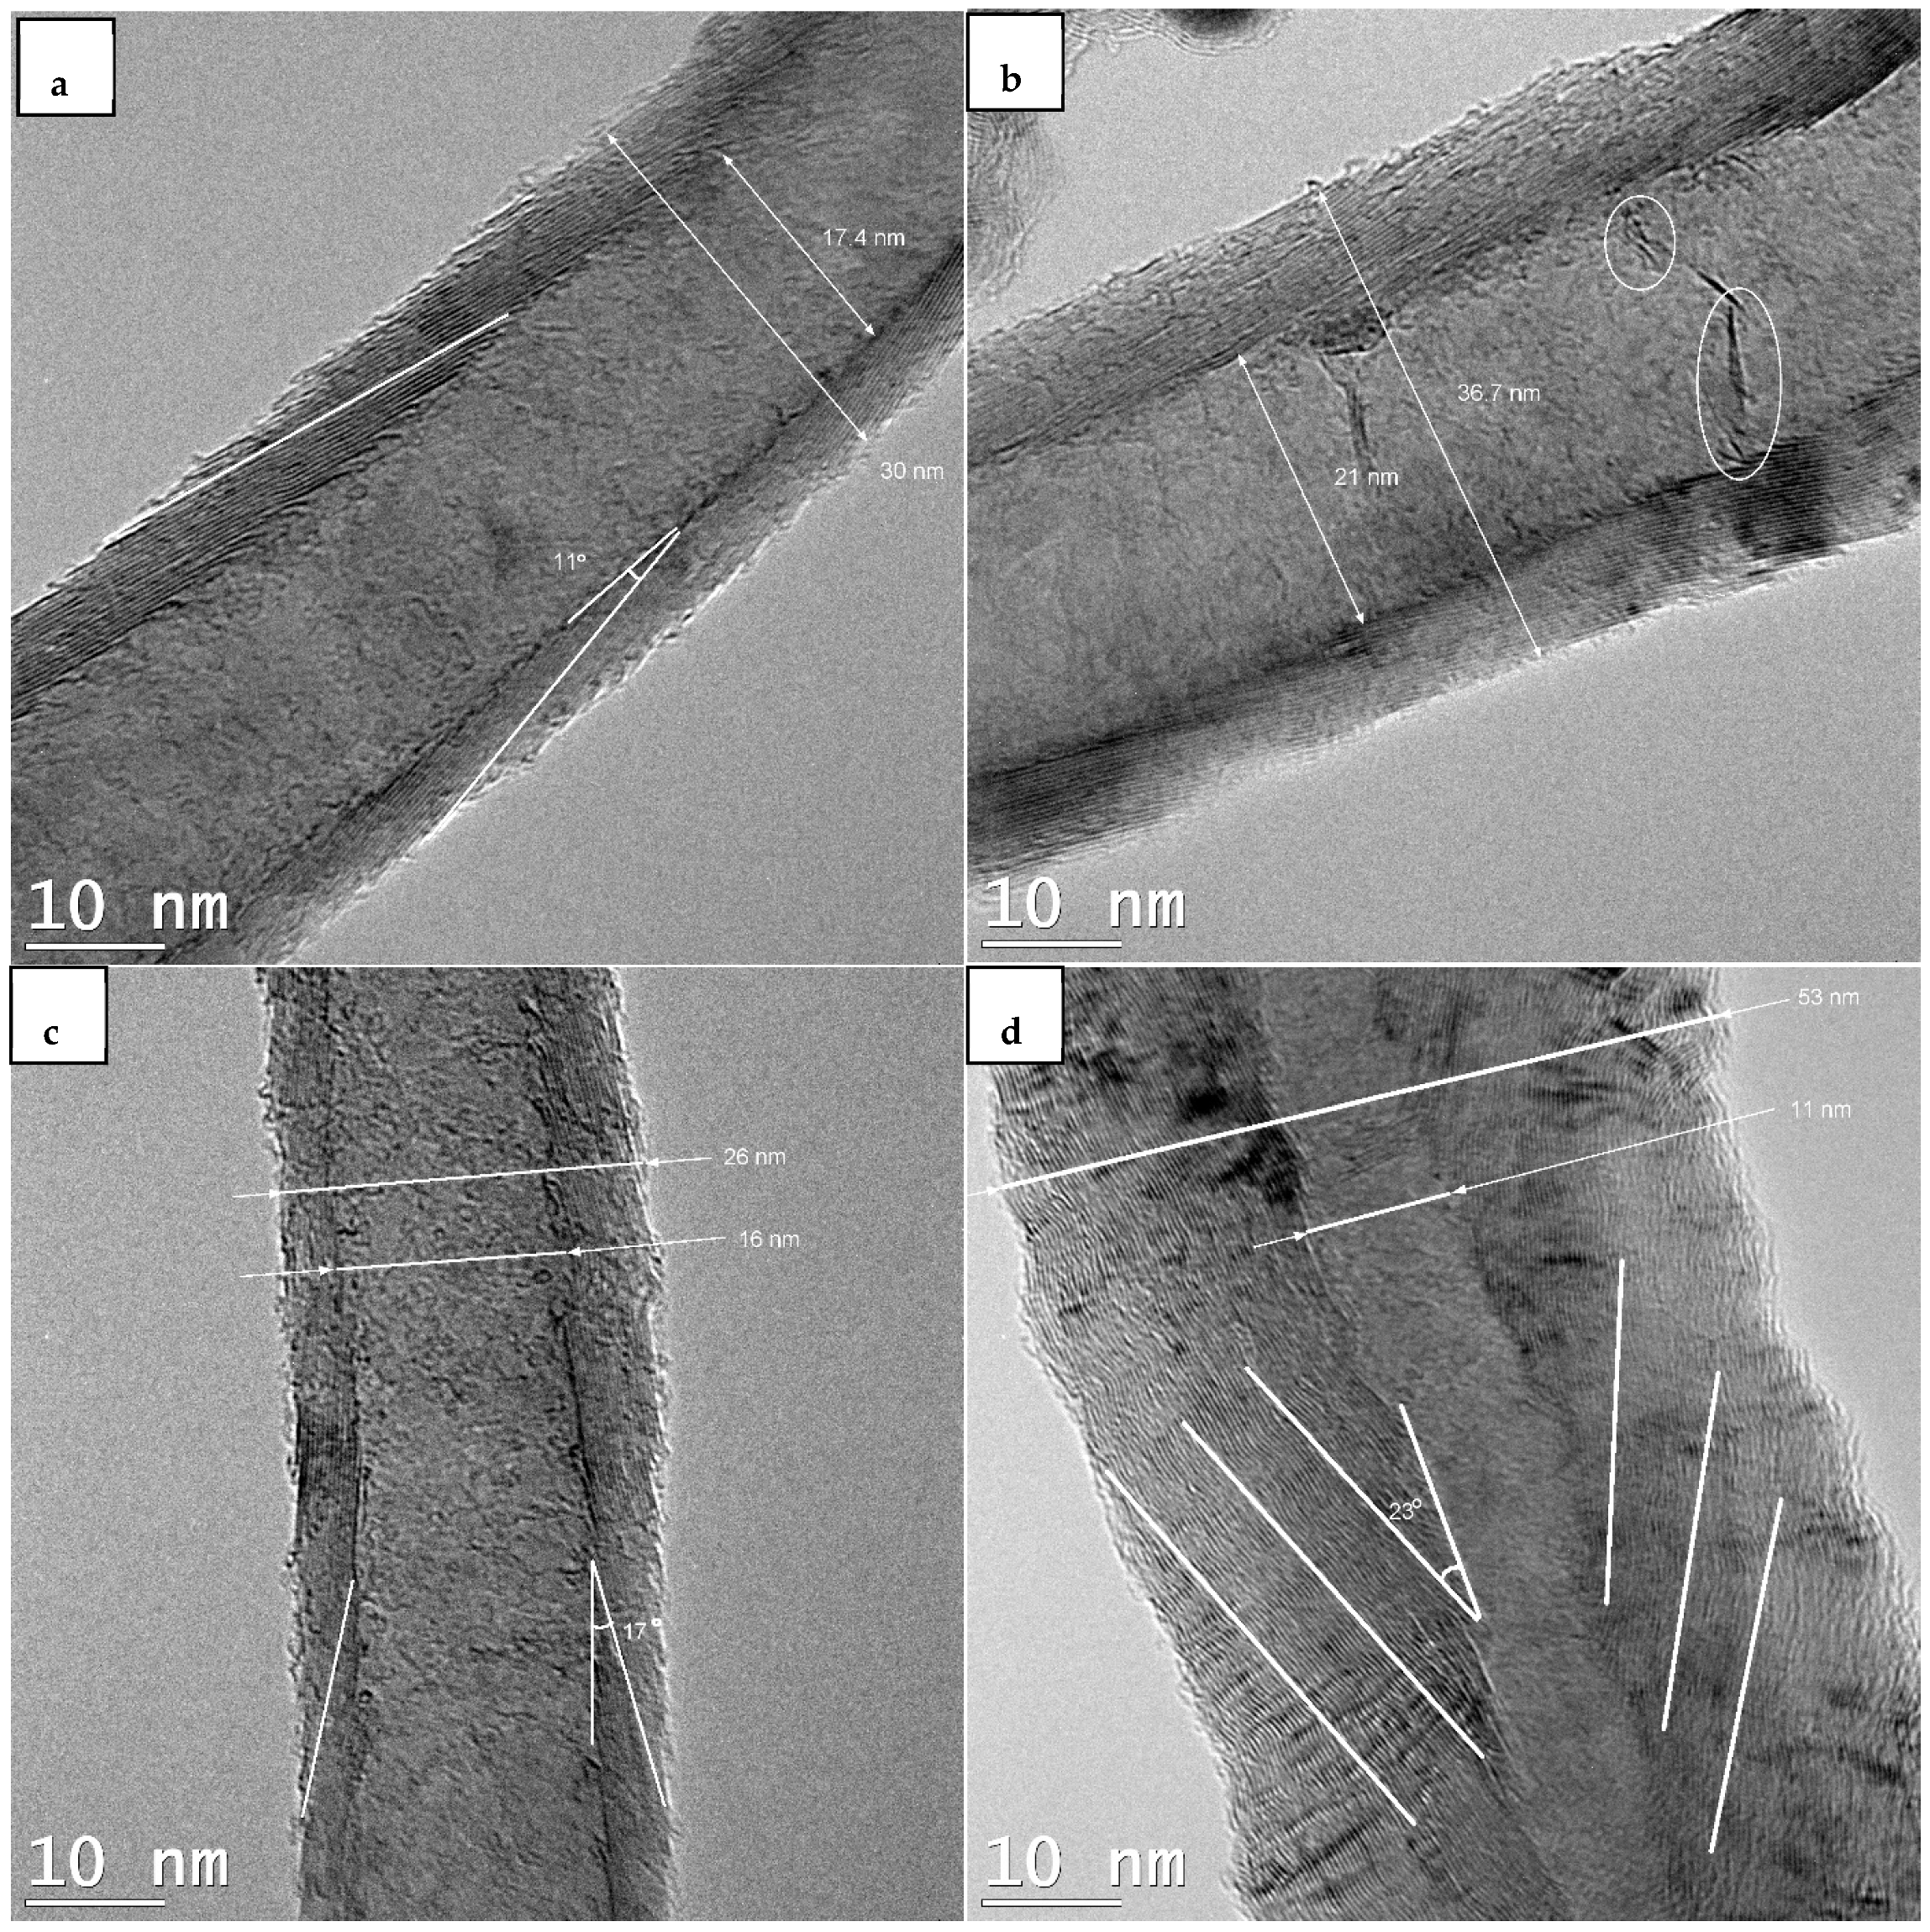
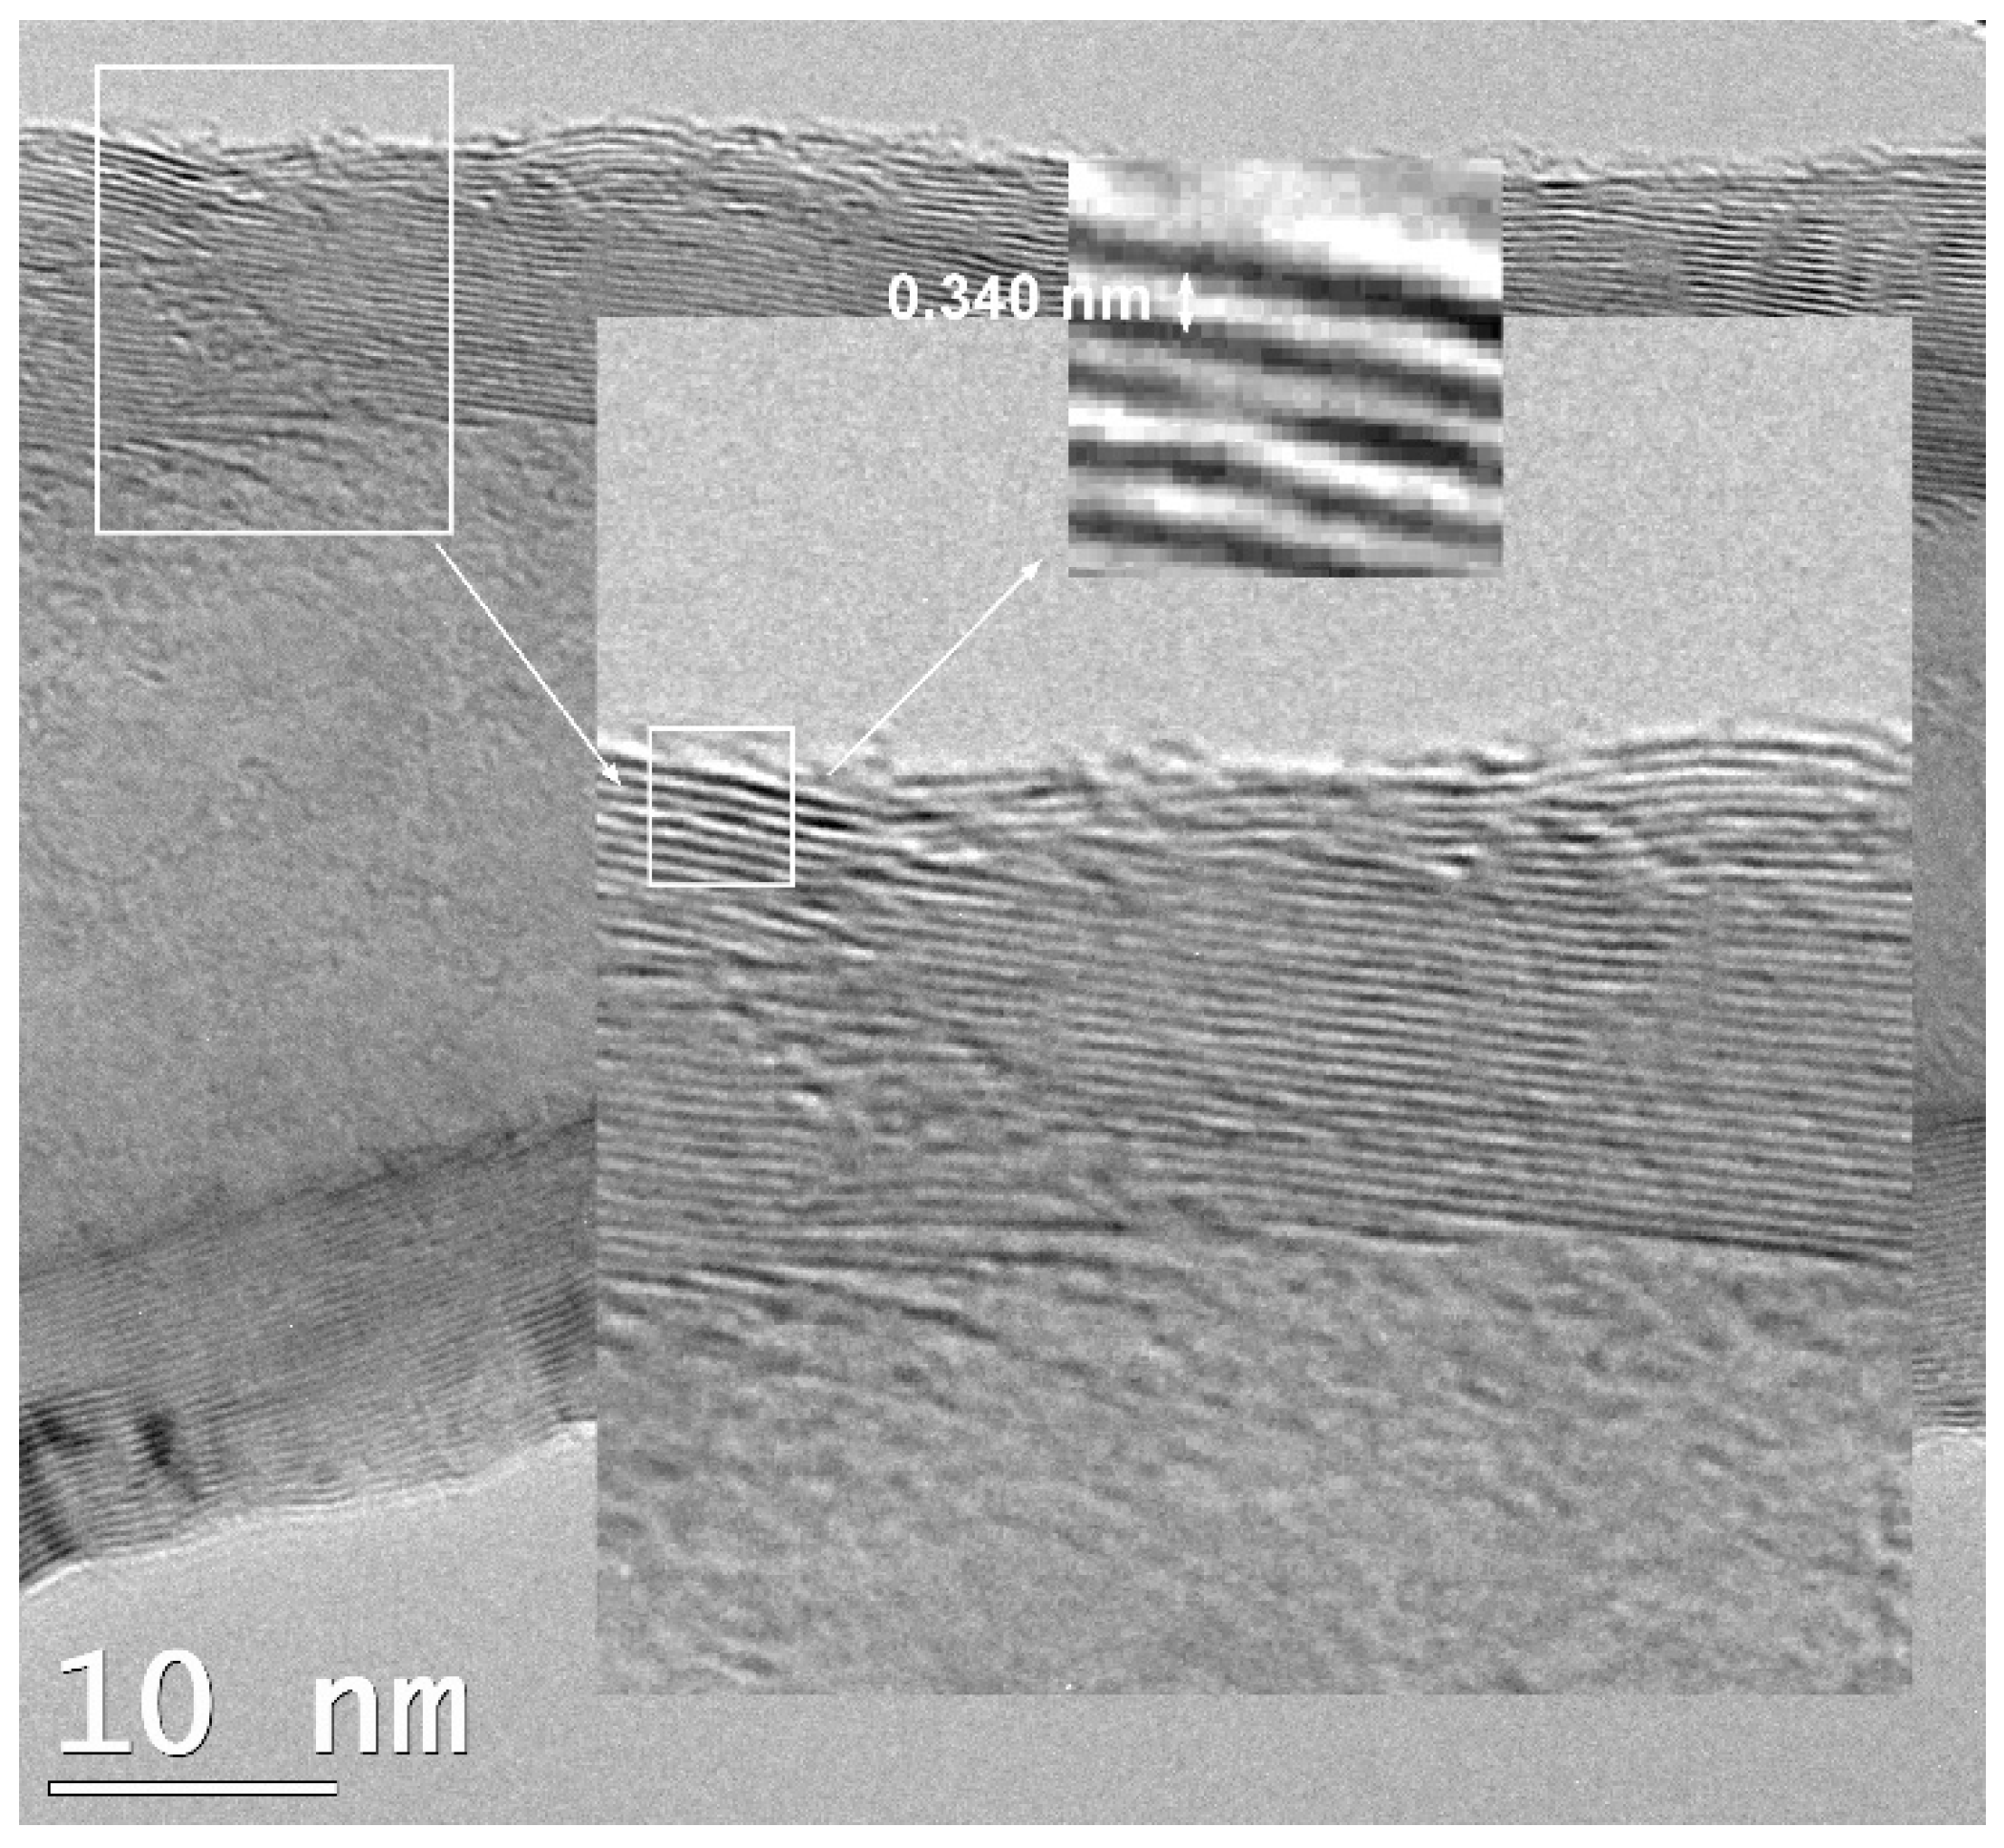
Figure 23.
TEM analysis of carbon deposited on Ni-UGSO 13% after the DR reaction at 650 °C for 2 h TOS, (a) CNF with d = 30 nm, (b) CNF with d = 36.7 nm, (c) CNF with d = 26 nm, (d) CNF with d = 53 nm.
Figure 23.
TEM analysis of carbon deposited on Ni-UGSO 13% after the DR reaction at 650 °C for 2 h TOS, (a) CNF with d = 30 nm, (b) CNF with d = 36.7 nm, (c) CNF with d = 26 nm, (d) CNF with d = 53 nm.
Figure 24.
Interplanar distance of graphene sheets.
Figure 24.
Interplanar distance of graphene sheets.
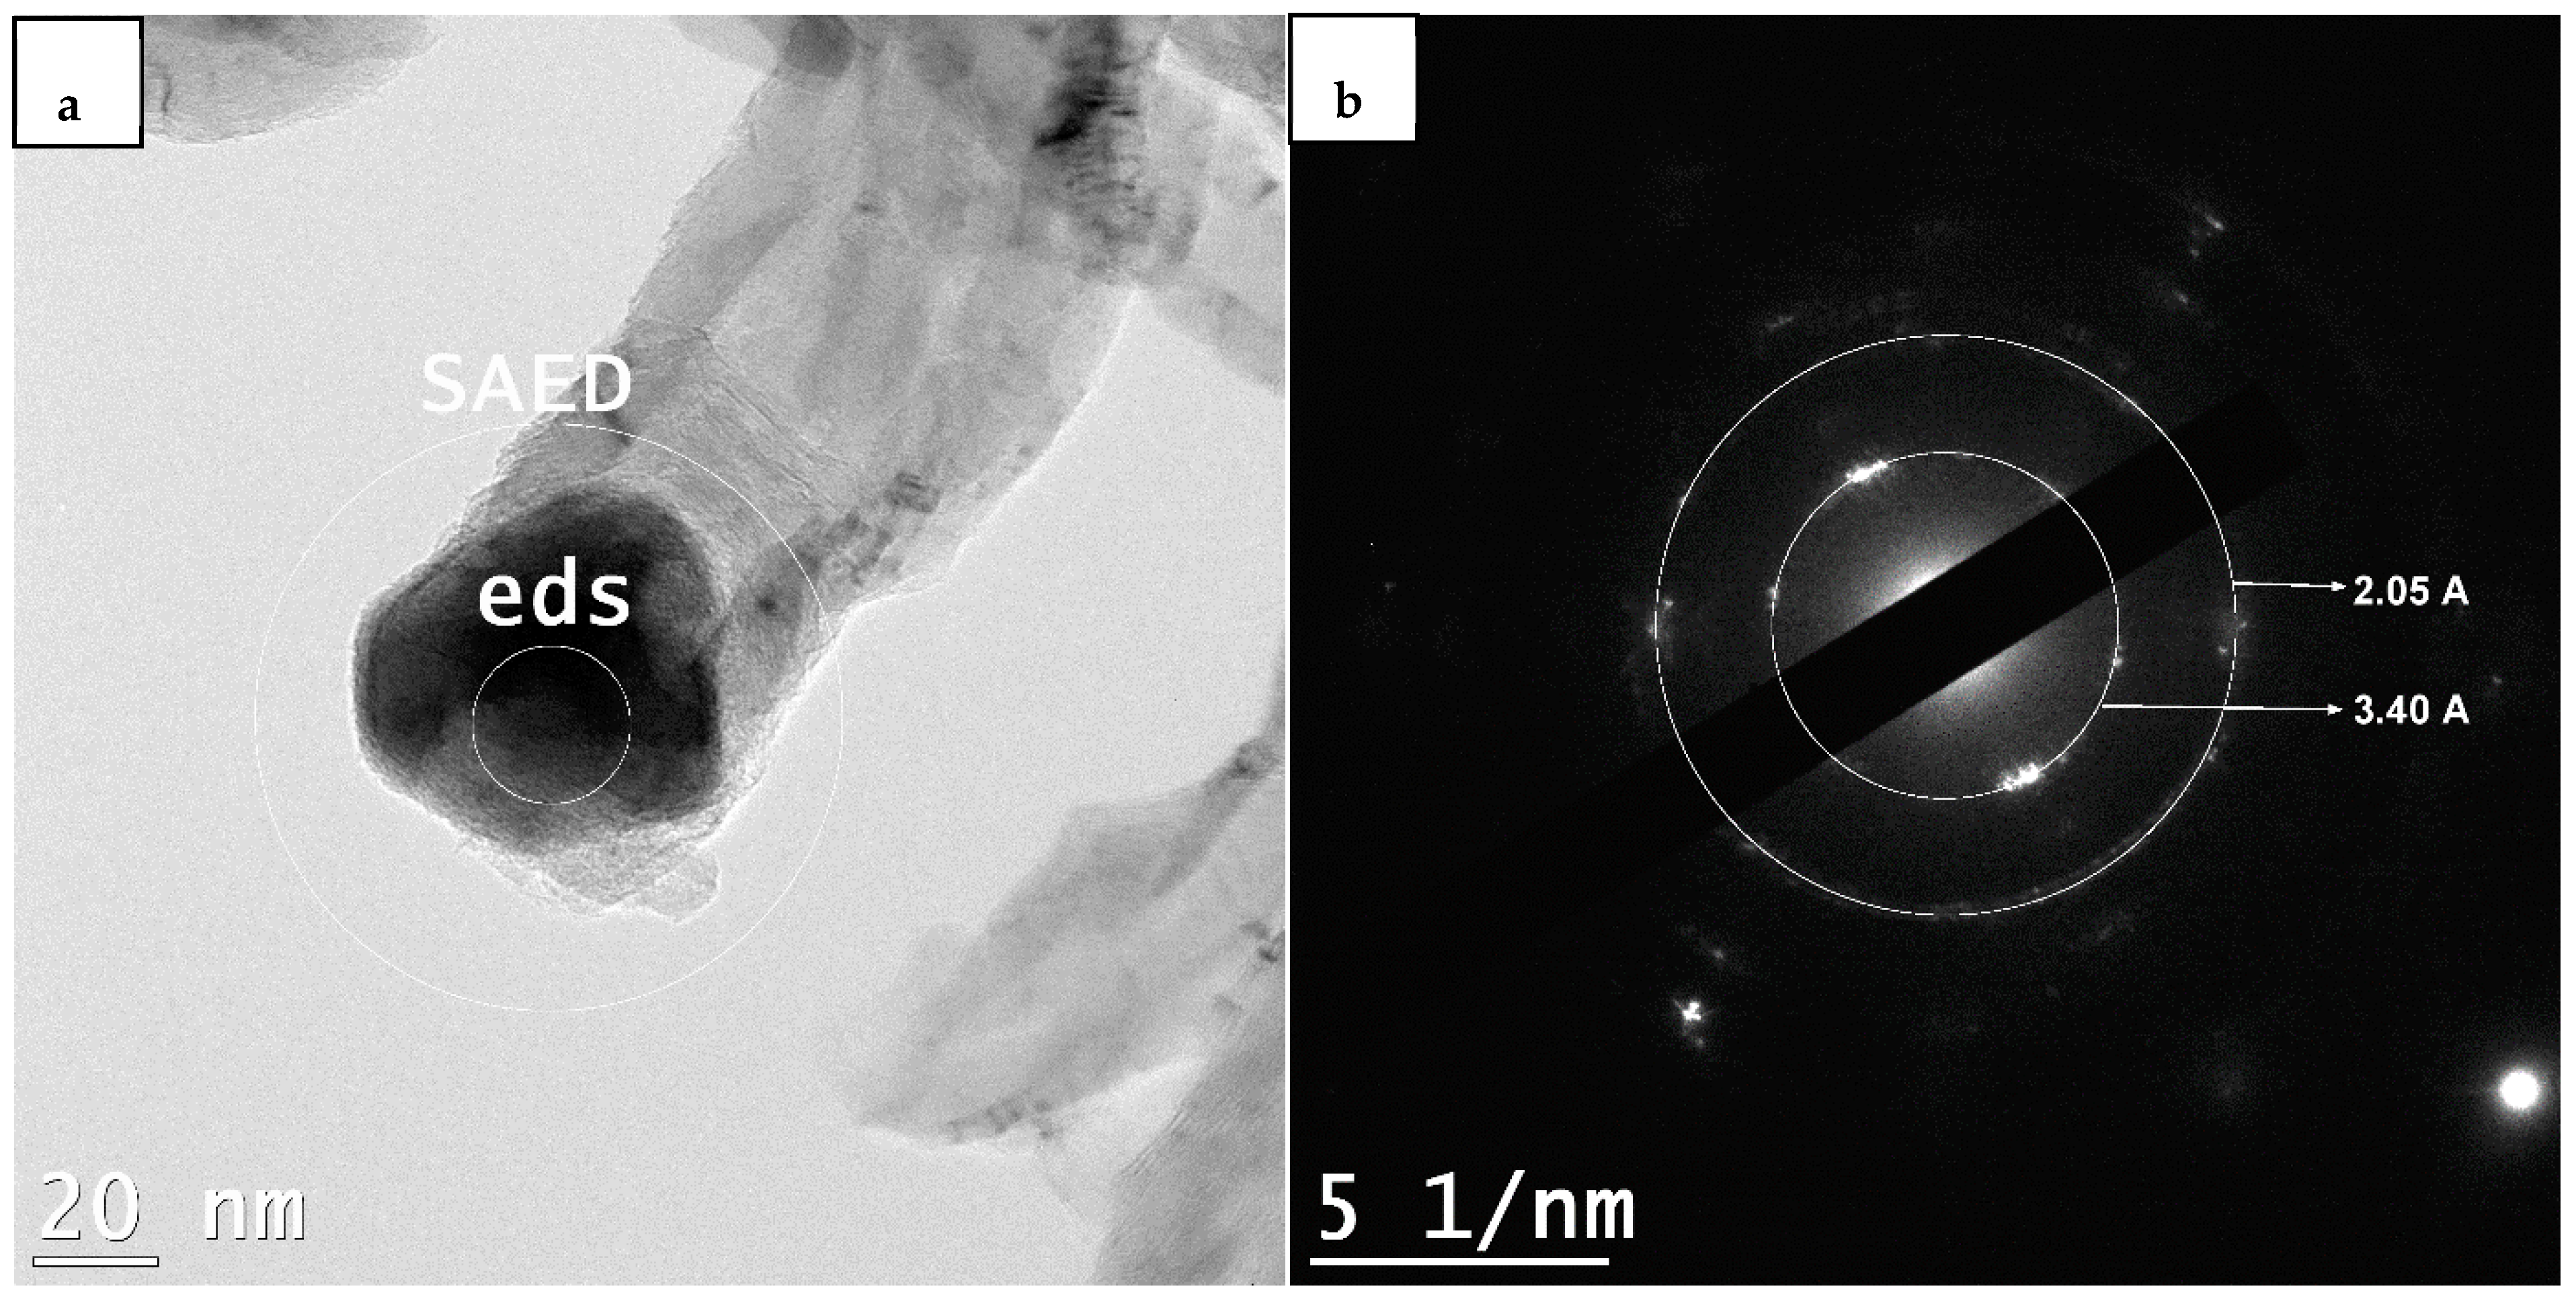
Figure 25.
(a) Metallic particle at the tip of CNF. (b) SAED of this particle.
Figure 25.
(a) Metallic particle at the tip of CNF. (b) SAED of this particle.
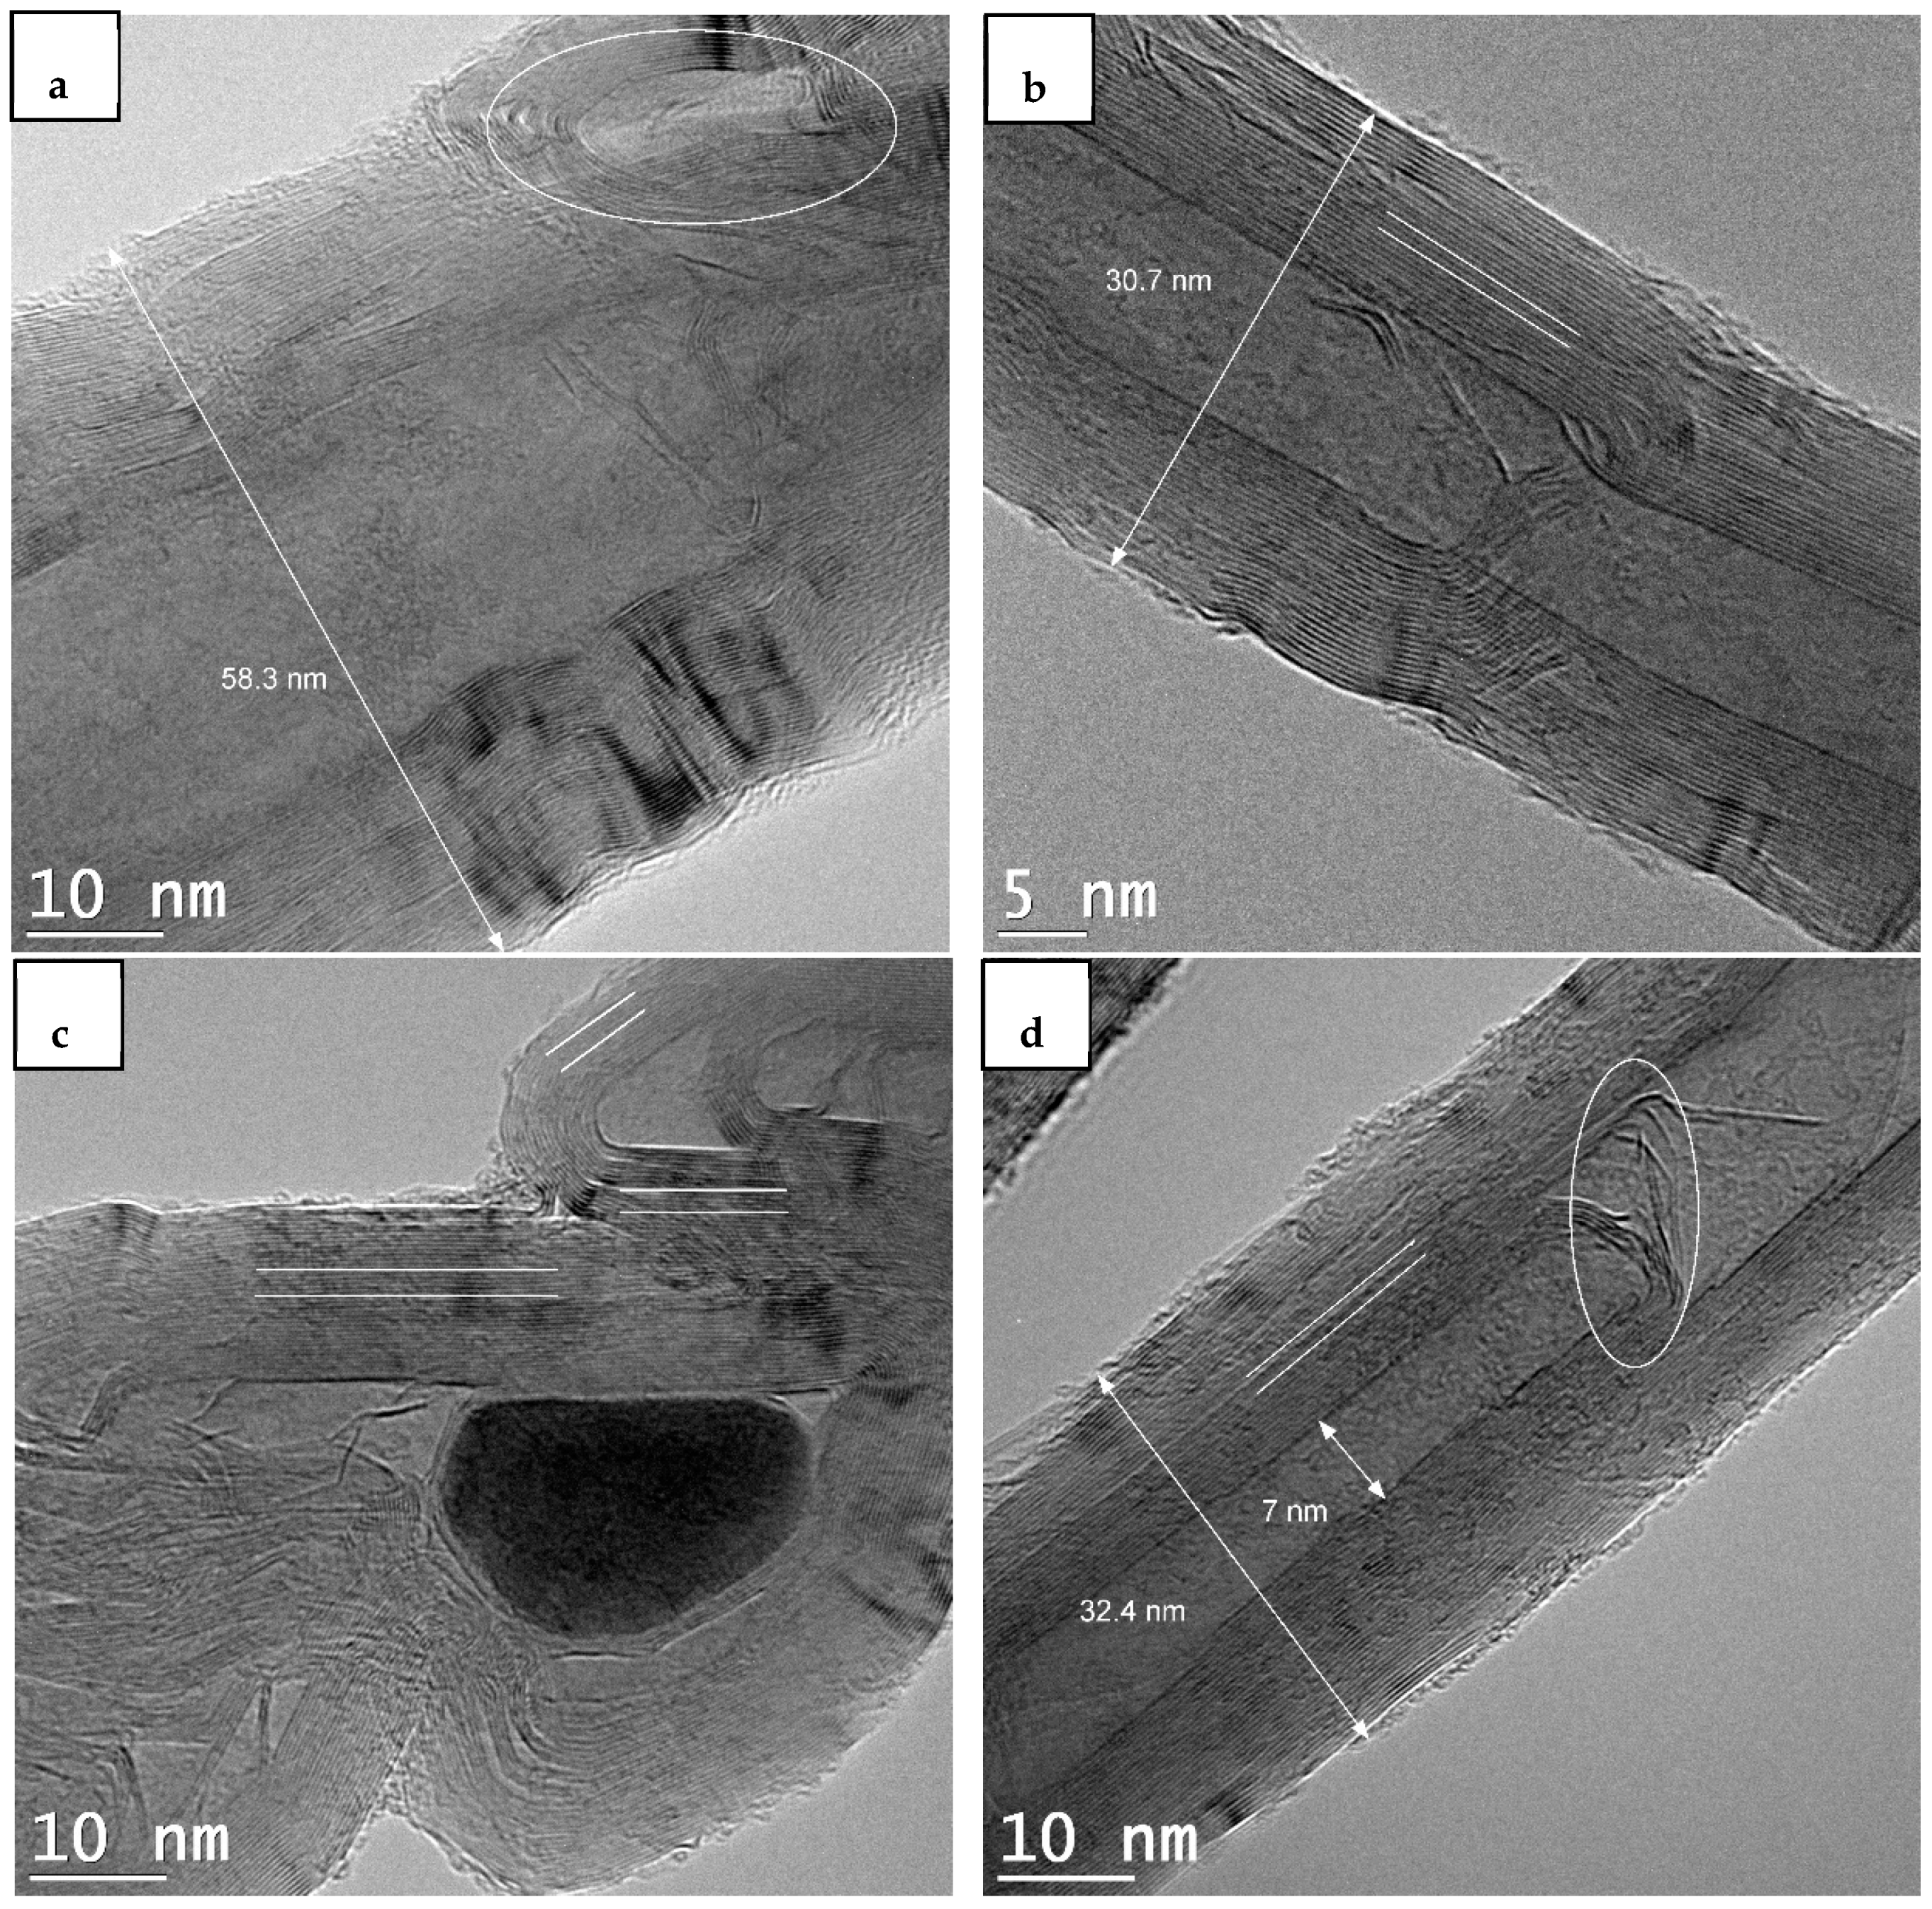
Figure 26.
TEM analysis of carbon deposited on Ni-UGSO 13% after CC reaction at 750 °C for 2 h TOS, (a) CNF formed with irregular stacked graphene planes, (b) and (d) tubular CNF with hollow core, (c) bamboo CNF.
Figure 26.
TEM analysis of carbon deposited on Ni-UGSO 13% after CC reaction at 750 °C for 2 h TOS, (a) CNF formed with irregular stacked graphene planes, (b) and (d) tubular CNF with hollow core, (c) bamboo CNF.
Figure 27.
TEM analysis showing a catalyst particle inserted in two different nanofilaments.
Figure 27.
TEM analysis showing a catalyst particle inserted in two different nanofilaments.
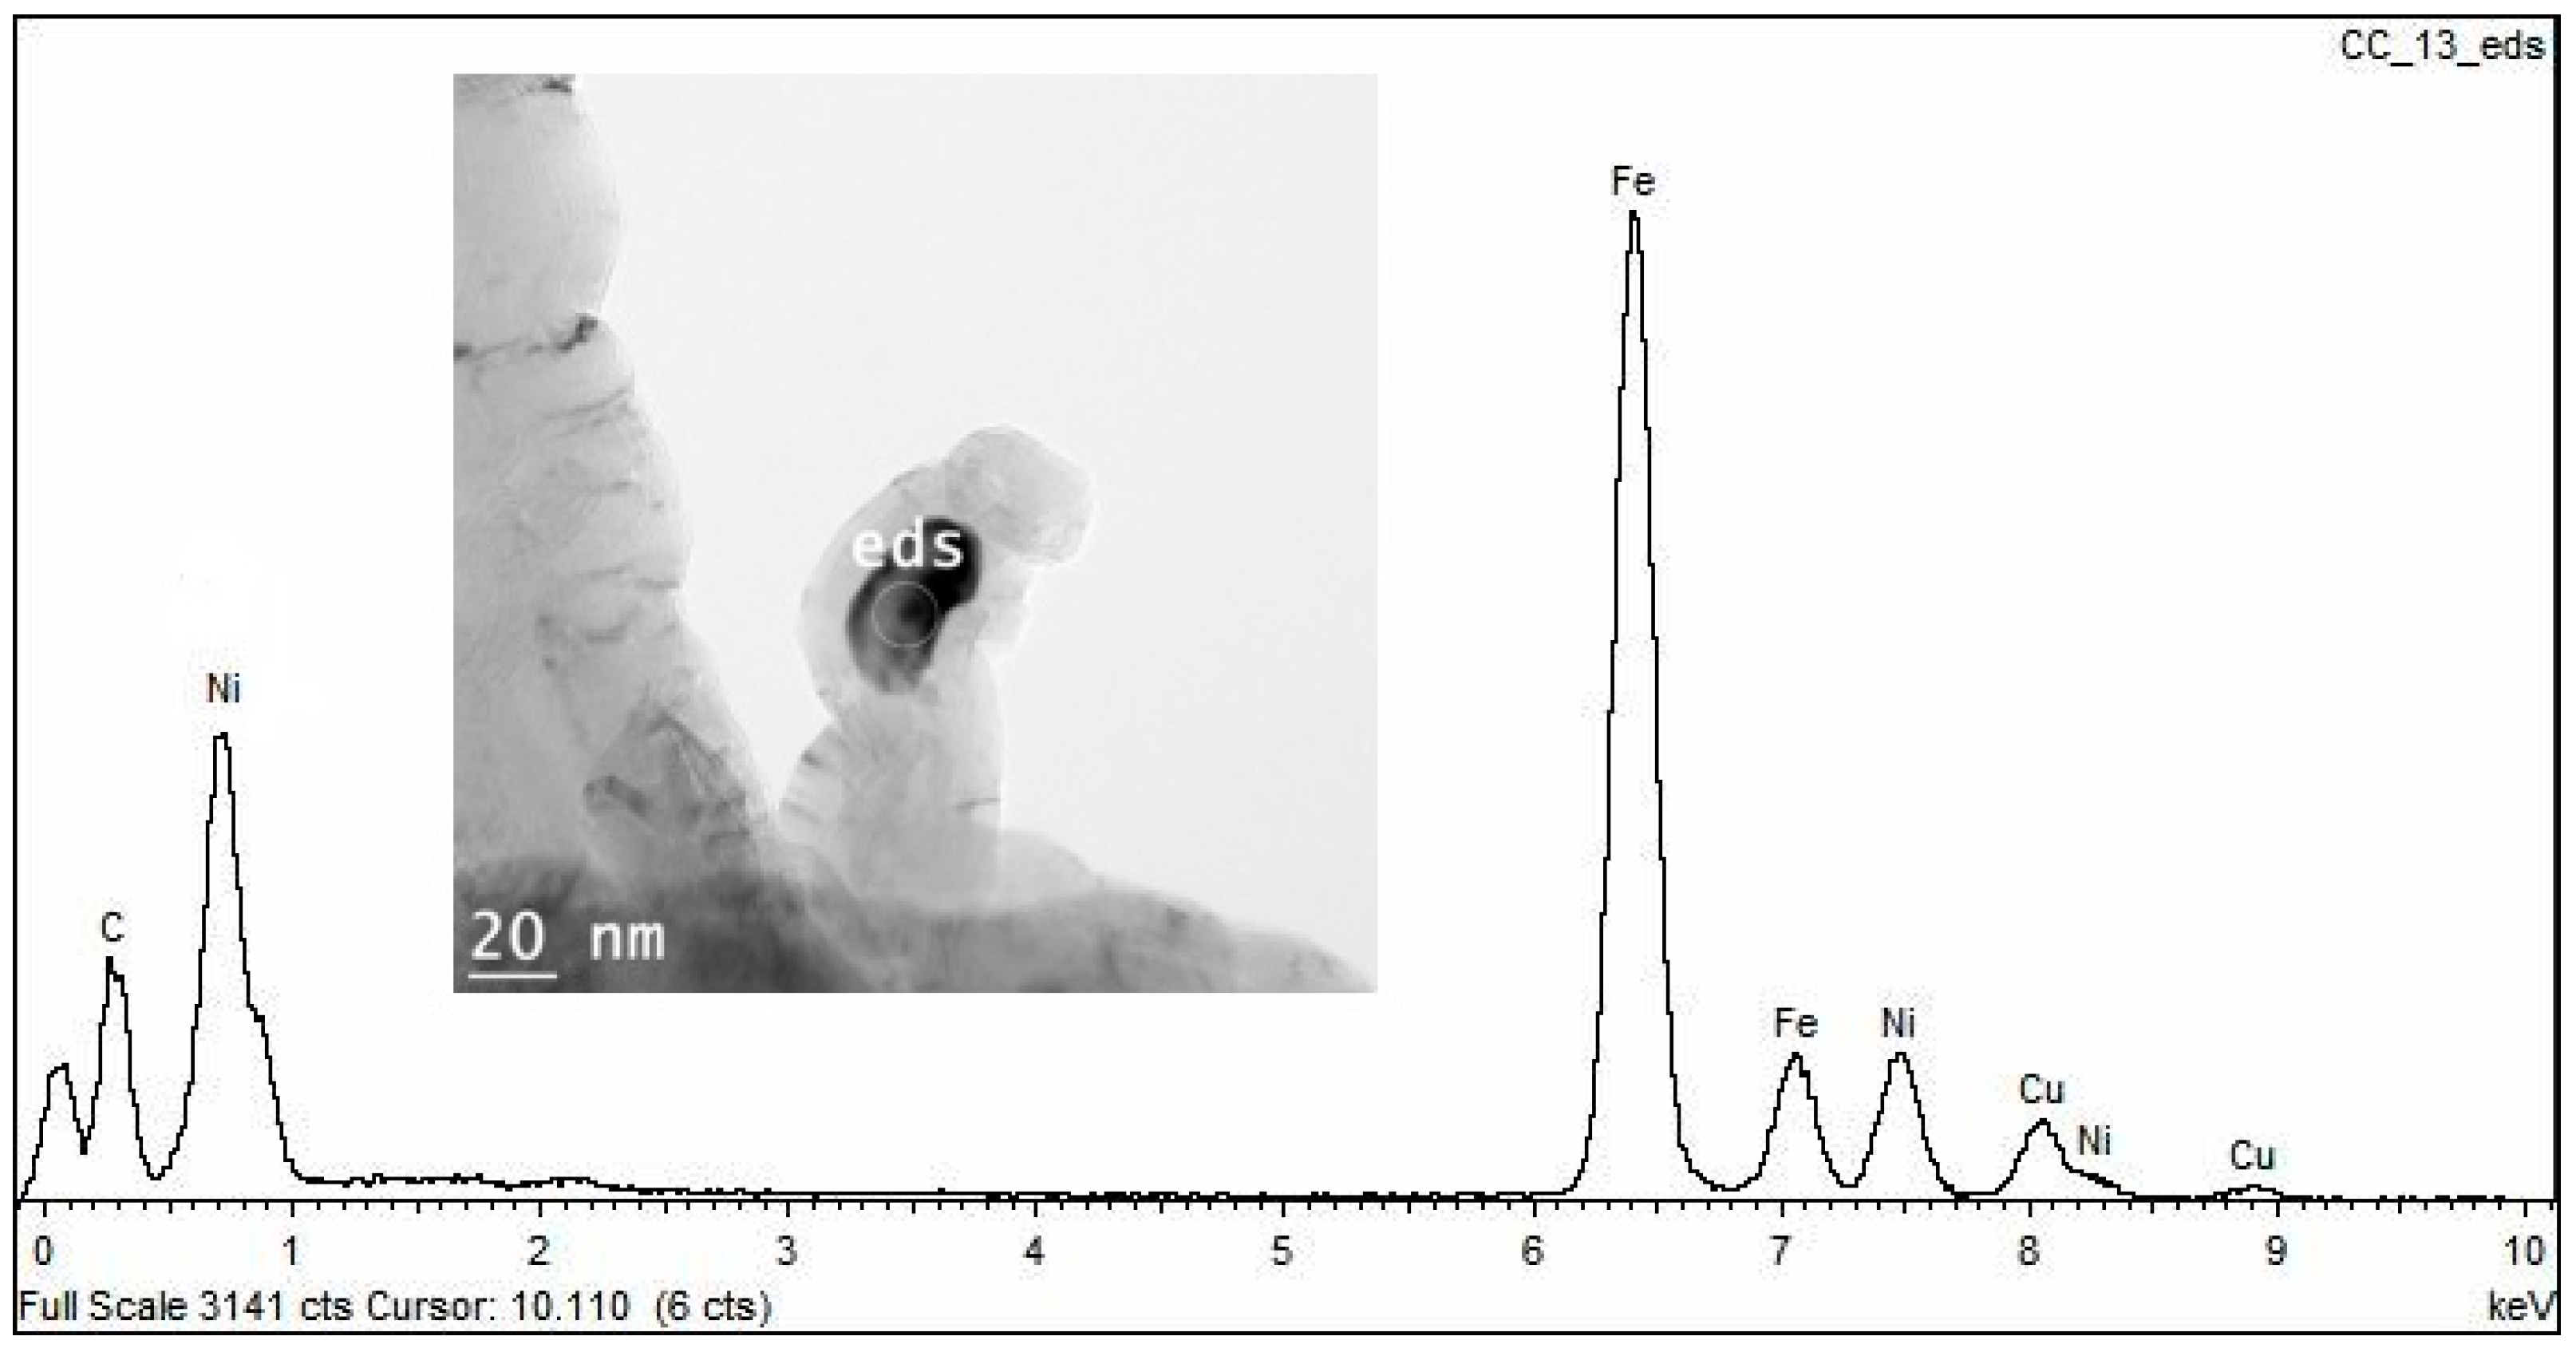
Figure 28.
EDX analysis of carbon deposited on Ni-UGSO 13% after CC reaction at 750 °C for 2 h TOS.
Figure 28.
EDX analysis of carbon deposited on Ni-UGSO 13% after CC reaction at 750 °C for 2 h TOS.
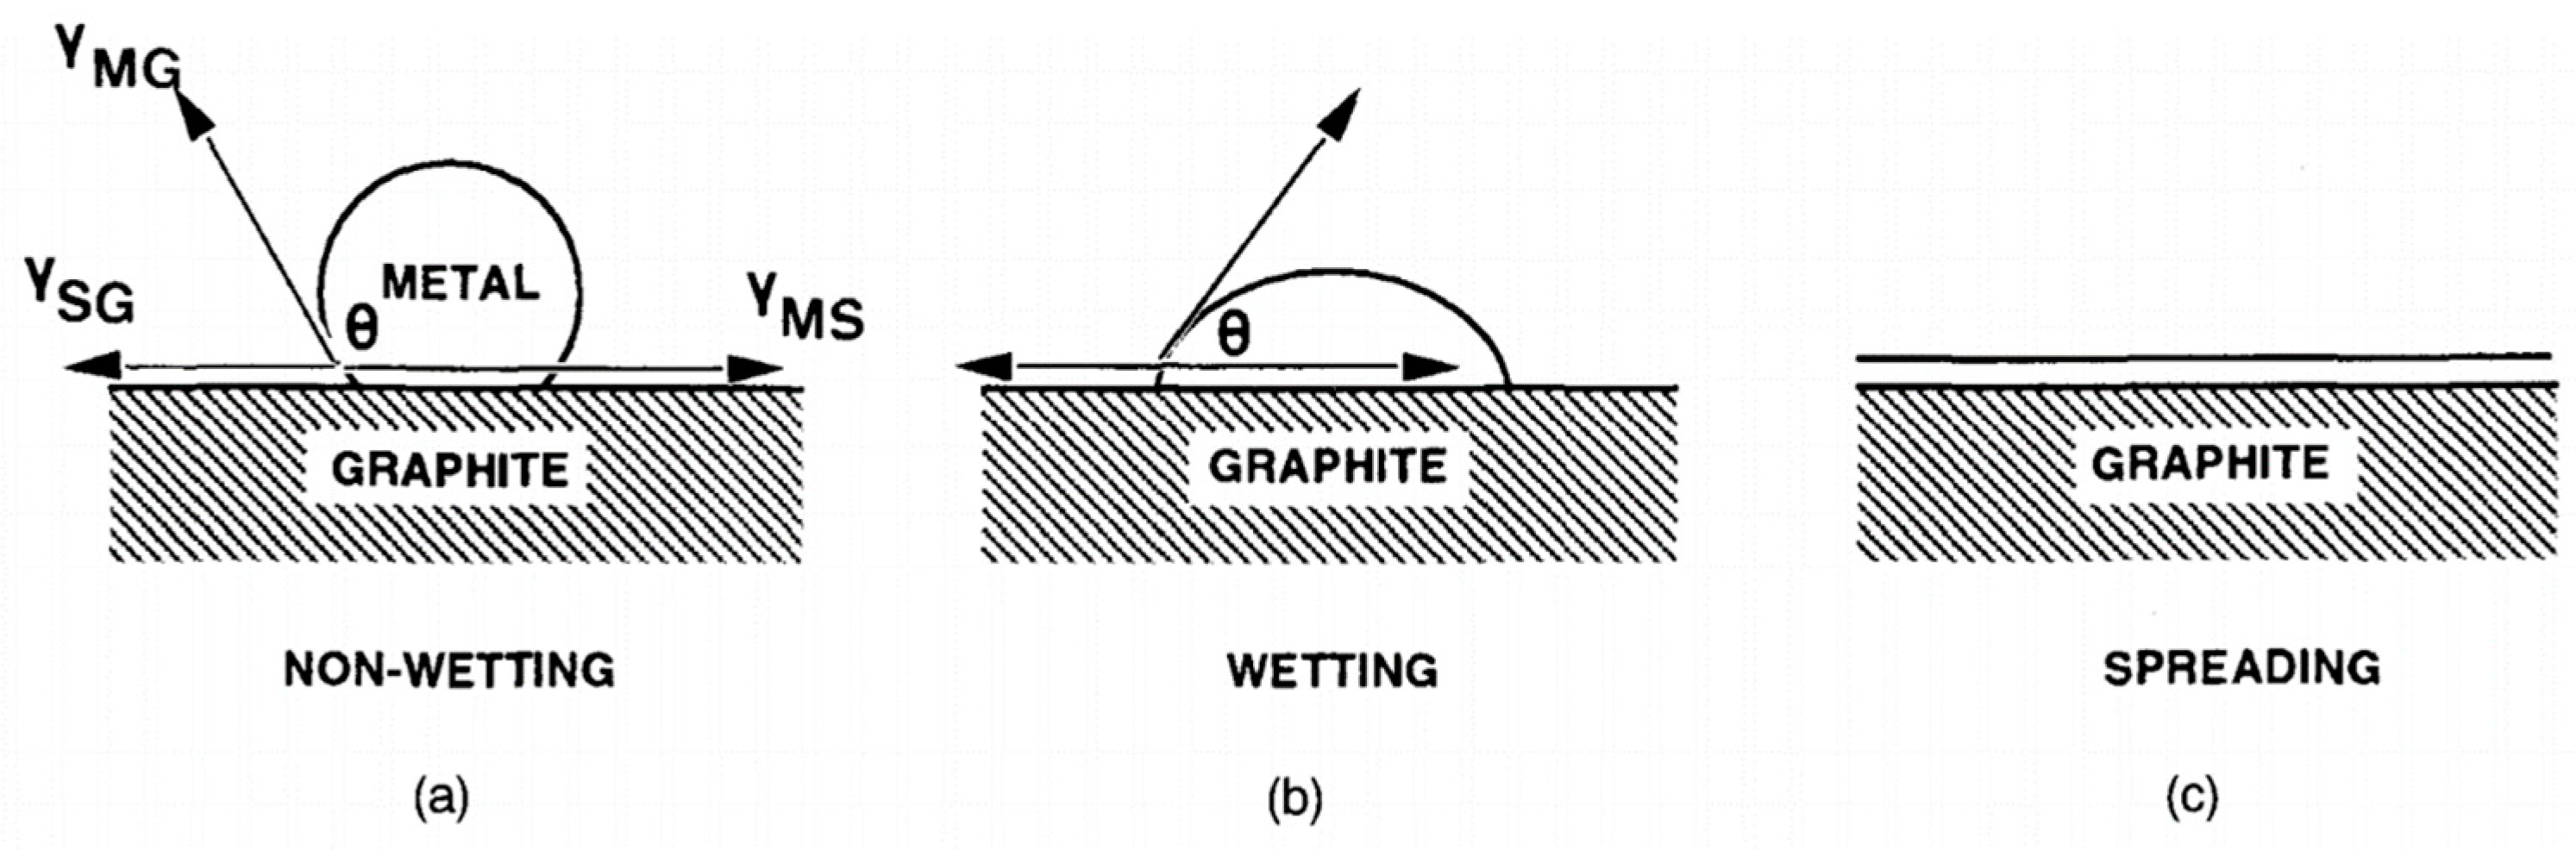
Figure 29.
Interaction between surface metal and graphite [
46].
Figure 29.
Interaction between surface metal and graphite [
46].
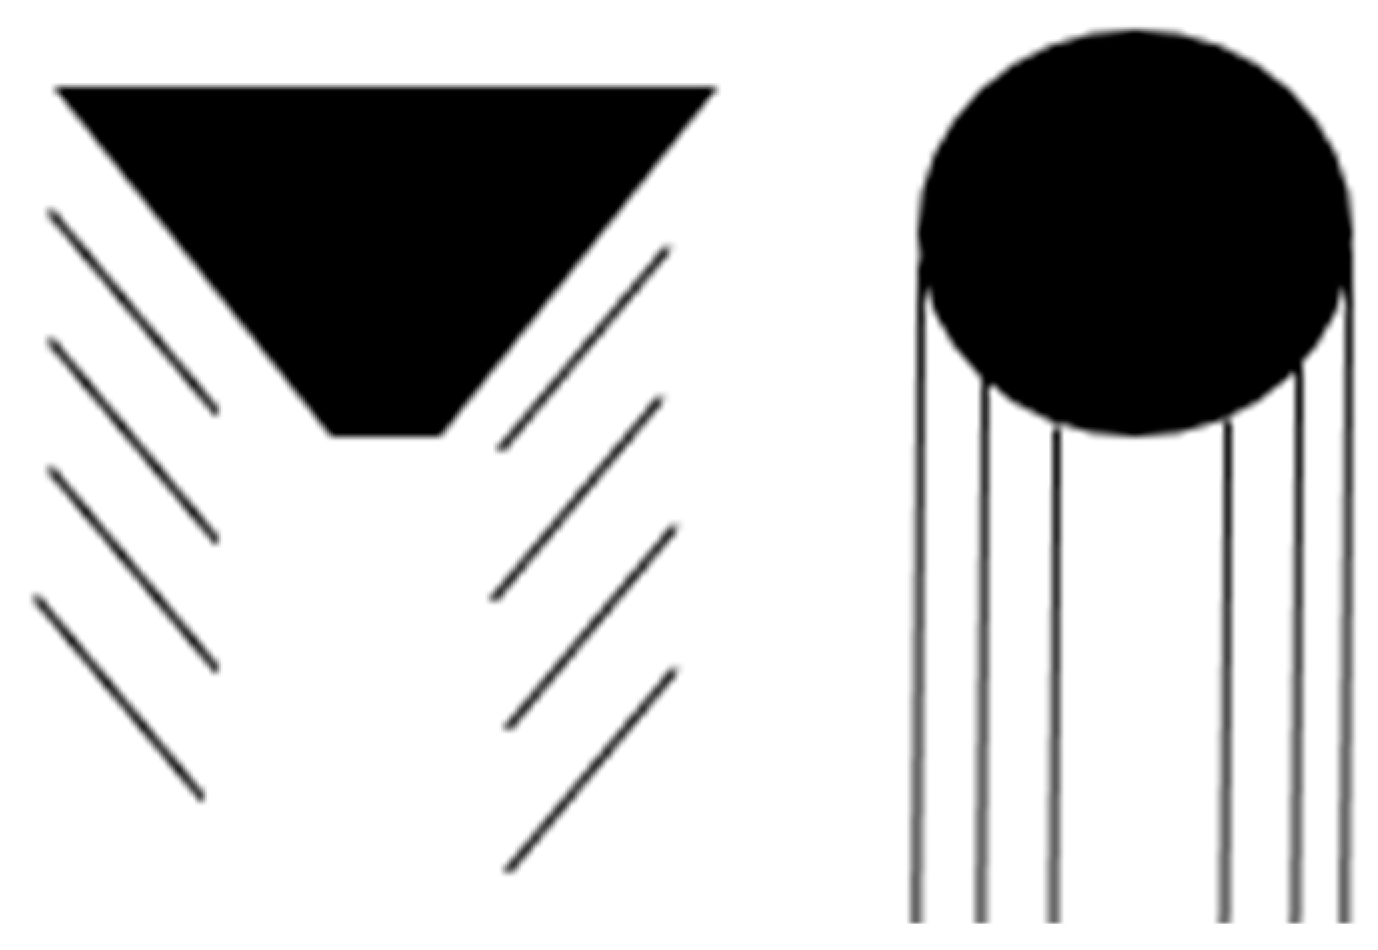
Figure 30.
Conical and spherical metal particles on the top of CNF and CNT, respectively.
Figure 30.
Conical and spherical metal particles on the top of CNF and CNT, respectively.
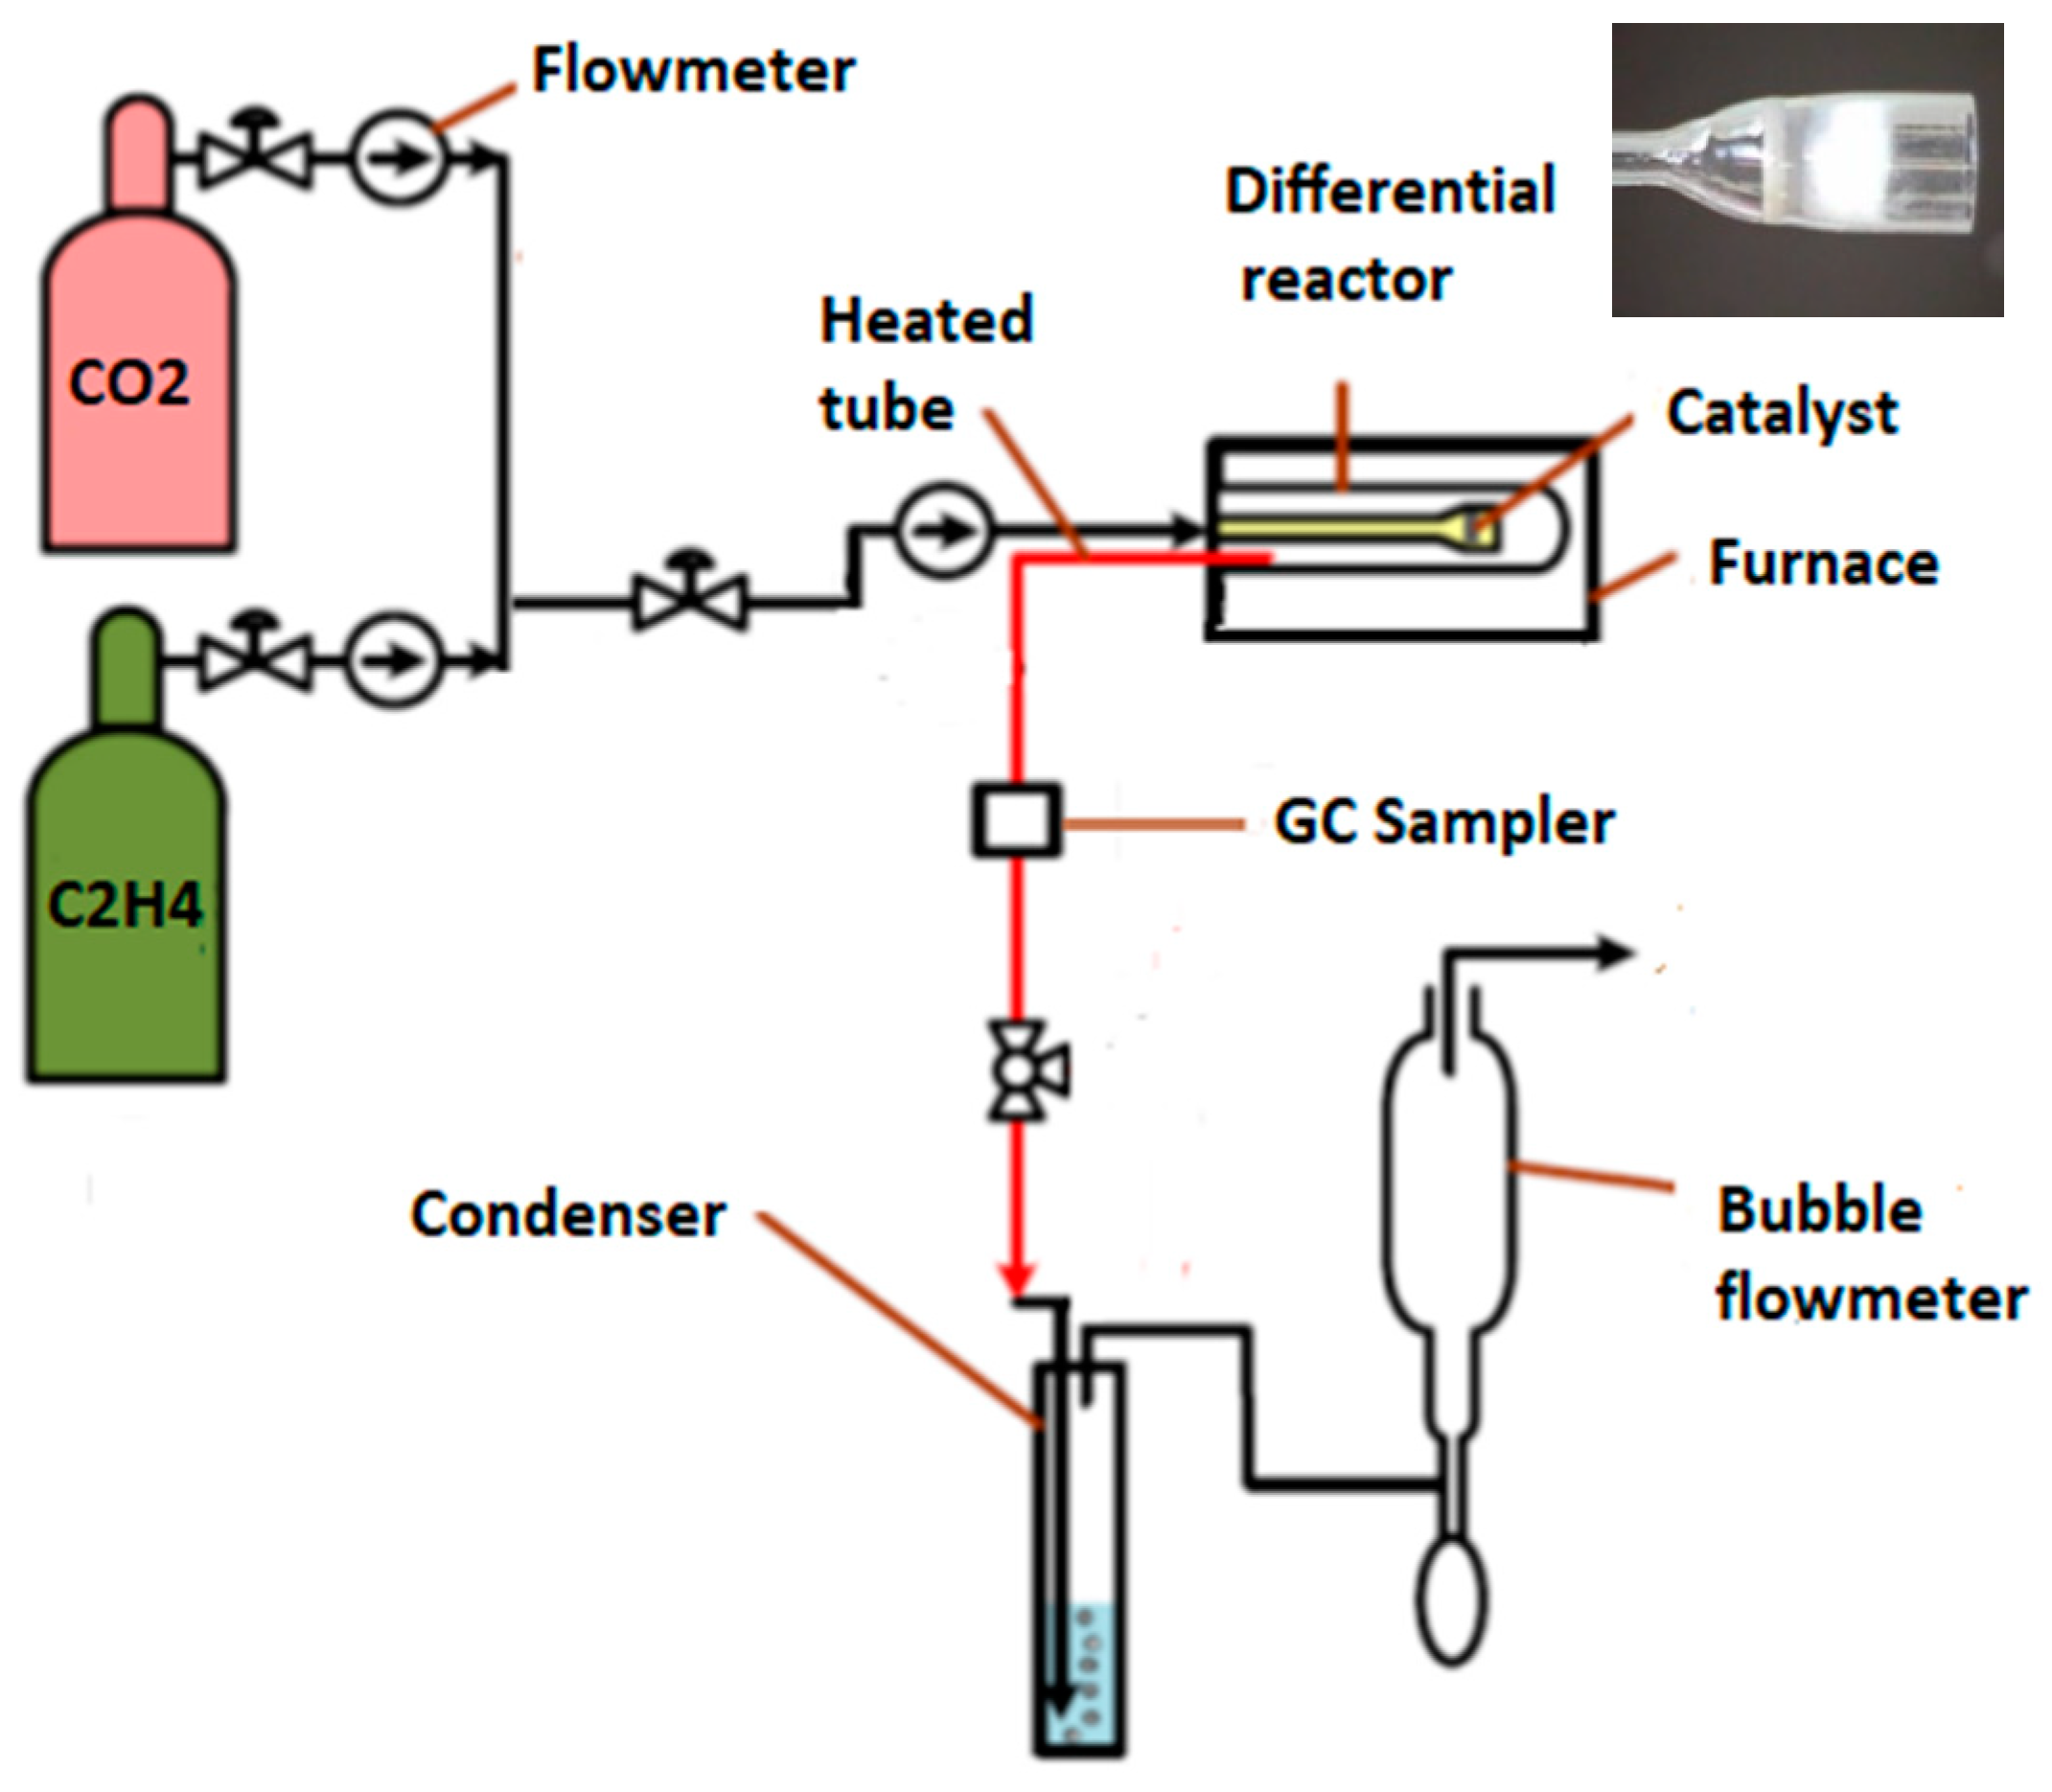
Figure 31.
Reaction set-up [
30].
Figure 31.
Reaction set-up [
30].
Table 1.
Textural properties of Ni-UGSO with different Ni contents (5, 10, and 13 wt.%).
Table 1.
Textural properties of Ni-UGSO with different Ni contents (5, 10, and 13 wt.%).
| Catalyst | BET Surface Area (m2·g−1) | Average Pore Volume (cm3·g−1) a | Average Pore Diameter (nm) b | FWHM (nm) | Ni spinel Crystal Size (nm) c |
|---|
| UGSO | 4.96 | 0.0256 | 20.1 | − | − |
| Ni-UGSO 5% | 2.91 | 0.0134 | 18.2 | 0.429 | 3.38 |
| Ni-UGSO 10% | 2.66 | 0.0126 | 19.2 | 0.426 | 3.41 |
| Ni-UGSO 13% | 2.87 | 0.0132 | 17.7 | 0.429 | 3.38 |
Table 2.
XRD phase legend.
Table 3.
Indexation of d-spacing measured by SAED.
Table 3.
Indexation of d-spacing measured by SAED.
| Measured D-Spacing (A°) | Indexation | Theoretical D-Spacing (A°) |
|---|
| 1.48 and 1.46 | (4 4 0) (MgFe)O/NiO | 1.47 |
| 1.67 | (4 2 2) NiFe2O4/Fe3O4 | 1.7 |
| 2.03 and 2.06 | (4 0 0) (MgFe)O/NiO | 2.08 |
| 2.47 and 2.41 | (3 1 1) NiFe2O4/Fe3O4 | 2.51 |
| 2.9 | (2 2 0) NiFe2O4/Fe3O4 | 2.94 |
| 4.61 | (1 1 1) NiFe2O4/Fe3O4 | 4.8 |
Table 4.
Textural properties of Ni-UGSO 13% before and after activation.
Table 4.
Textural properties of Ni-UGSO 13% before and after activation.
| Catalyst | BET Surface Area (m2·g−1) | Average Pore Volume (cm3·g−1) a | Average Pore Diameter (nm) b | FWMH | Ni Crystallite Size (nm) c |
|---|
| Fresh Ni-UGSO 13% | 2.87 | 0.0132 | 17.7 | 0.43 | 3.4 |
| Activated Ni-UGSO 13% | 4.81 | 0.0238 | 19.1 | 1.39 | 1.2 |
Table 5.
Carbon growth rate for the CC reaction using Ni-UGSO with different Ni wt.% (5, 10, and 13) at T = 550 °C, 650 °C, and 750 °C for 2 h TOS.
Table 5.
Carbon growth rate for the CC reaction using Ni-UGSO with different Ni wt.% (5, 10, and 13) at T = 550 °C, 650 °C, and 750 °C for 2 h TOS.
| Catalyst | Carbon Growth Rate (gC·gcat−1·h−1) At |
|---|
| 550 °C | 650 °C | 750 °C |
|---|
| Ni-UGSO 5% | 1.42 | 1.7 | 1.78 |
| Ni-UGSO 10% | 1.78 | 1.82 | 1.94 |
| Ni-UGSO 13% | 2.1 | 2.2 | 2.8 |
Table 6.
General experimental results for CC reaction using Ni-UGSO 13% at 750 °C for 2 h TOS.
Table 6.
General experimental results for CC reaction using Ni-UGSO 13% at 750 °C for 2 h TOS.
| C2H4 (mL/min) | 30 |
| Ar (mL/min) | 10 |
| Catalyst weight (g) | 0.5 |
| TOS (min) | 120 |
| GHSVSTP (mL·h−1. g) | 4800 |
| C2H4/Ar | 3 |
| Ar/C2H4 | 0.33 |
| Carbon (g) | 2.8 |
| Carbon production rate (gC·gcat−1·min−1) | 0.047 |
| Carbon production rate (gC·gcat−1·h−1) | 2.8 |
| Carbon yield (%) | 76.25 |
| Total H2 yield (%) | 74.46 |
| Total C2H4 conversion (%) | 92.24 |
| Mass balance error for C (%) | 3.31 |
| Mass balance error for H (%) | 0.08 |
Table 7.
Carbon growth rate for the DR reaction using Ni-UGSO with different Ni wt.% (5, 10, and 13) at T = 550 °C, 650 °C, and 750 °C for 2 h TOS.
Table 7.
Carbon growth rate for the DR reaction using Ni-UGSO with different Ni wt.% (5, 10, and 13) at T = 550 °C, 650 °C, and 750 °C for 2 h TOS.
| Catalyst | Carbon Growth Rate (gC·gcat−1·h−1) At |
|---|
| 550 °C | 650 °C | 750 °C |
|---|
| Ni-UGSO 5% | 1.1 | 1.96 | 1.83 |
| Ni-UGSO 10% | 1.7 | 2.05 | 1.9 |
| Ni-UGSO 13% | 0.9 | 2.25 | 1.96 |
Table 8.
General experimental results for the DR reaction at 650 °C and Ni-UGSO 13% for 2 h TOS.
Table 8.
General experimental results for the DR reaction at 650 °C and Ni-UGSO 13% for 2 h TOS.
| C2H4 (mL/min) | 30 |
| CO2 (mL/min) | 10 |
| Catalyst weight (g) | 0.5 |
| TOS (min) | 120 |
| GHSVSTP (mL·h−1·g−1) | 4800 |
| C2H4/CO2 | 3 |
| CO2/C2H4 | 0.33 |
| Carbon (g) | 2.25 |
| Carbon production rate (gC·gcat−1·min−1) | 0.0375 |
| Carbon production rate (gC·gcat−1·h−1) | 2.25 |
| Carbon yield (%) | 53.57 |
| Total H2 yield (%) | 67.47 |
| Total C2H4 conversion (%) | 91.29 |
| Total CO2 conversion (%) | 88.48 |
| Mass balance error for C (%) | 9.16 |
| Mass balance error for H (%) | 1.46 |
| Mass balance error for O (%) | 8.81 |
Table 9.
Indexation of D-spacing measured by SAED.
Table 9.
Indexation of D-spacing measured by SAED.
| Measured D-Spacing (Å) | Indexation [43] | Theoretical d-Spacing (Å) [43] |
|---|
| 2.05 | (111) Ni | 2.03 |
| (110) Fe | 2.04 |
| (102) Fe3C | 2.07 |
| (220) Fe3C | 2.03 |
| (031) Fe3C | 2.01 |
| 3.40 | (200) carbon | 3.35 |
Table 10.
Average elemental analysis of the upgraded slag oxide (UGSO) residue [
30].
Table 10.
Average elemental analysis of the upgraded slag oxide (UGSO) residue [
30].
| Component | Fe | Mg | Al | Ca | Mn | V | Ti | Cr | Na | Si | K | P | Zr | Zn |
|---|
| (wt.%) a | 31.26 | 17.49 | 5.35 | 1.07 | 1.01 | 0.90 | 0.60 | 0.51 | 0.17 | 0.08 | 0.02 | 0.004 | 0.01 | 0.01 |
Table 11.
Activation test conditions.
Table 11.
Activation test conditions.
| Catalyst | H2 Flow Rate (mL/min) a | Ar Flow Rate (mL/min) a | Catalyst Weight (g) | TOS (h) | GHSV (mL·h−1·g−1) | T (°C) |
|---|
| Ni-UGSO (wt.% = 5, 10, 13) | 30 | 10 | 0.5 | 2 | 4800 | 650 |
Table 12.
Ethylene dry reforming (DR) reaction conditions.
Table 12.
Ethylene dry reforming (DR) reaction conditions.
| Catalyst | C2H4 Flow Rate (mL/min) a | CO2 Flow Rate (mL/min) a | Catalyst Weight (g) | TOS (h) | GHSV (mL·h−1·g−1) | T (°C) |
|---|
| Ni-UGSO (wt.% = 5, 10, 13) | 30 | 10 | 0.5 | 2 | 4800 | 550, 650, 750 |
Table 13.
Ethylene catalytic cracking (CC) reaction conditions.
Table 13.
Ethylene catalytic cracking (CC) reaction conditions.
| Catalyst | C2H4 Flow Rate (mL/min) a | Ar Flow Rate (mL/min) a | Catalyst Weight (g) | TOS (h) | GHSV (mL·h−1·g−1) | T (°C) |
|---|
| Ni-UGSO (wt.% = 5, 10, 13) | 30 | 10 | 0.5 | 2 | 4800 | 550, 650, 750 |

 ,
, 


