Aldol Condensation of Cyclohexanone and Furfural in Fixed-Bed Reactor

 , ,
, ,  ,
, 

Abstract
:1. Introduction
2. Results and Discussion
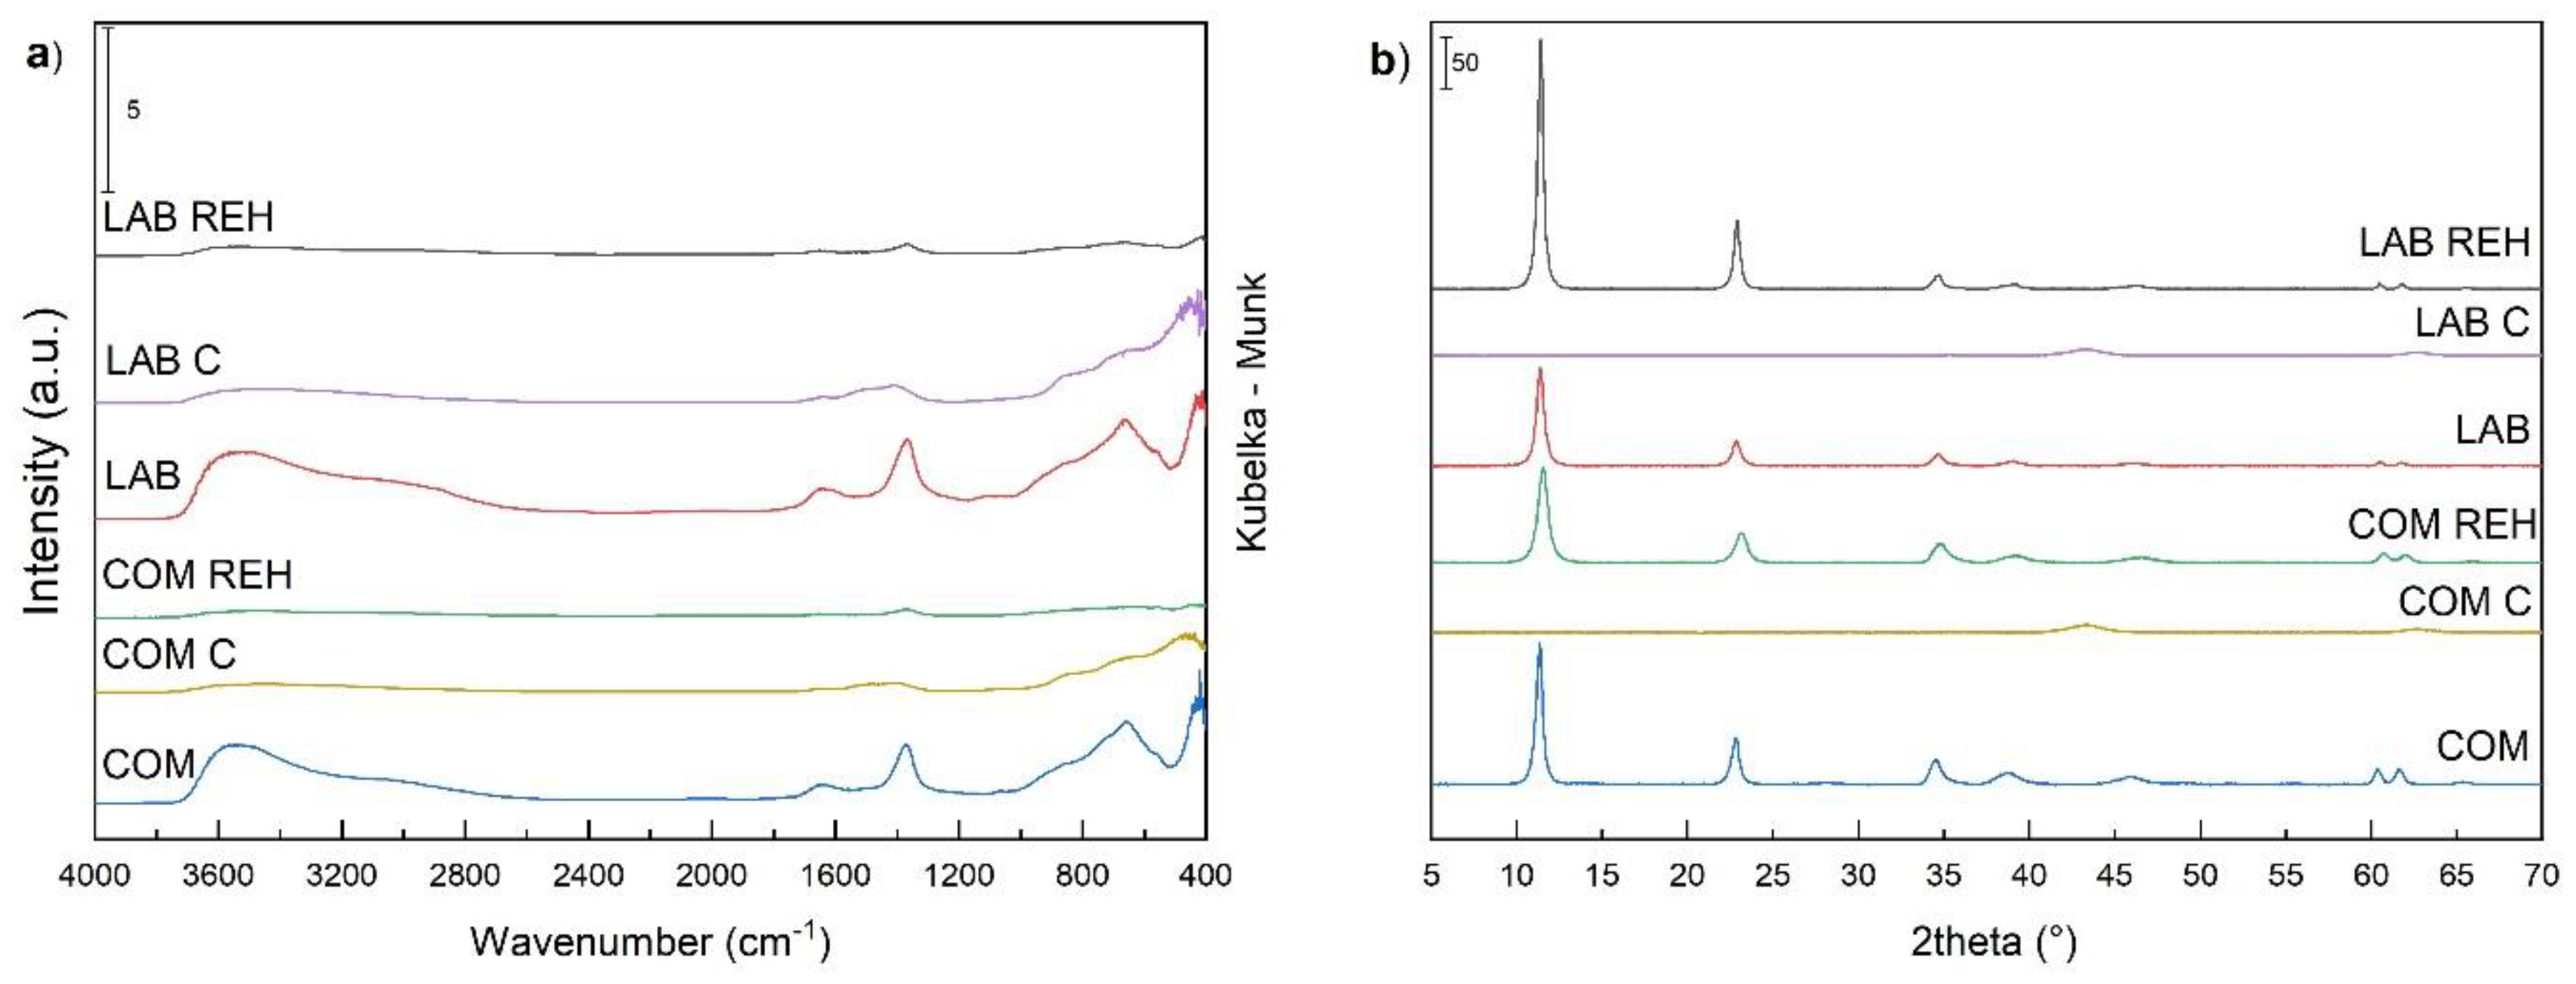
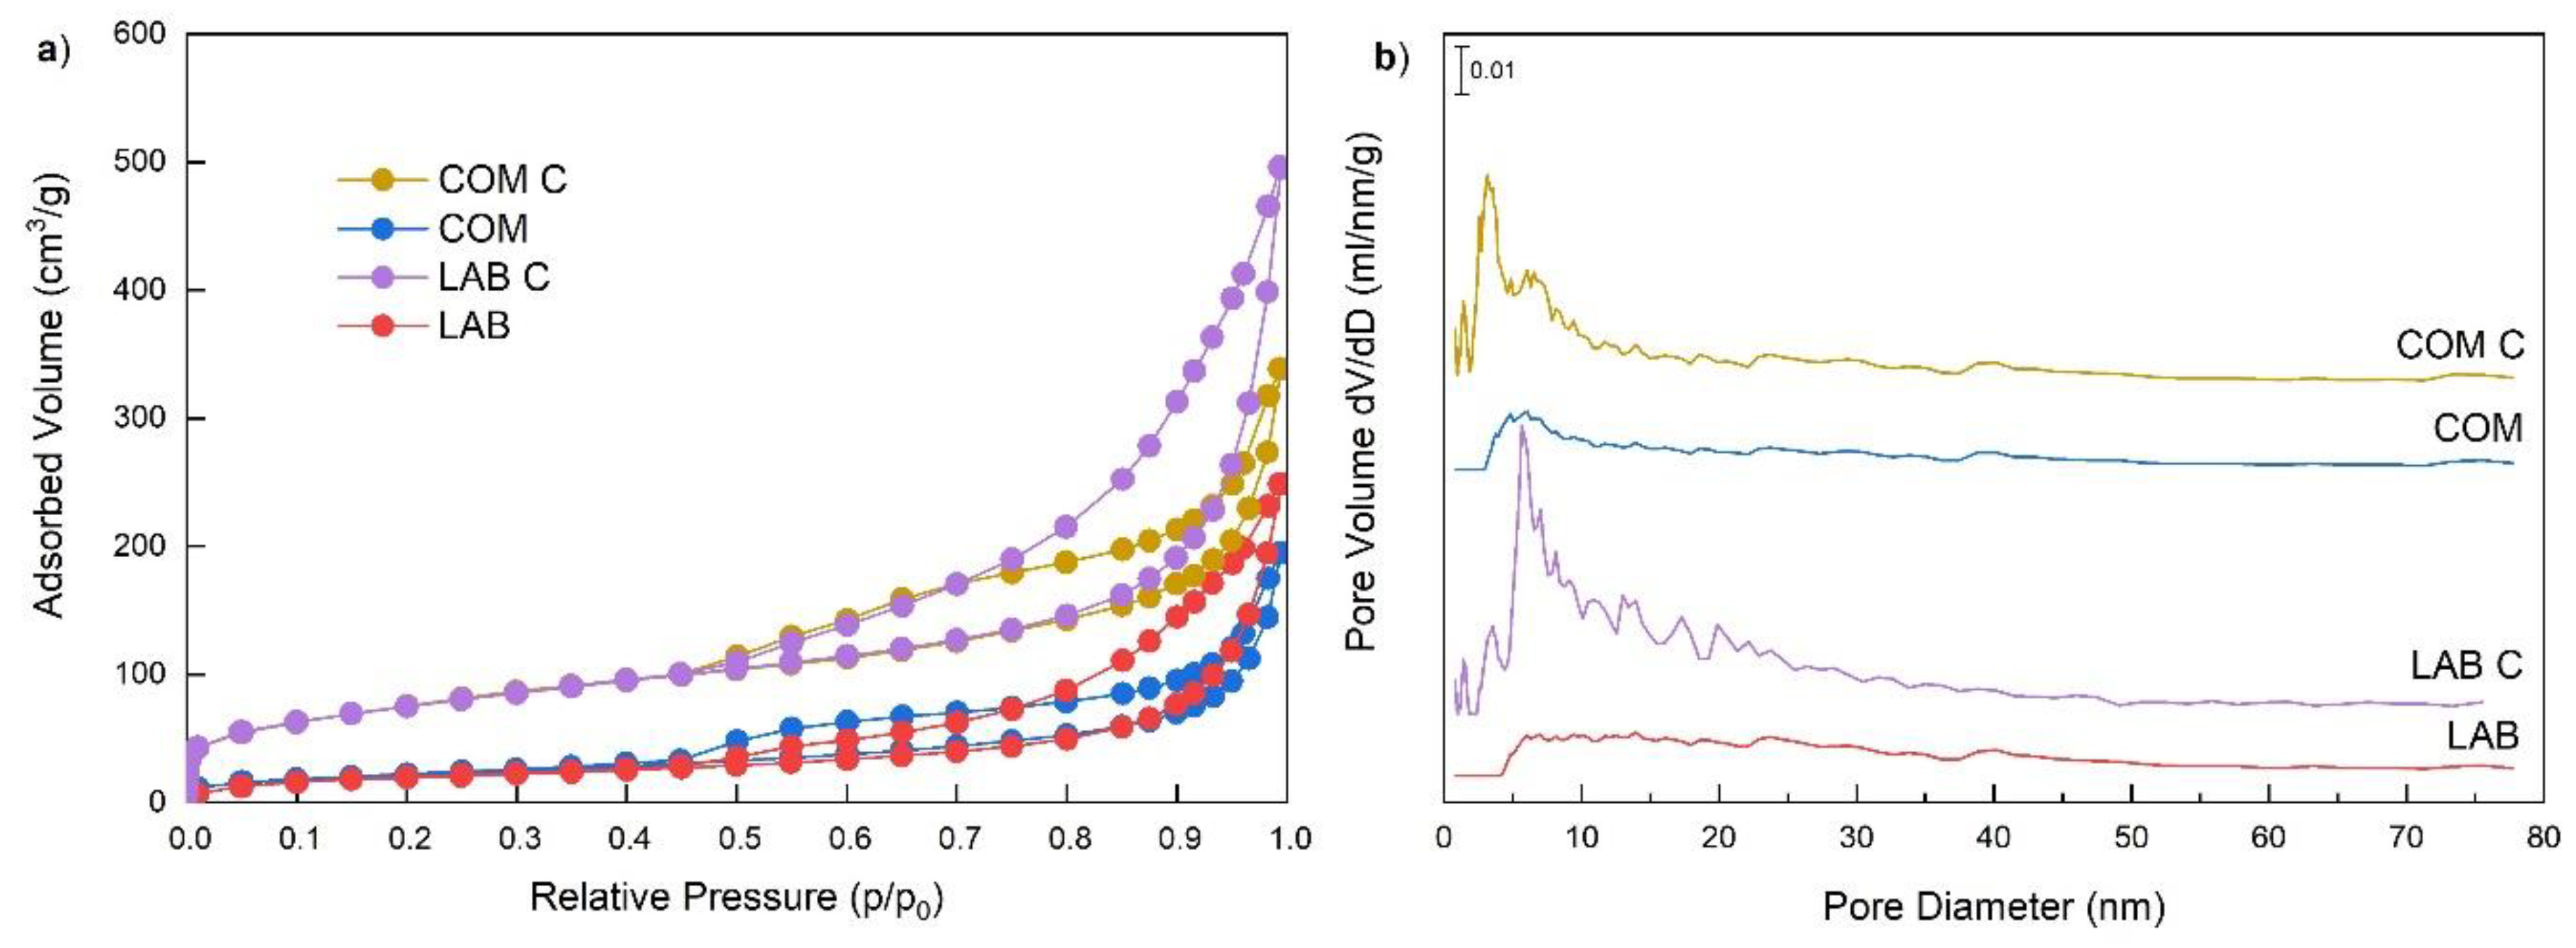
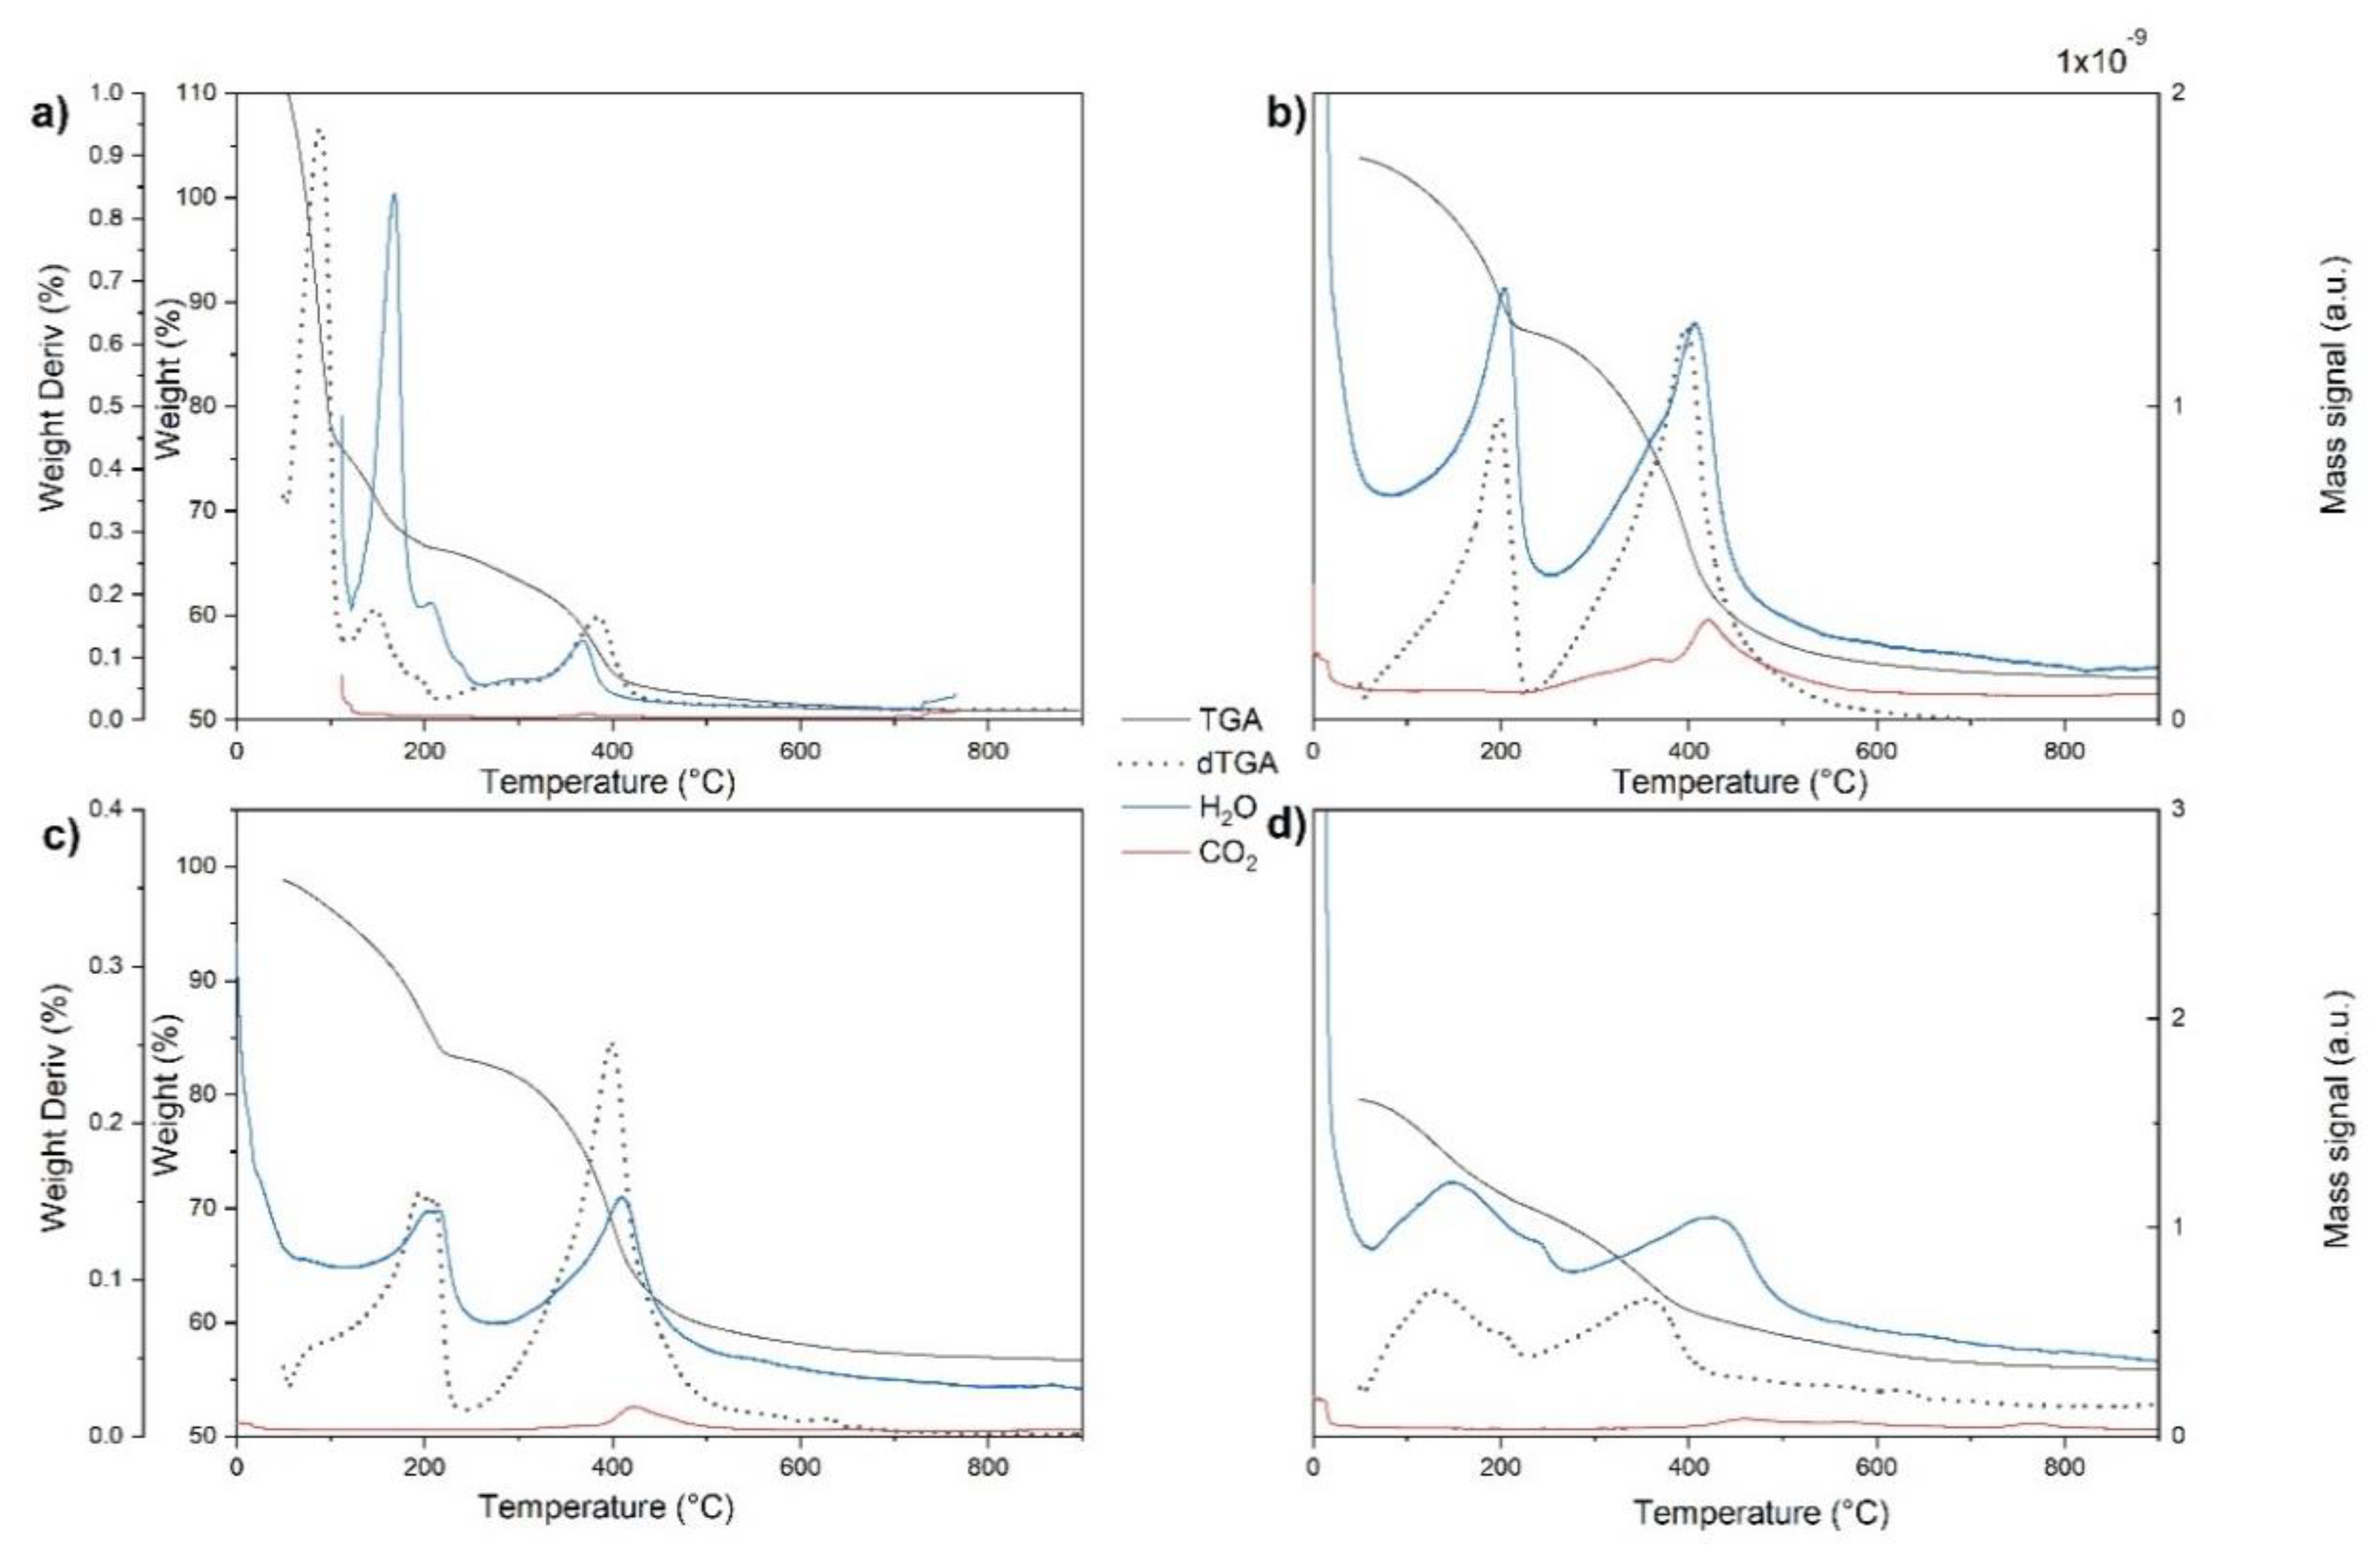
2.1. Structure of Precursors and Catalysts
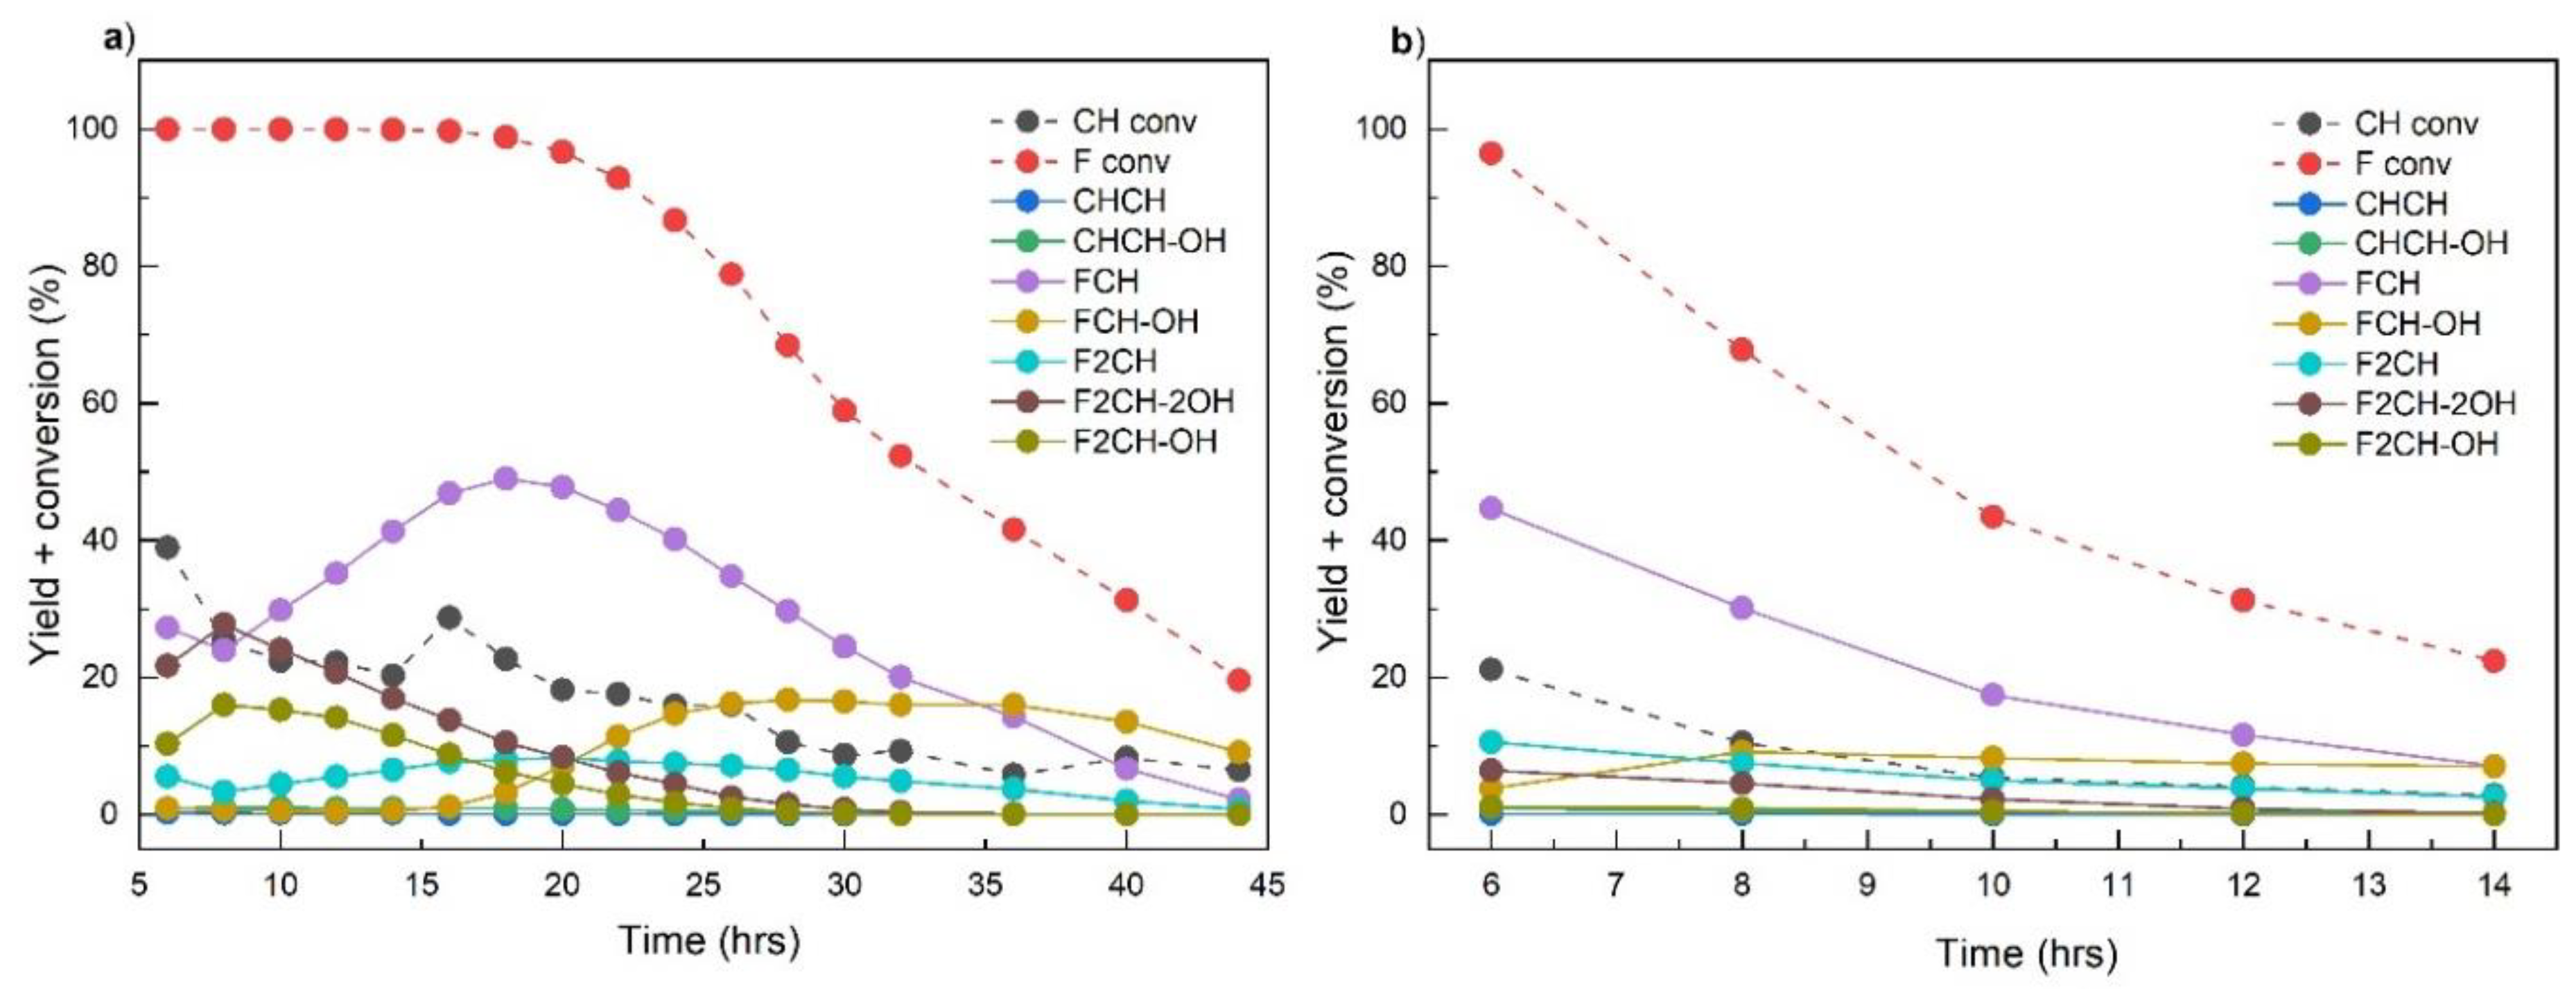
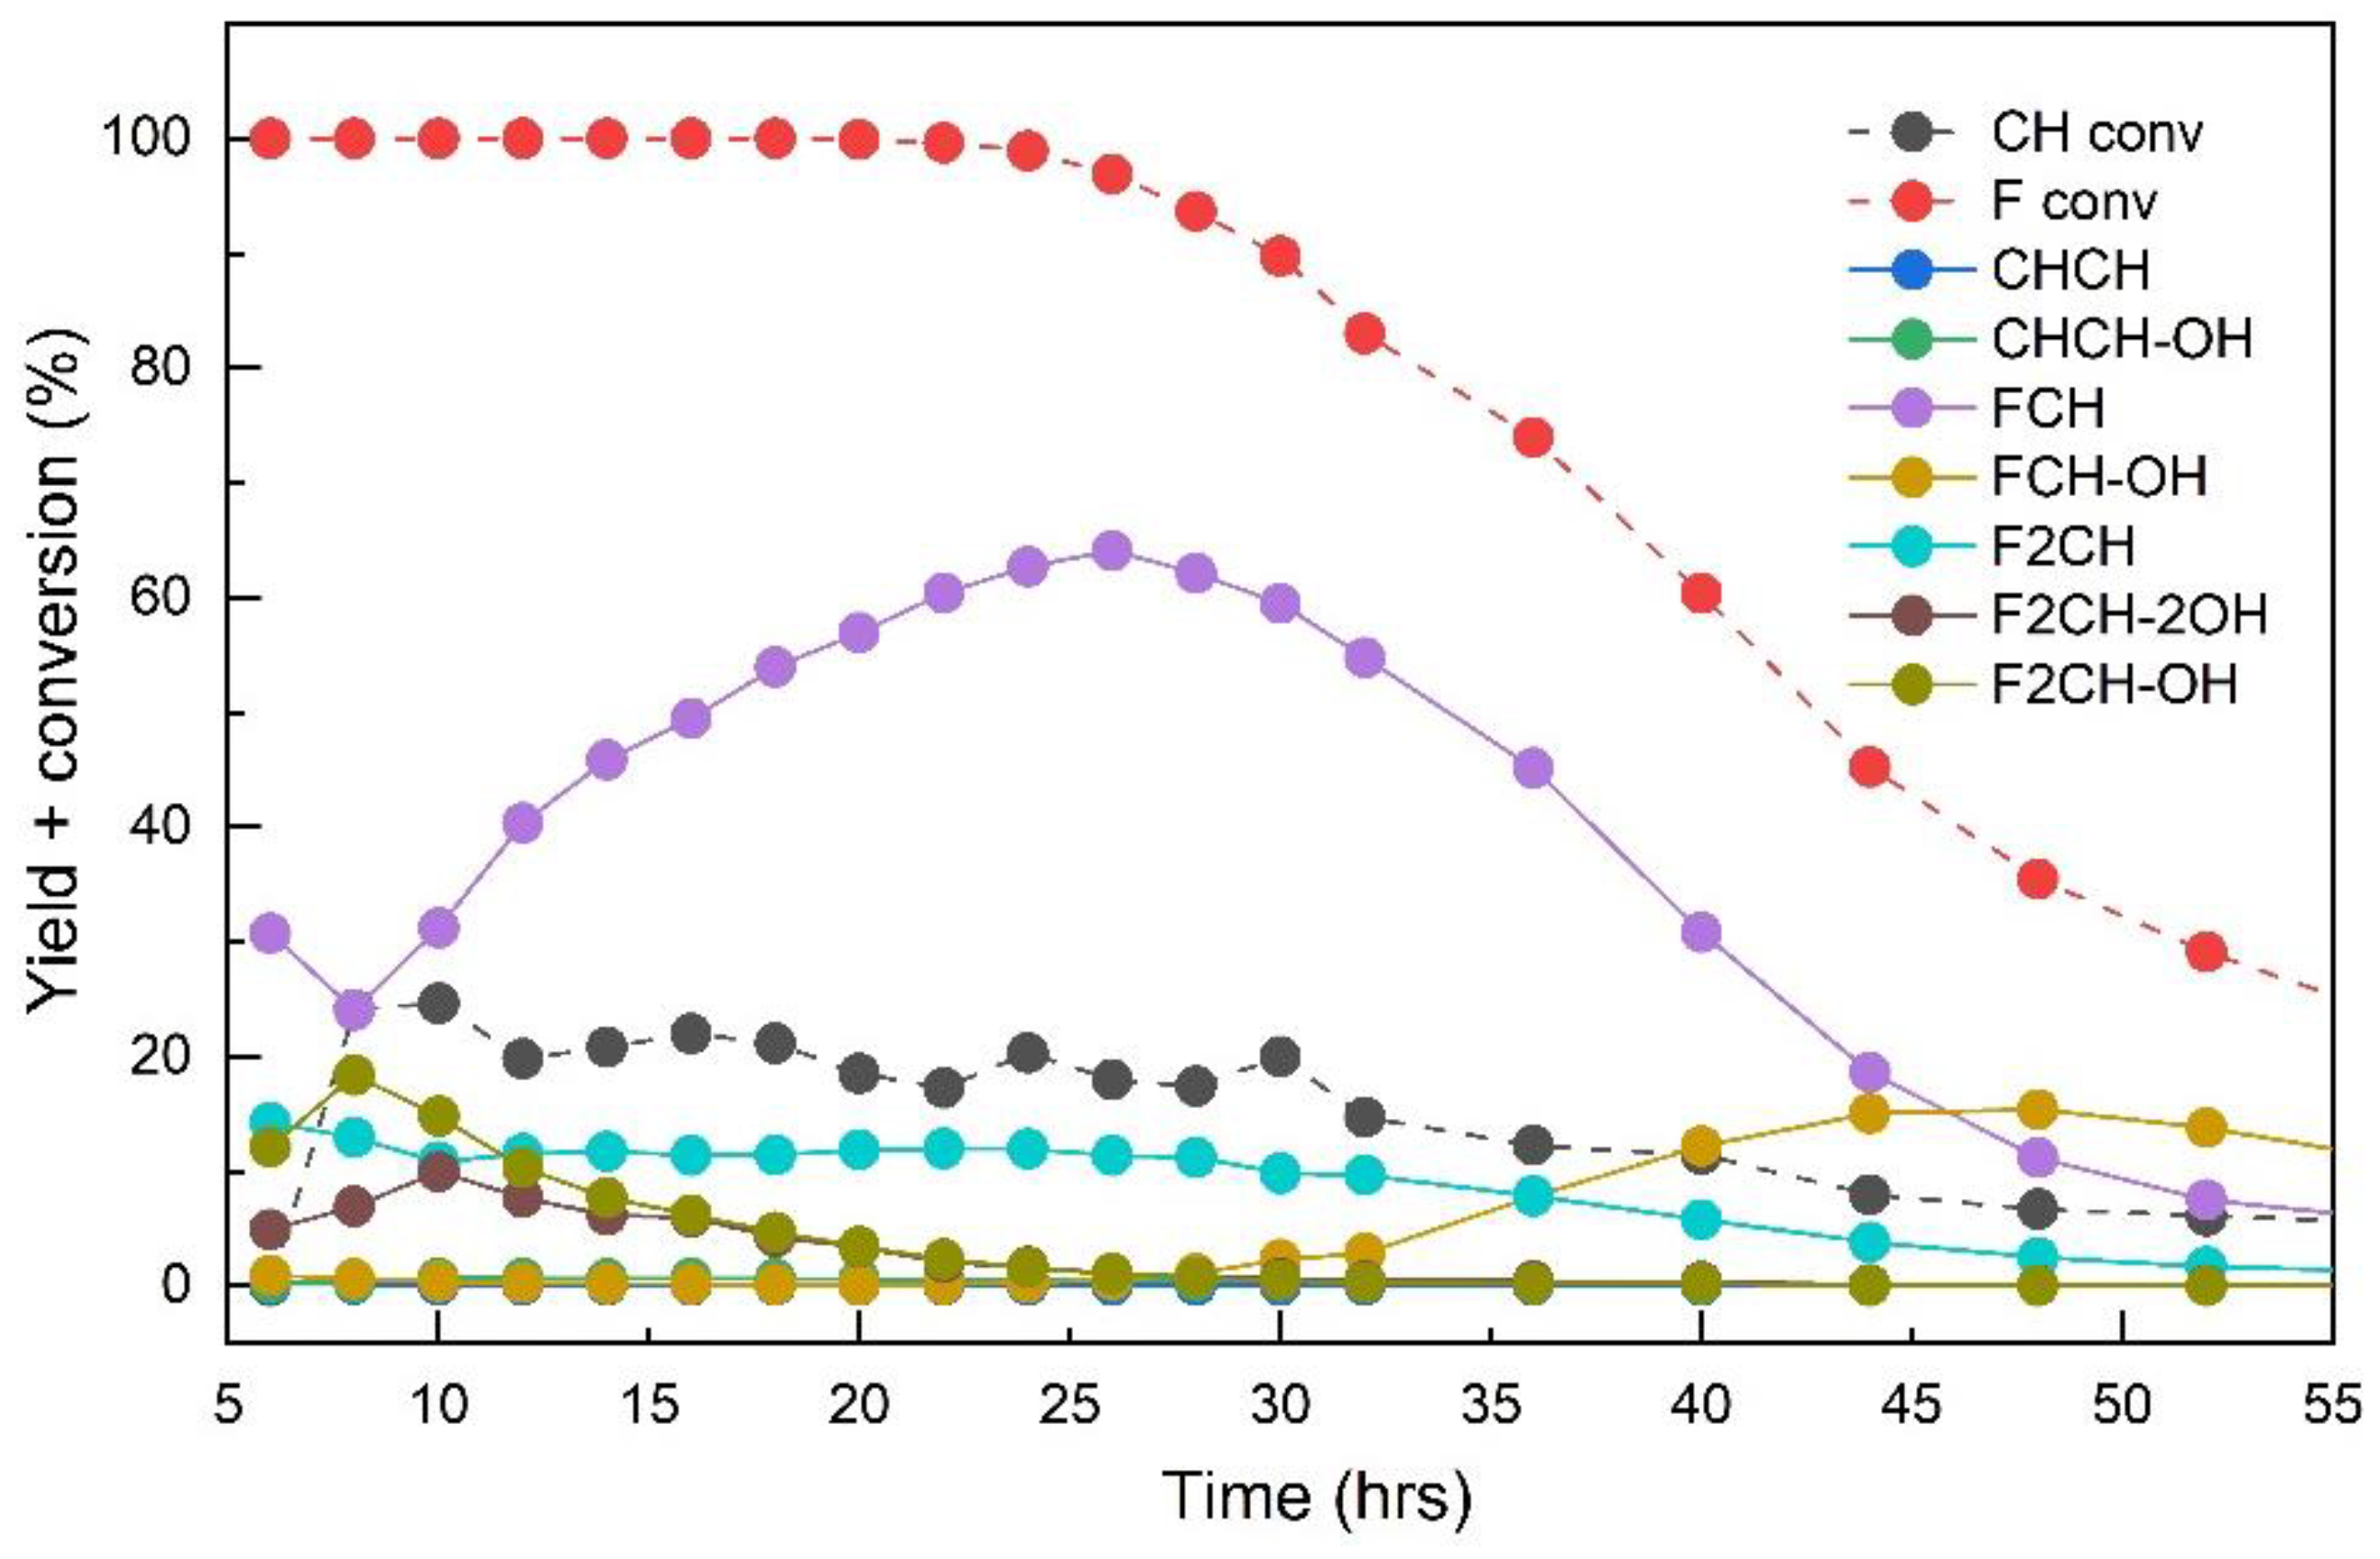
2.2. Catalytic Tests
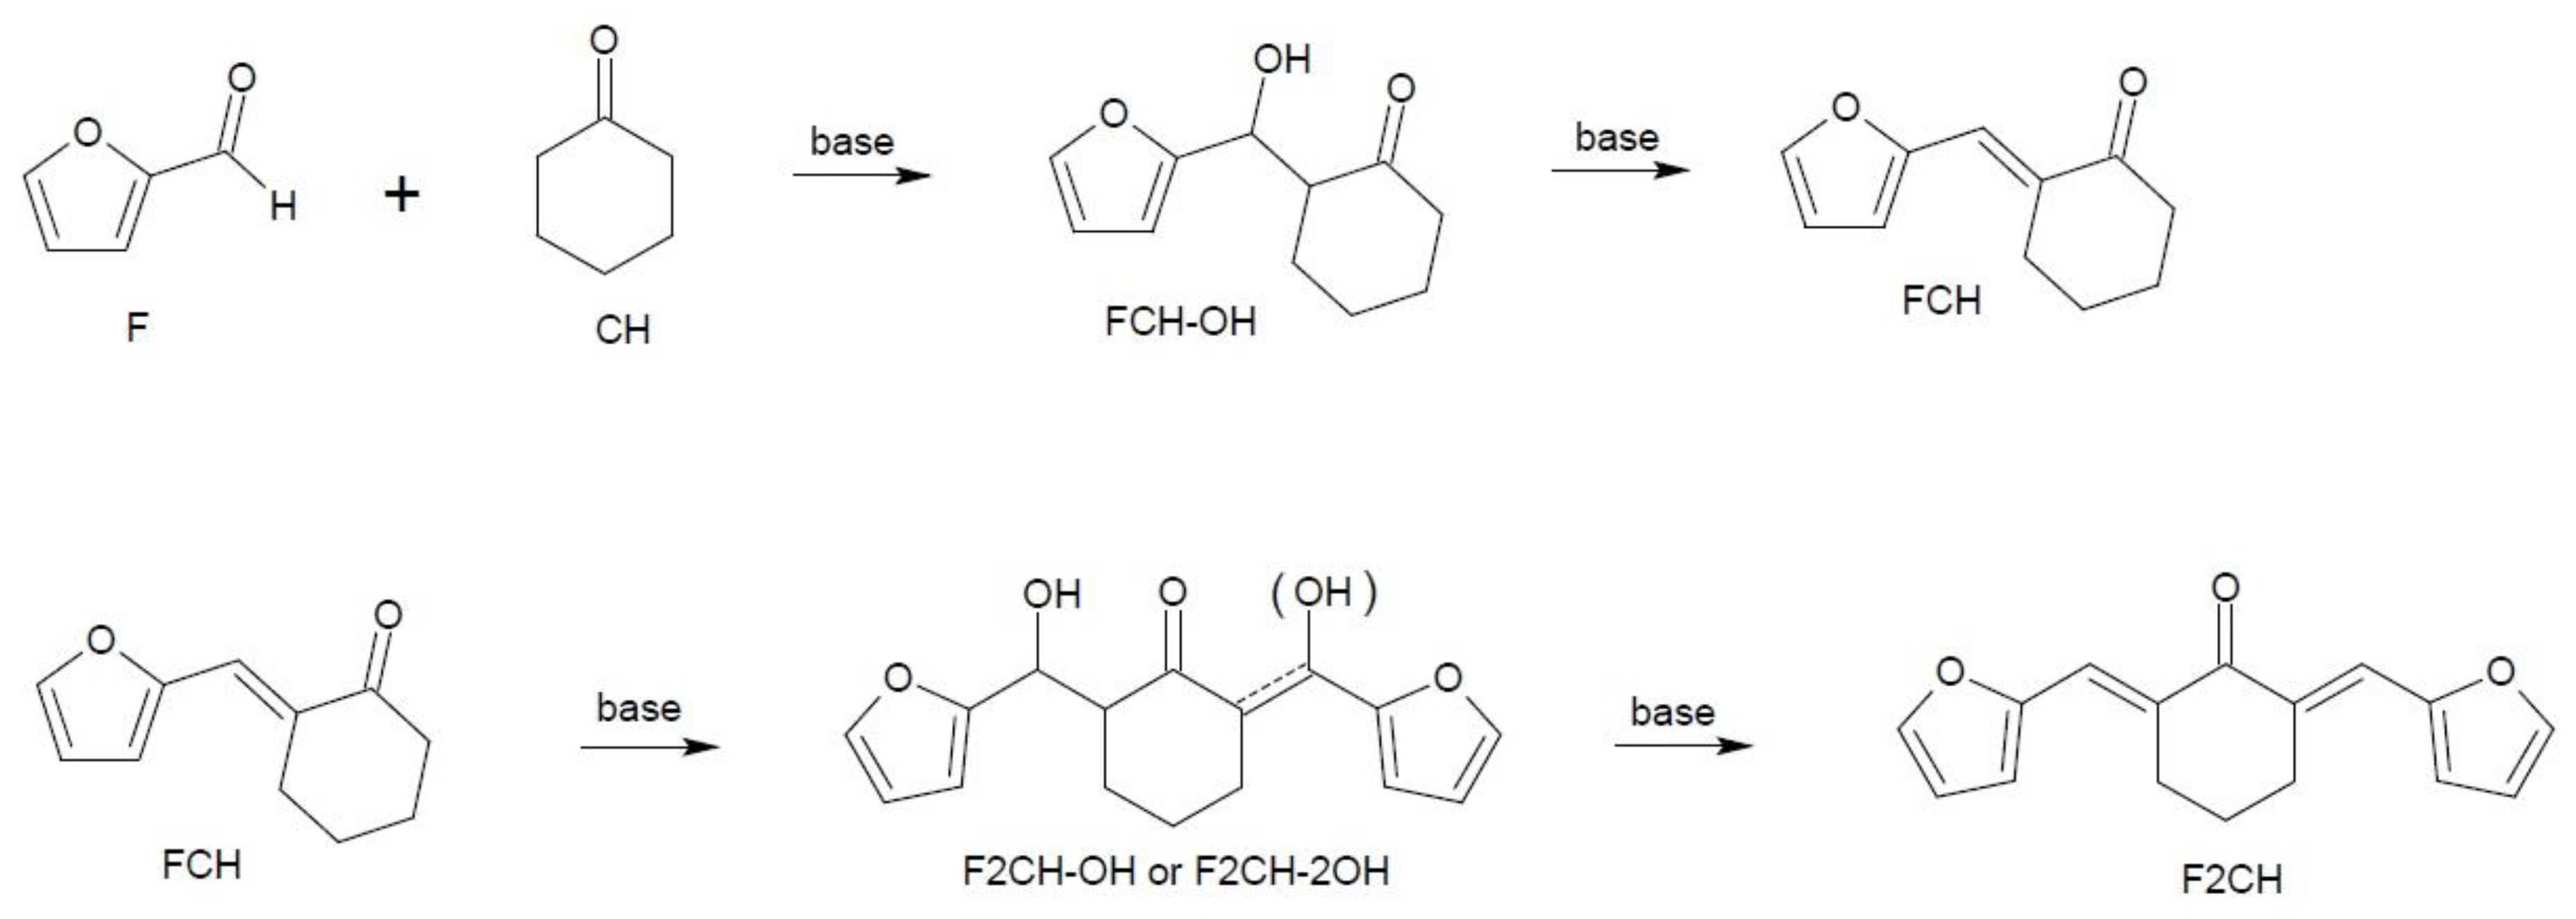
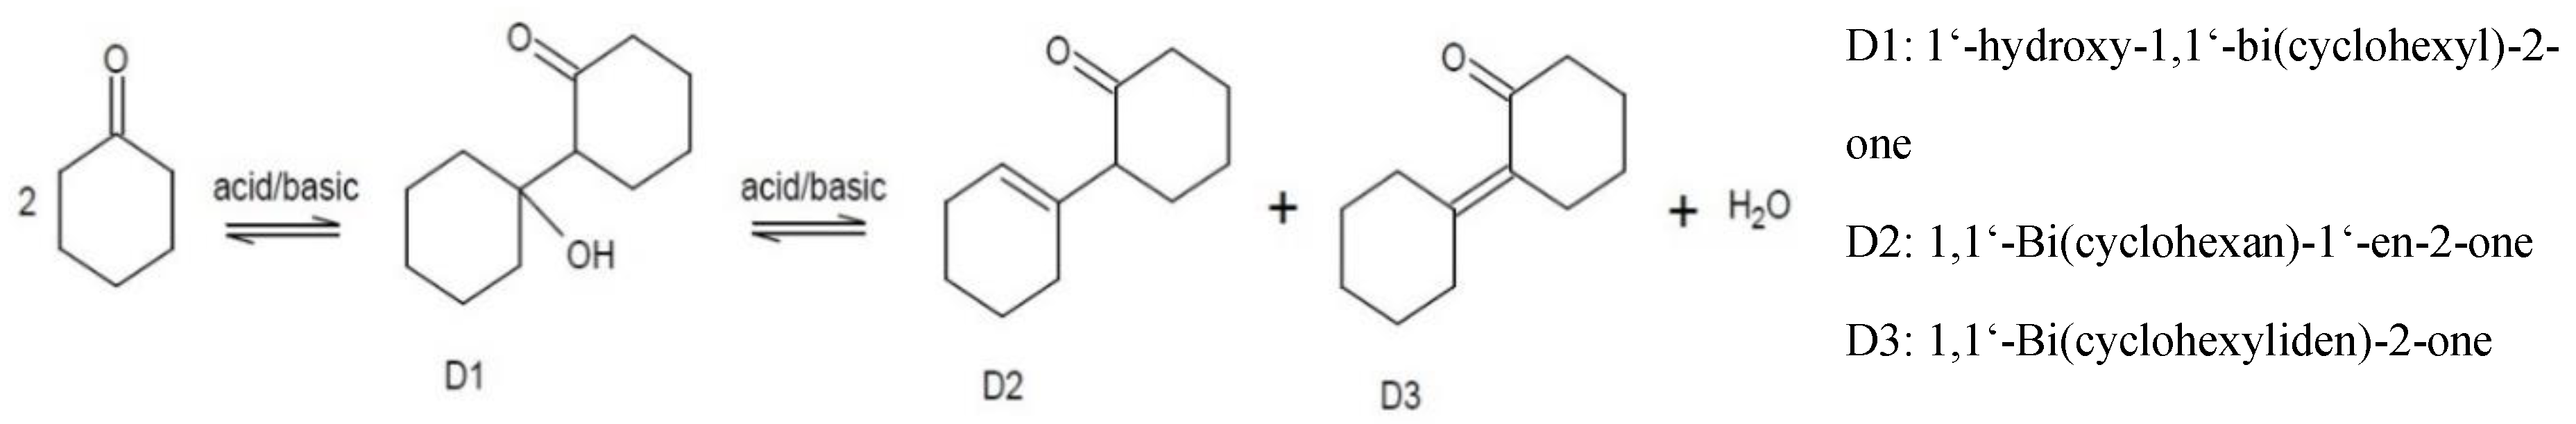
2.2.1. Aldol Condensation Mechanism
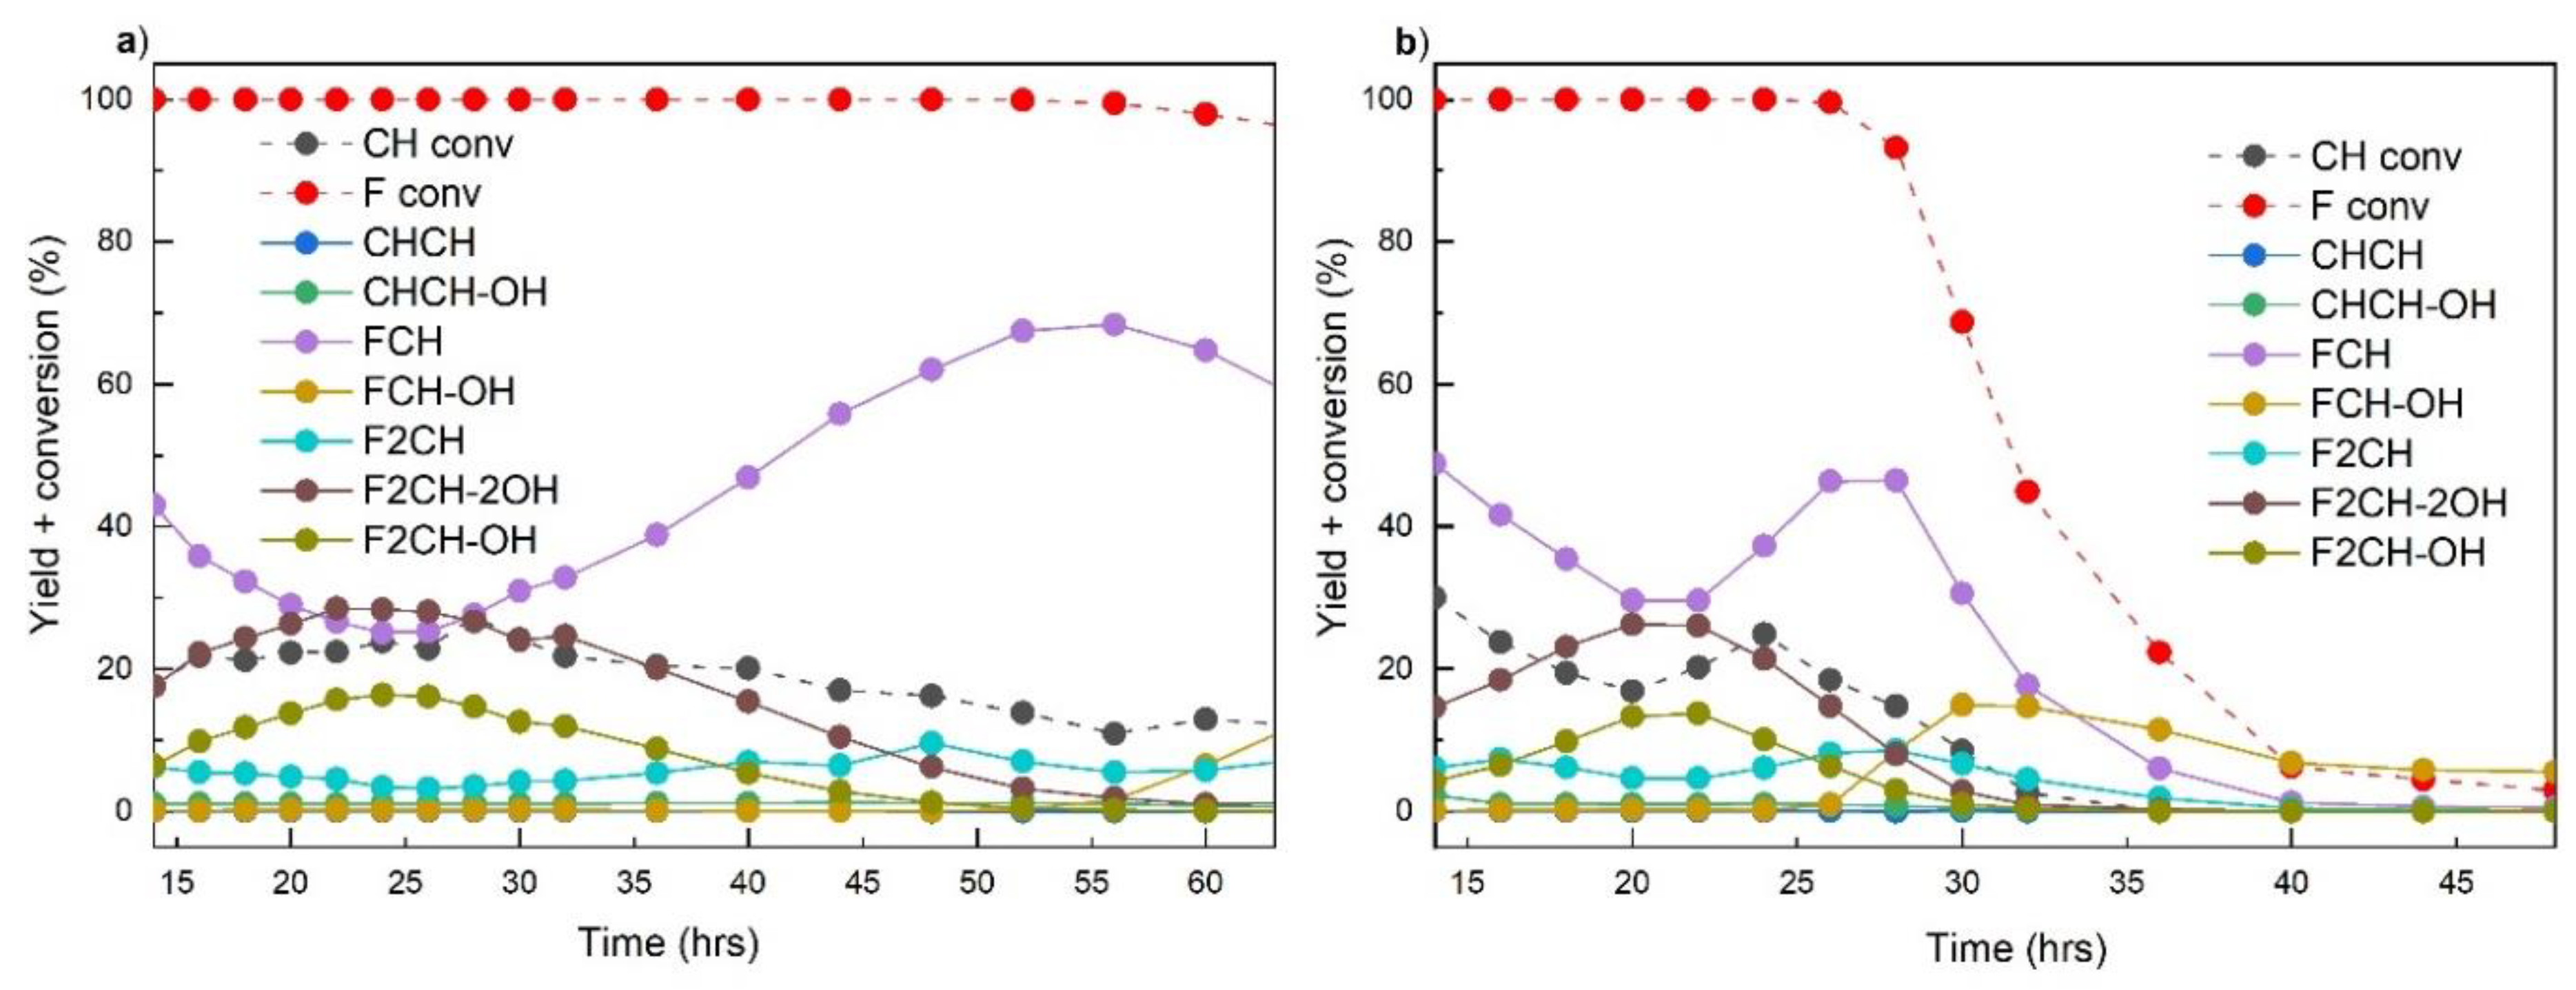
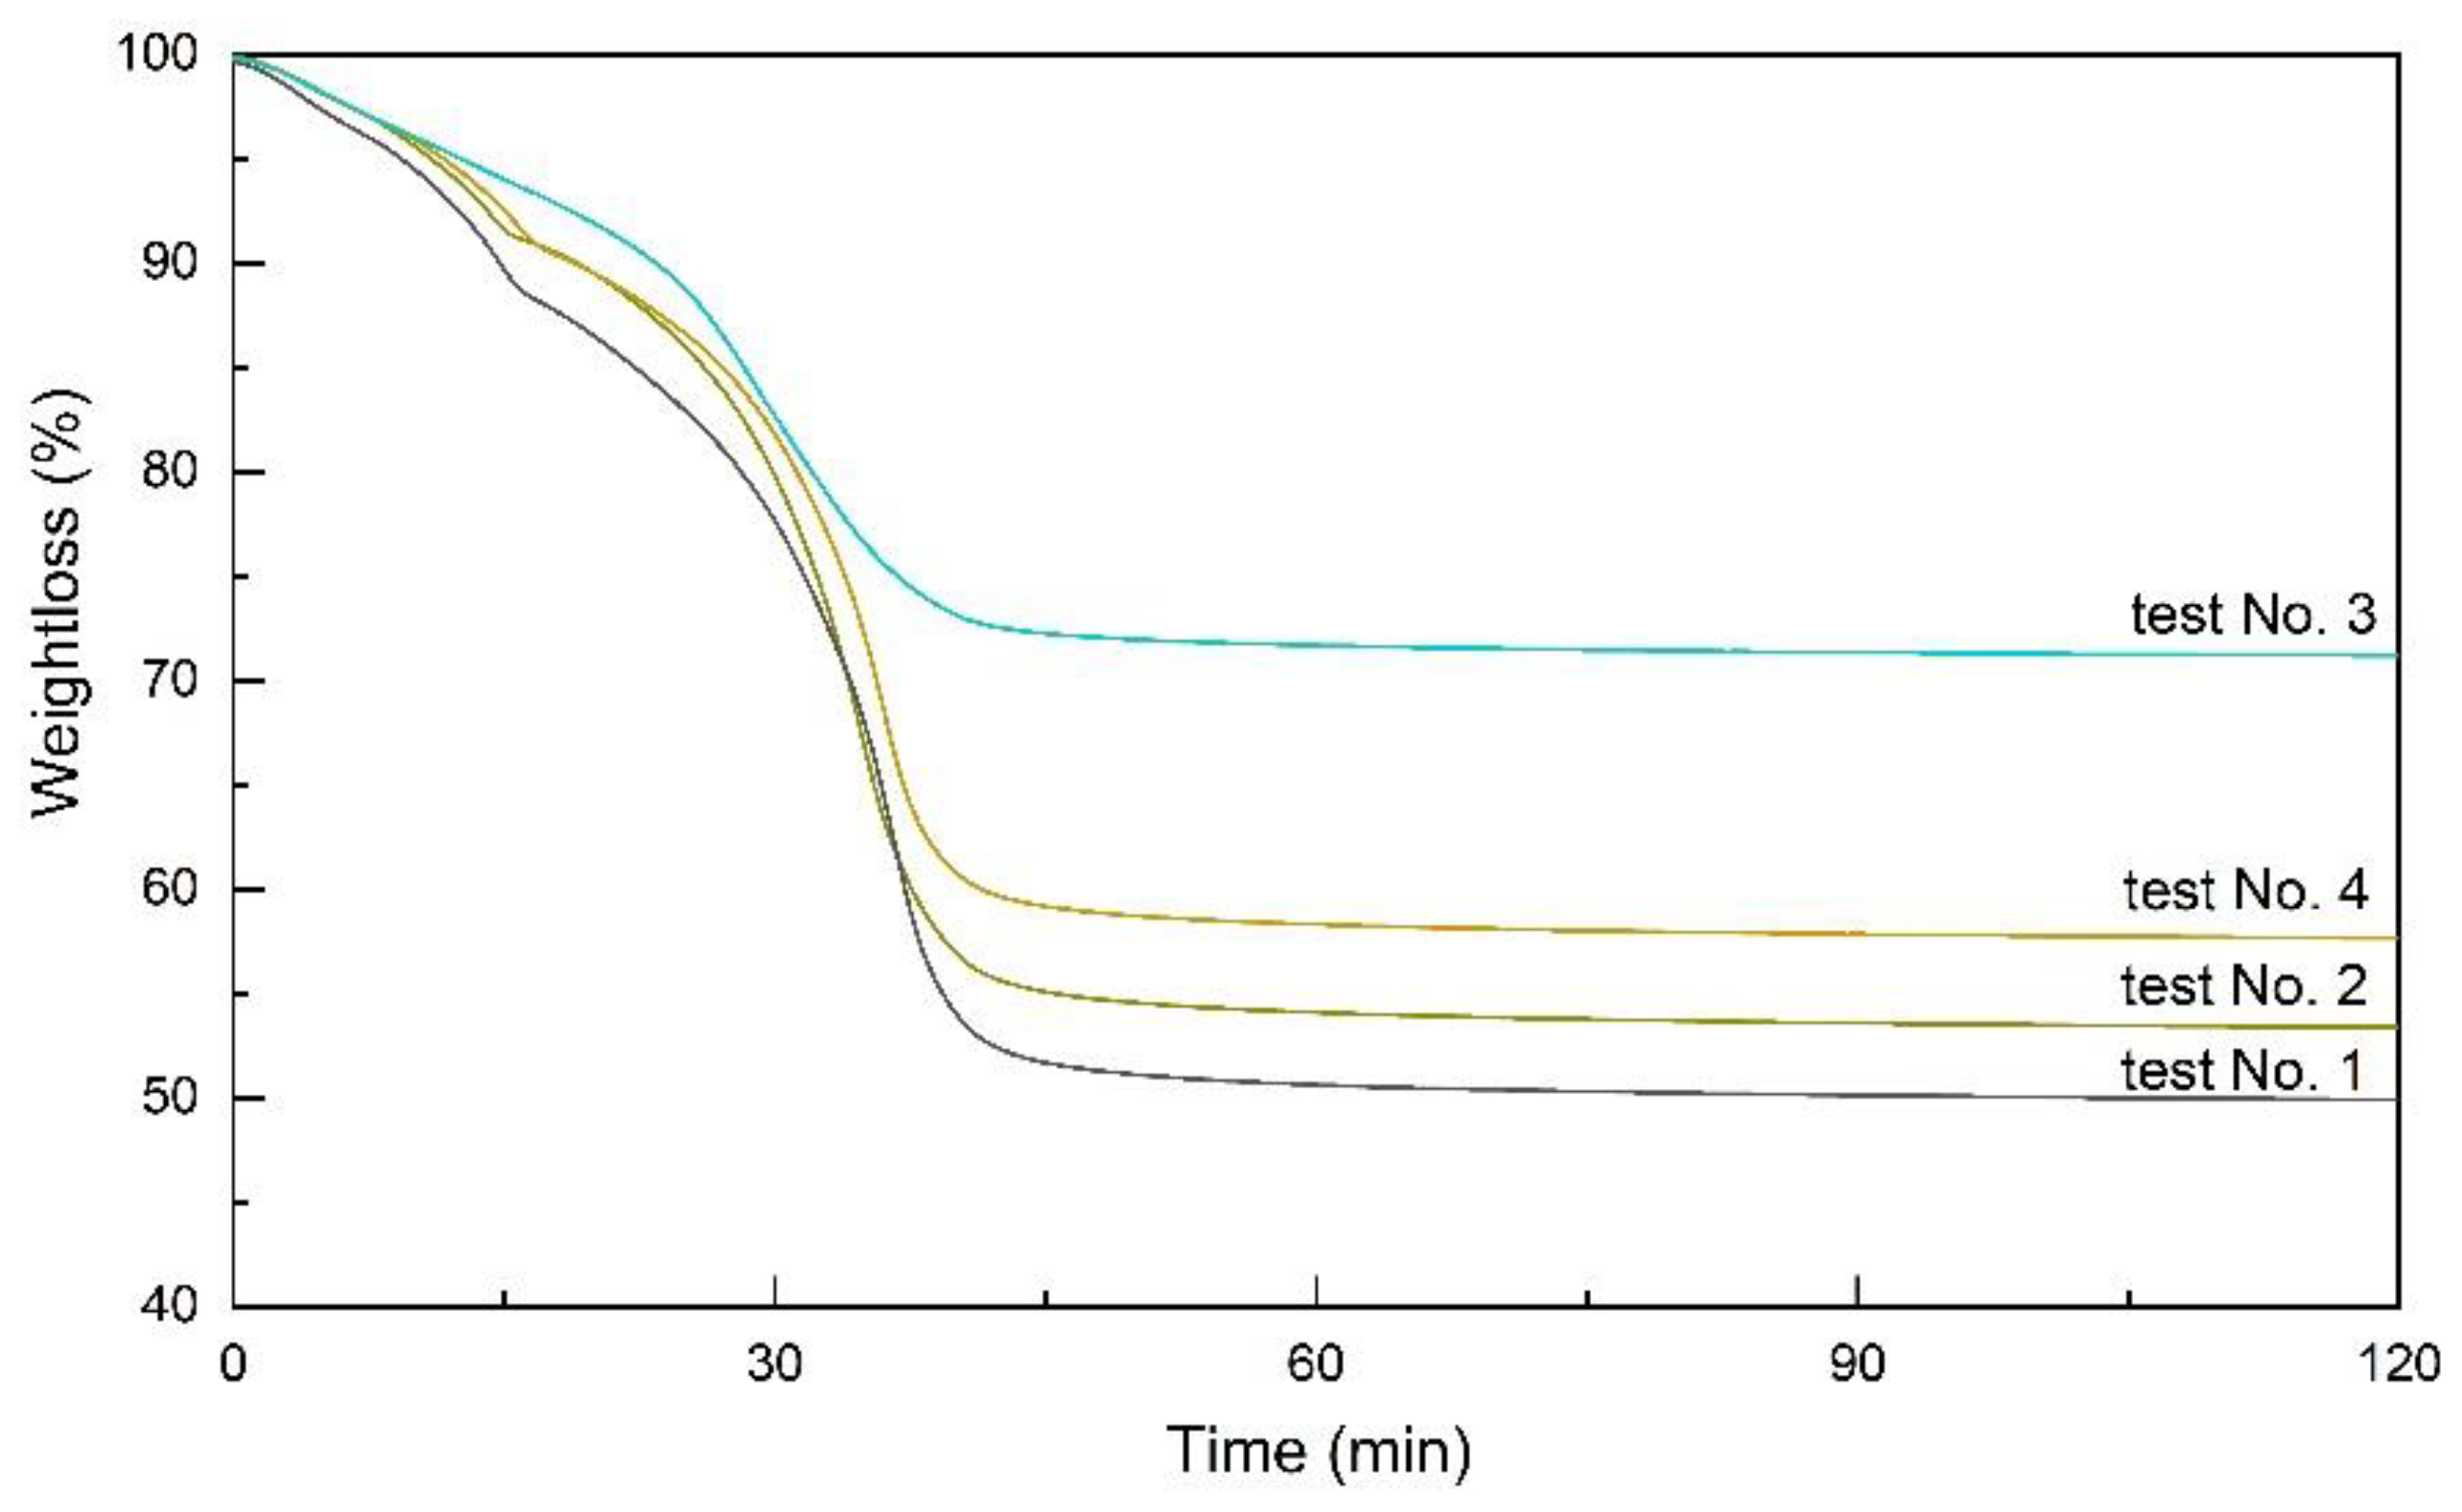
2.2.2. Test No. 1–Rehydrated and Regenerated LAB Catalyst
2.2.3. Test No. 2–Calcined LAB Catalyst
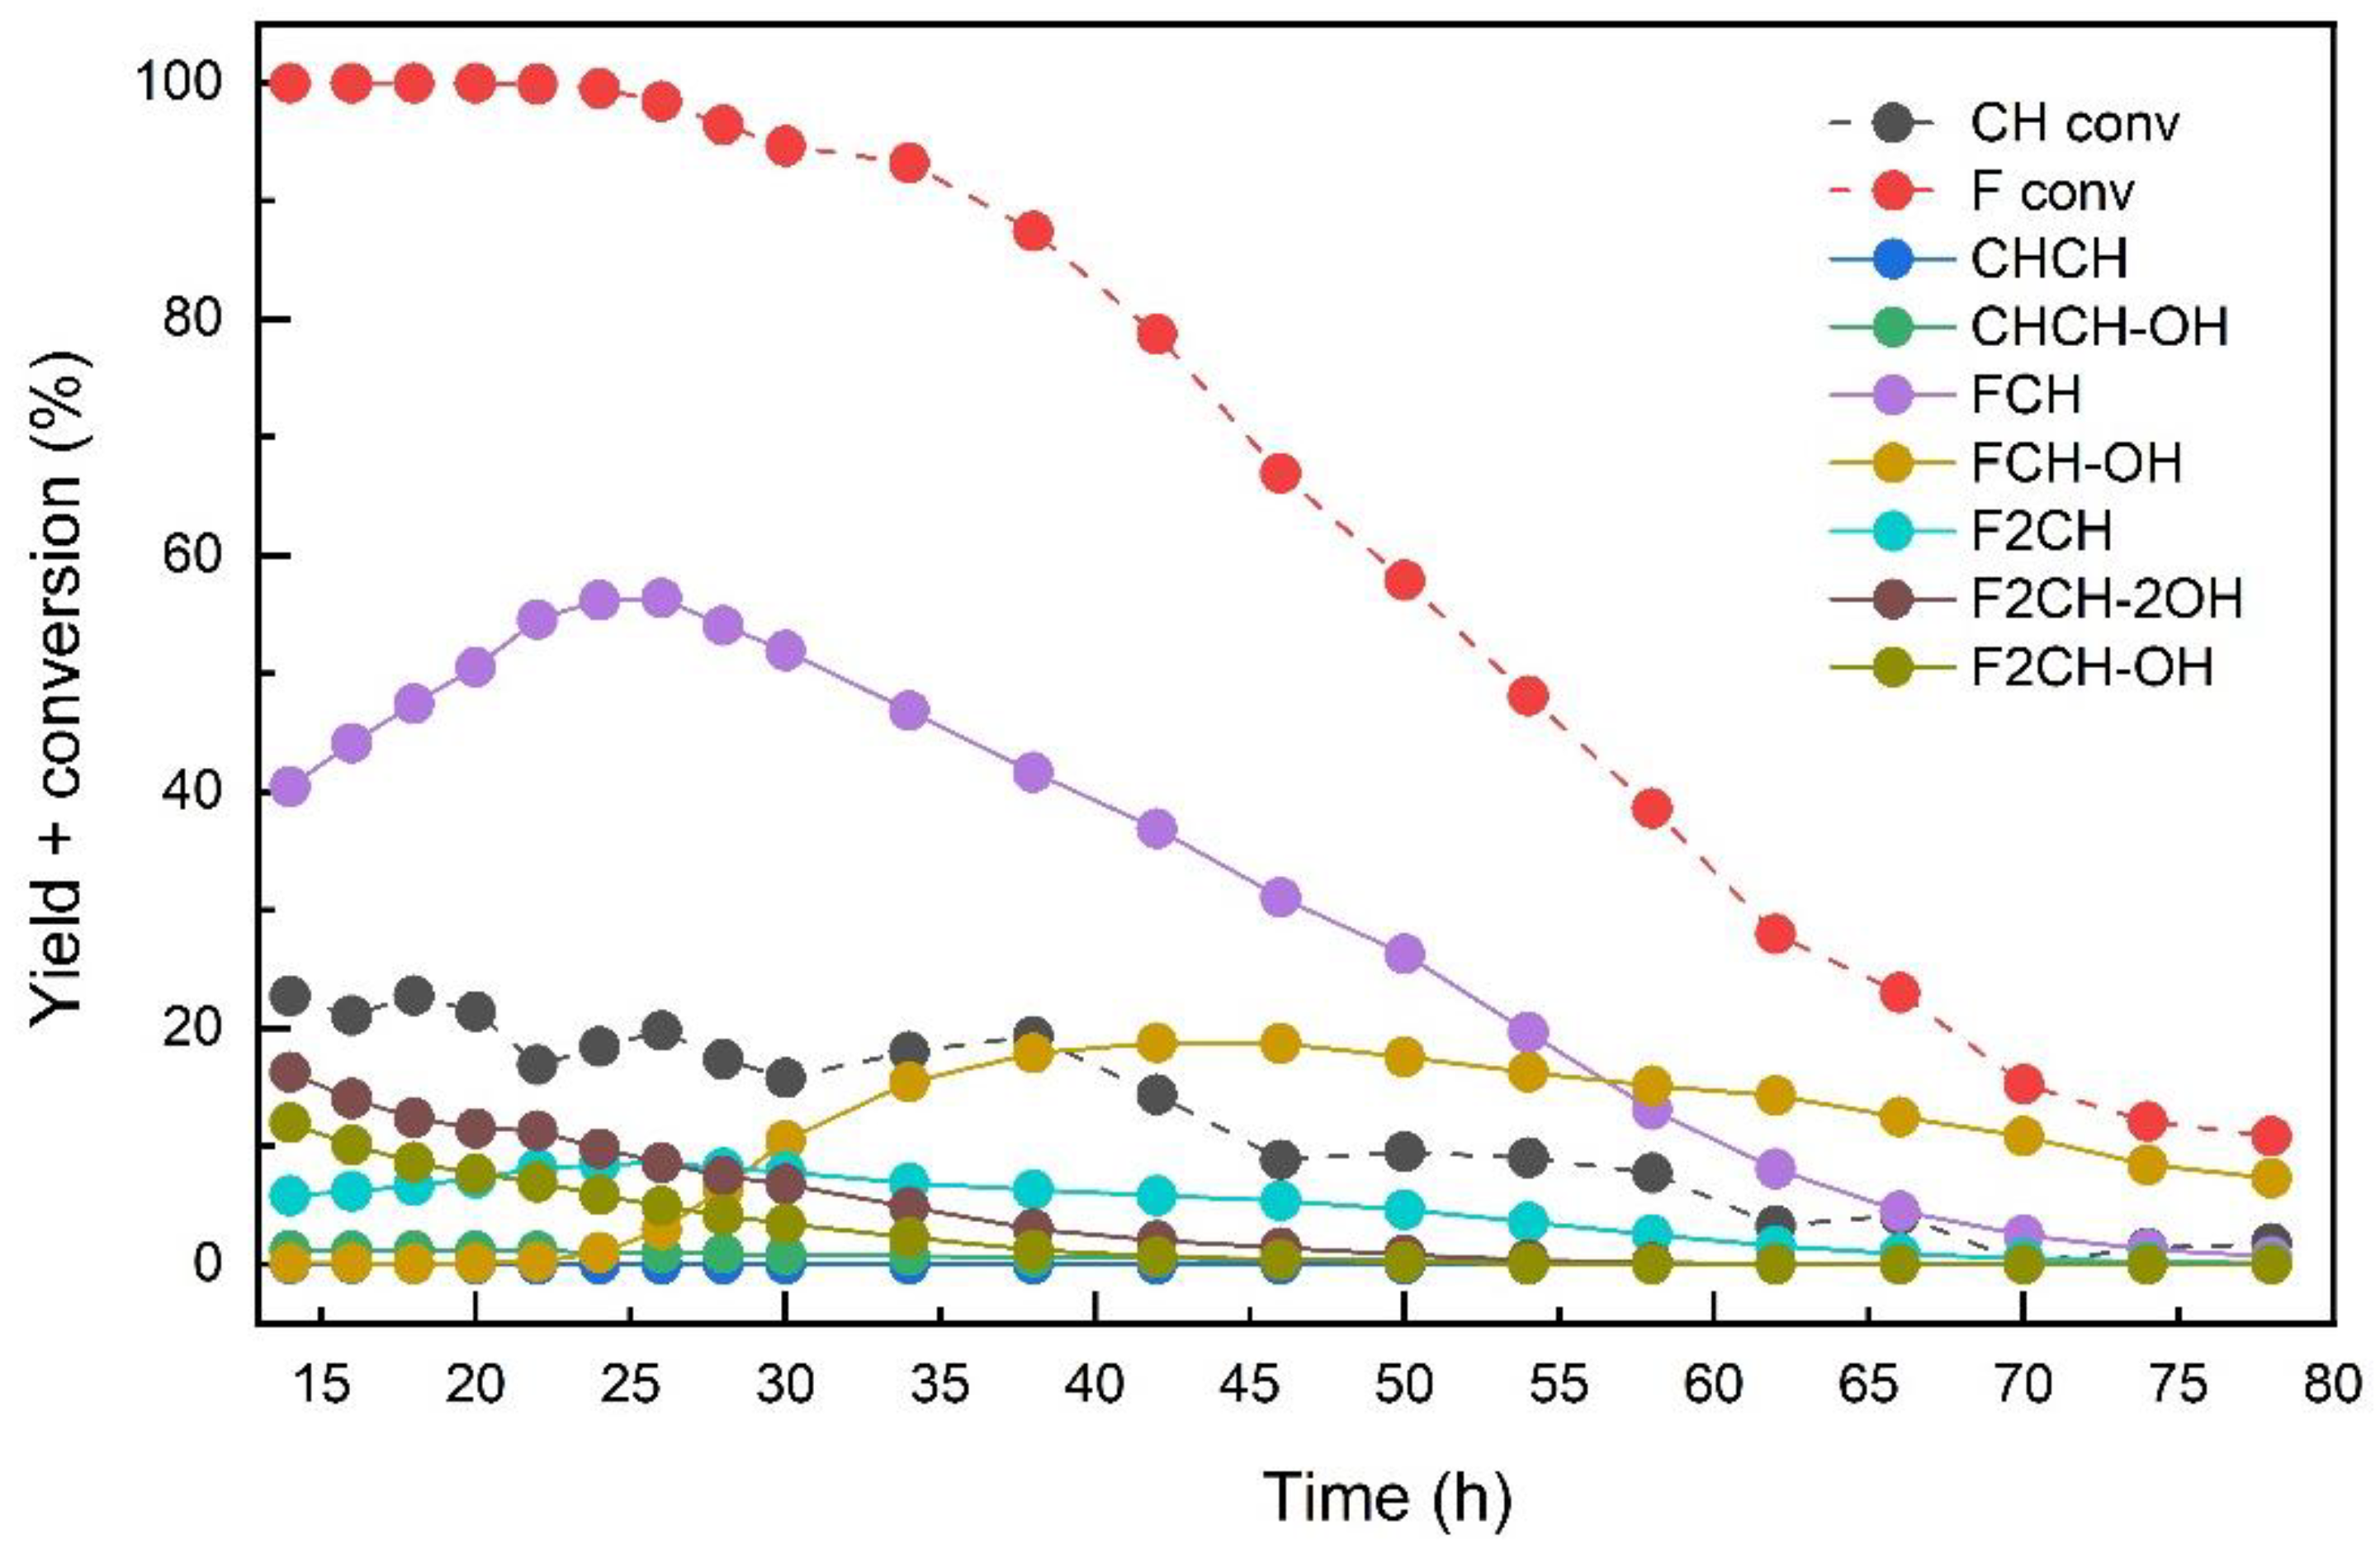
2.2.4. Test No. 3–Calcined and Regenerated COM Catalyst
2.2.5. Test No. 4–Calcined COM Catalyst with High Purity Cyclohexanone
3. Materials and Methods
3.1. Synthesis of Catalyst
3.2. Catalytic Tests
3.3. Characterisation of Precursors and Catalysts
4. Conclusions
Supplementary Materials
Author Contributions
Funding
Conflicts of Interest
References
- Huber, G.W.; Iborra, S.; Corma, A. Synthesis of Transportation Fuels from Biomass: Chemistry, Catalysts, and Engineering. Chem. Rev. 2006, 106, 4044–4098. [Google Scholar] [CrossRef] [PubMed] [Green Version]
- Huber, G.W.; Dale, B.E. Grassoline at the Pump. Sci. Am. 2009, 301, 52–59. [Google Scholar] [CrossRef] [PubMed]
- Kubička, D.; Kubičková, I.; Čejka, J. Application of Molecular Sieves in Transformations of Biomass and Biomass-Derived Feedstocks. Catal. Rev. 2013, 55, 1–78. [Google Scholar] [CrossRef]
- Somerville, C.; Youngs, H.; Taylor, C.; Davis, S.C.; Long, S.P. Feedstocks for Lignocellulosic Biofuels. Science 2010, 329, 790–792. [Google Scholar] [CrossRef] [Green Version]
- Zinoviev, S.; Müller-Langer, F.; Das, P.; Bertero, N.; Fornasiero, P.; Kaltschmitt, M.; Centi, G.; Miertus, S. Next-Generation Biofuels: Survey of Emerging Technologies and Sustainability Issues. ChemSusChem 2010, 3, 1106–1133. [Google Scholar] [CrossRef]
- Barrett, C.; Chheda, J.; Huber, G.; Dumesic, J. Single-Reactor Process for Sequential Aldol-Condensation and Hydrogenation of Biomass-Derived Compounds in Water. Appl. Catal. B Environ. 2006, 66, 111–118. [Google Scholar] [CrossRef]
- Kikhtyanin, O.; Hora, L.; Kubička, D. Unprecedented Selectivities in Aldol Condensation over Mg–Al Hydrotalcite in a Fixed Bed Reactor Setup. Catal. Commun. 2015, 58, 89–92. [Google Scholar] [CrossRef]
- Hu, X.; Wu, L.; Wang, Y.; Song, Y.; Mourant, D.; Gunawan, R.; Gholizadeh, M.; Li, C.-Z. Acid-Catalyzed Conversion of Mono- and Poly-Sugars into Platform Chemicals: Effects of Molecular Structure of Sugar Substrate. Bioresour. Technol. 2013, 133, 469–474. [Google Scholar] [CrossRef]
- Chheda, J.N.; Huber, G.W.; Dumesic, J.A. Liquid-Phase Catalytic Processing of Biomass-Derived Oxygenated Hydrocarbons to Fuels and Chemicals. ChemInform 2007, 38. [Google Scholar] [CrossRef] [Green Version]
- Dodds, D.R.; Gross, R.A. Chemicals from Biomass. Science 2007, 318, 1250–1251. [Google Scholar] [CrossRef]
- Silva, C.C.C.; Ribeiro, N.F.; Souza, M.M.; Aranda, D.A. Biodiesel Production from Soybean Oil and Methanol Using Hydrotalcites as Catalyst. Fuel Process. Technol. 2010, 91, 205–210. [Google Scholar] [CrossRef]
- Endalew, A.K.; Kiros, Y.; Zanzi, R. Inorganic Heterogeneous Catalysts for Biodiesel Production from Vegetable Oils. Biomass Bioenergy 2011, 35, 3787–3809. [Google Scholar] [CrossRef]
- Semwal, S.; Arora, A.K.; Badoni, R.P.; Tuli, D.K. Biodiesel Production Using Heterogeneous Catalysts. Bioresour. Technol. 2011, 102, 2151–2161. [Google Scholar] [CrossRef] [PubMed]
- Hora, L.; Kikhtyanin, O.; Čapek, L.; Bortnovskiy, O.; Kubička, D. Comparative Study of Physico-Chemical Properties of Laboratory and Industrially Prepared Layered Double Hydroxides and Their Behavior in Aldol Condensation of Furfural and Acetone. Catal. Today 2015, 241, 221–230. [Google Scholar] [CrossRef]
- Kikhtyanin, O.; Tišler, Z.; Velvarská, R.; Kubička, D. Reconstructed Mg-Al Hydrotalcites Prepared by Using Different Rehydration and Drying Time: Physico-Chemical Properties and Catalytic Performance in Aldol Condensation. Appl. Catal. A General 2017, 536, 85–96. [Google Scholar] [CrossRef]
- Tichit, D.; Bennani, M.N.; Figueras, F.; Tessier, R.; Kervennal, J. Aldol Condensation of Acetone over Layered Double Hydroxides of the Meixnerite Type. Appl. Clay Sci. 1998, 13, 401–415. [Google Scholar] [CrossRef]
- Figueras, F. Base Catalysis in the Synthesis of Fine Chemicals. Top. Catal. 2004, 29, 189–196. [Google Scholar] [CrossRef]
- Faba, L.; Díaz, E.; Ordóñez, S. Aqueous-Phase Furfural-Acetone Aldol Condensation over Basic Mixed Oxides. Appl. Catal. B Environ. 2012, 113–114, 201–211. [Google Scholar] [CrossRef]
- Vrbková, E.; Tišler, Z.; Vyskočilová, E.; Kadlec, D.; Červený, L. Aldol Condensation of Benzaldehyde and Heptanal: A Comparative Study of Laboratory and Industrially Prepared Mg-Al Mixed Oxides. J. Chem. Technol. Biotechnol. 2017, 93, 166–173. [Google Scholar] [CrossRef]
- Kuśtrowski, P.; Sułkowska, D.; Chmielarz, L.; Rafalska-Łasocha, A.; Dudek, B.; Dziembaj, R. Influence of Thermal Treatment Conditions on the Activity of Hydrotalcite-Derived Mg–Al Oxides in the Aldol Condensation of Acetone. Microporous Mesoporous Mater. 2005, 78, 11–22. [Google Scholar] [CrossRef]
- Kikhtyanin, O.; Lesnik, E.; Kubička, D. The Occurrence of Cannizzaro Reaction over Mg-Al Hydrotalcites. Appl. Catal. A General 2016, 525, 215–225. [Google Scholar] [CrossRef]
- Cavani, F.; Trifirò, F.; Vaccari, A. Hydrotalcite-Type Anionic Clays: Preparation, Properties and Applications. Catal. Today 1991, 11, 173–301. [Google Scholar] [CrossRef]
- Diko, M. Fourier Transform Infrared Spectroscopy and Thermal Analyses of Kaolinitic Clays from South Africa and Cameroon. Acta Geodyn. Geomat. 2015, 149–158. [Google Scholar] [CrossRef] [Green Version]
- Wahab, R.; Ansari, S.G.; Kim, Y.S.; Dar, M.A.; Shin, H.-S. ChemInform Abstract: Synthesis and Characterization of Hydrozincite and Its Conversion into Zinc Oxide Nanoparticles. ChemInform 2008, 39. [Google Scholar] [CrossRef]
- Jiang, W.; Lu, H.-F.; Qi, T.; Yan, S.-L.; Liang, B. Preparation, Application, and Optimization of Zn/Al Complex Oxides for Biodiesel Production under Sub-Critical Conditions. Biotechnol. Adv. 2010, 28, 620–627. [Google Scholar] [CrossRef] [PubMed]
- Li, J.; Yu, Y.; Zhang, L. Bismuth Oxyhalide Nanomaterials: Layered Structures Meet Photocatalysis. Nanoscale 2014, 6, 8473–8488. [Google Scholar] [CrossRef]
- Roy, D.M.; Roy, R.; Osborn, E.F. The System MgO-Al 2 O 3 -H 2 O and Influence of Carbonate and Nitrate Ions on the Phase Equilibria. Am. J. Sci. 1953, 251, 337–361. [Google Scholar] [CrossRef]
- Allegra, G.; Ronca, G. Crystal Powder Statistics. II. Line Profiles in Diffraction Spectra of Identical Crystals and of Gaussian Samples. Crystal Size Distributions. Acta Crystallogr. Sect. A 1978, 34, 1006–1013. [Google Scholar] [CrossRef]
- López-Salinas, E.; García-Sánchez, M.; Ramon-Garcia, M.L.; Schifter, I. New Gallium-Substituted Hydrotalcites: [Mg1-x Ga x (OH)2](CO3) x/2 mH2O. J. Porous Mater. 1996, 3, 169–174. [Google Scholar] [CrossRef]
- Smoláková, L.; Frolich, K.; Kocík, J.; Kikhtyanin, O.; Čapek, L. Surface Properties of Hydrotalcite-Based Zn(Mg)Al Oxides and Their Catalytic Activity in Aldol Condensation of Furfural with Acetone. Indust. Eng. Chem. Res. 2017, 56, 4638–4648. [Google Scholar] [CrossRef]
- Kadlec, D.; Tišler, Z.; Velvarská, R.; Pelíšková, L.; Akhmetzyanova, U. Comparison of the Properties and Catalytic Activity of Commercially and Laboratory Prepared Mg/Al Mixed Oxides in Aldol Condensation of Cyclohexanone with Furfural. React. Kinet. Mech. Catal. 2018, 126, 219–235. [Google Scholar] [CrossRef]


| Sample | LDH Crystallite Size D (nm) | LDH D Value (Å) | Relative Content of Crystalline Phases (%) | ||||
|---|---|---|---|---|---|---|---|
| Dried | Rehydrated | Calcined | |||||
| HTC | HTC | HTC | Dried | Rehyd | HTC | MgO | |
| COM | 196.4 | 123.8 | 40.8 | 7.81 | 7.66 | 100 | 0 |
| LAB | 163.2 | 224.4 | 38.4 | 7.84 | 7.76 | 100 | 0 |
| Sample | Specific Surface Area (m2/g) | Total Pore Volume (cm3/g) | Micropore Volume (cm3/g) | Mesopore Volume (cm3/g) |
|---|---|---|---|---|
| COM | 76.0 | 0.230 | 0.000 | 0.193 |
| LAB | 73.3 | 0.308 | 0.000 | 0.257 |
| C COM | 275.4 | 0.428 | 0.014 | 0.363 |
| C LAB | 241.9 | 0.654 | 0.007 | 0.588 |
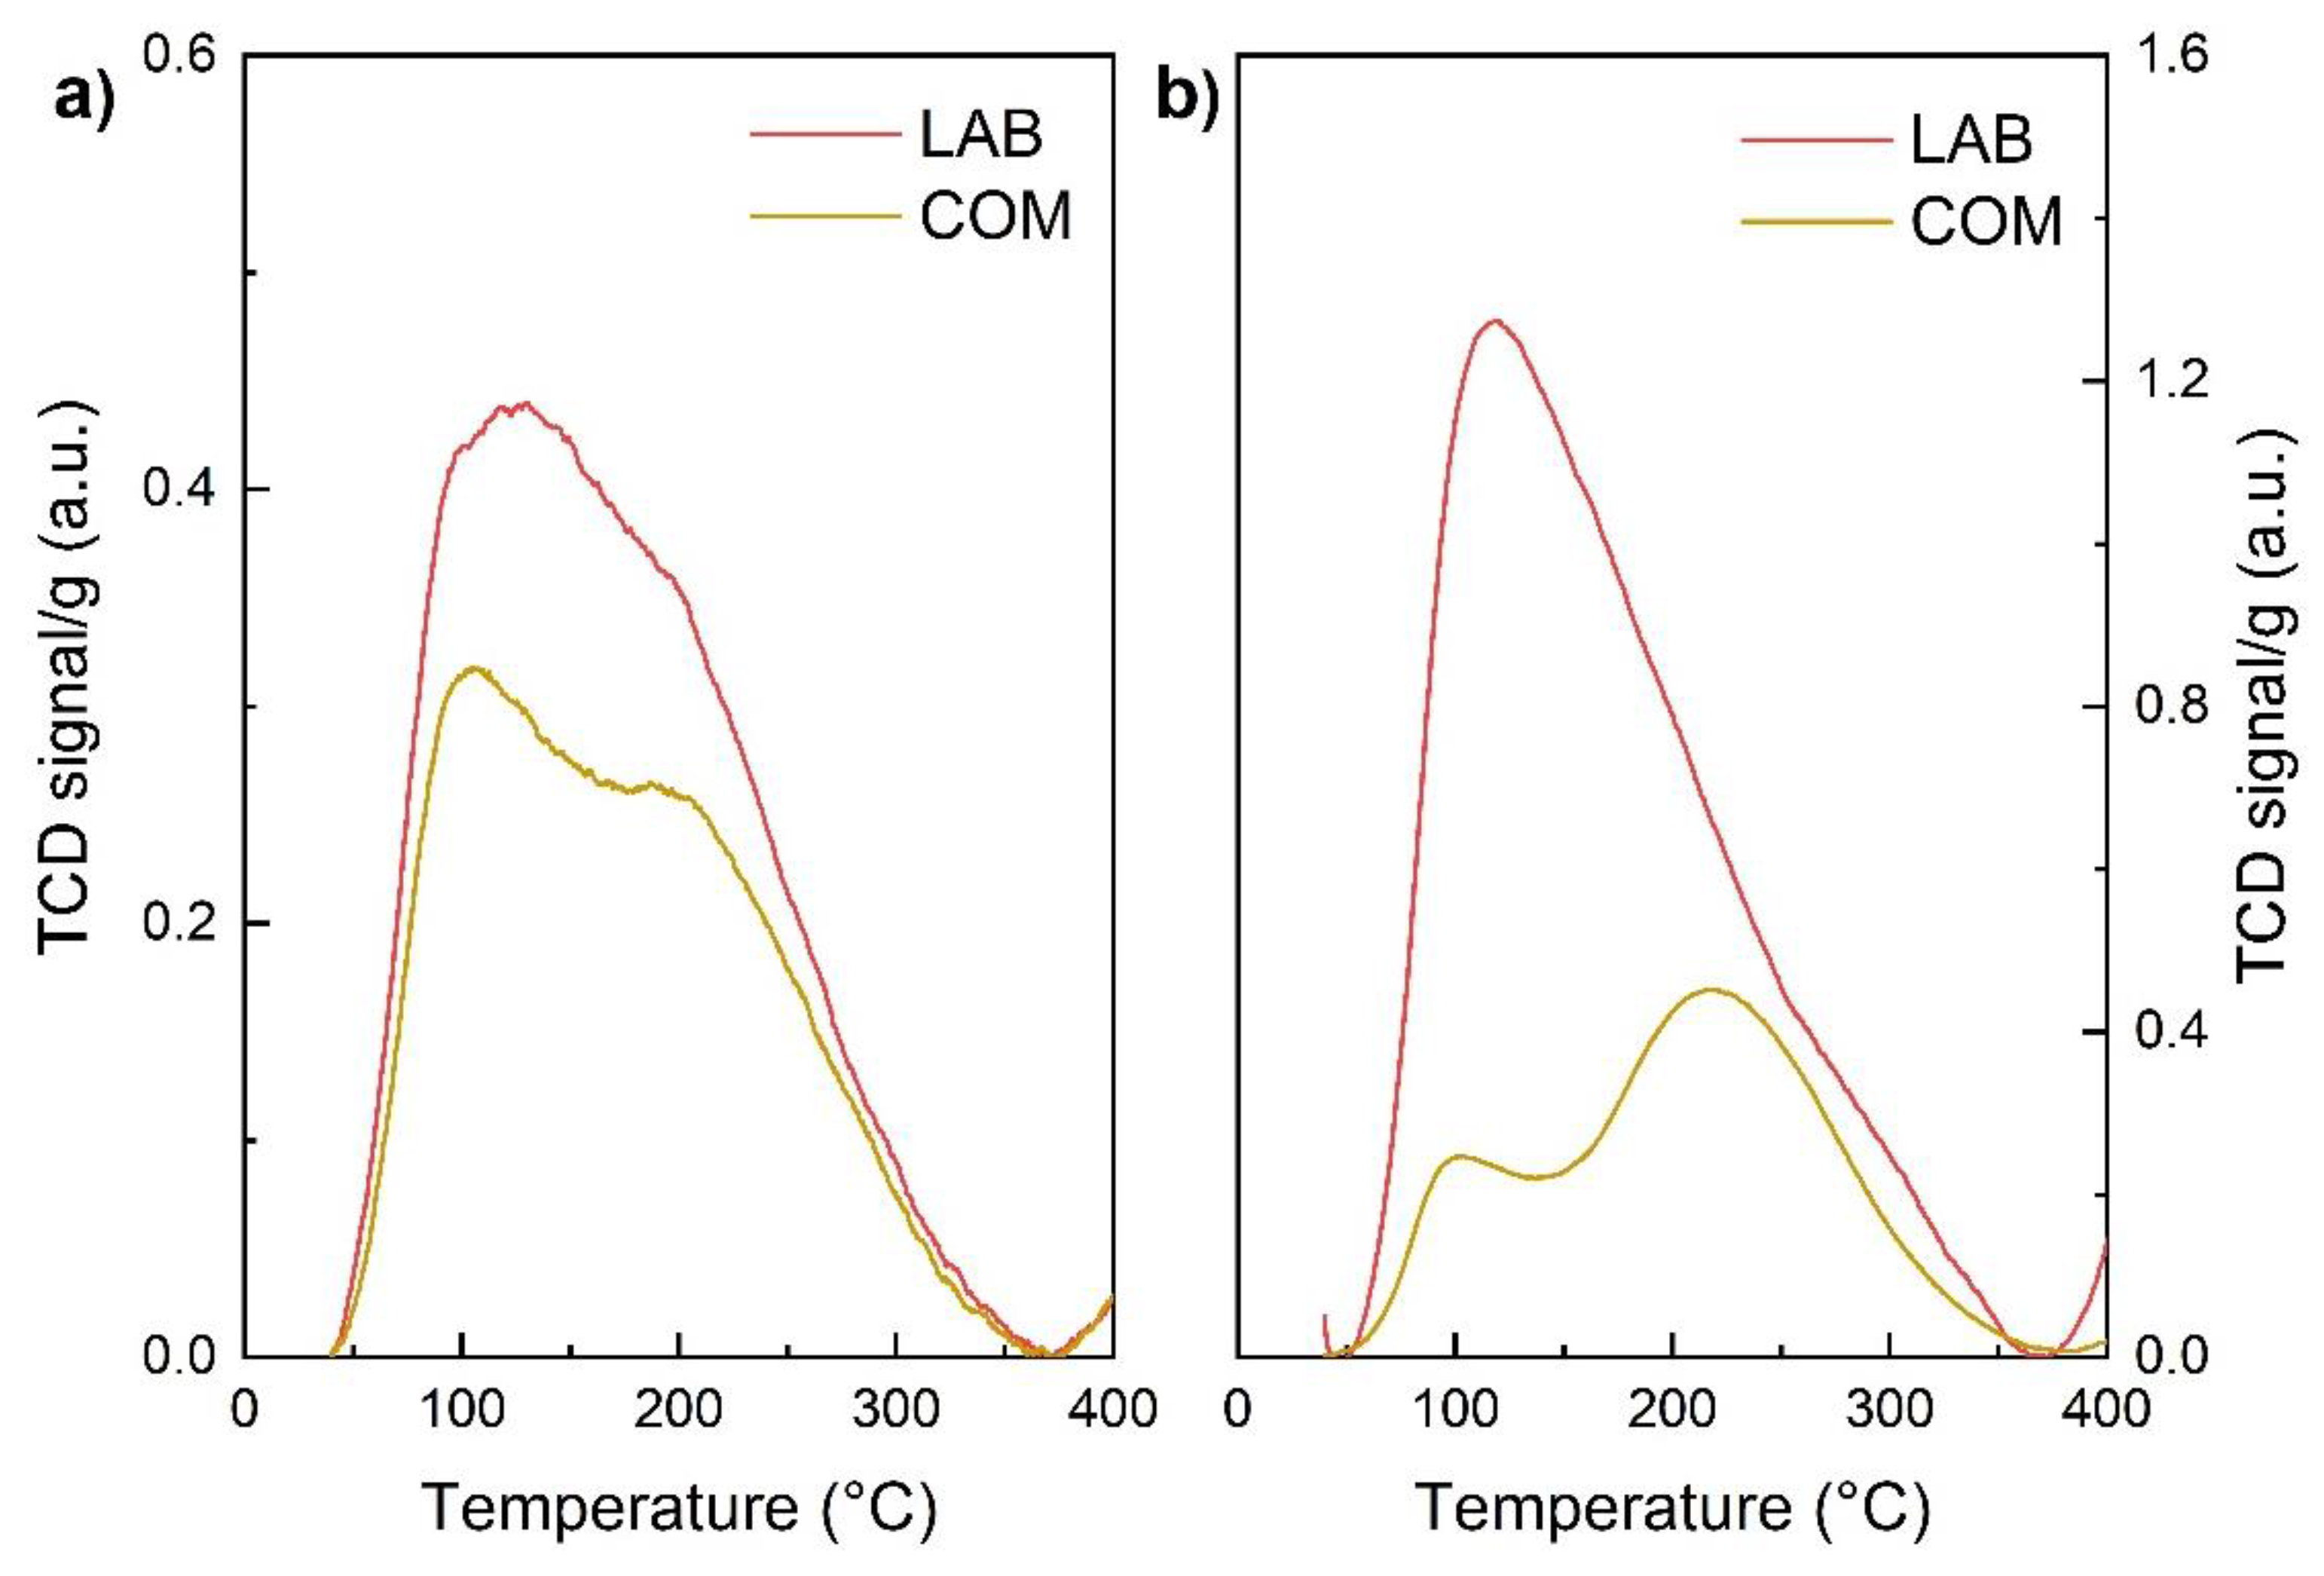
| Sample | Gas | cSUM (mmol/g) | Tmax1 (°C) | cLT (mmol/g) | Population LT (%) | Tmax2 (°C) | cHT0 (mmol/g) | Population HT (%) |
|---|---|---|---|---|---|---|---|---|
| LAB | NH3 | 0.751 | 103 | 0.347 | 46 | 193 | 0.404 | 54 |
| COM | NH3 | 0.555 | 101 | 0.255 | 46 | 208 | 0.300 | 54 |
| LAB | CO2 | 1.192 | 112 | 0.699 | 59 | 194 | 0.494 | 41 |
| COM | CO2 | 0.443 | 102 | 0.107 | 24 | 223 | 0.337 | 76 |
| No. of Test | Catalyst | Regeneration | Rehydration |
|---|---|---|---|
| 1. | LAB | YES | YES |
| 2. | LAB | NO | NO |
| 3. | COM | YES | NO |
| 4. | COM | NO | NO |
© 2019 by the authors. Licensee MDPI, Basel, Switzerland. This article is an open access article distributed under the terms and conditions of the Creative Commons Attribution (CC BY) license (http://creativecommons.org/licenses/by/4.0/).
Share and Cite
Tišler, Z.; Vondrová, P.; Hrachovcová, K.; Štěpánek, K.; Velvarská, R.; Kocík, J.; Svobodová, E. Aldol Condensation of Cyclohexanone and Furfural in Fixed-Bed Reactor. Catalysts 2019, 9, 1068. https://doi.org/10.3390/catal9121068
Tišler Z, Vondrová P, Hrachovcová K, Štěpánek K, Velvarská R, Kocík J, Svobodová E. Aldol Condensation of Cyclohexanone and Furfural in Fixed-Bed Reactor. Catalysts. 2019; 9(12):1068. https://doi.org/10.3390/catal9121068
Chicago/Turabian StyleTišler, Zdeněk, Pavla Vondrová, Kateřina Hrachovcová, Kamil Štěpánek, Romana Velvarská, Jaroslav Kocík, and Eliška Svobodová. 2019. "Aldol Condensation of Cyclohexanone and Furfural in Fixed-Bed Reactor" Catalysts 9, no. 12: 1068. https://doi.org/10.3390/catal9121068