Article

Irrigation Combined with Aeration Promoted Soil Respiration through Increasing Soil Microbes, Enzymes, and Crop Growth in Tomato Fields

1
College of Engineering, Huazhong Agricultural University, Wuhan 430070, China
2
Key Laboratory of Agricultural Soil and Water Engineering in Arid and Semiarid Areas of Ministry of Education, Northwest A & F University, Yangling 712100, China
3
College of Water Resources and Architectural Engineering, Northwest A & F University, Yangling 712100, China
*
Author to whom correspondence should be addressed.
Catalysts 2019, 9(11), 945; https://doi.org/10.3390/catal9110945
Submission received: 26 September 2019 / Revised: 26 October 2019 / Accepted: 6 November 2019 / Published: 11 November 2019
(This article belongs to the Special Issue Biomass Derived Heterogeneous and Homogeneous Catalysts)

Abstract

:
Soil respiration (Rs) is one of the major components controlling the carbon budget of terrestrial ecosystems. Aerated irrigation has been proven to increase Rs compared with the control, but the mechanisms of CO2 release remain poorly understood. The objective of this study was (1) to test the effects of irrigation, aeration, and their interaction on Rs, soil physical and biotic properties (soil water-filled pore space, temperature, bacteria, fungi, actinomycetes, microbial biomass carbon, cellulose activity, dehydrogenase activity, root morphology, and dry biomass of tomato), and (2) to assess how soil physical and biotic variables control Rs. Therefore, three irrigation levels were included (60%, 80%, and 100% of full irrigation). Each irrigation level contained aeration and control. A total of six treatments were included. The results showed that aeration significantly increased total root length, dry biomass of leaf, stem, and fruit compared with the control (p < 0.05). The positive effect of irrigation on dry biomass of leaf, fruit, and root was significant (p < 0.05). With respect to the control, greater Rs under aeration (averaging 6.2% increase) was mainly driven by soil water-filled pore space, soil bacteria, and soil fungi. The results of this study are helpful for understanding the mechanisms of soil CO2 release under aerated subsurface drip irrigation.

1. Introduction

Subsurface drip irrigation (SDI) has been largely applied in arid and semi-arid regions to supply water due to greater yield production and water-saving characteristics [1,2]. Nevertheless, a large number of wetting fronts are generated near emitters, producing ethylene and CO2, which are harmful for crop growth [3]. Aerated irrigation (AI), a modified irrigation technique that involves injecting air into soils based on SDI, has been extensively proven to improve soil aeration, thus increasing crop yields and fruit quality [4,5,6]. Even so, the effect of AI on soil environmental pollution is relatively sparse.
Soil respiration, originating primarily from heterotrophic respiration and autotrophic respiration [7,8], is a principal component in the global carbon cycle. A few studies have reported an increase of soil respiration under AI [6,9,10], while the cause of CO2 release needs to be further explored. Previously, studies on drivers of soil respiration have been largely conducted on soil water content, temperature, and the interaction of these two parameters [9,11,12,13,14]. For AI treatment, a close correlation between soil CO2 fluxes with soil water content and temperature has been confirmed [9,10]. Soil microbes and enzymes as biocatalysts for all biochemical reactions in the soil would decompose and oxidize soil organic matter [15] and intrinsically affect heterotrophic respiration, while the effect of AI on soil microbes and enzymes has been less tested [16]. Additionally, the properties of root morphology (total length, surface area, and volume) not only determine the ability of water and nutrient absorption but also determine the intensity of autotrophic respiration. Studies of root morphology under AI have been conducted in multiple crops [1,17,18,19], but the effect of AI on roots of greenhouse vegetables is still scarce. In recent years, researchers began to focus on the effects of soil microorganisms and plant growth on soil respiration [14,20,21]. However, the relationship between soil respiration and biotic components (microbes and plants) under AI remains unknown. Hence, studies of soil physical and biotic properties under AI are of critical significance to improve our mechanistic understanding of processes that release CO2 to the atmosphere.
To better understand the mechanism of soil respiration change under different irrigation levels with and without aeration, soil respiration from greenhouse tomato fields, as well as soil physical and biotic components (soil water-filled pore space, temperature, abundance of soil bacteria, fungi, and actinomycetes, soil microbial biomass carbon, soil cellulase and dehydrogenase activity, tomato root morphology, and plant dry biomass) were investigated in the present study. We hypothesized that irrigation in combination with AI would increase soil respiration, soil microbes, soil enzyme activity, and plant growth. We also hypothesized that soil respiration would be closely related to soil physical and biotic components. Our results were used to manage irrigation measures under AI for CO2 mitigation and to reveal the mechanism of soil respiration.

2. Results and Discussion

2.1. Environmental Variables

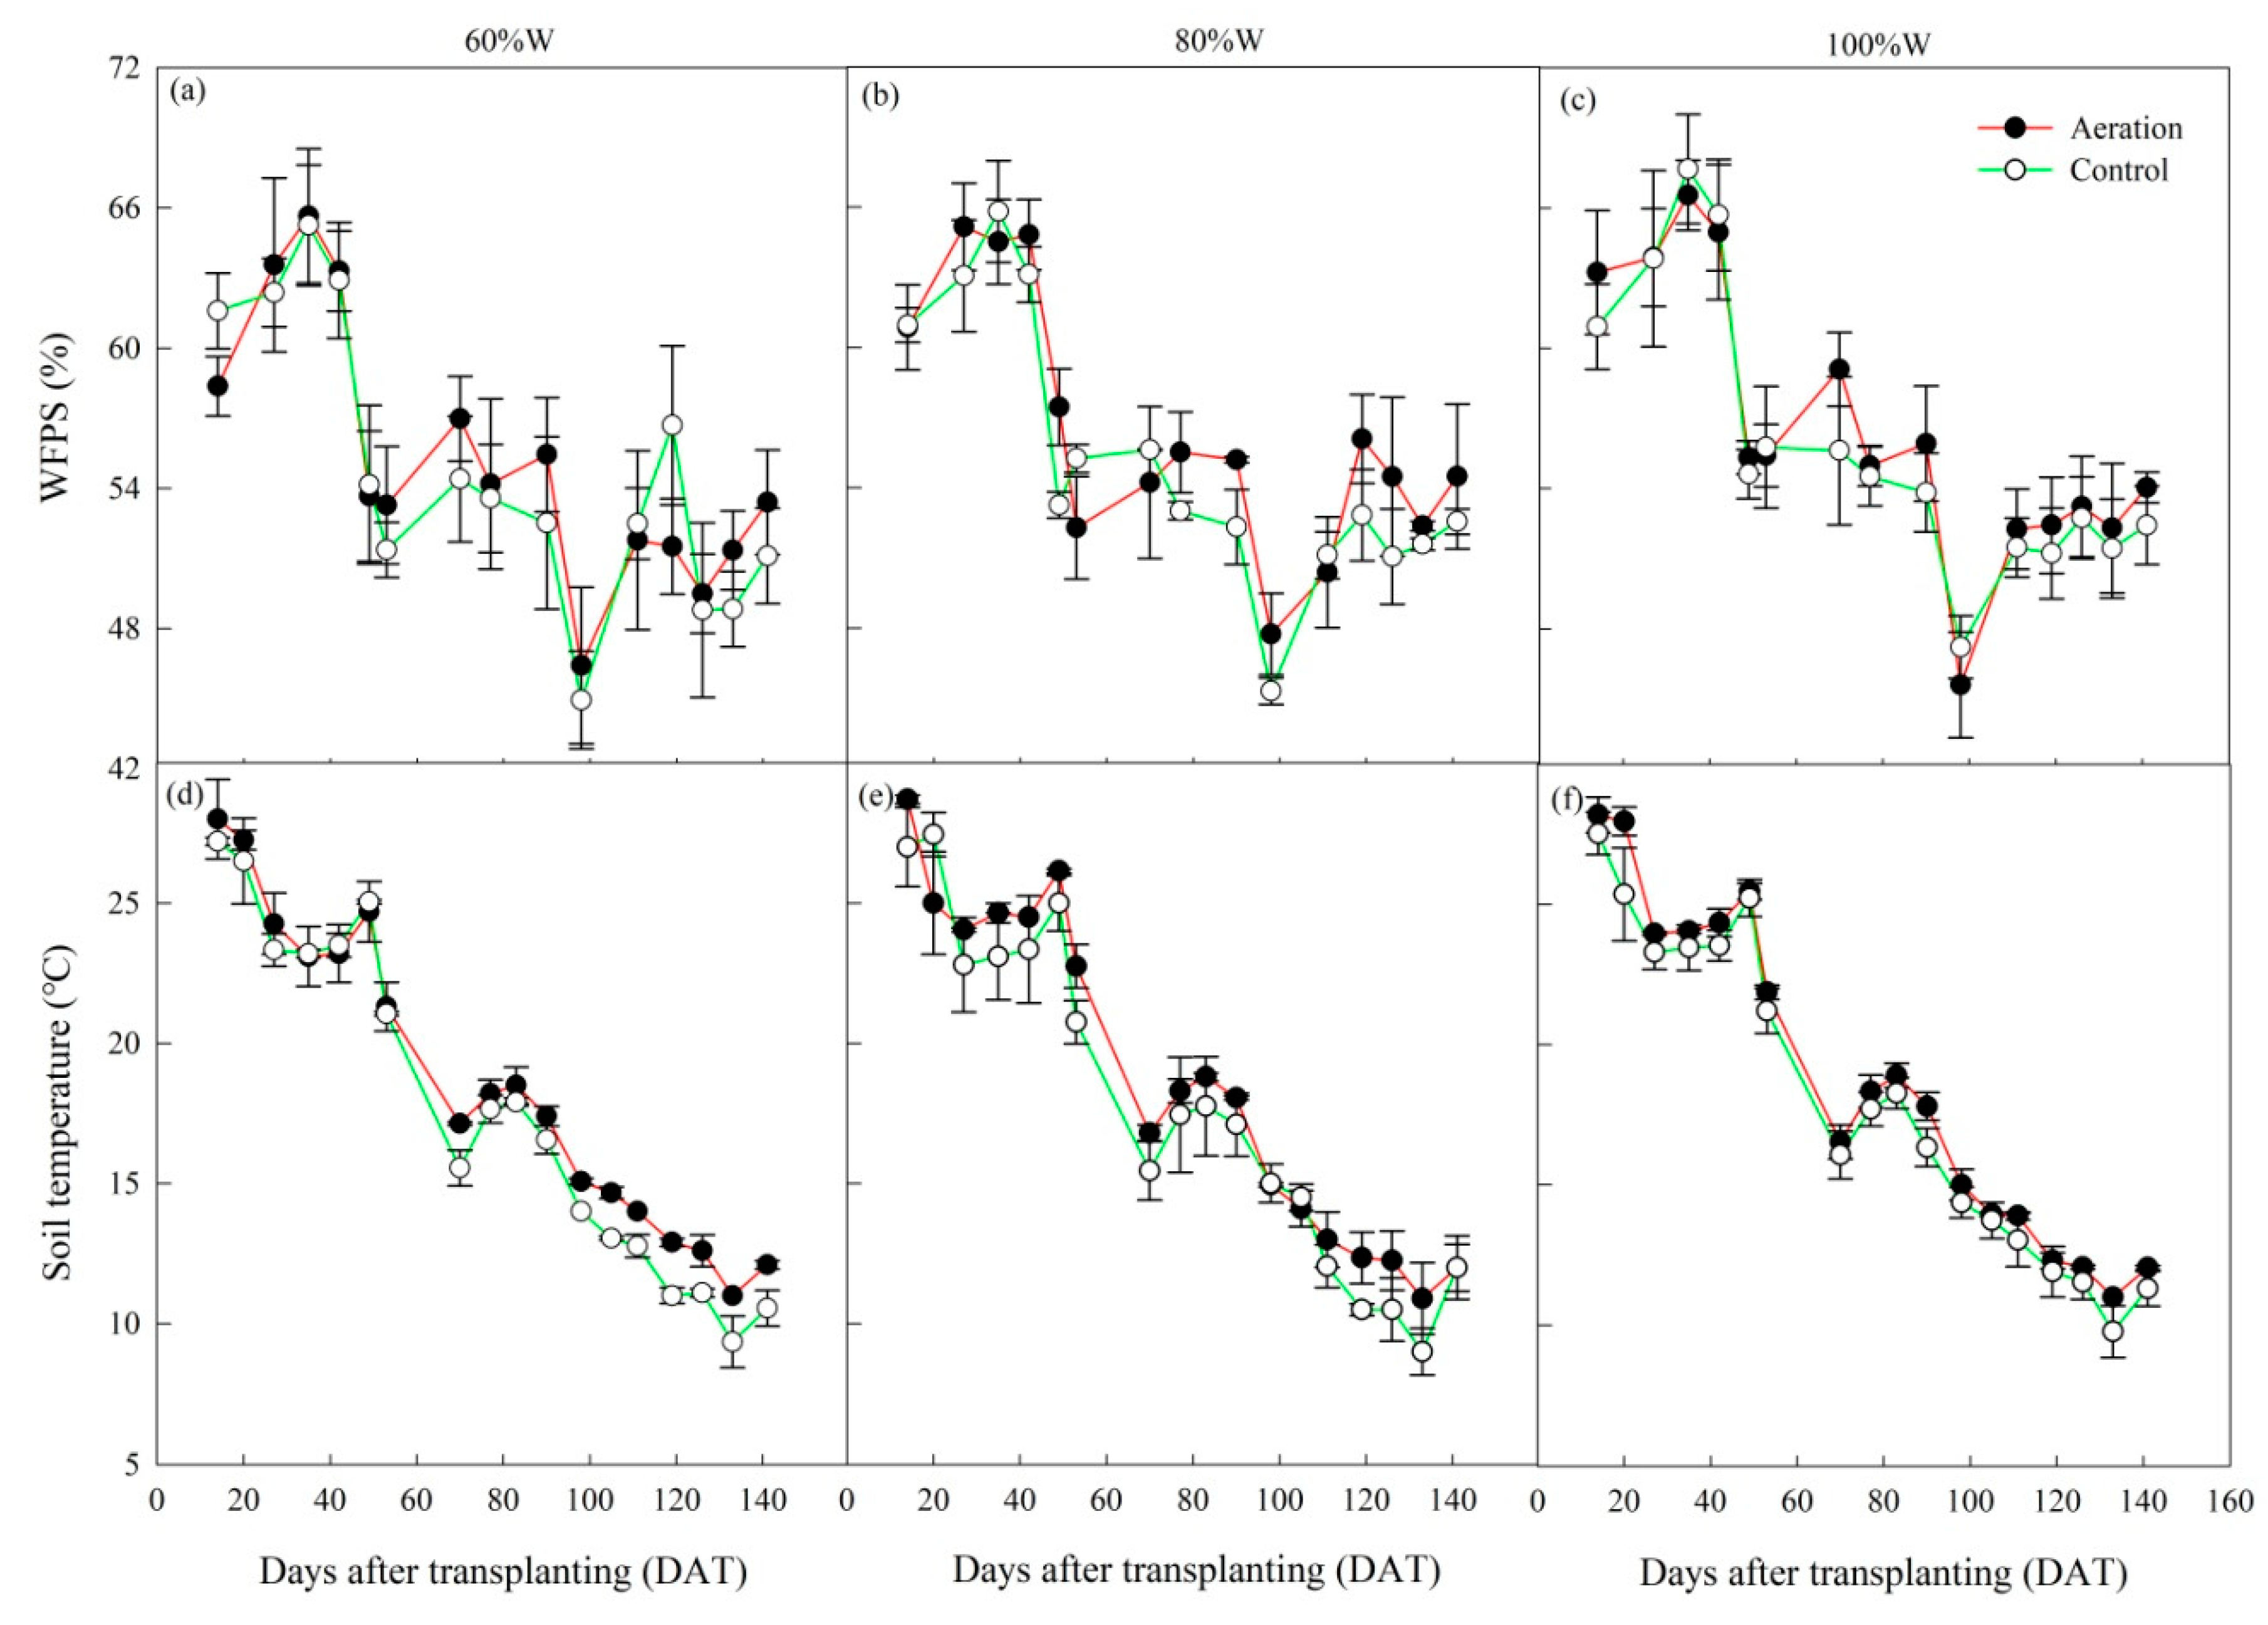
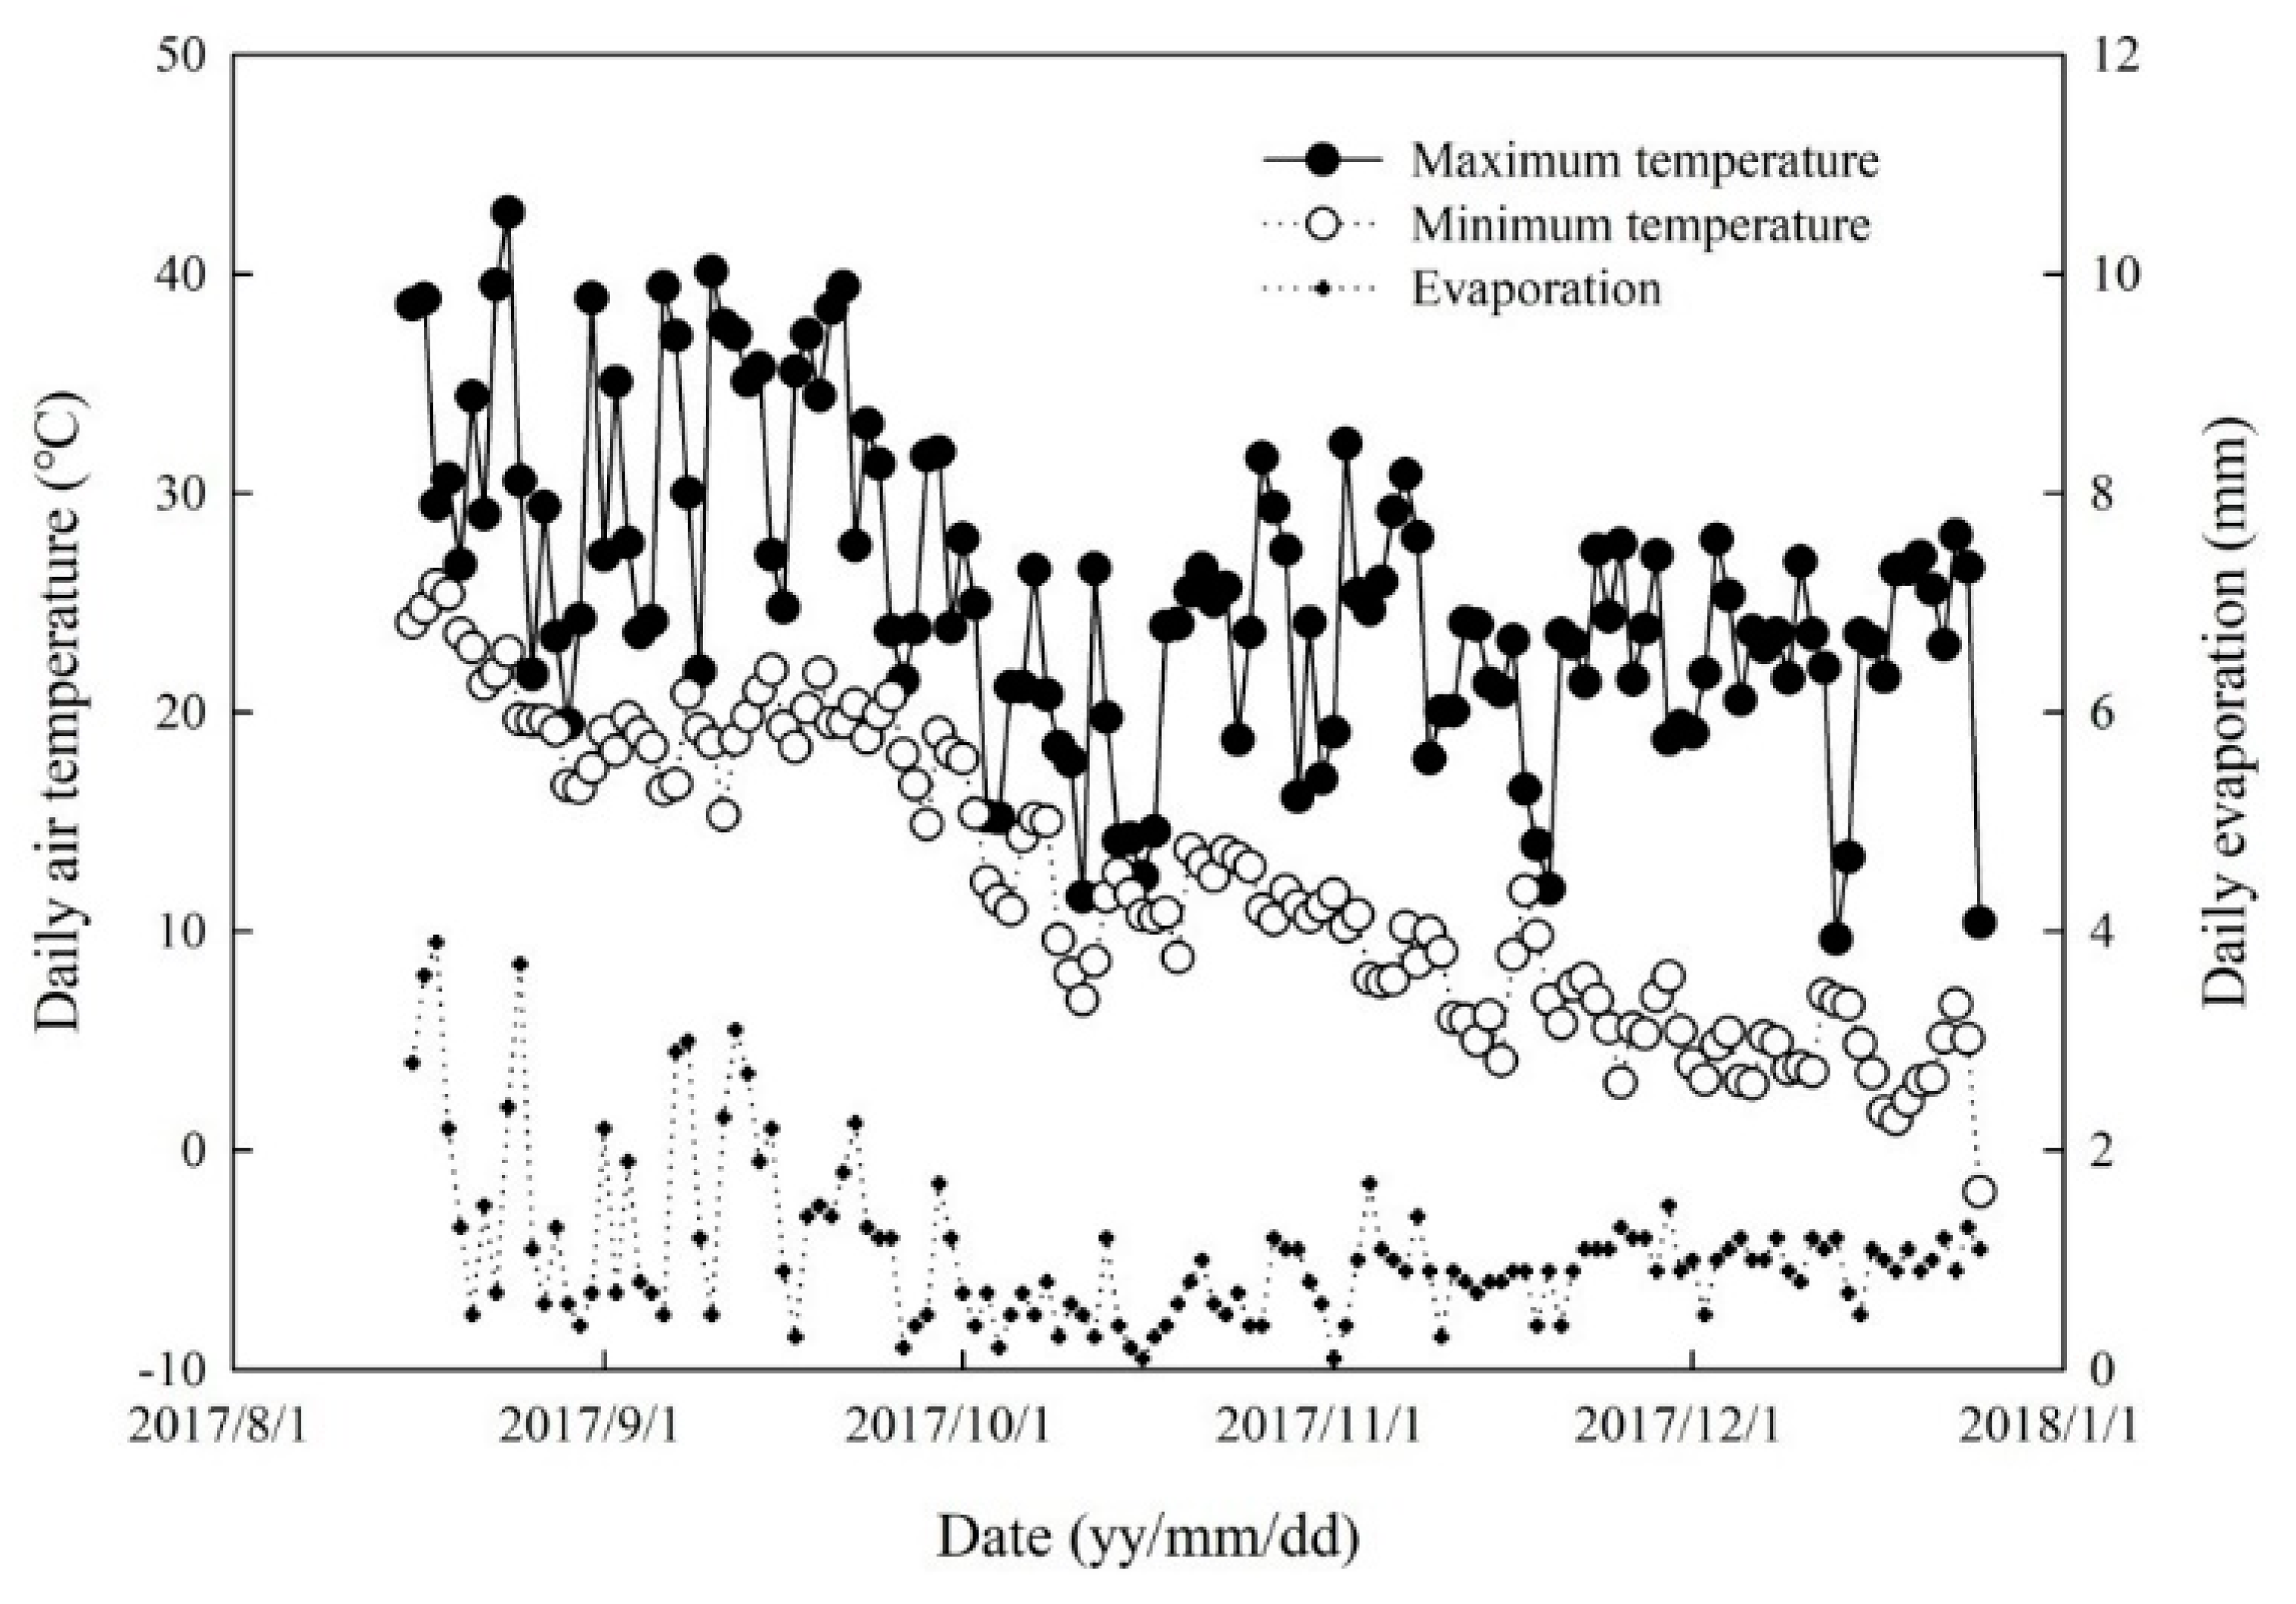
2.1.1. Soil Water-Filled Pore Space and Temperature

Soil water availability influences organic carbon decomposition, and soil temperature affects microbial growth and activity. They are considered as two major factors driving the variation of soil respiration [14].
A distinct seasonal difference of soil water-filled pore space (WFPS) and soil temperature can be observed (Figure 1). A sharp increase of WFPS occurred before 35 days after transplanting (DAT), and a decrease pattern was shown between 35 to 53 DAT. WFPS presented a total increase then decrease trend from 53 to 98 DAT. There was an upward trend of WFPS since 98 DAT (Figure 1a–c). As for soil temperature, a total decreasing trend was found throughout the whole tomato growing period except for a general increase between 35 to 49 DAT, between 70 to 83 DAT, as well as between 133 to 141 DAT (Figure 1d–f), which coincided with the seasonal patterns of air temperature. WFPS and soil temperature under aeration and high irrigation level were higher than the control and low irrigation level most of the time, which were in accordance with the findings of a previous study [9]. However, analysis of variance indicated that the effects of irrigation, aeration, and their interaction on mean WFPS and soil temperature were not significant (Table 1, p > 0.05).

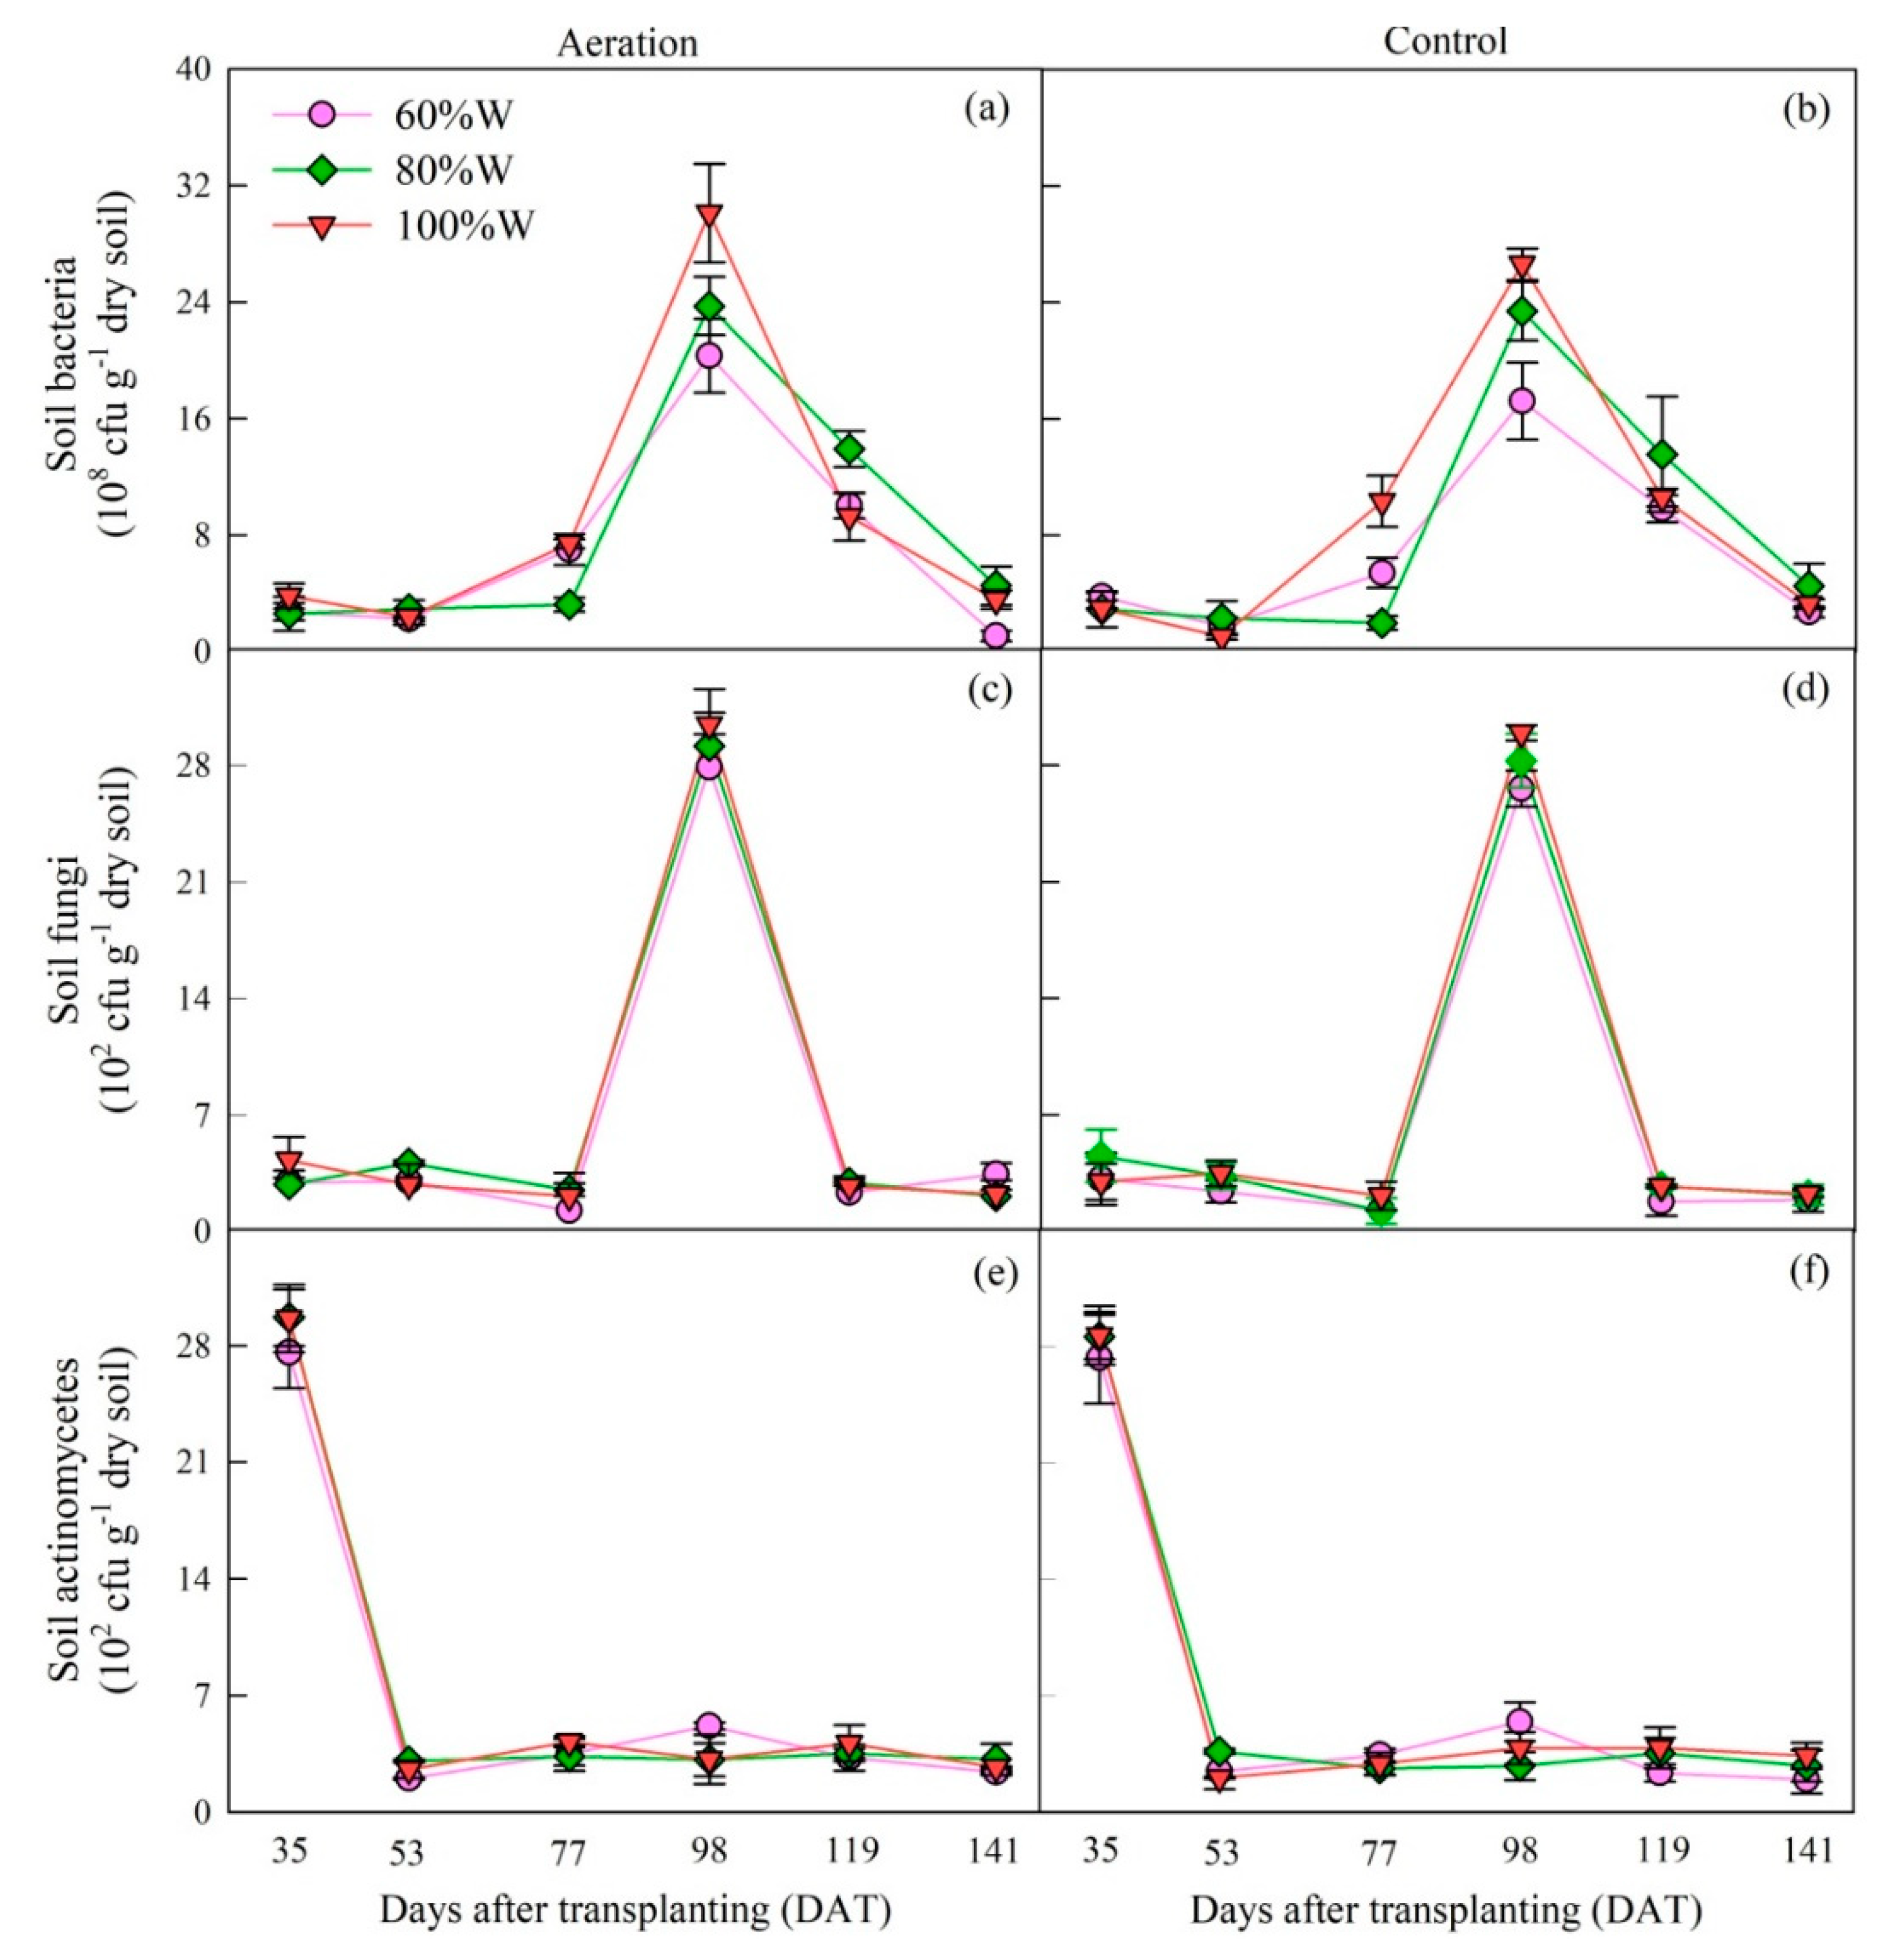
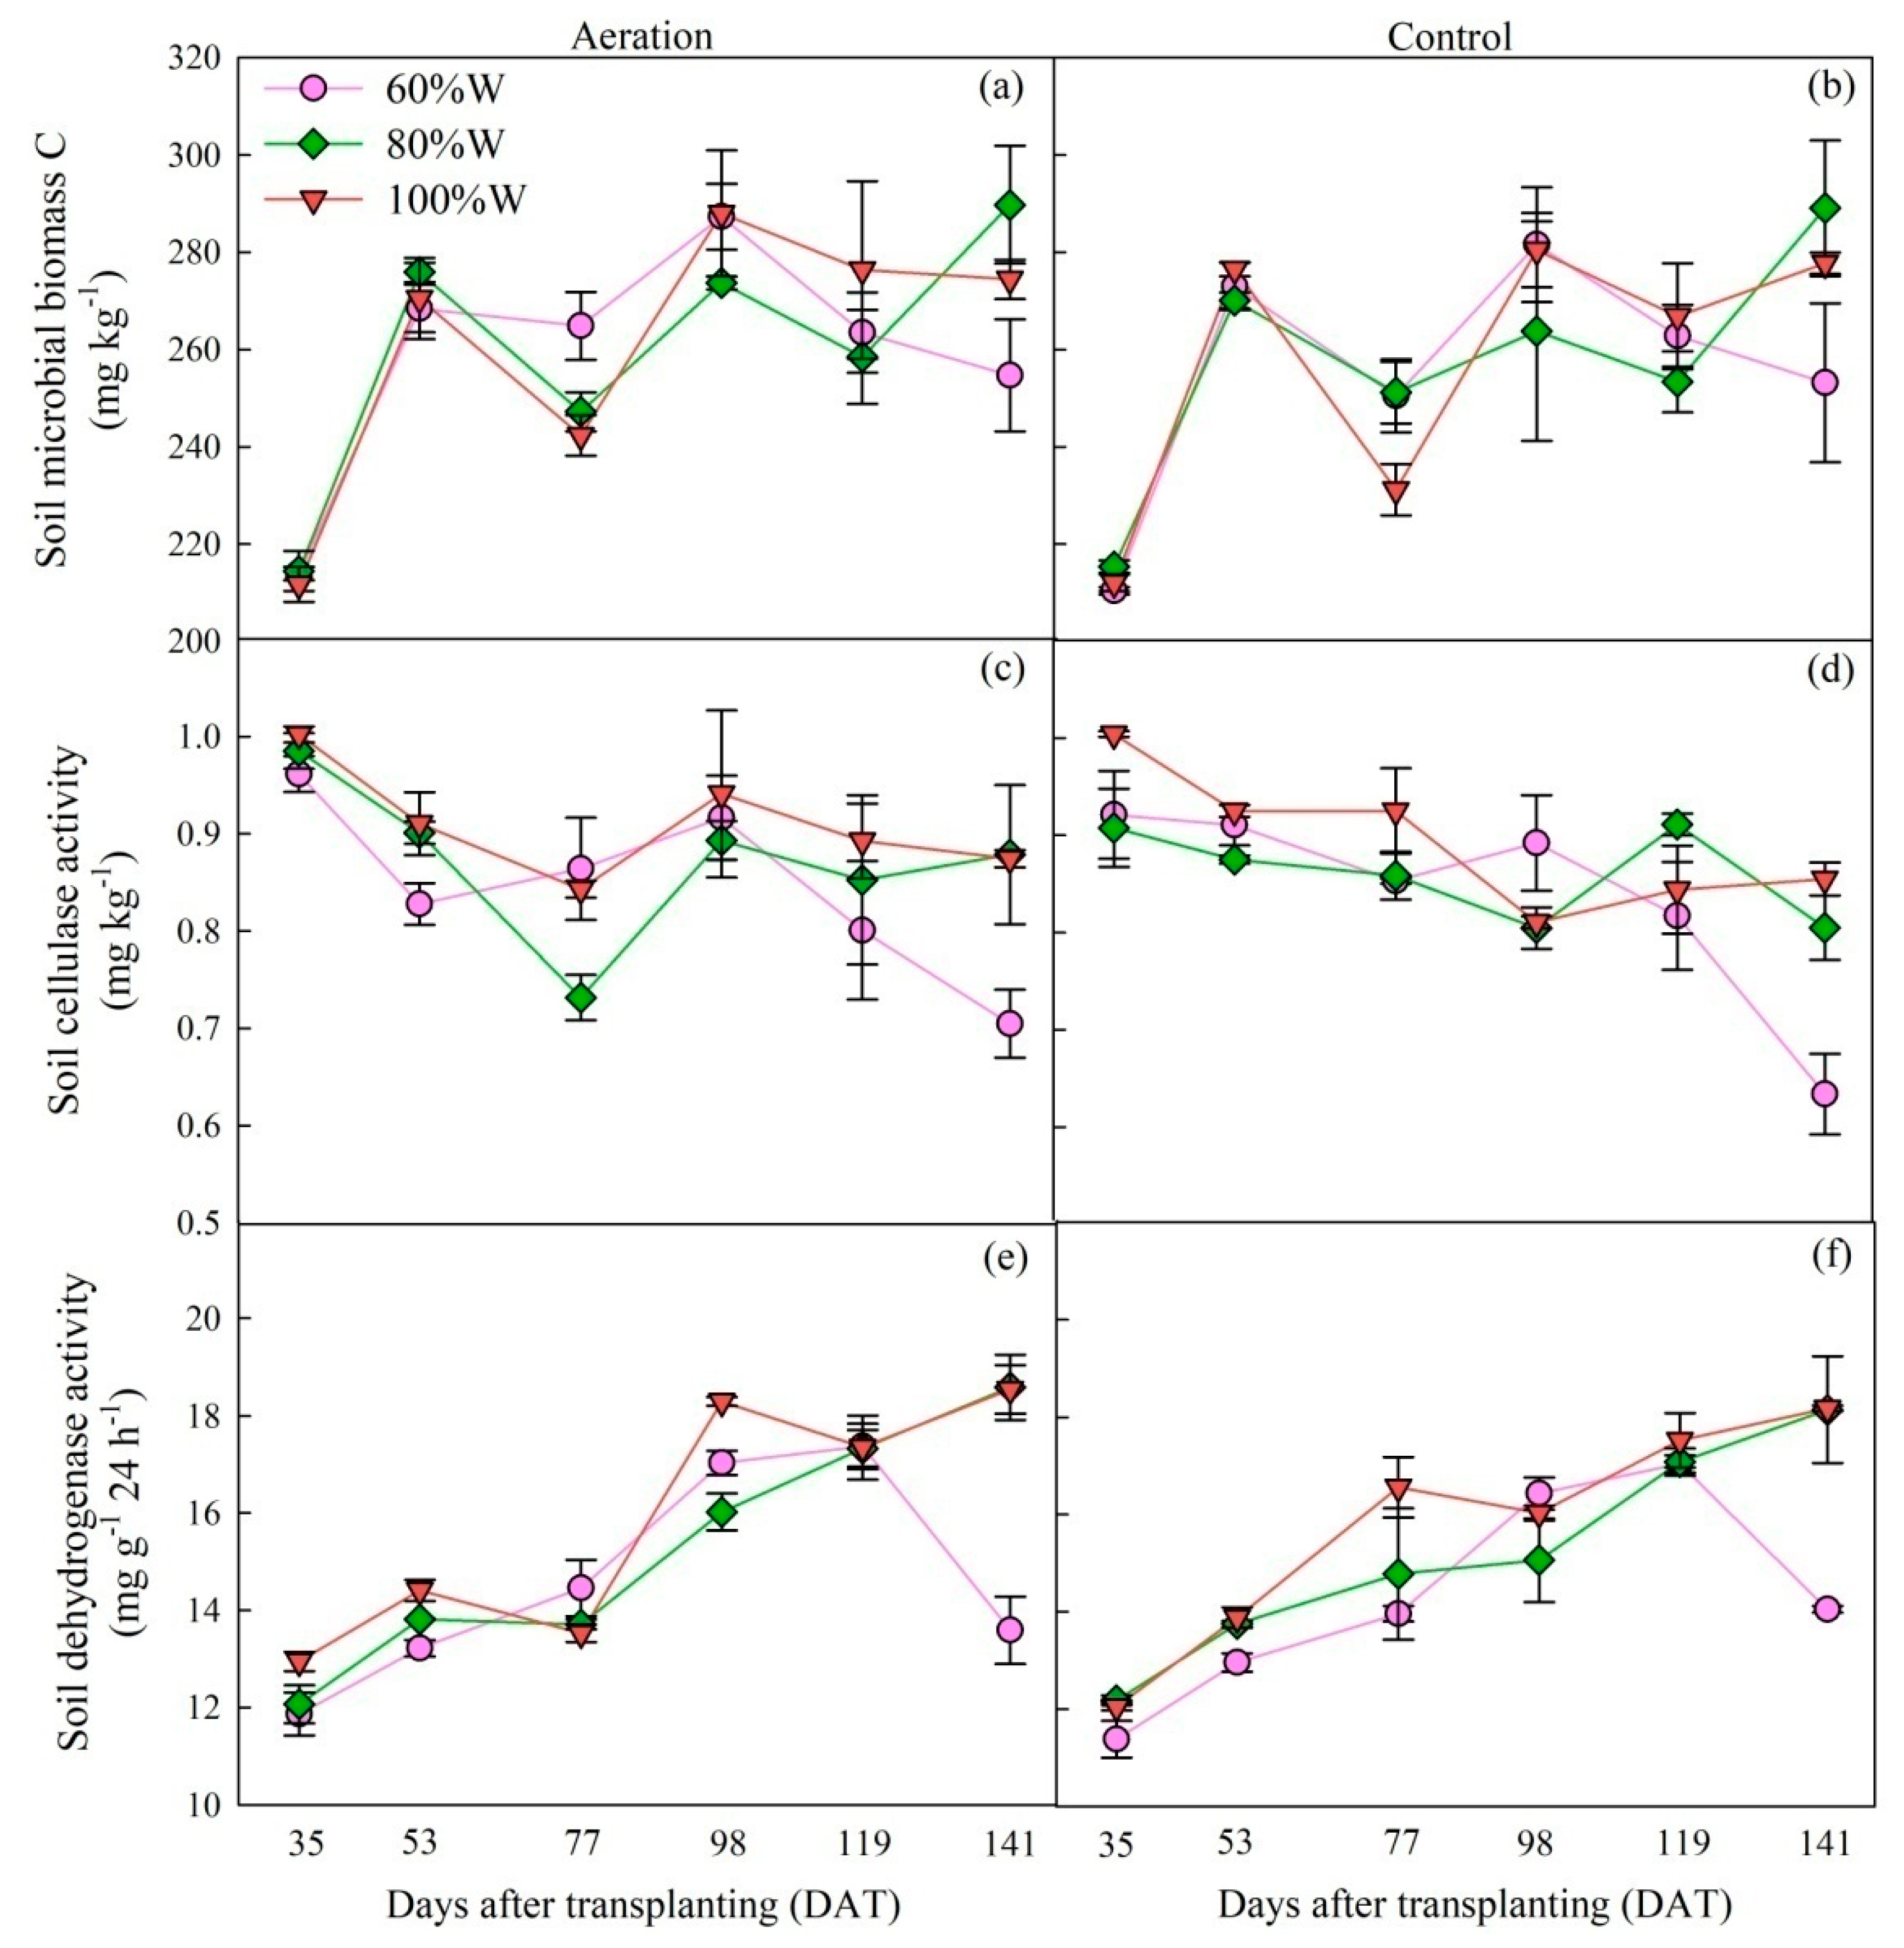
2.1.2. Soil Microbe and Enzyme Activity

Heterotrophic respiration, as a primary contributor to the soil respiration, is impacted by soil carbon-use efficiency which varies based on soil microbial abundance and richness [22]. A previous study demonstrated that the abundance of bacteria (cfub), fungi (cfuf), and actinomycetes (cfua) are involved in the soil carbon cycle by decomposing organic matter, degrading cellulose, and forming antibiotic substances [16]. Soil microbial biomass carbon (MBC), which affects the transformation of all organic matter entering the soil, is the key and driving force of the nutrient and energy cycle in the whole ecosystem and is also an important source and reservoir of soil nutrient transformation. Soil cellulose activity (CA), which participates in the decomposition and release of CO2 from soil organic substances, is the main enzyme activity in soil carbon cycle. Soil dehydrogenase activity (DHA), which catalyzes dehydrogenation of organic substances and plays an intermediate role in hydrogen transformation and transfer, can be used as an indicator of the microbial redox system and is considered to be a global indicator of microbial metabolic activity in soil. However, soil biological activity can be limited by many factors, i.e., soil water and soil aeration conditions [23,24]. Very few pieces of literature were concerned with the soil microbes under AI [23,25], and the effect of AI on MBC, CA, and DHA have rarely been reported. Hence, study of the soil microbe and enzyme activity (cfub, cfuf, cfua, MBC, CA, and DHA) has great significance to reveal the mechanism of CO2 release under AI.
As seen in Figure 2, cfub made up the majority of soil microbes, followed by cfua and cfuf, which was generally supported by the results of Li et al. [16] and Zhu et al. [25]. Nevertheless, the microorganism abundance in the study of Zhu et al. [25] were greater than the values of the current research (Figure 2), which was influenced by higher soil temperature in their study (their study vs. our study = 18–32 °C vs. 9–29 °C). Furthermore, there were different results about the changing trends of soil microbes in the tomato growing period. Zhu et al. [25] pointed out that cfub, cfuf, and cfua integrally presented an increase pattern. Chen et al. [26] concluded that cfuf and cfua showed an initial increase then decrease trend, and peaks were observed on 50 d. In our study (Figure 2), the number of cfub as a function of the days after transplanting was normally distributed, with the highest values observed on 98 DAT (Figure 2a,b). The number of cfuf peaked on 98 DAT, and the values during other periods were relatively stable (Figure 2c,d). The number of cfua peaked on 35 DAT, but remained at a relatively constant level during other periods (Figure 2e,f). The differences of changing patterns could have resulted from the combined effects of the availability of different rhizosphere secretions and substrates, changes of soil moisture, temperature, and fertility, as well as plant growth. Soil microbial abundance (especially for cfub and cfuf, Figure 2) peaked when soil hydrothermal conditions were good (Figure 1) and crops were growing vigorously on 98 DAT. Peaks of cfua during the early tomato growing period (on 35 DAT) were probably ascribed to the highest WFPS (64.5%–67.7%) and greater soil temperature (23.1–24.7 °C), as well as greater soil substrates resulted from base fertilizer application [9]. Compared with the control, aeration under each irrigation level slightly increased mean values of cfub, cfuf, and cfua (Table 1, p > 0.05), with average increases of 4.6%, 5.5%, and 3.4%, respectively. Similar results were also reported by Li et al. [16], Du et al. [23], and Zhu et al. [25]. The increases of soil microbes under the aeration were likely due to the frequent alternation of soil dry and wet zones, thereby enhancing soil nutrient mineralization to improve microbial growth. Additionally, in line with previous researches [24,25], cfub, cfuf, and cfua in this study increased as irrigation amount increased (Figure 2), which was in order of 60% full irrigation (W) level without aeration (S) (W0.6S) < 80%W irrigation level without aeration (W0.8S) < 100%W irrigation level without aeration (W1.0S). The enhancement of soil microbes under aeration or high irrigation level was also probably ascribed to greater temperature (Figure 1d–f), which stimulated more microbial growth and activity [14].
MBC generally exhibited an initial increase followed by a volatility within the range of 210.43 to 289.75 mg·kg−1 throughout the whole tomato growing period (Figure 3a,b). Across all sampling periods, CA among treatments varied from 0.63 to 1.00 mg·kg−1 and peaked on 35 DAT except for W0.8S treatment on 119 DAT (Figure 3c,d). Contrary to the changing rule of CA, DHA generally increased throughout the tomato growing period (Figure 3e,f). The changing patterns of soil enzyme activities were primarily because soil enzymes were correlated with the growth stages, soil texture, soil water content, soil temperature, air availability, and other factors [16]. Compared with the control, mean MBC, CA, and DHA under the aeration were slightly greater (Table 1, p > 0.05). As noted by Li et al. [16], soil enzymes are secreted by crop roots and rhizosphere microorganisms, as well as the decomposition of plant residues and microbial cells. Under the aeration, enhanced tomato root (Figure 4) and increased soil microbes (Figure 2) could immobilize and release nutrients into the soil and ameliorate soil fertility [23,27], which ultimately improved the CA and DHA (Figure 3). Additionally, soil water availability affects substrate availability, O2 concentrations, osmotic potential, gas diffusion, and cellular metabolism [24,28], thus impacting soil microbes. Difference in mean MBC, CA, and DHA values among treatments in this experiment was not significant (Table 1, p > 0.05).
In our study, the highest mean values of soil microbe and enzyme activity were obtained when 100%W was applied coupled with AI. This indicated that in a way the effect of irrigation on soil microbe and enzyme activity was enhanced under AI and that the soil biological environment was improved.

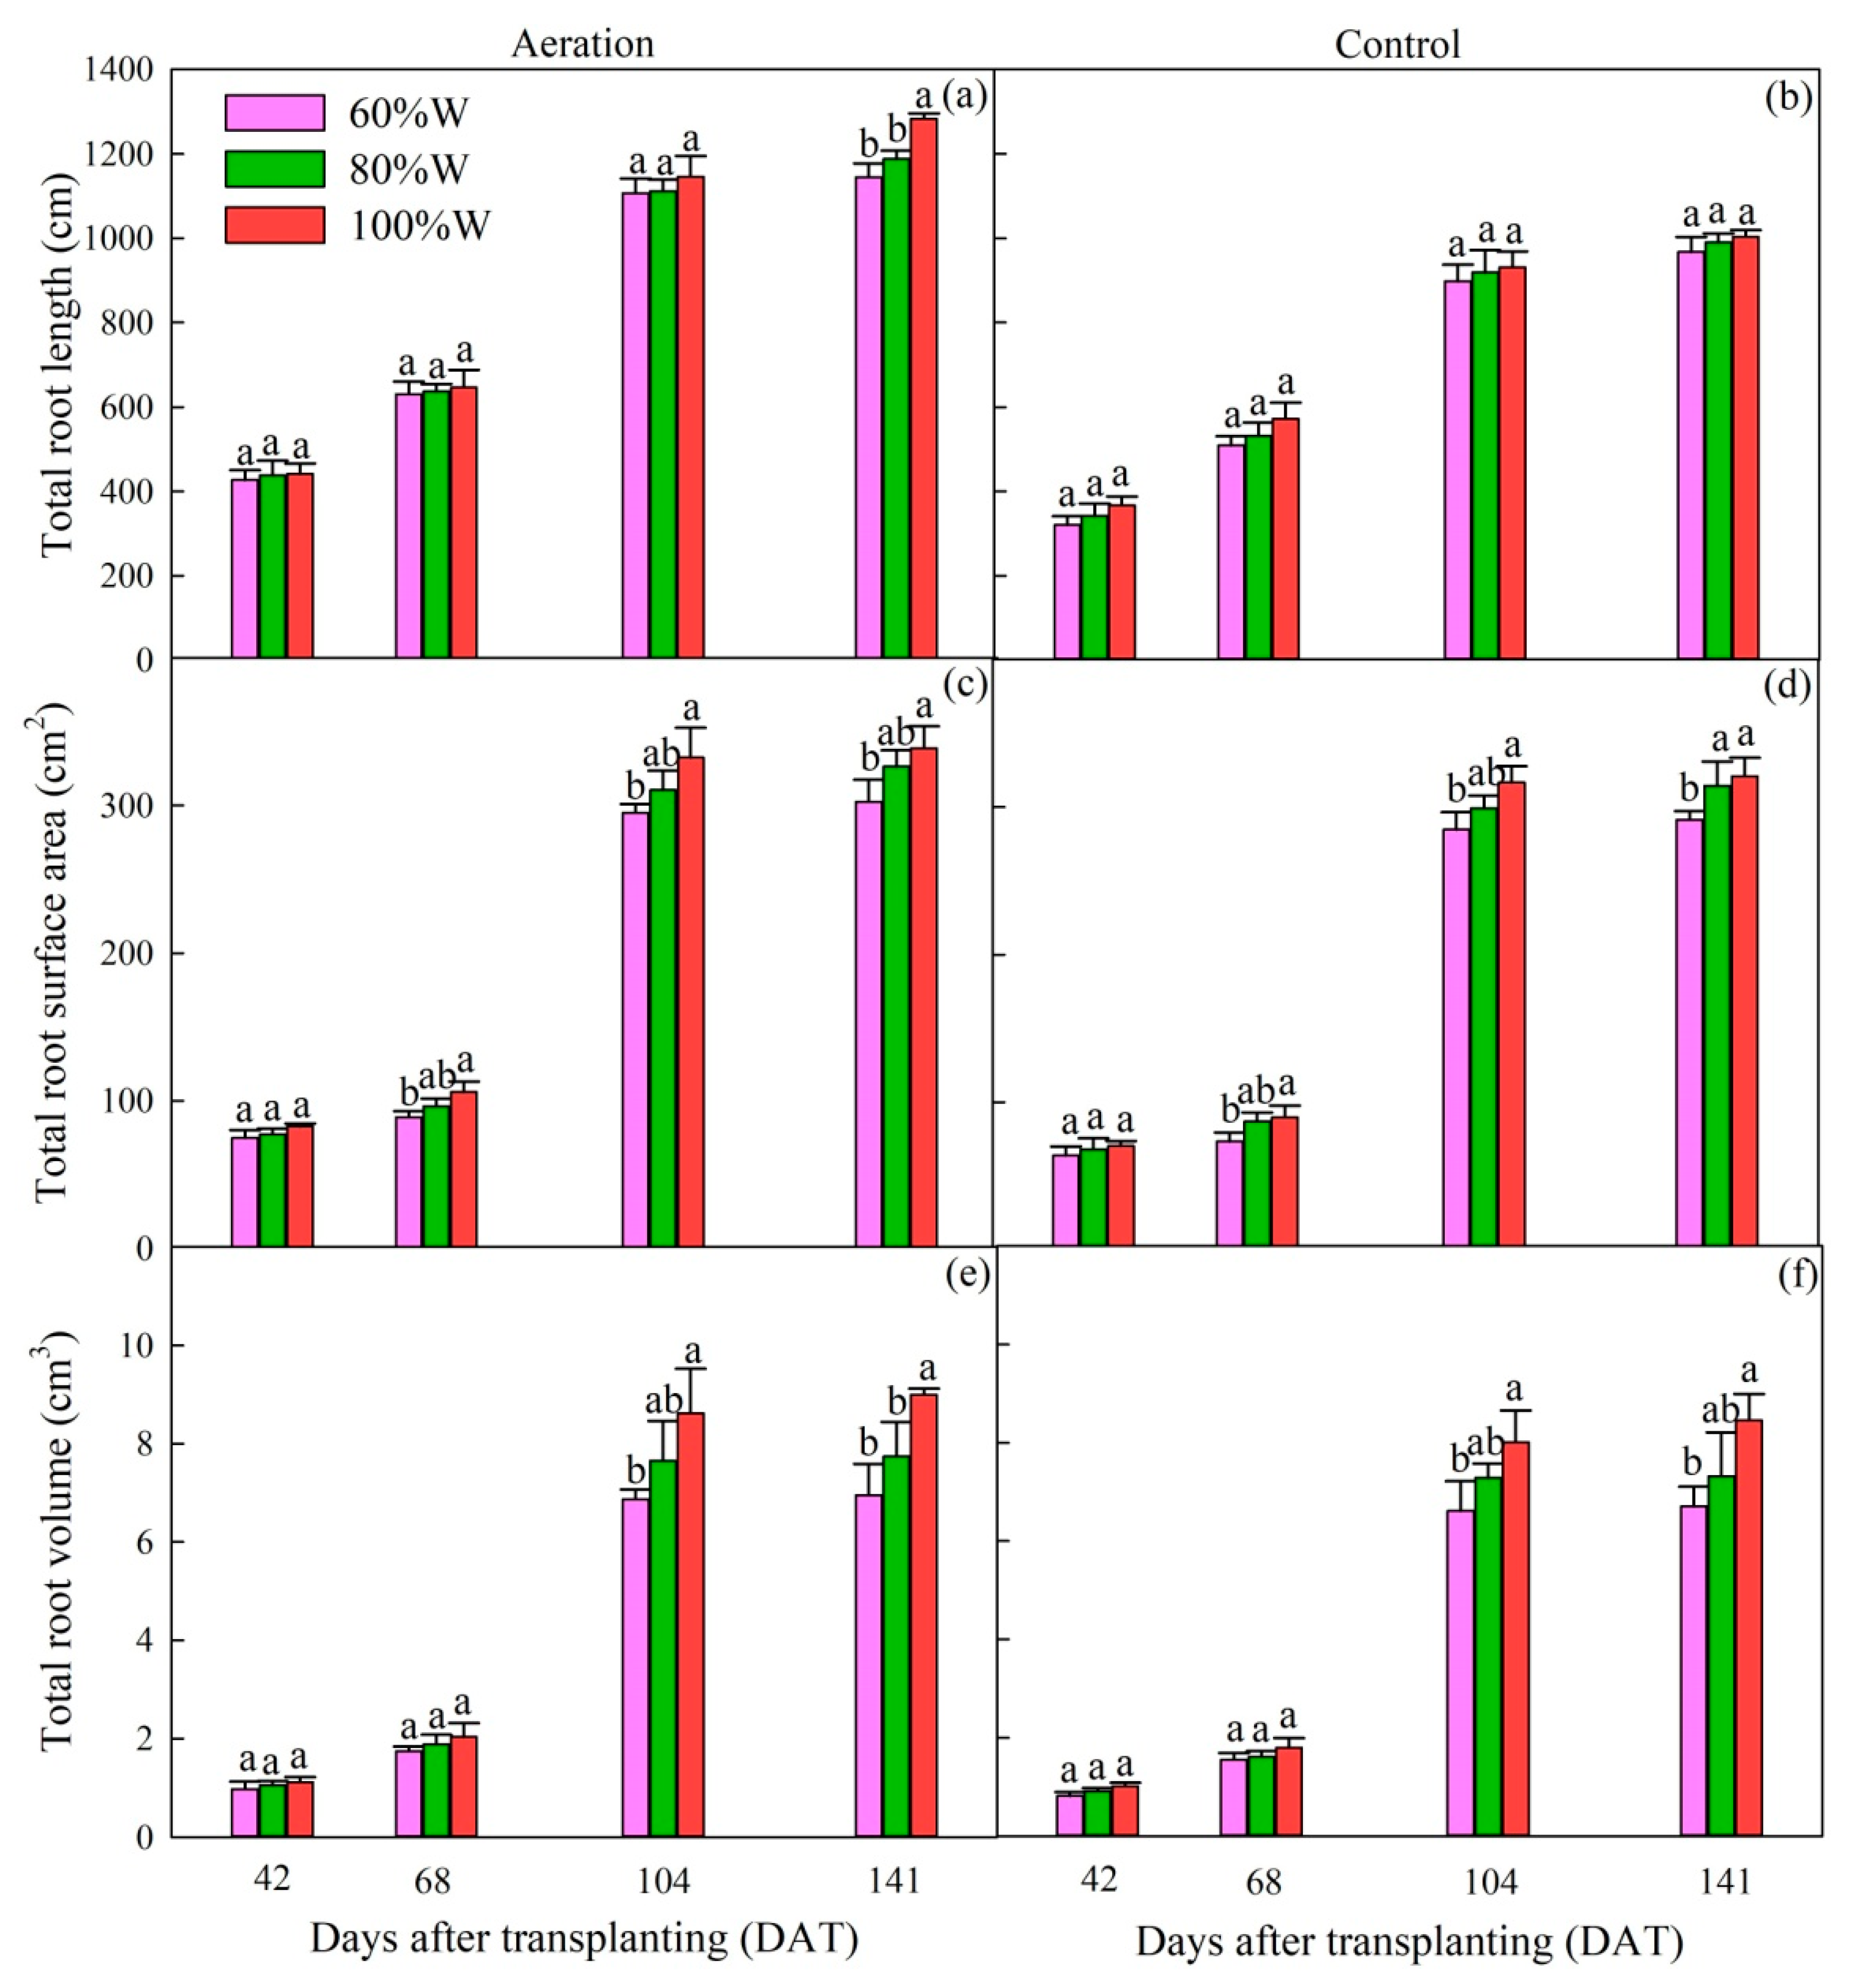
2.1.3. Root Morphology
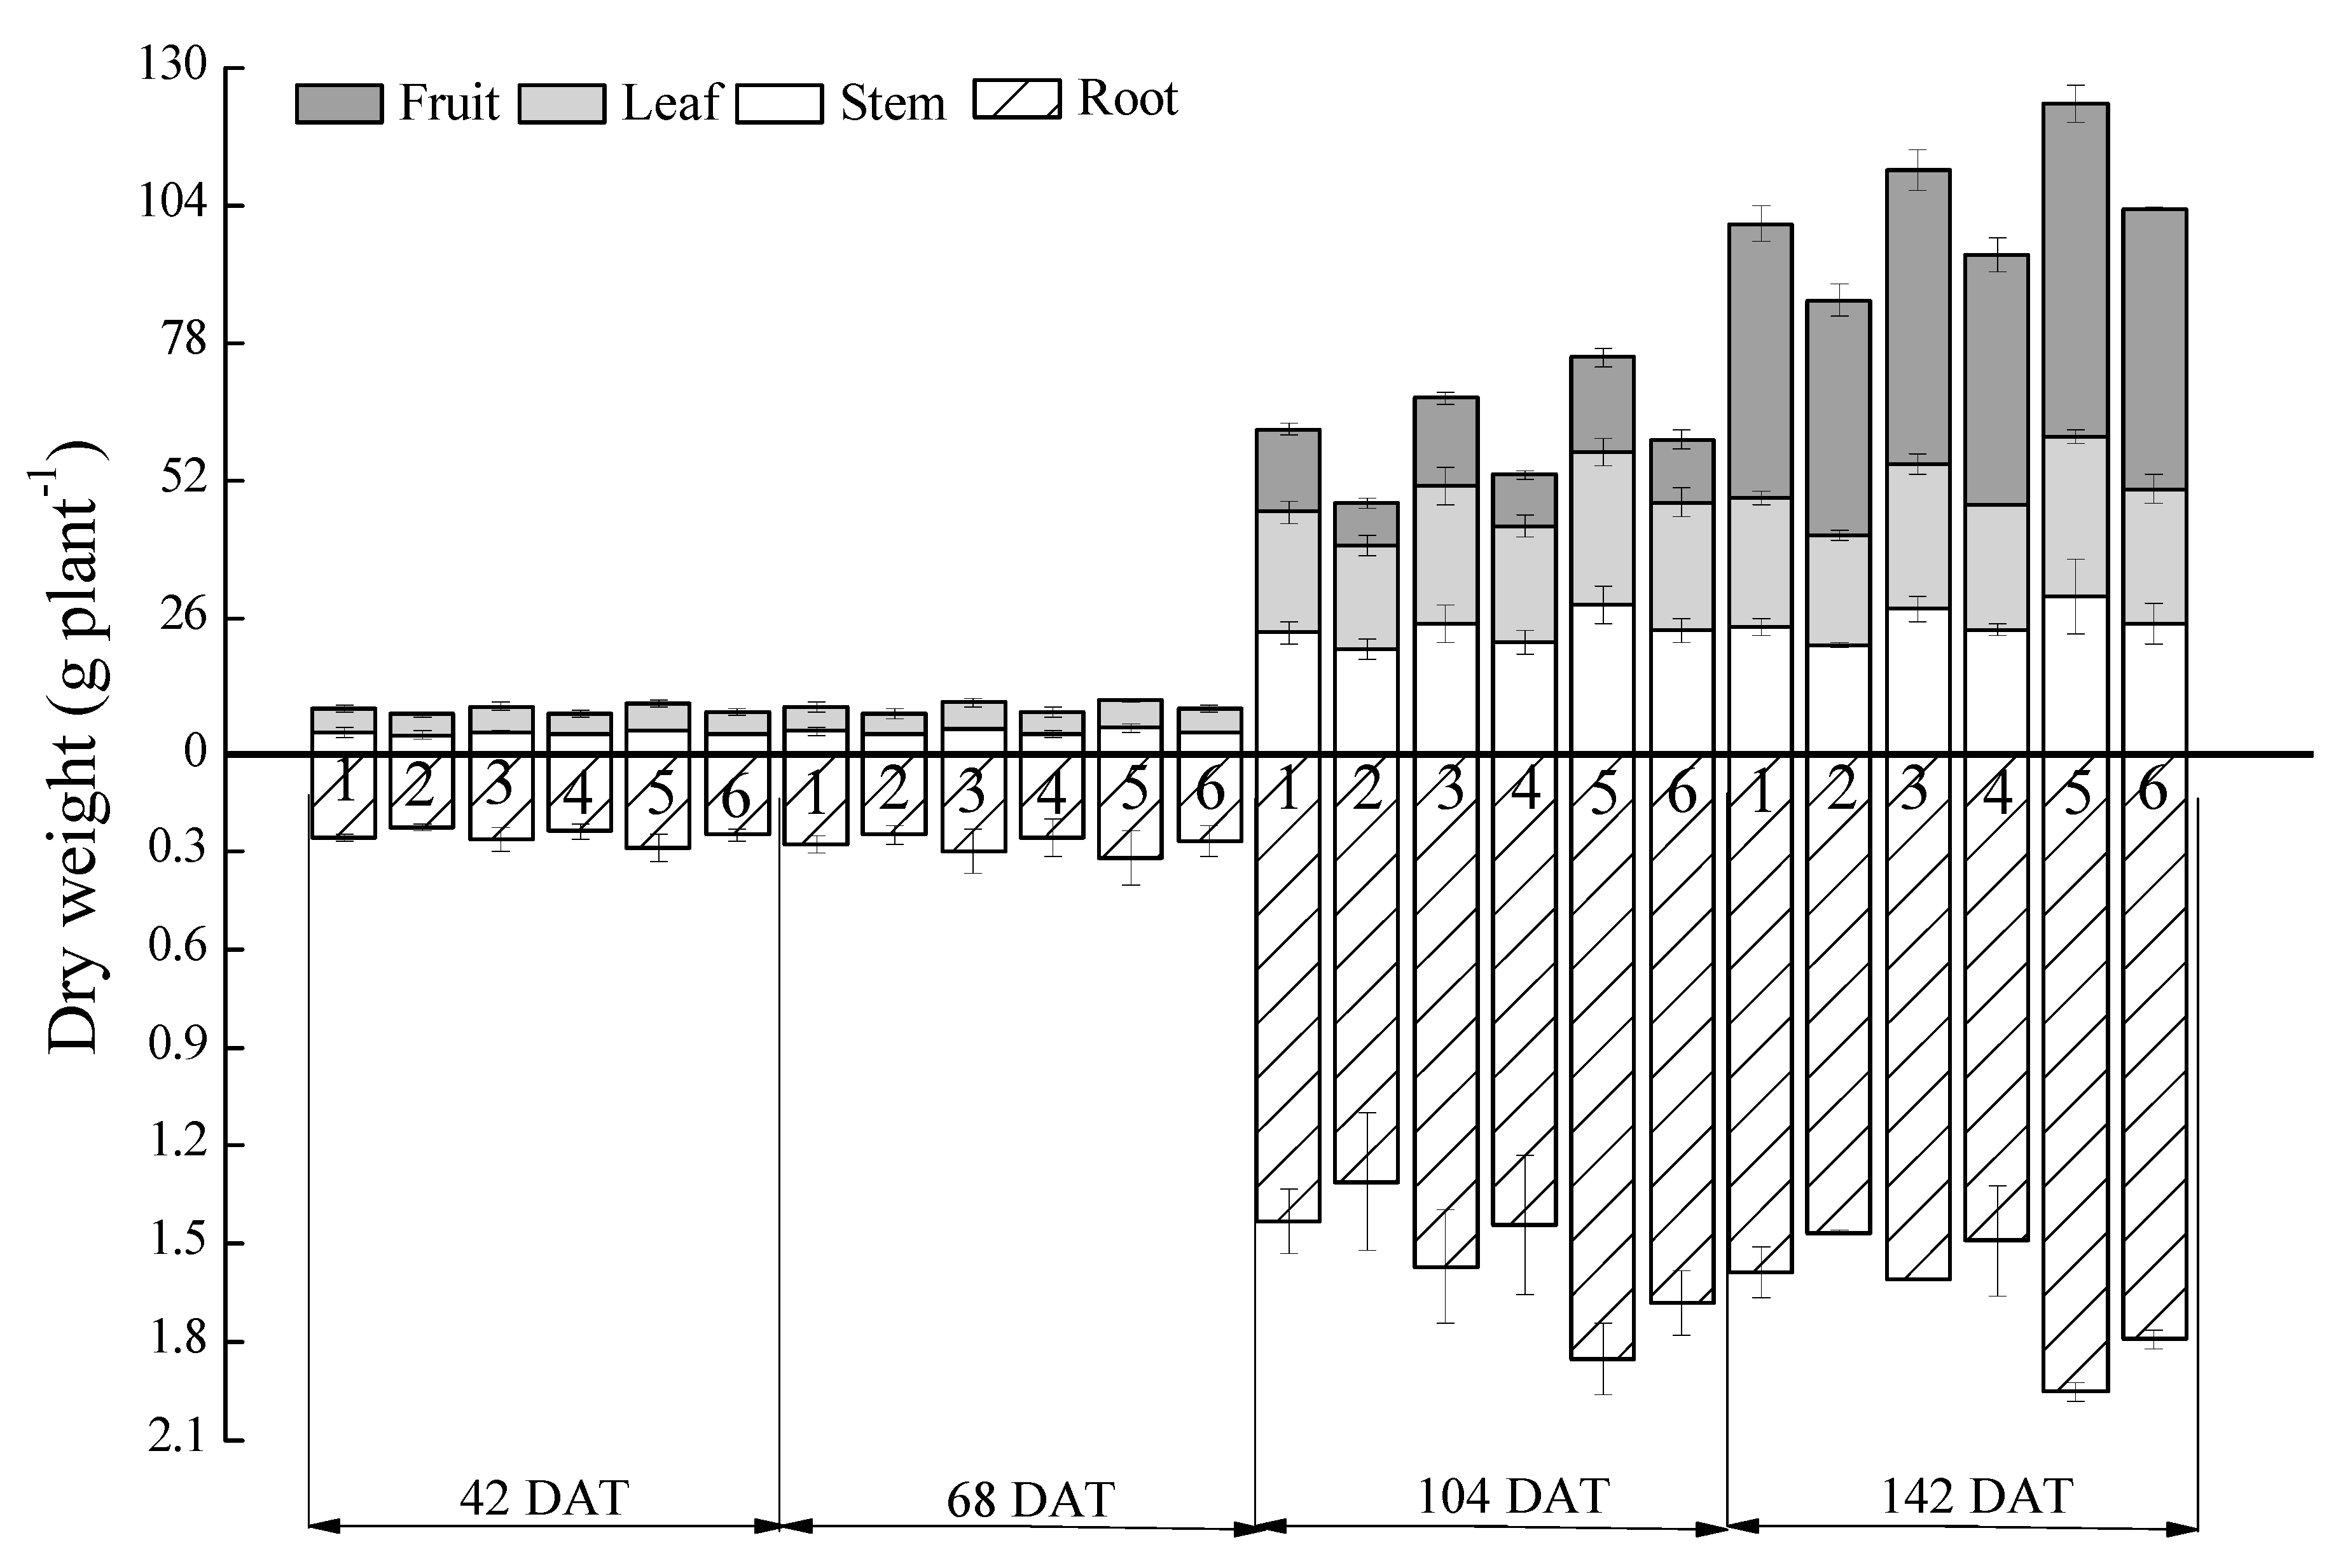
The root system plays a decisive role in water and nutrient absorption. The size of crop roots also determines autotrophic respiration. Hence, studies on root morphology are of great practical significance to the study of plant growth and root respiration.
Aeration has been determined to increase root dry biomass and root morphology in cucumber [17,18], soybean [1], and even in the conventional staple grain crop [19]. However, there have been few studies regarding tomato root morphology under AI. Our results showed that total root length, surface area, and volume on 104 and 141 DAT were significantly greater than those on 42 and 68 DAT (Figure 4, p < 0.05). Compared with the control, total root length was significantly increased by 22.2% on average under aeration (Table 2, p < 0.05). Meanwhile, total root surface area and volume under the aeration was 6.6% and 6.7% higher than that of the control, respectively (p > 0.05). Li et al. [18] also showed that root morphology (root length, surface area, and volume) increased with increasing frequency of aeration. Root length of greenhouse muskmelon was 7076, 5839, 5207, and 3864 cm, and root surface area was 1217, 1023, 998, and 746 cm2, while root volume was 31.0, 26.1, 25.7, and 20.1 cm3 for daily, 2-day, 4-day, and no aeration, respectively (p < 0.05) [18]. These increases of root morphology under the aeration were attributed to elongation, branching, and curving, influenced by the shape and dimensions of the wetted soil volume [18]. The injected air changed the soil structure owing to the shrinking and movement of soil particles, and it also pushed the water downwards [29]. All these characters in conjunction with higher soil moisture under aeration (Figure 1) were conducive to elongation of roots due to hydro-tropism. With respect to W1.0S, W0.6S significantly decreased the total root volume by 18.6% (p < 0.05), while the effects of other irrigation levels on root morphology were not significant (p > 0.05). Contrary to the results of the current study, Li et al. [18] stated that high irrigation levels has a negative effect on total root length, surface area, and volume with root length of 5981, 5364, and 5145 cm, surface area of 1114, 947, and 927 cm2, and volume of 30.8, 22.7, and 23.6 cm3 for the 70%, 80%, and 90% of field capacity level, respectively. Xu et al. [30] demonstrated that root length and surface area presented an increasing then decreasing trend as soil changes from dry to moist. Differences among literature were likely due to different hydrophily of crops controlled by the genes and tropic response to stimuli [18].

2.1.4. Dry Biomass

Soil respiration was influenced by not only soil physical environment (i.e., soil temperature and moisture), but also plant growth [14]. Study of dry biomass throughout the whole tomato growing period was an effective way to analyze the changes of soil respiration, especially for the autotrophic component.
An increasing trend of dry biomass was observed throughout the whole tomato growing period, and dry biomass on 42, 68, 104, and 142 DAT showed a similar changing pattern among treatments (Figure 5). Taking dry biomass at harvest (142 DAT) as an example, dry biomass of tomato leaf, stem, fruit, and root under aeration were higher than the control (Figure 5). As reported previously [31], the average increases of each part were 17.8%, 17.7%, 17.8%, and 8.4%, respectively, and the effect of aeration on leaf, stem, and fruit was significant (Table 2, p < 0.05). These improvements of dry biomass were in agreement with the results of former research [4,32], which were beneficial from increased soil aeration and reduced phytohormones under AI [31]. Dry biomass of tomato leaf, stem, fruit, and root increased as irrigation amount increased, and the effect was significant on leaf, fruit, and root (Table 2, p < 0.05). As noted previously [31], dry weight of root, stem, leaf, and fruit under 100%W was increased by 22.2%, 19.3%, 22.5%, and 19.0%, and by 20.1%, 5.4%, 7.0%, and 12.1% than that under 60%W and 80%W treatment, respectively. Zhu et al. [4] demonstrated that with crop-pan coefficient increasing from 0.6 to 1.0, dry biomass of root, stem, and leaf was increased by 24.0%, 17.2%, and 22.8%, respectively. The enhancement of dry biomass as irrigation amount increased was primarily ascribed to the greater canopy and leaf area index [4], as well as increased assimilation rate under high irrigation level [33].

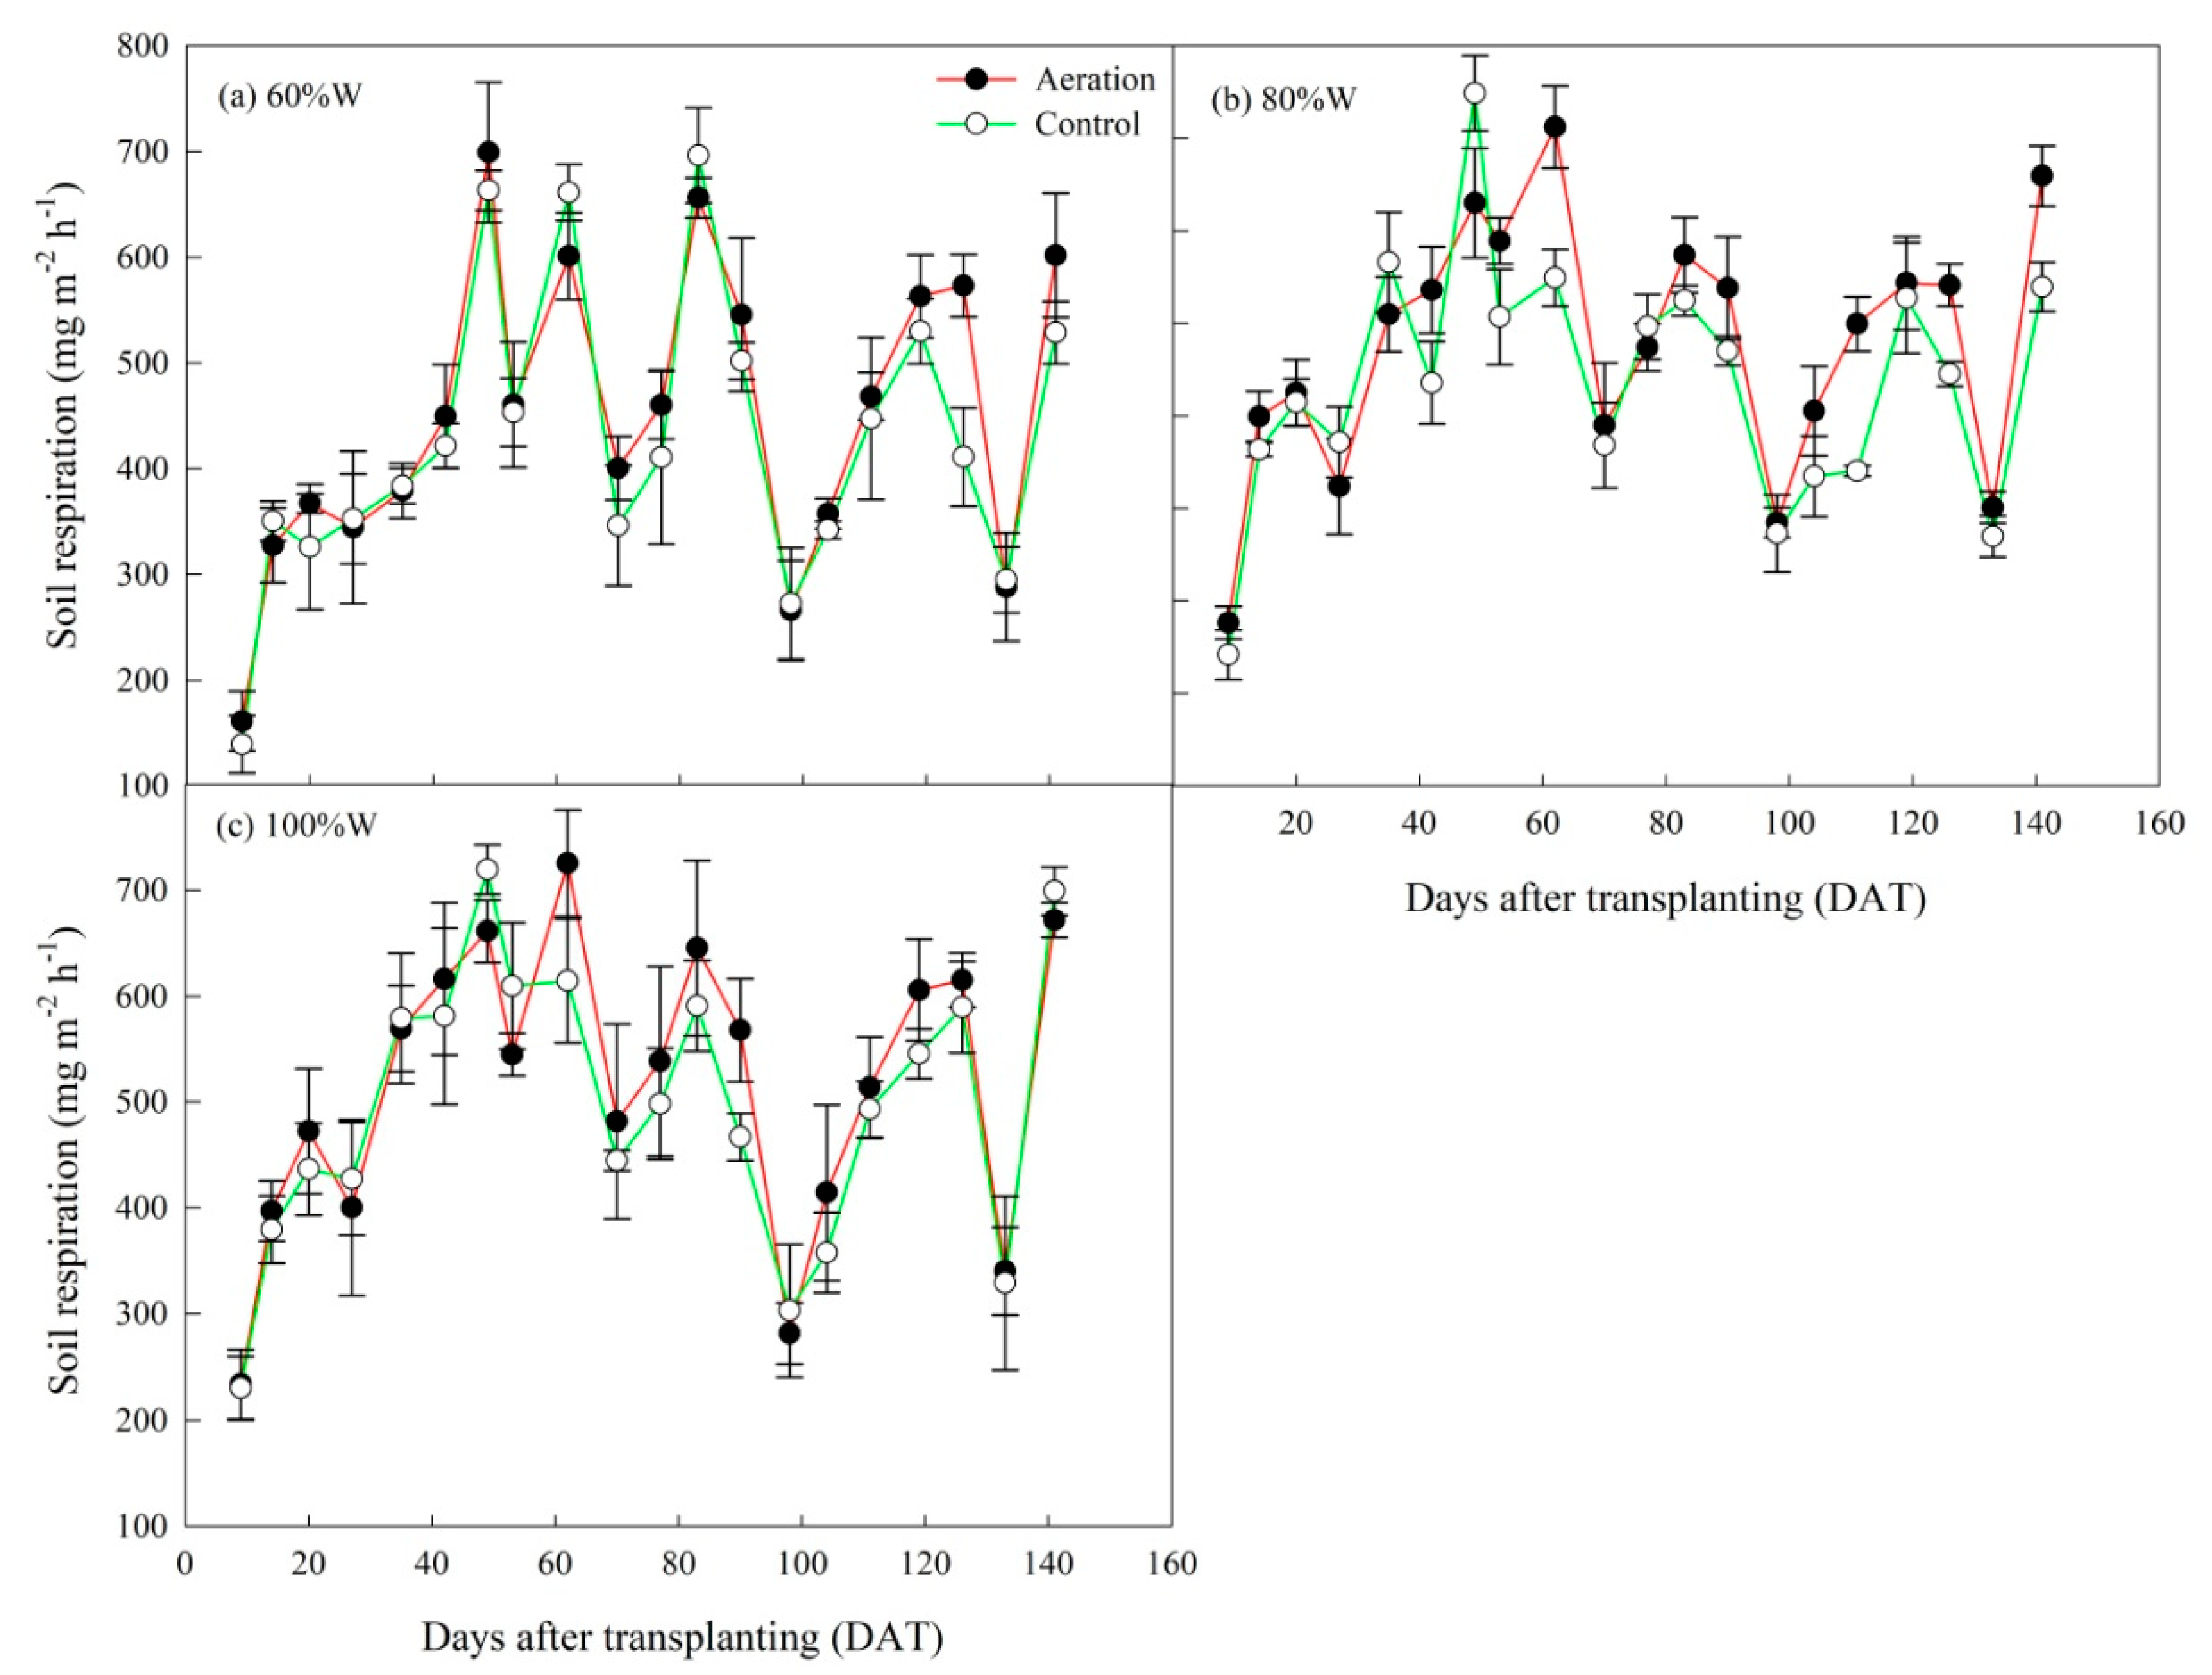
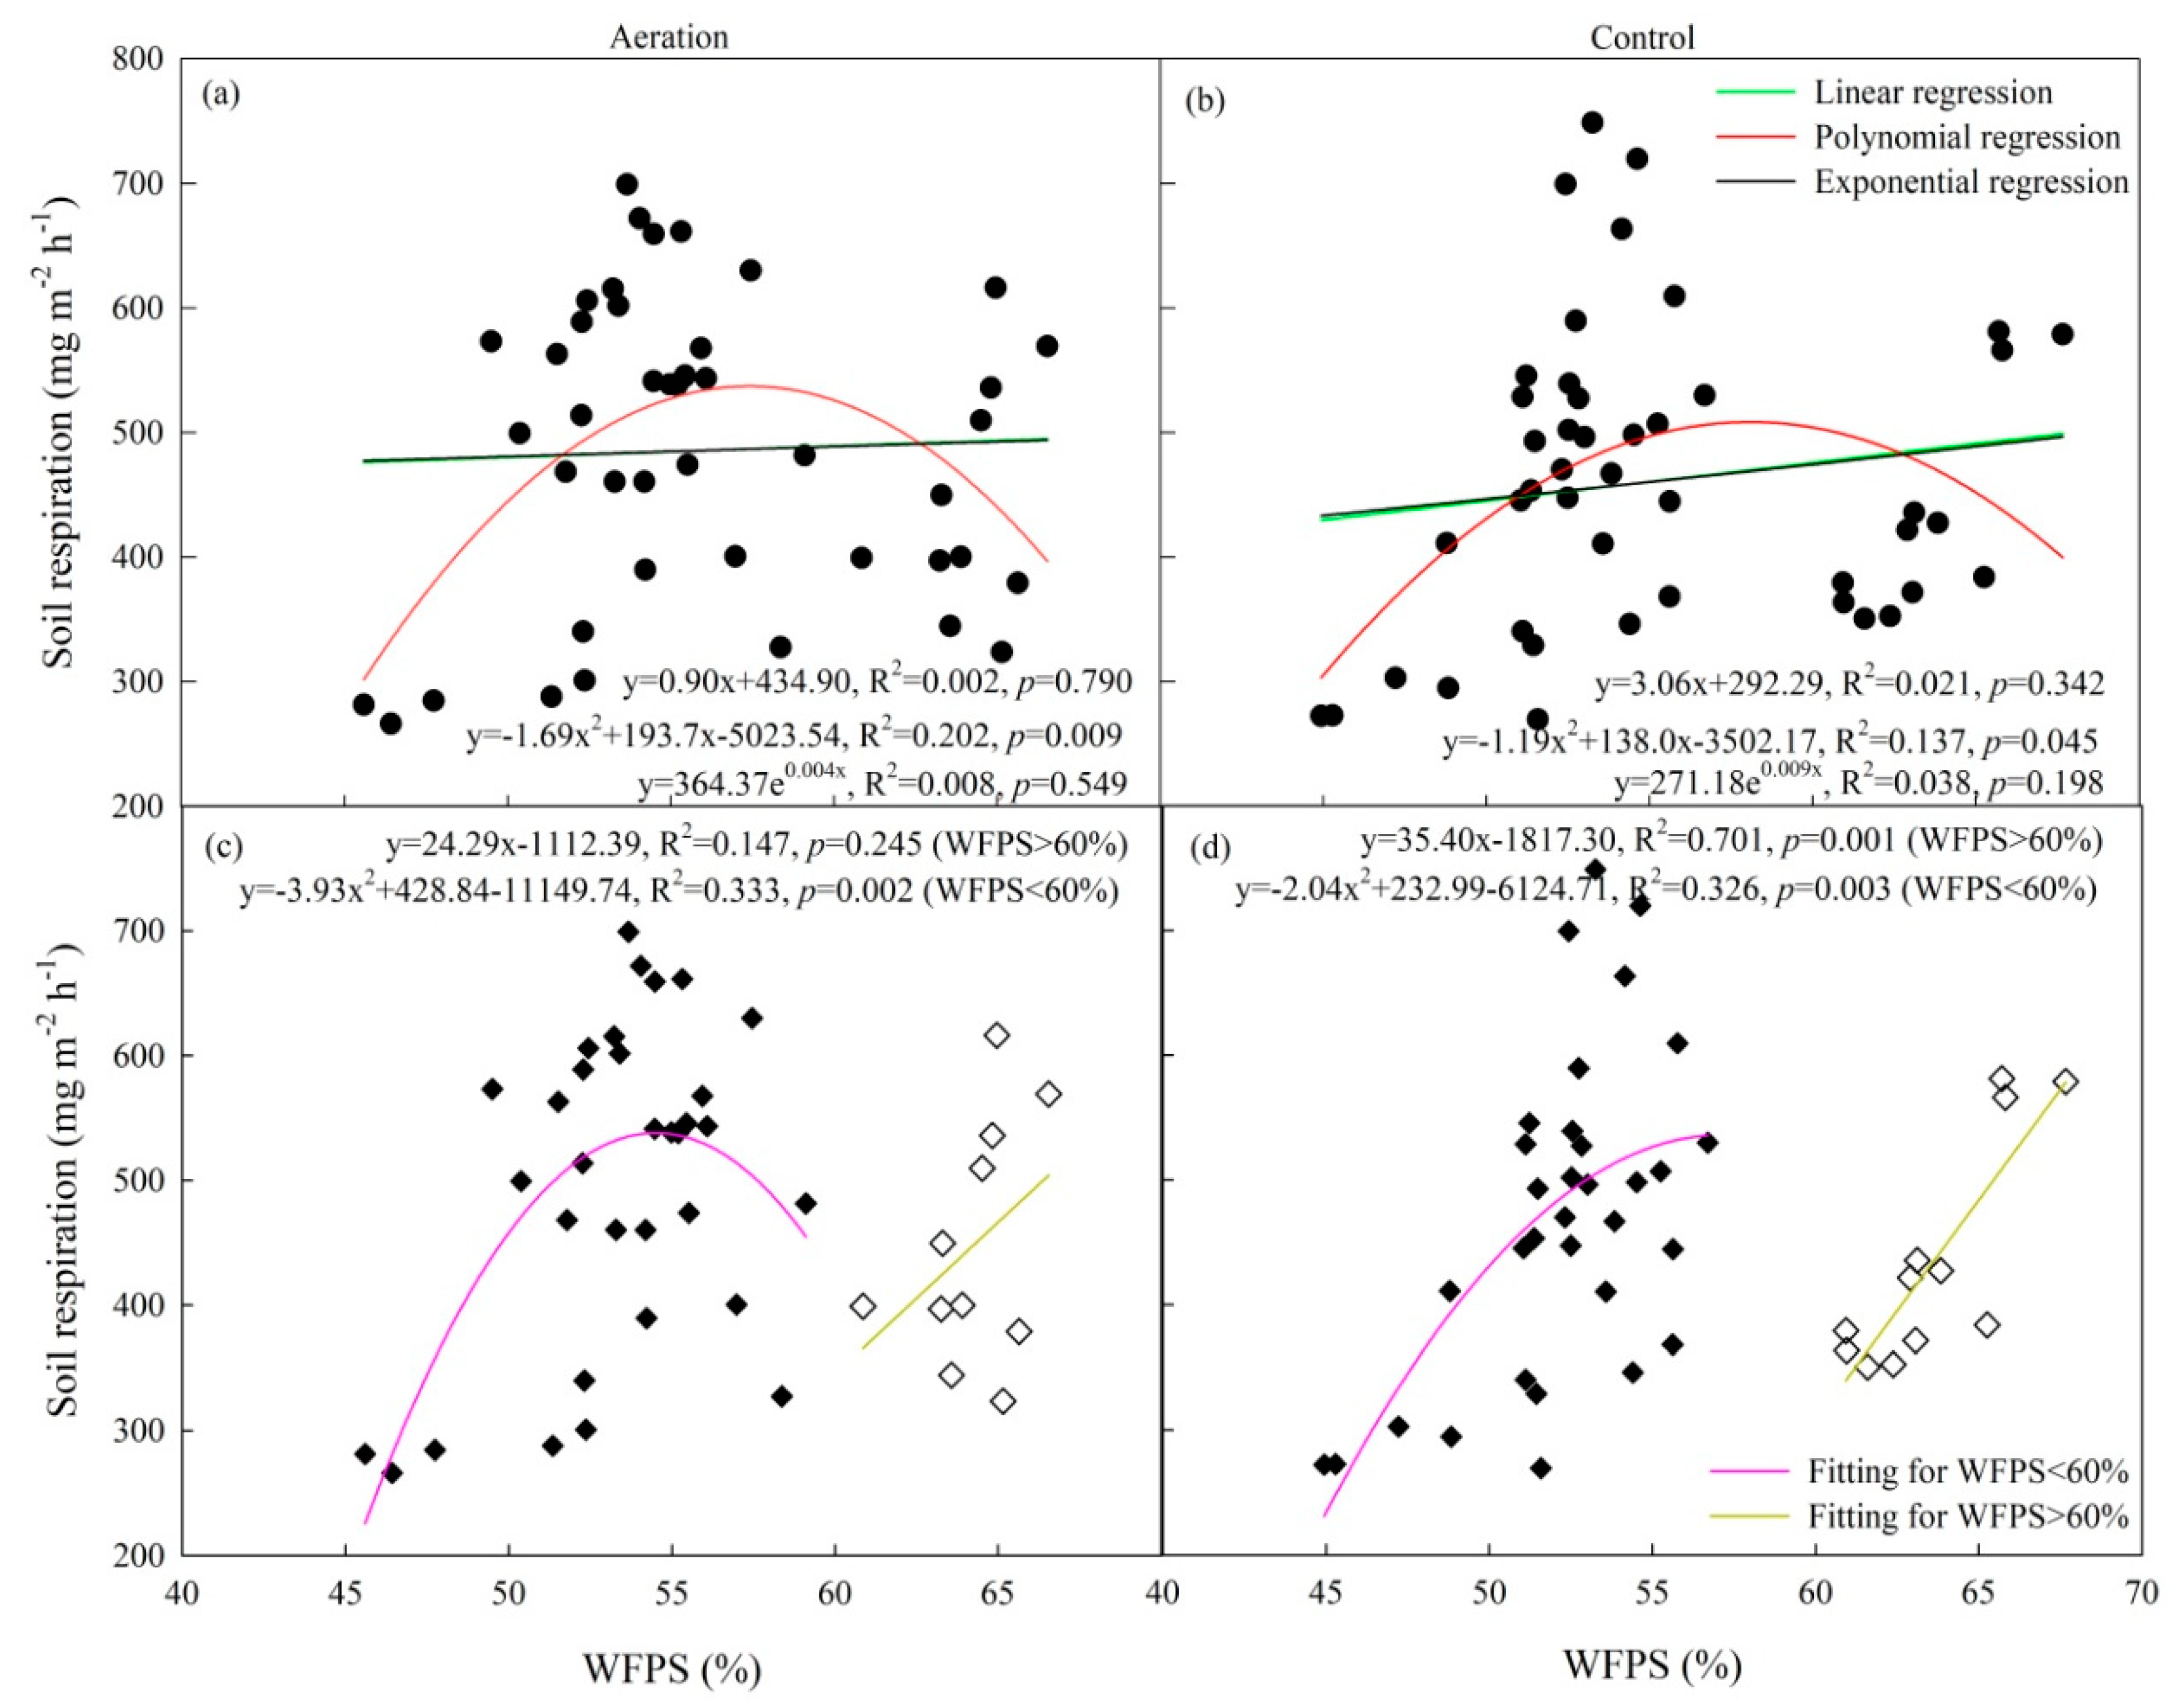
2.2. Soil Respiration

As presented in Figure 6, soil respiration showed fluctuated patterns during the whole tomato growing period, which varied from 139.19 to 748.64 mg·m−2·h−1 among treatments. Ranges of soil respiration in the present study was similar to the results of Hou et al. [10] but was higher than the research of the same tomato cultivations [9]. Differences might be the results of different irrigation amount and weather condition based on the year of cultivation. The changing patterns of soil respiration could be explained mostly by the abiotic and biotic factors (Figure 1, Figure 2, Figure 3, Figure 4 and Figure 5). The lowest values on 9 DAT were mainly due to lower soil microbes (especially for cfub and cfuf, Figure 2) and undeveloped tomato roots (Figure 4 and Figure 5) at the onset of transplantation. As days after transplanting increased, cfub and DHA increased gradually (Figure 2 and Figure 3), and the root growth enhanced slightly (Figure 4 and Figure 5), inducing larger emissions on 83 DAT. Relatively lower WFPS and obvious increases of soil temperature on 49 DAT (Figure 1) resulted in the peaks of soil respiration under W0.6O, W0.8S, and W1.0S treatment. Higher soil respiration on 62 DAT was attributed to increased WFPS, resulting in peaks under W0.8O and W1.0O treatment. Lower soil respiration on 98 and 133 DAT was primarily ascribed to a sharp decline of WFPS (Figure 1). An increasing trend of soil respiration was detected since 133 DAT, which was probably due to the increase of WFPS and soil temperature.
Previous research has shown a good correlation between soil respiration and soil temperature, oxygen concentration, and air-filled porosity [34]. Nevertheless, the correlation between soil respiration and soil microbe and enzyme activity, as well as plant growth under the aeration and irrigation treatments has not yet been well studied. In our study, regression analysis (linear, polynomial, and exponential) between soil respiration and WFPS was conducted, and a significant polynomial function was observed (Figure 7a,b, p < 0.05), similar to previous studies [11,12]. Further analysis found that a polynomial correlation was detected between soil respiration and WFPS when WFPS was below 60% (p < 0.01), while a linear positive correlation was observed when WFPS was above 60% (Figure 7c,d, p = 0.245 and 0.001 for the aeration and control, respectively). Moreover, there were significant negative correlations between soil respiration and cfub, as well as between soil respiration and cfuf (Table 3, p < 0.01), which was different from the result of Zhu et al. [25] where soil respiration showed strong positive correlations with cfub, cfuf, and cfua. The reason for the inconsistent conclusions was probably due to the different growing seasons. Zhu et al. [25] conducted the experiment in the spring–summer period where the weather was gradually raised, while the present experiment was finished in the autumn–winter period where the weather was gradually reduced. Different variation of soil temperature would lead to different changing rules of soil respiration, microbial activity, and water content. In the present study, the interactive effect of WFPS, cfub, and cfuf on soil respiration was extremely significant (Table 3, p < 0.01), which collectively accounted for 70.2% and 61.6% of changes in soil respiration under aeration and control, respectively. Unfortunately, correlations between soil respiration and other soil physical and biotic components (soil temperature, cfua, MBC, CA, DHA, tomato root morphology, and plant dry biomass) were not significant (p > 0.05, data not shown), which required further study.
Similar to previous results [6,9,10,34], soil respiration under the aeration in our study was typically and on average 6.2% greater but no significant different to that under the control according to ANOVA (Figure 6, Table 1, p > 0.05). Chen et al. [6] found that soil respiration increased by 42%–100% for oxygenation compared to control. Hou et al. [10] stated that aeration increased soil CO2 emissions by 11.8% (p = 0.394) compared to the control. Zhu et al. [34] revealed that mean soil respiration under the aeration was 22.5% higher than the control. Potential reasons explaining the enhancement of soil respiration under aeration include: (1) aeration increased soil microbes (Figure 2,3) and root growth (Figure 4 and Figure 5), which essentially controlled heterotrophic respiration and autotrophic respiration [22,35]; (2) greater CA and DHA under AI (Figure 3), which were involved in the decomposition and release of CO2 from soil organic substances, in turn promoted soil respiration; and (3) as a result of the enhanced aboveground dry biomass under AI, the increased demand for nutrients stimulated belowground C allocation and root growth (Figure 4 and Figure 5), which increased substrates to soil organisms and stimulated organic matter turnover [36,37], leading to higher biomass and/or activity that might stimulate the decomposition of soil organic matter [38,39]. All of these factors increased soil respiration conclusively. Consistent with previous research [9,40], soil respiration increased in the order of W0.6S < W0.8S < W1.0S (Figure 6), which resulted from increased soil microbial biomass (Figure 2), soil enzyme activity (Figure 3), root biomass (Figure 5), mineralization and decomposition rate of soil organic matter, as well as the diffusion rate of gases in soil pores [41]. Soil respiration under W1.0S was 16.0% and 13.9% higher than that under W0.6S and W0.8S, respectively. Nevertheless, the effect of irrigation on soil respiration was not significant (Table 1, p > 0.05).
Although this paper analyzed the response of soil respiration to soil physical and biotic variables, we do not know the proportion of root or microbial respiration to soil respiration as no measurement was made in this study, which was the deficiency of this study, and needs to be further carried out in future experiments.

3. Materials and Methods

3.1. Experimental Site

The experiment was conducted from August to December 2017 in a solar greenhouse located at 34°20′ N, 108°04′ E, at the Key Laboratory of Agricultural Soil and Water Engineering in Arid and Semi-Arid Areas of the Ministry of Education, Northwest A and F University, Yangling, Shaanxi Province, China. The site is in a semi-arid climate zone with an annual mean sunshine duration of 2163.8 h and frost-free period of 210 days. Lou soil was used in the experimental site. The texture was a silt clay loam (sand 26.0%; silt 33.0%; clay 41.0%). Soil properties of the top 20 cm were: field capacity 23.8% by weight; dry bulk density 1.35 g·cm−3; organic matter 14.62 g·kg−1; total N 1.88 g·kg−1; total P 1.37 g·kg−1; total K 20.21 g·kg−1; and pH 7.82.
Daily maximum and minimum temperatures inside the greenhouse during the experimental period, collected by an Automatic Meteorological Observing Station (Hobo event logger, Onset Computer Corporation, Bourne, MA, USA), are shown in Figure 8. The weather station, which was placed 2 m above the ground, recorded meteorological data at an interval of 15 min [31]. Higher temperatures were observed in August, while lower temperatures were recorded in December (Figure 8).

3.2. Experimental Design

Based on the irrigation amount of full irrigation (W) calculated as Equation (1), three irrigation levels were set: 60%, 80%, and 100% of W. Non-aerated SDI (S) was used as a control for aeration (O). Therefore, six treatments were designed (W0.6O, W0.6S, W0.8O, W0.8S, W1.0O, and W1.0S). Three replicates of each treatment were used (18 total plots), and the experiment was arranged using a randomized block [31]. Each plot with one row was 4 × 0.8 m in size, with eleven tomato plants of cultivar “JINGPENG SEED” planted on 6 August 2017. The plants were spaced 35 cm apart. All plots were mulched with a layer of low-density polyethylene to minimize surface evaporation [42]. SDI was applied in the experiment, which was buried at a depth of 15 cm below the soil surface with a dripper interval of 35 cm [9,10]. Additionally, a Mazzei air injector Model 287 (Mazzei Injector Company, LLC, Bakersfield, CA, USA) was installed at the head of each irrigation line for AI (inlet pressure: 0.1 MPa; outlet pressure: 0.02 MPa) [42]. Definitively, the air injectors were set to inject 17% volumetric air concentration in the water [25].
Daily evaporation measured by an E601 evaporation pan is shown in Figure 8. In all growth stages, 20 irrigation events were applied every seven days, with a total irrigation amount for W of 19.80 L per plot [31]. Irrigation amount was determined following the Equation (1) [9,10,42]:
W = k c p × E p a n × A
where kcp is the crop-pan coefficient, being 1.0; Epan is the total evaporation quantity following the last irrigation event (mm); and A is the area controlled by one irrigation dripper in this experiment, being 0.14 m2 (0.35 m × 0.4 m).
Only basal fertilizer, including organic fertilizer (N–P2O5–K2O ≥ 10%, organic matter ≥ 45%) and compound fertilizer (total nutrients ≥ 45%, N, P2O5 and K2O each at 15%), was applied for all plots. The application was achieved at a rate of 1875 and 1250 kg·ha−1 on 3 August 2017 for organic and compound fertilizer, respectively. Other agronomic managements were consistent with local production practices [42]. The experiment ended on 25 December 2017 with a total growth period of 142 days.

3.3. Measurement Index and Methods

Soil samples from 0 to 10 cm depth were collected when gas samples were collected except on 9, 20, 62, 83, and 104 DAT. Soil samples were taken through a diameter gauge with the three-point sampling method to measure soil water content via oven drying at 105 °C for 12 h, and then converted to WFPS by the following equation:
W F P S ( % ) = g r a v i m e t r i c w a t e r c o n t e n t t o t a l s o i l p o r o s i t y × s o i l b u l k d e n s i t y × 100
where total soil porosity = 1 – soil bulk density/2.65, with 1.35 g·cm−3 as the assumed particle density of the soil.
Soil temperature at a depth of 10 cm was recorded using a geothermometer (RM-004, Hengshui, China) when gas samples were collected, excluding on 9 and 62 DAT.
Soil samples of top-soil (0–20 cm) were collected to measure soil microbe and enzyme activity on 35, 53, 77, 98, 119, and 141 DAT. The cfub, cfuf, and cfua were estimated using the plate dilution counting method in beef extract and peptone medium, Martin’s medium, and the improved Gao’s No. 1 medium, respectively. Media plates were incubated at 37 and 25 °C, and the number of colonies after approximately 3 to 5 d was counted [23]. MBC was measured by the chloroform fumigation–K2SO4 extraction method. MBC in the extracts was determined by the K2Cr2O7–FeSO4 additional heating method. Detailed measurement steps regarding CA and DHA are described by Хазиев [43].
On 42, 68, 104, and 142 DAT, one plant from per plot was sampled to measure dry biomass and root morphology (total root length, surface area, and volume). All plant samples were first separated into leaves, stems, fruits, and roots. The roots collected from soil by digging were gently washed, scanned (Epson Perfection V700 photo, Seiko Epson Crop., Nagano-ken, Japan) to obtain a gray-scale JPG image, and then analyzed with the WinRHIZO Pro image processing system (Regent Instrument Inc., 2672 Chemin Sainte-Foy, Quebec City, Quebec G1V 1V4, Canada) to obtain root morphology [18]. After that, every part of the tomato plant including root was put into a 105 °C oven for 1 h to deactivate enzymes and then dried at 75 °C until the parts reached a constant weight. The dry biomass of each part was weighed on an electronic scale [31].
Gas samples of soil respiration was measured using the static closed chamber method described by Hou et al. [10]. All chambers, which were made of polyvinyl chloride (PVC) materials and wrapped with sponge and aluminum foil, were 25 × 25 × 25 cm in dimension. The bases of the chambers were installed between two plants in the middle of each plot on the day of transplanting and remained there until the end of the experiment. There was a 3-cm-deep groove on the top edge of the bottom layer and on the base of the chamber that was filled with water to seal the rim of the chamber. A mercury thermometer (WNG-01, Hengshui, China) at the top of each chamber was equipped to measure air temperature when gas sampling for calculating gas emission flux. Gas samples at an average interval of seven days were collected at 10:00, 10:10, 10:20 and 10:30 a.m. of each sampling time. A 30-mL air sample was drawn each time with a syringe. Gas samples in the syringes were analyzed for CO2 concentrations using a gas chromatograph (7890A GC System, Agilent Technologies, Santa Clara, USA) within a few hours. Sample sets were discarded unless they yielded an R2 linear regression value higher than 0.90. Then, soil CO2 fluxes (soil respiration), which were the sum of autotrophic and heterotrophic respiration, were calculated following the equation given by Hou et al. [10]:
F = ρ · h · 273 273 + T · d c d t
where F is the soil respiration (mg·m−2·h−1); ρ is the gas density at standard state (1.964 kg·m−3); h is the height of chamber above the water surface (m); d c d t is the gas mixing ratio concentration (μL·L1·h−1); and T is the mean air temperature inside the chamber during sampling (°C).

3.4. Statistical Analysis

A two-way analysis of variance (ANOVA) followed by an LSD test (95% confidence level, p < 0.05) was used to test for the effects of irrigation, aeration, and their interaction on soil respiration, soil physical and biotic properties (WFPS, temperature, cfub, cfuf, cfua, MBC, CA, DHA, root morphology, dry biomass). Regression analysis of soil respiration with soil physical and biotic variables was conducted. All statistical and regression analysis were performed using the software SPSS Statistics 22.0 (SPSS Inc., Chicago, IL, USA), and figures were generated using SigmaPlot 12.5 (Systat Software, Inc., Chicago, IL, USA).

4. Conclusions

This study investigated the variation of soil respiration and its influencing factors under different irrigation levels with and without aeration in a greenhouse tomato system. Aeration had a significant effect on tomato root length, as well as dry biomass of leaf, stem, and fruit, while no significant differences on other parameters were observed. As irrigation amount applied into soils increased, soil respiration increased in conjunction with its influencing factors, and the effect was significant on the dry biomass of leaf, fruit, and root. Soil respiration was significantly correlated with soil water-filled pore space, the abundance of soil bacteria and fungi. These results indicate that irrigation combined with aeration would increase soil physical and biotic variables, which stimulate more CO2 release. The application of reduced irrigation and aeration has potential for alleviating CO2 emissions.

Author Contributions

Conceptualization, H.C. (Hui Chen) and H.C. (Huanjie Cai); Data curation, H.C. (Hui Chen) and Z.S.; Formal analysis, Z.S.; Funding acquisition, H.C. (Huanjie Cai); Investigation, H.C. (Hui Chen), Z.S. and Y.Z.; Methodology, H.C. (Hui Chen), H.C. (Huanjie Cai) and Y.Z.; Software, H.C. (Hui Chen); Validation, H.C. (Huanjie Cai); Writing—original draft, H.C. (Hui Chen); Writing—review and editing, Z.S., H.C. (Huanjie Cai) and Y.Z.

Funding

This work was supported by the National Key Research and Development Program of China (2016YFC0400201) and the National Natural Science Foundation of China (51309192).

Conflicts of Interest

The authors declare no conflict of interest.

References

  1. Bhattarai, S.P.; Midmore, D.J.; Pendergast, L. Yield, water-use efficiencies and root distribution of soybean, chickpea and pumpkin under different subsurface drip irrigation depths and oxygation treatments in vertisols. Irrig. Sci. 2008, 26, 439–450. [Google Scholar] [CrossRef]
  2. Mo, Y.; Li, G.; Wang, D. A sowing method for subsurface drip irrigation that increases the emergence rate, yield, and water use efficiency in spring corn. Agric. Water Manag. 2017, 179, 288–295. [Google Scholar] [CrossRef]
  3. Růžička, K.; Ljung, K.; Vanneste, S.; Podhorská, R.; Beeckman, T.; Friml, J.; Benková, E. Ethylene Regulates Root Growth through Effects on Auxin Biosynthesis and Transport-Dependent Auxin Distribution. Plant Cell 2007, 19, 2197–2212. [Google Scholar] [CrossRef] [PubMed] [Green Version]
  4. Zhu, Y.; Cai, H.J.; Song, L.B.; Chen, H. Impacts of oxygation on plant growth, yield and fruit quality of tomato. Trans. Chin. Soc. Agric. Mach. 2017, 48, 199–211. (In Chinese) [Google Scholar]
  5. Bhattarai, S.P.; Pendergast, L.; Midmore, D.J. Root aeration improves yield and water use efficiency of tomato in heavy clay and saline soils. Sci. Hortic. 2006, 108, 278–288. [Google Scholar] [CrossRef]
  6. Dhungel, J.; Torabi, M.; Pendergast, L.; Chen, X.; Bhattarai, S.P.; Midmore, D.J. Impact of oxygation on soil respiration, yield and water use efficiency of three crop species. J. Plant Ecol. 2010, 4, 236–248. [Google Scholar]
  7. Hanson, P.J.; Edwards, N.; Garten, C.; Andrews, J. Separating root and soil microbial contributions to soil respiration: A review of methods and observations. Biogeochemistry 2000, 48, 115–146. [Google Scholar] [CrossRef]
  8. Kuzyakov, Y. Sources of CO2 efflux from soil and review of partitioning methods. Soil Boil. Biochem. 2006, 38, 425–448. [Google Scholar] [CrossRef]
  9. Chen, H.; Hou, H.-J.; Wang, X.-Y.; Zhu, Y.; Saddique, Q.; Wang, Y.-F.; Cai, H. The effects of aeration and irrigation regimes on soil CO2 and N2O emissions in a greenhouse tomato production system. J. Integr. Agric. 2018, 17, 449–460. [Google Scholar] [CrossRef]
  10. Hou, H.; Chen, H.; Cai, H.; Yang, F.; Li, D.; Wang, F. CO2 and N2O emissions from Lou soils of greenhouse tomato fields under aerated irrigation. Atmos. Environ. 2016, 132, 69–76. [Google Scholar] [CrossRef]
  11. Qi, Y.; Xu, M. Separating the effects of moisture and temperature on soil CO2 efflux in a coniferous forest in the Sierra Nevada mountains. Plant Soil 2001, 237, 15–23. [Google Scholar] [CrossRef]
  12. Shi, W.-Y.; Du, S.; Morina, J.C.; Guan, J.-H.; Wang, K.-B.; Ma, M.-G.; Yamanaka, N.; Tateno, R. Physical and biogeochemical controls on soil respiration along a topographical gradient in a semiarid forest. Agric. For. Meteorol. 2017, 247, 1–11. [Google Scholar] [CrossRef]
  13. Jia, S.; Wang, Z.; Li, X.; Sun, Y.; Zhang, X.; Liang, A. N fertilization affects on soil respiration, microbial biomass and root respiration in Larix gmelinii and Fraxinus mandshurica plantations in China. Plant Soil 2010, 333, 325–336. [Google Scholar] [CrossRef]
  14. Yu, C.-L.; Hui, D.; Deng, Q.; Dzantor, E.K.; Fay, P.A.; Shen, W.; Luo, Y. Responses of switchgrass soil respiration and its components to precipitation gradient in a mesocosm study. Plant Soil 2017, 420, 105–117. [Google Scholar] [CrossRef]
  15. Makoi, J.; Ndakidemi, P. Selected soil enzymes: Examples of their potential roles in the ecosystem. Afr. J. Biotechnol. 2008, 7, 181–191. [Google Scholar]
  16. Li, Y.; Niu, W.; Wang, J.; Liu, L.; Zhang, M.; Xu, J. Effects of Artificial Soil Aeration Volume and Frequency on Soil Enzyme Activity and Microbial Abundance when Cultivating Greenhouse Tomato. Soil Sci. Soc. Am. J. 2016, 80, 1208. [Google Scholar] [CrossRef]
  17. Li, J.; Sun, J.; Yang, Y.; Guo, S.; Glick, B.R. Identification of hypoxic-responsive proteins in cucumber roots using a proteomic approach. Plant Physiol. Biochem. 2012, 51, 74–80. [Google Scholar] [CrossRef]
  18. Li, Y.; Niu, W.; Xu, J.; Wang, J.; Zhang, M.; Lv, W. Root morphology of greenhouse produced muskmelon under sub-surface drip irrigation with supplemental soil aeration. Sci. Hortic. 2016, 201, 287–294. [Google Scholar] [CrossRef]
  19. Xu, C.-M.; Wang, D.-Y.; Chen, S.; Chen, L.-P.; Zhang, X.-F. Effects of Aeration on Root Physiology and Nitrogen Metabolism in Rice. Rice Sci. 2013, 20, 148–153. [Google Scholar] [CrossRef]
  20. Jia, B.; Zhou, G.; Wang, F.; Wang, Y.; Yuan, W.; Zhou, L. Partitioning root and microbial contributions to soil respiration in Leymus chinensis populations. Soil Boil. Biochem. 2006, 38, 653–660. [Google Scholar] [CrossRef]
  21. Iqbal, J.; Hu, R.; Feng, M.; Lin, S.; Malghani, S.; Ali, I.M. Microbial biomass, and dissolved organic carbon and nitrogen strongly affect soil respiration in different land uses: A case study at Three Gorges Reservoir Area, South China. Agric. Ecosyst. Environ. 2010, 137, 294–307. [Google Scholar] [CrossRef]
  22. Lange, M.; Eisenhauer, N.; Sierra, C.A.; Bessler, H.; Engels, C.; Griffiths, R.I.; Mellado-Vázquez, P.G.; Malik, A.A.; Roy, J.; Scheu, S.; et al. Plant diversity increases soil microbial activity and soil carbon storage. Nat. Commun. 2015, 6, 6707. [Google Scholar] [CrossRef] [PubMed]
  23. Du, Y.; Niu, W.; Zhang, Q.; Cui, B.; Gu, X.; Guo, L.; Liang, B. Effects of Nitrogen on Soil Microbial Abundance, Enzyme Activity, and Nitrogen Use Efficiency in Greenhouse Celery under Aerated Irrigation. Soil Sci. Soc. Am. J. 2018, 82, 606. [Google Scholar] [CrossRef]
  24. Manzoni, S.; Schimel, J.P.; Porporato, A. Responses of soil microbial communities to water stress: Results from a meta-analysis. Ecology 2012, 93, 930–938. [Google Scholar] [CrossRef] [PubMed]
  25. Zhu, Y.; Cai, H.; Song, L.; Chen, H. Aerated Irrigation Promotes Soil Respiration and Microorganism Abundance around Tomato Rhizosphere. Soil Sci. Soc. Am. J. 2019, 83, 1343. [Google Scholar] [CrossRef]
  26. Chen, S.; Liu, A.; He, C.; Zou, Z. Microbial and enzyme activities in tomato rhizosphere with organic soil cultivation in solar greenhouse. Chin. J. Soil Sci. 2010, 41, 815–818. (In Chinese) [Google Scholar]
  27. Chaparro, J.M.; Sheflin, A.M.; Manter, D.K.; Vivanco, J.M. Manipulating the soil microbiome to increase soil health and plant fertility. Boil. Fertil. Soils 2012, 48, 489–499. [Google Scholar] [CrossRef]
  28. Drenovsky, R.; Vo, D.; Graham, K.; Scow, K. Soil Water Content and Organic Carbon Availability Are Major Determinants of Soil Microbial Community Composition. Microb. Ecol. 2004, 48, 424–430. [Google Scholar] [CrossRef]
  29. Ben-Noah, I.; Friedman, S. Aeration of clayey soils by injecting air through subsurface drippers: Lysimetric and field experiments. Agric. Water Manag. 2016, 176, 222–233. [Google Scholar] [CrossRef]
  30. Xu, G.-W.; Lu, D.-K.; Wang, H.-Z.; Li, Y. Morphological and physiological traits of rice roots and their relationships to yield and nitrogen utilization as influenced by irrigation regime and nitrogen rate. Agric. Water Manag. 2018, 203, 385–394. [Google Scholar] [CrossRef]
  31. Chen, H.; Shang, Z.-H.; Cai, H.-J.; Zhu, Y. An Optimum Irrigation Schedule with Aeration for Greenhouse Tomato Cultivations Based on Entropy Evaluation Method. Sustainability 2019, 11, 4490. [Google Scholar] [CrossRef]
  32. Bai, T.; Li, C.; Li, C.; Liang, D.; Ma, F. Contrasting hypoxia tolerance and adaptation in Malus species is linked to differences in stomatal behavior and photosynthesis. Physiol. Plantarum. 2013, 147, 514–523. [Google Scholar] [CrossRef] [PubMed]
  33. Intrigliolo, D.S.; Bonet, L.; Nortes, P.A.; Puerto, H.; Nicolas, E.; Bartual, J. Pomegranate trees performance under sustained and regulated deficit irrigation. Irrig. Sci. 2013, 31, 959–970. [Google Scholar] [CrossRef]
  34. Zhu, Y.; Cai, H.; Song, L.; Chen, H. Oxygation improving soil aeration around tomato root zone in greenhouse. Trans. Chin. Soc. Agric. Eng. 2017, 33, 163–172. (In Chinese) [Google Scholar]
  35. Borkhuu, B.; Peckham, S.; Ewers, B.; Norton, U.; Pendall, E.; Ewers, B. Does soil respiration decline following bark beetle induced forest mortality? Evidence from a lodgepole pine forest. Agric. For. Meteorol. 2015, 214, 201–207. [Google Scholar] [CrossRef]
  36. Dieleman, W.I.J.; Luyssaert, S.; Rey, A.; de Angelis, P.; Barton, C.V.M.; Broadmeadow, M.S.J.; Broadmeadow, S.B.; Chigwerewe, K.S.; Crookshanks, M.; Dufrêne, E.; et al. Soil [N] modulates soil C cycling in CO2-fumigated tree stands: A meta-analysis. Plant Cell Environ. 2010, 33, 2001–2011. [Google Scholar] [CrossRef]
  37. Cheng, W. Rhizosphere priming effect: Its functional relationships with microbial turnover, evapotranspiration, and C–N budgets. Soil Boil. Biochem. 2009, 41, 1795–1801. [Google Scholar] [CrossRef]
  38. Dijkstra, F.A.; Cheng, W. Interactions between soil and tree roots accelerate long-term soil carbon decomposition. Ecol. Lett. 2007, 10, 1046–1053. [Google Scholar] [CrossRef]
  39. Zak, D.R.; Pregitzer, K.S.; King, J.S.; Holmes, W.E. Elevated atmospheric CO2, fine roots and the response of soil microorganisms: A review and hypothesis. New Phytol. 2000, 147, 201–222. [Google Scholar] [CrossRef]
  40. Scheer, C.; Grace, P.R.; Rowlings, D.W.; Payero, J. Soil N2O and CO2 emissions from cotton in Australia under varying irrigation management. Nutr. Cycl. Agroecosys. 2013, 95, 43–56. [Google Scholar] [CrossRef]
  41. Reth, S.; Göckede, M.; Falge, E. CO2 efflux from agricultural soils in Eastern Germany-comparison of a closed chamber system with eddy covariance measurements. Theor. Appl. Climatol. 2005, 80, 105–120. [Google Scholar] [CrossRef]
  42. Chen, H.; Hou, H.; Hu, H.; Shang, Z.; Zhu, Y.; Cai, H.; Qaisar, S. Aeration of different irrigation levels affects net global warming potential and carbon footprint for greenhouse tomato systems. Sci. Hortic. 2018, 242, 10–19. [Google Scholar] [CrossRef]
  43. Хазиев, Φ.Х. Soil Enzymes Activities; Science Press: Beijing, China, 1980. (In Chinese) [Google Scholar]
Figure 1. Soil water-filled pore space (WFPS) (a,b,c) and soil temperature (d,e,f) with and without aeration under the irrigation level of 60%W (a,d), 80%W (b,e), and 100%W (c,f) (mean ± SD, n = 3). W refers to full irrigation.
Catalysts 09 00945 g001
Figure 2. The abundance of soil bacteria (a,b), fungi (c,d), and actinomycetes (e,f) with the irrigation level of 60%W, 80%W, and 100% W under the aeration (a,c,e) and control (b,d,f) (mean ± SD, n = 3).
Catalysts 09 00945 g002
Figure 3. Soil microbial biomass carbon (a,b), soil cellulase activity (c,d), and soil dehydrogenase activity (e,f) with the irrigation level of 60%W, 80%W, and 100%W under the aeration (a,c,e) and control (b,d,f) (mean ± SD, n = 3).
Catalysts 09 00945 g003
Figure 4. Total root length (a,b), surface area (c,d), and volume (e,f) with the irrigation level of 60%W, 80%W, and 100%W under the aeration (a,c,e) and control (b,d,f) (mean ± SD, n = 3).
Catalysts 09 00945 g004
Figure 5. Dry biomass of tomato fruit, leaf, stem, and root among treatments on 42, 68, 104, and 142 days after transplanting (DAT). The number 1, 2, 3, 4, 5, and 6 represented treatment of 60%W with aeration, 60%W without aeration, 80%W with aeration, 80%W without aeration, 100%W with aeration, and 100%W without aeration, respectively.
Catalysts 09 00945 g005
Figure 6. Soil respiration with and without aeration under the irrigation level of 60%W (a), 80%W (b), and 100%W (c) (mean ± SD, n = 3).
Catalysts 09 00945 g006
Figure 7. Correlation between soil respiration with soil water-filled pore space (WFPS) for the all WFPS data (a,b) and data with WFPS piecewise analysis (c,d). (a)(c) and (b)(d) represented correlation under the aeration and control, respectively.
Catalysts 09 00945 g007
Figure 8. Daily evaporation, maximum and minimum temperature during the growing season at the experimental site.
Catalysts 09 00945 g008
Table 1. The effects of irrigation, aeration, and their interaction on mean values of soil water-filled pore space (WFPS), temperature, the abundance of soil bacteria (cfub), fungi (cfuf) and actinomycetes (cfua), soil microbial biomass carbon (MBC), soil cellulase activity (CA), dehydrogenase activity (DHA), and soil respiration (Rs) using a two-way ANOVA.
FactorAnalysis of Variance (p-Value)
WFPSTemperaturecfubcfufcfuaMBCCADHARs
Irrigationnsnsnsnsnsnsnsnsns
Aerationnsnsnsnsnsnsnsnsns
Irrigation × Aerationnsnsnsnsnsnsnsnsns
Note: ns—significance at p > 0.05.
Table 2. The effects of irrigation, aeration, and their interaction on mean root morphology and dry biomass using a two-way ANOVA.
FactorAnalysis of Variance (p-Value)
Root MorphologyDry Biomass
LengthSurface AreaVolumeLeafStemFruitRoot
Irrigationnsnsns*ns****
Aeration*nsns***ns
Irrigation × Aerationnsnsnsnsnsnsns
Note: ns, *, and **—significance at p > 0.05, p < 0.05, and p < 0.01, respectively.
Table 3. Relationships of soil respiration (Rs) with soil water-filled pore space (WFPS), the abundance of soil bacteria (cfub) and fungi (cfuf) under the aeration and control treatments.
TreatmentModelR2p
AerationRs = −10.579cfub + 588.6850.5030.001
Rs = −9.997cfuf + 571.8450.6600.000
Rs = 0.257WFPS2 − 36.187WFPS − 0.943cfub − 12.586cfuf + 17990.7020.001
ControlRs = −10.576cfub + 569.3160.4910.001
Rs = −9.142cfuf + 546.8480.6080.000
Rs = −0.351WFPS2 + 41.536WFPS − 2.142cfub − 5.858cfuf − 664.2750.6160.003

