Article

Effect of an Sb-Doped SnO2 Support on the CO-Tolerance of Pt2Ru3 Nanocatalysts for Residential Fuel Cells

1
Special Doctoral Program for Green Energy Conversion Science and Technology, Interdisciplinary, Graduate School of Medicine and Engineering, University of Yamanashi, 4 Takeda, Kofu 400-8510, Japan
2
Fuel Cell Nanomaterials Center, University of Yamanashi, 4 Takeda, Kofu 400-8510, Japan
3
Clean Energy Research Center, University of Yamanashi, 4 Takeda, Kofu 400-8510, Japan
*
Author to whom correspondence should be addressed.
Catalysts 2016, 6(9), 139; https://doi.org/10.3390/catal6090139
Submission received: 8 August 2016 / Revised: 3 September 2016 / Accepted: 7 September 2016 / Published: 10 September 2016

Abstract

:
We prepared monodisperse Pt2Ru3 nanoparticles supported on carbon black and Sb-doped SnO2 (denoted as Pt2Ru3/CB and Pt2Ru3/Sb-SnO2) with identical alloy composition and particle size distribution by the nanocapsule method. The activities for the hydrogen oxidation reaction (HOR) of these anode catalysts were examined in H2-saturated 0.1 M HClO4 solution in both the presence and absence of carbon monoxide by use of a channel flow electrode at 70 °C. It was found that the CO-tolerant HOR mass activity at 0.02 V versus a reversible hydrogen electrode (RHE) on the Pt2Ru3/Sb-SnO2 electrode was higher than that at the Pt2Ru3/CB electrode in 0.1 M HClO4 solution saturated with 1000 ppm CO (H2-balance). The CO tolerance mechanism of these catalysts was investigated by in situ attenuated total reflection Fourier transform infrared reflection-adsorption spectroscopy (ATR-FTIRAS) in 1% CO/H2-saturated 0.1 M HClO4 solution at 60 °C. It was found, for the Pt2Ru3/Sb-SnO2 catalyst, that the band intensity of CO linearly adsorbed (COL) at step/edge sites was suppressed, together with a blueshift of the COL peak at terrace sites. On this surface, the HOR active sites were concluded to be more available than those on the CB-supported catalyst surface. The observed changes in the adsorption states of CO can be ascribed to an electronic modification effect by the Sb-SnO2 support.

Graphical Abstract

1. Introduction

Polymer electrolyte fuel cells (PEFCs) have been intensively developed for the applications of residential cogeneration systems and fuel cell vehicles. In 2009, a 1 kW-class residential PEFC system (ENE·FARM®) was the first such system to be commercialized in Japan, and the total number of systems installed had exceeded 150,000 by the end of 2015. In the fuel processing system (FPS) for such a residential PEFC, hydrogen-rich gas (reformate) is produced by steam-reforming of raw hydrocarbon fuels (CH4 or C3H8), followed by the water-gas-shift reaction to reduce the concentration of CO to a level of several thousand ppm. The CO concentration in the reformate must be reduced further, down to ≤10 ppm, by the preferential oxidation (PROX) of CO. This is because the CO-tolerance of the state-of-the-art commercial anode catalyst, Pt2Ru3 nanoparticles supported on high-surface-area carbon black (c-Pt2Ru3/CB), is insufficient. The hydrogen oxidation reaction (HOR) rate decreases with increasing CO concentration in the fuel due to a blocking of the HOR active sites by adsorbed CO (COad) [1,2,3]. It is quite essential to develop potential anode catalysts with higher CO tolerance, which would make it possible to simplify the FPS and, thus, reduce the cost. For example, if the PROX unit were excluded or replaced with one for the selective methanation of CO, a complicated sub-system (air supply, cooling system, mixer for fuel and air) could be removed from the FPS [4].
To improve the CO tolerance of Pt or Pt-Ru alloy anode catalysts metal oxide materials, such as MoOx [5], SnO2 [6,7,8,9,10,11], WO3 [12], and RuO2 [13], have been used as the support or co-catalyst. The typical effect of such oxides is an increased oxidation rate of COad, which is the major intermediate of the oxidation reaction of methanol or formaldehyde [5,6,7,11,12,13]. Lee et al. [6] proposed a so-called bifunctional mechanism at Pt/SnO2, in which an OH species can be supplied from the SnO2 support to oxidize COad on Pt. A ligand effect was proposed for the methanol oxidation reaction at a PtRu-MoOx catalyst [5]: MoOx was found to weaken the CO adsorption on the Pt-Ru surface, resulting in the enhanced oxidation rate of COad. On the other hand, the CO poisoning effect on the HOR rate was found to be mitigated by the addition of SnO2 particles to Pt/C or Pt-Ru/C [8,9,10], although the mechanism is still unclear.
In the present research, we focus on the effect of Sb-doped SnO2 (electronic conductive oxide support) on the CO-tolerant HOR activity of Pt2Ru3. For this purpose, we have prepared Pt2Ru3 nanoparticles supported on both Sb-SnO2 and conventional carbon black with the identical alloy composition, as well as the identical size distribution. The mechanism of the CO tolerance has been examined by use of the multi-channel flow electrode (M-CFE) cell technique [14] and in situ FTIR analysis.

2. Results and Discussion

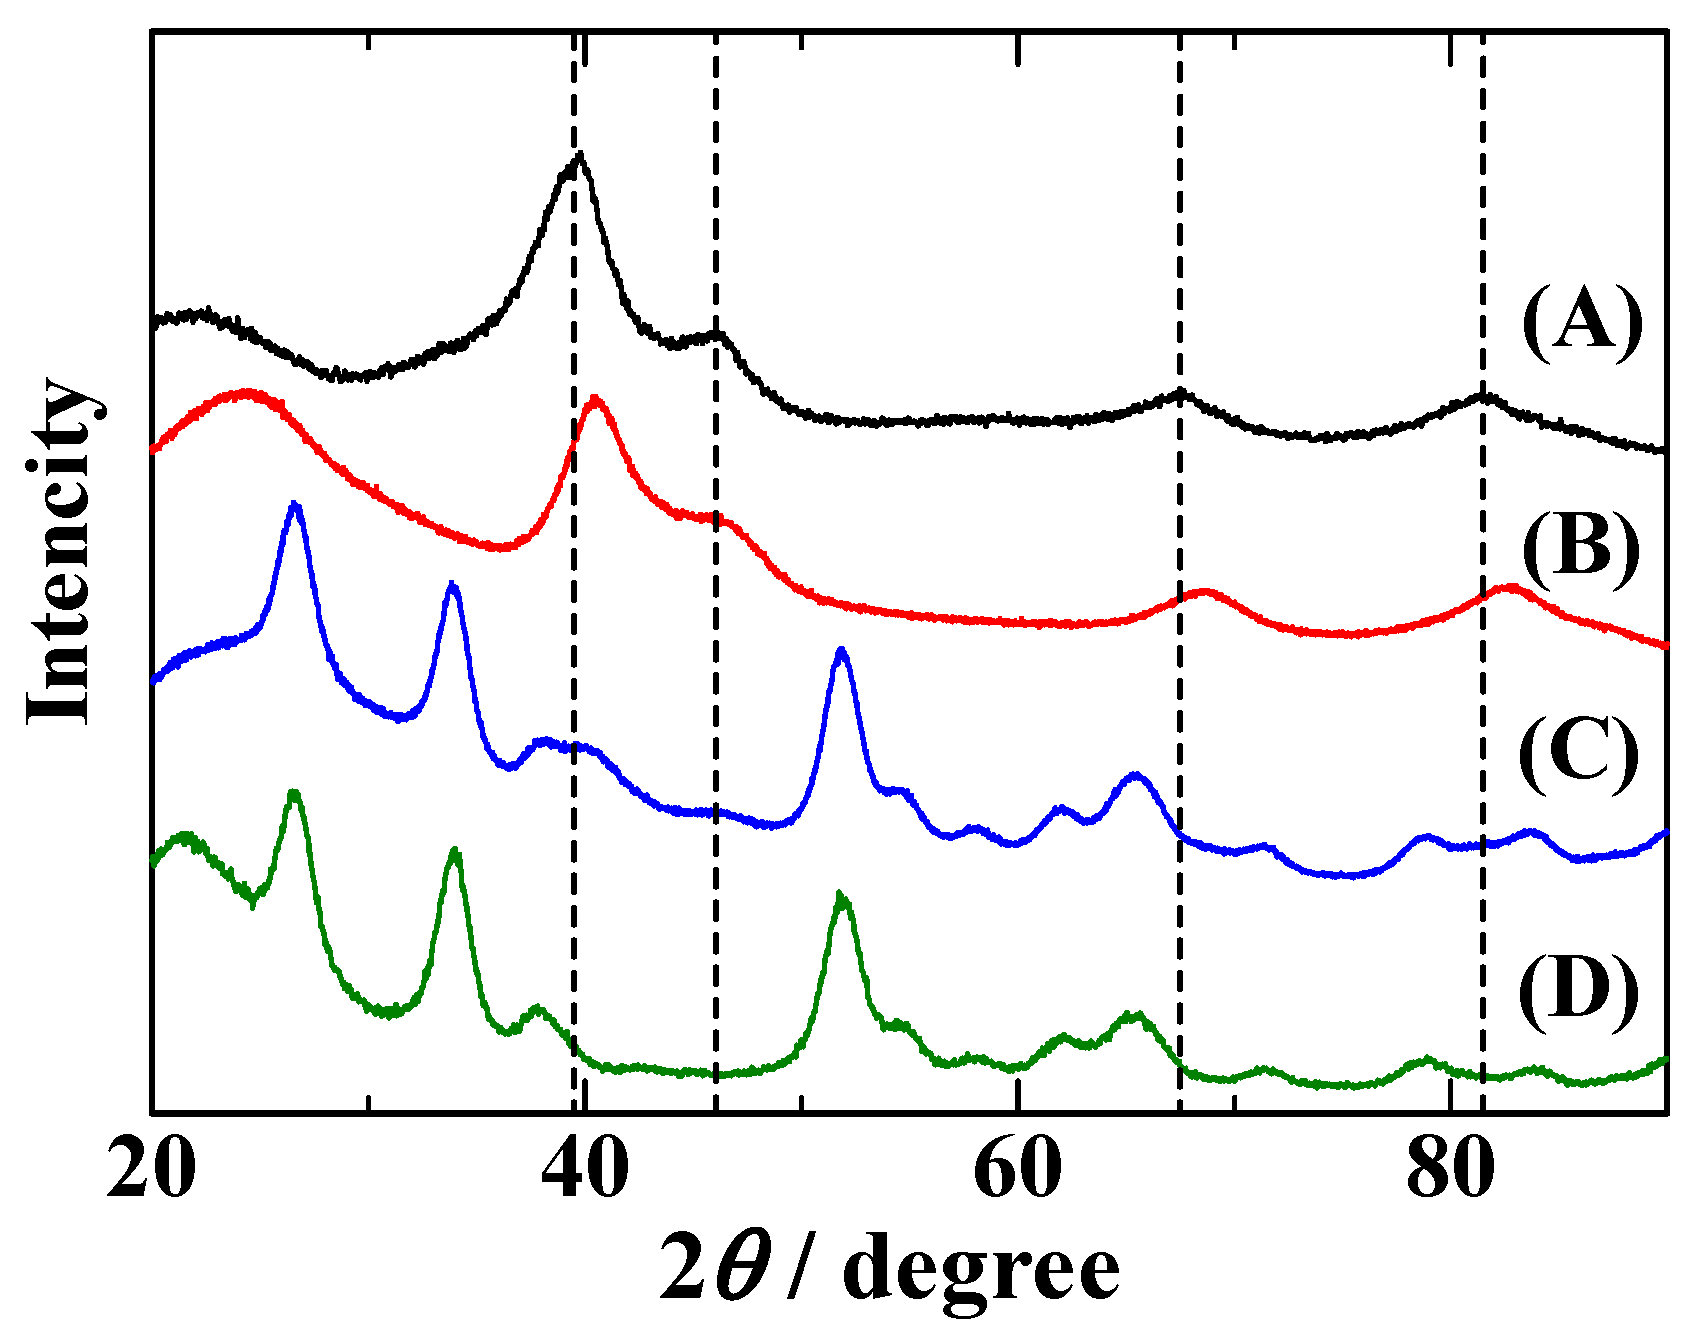
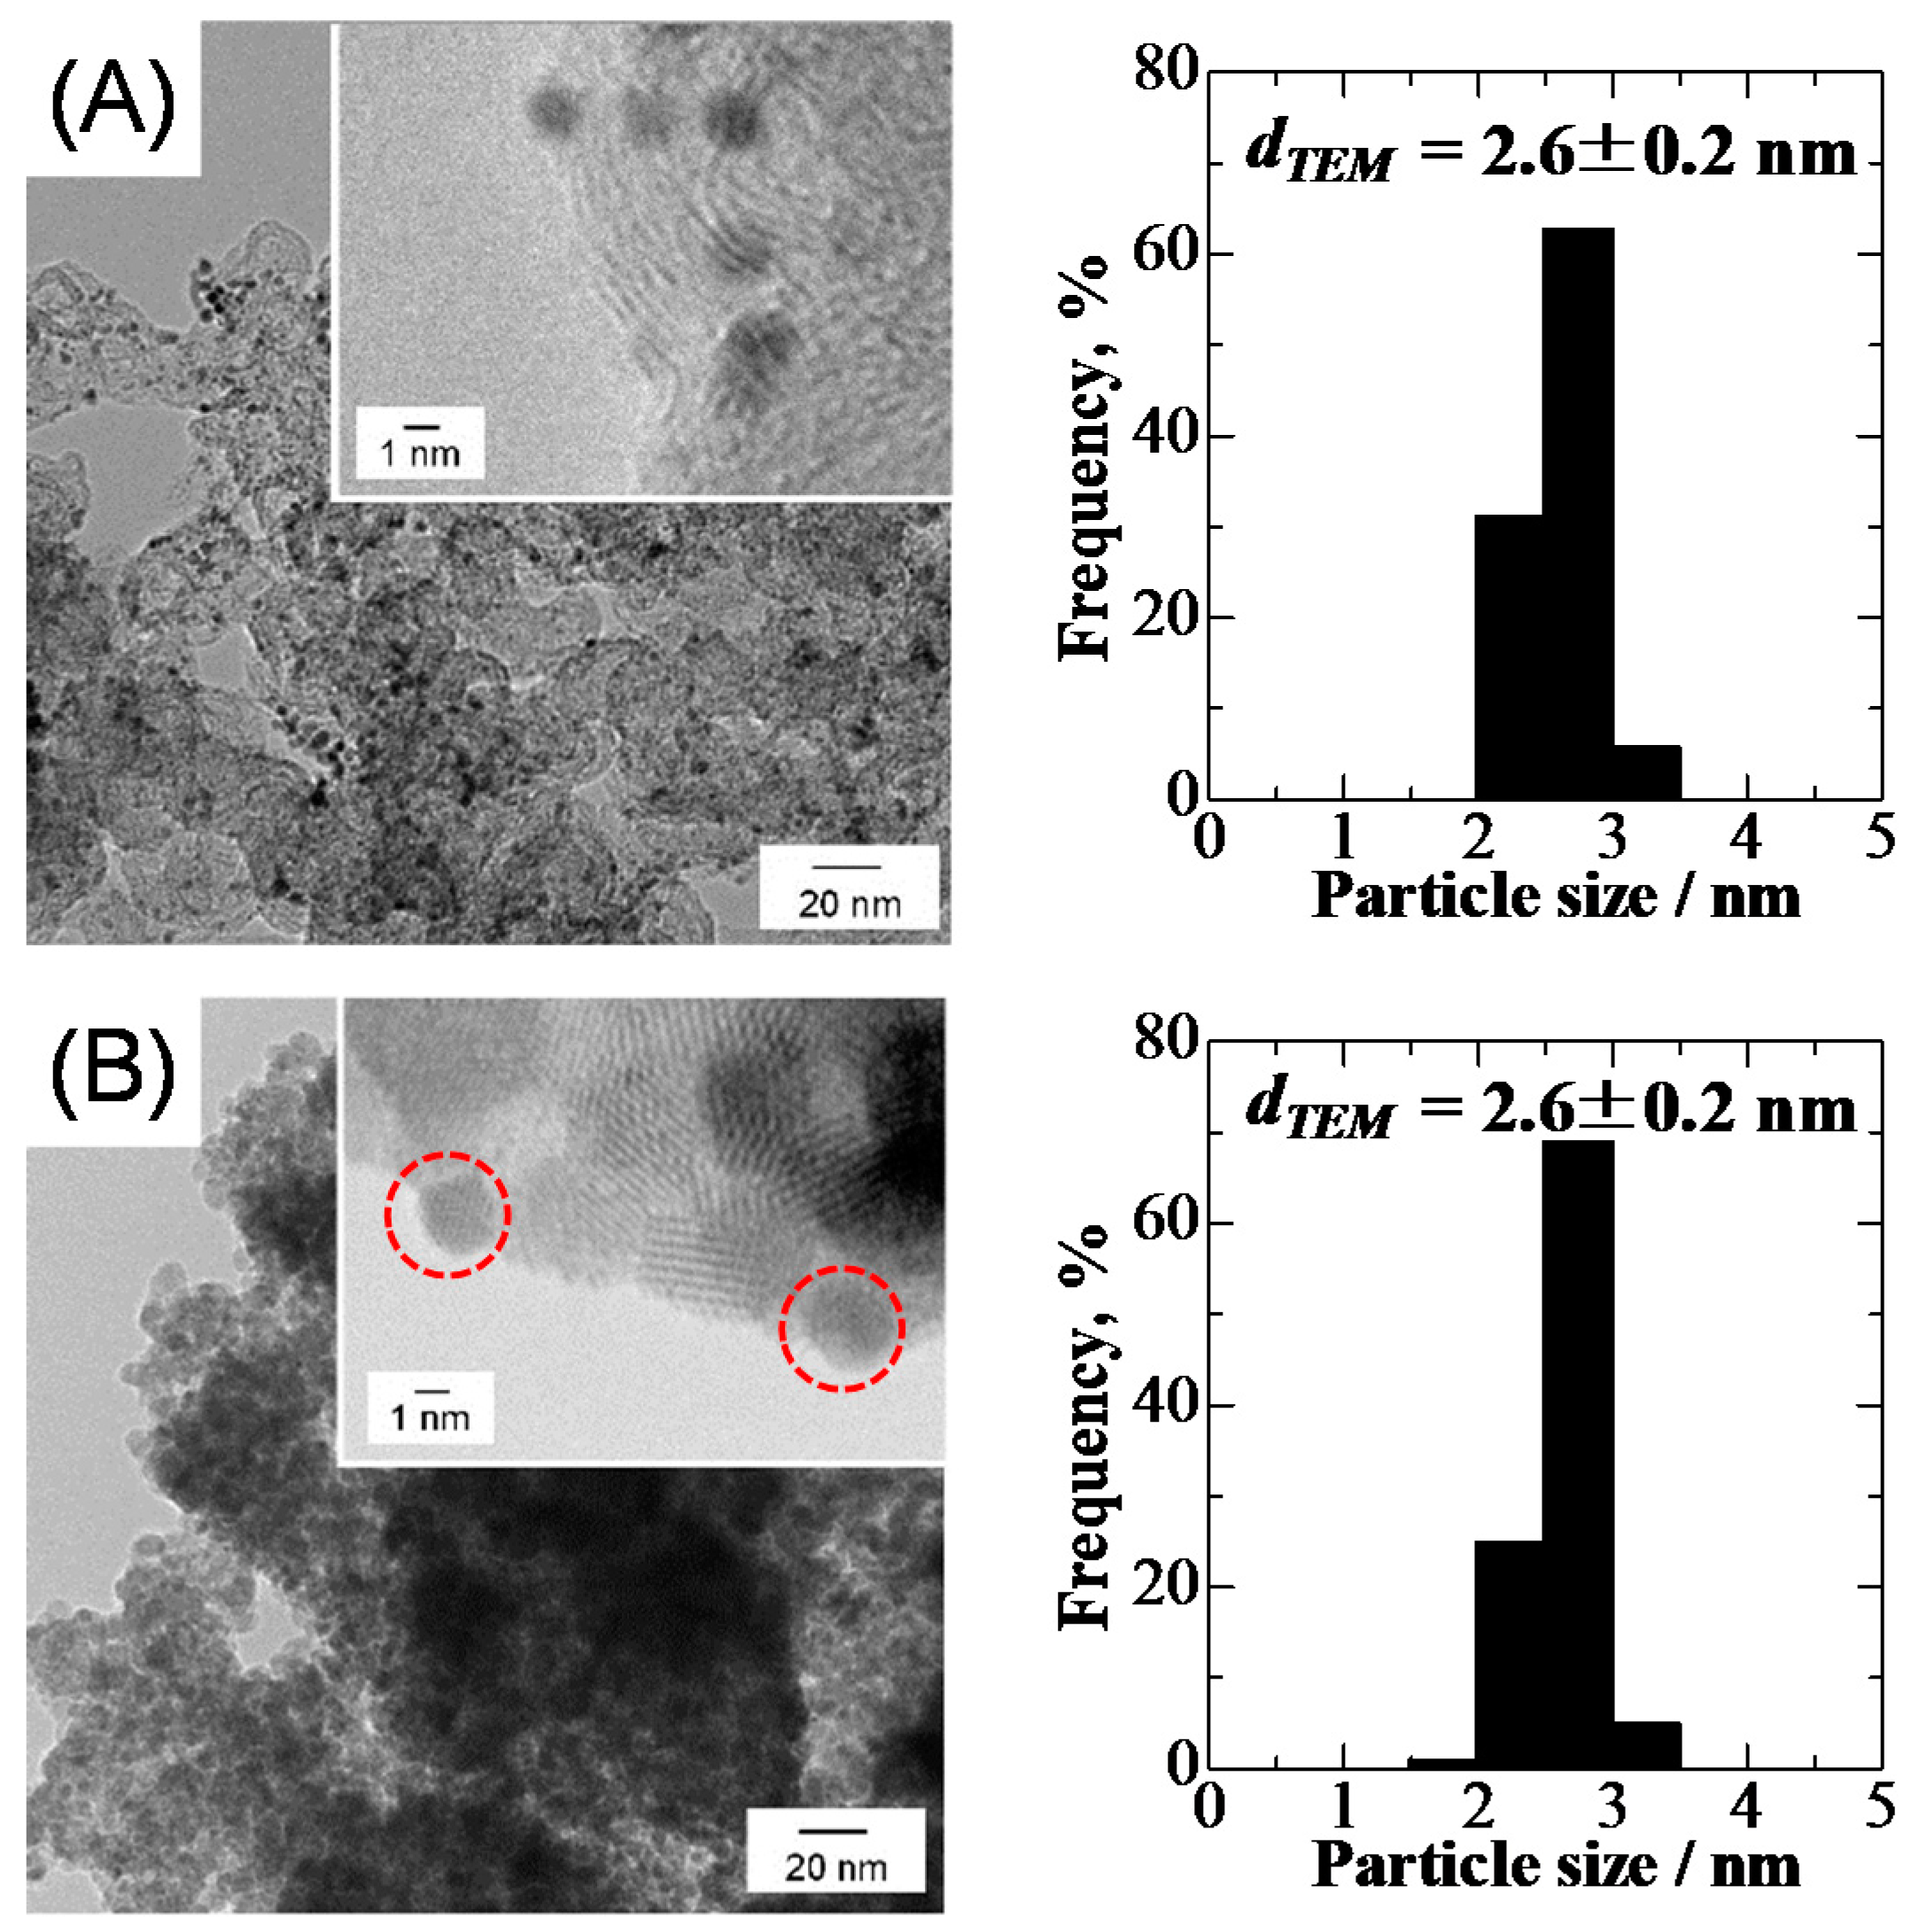
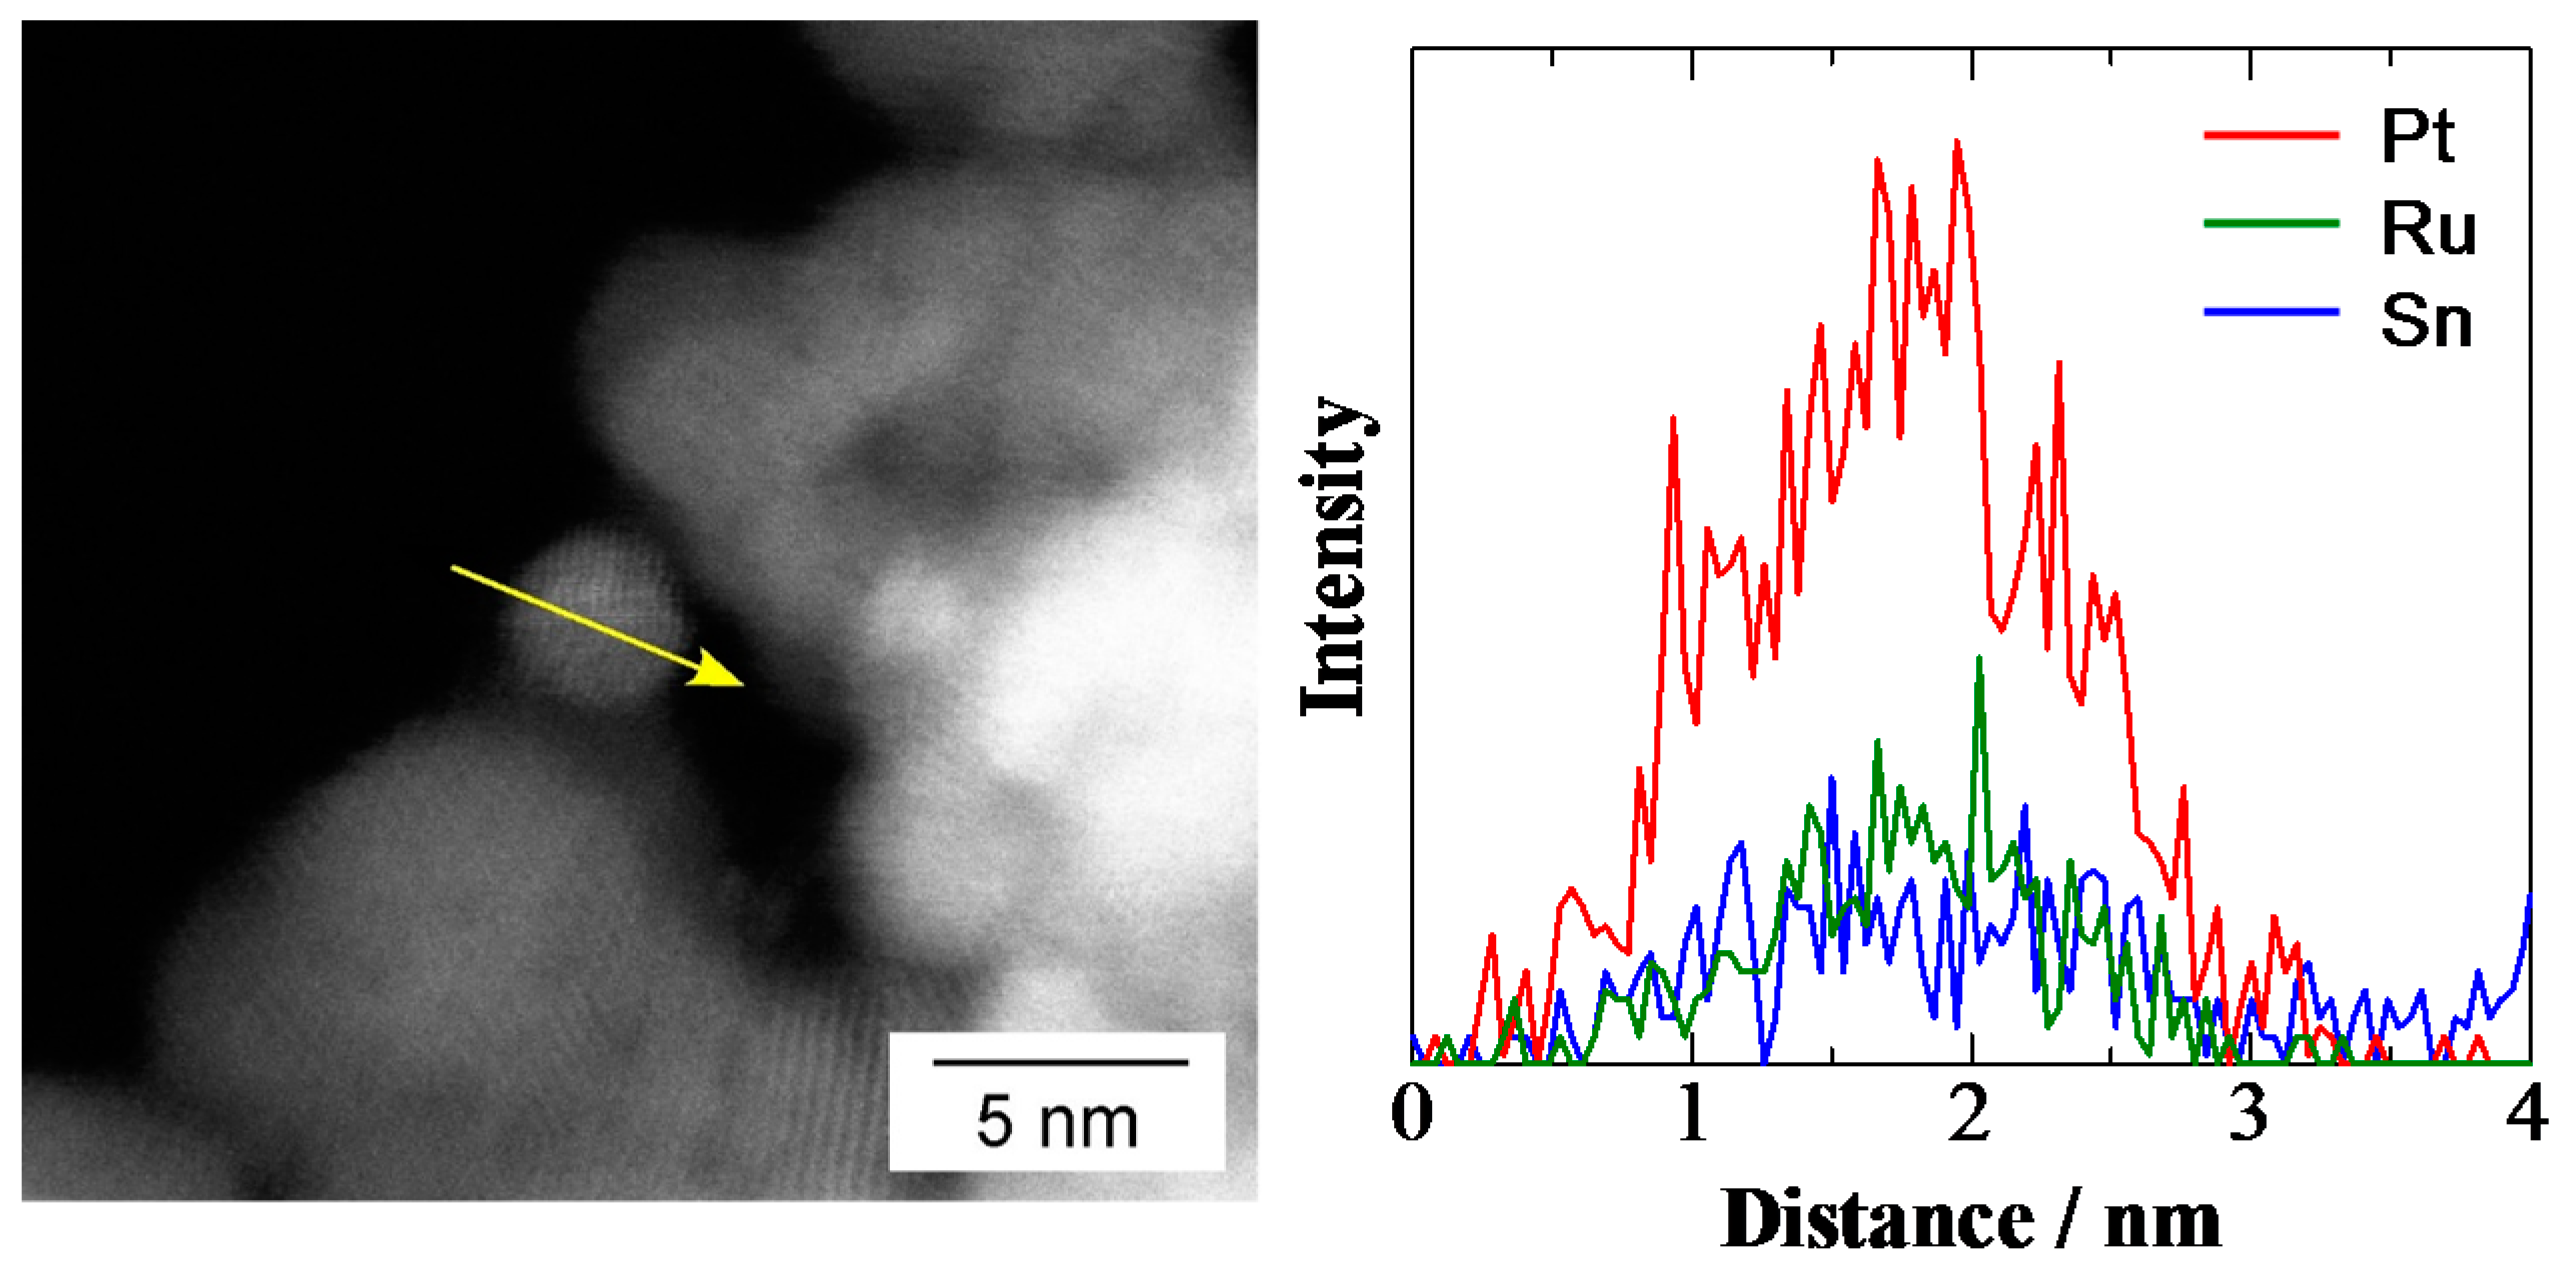
2.1. Characterization of Pt2Ru3/CB and Pt2Ru3/Sb-SnO2

Figure 1 shows X-ray diffraction (XRD) patterns of the Pt2Ru3/CB and Pt2Ru3/Sb-SnO2 catalysts, which were prepared by the nanocapsule method [15,16], together with that of a commercial Pt/CB as a reference. The broad peak at 2θ = ca. 25° observed for Pt2Ru3/CB and Pt/CB was assigned to amorphous carbon. The diffraction peaks assigned to the Pt-Ru alloy for Pt2Ru3/CB were clearly shifted to higher angles than those of pure Pt with the face-centered cubic (fcc) structure. For example, the peak of 2θ = 39.8° observed for Pt/CB was assigned to Pt(111), whereas the corresponding peak for the Pt2Ru3/CB catalyst was observed at 40.5°. As shown in Figure S1 in the Supplementary Materials, all peaks for the Sb-SnO2 support were well assigned to rutile-type SnO2. Such a series of peaks, with identical intensity ratios, were also observed for Pt2Ru3/Sb-SnO2, except that additional small peaks were seen, which could be assigned to the Pt-Ru alloy phase. No additional peaks, for example, ones that could have been assigned to Ru or Ru oxides, were observed for either Pt2Ru3/CB or Pt2Ru3/Sb-SnO2. We calculated the average lattice constant of the Pt-Ru alloy in these catalysts based on the (111), (200), (220), and (311) diffraction peaks. As shown in Figure S2 in the Supplementary Materials, the average lattice constants of Pt2Ru3/CB, Pt2Ru3/Sb-SnO2, and commercial Pt2Ru3/CB were all located at 60 atom %-Ru on the regression line in a plot based on Vegard’s law, indicating that an fcc solid solution was formed from Pt and Ru [16].
Figure 2 shows transmission electron microscopy (TEM) images and particle size distribution histograms of Pt2Ru3/CB and Pt2Ru3/Sb-SnO2. The average particle size dTEM (determined from 500 particles in several TEM images), standard deviation σd, chemical composition, and amount of metal supported are summarized in Table 1. Since the transmittance of the electron beam for Pt2Ru3 alloy nanoparticles and Sb-SnO2 support particles was very similar, it was difficult to distinguish the Pt2Ru3 alloy nanoparticles in a single TEM image. Therefore, we measured the sizes of Pt2Ru3 particles from a dozen different images (four typical images of Pt2Ru3/Sb-SnO2 are shown in Figure S3). Nanoparticles ranging from 2 to 3 nm in size were uniformly dispersed on CB and Sb-SnO2 supports. The values of d and very narrow size distributions (σd < 10% of dTEM) for both catalysts were nearly identical, 2.6 ± 0.2 nm, as seen in the histograms. It is also noteworthy that the average chemical compositions of Pt-Ru analyzed by inductively-coupled plasma mass analyzer (ICP-MS) were nearly equal to the projected value (Pt2Ru3) for both catalysts. Thus, we succeeded in preparing Pt2Ru3 nanoparticles highly dispersed on both Sb-SnO2 and CB, with the identical alloy composition as well as the identical size distribution, by the use of the nanocapsule method.

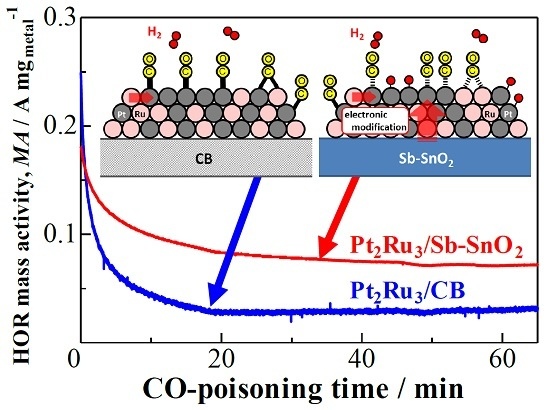
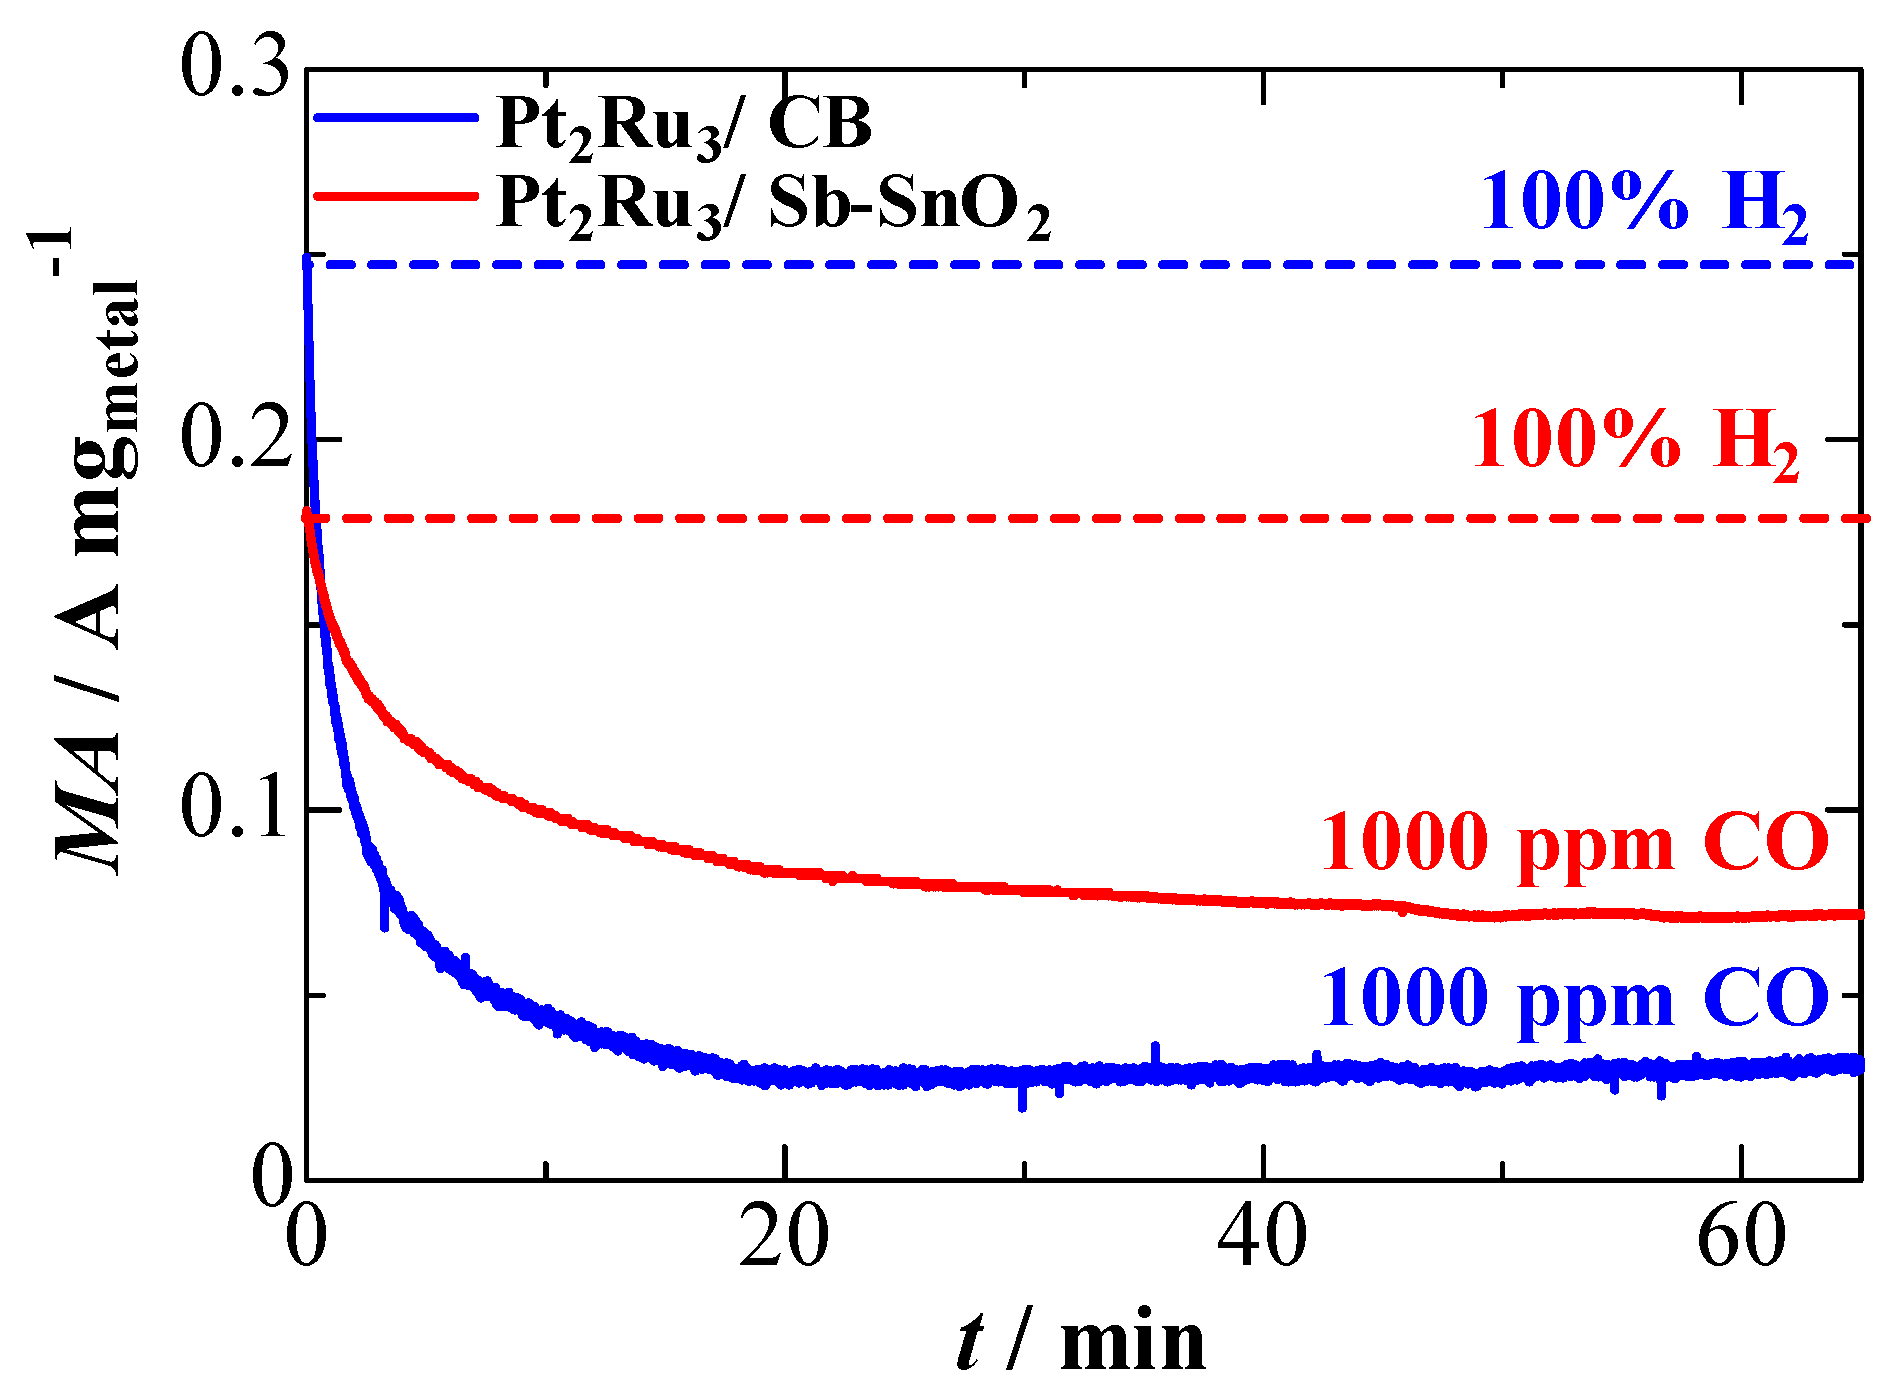
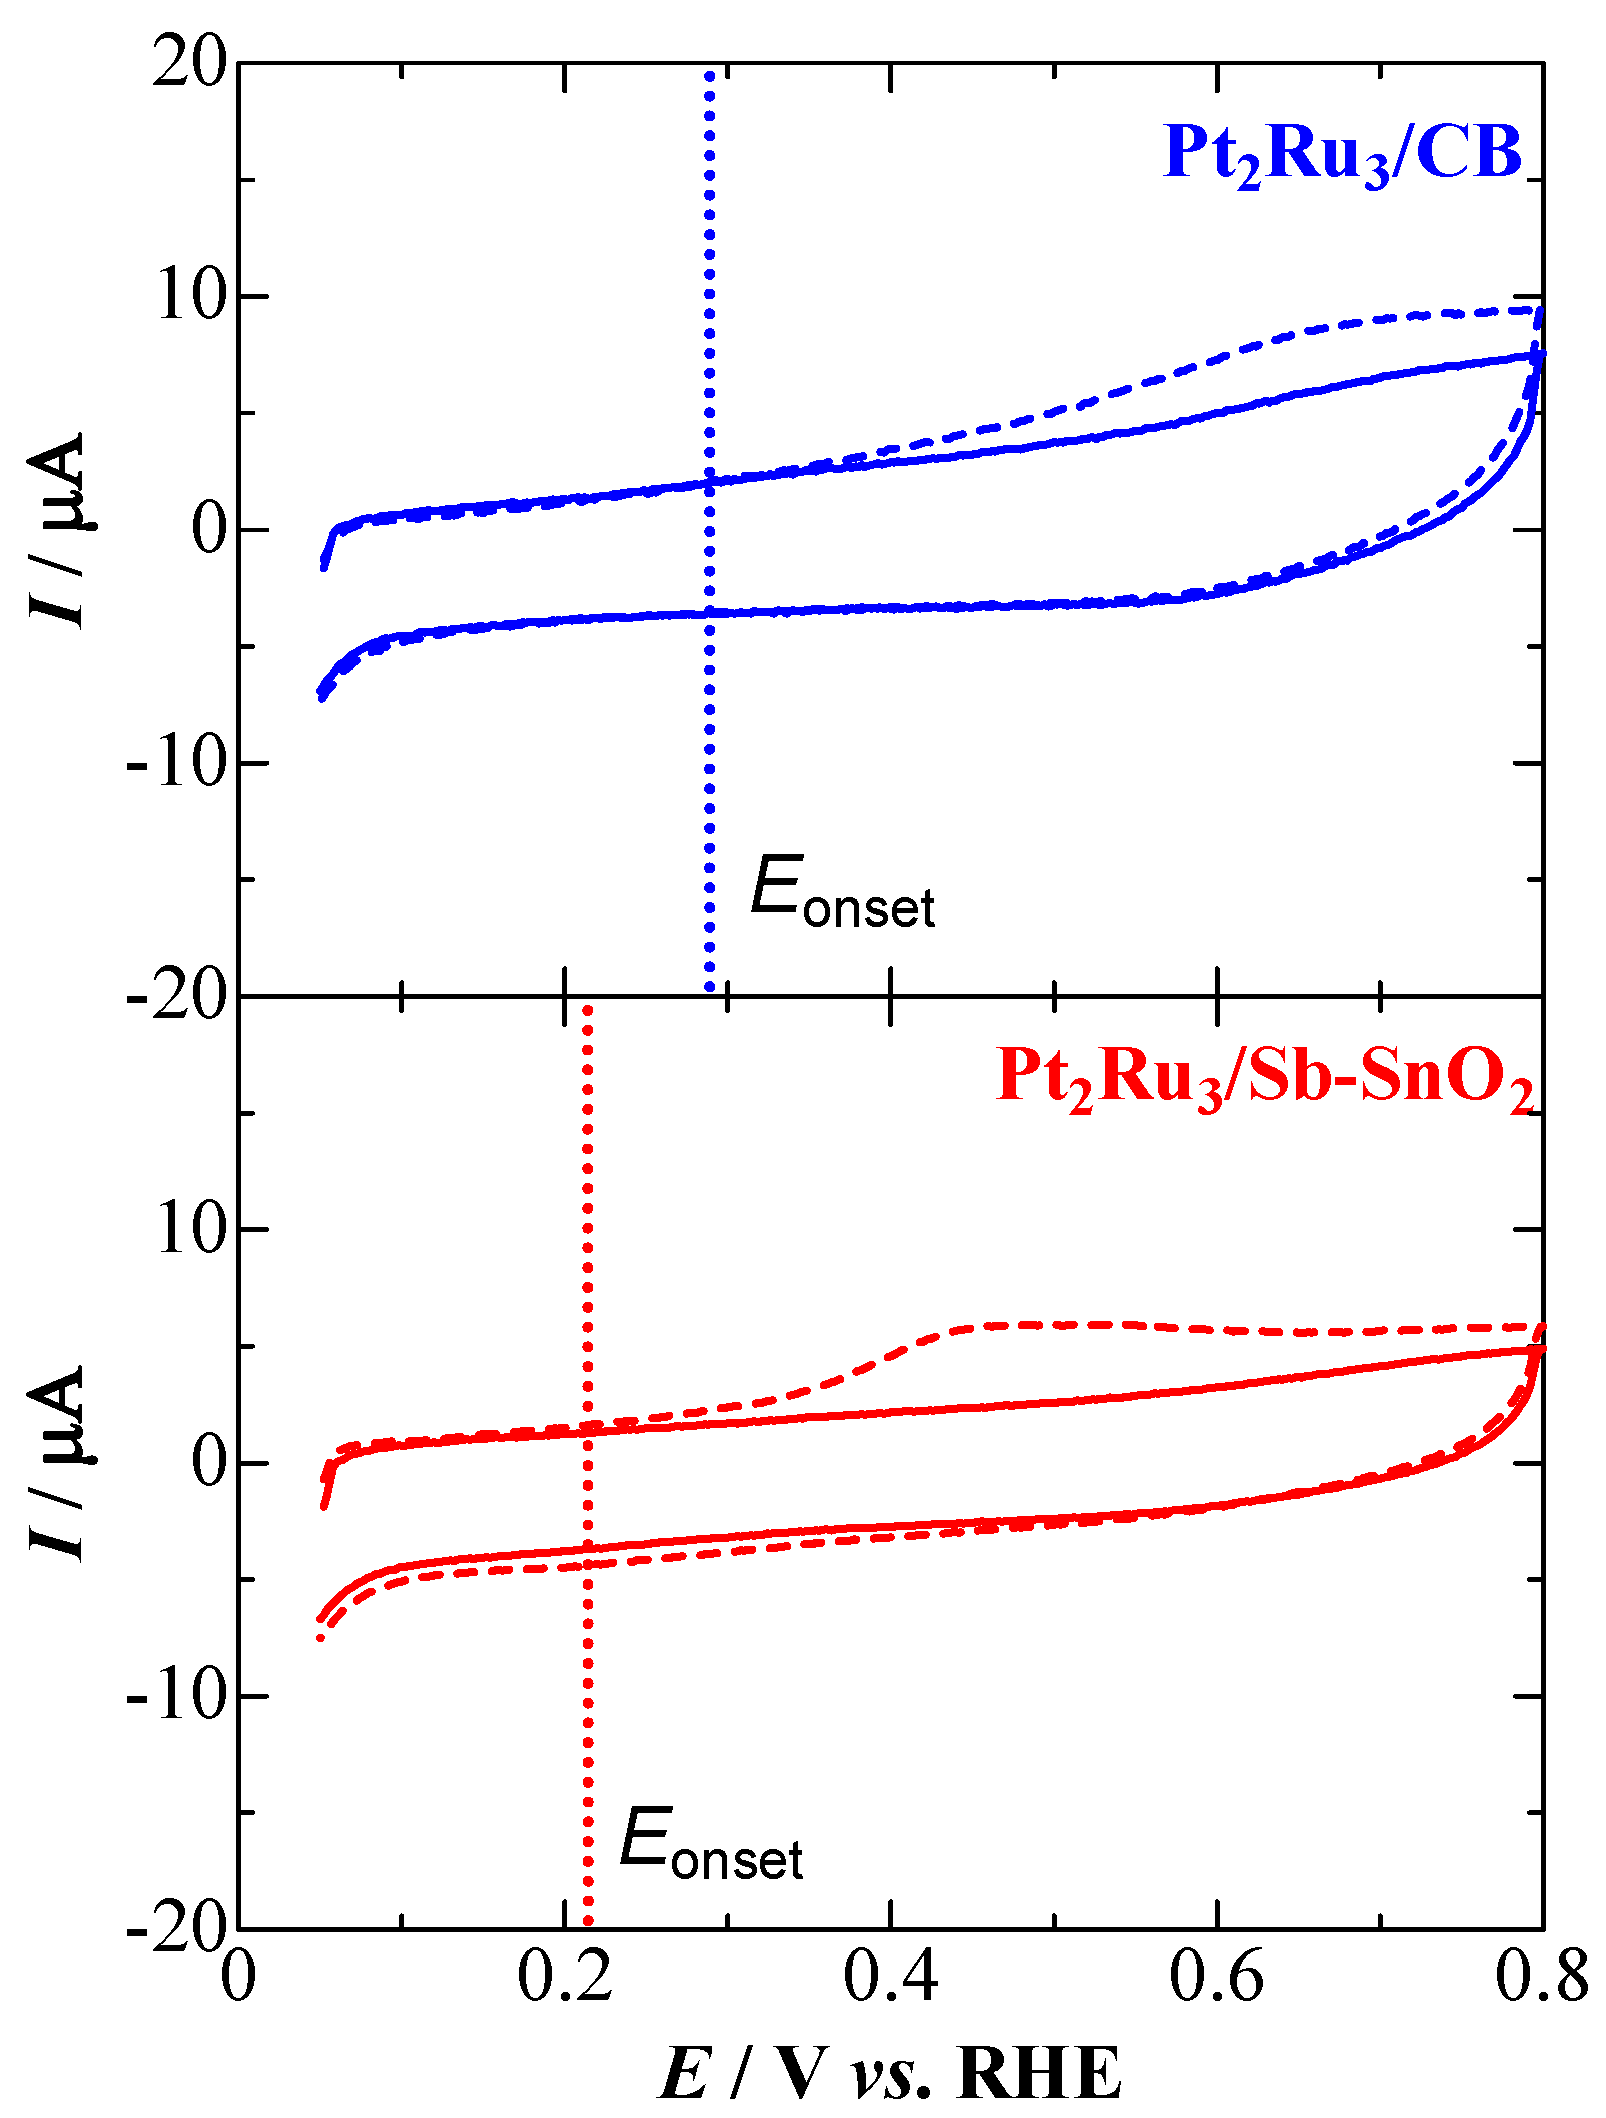
2.2. CO Tolerance for the Hydrogen Oxidation Reaction (HOR)

We evaluated the hydrogen oxidation reaction (HOR) activity on both catalysts at 0.02 V (practical operating potential in PEFCs) versus a reversible hydrogen electrode (RHE) in the presence and absence of CO in 0.1 M HClO4 electrolyte solution at 70 °C by use of the multi-channel flow electrode (M-CFE) cell. Figure 3 shows time courses of the mass activity for the HOR (MA, HOR current per unit metal mass loaded) at 0.02 V vs. RHE under a flow of 0.1 M HClO4 solution saturated with pure H2 or H2 containing 1000 ppm CO. The MA value at the CB supported catalyst was as high as 0.25 A·mgmetal−1 in pure H2-saturated solution, but it decreased rapidly in contact with CO, losing about 90% of the activity after 20 min due to severe CO poisoning. In contrast, the steady-state MA value at the Pt2Ru3/Sb-SnO2 electrode observed after 60 min of CO-poisoning was about two times larger than that observed at the electrode with CB-supported catalyst, even though the MA value in pure H2-saturated solution was only about 70% of that for the CB-supported catalyst.
One of the possible mechanisms for the CO tolerance at Pt-Ru alloy catalysts is the bifunctional mechanism, in which the oxidation of CO molecules adsorbed on Pt sites (Pt-CO) is facilitated by oxygen-containing species on Ru sites (such as Ru-OH) [17,18]. To examine the activity for the oxidation of COad on Pt2Ru3/Sb-SnO2 and Pt2Ru3/CB, CO-stripping voltammograms were measured in 0.1 M HClO4 solution at 70 °C. As shown in Figure 4, the anodic current due to COad oxidation on the Sb-SnO2-supported catalyst was observed with an onset potential of 0.21 V, whereas that for the COad oxidation on the CB-supported catalyst was ca. 0.28 V. This suggests that the use of the Sb-SnO2 support accelerated the COad oxidation reaction on the Pt2Ru3 catalyst, because the particle size and the average alloy composition for both catalysts were identical, as described above. Such an enhancement in the COad oxidation activity on the Pt2Ru3/Sb-SnO2 accords well with that reported for the increased oxidation rate of CH3OH and HCHO on PtRu/Sb-SnO2 [11], Pt/SnO2 [7], and Pt2Ru3/SnO2/C [9]. Nevertheless, the mitigation of CO poisoning for the HOR at 0.02 V on the Pt2Ru3/Sb-SnO2 electrode shown in Figure 3 is not ascribable to such an increase in the COad oxidation activity, because COad is not oxidized at potentials less positive than 0.1 V, even for the Pt2Ru3/Sb-SnO2 catalyst at 70 °C, as shown in the CO-stripping voltammogram. Therefore, we focus next on the difference in the adsorption state of CO on Pt2Ru3 supported on Sb-SnO2 and CB by the use of in situ FTIR.

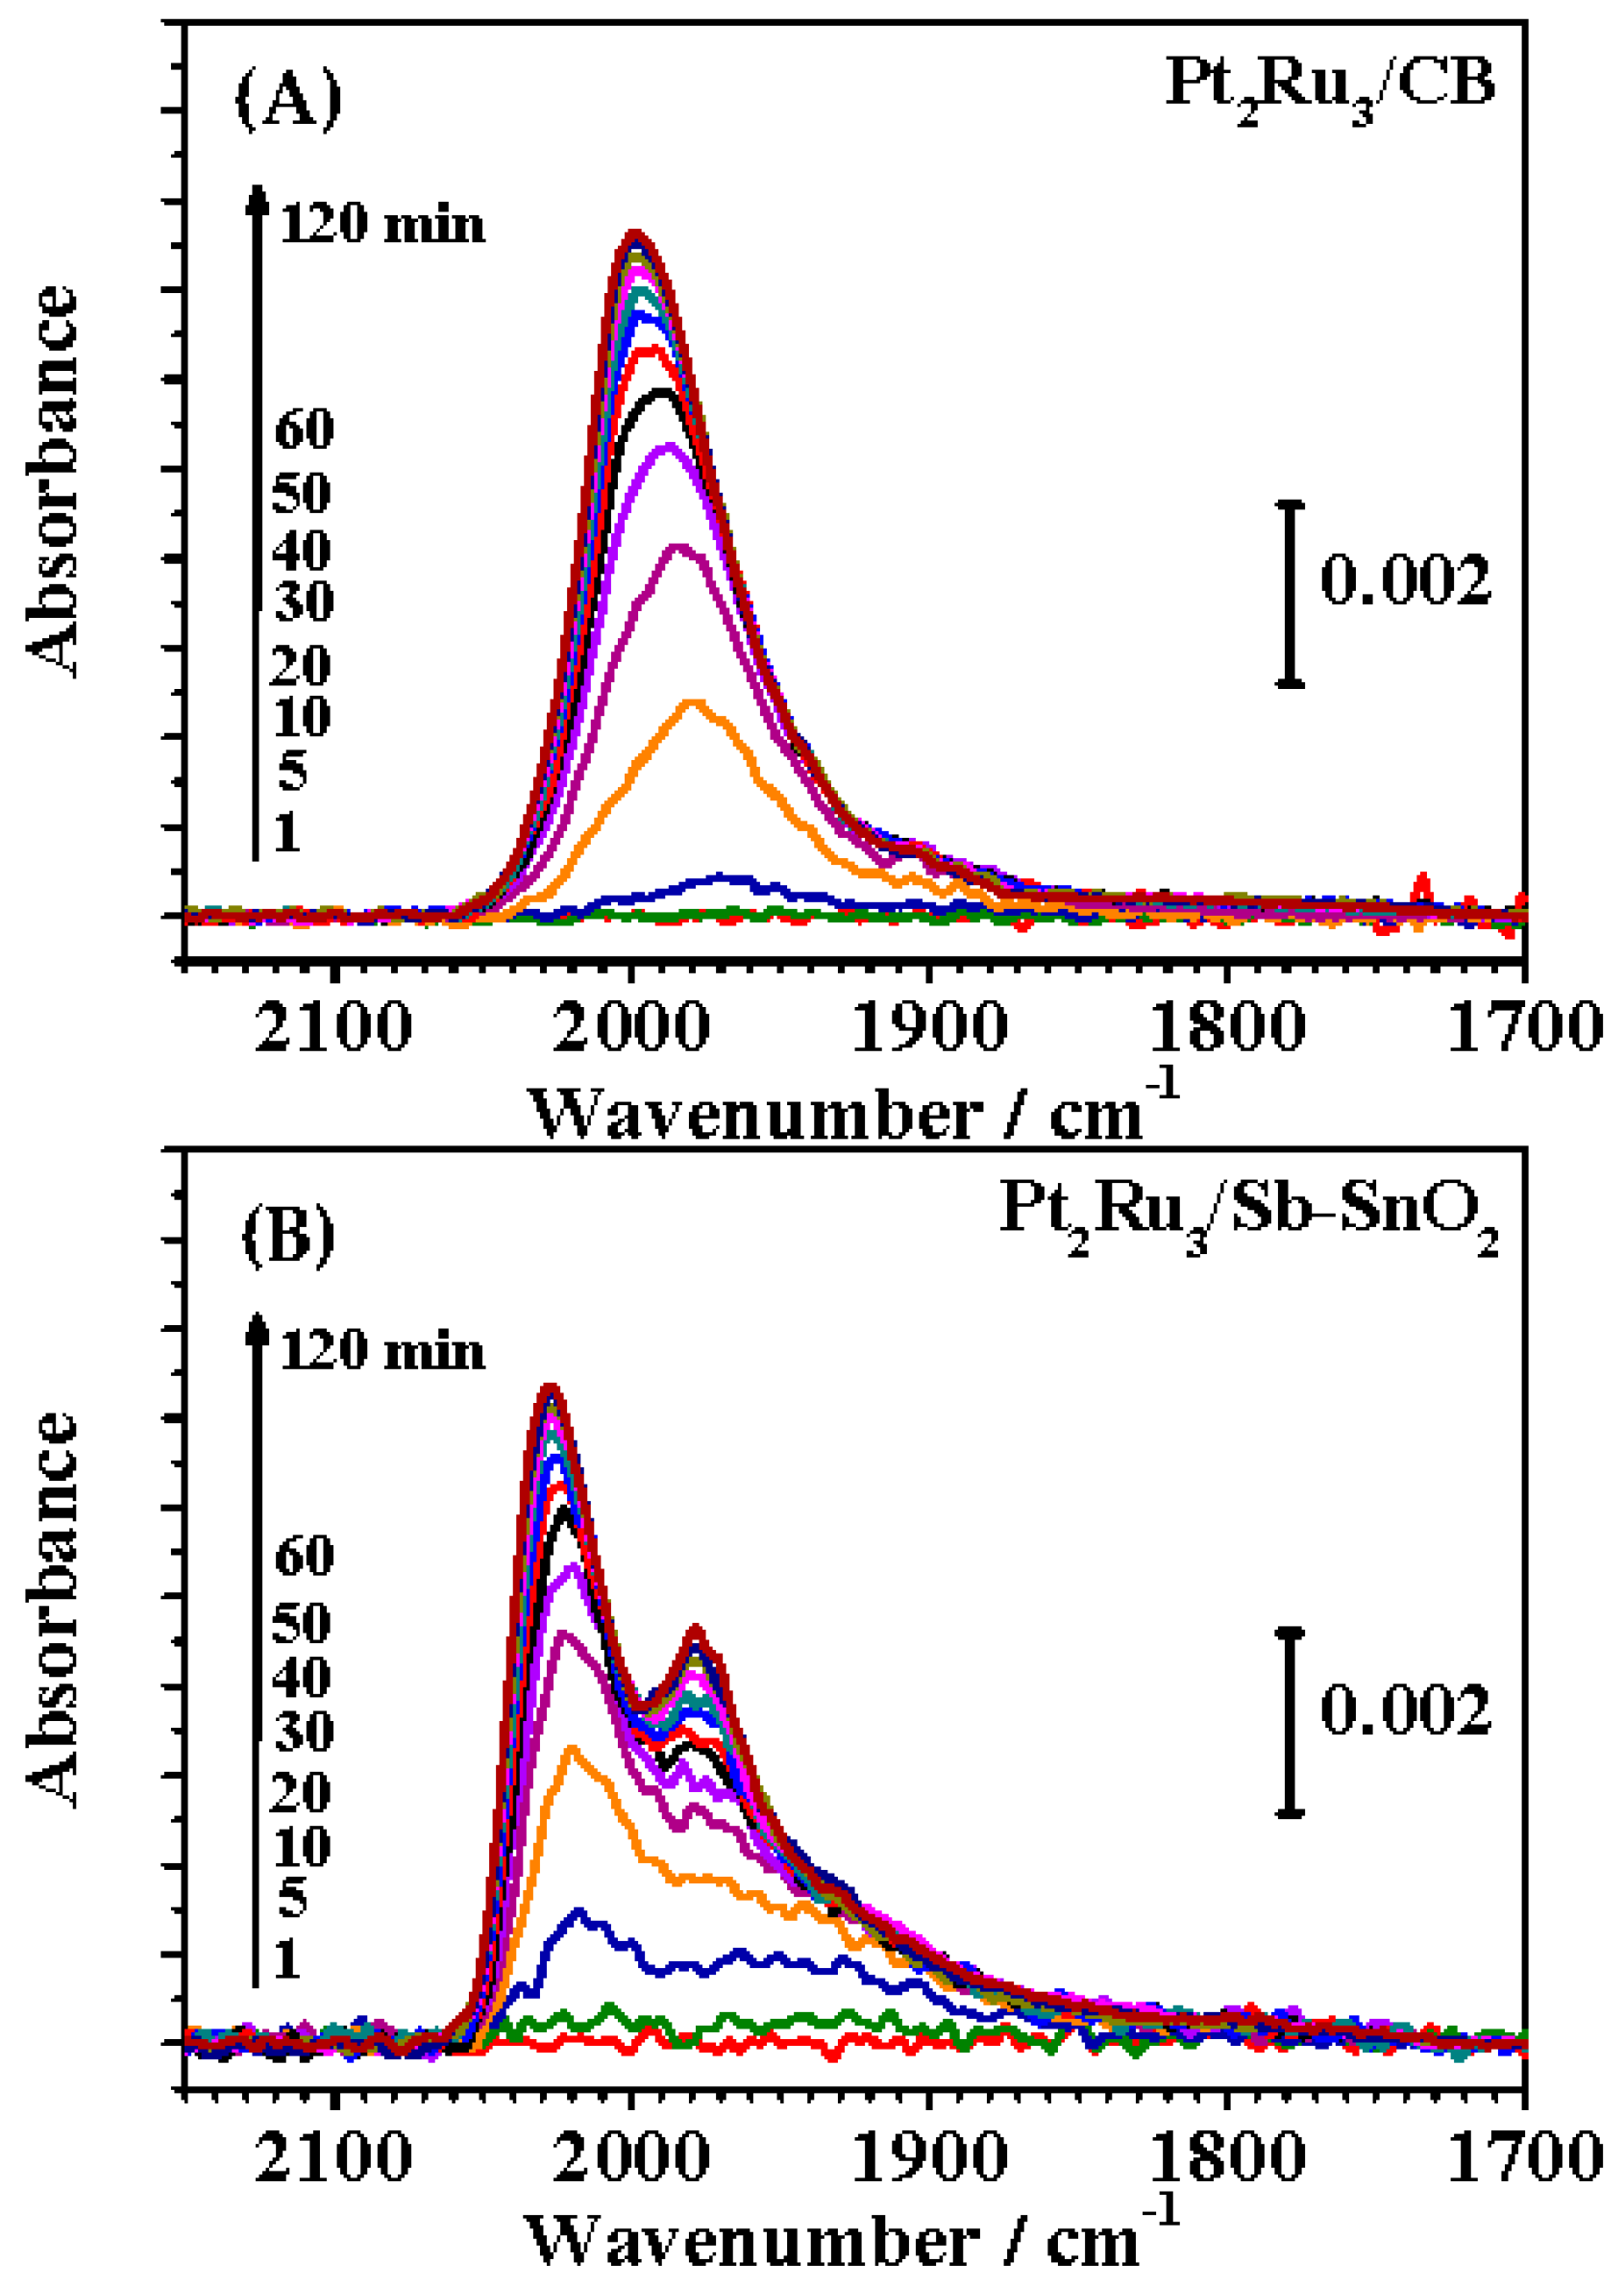
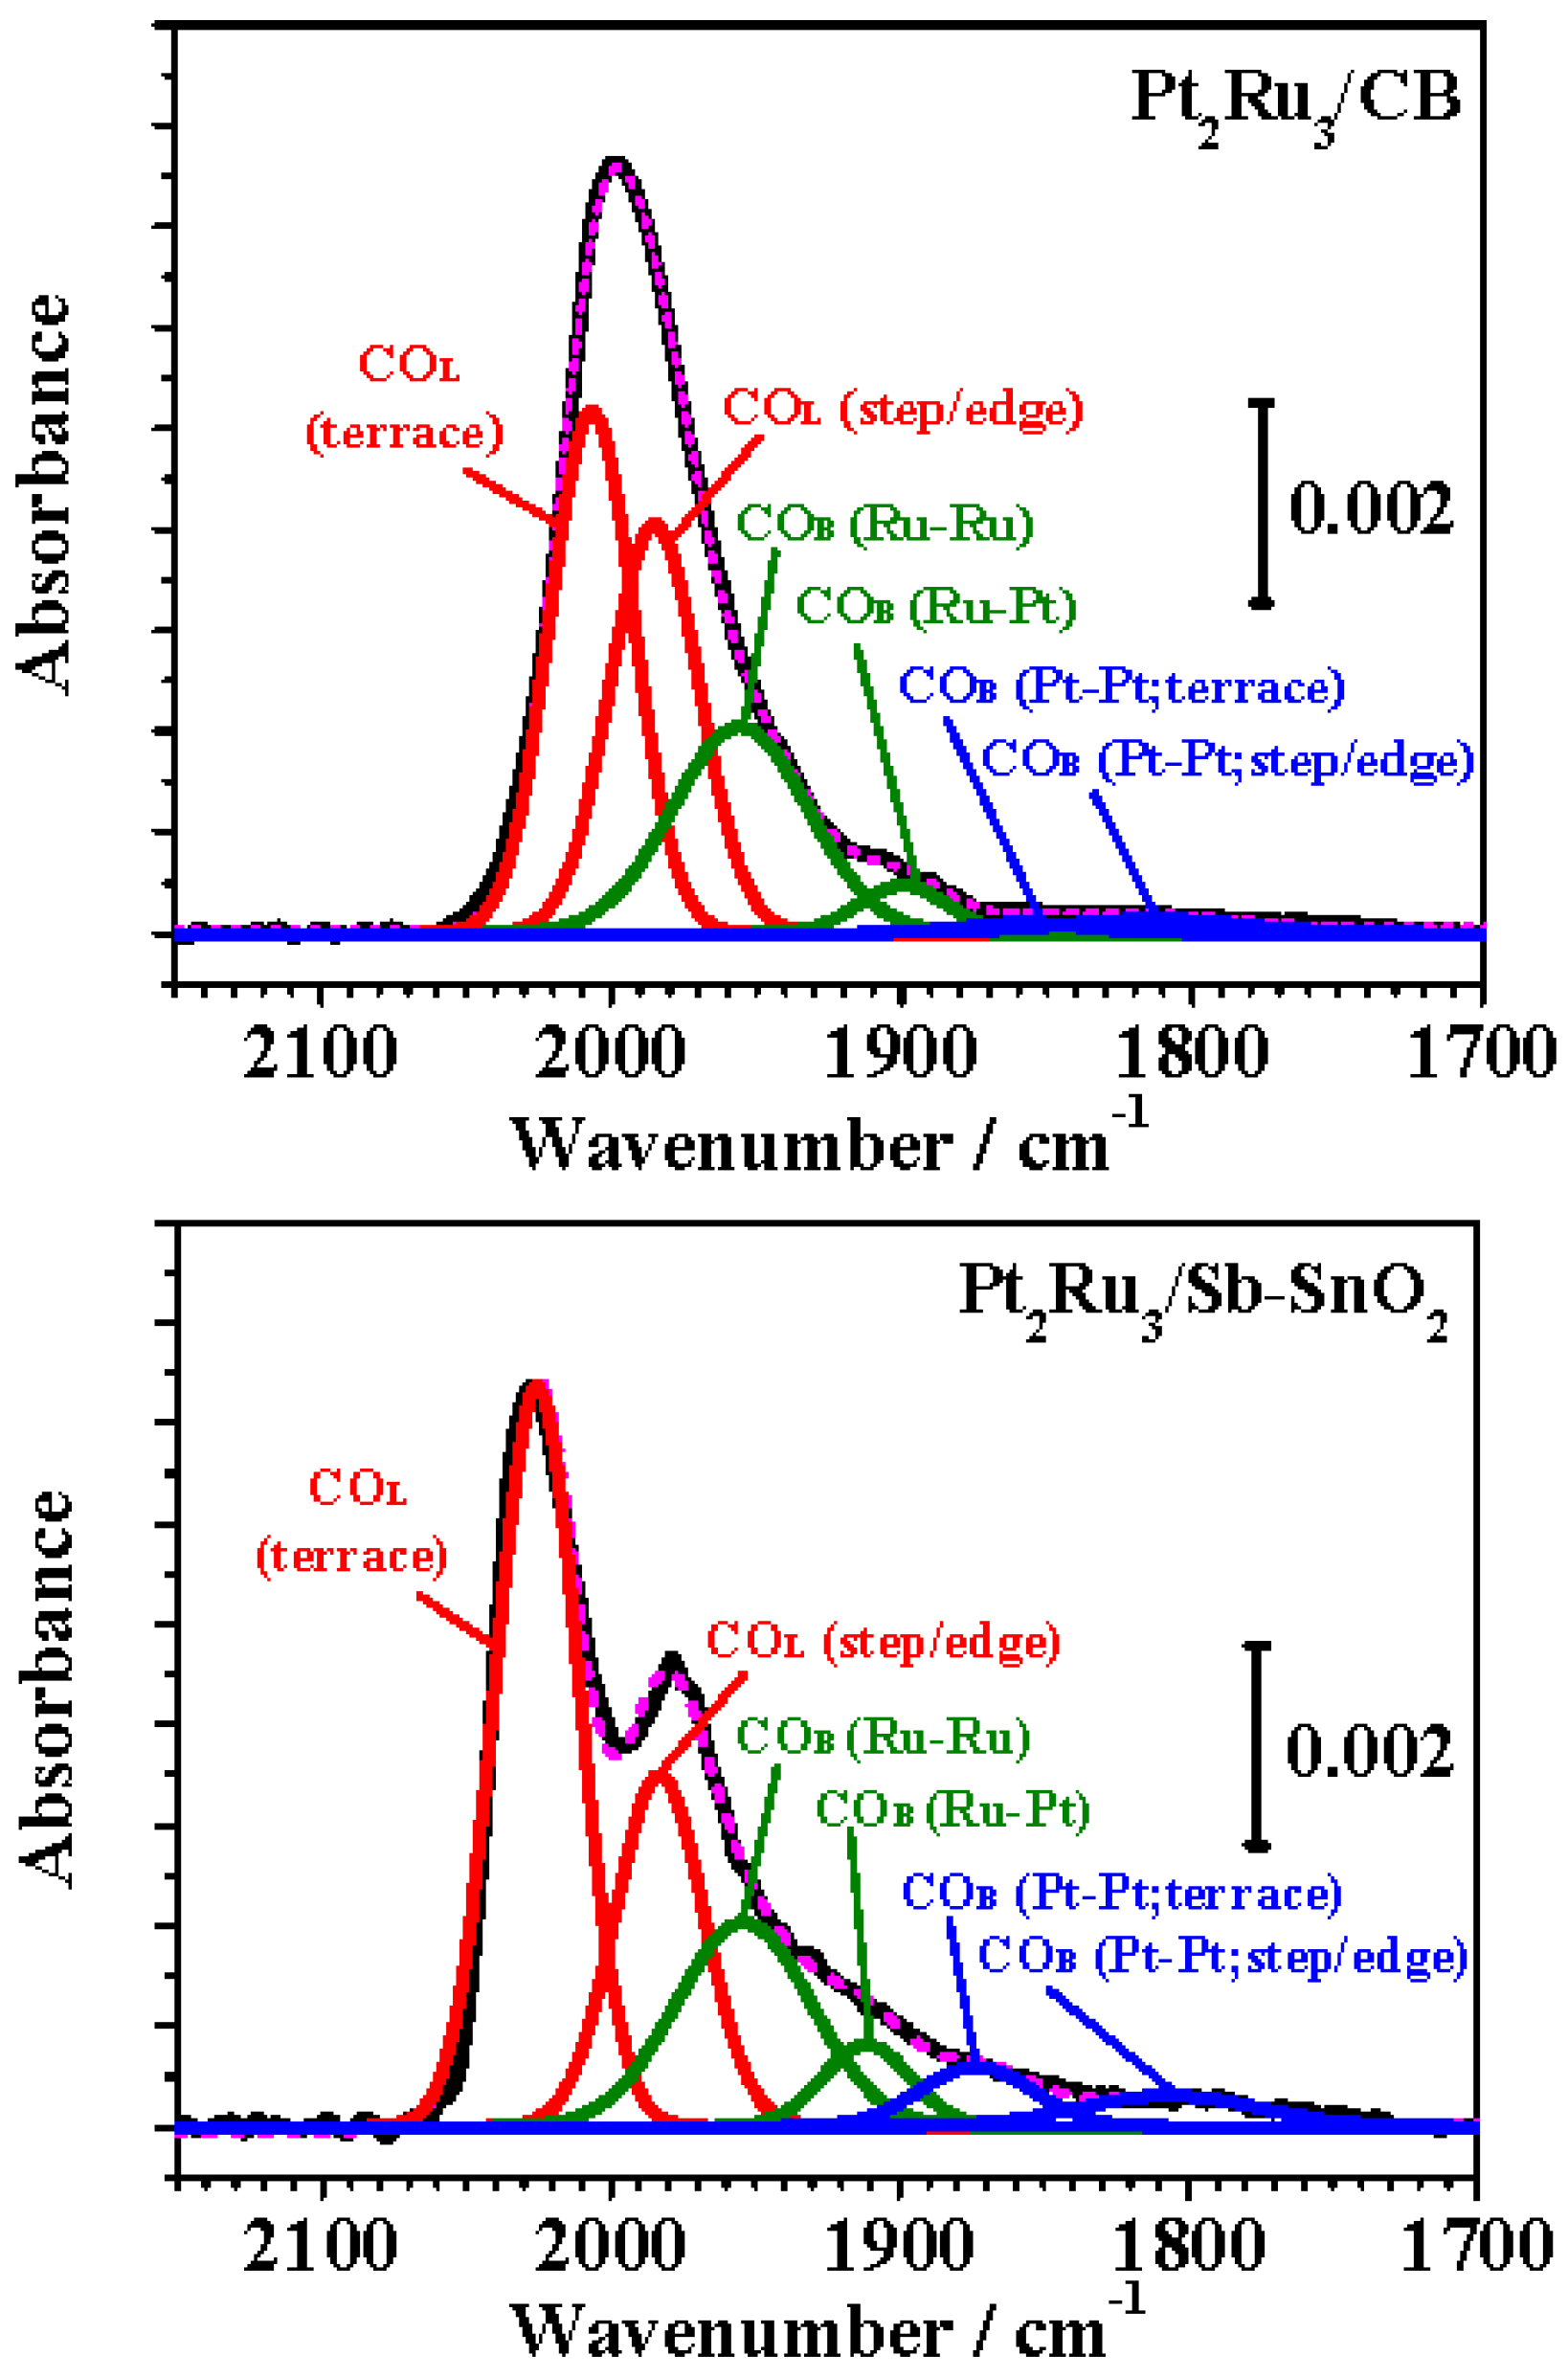
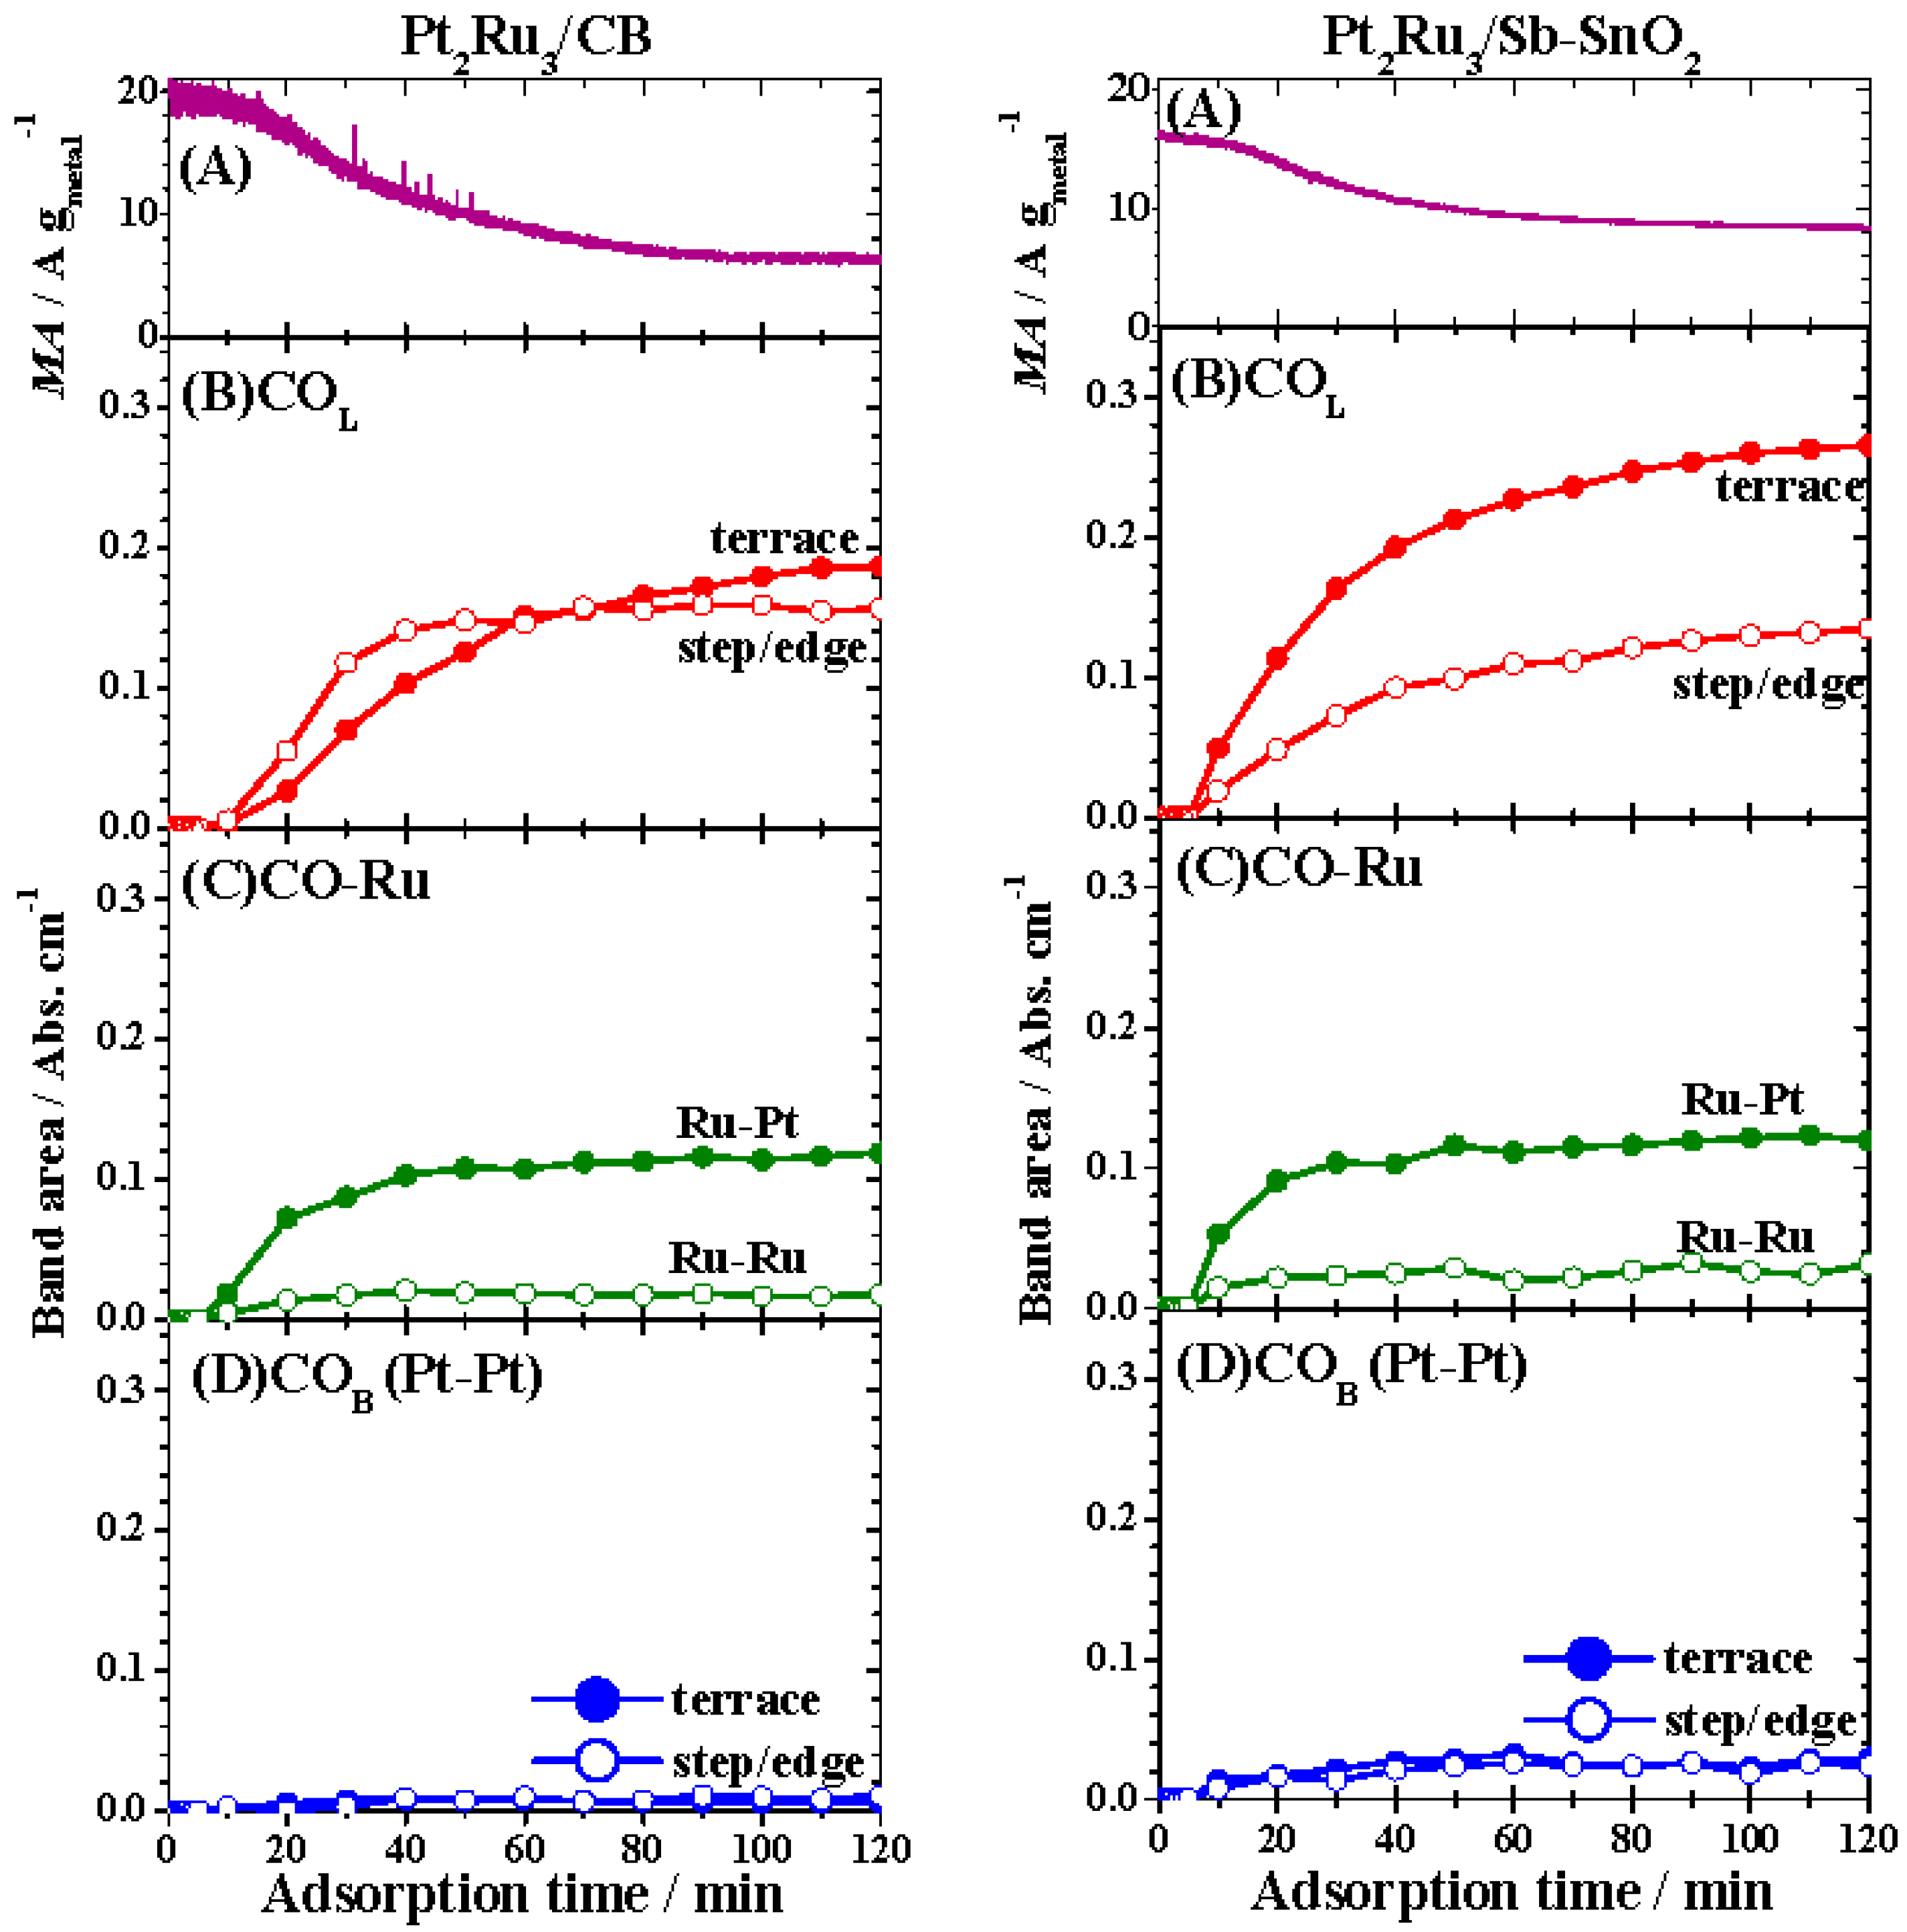
2.3. FTIR Analysis of CO Adsorption on Pt-Ru Alloys

Figure 5 shows changes in the IR spectra with CO adsorption time at 0.02 V and 60 °C in 0.1 M HClO4 saturated with 1% CO (H2 balance). The potential of 0.02 V for CO adsorption was precisely the same as that examined in the CFE experiment described above. The bands observed around 2000 cm−1, 1950 cm−1 and 1800 cm−1 were assigned to COad with the configuration of linear (on-top) (COL), bridged on Ru-Ru sites and Ru-Pt sites (CO-Ru, consisting of COB(Ru-Ru) and COB(Ru-Pt)), and bridged on Pt-Pt pair sites (COB(Pt-Pt)), respectively [19,20,21]. All of the band intensities increased with CO adsorption time and reached nearly steady-state levels after 2 h. It was also confirmed from the CO-stripping voltammogram observed after 2 h of in situ FTIR measurement that the value of θCO was approximately 90% for both catalysts. Similar to the case of the CO adsorption process observed for various Pt2Ru3/CB, Pt/C or Pt black catalysts [19,20,21], the time courses of the spectra in Figure 5 indicate that each band (COL, CO-Ru, and COB(Pt-Pt)) consists of multiple components. It is most likely that this multiplicity can be ascribed to the fact that CO is adsorbed on slightly different sites (such as terraces or step/edge sites), even though the configuration of COad is identical. The deconvolution of the FTIR spectra of COad and the assignments of each band were discussed in detail in our previous work [19,20].
In order to analyze the changes in the integrated intensity of each band, we deconvoluted these bands into several symmetric Gaussian peaks in a manner similar to that described in our previous work [19,20]. The curve fitting was performed for all of the spectra with the full width at half maximum (FWHM) as a constant and allowing the peak wavenumbers and areas to vary. Typical examples after CO adsorption for 2 h are shown in Figure 6.
We deconvoluted the FTIR spectra into six components, so that the sum of these peaks corresponded well with the experimental spectrum measured at each adsorption time. It should be noted for the FTIR spectrum of COad on bulk Pt that the COL band was deconvoluted into three sharp peaks with fairly small FWHM (15 to 20 cm−1), which were assigned to COL adsorbed on (110), (111), and (100) facets, together with an additional broad peak (FWHM = 50 cm−1) assigned to COL at step/edge sites [22]. In contrast, for nanoparticle catalysts of Pt/C or Pt-Ru/C, the COL band was deconvoluted into three broad peaks (FWHM = 23, 33, and 41 cm−1) assigned to CO adsorbed at terrace sites ((111) or (100)) and two kinds of step/edge sites [19,21,23]. Since the widths of the (111) or (100) terrace on the nanoparticle surface (d = 2.6 nm in the present work) are much smaller than those of well-defined single crystal surfaces, the adsorption energies (corresponding vibrational wavenumbers) of COL on (111) and (100) terraces might be fairly close and would be expected to be observed as one broad band (COL, terrace), as found in the present work. As summarized in Table S1 in the Supplementary Materials, we were able to deconvolute the COL band into two peaks, assigned to COL on terrace and step/edge sites with reasonable FWHM values of 33 and 36 cm−1, respectively. Such assignments of the peaks to COL or COB(Pt-Pt) adsorbed on the terrace and step/edge were based on those observed on stepped Pt single crystal electrodes [19,24], in which the preferential adsorption of CO at step/edge sites at low CO coverages (initial stage of CO adsorption) was reported on Pt(443) and Pt(332), with (111) terraces and (110) steps, and Pt(322), with (111) terraces and (100) steps. As shown for the present Pt2Ru3/CB catalyst in Figure 5A (or Figure 7B, shown below), the intensity of the COL band with lower wavenumber increased more rapidly than that with higher wavenumber, due to preferential CO adsorption at the low coordinated sites. The validity of the deconvolution was supported further by Figure S4, in which the peak wavenumbers of all components were found to shift to higher wavenumbers with increasing adsorption time, which can be ascribed with certainty to the increase in the dipole-dipole interactions between COad molecules [23].
It can be seen in Figure 6 and Table S1 that the peak for COL adsorbed at terrace sites on Pt2Ru3/Sb-SnO2 was blueshifted by ca. 20 cm−1 compared with that of Pt2Ru3/CB, suggesting a change in the adsorption state of CO on Pt2Ru3 due to the presence of the Sb-SnO2 support. Very recently, with the use of in situ FTIR at room temperature, a blueshift of the COL band by ca. 5 cm−1 was observed after the addition of SnO2 particles to Pt-Ru/C [9]. While the shape of the COL band was nearly unchanged by the addition of SnO2 in that work [9], the spectral shape for the Pt2Ru3/Sb-SnO2 catalyst in the present work was clearly distinct from that for Pt2Ru3/CB. To examine the changes more closely, the integrated intensities of all six peaks were plotted as a function of time in Figure 7, together with changes in the MA for the HOR measured simultaneously in the ATR-FTIR cell. The values of MA and the changes with time were different from those measured in the M-CFE (in Figure 3), mainly because a high concentration of 1% CO (H2-balance) was used to accelerate the CO adsorption on the catalysts at 60 °C. However, even under such severe conditions, the Pt2Ru3/Sb-SnO2 catalyst exhibited superior CO-tolerance: the CO-tolerance parameter MACO ≈ 0.9)/MACO = 0), which is defined as the ratio of the MA value at 2 h (θCO ≈ 0.9) to the initial one [21], on the Sb-SnO2-supported catalyst was 56%, which was higher than that on the CB-supported catalyst (30%).
Based on an inspection of the time courses of the MA values and peak intensities, we have noted the following points. First, as shown in Figure 7D, the integrated intensities for COB, I[COB(Pt-Pt)], (COB on Pt-Pt pair sites on terrace and step/edge sites), on both catalysts were quite small, even after 2 h (θCO ≈ 0.9), compared with our Pt2Ru3/CB catalyst with the same size d = 2.6 nm [21]. This is because the catalyst used in [20] was heat-treated in 5% H2 (N2-balance) at 200 °C for 5 h in order to make the surface Pt-rich, whereas the present catalysts were heat-treated under milder conditions: 1% H2 (N2-balance) at 200 °C for 2 h, which was chosen specifically for the Pt2Ru3/Sb-SnO2 in order to avoid alloying with Sn. Thus, Pt and Ru atoms were distributed uniformly on the surface of the present catalysts supported on CB and Sb-SnO2. The effect of a Pt-rich surface on the CO-tolerance will be discussed later.
Second, the values of I[CO-Ru] (CO bridged on Pt-Ru and Ru-Ru sites) and their changes with time were nearly comparable for both catalysts (Figure 7C). Thus, neither I[COB(Pt-Pt)] nor I[CO-Ru] can be correlated with the improvement in the CO-tolerance on the Sb-SnO2 supported catalyst. In contrast, two clear differences in the adsorption behavior of COL were seen between the two catalysts in Figure 7B, i.e., the intensity ratio of COL, step/edge to COL, terrace and its variation with time. The ratio I[COL, step/edge] to I[COL, terrace] on the Sb-SnO2-supported catalyst was smaller than that on the CB-supported one, and the increase in I[COL, step/edge] on the former was slower.
Regarding the ratio I[COL, step/edge] to I[COL, terrace], we calculated the number of atoms on the terraces and step/edges, assuming a cubo-octohedral shape of Pt2Ru3 fcc nanoparticles with d = 2.6 nm. The calculation procedure [25,26] is shown in Appendix S1. The ratio of the number of atoms at the step/edge to that at the terrace was calculated to be 3/4 (see in Table S2), which accords well with the ratio of I[COL, step/edge] to I[COL, terrace] at the Pt2Ru3/CB catalyst after CO adsorption for 2 h. In contrast, the area ratio of I[COL,step/edge]/I[COL,terrace] at the Pt2Ru3/Sb-SnO2 was as small as 1/2. Hence, even at θCO ≈ 0.9, the adsorption of COL at the step/edge was markedly suppressed by the use of the Sb-SnO2 support.
It has been reported that the Pt(110) surface exhibits the highest catalytic activity for the HOR, compared to those for Pt(111) and Pt(100) [27]. As stated above, the cubo-octohedral shape of Pt-based (fcc) nanoparticles consists of (111) and (100) terraces, with (110)-like edges between two (111) facets, and (110) steps can also exist at the edges of the (111) terraces. Both types of sites can be active for the HOR. Thus, the suppression of COL, step/edge could result in the improvement of the CO-tolerant HOR activity on the Pt2Ru3/Sb-SnO2 catalyst.
At this point, we can discuss the mechanism for such an improved CO tolerance on the Pt2Ru3/Sb-SnO2. As described above, both the average chemical composition and the size distribution of Pt2Ru3 nanoparticles were controlled to be identical on both supports of Sb-SnO2 and CB. However, we further examined changes in the local composition of Pt2Ru3 by using a scanning transmission microscope (STEM) with an dispersive X-ray (EDX) analyzer. It was found that a very small amount of Sn (ca. 1 at %) was incorporated into the Pt2Ru3 nanoparticles (Figure 8). During the heat treatment, the Sn component might penetrate from the Sb-SnO2 support, but the amount of Sn was too low to be detected by the ICP analysis. The addition of Sn to Pt has been known to provide the bifunctional effect [6,28,29], as well as an electronic effect [7]. However, considering the very low concentration of Sn in the particles and lack of surface enrichment, its electronic effect is not expected to be large.
Another potential mechanism is an electronic effect (ligand effect) by the Sb-SnO2 support. This is frequently referred to as a strong metal-support interaction (SMSI) [7], but the nature of SMSI has been frequently ambiguous because of a lack of direct evidence. However, very recently, by the use of in situ X-ray absorption spectroscopy (XAS) measurements designed to elucidate the ethanol oxidation reaction (EOR) at platinum nanoparticle catalysts supported on carbon with several transition metal oxides, including SnO2, (Pt/C-MOx), the metal-support interaction was found to increase the number of Pt 5d vacancies observed at the potential near the onset of the EOR [30]. Such an effect would be expected to cause the CO adsorption energy to decrease. A similar effect of alloying was also confirmed by X-ray photoelectron spectroscopy combined with an electrochemical cell [31]. Hence, the electronic modification of Pt2Ru3 nanoparticles by the Sb-SnO2 support could give rise to the change in the peak wavenumber for COL, terrace and the suppression of COL, step/edge.
Finally, we discuss the effect of the top-surface composition of Pt2Ru3 nanocatalysts on the CO-tolerance. In our previous work on monodisperse Pt2Ru3/CB catalysts [20,21], the highest CO-tolerant HOR activity at both 25 and 60 °C was observed for the smallest Pt2Ru3 particle (d = 2.6 nm), with a Pt-rich top-surface and a Ru-rich core. At 60 °C, the value of I[COB(Pt-Pt)] was lowest on the smallest particle, due to an electronic modification effect of the Ru-rich core. Since COB blocks two active Pt-Pt sites for the HOR, the largest number of HOR active sites can be available at the smallest particle: the CO-tolerance parameter MACO ≈ 0.9)/MACO = 0) was about 40% [21]. In contrast, in the present research, the top-surfaces of the Pt2Ru3 (d = 2.6 nm) particles supported on both CB and Sb-SnO2 were not Pt-rich, which was clearly demonstrated by the very small I[COB(Pt-Pt)] values, as described above. While larger numbers of Ru atoms were exposed on the surface, the adsorption of COB on Ru-Ru and Pt-Ru sites were not significantly increased at 60 °C, consistent with the results in [21]. The value of MACO ≈ 0.9)/MACO = 0) of 30% was smaller than that of a Pt-rich catalyst [21]. However, in the present work, we have found an important, new effect that the CO tolerance of the Pt2Ru3 catalyst (treated under mild conditions) was improved greatly by using the Sb-SnO2 support, so that the value of MACO ≈ 0.9)/MACO = 0) increased as high as 56%. The adsorption of COL at step/edge sites was found to be suppressed by the use of the Sb-SnO2 support. To our knowledge, the present work is the first to demonstrate the mechanism of improvement of the CO-tolerant HOR activity on Pt2Ru3 alloy nanoparticles dispersed on a conductive ceramic support Sb-SnO2.

3. Experimental Section

The catalysts employed were Pt2Ru3/Sb-SnO2 and Pt2Ru3/CB (high-surface-area carbon black, 800 m2·g−1) prepared by the nanocapsule method [15,16]. A commercial Sb-doped SnO2 powder (Sn0.98Sb0.02O2−δ, SN-100P, 70 m2·g−1, Ishihara Sangyo, Ltd., Osaka, Japan) was used as the conductive support. These catalysts were heat-treated in He at 400 °C for 4 h. To remove remaining organic impurities, they were washed with alcohol, followed by vacuum drying at 150 °C for 30 min. Finally, they were treated in 1% H2 (N2-balance) at 200 °C for 2 h.
The catalyst powder thus prepared was examined by X-ray diffraction (XRD, Ultima IV, Rigaku Co. Ltd, Tokyo, Japan) with Cu Kα radiation (40 kV, 40 mA). The microstructure was observed by transmission electron microscopy (TEM, H-9500, acceleration voltage = 200 kV, Hitachi high-Tech Co. Ltd, Tokyo, Japan) and spherical aberration (SA)-corrected scanning transmission electron microscopy (STEM, HD-2700, acceleration voltage = 200 kV, Hitachi high-Tech Co. Ltd, Tokyo, Japan) with an energy dispersive X-ray analysis (EDX, EDAX Genesis, AMETEK Co. Ltd, Tokyo, Japan) system. The loaded amount of Pt2Ru3 on the carbon support was quantified from the weight loss by combustion of the carbon at 600 °C in air by the use of thermogravimetry. The loaded amounts of Pt2Ru3 on the Sb-SnO2 support and the compositions of the Pt2Ru3 alloys on both supports were quantitatively analyzed with an inductively-coupled plasma mass analyzer (7500CX, ICP-MS, Agilent Technologies Inc., Santa Clara, CA, USA) after dissolving the Pt-Ru in hot aqua regia.
The CO-tolerance of these two catalysts was evaluated by the multi-channel flow electrode (M-CFE) method [14]. The working electrode consisted of the supported catalysts dispersed uniformly on an Au substrate (flow direction length 1 mm × width 4 mm) at a constant loading of 10 µg-metal cm−2. A Nafion solution was pipetted onto the catalyst layer to yield an average film thickness of 0.075 μm, followed by heat treatment at 130 °C for 30 min in air.
A platinum mesh was used as the counter electrode of the M-CFE. A reversible hydrogen electrode (RHE) was used as the reference electrode. All electrode potentials in this paper are referred to the RHE. The electrolyte solution used was 0.1 M HClO4, which was prepared from reagent grade HClO4 (Kanto Chemical Co., Tokyo, Japan) and Milli-Q water and purified in advance by a conventional pre-electrolysis method [32]. The hydrogen oxidation reaction (HOR) current on the catalyst was measured at 0.02 V under a flow of 0.1 M HClO4 solution (at linear flow rate of 10 cm·s−1, corresponding to a volume flow rate of 2 cm3·s−1) saturated with H2 gas, either pure or containing 1000 ppm CO.
We analyzed the CO-tolerant mechanism at the Pt2Ru3/Sb-SnO2 or Pt2Ru3/CB catalysts by in situ attenuated total reflection Fourier transform infrared reflection spectroscopy (ATR-FTIR). Details of the experimental setup and the procedure of the ATR-FTIR have been described in our previous paper [20]. The Nafion-coated Pt2Ru3/Sb-SnO2 or Pt2Ru3/CB layer (10 µg-metal cm−2) was prepared on an Au film electrode deposited on a Si ATR prism. The average thickness of Nafion was 0.013 μm. The Nafion-coated working electrode was finally heated at 130 °C for 30 min in air. The geometrical surface area of the working electrode was 1.72 cm2. For the ATR-FTIR experiment, 0.1 M HClO4 electrolyte solution was prepared from a superpure-grade HClO4 (Merck, Frankfurter, Germany) and Milli-Q water.
A RHE was used as the reference electrode. All of the measurements were conducted in a class 1000 clean room maintaining a constant temperature of 25 °C and humidity of 40% RH. The temperature of the spectro-electrochemical cell was controlled at 60 °C.
Prior to all measurements, the working electrode surface was cleaned by repeated potential cycles between 0.05 and 0.80 V at 0.05 V·s−1 in N2-purged 0.1 M HClO4. The electrochemically active area of the working electrode was estimated from the hydrogen desorption charge SQH in the positive-going scan, assuming ΔQH° = 210 μC·cm−2.
An FTIR spectrometer (FTS7000, DIGILAB, Inc., Holliston, MA, USA) with an MCT detector was employed. An unpolarized infrared beam was irradiated to the ATR prism with an incidence angle of 70°. The spectral resolution was set at 4 cm−1 with the interferometer scan of 40 kHz. First, we measured a reference spectrum at 0.02 V in 0.1 M HClO4 saturated with H2 (UHP grade, 99.9999%), with an average of 500 interferograms. All IR spectra are displayed in absorbance units, log (I0/I), where I0 and I are the spectral intensities of the reference state and the sample, respectively. Then, H2 gas containing 1% CO was bubbled in the electrolyte solution at a flow rate 10 mL·min−1, and the change in the HOR current at 0.02 V vs. RHE was measured continuously, with IR spectra acquired every 10 s (one spectrum averaged for 10 s).
The CO coverage θCO on the catalyst surface was evaluated from the CO-stripping voltammogram. After a given time of CO adsorption, the dissolved CO in 0.1 M HClO4 was removed by bubbling N2 gas for 30 min, followed by a potential sweep from 0.05 to 0.80 V at 2 mV·s−1. The value of θCO was defined as the ratio of the occupied sites by adsorbed CO (COad) to the CO-free electrochemically active sites:
θCO = 1 − (COQH/SQH)
where COQH and SQH are the hydrogen desorption charges with and without COad, respectively.

4. Conclusions

Pt2Ru3 alloy nanoparticles highly dispersed on an Sb-SnO2 support were found to exhibit higher CO tolerance than those supported on carbon black with the identical alloy composition, as well as the identical size distribution: the mass activity for the HOR at 0.02 V vs. RHE on the Sb-SnO2-supported catalyst after CO-poisoning for 60 min (in 0.1 M HClO4 saturated with 1000 ppm CO/H2 at 70 °C) was about two times larger than that of the corresponding CB-supported catalyst. Such an improvement in the CO-tolerance cannot be explained by an increase in the oxidation activity of COad, because COad was not oxidized at potentials less positive than 0.1 V, even on the Pt2Ru3/Sb-SnO2 catalyst in the CO-stripping voltammogram. It was found by in situ ATR-FTIR spectroscopy for the Sb-SnO2-supported catalyst that the adsorption of COL at step/edge sites was suppressed, together with a blueshift of the COL peak at terrace sites, which maintained the HOR active sites. Such changes in the adsorption state of COL can be ascribed to an electronic modification of the Pt2Ru3 nanoparticles by the Sb-SnO2 support.

Supplementary Materials

The following are available online at www.mdpi.com/2073-4344/6/9/139/s1, Figure S1: X-ray diffraction patterns of pristine powders of commercial Pt/CB (50 wt %-Pt, TEC10E50E), Pt2Ru3/CB, Pt2Ru3/Sb-SnO2, and Sb-SnO2 support and the assignment of XRD peaks to Pt and SnO2., Figure S2: Relationship between lattice constant and Ru content of Pt2Ru3 alloys forPt2Ru3/CB, Pt2Ru3/Sb-SnO2, and commercial Pt2Ru3/CB., Figure S3: Additional TEM images of pristine Pt2Ru3/Sb-SnO2., Figure S4: Peak top wavenumbers of COL, CO-Ru, and COB observed at 0.02 V and 60 °C in 1% CO (H2-balance)-saturated 0.1 M HClO4., Table S1: Values of peak wavenumber and the full width at half maximum (FWHM) used for the deconvolution of FTIR spectra on Pt2Ru3/CB and Pt2Ru3/Sb-SnO2 and The integrated intensity of each peak after 2 h of CO adsorption. Appendix S1. Calculation of the number of atoms at terraces and step/edges of a cubo-octohedral Pt2Ru3 fcc particle with the particle size d, according to the method in [25,26]. Table S2: Number of atoms calculated based on a cubo-octohedral shape of Pt2Ru3 fcc nanoparticles.

Acknowledgments

This work was supported by funds for the “Highly CO-Tolerant Anode Catalysts for Residential PEFCs” project and the “Superlative, Stable, and Scalable Performance Fuel Cells” (SPer-FC) project from the New Energy and Industrial Technology Development Organization (NEDO) of Japan. The authors thank Donald A. Tryk (Fuel Cell Nanomaterials Center, University of Yamanashi) for his kind advice.

Author Contributions

This work was coordinated by Hiroyuki Uchida and Masahiro Watanabe. Yoshiyuki Ogihara carried out the preparation and characterization (XRD, TEM, and ICP-MS) of catalysts, and performed all measurements (M-CFE and ATR-FTIR). Hiroshi Yano contributed to the preparation and characterization (STEM, TEM) of catalysts. Akihiro Iiyama contributed to the analysis of CO-tolerance. All of the authors contributed equally to the data interpretation and discussion. Yoshiyuki Ogihara prepared the manuscript, and Hiroyuki Uchida revised the final version of paper.

Conflicts of Interest

The authors declare no conflict of interest.

References

  1. Lemons, R.A. Fuel Cells for Transportation. J. Power Sources 1990, 29, 251–264. [Google Scholar] [CrossRef]
  2. Igarashi, H.; Fujino, T.; Watanabe, M. Hydrogen Electro-Oxidation on Platinum Catalysts in the Presence of Trace Carbon Monoxide. J. Electroanal. Chem. 1995, 391, 119–123. [Google Scholar] [CrossRef]
  3. Igarashi, H.; Fujino, T.; Zhu, Y.; Uchida, H.; Watanabe, M. CO Tolerance of Pt Alloy Electrocatalysts for Polymer Electrolyte Fuel Cells and the Detoxification Mechanism. Phys. Chem. Phys. Chem. 2001, 3, 306–314. [Google Scholar] [CrossRef]
  4. Kimura, M.; Miyao, T.; Komori, S.; Chen, A.; Higashiyama, K.; Yamashita, H.; Watanabe, M. Selective Methanation of CO in Hydrogen-Rich Gases Involving Large Amounts of CO2 over Ru-Modified Ni-Al Mixed Oxide Catalysts. Appl. Catal. A: Gen. 2010, 379, 182–187. [Google Scholar] [CrossRef]
  5. Martínez-Huerta, M.V.; Rodríguez, J.L.; Tsiouvaras, N.; Peña, M.A.; Fierro, J.L.G.; Pastor, E. Novel Synthesis Method of CO-Tolerant PtRu-MoOx Nanoparticles: Structural Characteristics and Performance for Methanol Electrooxidation. Chem. Mater. 2008, 20, 4249–4259. [Google Scholar] [CrossRef]
  6. Lee, K.-S.; Park, I.-S.; Cho, Y.-H.; Jung, D.-S.; Jung, N.; Park, H.-Y.; Sung, Y.-E. Electrocatalytic Activity and Stability of Pt Supported on Sb-Doped SnO2 Nanoparticles for Direct Alcohol Fuel Cells. J. Catal. 2008, 258, 143–152. [Google Scholar] [CrossRef]
  7. Santos, A.L.; Profeti, D.; Olivi, P. Electrooxidation of Methanol on Pt Microparticles Dispersed on SnO2 Thin Films. Electrochim. Acta 2005, 50, 2615–2621. [Google Scholar] [CrossRef]
  8. Takeguchi, T.; Anzai, Y.; Kikuchi, R.; Eguchi, K.; Ueda, W. Preparation and Characterization of CO-Tolerant Pt and Pd Anodes Modified with SnO2 Nanoparticles for PEFC. J. Electrochem. Soc. 2007, 154, B1132–B1137. [Google Scholar] [CrossRef]
  9. Takeguchi, T.; Kunifuji, A.; Narischat, N.; Ito, M.; Noguchi, H.; Uosaki, K.; Mukai, S.R. Ligand Effect of SnO2 on a Pt-Ru Catalyst and the Relationship Between Bond Strength and CO Tolerance. Catal. Sci. Technol. 2016, 6, 3214–3219. [Google Scholar] [CrossRef]
  10. Wang, G.; Takeguchi, T.; Muhamad, E.N.; Yamanaka, T.; Ueda, W. Effect of Addition of SnOx to the Pt2Ru3/C Catalyst on CO Tolerance for the Polymer Electrolyte Fuel Cell. J. Electrochem. Soc. 2011, 158, B448–B453. [Google Scholar] [CrossRef]
  11. Devaux, D.; Yano, H.; Uchida, H.; Dobois, J.-L.; Watanabe, M. Electro-Oxidation of Hydrolysed Ploy-Oxymethylene-Dimethylether ono PtRu Supported Catalysts. Electrochim. Acta 2001, 56, 1460–1465. [Google Scholar] [CrossRef]
  12. Shen, P.K.; Tseung, A.C.C. Anodic Oxidation of Methanol on Pt/WO3 in Acidic Media. J. Electrochem. Soc. 1994, 141, 3082–3090. [Google Scholar] [CrossRef]
  13. Villullas, H.M.; Mattos-Costa, F.I.; Bulhoes, L.O.S. Electrochemical Oxidation of Methanol on Pt Nanoparticles Dispersed on RuO2. J. Phys. Chem. B 2004, 108, 12898–12903. [Google Scholar] [CrossRef]
  14. Uchida, H.; Izumi, K.; Watanabe, M. Temperature Dependence of CO-Tolerant Hydrogen Oxidation Reaction Activity at Pt, Pt-Co, and Pt-Ru Electrodes. J. Phys. Chem. B 2006, 110, 21924–21930. [Google Scholar] [CrossRef] [PubMed]
  15. Yano, H.; Kataoka, M.; Yamashita, H.; Uchida, H.; Watanabe, M. Oxygen Reduction Activity of Carbon-Supported Pt-M (M = V, Ni, Cr, Co, and Fe) Alloys Prepared by Nanocapsule Method. Langmuir 2007, 23, 6438–6445. [Google Scholar] [CrossRef] [PubMed]
  16. Okaya, K.; Yano, H.; Uchida, H.; Watanabe, M. Control of Particle Size of Pt and Pt Alloy Electrocatalysts Supported on Carbon Black by the Nanocapsule Method. ACS Appl. Mater. Interfaces 2010, 2, 888–895. [Google Scholar] [CrossRef] [PubMed]
  17. Watanabe, M.; Motoo, S. Electrocatalysis by Ad-Atoms: Part II. Enhancement of the Oxidation of Methanol on Platinum by Ruthenium Ad-Atoms. J. Electroanal. Chem. 1975, 60, 267–273. [Google Scholar] [CrossRef]
  18. Watanabe, M.; Motoo, S. Electrocatalysis by Ad-Atoms: Part III. Enhancement of the Oxidation of Carbon Monoxide on Platinum by Ruthenium Ad-Atoms. J. Electroanal. Chem. 1975, 60, 275–283. [Google Scholar] [CrossRef]
  19. Sato, T.; Kunimatsu, K.; Uchida, H.; Watanabe, M. Adsorption/oxidation of CO on Highly Dispersed Pt Catalyst Studied by Combined Electrochemical and ATR-FTIRAS Methods Part 1. ATR-FTIRAS Spectra of CO Adsorbed on Highly Dispersed Pt Catalyst on Carbon Black and Carbon Un-Supported Pt Black. Electrochim. Acta 2007, 53, 1265–1278. [Google Scholar] [CrossRef]
  20. Sato, T.; Kunimatsu, K.; Okaya, K.; Yano, H.; Watanabe, M.; Uchida, H. In situ ATR-FTIR Analysis of the CO-Tolerance Mechanism on Pt2Ru3/C Catalysts Prepared by the Nanocapsule Method. Energy Environ. Sci. 2011, 4, 433–438. [Google Scholar] [CrossRef]
  21. Sato, T.; Okaya, K.; Kunimatsu, K.; Yano, H.; Watanabe, M.; Uchida, H. Effect of Particle Size and Composition on CO-Tolerance at Pt-Ru/C Catalysts Analyzed by in Situ Attenuated Total Reflection FTIR Spectroscopy. ACS Catal. 2012, 2, 450–455. [Google Scholar] [CrossRef]
  22. Kunimatsu, K.; Sato, T.; Uchida, H.; Watanabe, M. Role of Terrace/Step Edge Sites in CO Adsorption/Oxidation on a Polycrystalline Pt Electrode Studied by in Situ ATR-FTIR Method. Electrochim. Acta 2008, 53, 6104–6110. [Google Scholar] [CrossRef]
  23. Kunimatsu, K.; Sato, T.; Uchida, H.; Watanabe, M. Adsorption/Oxidation of CO on Highly Dispersed Pt Catalyst Studied by Combined Electrochemical and ATR-FTIRAS Methods: Oxidation of CO Adsorbed on Carbon-Supported Pt Catalyst and Unsupported Pt Black. Langmuir 2008, 24, 3590–3601. [Google Scholar] [CrossRef] [PubMed]
  24. Lebedeva, N.P.; Rodes, A.; Feliu, J.M.; Koper, M.T.M.; van Santen, R.A. Role of Crystalline Defects in Electrocatalysis: CO Adsorption and Oxidation on Stepped Platinum Electrodes As Studied by in situ Infrared Spectroscopy. J. Phys. Chem. B 2002, 106, 9863–9872. [Google Scholar] [CrossRef]
  25. Benfield, R.E. Mean Coordination Numbers and the Non-Metal Transition in Clusters. J. Chem. Soc. Faraday Trans. 1992, 88, 1107–1110. [Google Scholar] [CrossRef]
  26. Okaya, K.; Yano, H.; Kakinuma, K.; Watanabe, M.; Uchida, H. Temperature Dependence of Oxygen Reduction Reaction Activity at Stabilized Pt Skin-PtCo Alloy/Graphitized Carbon Black Catalysts Prepared by a Modified Nanocapsule Method. ACS Appl. Mater. Interfaces 2012, 4, 6982–6991. [Google Scholar] [CrossRef] [PubMed]
  27. Markovic, N.M.; Grgur, B.N.; Ross, P.N. Temperature-Dependent Hydrogen Electrochemistry on Platinum Low-Index Single-Crystal Surfaces in Acid Solutions. J. Phys. Chem. B 1997, 101, 5405–5413. [Google Scholar] [CrossRef]
  28. Motoo, D.; Watanabe, M. Electrocatalysis by Sn and Ge Ad-Atoms. J. Electroanal. Chem. 1976, 69, 429–431. [Google Scholar] [CrossRef]
  29. Arenz, M.; Stamenkovic, V.; Blizanac, B.B.; Mayrhofer, K.J.; Markovic, N.M.; Ross, P.N. Carbon-Supported Pt-Sn electrocatalysts for the Anodic Oxidation of H2, CO, and H2/CO Mixtures : Part II: The Structure–Activity Relationship. J. Catal. 2005, 232, 402–410. [Google Scholar] [CrossRef]
  30. Godoi, D.R.M.; Villullas, H.M.; Zhu, F.-C.; Jiang, Y.-X.; Sun, S.-G.; Guo, J.; Sun, L.; Chen, R. A Comparative Investigation of Metal-Support Interactions on the Catalytic Activity of Pt Nanoparticles for Ethanol Oxidation in Alkaline Medium. J. Power Sources 2016, 311, 81–90. [Google Scholar] [CrossRef]
  31. Wakisaka, M.; Mitsui, S.; Hirose, Y.; Kawashima, K.; Uchida, H.; Watanabe, M. Electronic Structure of Pt-Co and Pt-Ru Alloy for CO-Tolerant Anode Catalysts in Polymer Electrolyte Fuel Cells Studied by EC-XPS. J. Phys. Chem. B 2006, 110, 23489–23496. [Google Scholar] [CrossRef] [PubMed]
  32. Uchida, H.; Ikeda, N.; Watanabe, M. Electrochemical Quartz Crystal Microbalance Study of Copper Ad-Atoms on Gold Electrodes. Part II. Further Discussion on the Specific Adsorption of Anions from Solutions of Perchloric and Sulfuric Acid. J. Electroanal. Chem. 1997, 424, 5–12. [Google Scholar] [CrossRef]
Figure 1. X-ray diffraction patterns of pristine powders of (A) commercial Pt/CB (50 wt %-Pt, TEC10E50E); (B) Pt2Ru3/CB; (C) Pt2Ru3/Sb-SnO2; and (D) Sb-SnO2 support. Dashed vertical lines indicate the positions of diffraction peaks for pure platinum.
Catalysts 06 00139 g001
Figure 2. TEM (transmission electron microscopy) images and particle size distribution histograms of pristine (A) Pt2Ru3/CB and (B) Pt2Ru3/Sb-SnO2.
Catalysts 06 00139 g002
Figure 3. Change in the mass activity for the HOR (hydrogen oxidation reaction) (MA) at 0.02 V on Nafion-coated Pt2Ru3/CB and Pt2Ru3/Sb-SnO2 electrodes under a flow of 0.1 M HClO4 (linear flow rate = 10 cm·s−1, corresponding to a volume flow rate of 2 cm3·s−1) saturated with H2 (dashed lines) and 1000 ppm CO/H2 (solid lines) at 70 °C.
Catalysts 06 00139 g003
Figure 4. CO stripping voltammograms at Nafion-coated Pt2Ru3/CB and Pt2Ru3/Sb-SnO2 electrodes measured in N2-purged 0.1 M HClO4 at 70 °C and a potential sweep rate of 0.02 V·s−1. The solid lines indicate the CV at the CO-free electrode. The vertical dotted line shows the onset potential (Eonset) for the oxidation of adsorbed CO. Carbon monoxide was adsorbed on the working electrode by supplying 0.1 M HClO4 solution saturated with 5% CO (He balance) at a mean linear flow rate of 10 cm·s−1 (corresponding to a volume flow rate of 2 cm3·s−1) for 30 min while maintaining the potential at 0.05 V.
Catalysts 06 00139 g004
Figure 5. Changes in FTIR spectra observed on Nafion-coated (A) Pt2Ru3/CB and (B) Pt2Ru3/Sb-SnO2 electrodes at 0.02 V and 60 °C during CO adsorption in 0.1 M HClO4 with bubbling 1% CO (H2 balance) for 120 min.
Catalysts 06 00139 g005
Figure 6. Deconvolution of FTIR spectra observed on Pt2Ru3/CB and Pt2Ru3/Sb-SnO2 at 0.02 V and 60 °C after 2 h of 1% CO/H2 gas bubbling in 0.1 M HClO4. Curve fitting was performed for all spectra with the full width at half maximum (FWHM) fixed as a constant while allowing the peak wavenumbers and areas to vary, based on previous work (see Table S1). The COL bands around 2020–1980 cm−1 was deconvoluted into two components, which could be assigned to COL on terrace and step-edge sites, respectively. The CO-Ru bands around 1960–1900 cm−1 were deconvoluted into two components, which were assigned to COB on Ru-Ru and Ru-Pt sites, respectively. The COB(Pt-Pt) bands around 1850–1790 cm−1 were also deconvoluted into two components, which could be assigned to COB(Pt-Pt) on terrace and step-edge sites, respectively. These spectra were normalized with respect to the total intensities of peaks assigned to COL, I[COL]; ( ------- ) experimental spectrum, ( ―― ) sum of six peaks, ( ―― ) COL peaks, ( ―― ) CO-Ru peaks(consisting of COB(Ru-Ru) and COB(Ru-Pt)), and ( ―― ) COB(Pt-Pt) peaks.
Catalysts 06 00139 g006
Figure 7. Changes in the mass activity for the HOR (A) and integrated intensities of I[COL] (B); I[CO-Ru] (C); and I[COB] (D) observed at 0.02 V and 60 °C in 1% CO (H2-balance)-saturated 0.1 M HClO4.
Catalysts 06 00139 g007
Figure 8. High-angle annular dark-field (HAADF)-STEM (transmission microscope) images and elemental distributions of Pt, Ru, and Sn obtained by EDX (dispersive X-ray) line scan analysis parallel to the interface between the PtRu catalyst metal particles and the Sb-SnO2 support.
Catalysts 06 00139 g008
Table 1. Typical properties of Pt2Ru3/CB and Pt2Ru3/Sb-SnO2 catalysts a.
CatalystdTEM (nm) bMetal Loaded (wt %) cComposition d
Pt (atom %)Ru (atom %)
Pt2Ru3/CB2.6 ± 0.220.040.859.2
Pt2Ru3/Sb-SnO22.6 ± 0.211.242.157.9
a Projected value of metal-loading level (wt %) of the catalysts was 20 wt %; b Average particle size and standard deviations (σd) based on the TEM observation; c Metal weight percent in the catalysts analyzed by ICP; d The composition of Pt2Ru3 alloy analyzed by ICP.

