Article

Mixed-Metal Semiconductor Anodes for Electrochemical Water Splitting and Reactive Chlorine Species Generation: Implications for Electrochemical Wastewater Treatment

Linde Center for Global Environmental Science, Division of Engineering & Applied Science, Linde-Robinson Laboratory, California Institute of Technology, Pasadena, CA 91125-0001, USA
*
Author to whom correspondence should be addressed.
Catalysts 2016, 6(4), 59; https://doi.org/10.3390/catal6040059
Submission received: 16 February 2016 / Revised: 25 March 2016 / Accepted: 31 March 2016 / Published: 20 April 2016
(This article belongs to the Special Issue Photocatalytic Water Splitting-1)

Abstract

:
A procedure for the preparation of semiconductor anodes using mixed-metal oxides bound together and protected with a TiO2 nanoglue has been developed and tested in terms of the relative efficiencies of the oxygen evolution (OER), the reactive chlorine species evolution (RCS), and the hydrogen evolution (HER) reactions. The composition of the first anode is a Ti metal substrate coated with IrTaOx and overcoated with TiO2 (P25) that was mixed with TiO2 nanogel, while the second anode consists of a Ti metal substrate coated with IrTaOx and an over-coating layer of La-doped sodium tantalate, NaTaO3:La. The experimental efficiencies for water splitting ranged from 62.4% to 67.5% for H2 evolution and 40.6% to 60.0% for O2 evolution. The corresponding over-potentials for the Ti/IrTa-TiO2 and Ti/IrTa-NaTaO3:La anodes coupled with stainless steel cathodes of the same dimensions were determined to be 437 mV and 367 mV for the OER, respectively, and 239 mV and 205 mV for RCS, respectively. The preparation procedure described herein should allow for easier production of large-surface area anodes at lower costs than standard methods.

Graphical Abstract

1. Introduction

We have recently developed prototype electrochemical reactor systems for the treatment of human or domestic wastewater that are powered by either AC or DC power sources [1,2,3,4]. In these electrochemical treatment systems, human wastewater is oxidized at an array of semiconductor anodes based on the generation rate of Reactive Chlorine Species (RCS), which is a key active compound in the process of wastewater treatment. Water oxidation and Cl oxidation to free chlorine (Cl2) have been known to compete against each other during electrocatalysis due to sharing the active sites for both processes, while H2 is produced at matched metal cathodes. Hydrogen generation via electrochemical water splitting is generally environmental friendly and reliable for the large-scale hydrogen production that would be required for a hydrogen economy [5,6,7]. The cathodic generation of molecular hydrogen is effectively limited by the corresponding anodic oxidation of water. In order to improve the efficiency of water splitting, it is essential to reduce the anodic overpotential for the oxygen evolution reaction (OER) by using optimized electron transfer catalysts. If a chloride ion is present in the electrolyte or wastewater undergoing treatment, then the oxidation of Cl to Cl2 takes place at lower applied potentials in light of the overpotential for the OER [4].
A significant effort combining both theoretical and experimental work has been made over the past decade in order to identify new materials that could lower the overpotential of the OER [8]. RuO2 and IrO2 base anodes are referred to as dimensionally stable anodes (DSA), which are often used both for the electrochemical generation of reactive chlorine species (RCS) and the OER at relatively low overpotentials [9]. However, the high cost of the iridium oxide precursor reagents coupled with the relatively poor long-term stability of IrO2 has essentially impeded the large-scale commercial application of DSAs.
The process of attachment of nanoparticulate metal oxide semiconductors (e.g., IrO2, RuO2, Ta2O5, SnO2, Bi2O3) to base-metal surfaces is critical for producing efficient anodes and, in some cases, functionalized cathodes. Anatase (TiO2) nanogels have been reported to be a sticky inter-particle binding agent or nanoglue that results in improved electrochemical performance and higher current efficiencies for base-metal supported semiconductor anodes [10].

2. Results and Discussion

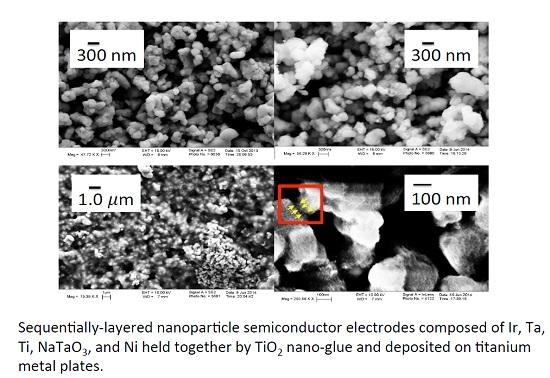
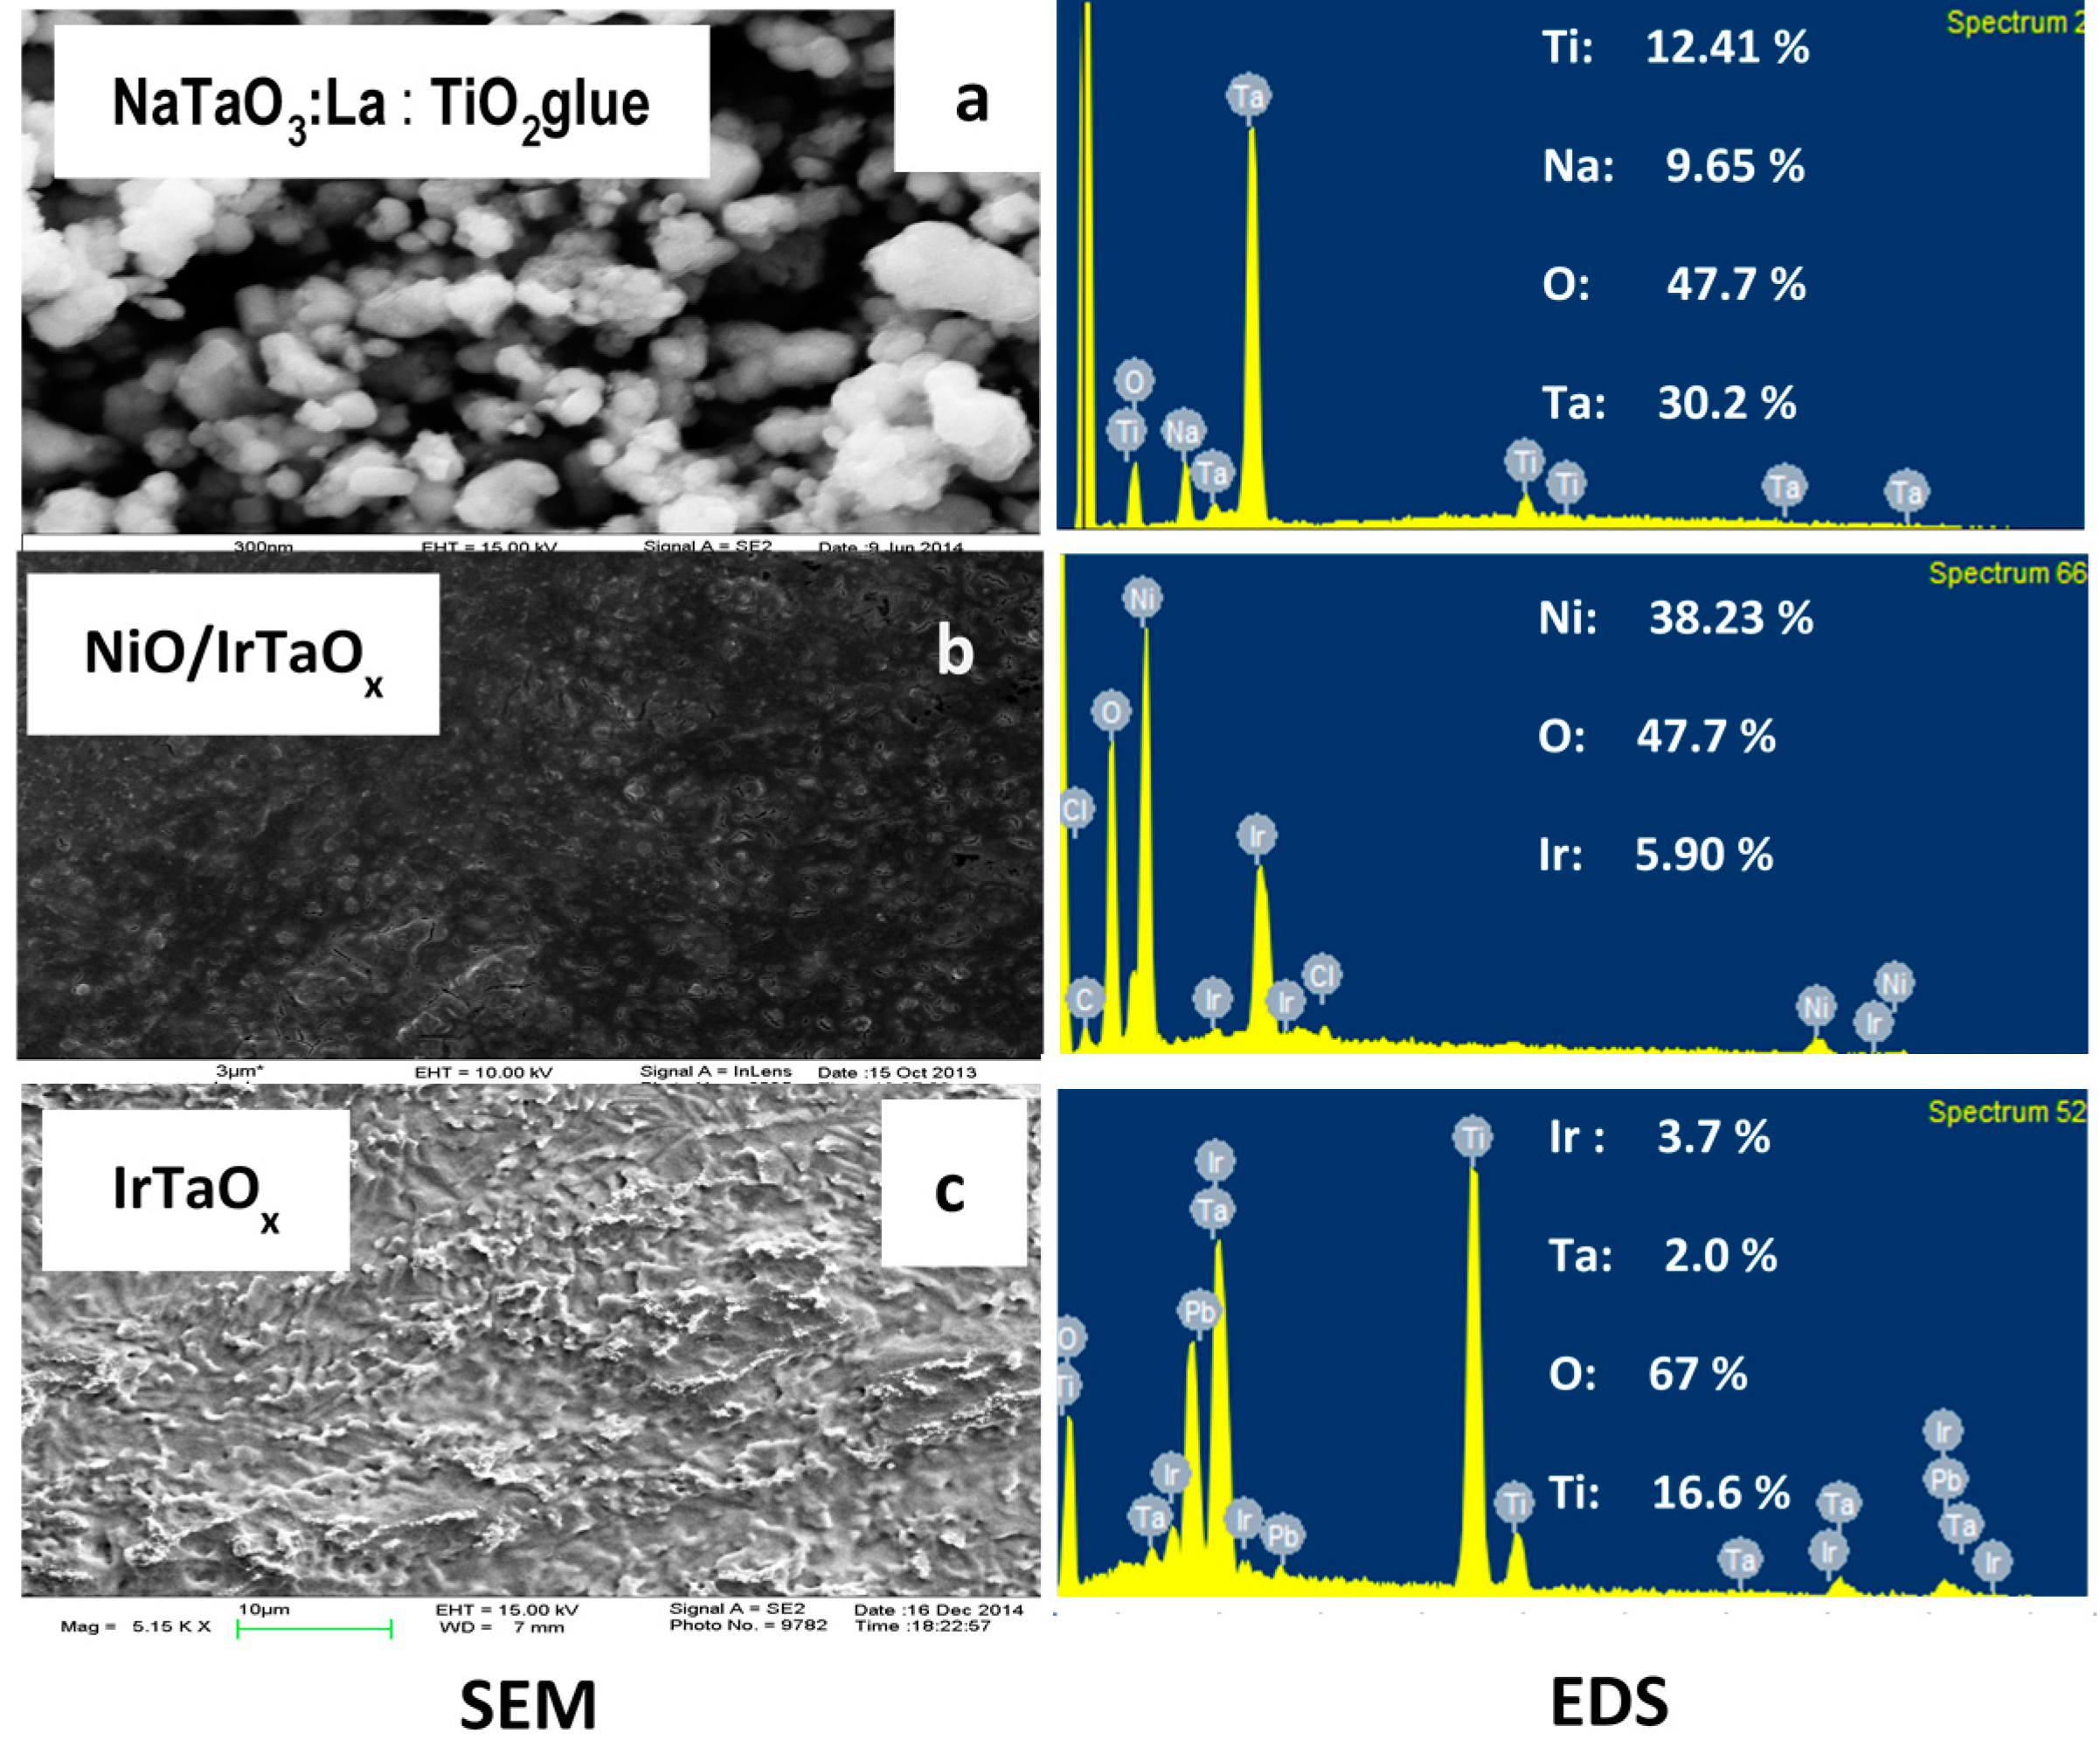
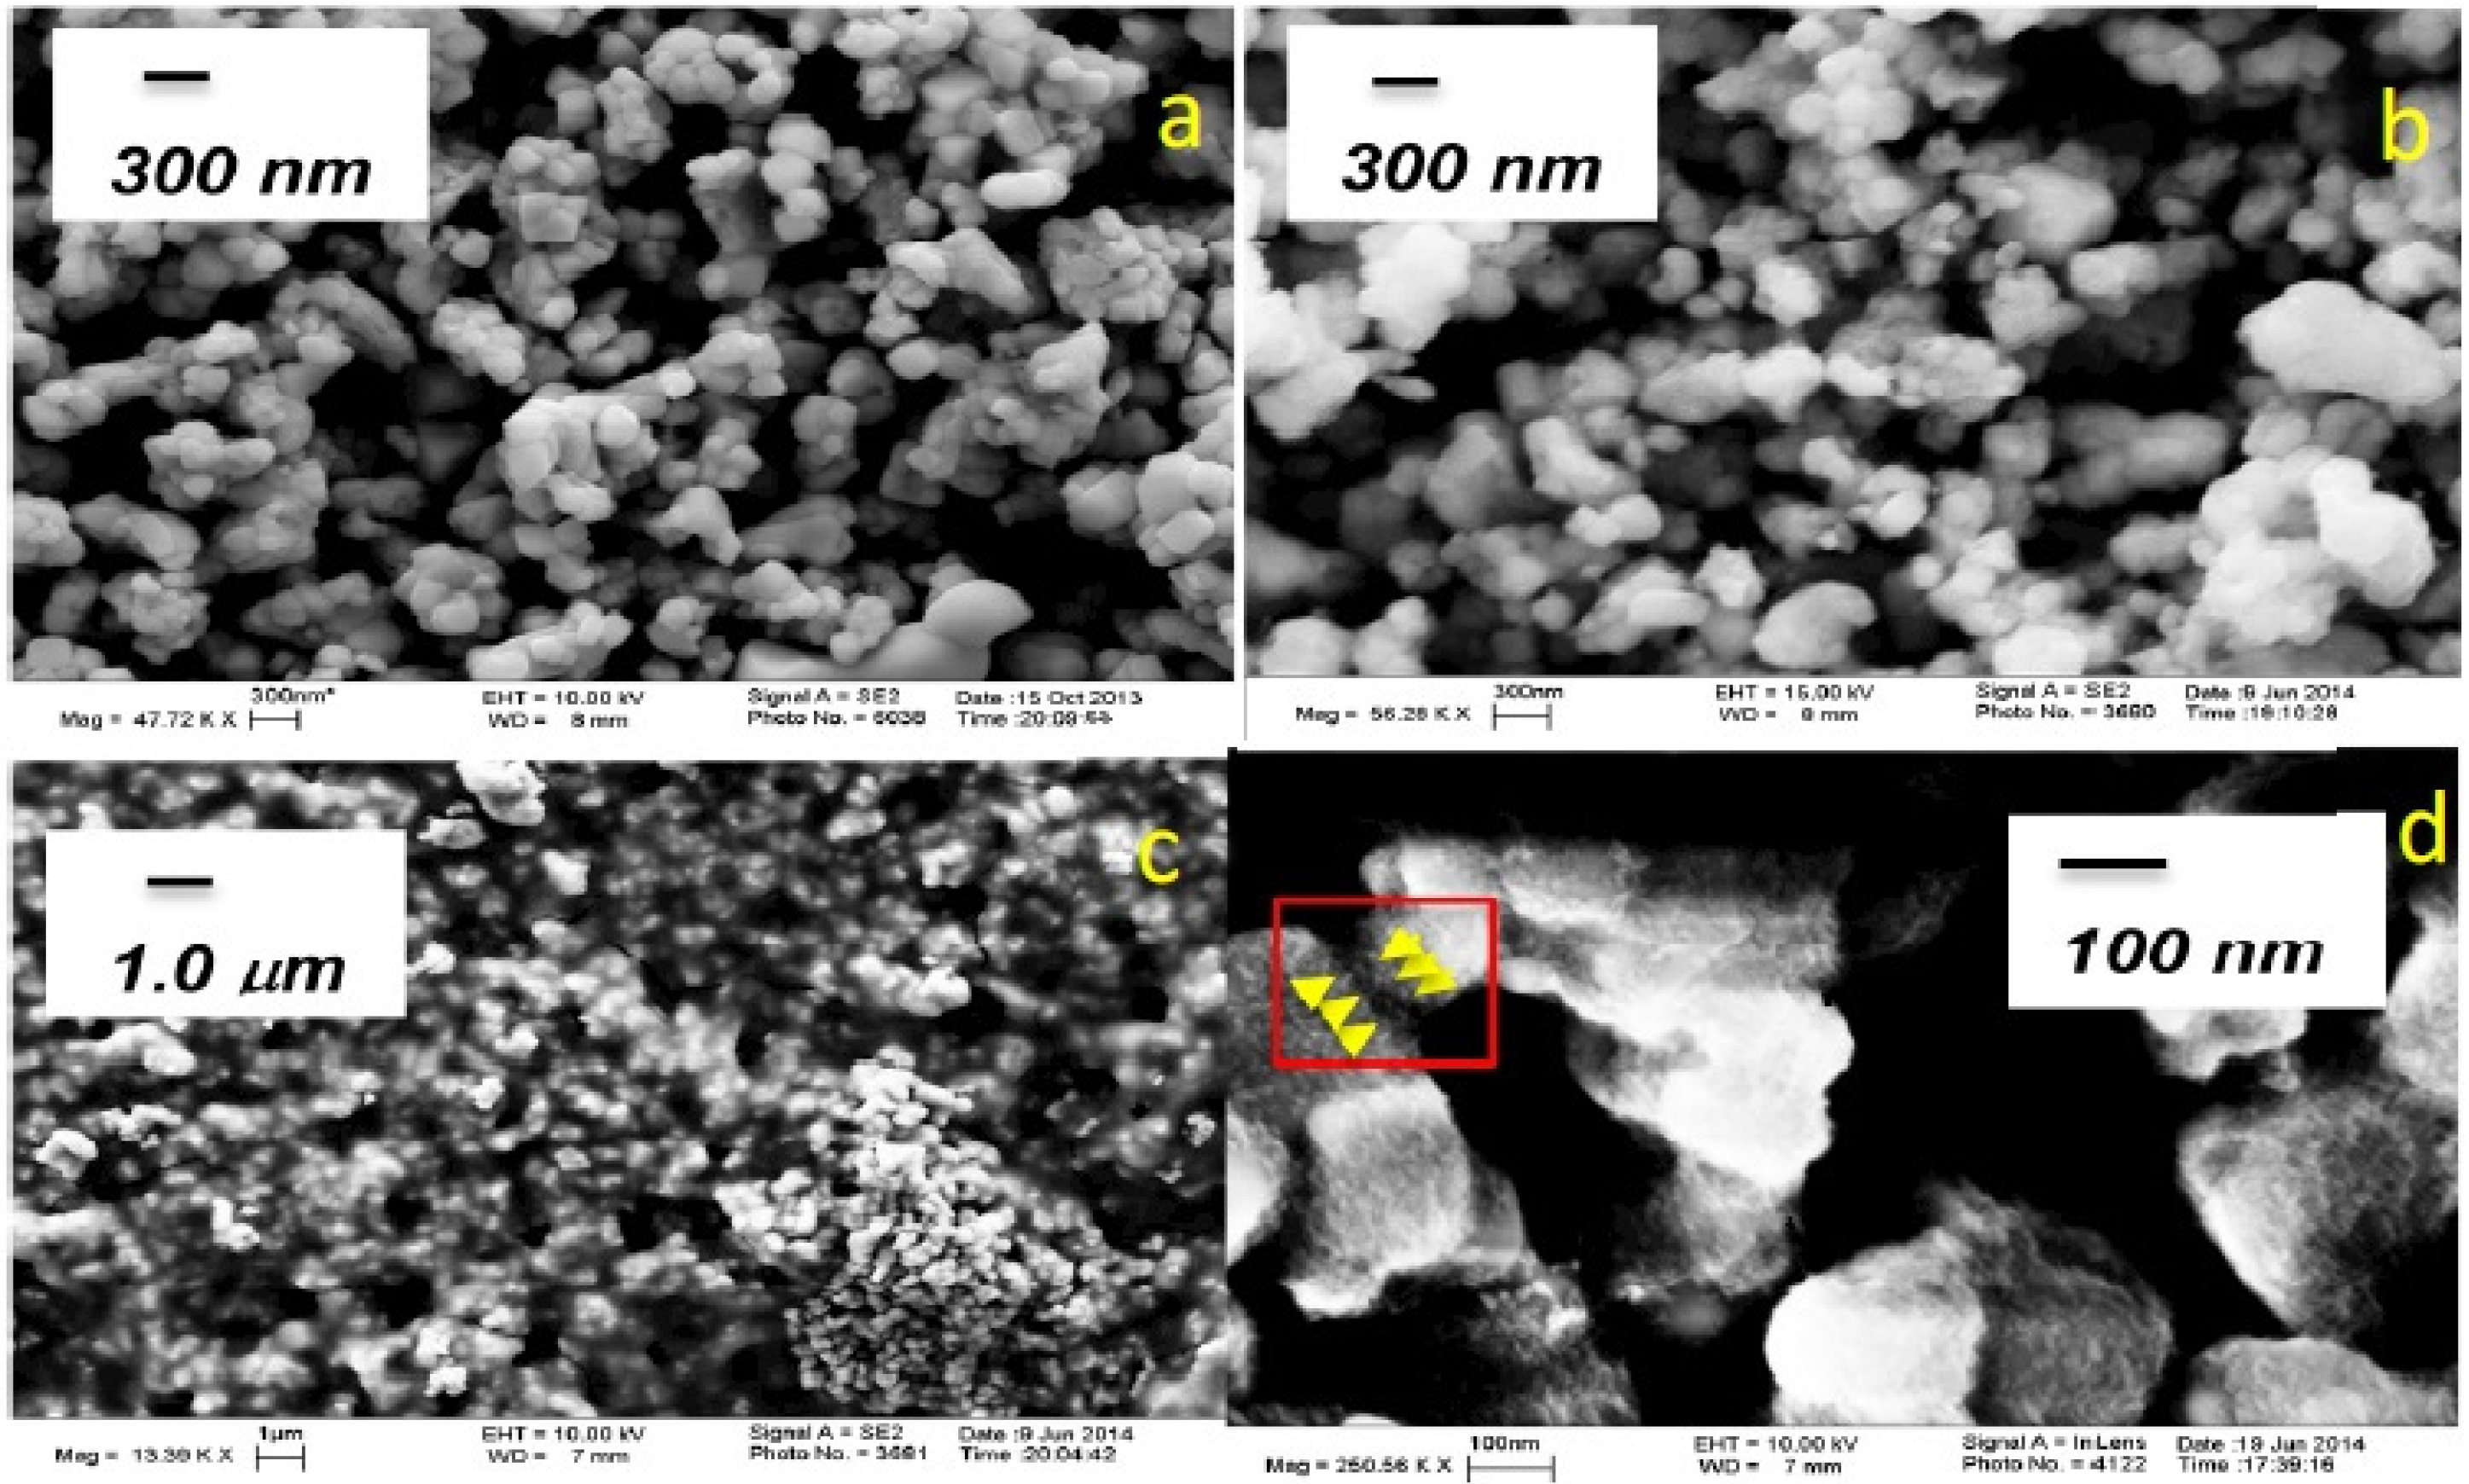
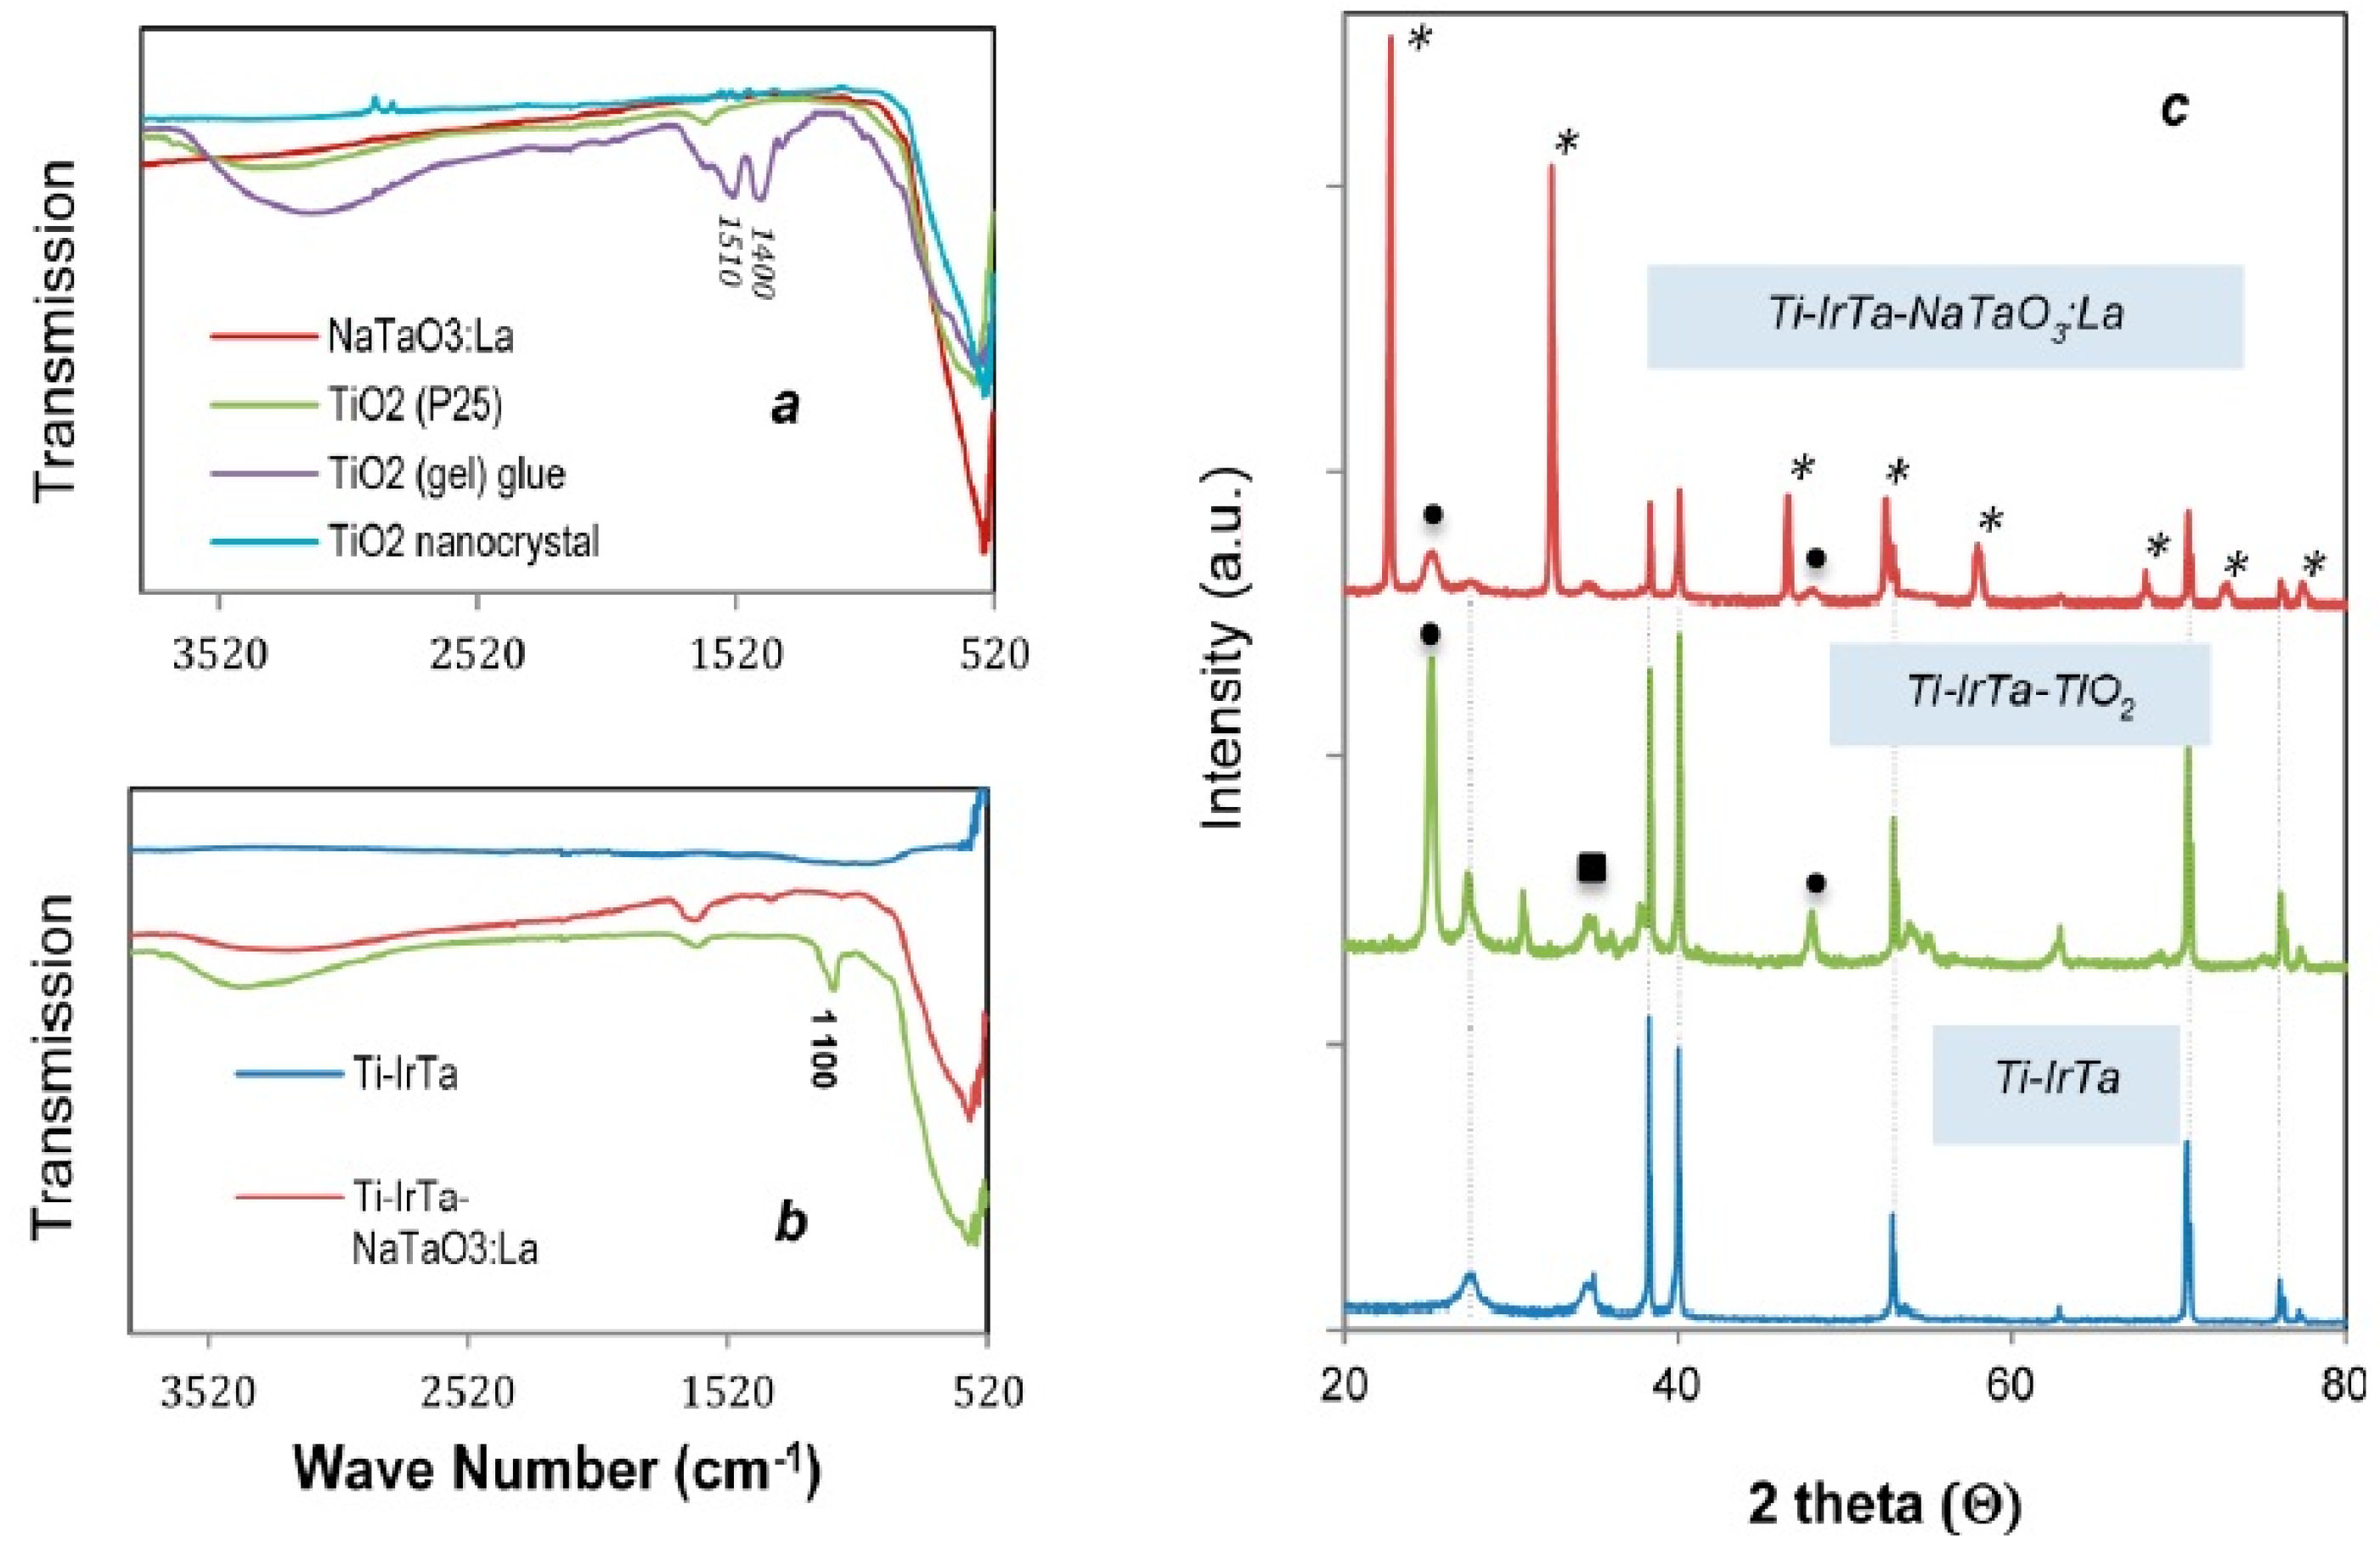
2.1. Anode Characterization

The sequentially layered anode assembly can be visualized in a series of SEM micrographs showing the surface morphologies as determined by EDS analyses for each layer in Figure 1. The surface sampling depth was 1–2 μm for the determination of the elemental composition. The SEM micrograph of the mixed-metal oxide layer of IrO2/Ta2O5 on the Ti base-metal plate has a wave-like surface morphology in contrast to the typically observed cracked-film morphology for IrO2 deposits applied to base-metal substrates [11]. The initially deposited layer consists of Ir, O, Ti, and Ta, while the seal coating layer made from Ni(NO3)3∙6H2O contains NiO with minor amounts of Ni(OH)2 as determined by XPS analysis. The electron probe microanalysis of the Ti-IrTa-NaTaO3:La composite anode shows that the outermost surface of the anode consists of NaTaO3:La mixed with nanoparticulate TiO2 in distinctly different size domains (Figure 2). The magnified SEM image shown in Figure 2d allows us to distinguish the location of TiO2 nanoparticles that are located between the larger NaTaO3:La particles. The TiO2 nanoglue serves as an inter-particle binding agent via interlocking surface-hydroxyl groups of hydrated TiO2 with the surface hydroxyl groups of hydrated NaTaO3. These interlocking surface hydroxyl groups condense during elevated temperature dehydration to form > M–O–M < bonds during the annealing steps at 100 °C [10].
The FTIR spectra shown in the Figure 3 can be used to compare the combination of NaTaO3:La and TiO2 (P25) in the particle phase (Figure 3a) to the electrode surface when prepared with TiO2 nanoglue as shown in Figure 3b. The IR spectrum of the TiO2 nanoglue composite is dominated by surface hydroxyl groups that are characterized by a strong > OH stretch centered near 3100 cm−1. A broader peak normally observed at 535 cm−1 that is characteristic of skeletal > Ti–O–Ti < vibrations was not detected in the dehydrated TiO2 nanoparticles. Peaks at 1400 and 1500 cm−1 are attributed to C–O vibrational modes that originate from either residual titanium isopropoxide or from acetic acid, which was added to adjust pH. The TiO2 nanogel was used during the formation of the electrode outer layers of the Ti-IrTa-TiO2 and Ti-IrTa-NaTaO3:La electrodes in order to facilitate the inter-particle binding of TiO2 (P25) and NaTaO3:La; however, the nanoglue was still detectable after annealing as measured by the OH-vibrational peak at 3100 cm−1. The XRD pattern of Ti-IrTa-NaTaO3:La is consistent with a combination of anatase TiO2 that originated from amorphous TiO2 nanoglue and NaTaO3:La. In contrast, a mixed phase of anatase and rutile TiO2 is evident in the XRD pattern for Ti-IrTa-TiO2 (Figure 3b).
SEM micrographs clearly show a nanostepped surface morphology of NaTaO3:La due to a change of the surface structure of NaTaO3 due to doping with lanthanum, while the surface of un-doped NaTaO3 appears to be relatively flat (Figure S1) [12]. NiO deposited on to NaTaO3 doped with La has been reported to be an efficient water-splitting photocatalyst. The evolution of O2 is reported to take place on the grooves of the nanostep, while H2 is catalytically evolved on the ultrafine NiO particles. The loading of NiO nanoparticle coupled with the doping of La into the structure of NaTaO3 increases the lifetime of the trapped electrons and holes, which lead to higher yields of H2 and O2 under continuous illumination [12].
Given the favorable photosynthetic water-splitting properties of NaTaO3:La upon irradiation, we decided to utilize it for the outer layer of our metal oxide semiconductor anode. The synthesized TiO2 nanogel is characterized by various analytical techniques: TEM image of TiO2 nanoglue indicated around 8 nm of the particle size; XRD pattern confirmed an anatase phase of crystalline structure;surface hydroxyl groups were verified by FTIR; and the band-gap energy for the nanoglue was determined to be 3.13 eV (Figure S2).

2.2. Electrochemical Characterization

The mixed metal oxide anodes were characterized by cyclic voltammetry (CV). The anodes were paired with stainless steel (SS) cathodes that were separated by 5 mm. The CV measurements were carried out in either a 50 mM NaCl or a 50 mM K2SO4 solution at a fixed scanning rate of 20 mV s−1 over a range of applied potentials ranging from 0 to 2.0 V. In Figure 4, the resulting CV plots are shown for (a) IrO2/Ta2O5 coated on to a Ti base-metal plate (designated as Ti-IrTa), (b) a sealing coat of NiO on Ti-IrTa (designated as Ti-IrTa-Ni), (c) an over-coating layer of TiO2 on Ti-IrTa (designated as Ti-IrTa-TiO2), and (d) an over-coating layer of NaTaO3:La on Ti-IrTa (designated as Ti-IrTa-NaTaO3). The Reactive Chlorine Species (RCS) and oxygen onset potentials (OER) were determined from the intersection of the tangents between the baseline and the current signals. The observed onset potentials occurred close to 1.2 V for the production of RCS and 1.25 V for the evolution of oxygen, OER. The corresponding overpotential for the RCS was determined to be 239 mV for the Ti-IrTa-TiO2 anode and 205 mV for Ti-IrTa-NaTaO3:La anode, respectively (Figure 4c).
The CV profiles observed in the 50 mM K2SO4 electrolyte solutions had steeper polarization curves compared to the comparative measurement in NaCl solutions except for the NiO-coated electrode (Figure 4b). The CV curves obtained in the K2SO4 electrode solutions indicate that only the OER is taking place. In this case, the overpotentials observed for the OER on Ti-IrTaOx-TiO2 and on Ti-IrTaOx-NaTaO3:La were determined to be 437 mV and 367 mV, respectively. The measured overpotentials are comparable to previously reported values for IrO2 of 300 mV [13]. The anode with a sealing coat of NiO on the Ti-IrTaOx electrode had a relatively gentle J–V curve (i.e., slope) and a lower overpotential of 212 mV. This may be attributed to surface corrosion during electrochemical water oxidation [9]. In comparison, anodes prepared with an outer layer of NaTaO3:La and TiO2 (P25) bound together with TiO2 nanoglue had steeper J–V curves with a cathodic shift in the onset potential for both electrolyte solutions that was close to 100 mV.

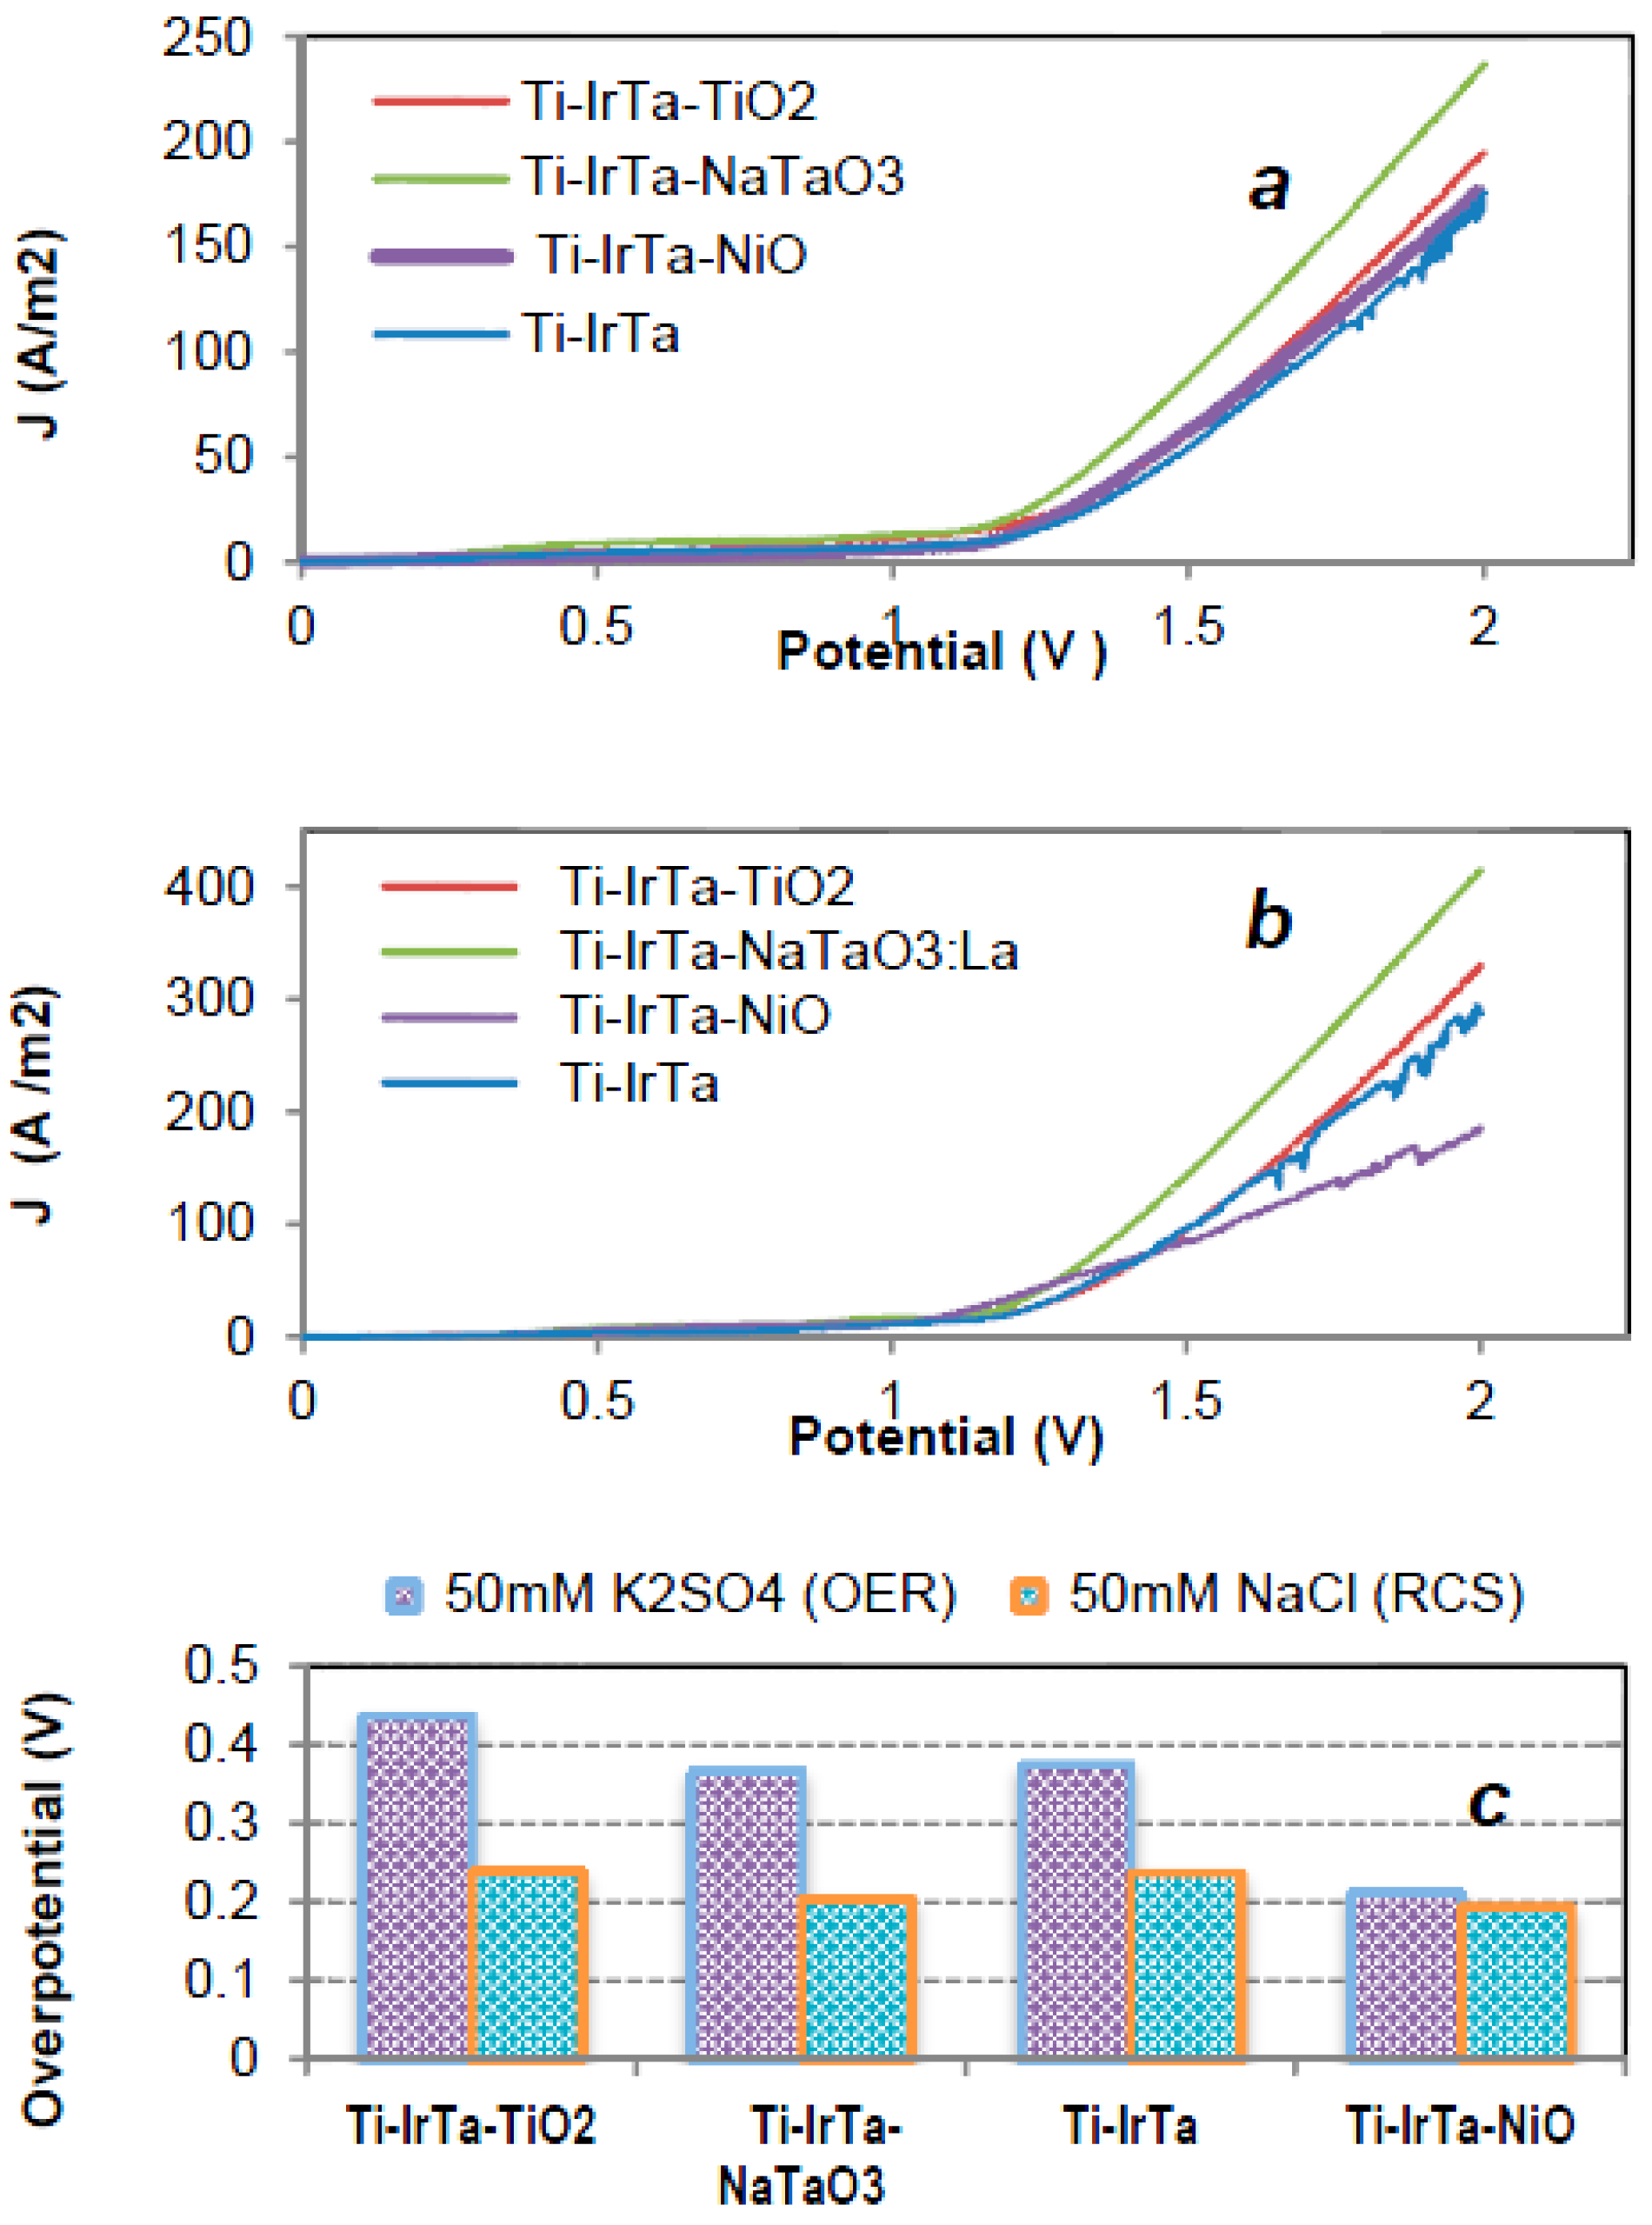
2.3. Electrocatalysis

Given the current level of interest in photo-electrochemical water splitting, chlorine production, and electrochemical wastewater treatment [14,15,16] for small scale application or for distributed water treatment systems, alternatives to the platinum group metals or boron-doped diamond electrodes are needed to lower the costs of electrochemical treatment [17,18,19,20,21,22,23,24,25,26]. Alternative electroactive materials are needed in order to lower the cost of production of semiconductor anodes for larger-scale practical applications. A major limitation of DSA systems that are currently in use is the dependence on the use of IrO2 or RuO2 as primary ohmic contact material. For example, the typical precursor reagents used, IrCl3 and RuCl3, are quite expensive with the cost of IrCl3 at three times the cost of RuCl3.
Zaradjanin et al. [27] reported on the critical importance of the chemical composition of the semiconductor anode materials in terms of improving interfacial electron transfer rates and for optimization of electrochemical efficiencies. In the case of reactions taking place in an NaCl electrolyte, there is major competition between the OER and RCS reactions for the same active sites on the anode surfaces [18,28].

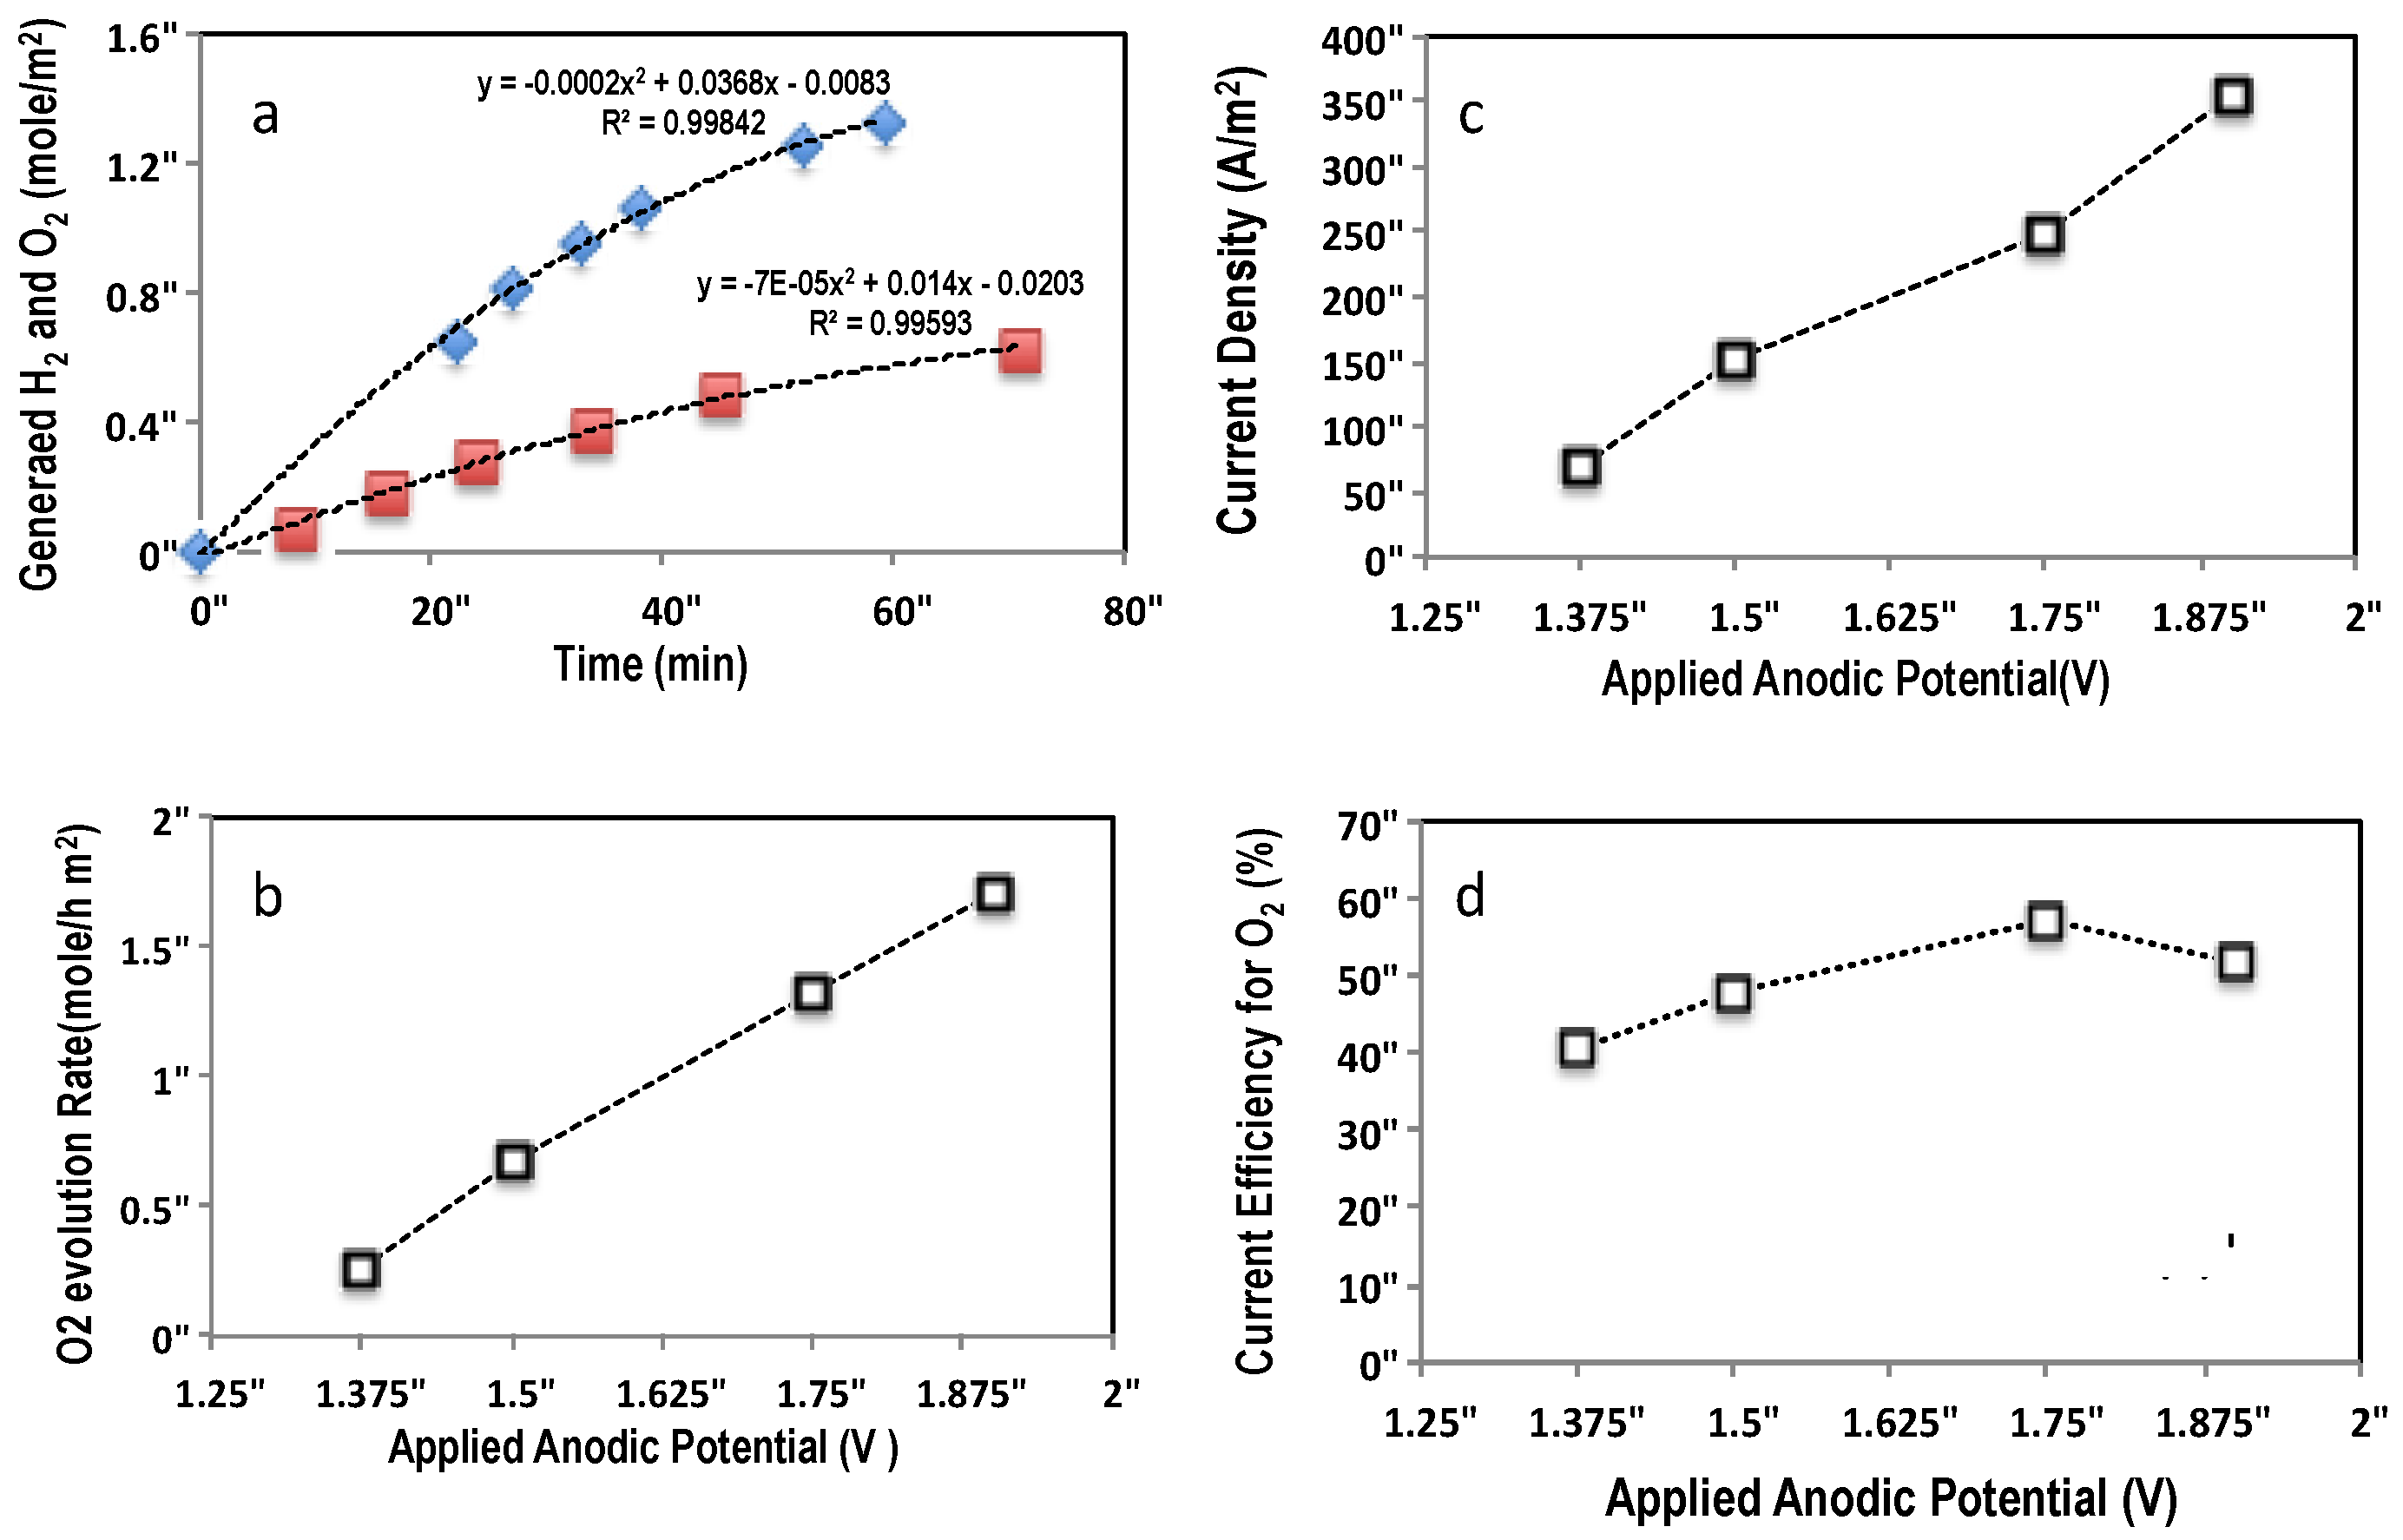
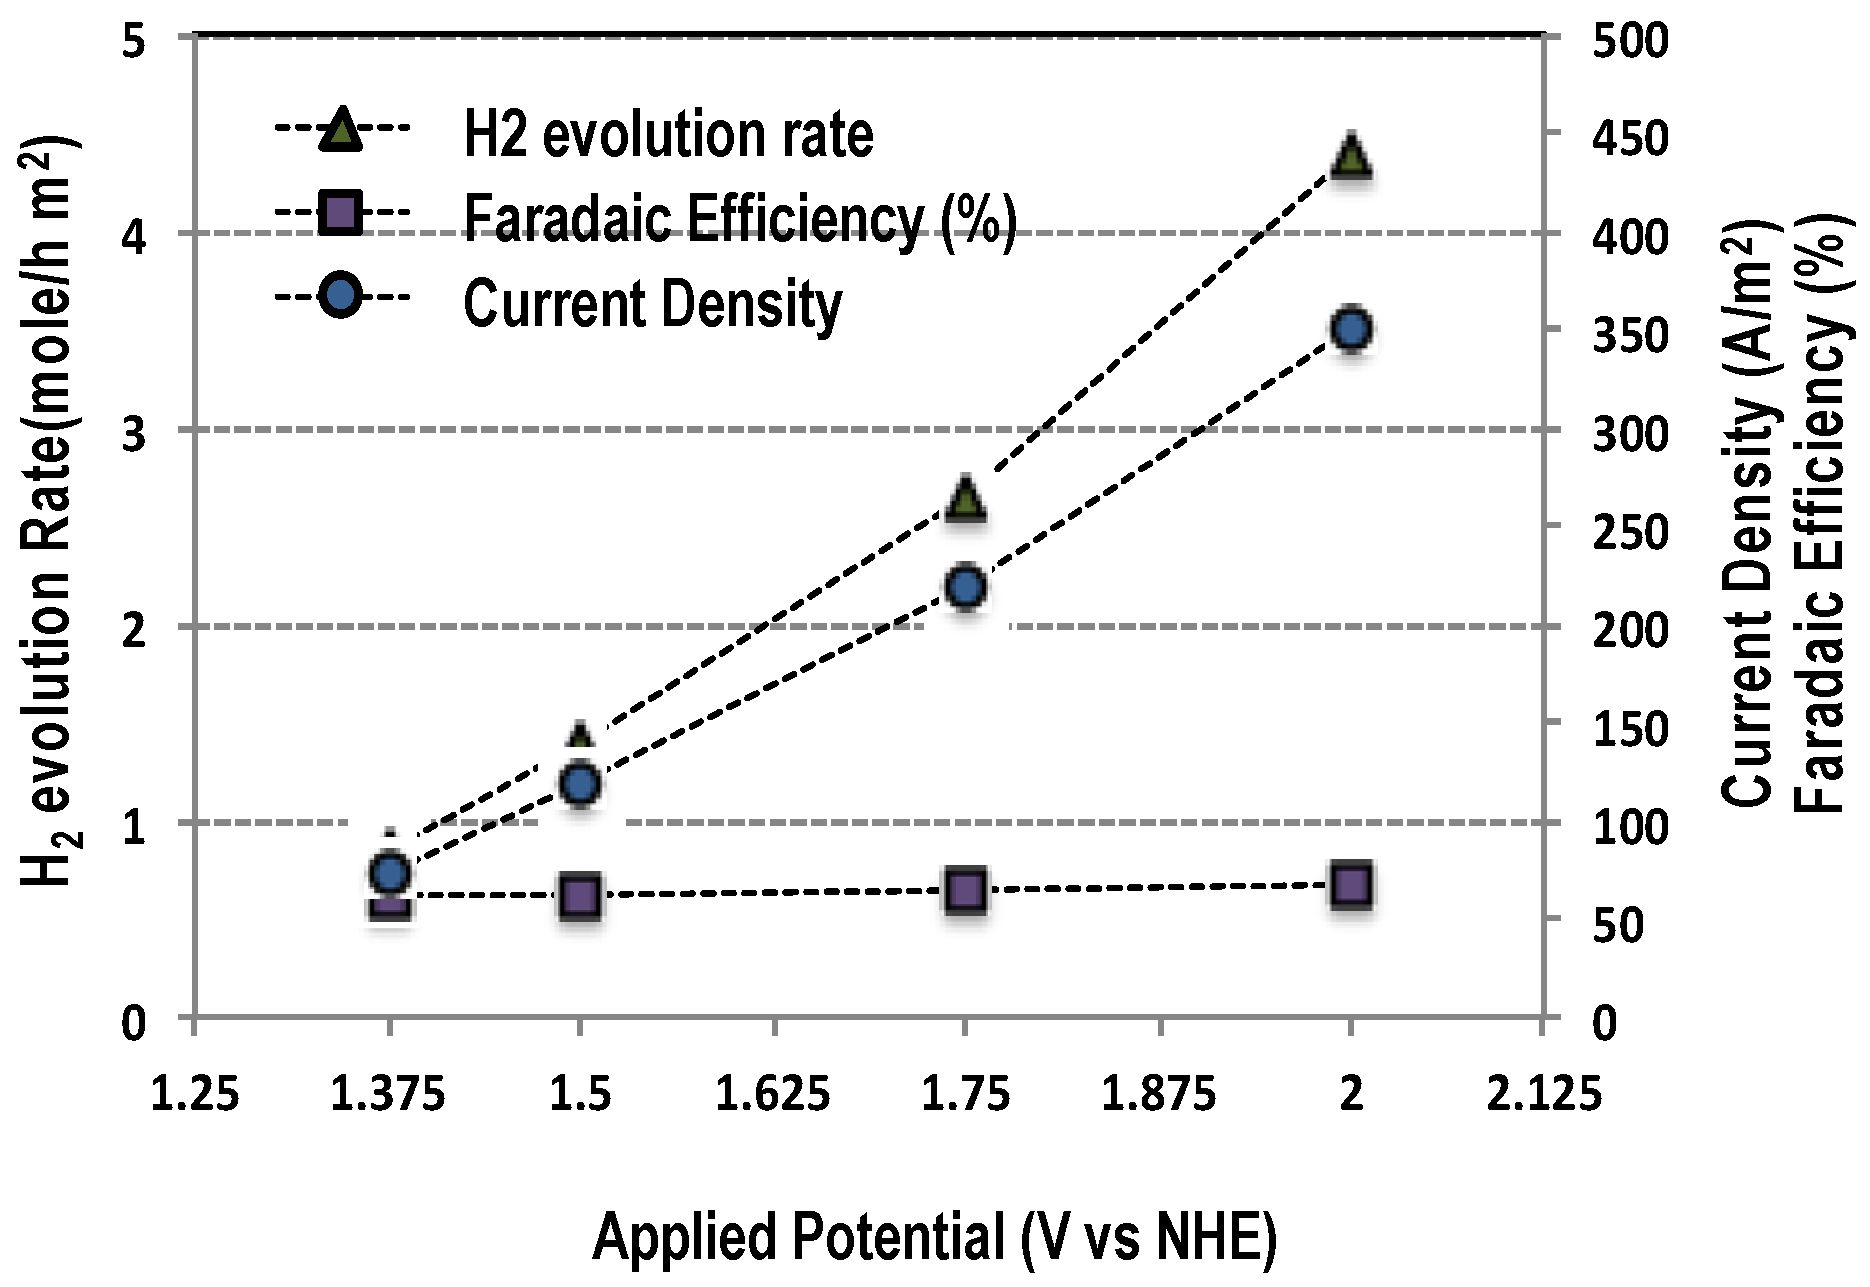
2.3.1. Water Oxidation

Metal oxide semiconductor electrodes are often used for electrochemical water splitting into O2 and H2 in alkaline, acidic, or neutral solutions in spite of their relatively large bandgap energies coupled with valence band edges close to −3.0 eV. The half-reactions for water splitting and corresponding overall reaction are given in Equations (1)–(3):
2 H2O → O2 + 4 H+ + 4 e (E = 1.23 VNHE-0.059V/pH)
4 H+ + 4 e → 2H2 (E = 0 VNHE-0.059V/pH)
2 H2O → O2 + 2 H2
The Ti-IrTa-TiO2 and Ti-IrTa-NaTaO3:La anodes were tested for their water splitting capability in 50 mM K2SO4 alone to avoid a direct composition of reactive chlorine species (RCS) from chloride at the electrode surfaces. The OER reaction mechanism on the metal oxide anodes can be considered to take place according to the sequence of reactions outlined by Comninellis [29]. The key reactions in the sulfate electrolyte solutions involve surface bound hydroxyl groups, >MOH, bound or adsorbed water >MOH2+, or a hydroxide ion within the near surface electrical double layer, which depends on the electrolyte solution pH and the pHzpc of the active metal oxide at the solid–solution interface [17,30].
MOx + H2O → MOx(OH) + H+ + e
MOx(OH) → MO(x+1) + H+ + e
MOx(OH) → MOx + ½ O2 + H+ + e
MO(x+1) → MOx + ½ O2
If the applied potential in a sulfate electrolyte solution is kept below +2.0 V, then the oxidation of SO42− to SO4 and S2O82− should not be a competitive process. Figure 4b shows the cyclic voltammetry (CV) profile of the anodes, Ti-IrTa-TiO2 and Ti-IrTa-NaTaO3:La, in a 50 mM K2SO4 electrolyte solution at the circum-neutral pH of 5.8. The Gibbs free energy (∆G) for water splitting at room temperature is 237.16 kJ/mol at a potential of 1.23 V at pH 0. The observed onset potential for the Ti-IrTa-NaTaO3 anode coupled with stainless steel cathode is about 1.255 V, which is giving an overpotential of 367 mV at circum-neutral pH in 50 mM K2SO4. The rate of H2 and O2 generation was determined for the Ti-IrTa-NaTaO3 and Ti-IrTa-TiO2 anodes using 6 cm2 active surfaces coupled with stainless steel cathodes at a separation distance of 5 mm as a function of the applied anodic potential, which varied from 1.35 to 2.0 V. Figure 5 shows the time-dependent evolution of H2 and O2 as a function of time as measured simultaneously, and O2 generation rate and current density, which increases with an increase in applied potential. The measured mole ratio of evolved H2 to O2 was not found to be 2 to 1 while the generation rate of H2 and O2 decreased as a function of time. The less than 2 to 1 stoichiometric ratio in the reactor headspace may be due to a number of factors including different gas solubility between O2 and H2 in water, which depends on the relative partial pressures in headspace of the reactor. The O2 solubility is 25 times that of H2 at 25 °C and a total pressure of 1.0 atm. In a well-mixed reactor that is lacking a salt bridge or proton-exchange membrane separator, oxygen can be simultaneous oxidized and reduced. Figure 6 shows the H2 and O2 evolution rates along with the current densities and current efficiencies. The generation rates of H2 and O2 were found to increase linearly with an increase in current density, as given in Table 1. The faradaic efficiencies ranged from 62.4% to 67.5% for H2 and from 40.6% to 60% for O2, respectively. At these efficiencies the Ti-IrTa-TiO2 and Ti-IrTa-NaTaO3 anodes, if coupled with more efficient cathodes, could be used for H2 generation [31].

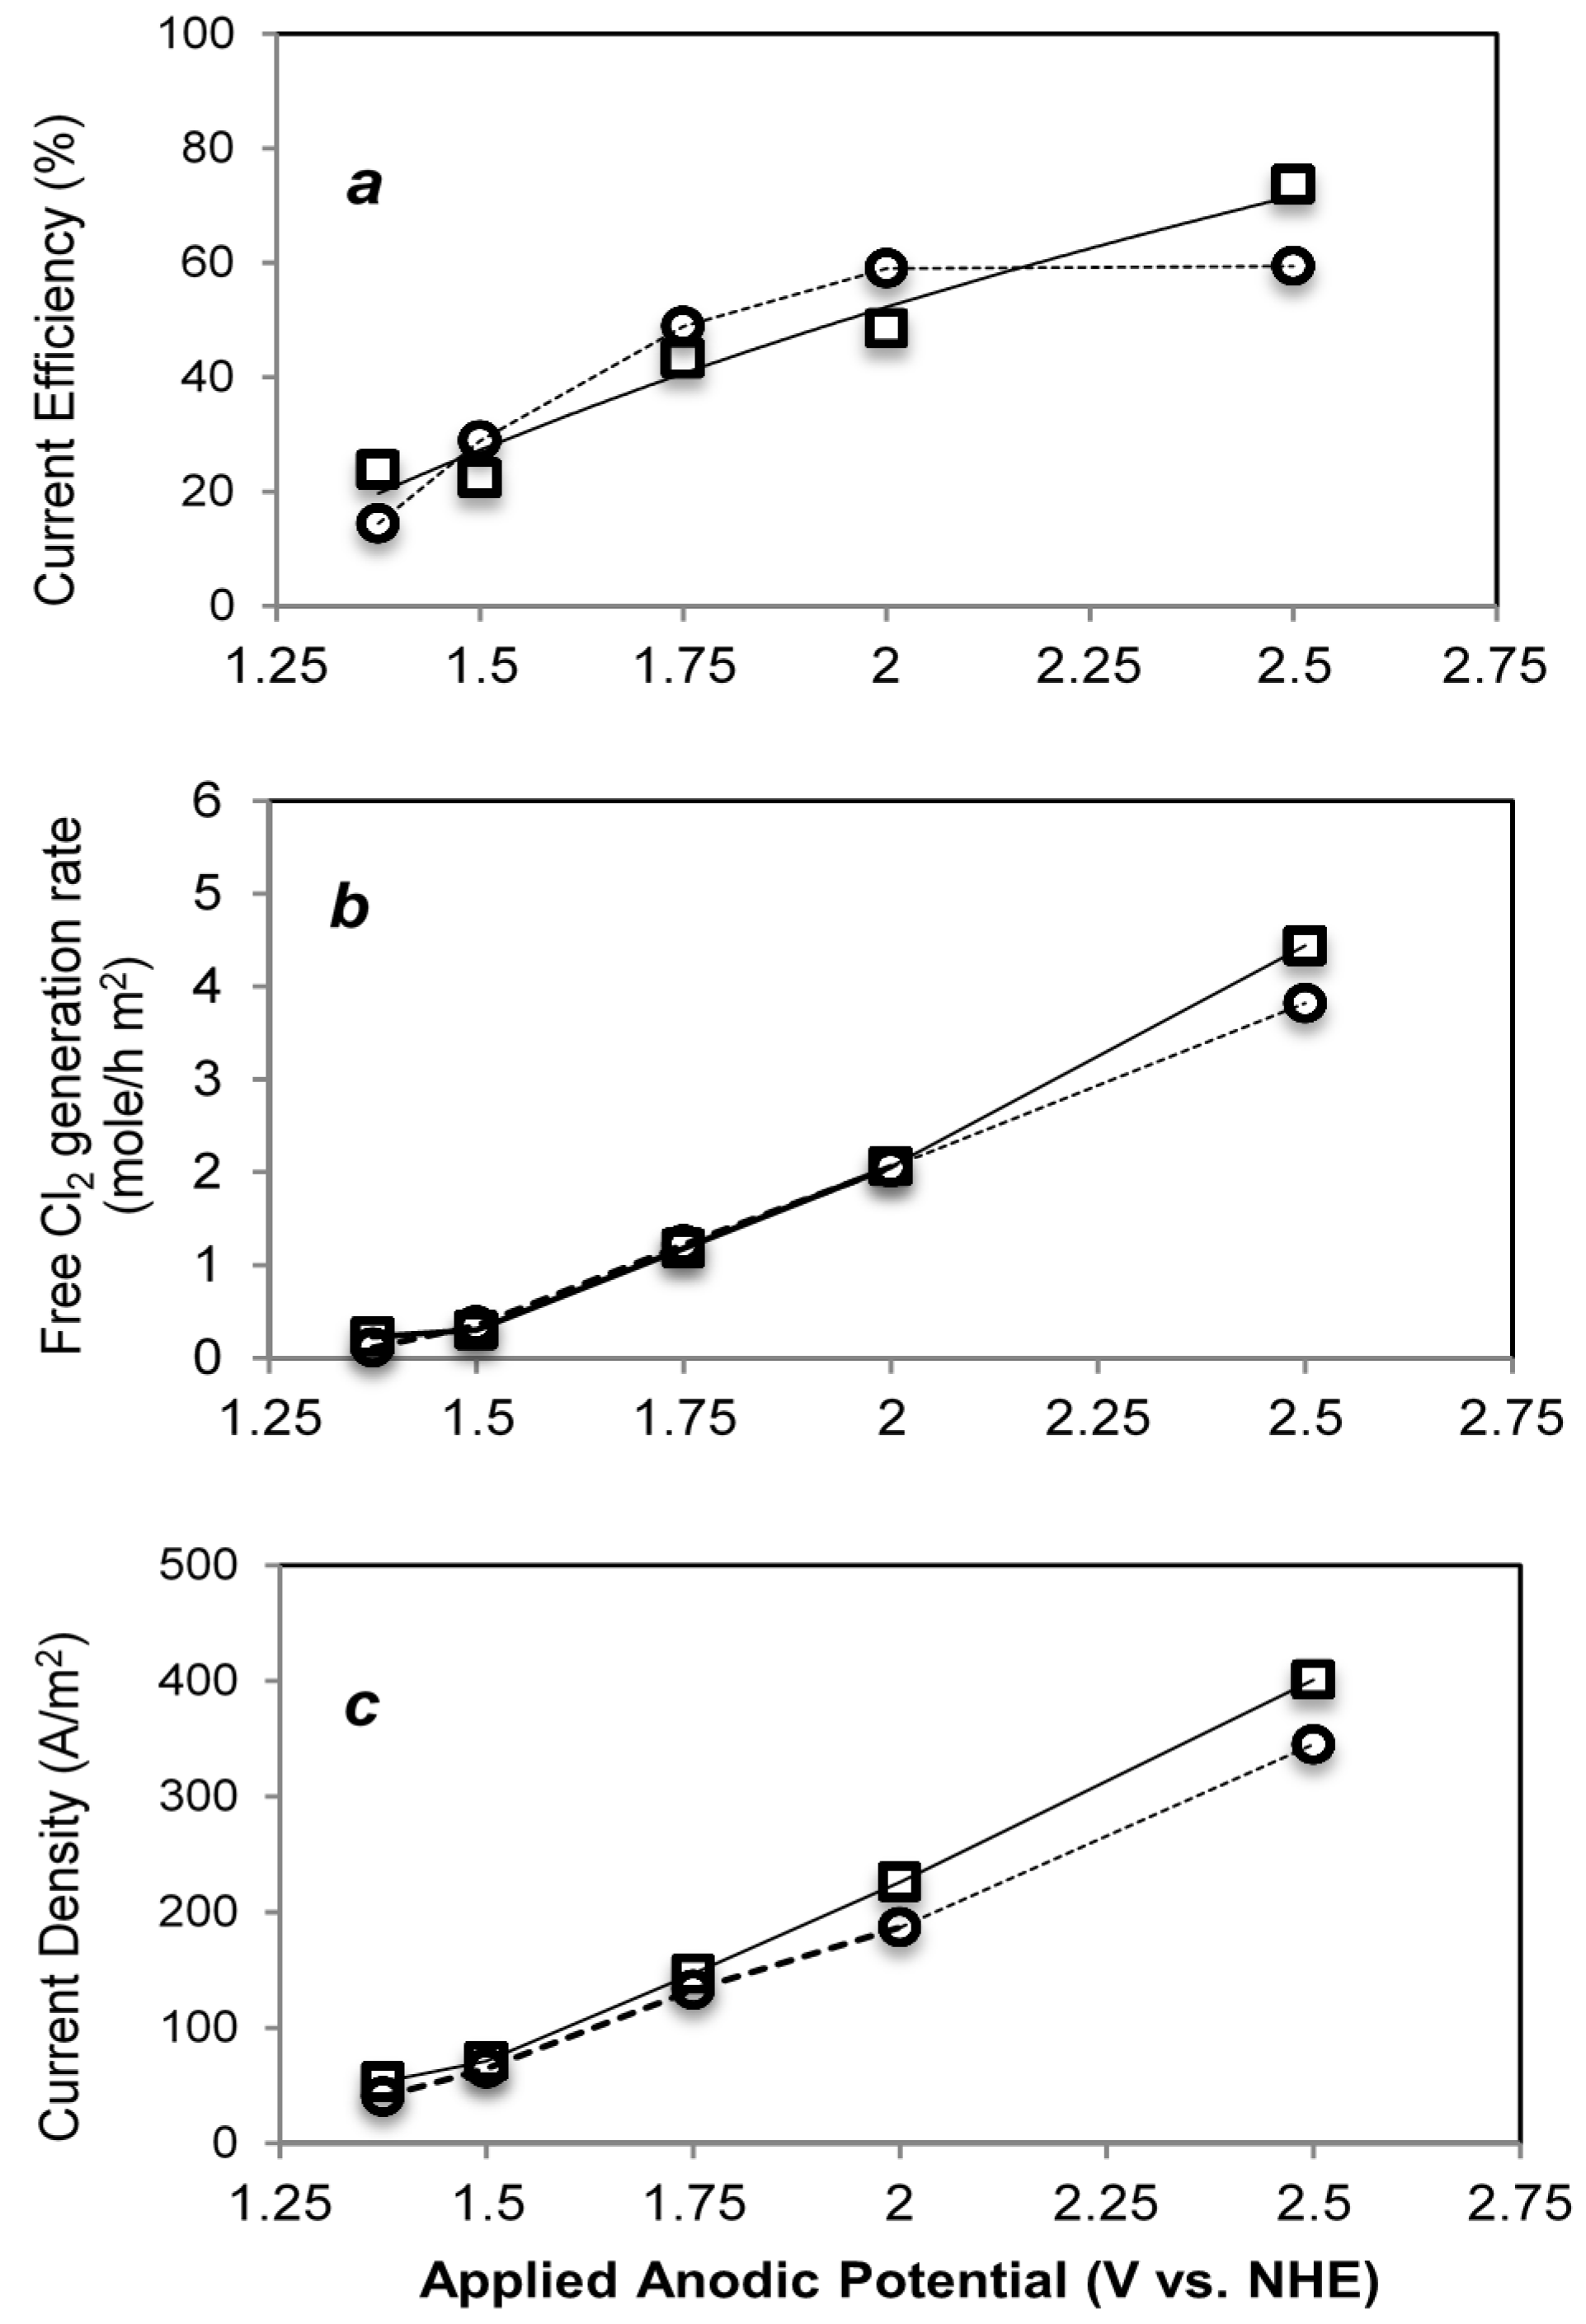
2.3.2. Wastewater Treatment

There is a growing interest in the use of electrochemistry for wastewater treatment, especially in smaller-scale distributed systems. The oxidation of organic and reduced inorganic compounds on the surface of metal oxides anodes is initiated via the formation of surficial hydroxyl radicals and/or by direct electron transfer to surface-trapped holes [17,30]. Chloride ions (Cl), which are normally present at variable levels in wastewater, undergo “indirect” oxidation by surface-bound hydroxyl radicals, leading to the production of reactive chlorine species (RCS) including free chlorine (Cl2, HOCl, ClO) [17,30] and chlorine radicals (Cl, Cl2) [2,16]. The RCS generation rate increases with an increase in applied voltage (Ea) up to a limiting value. The Ti-IrTa-TiO2 and Ti-IrTa-NaTaO3:La anodes were evaluated with respect to their free chlorine generation rates and electrochemical efficiencies when coupled with matched stainless steel cathodes. Figure 7 shows the observed generation rates for the RCS, current densities, and current efficiencies as a function of applied anodic potential over the range of +1.35 to +2.5 V during potentiostatic electrolysis (Table 2). The production of RCS is directly proportional to the electrode current density. The OER and RCS have similar standard redox potentials of 1.23 and 1.36 V at pH 0, respectively. On the surface of the mixed-metal oxide anodes, RCS evolution appears to be kinetically favored even though the OER is thermodynamically favored. The electrochemical oxidation of Cl on metal oxide anodes can be attributed to either oxidation by hydroxyl radical or by active lattice oxygens [17,32,33] as illustrated below:
MOx(OH) + Cl → MOx + Cl + OH
where k8 = 4.3 × 10⁹ M−1 s−1 for the homogeneous oxidation of Cl by OH.
MO(x+1) + Cl → MOx + ClO
In typical wastewater with relatively high chloride ion concentrations, there is an obvious competition between the RCS production and the OER on the anode surfaces.
In the case of RuO2 or RuO2/TiO2 the MOx+1 surficial sites appear to be the principal reactive sites for chloride oxidation [34]. In a typical sequence it initiates by an oxidation of Cl to a surface bound OCl (Equation (10)), the generation of reactive chlorine species (RCS) is developed as first order in concentration of Cl with a pseudo-steady-state approximation on MOx(OCl). However, at circumneutral pH, the Cl2 reacts with water to form hypochlorous acid and hypochlorite, as described in Equations (14) and (11). The formation of chlorate, ClO3, which we expect to detect from a subsequent reaction that is led by OCl or HOCl as a primary reductant(Equations (15) and (16)). The stepwise sequence of reactions for the production of RCS can be written as follows:
MO(x+1) + Cl → MO(x) + OCl
H+ + OCl ⇌ HOCl (pKaHOCl = 7.53)
MOx(OH) + Cl → MOx + Cl + OH
2Cl ⇌ Cl2
Cl2 + H2O → HOCl + Cl + H+
2MO(x+1) + ClO → 2MOx + ClO3
2MO(x+1) + HOCl → 2MOx + ClO3 + H+

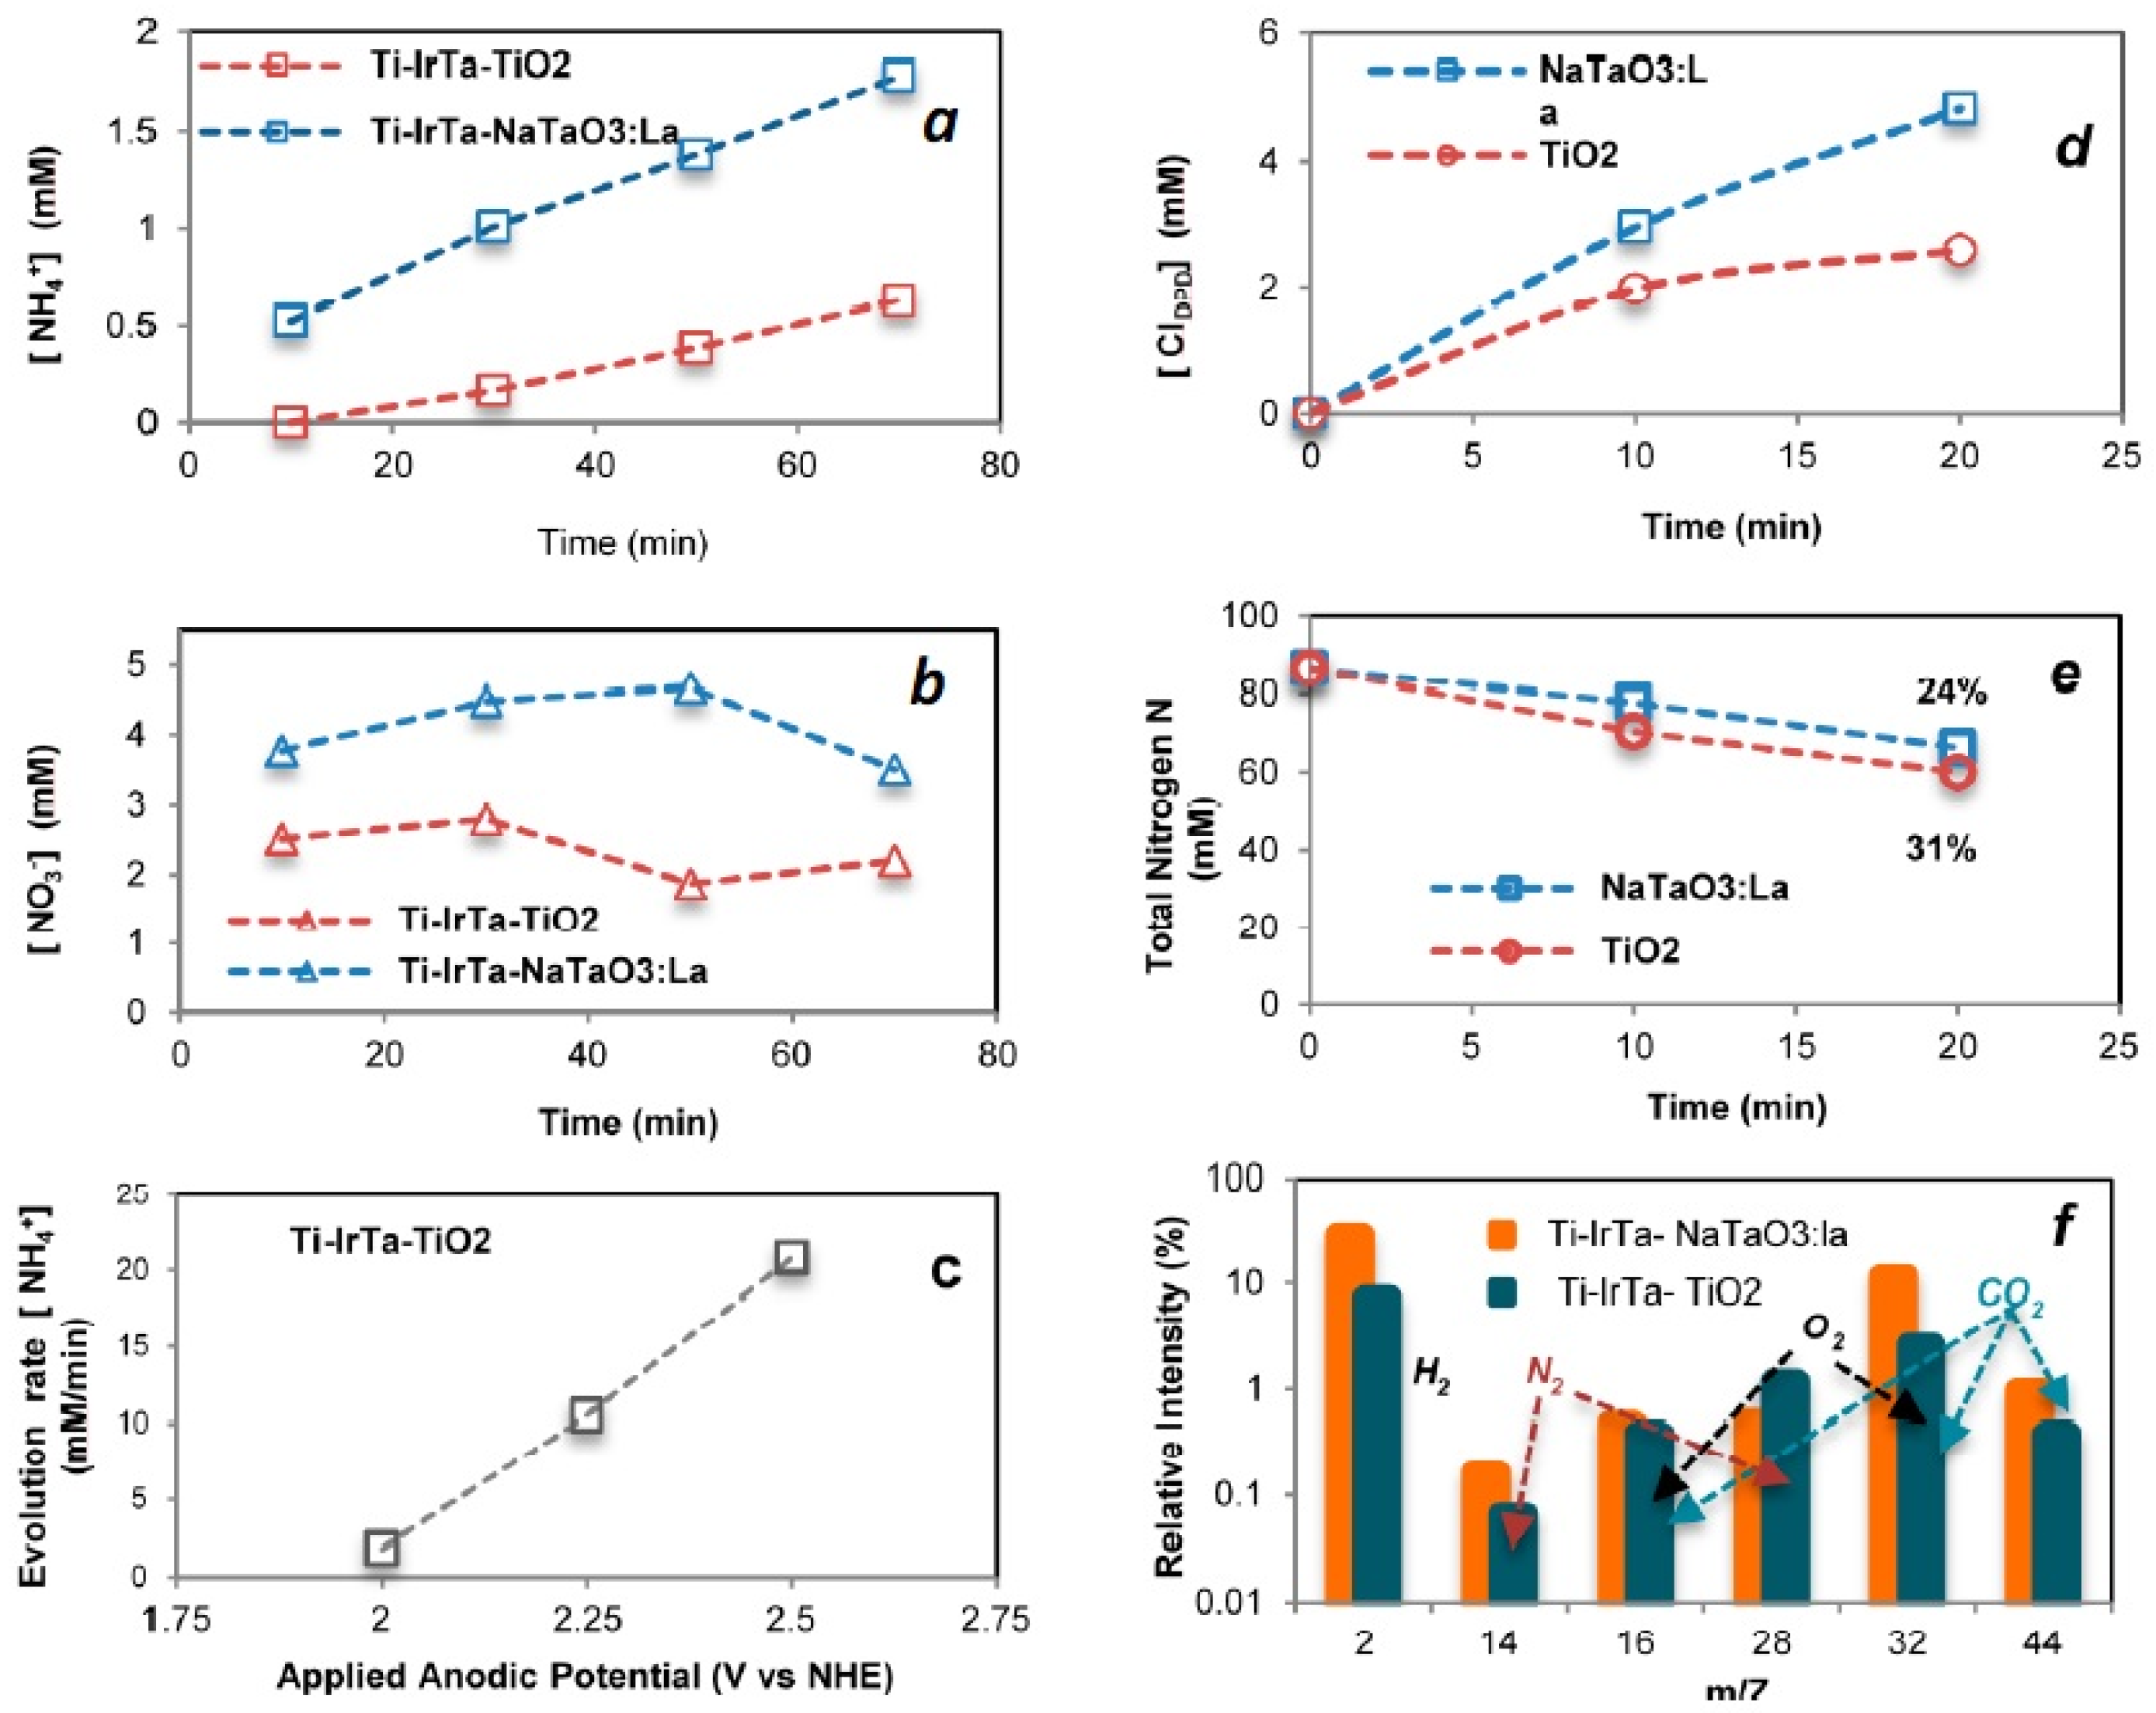
2.3.3. Urea Degradation

Urea is the most abundant nitrogen-containing compound in freshly discharged human waste. Upon hydrolysis, urea forms NH3 and CO2, eventually leading to the formation of chloramines, NHCl2, NH2Cl, and NCl3. Urea decomposition and subsequent chlorination using mixed metal oxide anodes [35,36,37] has been reported. Urea degradation using the alternative Ti-IrTa-TiO2 and Ti-IrTa-NaTaO3:La anodes has been investigated as part of this study. During electrochemical oxidation, N2 and CO2 along with H2 and O2 were formed as gaseous products, while NH4+, NO3, NH2Cl, NHCl2, and NCl3 were formed as reactive intermediates and products in the liquid phase. Simultaneous analysis of the gas and liquid phases was performed with a quadrupole mass spectrometer (QMS) for the headspace gas analysis and a DX-2000 ion chromatographic system was used to quantify ions in the aqueous phase [3]. Free reactive chlorine (HOCl or OCl, Figure 7) is a primary oxidant during urea degradation at relatively fast reaction rates. Figure 8 shows the concentration vs. time profiles of NH4+ and NO3 formed during potentiostatic electrolysis at an applied voltage of 2.25 V of a solution of urea at an initial concentration of 41.6 mM with an electrolyte concentration of 50 mM Cl in a reaction volume of 70 mL. During a typical reaction, the free molecular chlorine (Cl2) was below the detection limit, while the majority of total chlorine was found to be RCS plus an array of inorganic chloramines [38]. The observed concentration vs. time profiles of aqueous products are similar to previous reports [3,38]. This suggests that urea degradation takes place via reactions between urea and electrochemically-generated reactive chlorine (i.e., RCS) rather than by a direct oxidation pathway on the electrode surface, which normally takes place via direct electron transfer from nitrogen in urea to the active sites on the anode surface [1]. The first step during the oxidation of urea by chlorine has been reported to proceed slowly and thus it is the rate-determining step in the overall electrochemical oxidation and degradation of urea [38,39,40]. Based on previously reported results, RCS are formed on the anode surface, which then leads to formation of urea chlorinate to tetrachloro-urea that is subsequently oxidized to CO2 along with the formation of chloramines. The reaction sequence shown below in Equations (17) to (26) has been proposed to account for the decomposition of urea during chlorination:
2 (H2N)2CO + (OCl/HOCl/Cl) → H2N(CO)NHCl + H2N(CO)NCl2 + 2 H2O
Cl2N(CO)NCl2 + H2O → CO2 + 2 NHCl2
H2N(CO)NHCl + HOCl → CO2 + 2 NH2Cl
H2N(CO)NHCl + H2O → NH2Cl + NH2(CO)OH
NH2(CO)OH + Cl → ClHN(CO)OH + HOCl → CO2 + NHCl2 + H2O
NH2Cl + H2O → NH4+ + OCl
NH2Cl + HOCl → NHCl2 + H2O
NHCl2 + HOCl → NCl3 + H2O
NCl3 + HOCl + 2H2O → NO3 + 4Cl + 5H+
NHCl2 + NH2Cl → N2 + 3Cl + 3H+
The reversible hydrolysis of chloramines generates NH4+/NH3 depending on pH and the [RCS] [39]. Trichloramine oxidation by RCS also leads to NO3 formation [1,38]; however, the yields are quite low for the electrochemical oxidation of urea initiated by RCS. The observed time profiles ofNH4+ and NO3 shown in Figure 8a,b are consistent with previous reports for urea degradation on a bismuth-doped TiO2 electrode (BiOx/TiO2); in addition, the NH4+ ion in liquid phase increased proportionally along with an increased applied anodic potential, as shown in Figure 8c. The total nitrogen decay profile could be used as a surrogate for urea decomposition, since TN in the aqueous phase includes [NO3], [NH4+], [NHxCl3−x], although some of the chloramines react to form N2, as illustrated above via breakpoint chlorination. In general, the summation of the detected concentration of NH4+ and NO3, and ClDPD-containing nitrogen in the form of a chloramine (NHxCl3−x), is much smaller than the degassed N2, N2O, NO, or NO2.
The TN removal rate, in the case of the Ti-IrTa-TiO2 anode, was 31% after 20 min of electrolysis at an applied potential of 3.25 V. This level of reduction is higher than we had previously reported for a multi-metal anode with an overcoat of Bi-doped TiO2[2]. The rate of urea degradation based on the TN decay was ~1.0 mM min−1 with the Ti-IrTa-NaTaO3:La anode. In comparison, the rate of urea degradation or decomposition was found to be 1.3 times faster with the Ti-IrTa-TiO2 anode than with the Ti-IrTa-NaTaO3:La anode. The time profiles for the generated N2 and CO2 during electrolysis of urea degradation are shown in Figure S3. From the time-dependent concentration profiles of Figure 8, it is clear that the [NH4+] increased slowly compared to nitrate. NCl3, which is a likely intermediate leading to the formation of NO3 via the reaction of NH2Cl and free chlorine (HOCl) [38], was at pH 6.5. On the other hand, NH4+ might be formed through a reversible hydrolysis of the inorganic chloramine (NH2Cl). The formation of CO2 is generated via a different pathway from N2 generation, as described in Equations (18) and (19) above, and it is indicated that the CO2 formation is slower than the N2 generation, as shown in the time profiles of Figure S3.

3. Experimental Details

3.1. Synthetic Procedures: La-Doped NaTaO3 and TiO2 Nanogel

Lanthanum-doped NaTaO3 powder (denoted as NaTaO3:La) was prepared in a solid-state reaction [11] Reagent grade starting materials, La2O3, Na2CO3, and Ta2O5, were mixed in a ratio Na:La:Ta = (1 − x to x to 1). An excess amount of sodium (5 mol%) was added to the mixture in order to compensate for the volatilization during thermal processing. The reagent mixture was calcined in air at 1170 K for 1 h and 1420 K for 10 h with periodic breaks for grinding. Excess sodium was removed by water extraction after calcination. On average, the doping level was 2 mol% La into NaTaO3. TiO2 was synthesized according to a procedure used by Li et al. [10]. Titanium tetra-isopropoxide, Ti(OCH(CH3)2)4 or (TTIP), was diluted with 2-propanol and then added drop by drop into Milli-Q water where the mass ratio was MH2O/MTTIP = 110 in the presence of acetic acid at pH = 2. After complete hydrolysis the suspension was heated at 90 °C for 4 h with vigorous stirring. TiO2 particles were collected by centrifugation to yield a concentrated 15 wt. % gel. The resulting 15 wt. % TiO2 nanogel is defined as a “nanoglue.”

3.2. Electrode Fabrication

The metal oxide hetero-junction anodes were prepared by sequential deposition as follows: Ti metal coupons (2 × 5 cm2) were pretreated by sand blasting the surface; the sand-blasted Ti-metal coupons were then etched in a boiling 10 wt. % oxalic acid solution for 10 min. The first deposition layer of IrTaOx (i.e., anti-passivation ohmic contact) was prepared by coating with the precursor solution that contained 73 mM H2IrCl6 with 27 mM TaCl5 dissolved in a solution of ethanol and isopropanol at a 1:1 volume ratio. The deposited layer of IrTaOx was then annealed for 10 min at 525 °C. This procedure was repeated four to six times; the final over-coating layer was annealed for an additional hour at 525 °C. A protective over-coating layer of TiO2 in the form of a viscous paste was then applied. The alcohol-TiO2 coating paste was prepared by mixing 10% by weight Aeroxide P25 TiO2 with 15 wt. % of the TiO2 nanogel; the mixture was then ultrasonically mixed with a 20 kHz sonication system for 1 h. The weight ratio of the P25 TiO2 to the nanogel TiO2 was fixed at a ratio of 7:1. The NaTaO3:La overcoat was then prepared as a slurry by mixing 15 wt. % NaTaO3:La suspended in alcohol also containing 15 wt. % TiO2 nanogel at a weight ratio of 3.75:1. The outer-layer slurry coating was then applied with a doctor blade using tape as a spacer on the IrTaOx layer. The sequential deposition process can be summarized in the following steps used for the preparation of anode “A.” (1) A mixed suspension of IrO2/Ta2O5 at the mole ratio of 73:27 is deposited to provide an anti-passivation layer; (2) a protective sealing coat of Ni(NO3)3∙6H2O is then applied; and (3) a slurry of TiO2(P25) and TiO2 nanogel is deposited at the weight ratio of 3.75:1. The preparation of anode “B” was prepared following a two-step sequence of (1) application of an initial coating on the Ti base-metal with a mixture of IrO2/Ta2O5 at the mole ratio of 73:27 and then (2) deposition of a suspension slurry of NaTaO3:La and TiO2 nanogel at the weight ratio of 2.85:1. The preparation sequence involves depositing an initial ohmic contact layer on to the base Ti metal, which is followed by a sealing coat layer that is then followed by an overcoating layer (or an overcoat). After each coating layer is deposited, the composite material is thermally annealed as described above.
The electrochemical setup consisted of a mixed-metal oxide semiconductor anode coupled with a stainless steel cathode a separation distance of 5 mm. The effective surface areas for both anodes and cathodes were 6 cm2 (3 cm × 2 cm). The temperature-controlled electrochemical cells were connected to a potentiostat (SP-50, Bio-Logic, Grenoble, France). The applied anodic potential, Ea, was adjusted based on continuous monitoring of the response current (I) and cathodic potential (Ec). Electrochemical water splitting was carried out in electrolyte solutions of either 50 mM NaCl or 50 mM K2SO4 in a cell with total volume of 105 mL; this volume included 35 mL of head space was used to measure the production of H2 and O2 during electrolysis. Before each experiment, the reactor was purged high purity N2 for 45 min. The anodic and cathodic current efficiencies (Faradaic Efficiency, FE) for the production free reactive Cl2 (e.g., Cl2, HOCl, and OCl-) and/or O2 and H2 were determined according to the expression FE (%) = [Cl2 production rate (mol/s) × n × F/I] × 100, in which “n” is the number of electrons transferred for the production of Cl2, O2, and H2, respectively, I is the current (A), t is time (s) and F is the Faraday constant (96,485 C/mol). The free reactive chlorine concentrations were determined using a HACH standard DPD (N,N-diethyl-p-phenylenediamine) method and a HACH DR 900 colorimeter (HACH, Loveland, CO, USA). The method was calibrated using a SpecCheck Secondary Gel Standard Set for DPD Chlorine that has an analytical range from 0 to 6.5 mg/L as free reactive Cl2.

3.3. Instrumentations

X-ray photoelectron spectroscopy (XPS) analysis was conducted by using a surface science instrument M-probe spectrometer with a monochromatic 1486.6 eV Al Kα X-ray line source directed 35° to the sample surface, which is controlled by ESCA25 capture software. UV-Vis diffuse reflectance spectrum was measured using a Shimadzu UV-2101PC (dual beam) (Shimadzu, Kyoto, Japan) equipped with an integration sphere attachment (Shimadzu ISR-260, Shimadzu, Kyoto, Japan), which is used for reflection and transmittance measurement of liquid and solids. IR spectra were obtained using a Nicolet iS50 FTIR spectrometer (Thermo Scientific Inc., Waltham, MA, USA) integrated a diamond accessory. XRD apparatus used is a PANalytical X-ray diffractometer (X’Pert Pro) (PANalytical, Westborough, UK) which is a closed system that is completely remote controlled via computer. The XRD data was obtained by automatic scanning of a given range of the angle, 20° to 80°. SEM images were collected using a ZEISS 1550VP Field Emission Scanning Electron Microscope (SEM) (Carl Zeiss, Jena, Germany) operating at 10 kV acceleration voltages. Elemental analysis was performed using an energy dispersive X-ray spectroscopy system (EDS, Carl Zeiss, Jena, Germany) integrated with SEM, with the electron beam voltage set at 15 KeV. The particle size of TiO2 nanogel was estimated with a Transmission Electron Microscope (TEM) image. The analysis of the interest ions, NO3 and NH4+, were quantified by Dionex ICS2000 ion chromatography system. The amount of H2 and O2 evolved during water splitting electrolysis was analyzed using gas chromatography (HP 5890 Series II, Hewlett Packard, Palo Alto, CA, USA) with a thermal conductivity detector (TCD). Helium was used as the carrier gas for O2 detection, while nitrogen was used as carrier for H2 detection, and the separation was achieved with a molecular sieve column (30 m × 0.32 mm × 12.00 μm).

4. Conclusions

The alternative anode formulations, Ti-IrTa-TiO2 and Ti-IrTa-NaTaO3:La, had overpotentials of 437 mV and 239 mV, respectively, for OER with Faradaic efficiencies ranging from 62.4% to 67.5% for H2 and 40.6% to 60.0% for O2. The Faradaic efficiencies for RCS evolution were as high as 73.7% depending on the applied potential. The overpotentials were determined to be 239 mV and 205 mVfor RCSE, respectively. It appears that the relatively high efficiencies for electrolysis may be due to the use of a TiO2 nanogel as an inter-particle binding agent and electron relay.

Supplementary Materials

Figure S1: SEM and EDS of NaTaO3:La shows a nanostep surface morphology (A), while the surface of nondoped NaTaO3 was flat (B), caused by a change of the structure of NaTaO3 with the dope of lanthanum, Figure S2: TEM image that determined particle size as around 8 nm, and XRD patterns that revealed the anatase structural phase of TiO2 and confirmed abundant surface hydroxyl group in FTIR spectrum. The bandgap was determined as 3.13 eV at its UV-vis reflectance spectrum, Figure S3: Time profile for the generated N2 and CO2 gas during electrolysis of urea degradation: (a) a time profile of an estimated N2 and CO2 gas generation; (b) a time profile of head-space gas composition for the major gases, H2, O2, N2, and CO2.

Acknowledgments

This study is supported by Bill & Melinda Gates Foundation (BMGF RTTC Grant No. 1105724). The authors are grateful to Byung-Kuk Yoo (Caltech) for his support for TEM measurement.

Author Contributions

Su Young Ryu performed the experiments and data analysis and she wrote the initial draft of the paper. Michael Hoffmann was the principal investigator of the project; he edited the draft manuscript for publication.

Conflicts of Interest

The authors declare no conflict of interest.

References

  1. Cho, K.; Hoffmann, M.R. Urea degradation by electrochemically generated reactive chlorine species: Products and reaction pathways. Environ. Sci. Technol. 2014, 48, 11504–11511. [Google Scholar] [CrossRef] [PubMed]
  2. Cho, K.; Kwon, D.; Hoffmann, M.R. Electrochemical treatment of human waste coupled with molecular hydrogen production. RSC Adv. 2014, 4, 4596–4608. [Google Scholar] [CrossRef]
  3. Cho, K.; Qu, Y.; Kwon, D.; Zhang, H.; Cid, C.A.; Aryanfar, A.; Hoffmann, M.R. Effects of anodic potential and chloride ion on overall reactivity in electrochemical reactors designed for solar-powered wastewater treatment. Environ. Sci. Technol. 2014, 48, 2377–2384. [Google Scholar] [CrossRef] [PubMed]
  4. Cho, K.; Hoffmann, M.R. BixTi1−xOz functionalized heterojunction anode with an enhanced reactive chlorine generation efficiency in dilute aqueous solutions. Chem. Mater. 2015, 27, 2224–2233. [Google Scholar] [CrossRef]
  5. Zeng, K.; Zhang, D.K. Recent progress in alkaline water electrolysis for hydrogen production and applications. Prog. Energy Combust. Sci. 2010, 36, 307–326. [Google Scholar] [CrossRef]
  6. Tributsch, H. Photovoltaic hydrogen generation. Int. J. Hydrog. Energy 2008, 33, 5911–5930. [Google Scholar] [CrossRef]
  7. Hall, D.E. Ni(OH)2 impregnated anodes for alkaline water electrolysis. J. Electrochem. Soc. 1983, 130, 317–321. [Google Scholar] [CrossRef]
  8. Doyle, R.L.; Godwin, I.J.; Brandon, M.P.; Lyons, M.E. Redox and electrochemical water splitting catalytic properties of hydrated metal oxide modified electrodes. Phys. Chem. Chem. Phys. PCCP 2013, 15, 13737–13783. [Google Scholar] [CrossRef] [PubMed]
  9. McCrory, C.C.; Jung, S.; Peters, J.C.; Jaramillo, T.F. Benchmarking heterogeneous electrocatalysts for the oxygen evolution reaction. J. Am. Chem. Soc. 2013, 135, 16977–16987. [Google Scholar] [CrossRef] [PubMed]
  10. Li, Y.; Lee, W.; Lee, D.K.; Kim, K.; Park, N.G.; Ko, M.J. Pure anatase TiO2 “nanoglue”: An inorganic binding agent to improve nanoparticle interconnections in the low-temperature sintering of dye-sensitized solar cells. Appl. Phys. Lett. 2011, 98, 103301. [Google Scholar] [CrossRef]
  11. Lyons, M.E.; Floquet, S. Mechanism of oxygen reactions at porous oxide electrodes. Part 2-oxygen evolution at RuO2, IrO2 and IrxRu1−xO2 electrodes in aqueous acid and alkaline solution. Phys. Chem. Chem. Phys. PCCP 2011, 13, 5314–5335. [Google Scholar] [CrossRef] [PubMed]
  12. Kato, H.; Asakura, K.; Kudo, A. Highly efficient water splitting into H2 and O2 over lanthanum-doped NaTaO3 photocatalysts with high crystallinity and surface nanostructure. J. Am. Chem. Soc. 2003, 125, 3082–3089. [Google Scholar] [CrossRef] [PubMed]
  13. Kotz, R.; Stucki, S. Stabilization of RuO2 by IrO2 for anodic oxygen evolution in acid media. Electrochem. Acta 1986, 31, 1311–1316. [Google Scholar] [CrossRef]
  14. Park, H.; Vecitis, C.D.; Choi, W.; Weres, O.; Hoffmann, M.R. Solar-powered production of molecular hydrogen from water. J. Phys. Chem. C 2008, 112, 885–889. [Google Scholar] [CrossRef]
  15. Park, H.; Vecitis, C.D.; Hoffmann, M.R. Solar-powered electrochemical oxidation of organic compounds coupled with the cathodic production of molecular hydrogen. J. Phys. Chem. A 2008, 112, 7616–7626. [Google Scholar] [CrossRef] [PubMed]
  16. Park, H.; Vecitis, C.D.; Hoffmann, M.R. Electrochemical water splitting coupled with organic compound oxidation: The role of active chlorine species. J. Phys. Chem. C 2009, 113, 7935–7945. [Google Scholar] [CrossRef]
  17. Martinez-Huitle, C.A.; Ferro, S. Electrochemical oxidation of organic pollutants for the wastewater treatment: direct and indirect processes. Chem. Soc. Rev. 2006, 35, 1324–1340. [Google Scholar] [CrossRef] [PubMed]
  18. Martinez-Huitle, C.A.; Brillas, E. Decontamination of wastewaters containing synthetic organic dyes by electrochemical methods: A general review. Appl. Catal. B Environ. 2009, 87, 105–145. [Google Scholar] [CrossRef]
  19. Raut, A.S.; Cunningham, G.B.; Parker, C.B.; Klem, E.J.D.; Stoner, B.R.; Deshusses, M.A.; Glass, J.T. Disinfection of E. coli contaminated urine using boron-doped diamond electrodes. J. Electrochem. Soc. 2014, 161, G81–G81. [Google Scholar] [CrossRef]
  20. Antonin, V.S.; Santos, M.C.; Garcia-Segura, S.; Brillas, E. Electrochemical incineration of the antibiotic ciprofloxacin in sulfate medium and synthetic urine matrix. Water Res. 2015, 83, 31–41. [Google Scholar] [CrossRef] [PubMed]
  21. Marmanis, D.; Dermentzis, K.; Christoforidis, A.; Ouzounis, K.; Moumtzakis, A. Electrochemical treatment of actual dye house effluents using electrocoagulation process directly powered by photovoltaic energy. Desalin. Water Treat. 2015, 56, 2988–2993. [Google Scholar] [CrossRef]
  22. Muazu, N.D.; Jarrah, N.; Bukhari, A. Kinetic modeling of electrochemical oxidation of phenol on boron-doped diamond anode in the presence of some inorganic species. Desalin. Water Treat. 2015, 56, 3005–3012. [Google Scholar] [CrossRef]
  23. Radjenovic, J.; Sedlak, D.L. Challenges and opportunities for electrochemical processes as next generation technologies for the treatment of contaminated water. Environ. Sci. Technol. 2015, 49, 11292–11302. [Google Scholar] [CrossRef] [PubMed]
  24. Zollig, H.; Fritzsche, C.; Morgenroth, E.; Udert, K.M. Direct electrochemical oxidation of ammonia on graphite as a treatment option for stored source-separated urine. Water Res. 2015, 69, 284–294. [Google Scholar] [CrossRef] [PubMed]
  25. Zollig, H.; Morgenroth, E.; Udert, K.M. Inhibition of direct electrolytic ammonia oxidation due to a change in local pH. Electrochim. Acta 2015, 165, 348–355. [Google Scholar] [CrossRef]
  26. Zollig, H.; Remmele, A.; Fritzsche, C.; Morgenroth, E.; Udert, K.M. Formation of chlorination byproducts and their emission pathways in chlorine mediated electro-oxidation of urine on active and nonactive type anodes. Environ. Sci. Technol. 2015, 49, 11062–11069. [Google Scholar] [CrossRef] [PubMed]
  27. Zeradjanin, A.R.; Menzel, N.; Schuhmann, W.; Strasser, P. On the faradaic selectivity and the role of surface inhomogeneity during the chlorine evolution reaction on ternary Ti-Ru-Ir mixed metal oxide electrocatalysts. Phys. Chem. Chem. Phys. 2014, 16, 13741–13747. [Google Scholar] [CrossRef] [PubMed]
  28. Exner, K.S.; Anton, J.; Jacob, T.; Over, H. Chlorine evolution reaction on RuO2(110): Ab initio atomistic thermodynamics study-Pourbaix diagrams. Electrochim. Acta 2014, 120, 460–466. [Google Scholar] [CrossRef]
  29. Comninellis, C. Electocatalysis in the electrochemical conversion/combustion of organic pollutants for waste water treatment. Electrochem. Acta 1994, 39, 1857–1862. [Google Scholar] [CrossRef]
  30. Panizza, M.; Cerisola, G. Direct and mediated anodic oxidation of organic pollutants. Chem. Rev. 2009, 109, 6541–6569. [Google Scholar] [CrossRef] [PubMed]
  31. Cheng, S.; Logan, B.E. Sustainable and efficient biohydrogen production via electrohydrogenesis. PNAS 2007, 104, 18871–18873. [Google Scholar] [CrossRef] [PubMed]
  32. Hansen, H.A.; Man, I.C.; Studt, F.; Abild-Pedersen, F.; Bligaard, T.; Rossmeisl, J. Electochemical chlorine evolution at rutile oxide (110) surfaces. Phys. Chem. Chem. Phys. 2010, 12, 283–290. [Google Scholar] [CrossRef] [PubMed]
  33. Trasatti, S. Progress in the understanding of the mechanism of chlorine evolution at oxide electrodes. Electrochem. Acta 1987, 32, 369–382. [Google Scholar] [CrossRef]
  34. Krishtalik, L.I. Kinetics and mechanism of anodic chlorine and oxygen evolution reactions on transition metal oxide electrodes. Electrochem. Acta 1981, 26, 329–337. [Google Scholar] [CrossRef]
  35. Simka, W.; Piotrowski, J.; Robak, A.; Nawrat, G. Electrochemical treatment of aqueous solutions containing urea. J. Appl. Electrochem. 2009, 39, 1137–1143. [Google Scholar] [CrossRef]
  36. Hernlem, B.J. Electrolytic destruction of urea in dilute chloride solution using DSA electrodes in a recycled batch cell. Water Res. 2005, 39, 2245–2252. [Google Scholar] [CrossRef] [PubMed]
  37. Carlesi Jara, C.; di Giulio, S.; Fino, D.; Spinelli, P. Combined direct and indirect electroxidation of urea containing water. J. Appl. Electrochem. 2008, 38, 915–922. [Google Scholar] [CrossRef]
  38. Blatchley, E.R.; Cheng, M.M. Reaction mechanism for chlorination of urea. Environ. Sci. Technol. 2010, 44, 8529–8534. [Google Scholar] [CrossRef] [PubMed]
  39. Jafvert, C.T.; Valentine, R.L. Reaction scheme for the chlorination of ammoniacal water. Environ. Sci. Technol. 1992, 26, 577–586. [Google Scholar] [CrossRef]
  40. Deborde, M.; von Gunten, U. Reactions of chlorine with inorganic and organic compounds during water treatment-Kinetics and mechanisms: A critical review. Water Res. 2008, 42, 13–51. [Google Scholar] [CrossRef] [PubMed]
Figure 1. SEM micrographs and associated EDS data with the associated chemical composition for the sequential coating layers. (a) Top surface over-coating layer (b) Second coating layer of NiO applied as an optional layer, containing a minor amount of Ni(OH)2 as determined by XPS analysis. (c) Primary coating of IrTaOx on the surface of the Ti base-metal support.
Catalysts 06 00059 g001
Figure 2. SEM images of overcoated substrate surfaces coupled together with TiO2 nanogel: (a) NaTaO3; (b) NaTaO3:La mixed with 1.5% TiO2 nanogel; (c) additional TiO2 nanogel applied on the surface shown in Figure 2b for a total of 3 wt. % TiO2 nanogel; (d) higher resolution SEM image of the over-coating layer of NaTaO3:La mixed with 1.5% TiO2 nanogel inter-particle binding agent that highlights a nanogel binder location shown in the red box.
Catalysts 06 00059 g002
Figure 3. (a) FTIR spectra of the metal oxide powders used for fabrication of anode, TiO2 (P25), NaTaO3:La, TiO2 nanogel, and TiO2 nanocrystals. (b) FTIR spectra of the Ti-IrTa, Ti-IrTa-TiO2, Ti-IrTaTi-IrTa-NaTaO3:La anodes. (c) XRD spectra of Ti-IrTa-NaTaO3:La, Ti-IrTa-TiO2 and Ti-IrTa electrode. Ti-IrTa electrode pattern was dominated by the Ti foil XRD pattern due to the thin layer of of IrTaOx. XRD pattern of NaTaO3:La (*), an anatase phase of TiO2 nanogel (●), and a rutile phase from TiO2 (P25) (■).
Catalysts 06 00059 g003
Figure 4. Cyclic voltammetry (CV) results for IrO2/Ta2O5 pre-coated anodes (Ti-IrTa), TiO2 over-coated anodes (Ti-IrTa-TiO2), and NaTaO3:La over-coated on IrO2Ta2O5 (Ti-IrTa-NaTaO3:La). (a) CV in a 50 mM NaCl solution; (b) CV in a 50 mM K2SO4 solution; and (c) the estimated overpotential obtained.
Catalysts 06 00059 g004
Figure 5. The generation rates for H2 and O2 were determined using 6 cm2 active surface areas for specific test anode and cathode. The Ti-IrTa-NaTaO3 anode was paired with a stainless steel cathode at a separation distance of 5 mm. Evolution rates were measured as a function of the applied anodic potential over the range of 1.35 to 2.0 V vs. SHE in a 50 mM K2SO4 electrolyte:(a) evolved H2 and O2 as measured simultaneously as a function of time at the 1.5 applied anodic potential; (b) O2 evolution rate; and (c) current density as function of applied potential; with (d) current efficiency for O2 evolution.
Catalysts 06 00059 g005
Figure 6. H2 evolution rates and associated faradaic efficiencies (HER) and current densities as a function of applied potential using the Ti-IrTa-TiO2 anodes (6 cm2) coupled with stainless steel cathodes with an electrode separation distance of 5 mm in a 50 mM K2SO4 electrolyte solution.
Catalysts 06 00059 g006
Figure 7. Comparative performance of the Ti-IrTa-TiO2 (○) and Ti-IrTa-NaTaO3:La (□) anodes coupled with stainless steel cathodes in terms of (a) current efficiency, (b) reactive chlorine generation rates, and (c) current density as a function of applied anodic potential during potentiostatic electrolysis of 50 mM NaCl solutions using the same cell dimensions and surface areas.
Catalysts 06 00059 g007
Figure 8. (a) [NH4+] and (b) [NO3] versus time during the potentiostatic electrolysis of a solution containing 42 mM of urea and 50 mM NaCl in a volume of 70 mL for the Ti-IrTa-TiO2 and Ti-IrTa-NaTaO3:La anodes; (c) NH4+ production rate as a function of applied potential; (d) total chlorine production (ClDPD) at +2.25 V for Ti-IrTa-TiO2 and Ti-IrTa-NaTaO3:La; (e) [𝚺N]T vs. time; (f) head-space gas composition at an anodic potential of +3.25 V as determined by online MS.
Catalysts 06 00059 g008
Table 1. H2 evolution rates and current efficiencies as a function of the applied anodic potential over the range from 1.375 to 2.0 V during electrolysis of water in 50 mM K2SO4.
ElectrodePotential (V vs. NHE)Current (mA)Current Density (A/m2)H2 Evolution (mol/h∙m2)O2 Evolution (mol/h∙m2)Current Efficiency (%) for H2/O2
Ti-IrTa-TiO21.384371.70.834-62.4/-
1.5721201.3920.68062.2/60
1.75131218.32.64-64.8/-
2.02103504.404-67.5/-
Ti-IrTa-NaTaO31.384168.3-0.258-/40.6
1.591151.71.80.67862/48
1.75149248.3-1.326-/57.2
1.9213355-1.715-/51.8
Table 2. Measured rates of reactive chlorine generation, current efficiencies, and current densities as a function of applied anodic potential from 1.38 to 2.5 V NHE during potentiostatic electrolysis in 50 mM NaCl solutions.
Electrode (Anode)Potential (V vs. NHE)Current (mA)Current Density (A/m2)Free Cl2 Evolution (mol/h∙m2)Current Efficiency (%)
Ti-IrTa-TiO21.38V24.240.30.1116.4
1.5 V38.864.70.3531.3
1.75 V79.7132.81.2248.9
2.0 V112186.72.0559
2.5 V2073453.8259.4
Ti-IrTa-NaTaO31.3 V3253.30.2323.8
1.5 V42.6710.3022.3
1.75 V88146.71.1843.25
2.0 V135.62262.0648.5
2.5 V2414014.4473.7

