Article

Adsorption Performance of Methyl Violet via α-Fe2O3@Porous Hollow Carbonaceous Microspheres and Its Effective Regeneration through a Fenton-Like Reaction

1
College of Environmental Science and Engineering, Chang’an University, Xi’an 710054, China
2
Key Laboratory of Tibetan Medicine Research, Northwest Institute of Plateau Biology, Chinese Academy of Sciences, Xining 810001, China
*
Author to whom correspondence should be addressed.
Catalysts 2016, 6(4), 58; https://doi.org/10.3390/catal6040058
Submission received: 5 March 2016 / Revised: 1 April 2016 / Accepted: 6 April 2016 / Published: 15 April 2016

Abstract

:
α-Fe2O3@porous hollow carbonaceous microspheres (α-Fe2O3@PHCMs) were prepared through a combination of hydrothermal and calcination method. The novel α-Fe2O3@PHCMs integrated the adsorptive and catalytic performances and served as an inexpensive adsorbent to rapidly remove cationic dye (methyl violet (MV)) from aqueous solution. Equilibrium studies indicated that the dye molecules obeyed Langmuir type of adsorption with the calculated maximum adsorption capacity of 539.8 mg∙g−1 at 313.15 K. Kinetic data were better described by pseudo-second-order model and the thermodynamic studies illustrated that MV adsorption onto the composite was spontaneous, endothermic and occurred by physisorption. The Fenton-like process was found to be effective for the regeneration of the spent α-Fe2O3@PHCMs. The regeneration efficiency, as high as 88.0%, was still maintained after three consecutive adsorption-regeneration cycles. FTIR and XRD characterizations of the composite before and after adsorption-regeneration treatment showed that the Fenton-like process did not cause serious damage to the structure of composites.

Graphical Abstract

1. Introduction

The increasing environmental problems caused by dye effluents have driven considerable research efforts on the degradation of dye wastewater [1]. Methyl violet (MV) is especially important because of its broad applications in paints, textiles, print inks, bacteria classification and disinfectant [2,3]. The inhalation of MV may cause irritation to the respiratory tract, and ingestion typically causes irritation to the gastrointestinal tract [4]. Moreover, MV is recalcitrant and difficult to degrade because of the presence of three aryl groups, each of which is bonded to a nitrogen atom that interacts with one or two methyl groups [5]. A wide range of technologies have been developed for the removal of synthetic dyes from aqueous solutions to decrease their environmental impacts, including membrane filtration processes [6], sorption techniques [7], coagulation [8], advanced oxidation processes [9] and ozonation [10]. Among the above-mentioned technologies, adsorption is superior to the other techniques in terms of low initial cost, flexibility, simplicity of design, ease of operation and insensitivity to toxic pollutants [11].
Nowadays, the development of new adsorbents having superior properties such as high adsorption capacity, renewability and mechanical strength has generated great interests for wastewater treatment [12]. Recently, one unique hollow carbonaceous microsphere with porous shell has been reported by using yeast cells as raw materials, which have attracted significant attention because of their outstanding chemical and physical properties [13]. For instance, the amphiphilic property of hollow carbonaceous microspheres allows their stable dispersion in various solvents, and endows them with a spontaneous phase-transfer feature in biphasic systems. Moreover, rapid and reversible auto-enrichment of organic species on the surface and inside the hollow cavities could be achieved readily. However, their practical application as adsorbent in wastewater treatment has still been limited because they could get saturated easily in the adsorption process [14]. Therefore, the combination of carbonaceous material and nano-sized metal oxide particles has gained more attention in adsorption due to their unique chemical, physical and structural characteristics [15]. These facts inspired us to utilize porous hollow carbonaceous microspheres derived from yeast as carbon support to synthesize α-Fe2O3@PHCMs microspheres for dye removal.
In this study, recyclable and efficient α-Fe2O3@PHCMs were prepared as alternative adsorbent for cationic MV dye removal from aqueous solutions. The influence of several parameters such as pH, adsorbent dosage, initial dye concentration, contact time and temperature on the adsorption capacity was evaluated and discussed. Kinetic, equilibrium, and thermodynamic studies have also been fully conducted. Moreover, in situ regeneration of the adsorbents was investigated, and characterization of the adsorbent before and after regeneration cycles was conducted to verify the renewability and stability of the α-Fe2O3@PHCMs adsorbent.

2. Results and Discussion
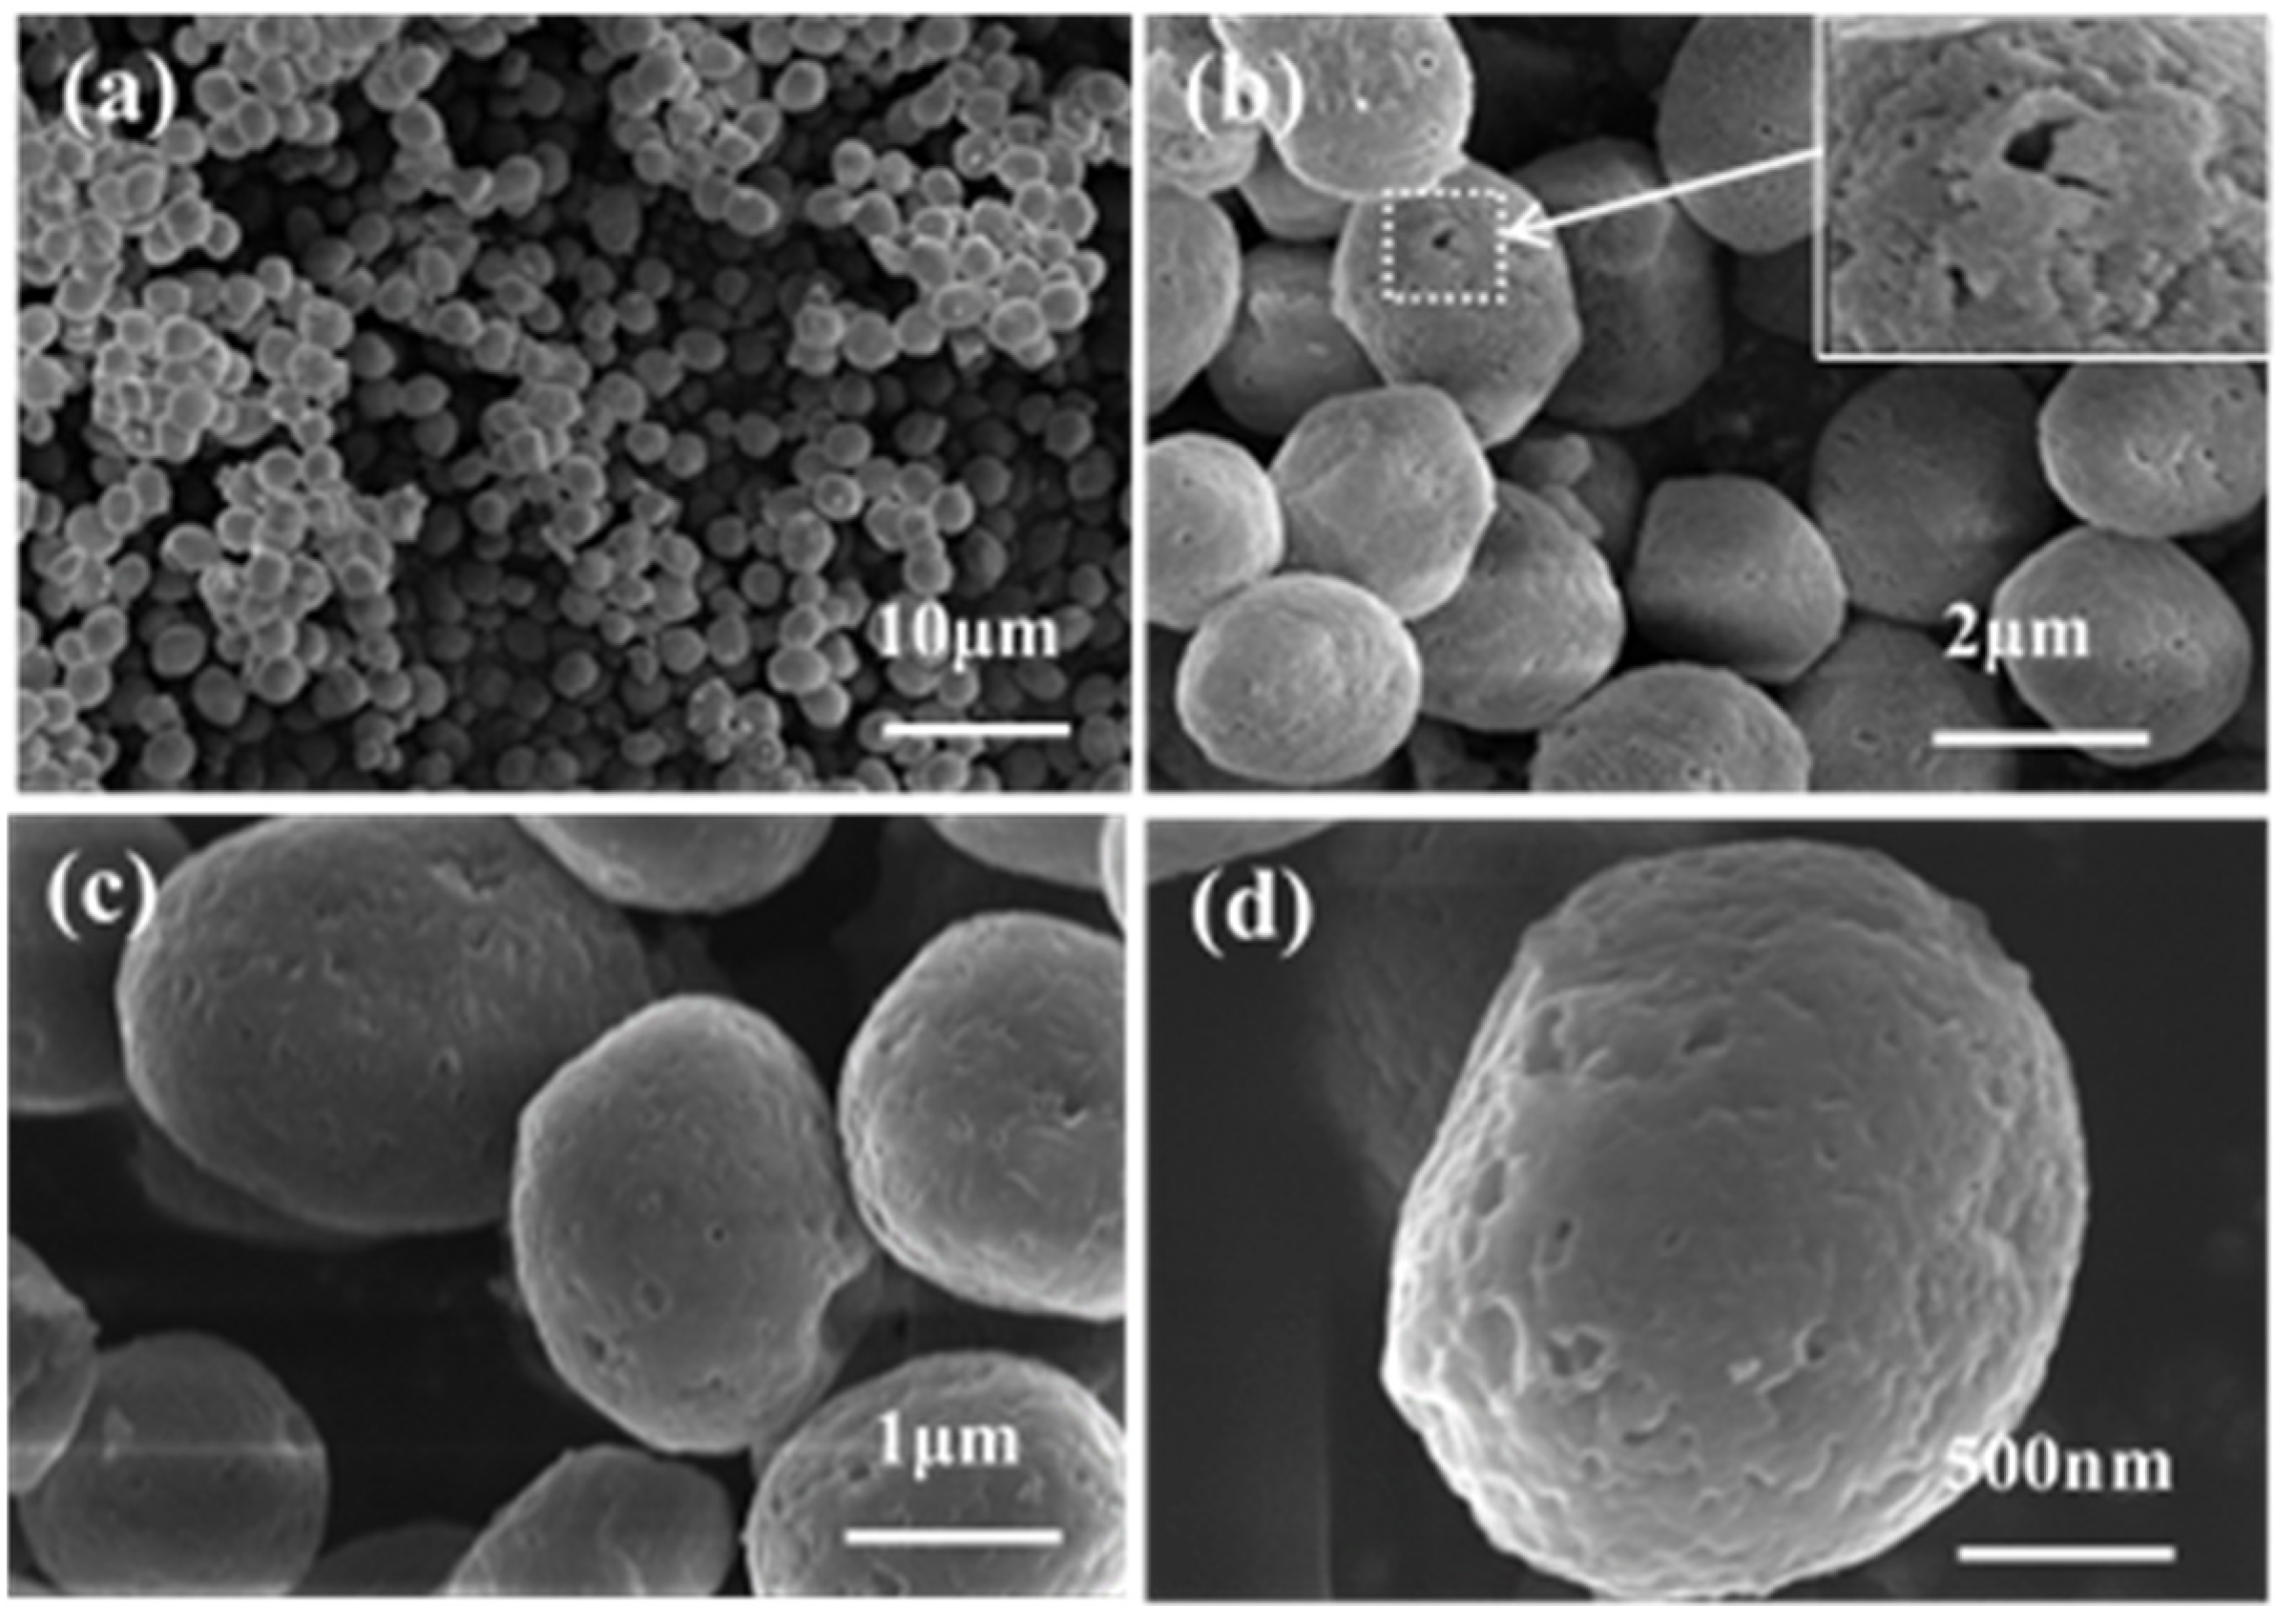
2.1. SEM

Figure 1 shows the FE-SEM images of the prepared α-Fe2O3@PHCMs microsphere under different magnifications. We can see that the prepared α-Fe2O3@PHCMs microspheres inherit the ellipsoidal morphology of the original yeast [16]. It is also clearly seen that the oval-shaped α-Fe2O3@PHCMs microspheres exhibited a good dispersity and are of relatively uniform size distribution, approximately 2.0 ± 0.2 μm in length and 1.8 ± 0.2 μm in width. From the inset image in Figure 1b, we can see that the α-Fe2O3@PHCMs spheres exhibited integral porous hollow structure. This might be due to the hydrothermal treatment of yeast with the addition of acetone. Figure 1d illustrates the FE-SEM image with a higher magnification, which verifies the porous structure and smooth surface of α-Fe2O3@PHCMs microspheres.

2.2. Adsorption Studies

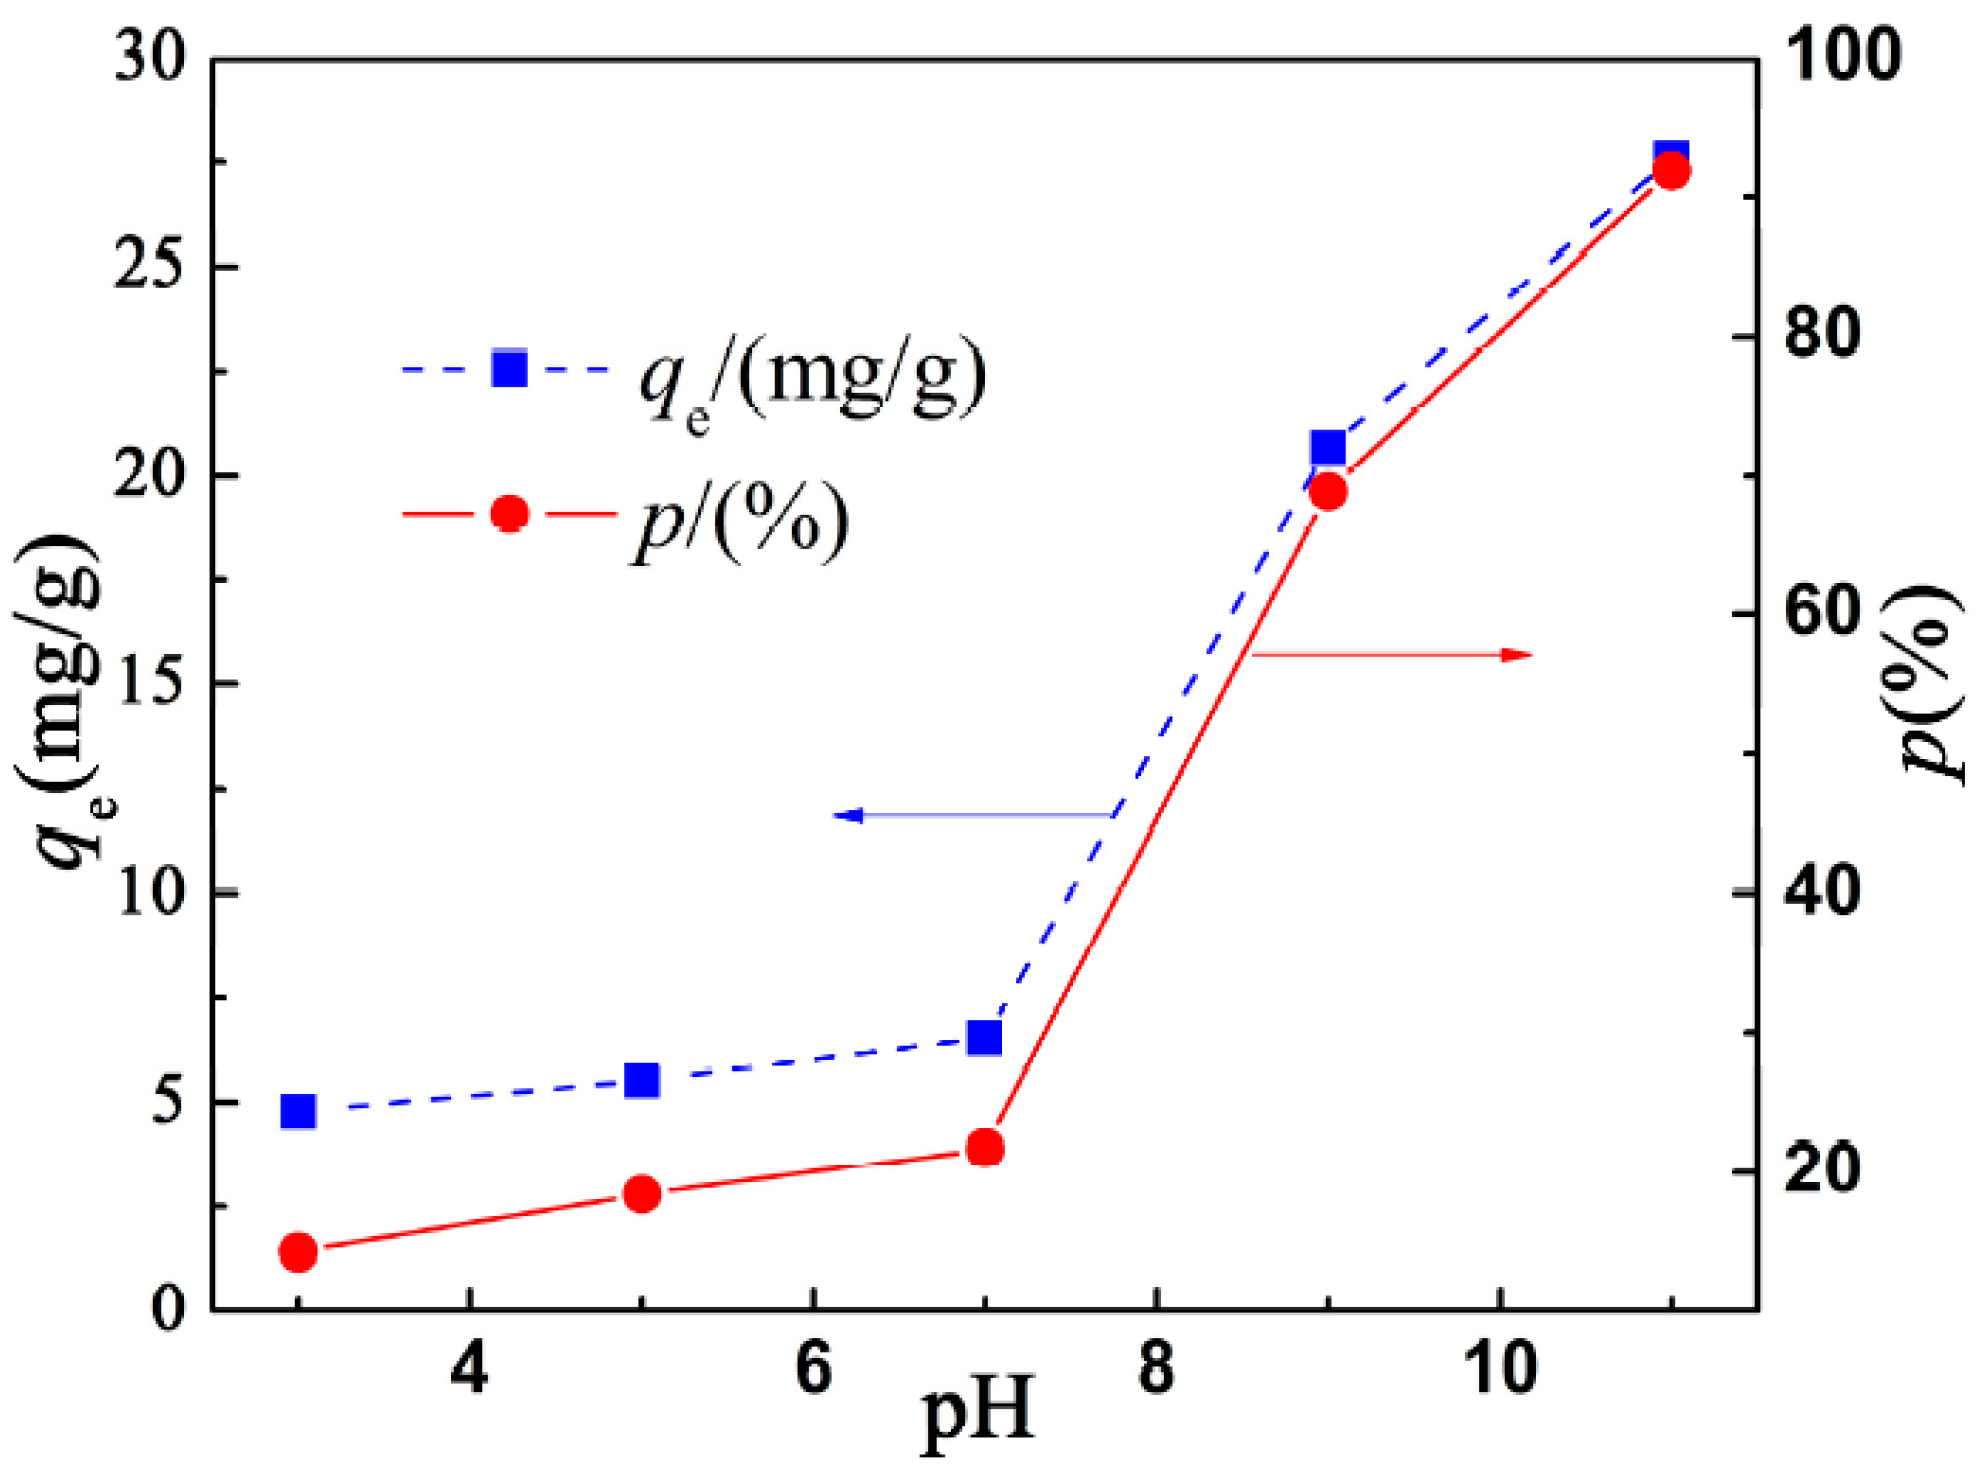
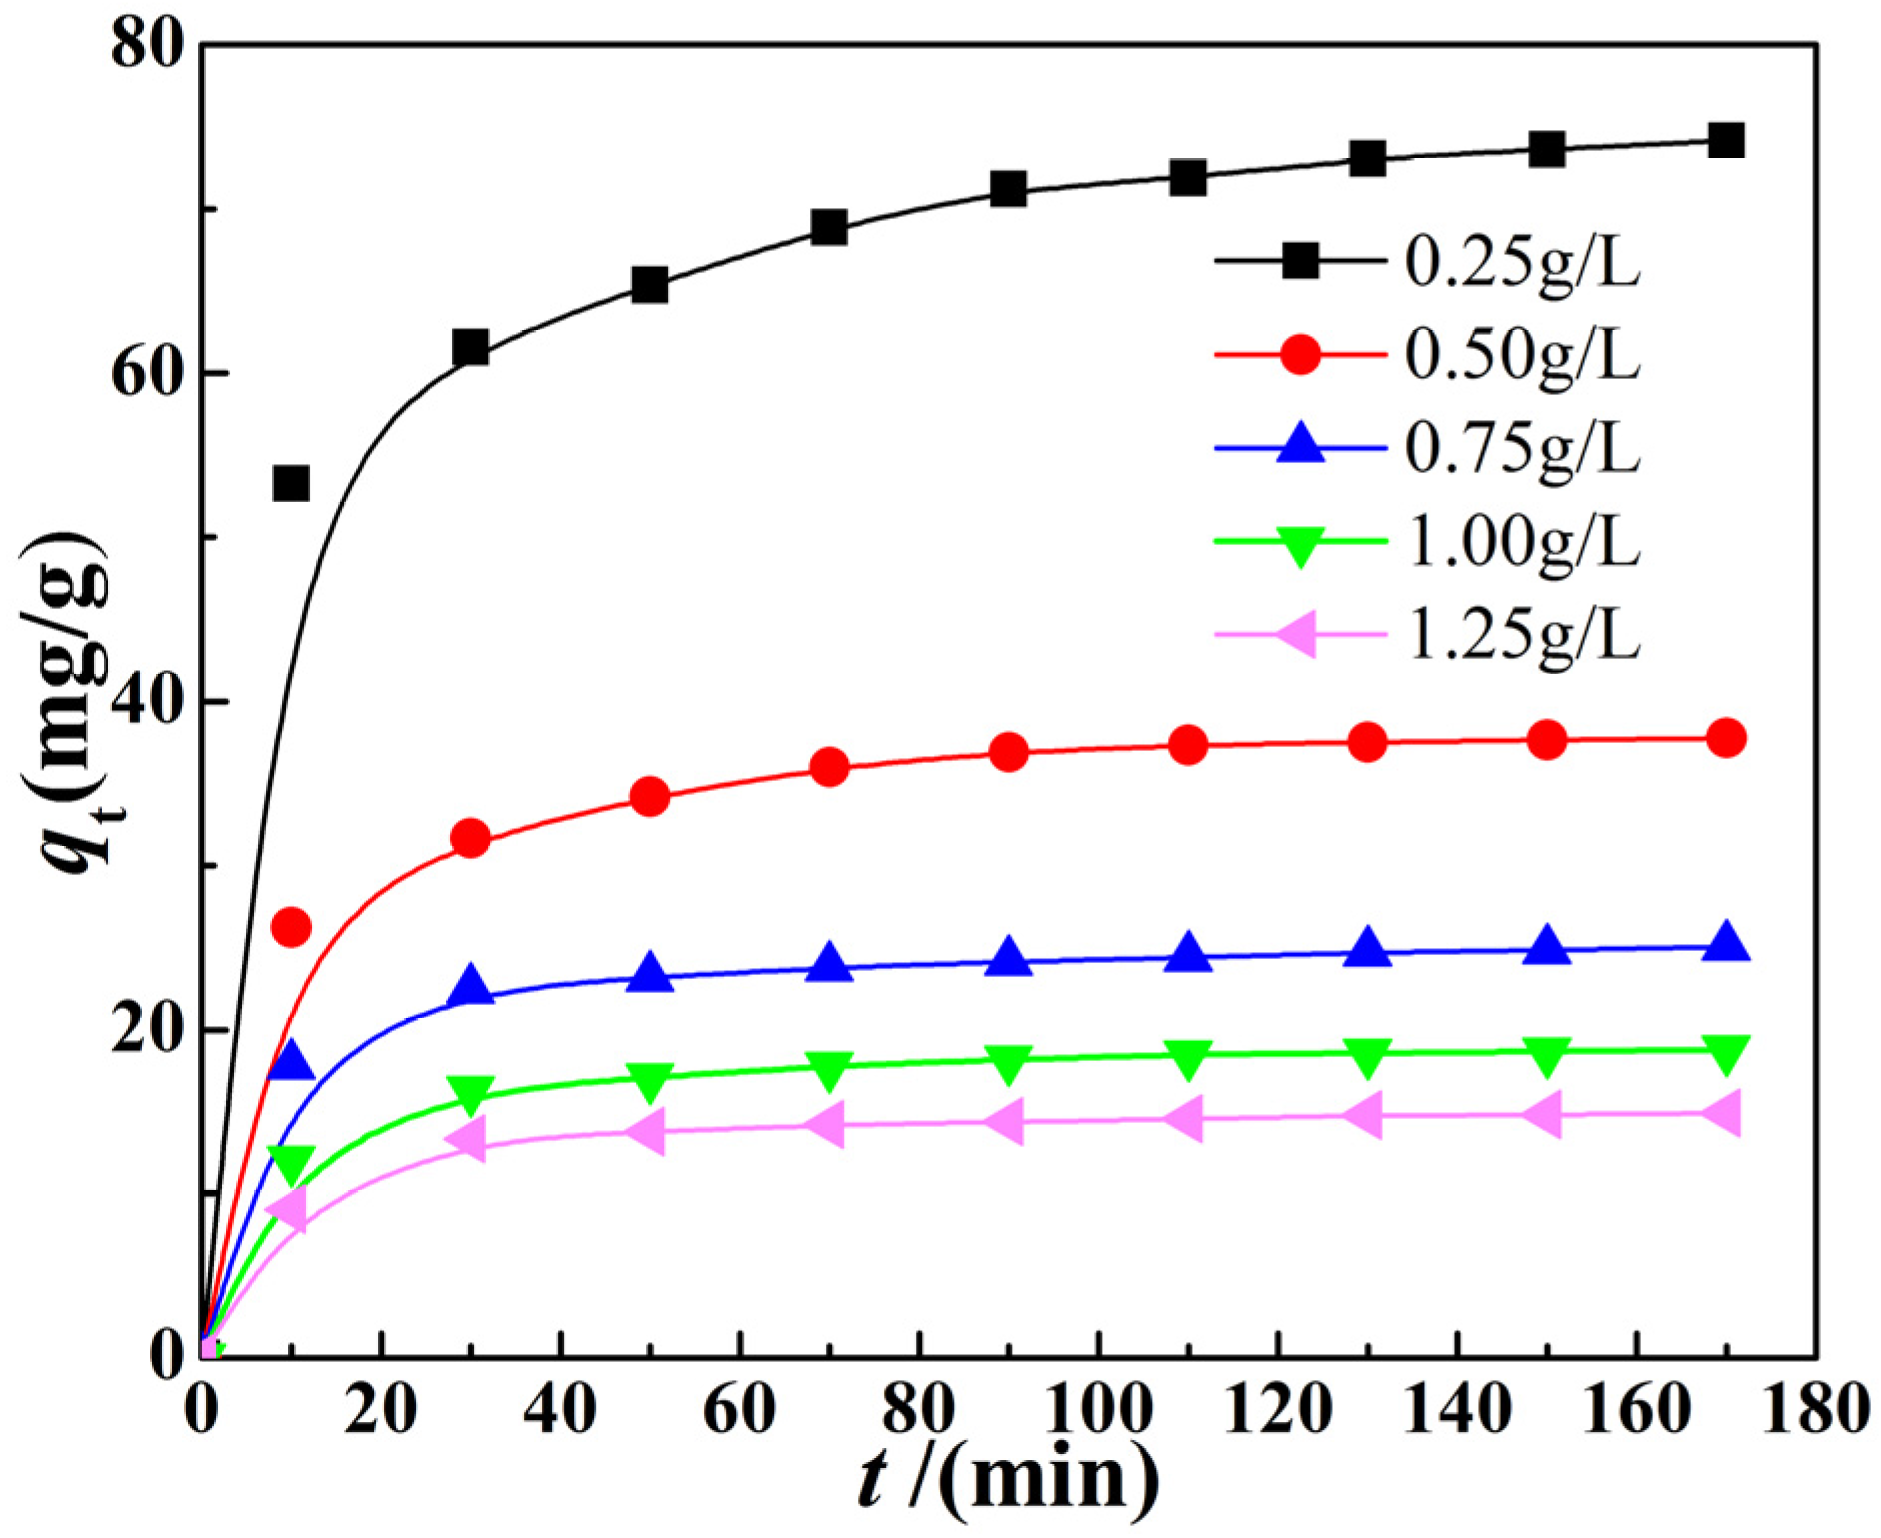
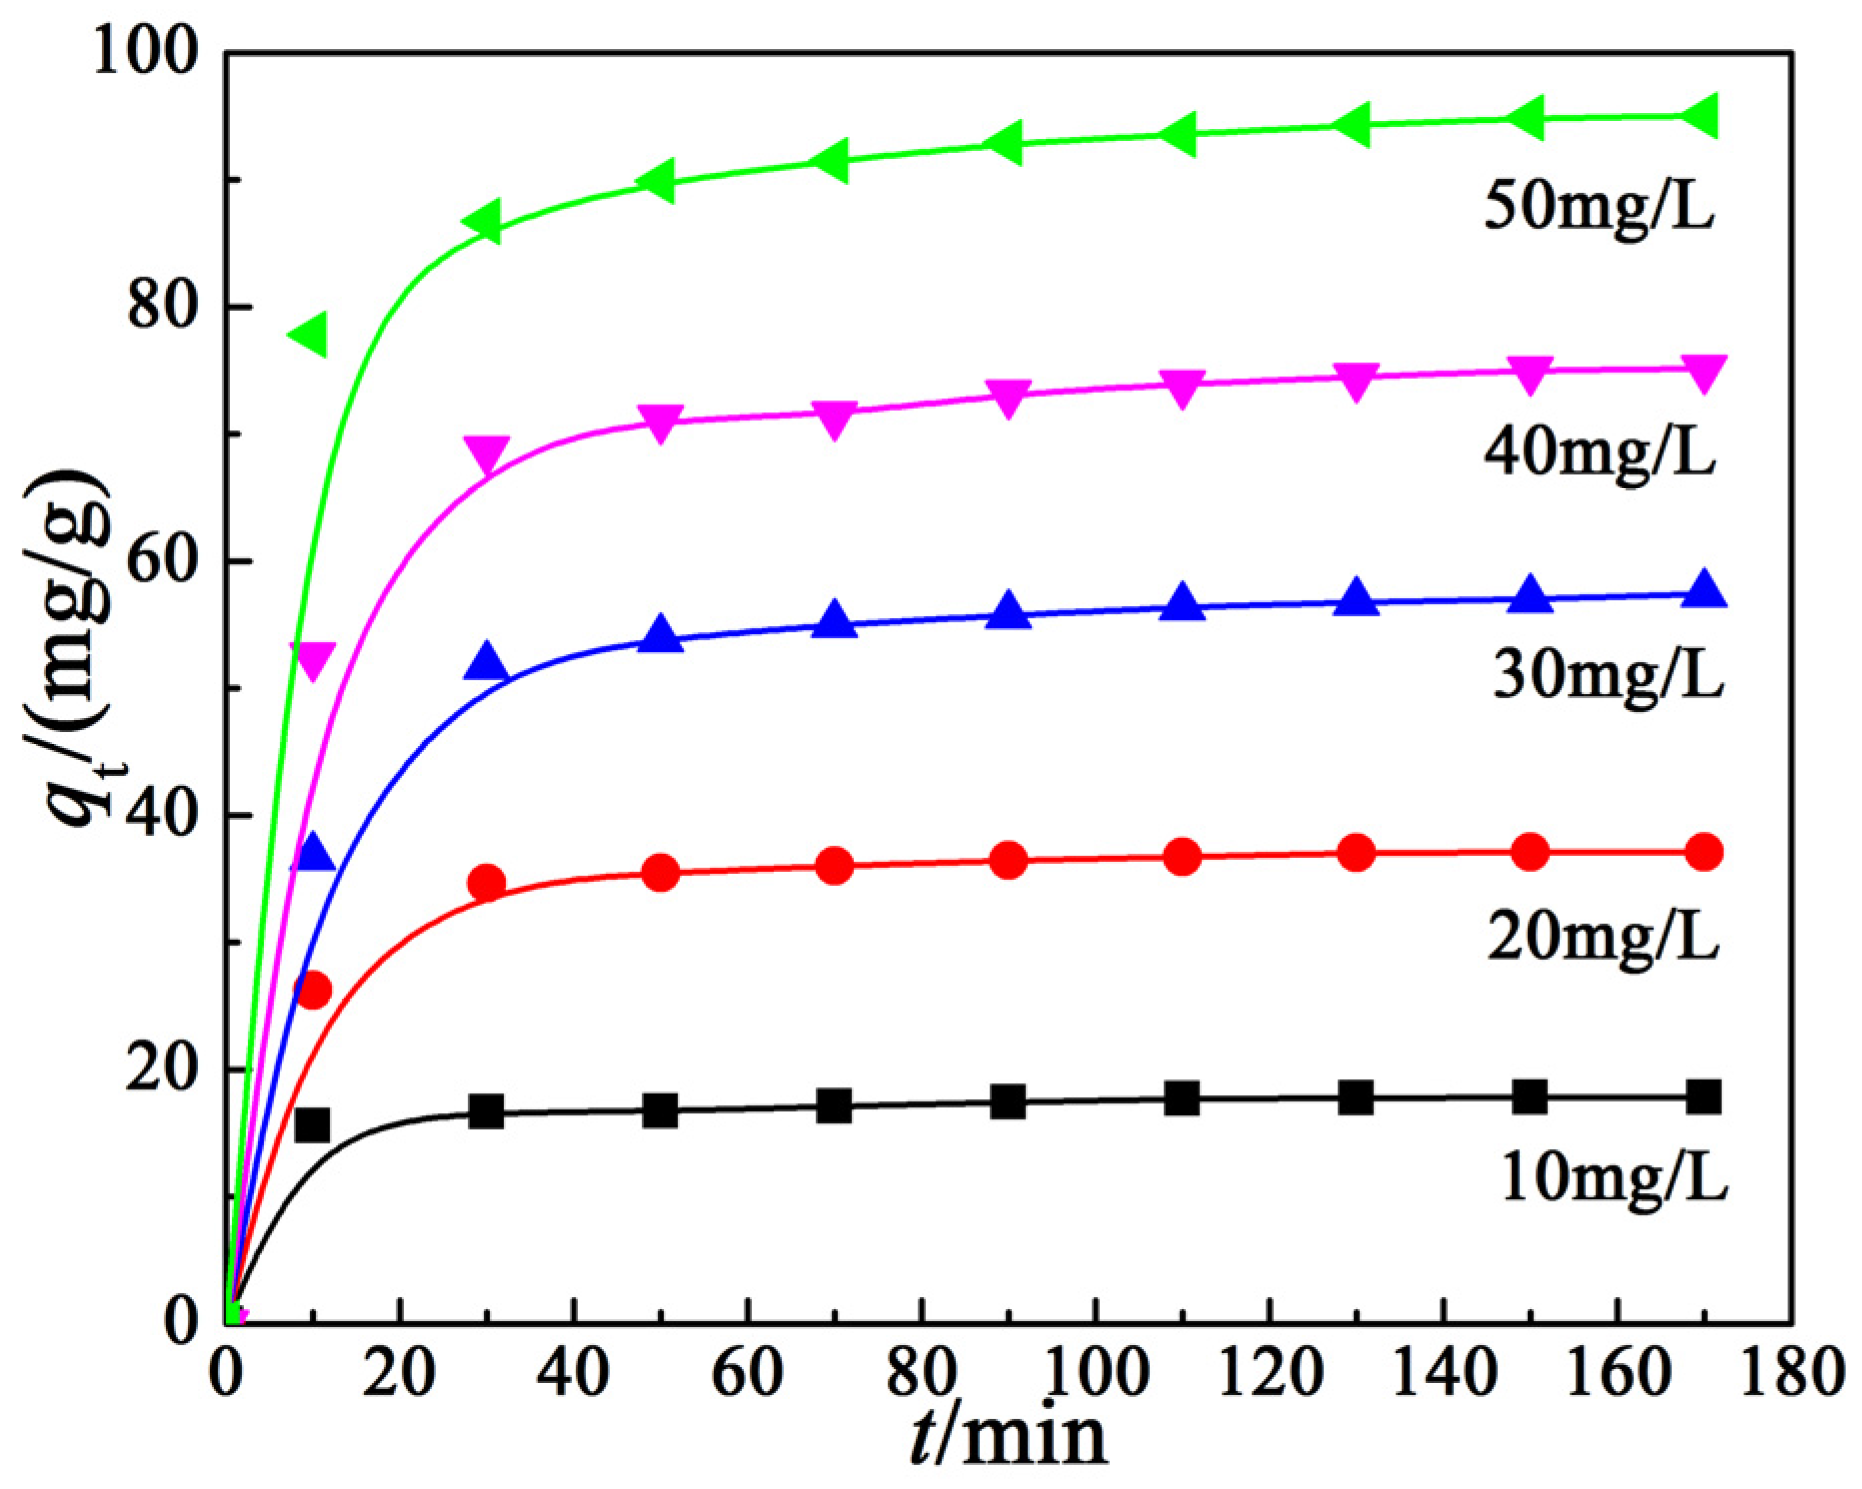
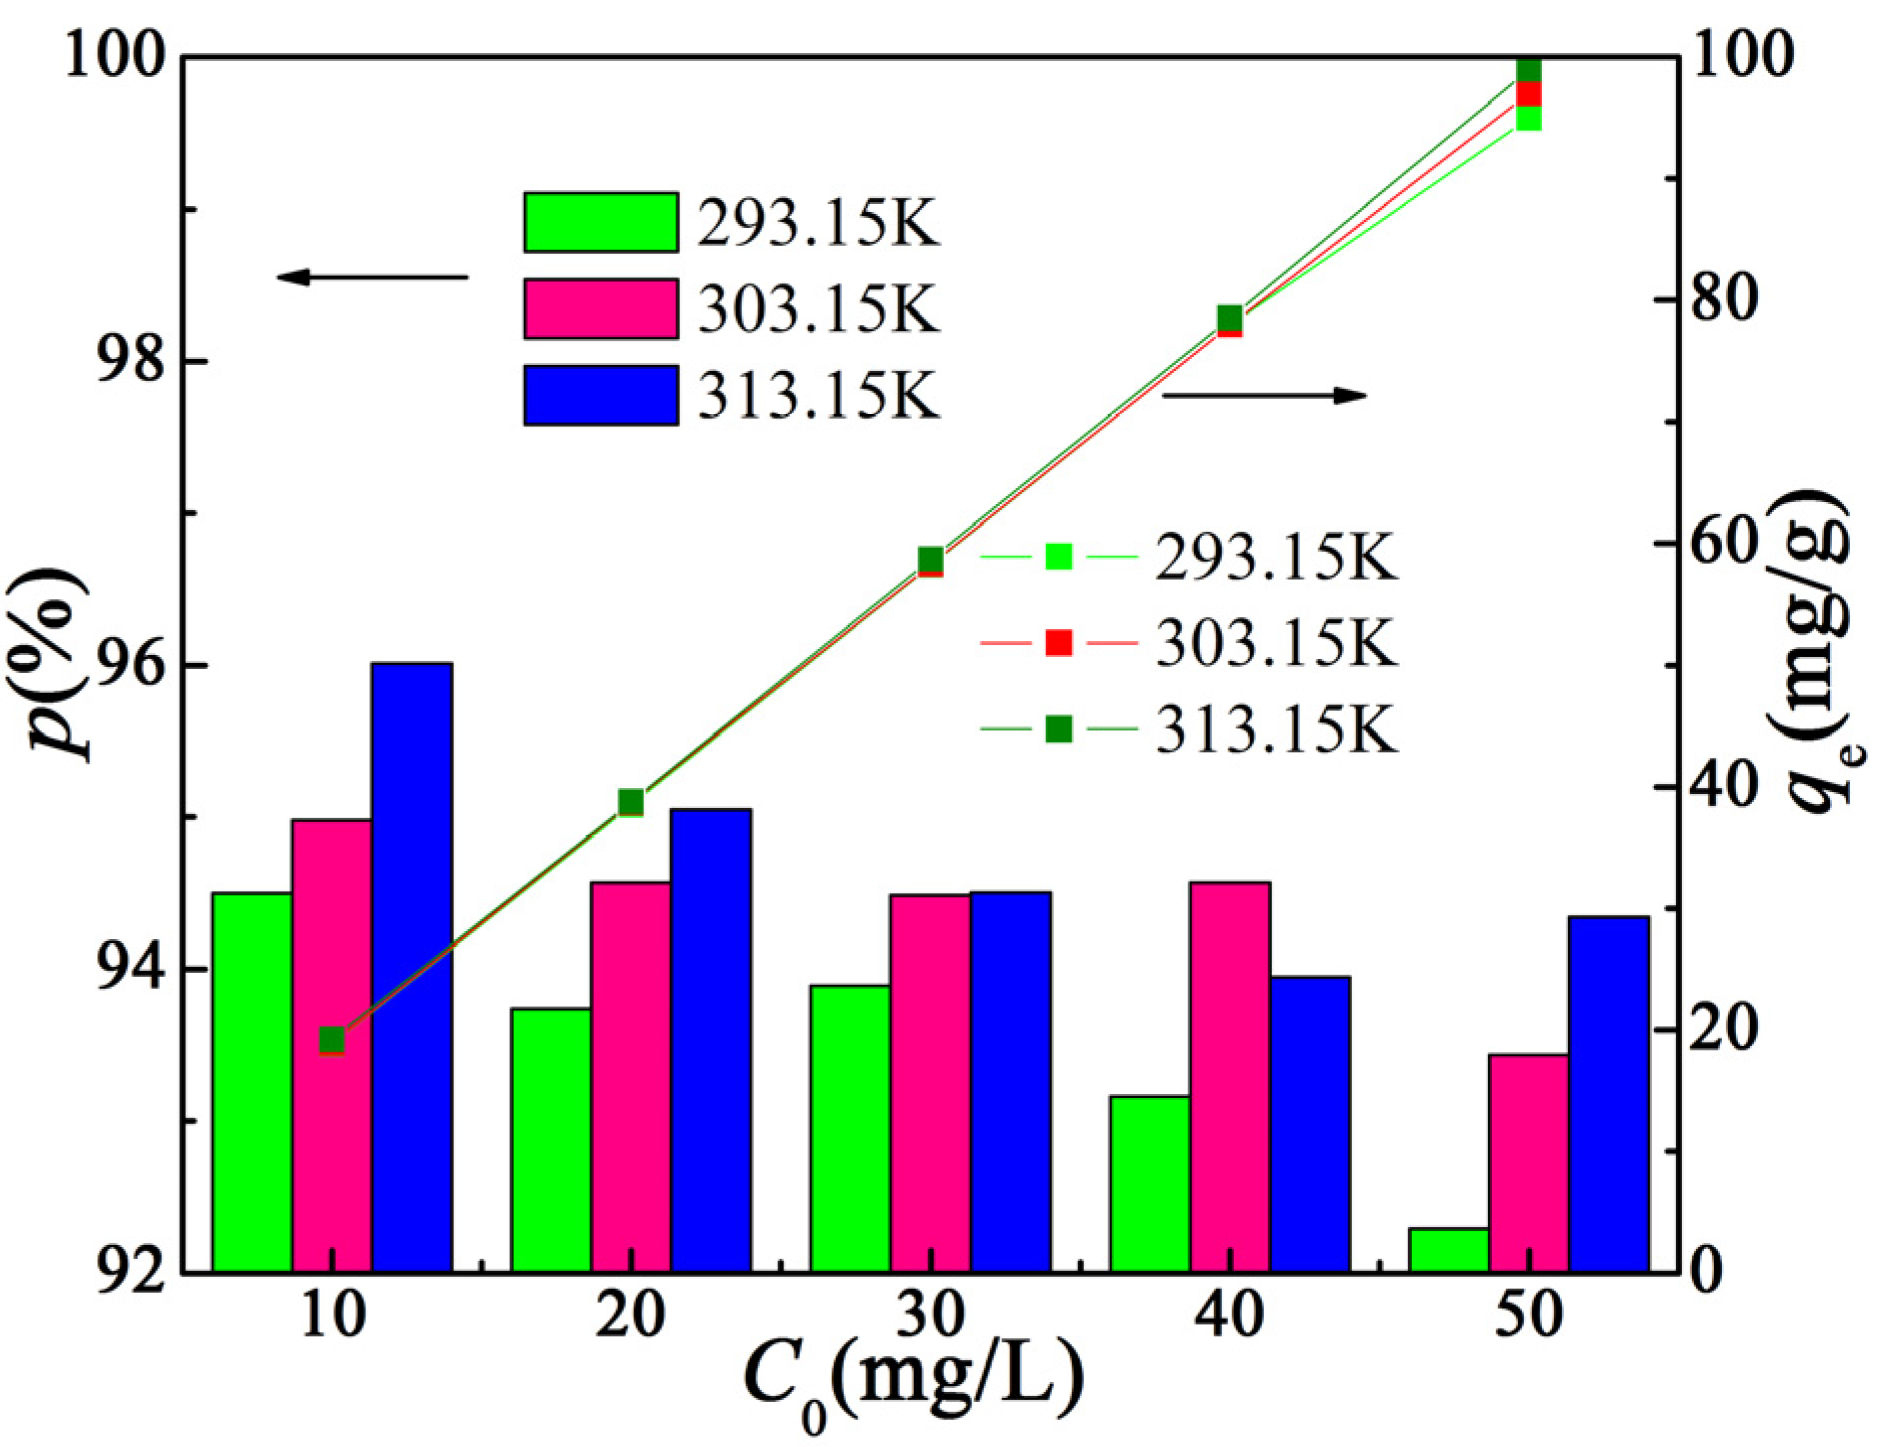
2.2.1. Influence of Adsorption Parameters

A number of factors may play important roles in the dye adsorption process, such as pH values of solutions, adsorbent doses, initial dye concentration and the temperatures. The initial pH of a dye solution exerts profound influence in batch adsorption, presumably as it not only governs the surface property of the adsorbent, but also affects the ionization process of the dye molecule in the aqueous medium greatly [15,17]. Besides, the magnitude of the electrostatic charges, offered by ionized dye molecules, is also determined by the pH of the solution [18]. Thus, the influence of pH on the removal of MV dye by α-Fe2O3@PHCMs microspheres was studied to gain further insight into the adsorption process. The effect of pH was checked at ambient temperature over the pH range 3–11 with 15 mg∙L−1 feed concentration of MV dye and adsorbent dosage of 0.5 g/L. pH values were adjusted by adding 0.1 mol∙L−1 HNO3 and 0.1 mol∙L−1 NaOH solutions.
Figure 2 gives the adsorption capacity and removal efficiency of MV within pH range 3.0–11.0. The uptake of MV increased with the increase in the solution pH. The maximum absorption capacity and percentage removal of MV was observed at pH 11.0 as 27.6 mg/g and 91.9%, respectively. The poor adsorption of MV at low pH values can be explained from the perspective of electrostatic force. MV is a cationic dye and carries positive charges in the dye aqueous solution. Thus, the electrostatic repulsion between positively charged MV ions and positively charged α-Fe2O3@PHCMs sites causes the decrease in the dye adsorption. Moreover, the presence of excess H+ ions competed with cationic MV dyes for the active sites on the adsorbent surface and thus further inhibited the adsorption of dye. As the pH values increased, the α-Fe2O3@PHCMs surface was more negatively charged and the functional groups such as amide (from yeast moiety and dithizone), carboxylic and other hydroxyl groups would be more deprotonated, leading to the enhanced attraction of MV ions. Similar results of the effect of pH were also reported by other researchers [4,19,20,21,22].
Adsorbent dose is also an important parameter that strongly influences the adsorption process by affecting adsorption capacity of the adsorbent. Different dosages of α-Fe2O3@PHCMs were investigated in this study and the results are displayed in Figure 3. In Figure 3, it was noted that the equilibrium absorption capacity decreased with the increasing amount of adsorbent doses. This phenomenon may be explained as a result of the particulate interaction such as partial overlapping or aggregation of adsorption sites, causing a decrease in effective adsorbent surface area available to dye and an increase in diffusion path length [23]. Thus, with α-Fe2O3@PHCMs dose increasing, the amount of dye adsorbed onto unit weight of α-Fe2O3@PHCMs reduced, leading to a decrease in qe (mg/g) value. These are in agreement with the result reported by Senthil et al. [24].
Initial dye concentration and contact time is another controlling parameter that strongly influences the adsorption process. Figure 4 depicts the equilibrium absorption capacity versus the contact time for varying initial dye concentrations (10–50 mg/L). The experiments were carried out with fixed adsorbent dosage (0.5 g/L), along with stable temperature, at pH 11 and shaken until equilibrium reached.
From Figure 4, it was evident that adsorption capacity increased with the extension of contact time and finally reached equilibrium in a certain amount of time. The adsorption capacity for α-Fe2O3@PHCMs increased from 17.8 to 95.1 mg/g as the MV initial concentration increased from 10 to 50 mg/L. Such trend might be explained from the perspective of concentration gradient, which acts as the driving force to overcome the mass transfer resistance of the MV between the aqueous and solid phase [25]. Under the experimental conditions, the higher initial concentration, the higher driving force for mass transfer of dye molecules may be achieved, leading to an increasing adsorption capacity until saturated. Moreover, it was also illustrated in Figure 4 that the adsorption of MV showed two-stage behavior: A very rapid initial adsorption over a few minutes (30 min), followed by a longer period of much slower uptake. At the initial stage, a large number of active sites on the adsorbent and the strong electrostatic attraction between the highly negative charged surface of the adsorbent and cationic MV molecules enhanced the adsorption [26], while the following lower adsorption may be due to the repulsive forces between the MV molecules adsorbed on the adsorbent and those in the bulk phase. A similar phenomenon was observed in the adsorption of pararosaniline with grapheme-Fe3O4 nanocomposite [27].
Temperature has been recognized as a key factor influencing the adsorption process. In the present study, the effect of temperature was carried out from 293.15 to 313.15 K and the results are shown in Figure 5. It is clearly indicated that the adsorption capacity was slightly influenced by the temperature under the same initial concentration of dye, and the qe (mg/g) increased with temperature increasing, even though the augment is not obvious. Thus, the adsorption of MV is an endothermic process in nature. In Figure 5, the histogram means the change of percent removal efficiency (p/%) with temperature. By and large, a slight increase of the value of p/% can be observed with the increase of temperature at the same initial concentration, and the removal rate seems to decrease with increasing concentration under the same temperature. Generally, the viscosity of the solution decreases as the temperature rising, leading to the increasing rate of intraparticle and interparticles diffusion [28]. Moreover, an increase in the mobility of the dye molecules facilitates the dye molecules to move to the adsorbent surface, which causes an increase in the removal efficiency as the solution temperature increased. Similar observations are reported by Chowdhury et al. on the adsorption of malachite green onto chemically modified rice husk [29].

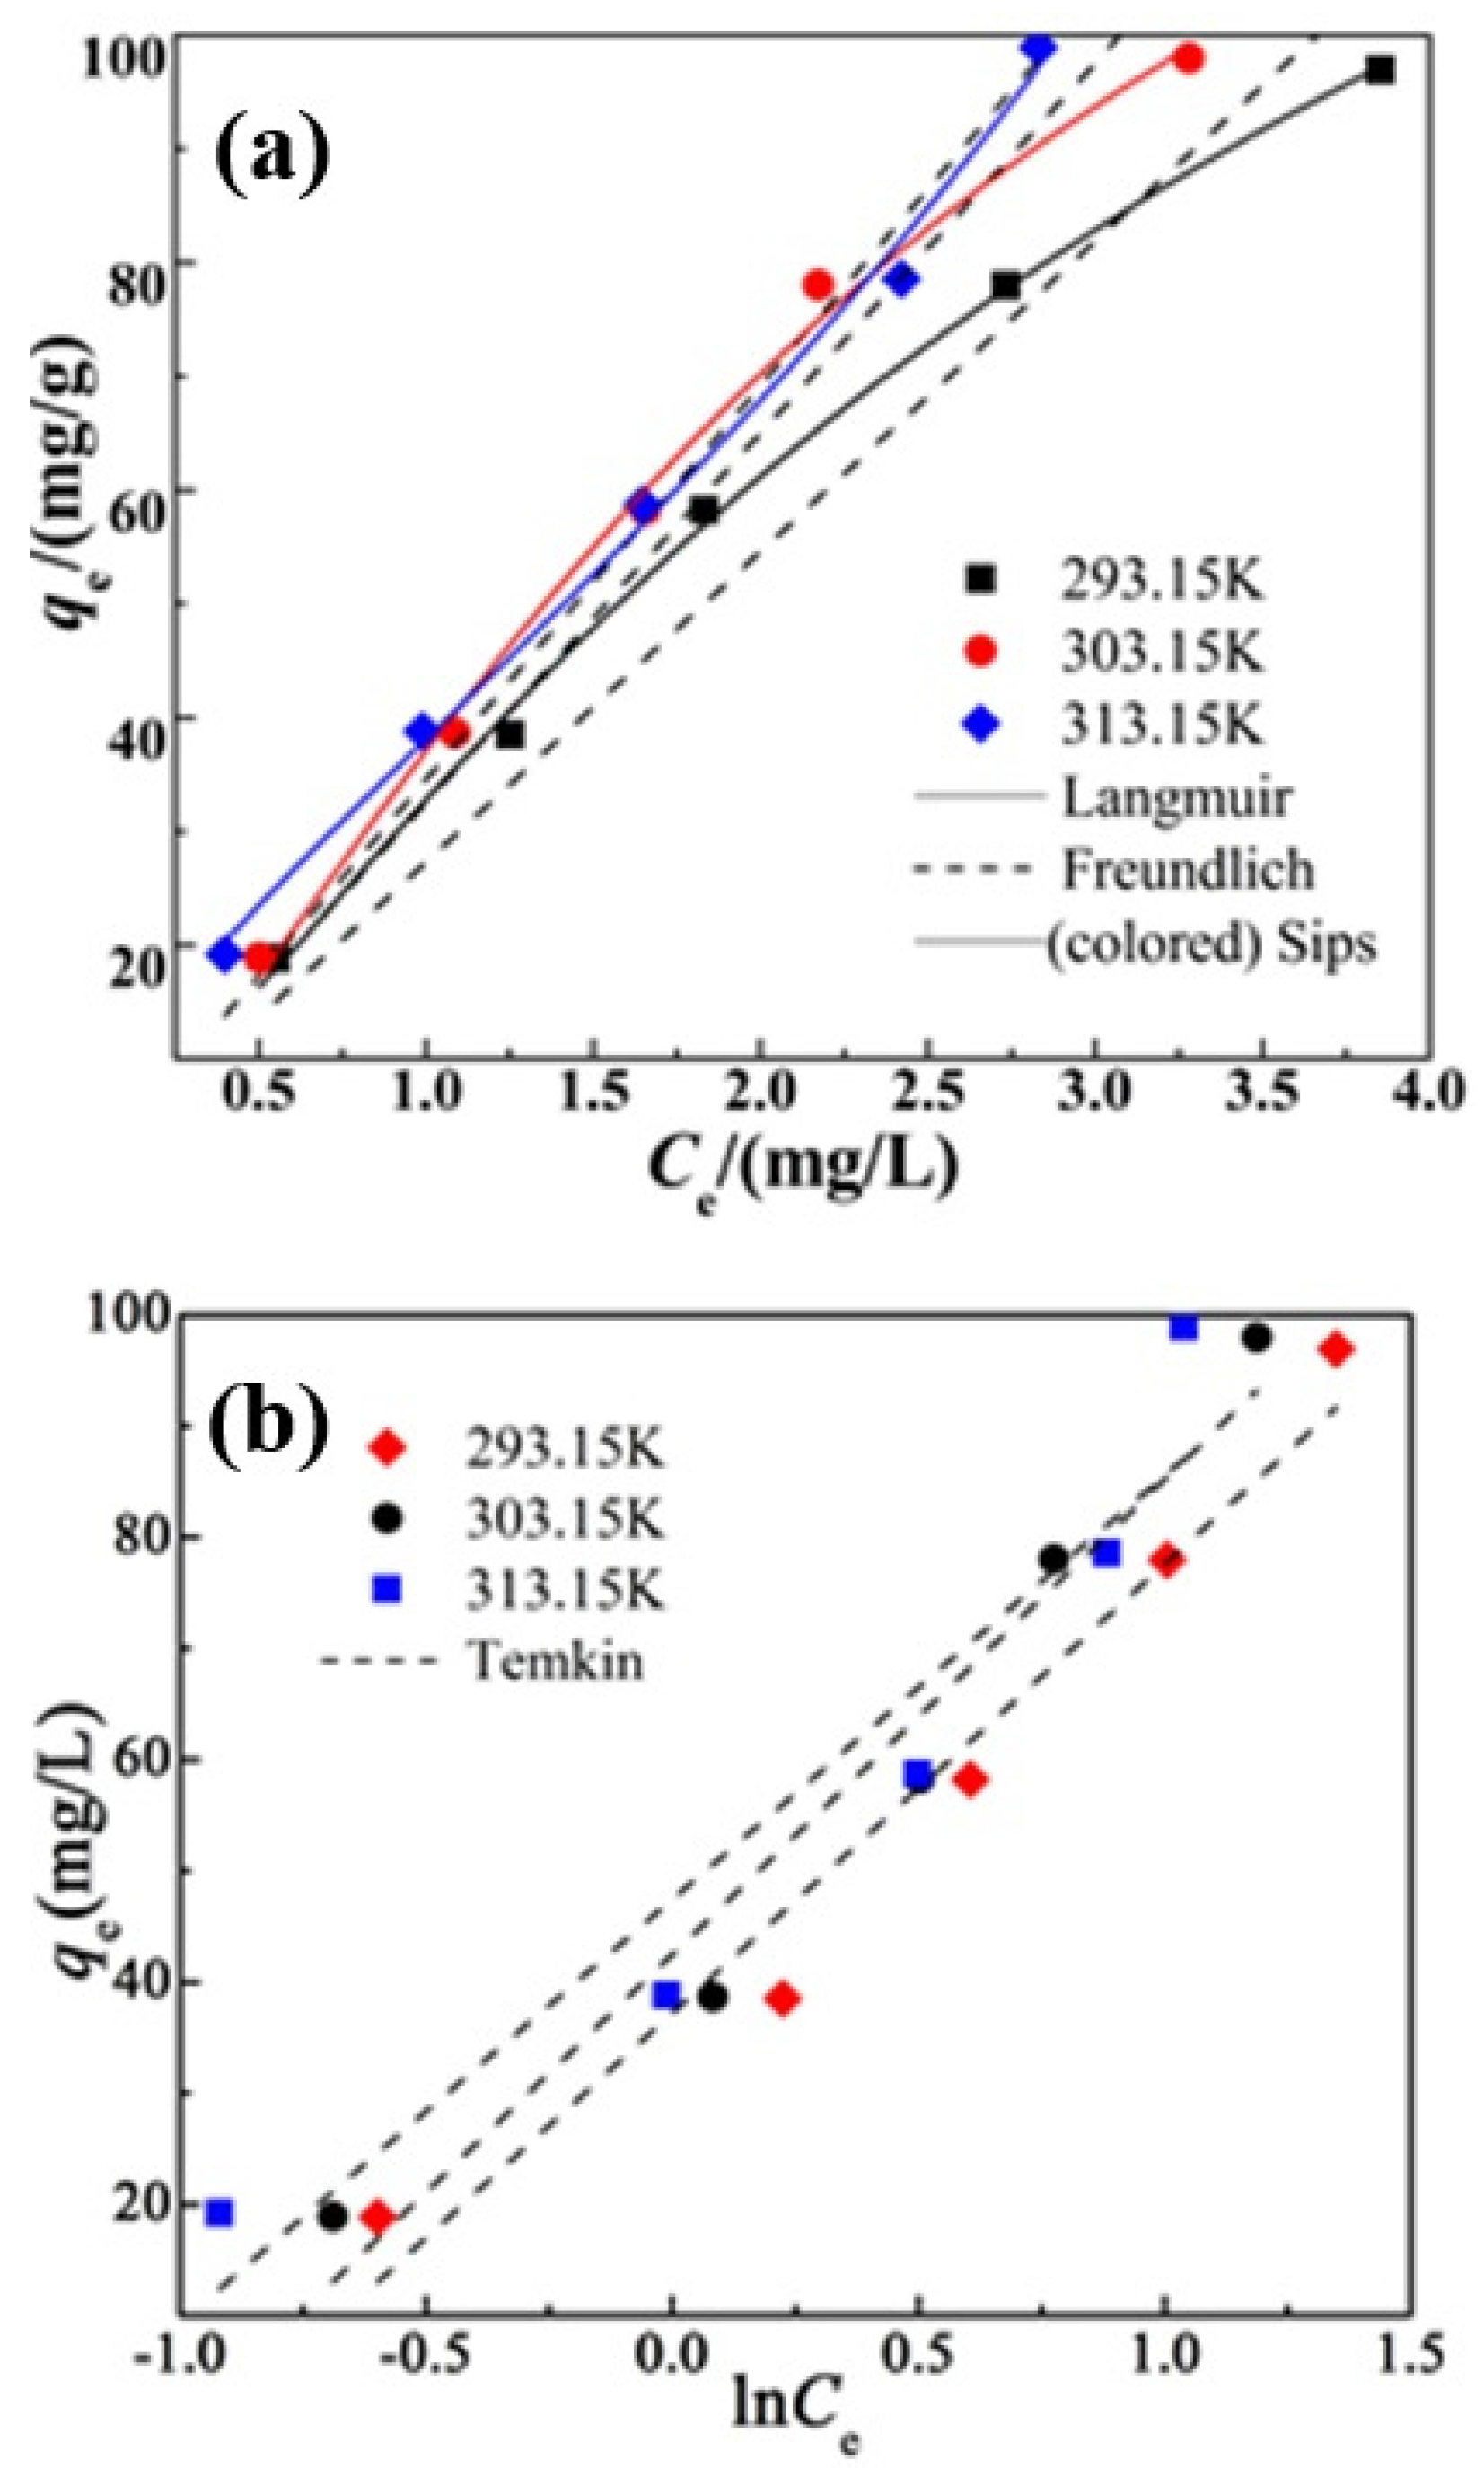
2.2.2. Adsorption Isotherm

To interpret the adsorption mechanism and heterogeneity of the adsorbent surface, it is advisable and relevant to optimize the design of an adsorption system. In this study, two-parameter Langmuir, Freundlich, and Temkin models as well as three-parameter Sips isotherm model were used to fit the equilibrium data obtained from the study of MV adsorption onto α-Fe2O3@PHCMs.
Langmuir isotherm is a theoretical model and is valid for monolayer adsorption [30]. The nonlinear Langmuir equation is represented as follows:
qe = qmax·b·Ce/(1 + b·Ce)
where, qe (mg/g) is the amount of MV adsorbed per unit mass of the α-Fe2O3@PHCMs microspheres at equilibrium (mg/g), Ce (mg/L) is the equilibrium concentration of dye left out in the supernatant, qmax (mg/g) is the theoretical monolayer adsorption capacity of MV and b (L/mg) is the Langmuir constant depicting the free energy and affinity of adsorption.
Besides, to predict the favorability of an adsorption system, the essential characteristic of the Langmuir isotherm can be expressed according to a dimensionless constant (RL), which is referred to as the equilibrium parameter or separation factor, defined as follows [31]:
RL = 1/(1 + b·C0,m)
where b (L/mg) and C0,m (mg/L) represent the Langmuir constant and the highest initial concentration, respectively. The value of RL indicates the isotherm type: unfavorable (RL > 1), linear (RL = 1), favorable (0 < RL < 1) or irreversible (RL = 0). The plot of specific adsorption (qe) against the equilibrium concentration (Ce) (Figure 6) shows that the adsorption compliances the Langmuir model. The value of RL in the present investigation was found to be between 0 and 1 confirming that the adsorption of MV is favorable under the present experimental conditions. Furthermore, the maximum adsorption capacity qmax increased with increasing temperature, while the opposite trend was presented by the Langmuir b, which further proved that the adsorption was advantageous at higher temperature.
The Freundlich model is an empirical theory based on adsorption on heterogeneous surface with nonuniform distribution of adsorption energy and affinities through a multilayer adsorption [32]. The nonlinear equation can be expressed as follows:
qe = Kf × Ce1/n
where Kf is a constant relating to the adsorption capacity and 1/n is an empirical parameter measuring the adsorption intensity ((mg⋅g−1 (L⋅mg−1)1/n)). In general, the magnitude of exponent 1/n gives an indication of how favorable the adsorption process is, and a value between 0.1 and 1.0 represents a favorable adsorption [26]. The values of Kf and 1/n are summarized in Table 1. From Table 1, the Freundlich constant Kf (mg/g) increased with increasing temperature, which also confirmed that the adsorption of MV onto α-Fe2O3@PHCMs was more favorable at higher temperatures. Similar results were also reported by Chen et al. [33]. Meanwhile, the 1/n, ranging from 0 to 1, represents favorable adsorption condition.
Temkin isotherm presumes that the heat of the adsorption of all the molecules in the layer decreases linearly with coverage taking into the effects of indirect adsorbent-adsorbate interaction, and adsorption process is characterized by a uniform distribution of binding energies, up to some maximum binding energy [34]. The linear form of Temkin isotherm is expressed as follows:
qe = B·lnA + B·lnCe
where B (=RT/b) is the Temkin constant representing the heat of adsorption, R the gas constant (8.314 J/mol·K) and T the absolute temperature (K). A (L/mg) is the equilibrium binding constant relating to maximum binding energy. The constants A and B can be determined by plotting qe versus lnCe (Figure 6) and the results are listed in Table 1.
The sips isotherm [35] has been used in the following form:
qe = (KS·Ceβs)/(1 + aS·Ceβs)
where KS is the Sips model isotherm constant (L/g), aS is the Sips model constant (L/mg), and βS is the Sips model exponent. It is a combined form of Langmuir and Freundlich expressions deduced for predicting heterogeneous adsorption systems. We can see from Table 1 that the exponent βS values were close to unity, which means that MV adsorption data obtained in this study are more of Langmuir form rather than that of Freundlich model. This was also confirmed in Figure 6a that the Sips fitted curves almost coincided with those of Langmuir model.
Here, on the basis of the correlation coefficient R2, all of the four well-known adsorption isotherms mentioned above were fitted to the experimental data for MV at different temperatures, while the Langmuir isotherm yielded the best fit, as indicated by the highest correlation coefficient (R2 > 0.98). This manifests that the adsorption of MV on α-Fe2O3@PHCMs takes place on homogeneous monolayer sites at the adsorbent surface. All sites are energetically equivalent saturation so that adsorption cannot no longer occur. In addition, the maximum monolayer adsorption capacity, qmax, still contains valuable information and has been widely used to compare the efficiency of the absorbent. Table 1 indicates that the as-synthesized α-Fe2O3@PHCMs composites have large adsorption capacities of 297.8, 344.9 and 539.8 mg g−1 for MV at temperature of 293.15, 303.15 and 313.15 K, respectively.
Table 2 tabulated a comparison of the maximum adsorption capacities (qmax) of a few adsorbents available in the literature for removal of MV from aqueous solutions. It is clearly shown that α-Fe2O3@PHCMs composite used in this work had a higher adsorption capacity, despite of its relatively small surface area (22.8 m2 g−1).

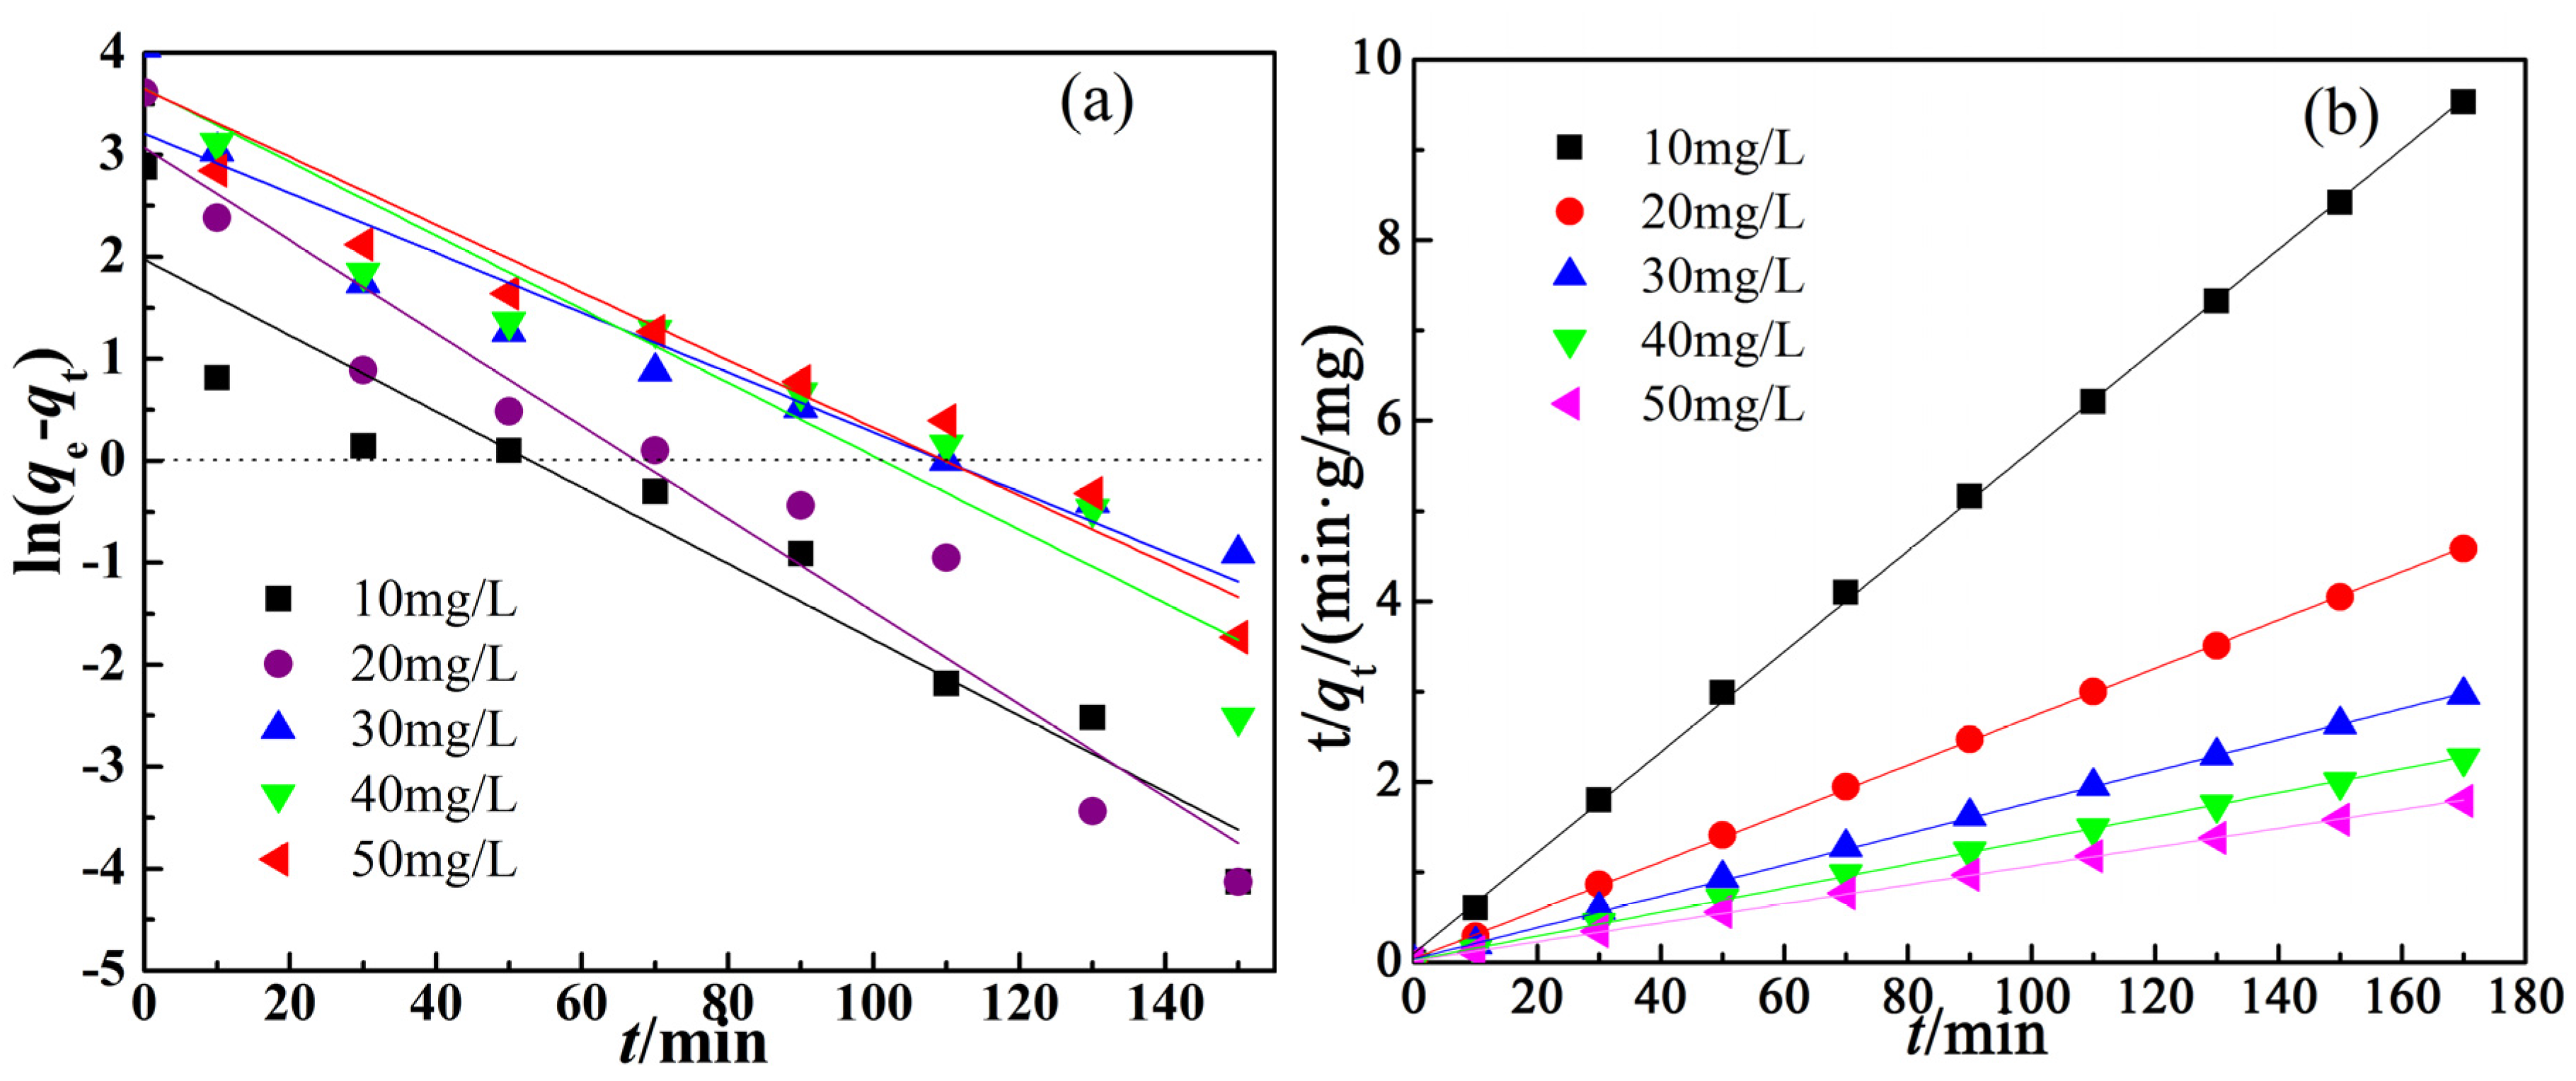
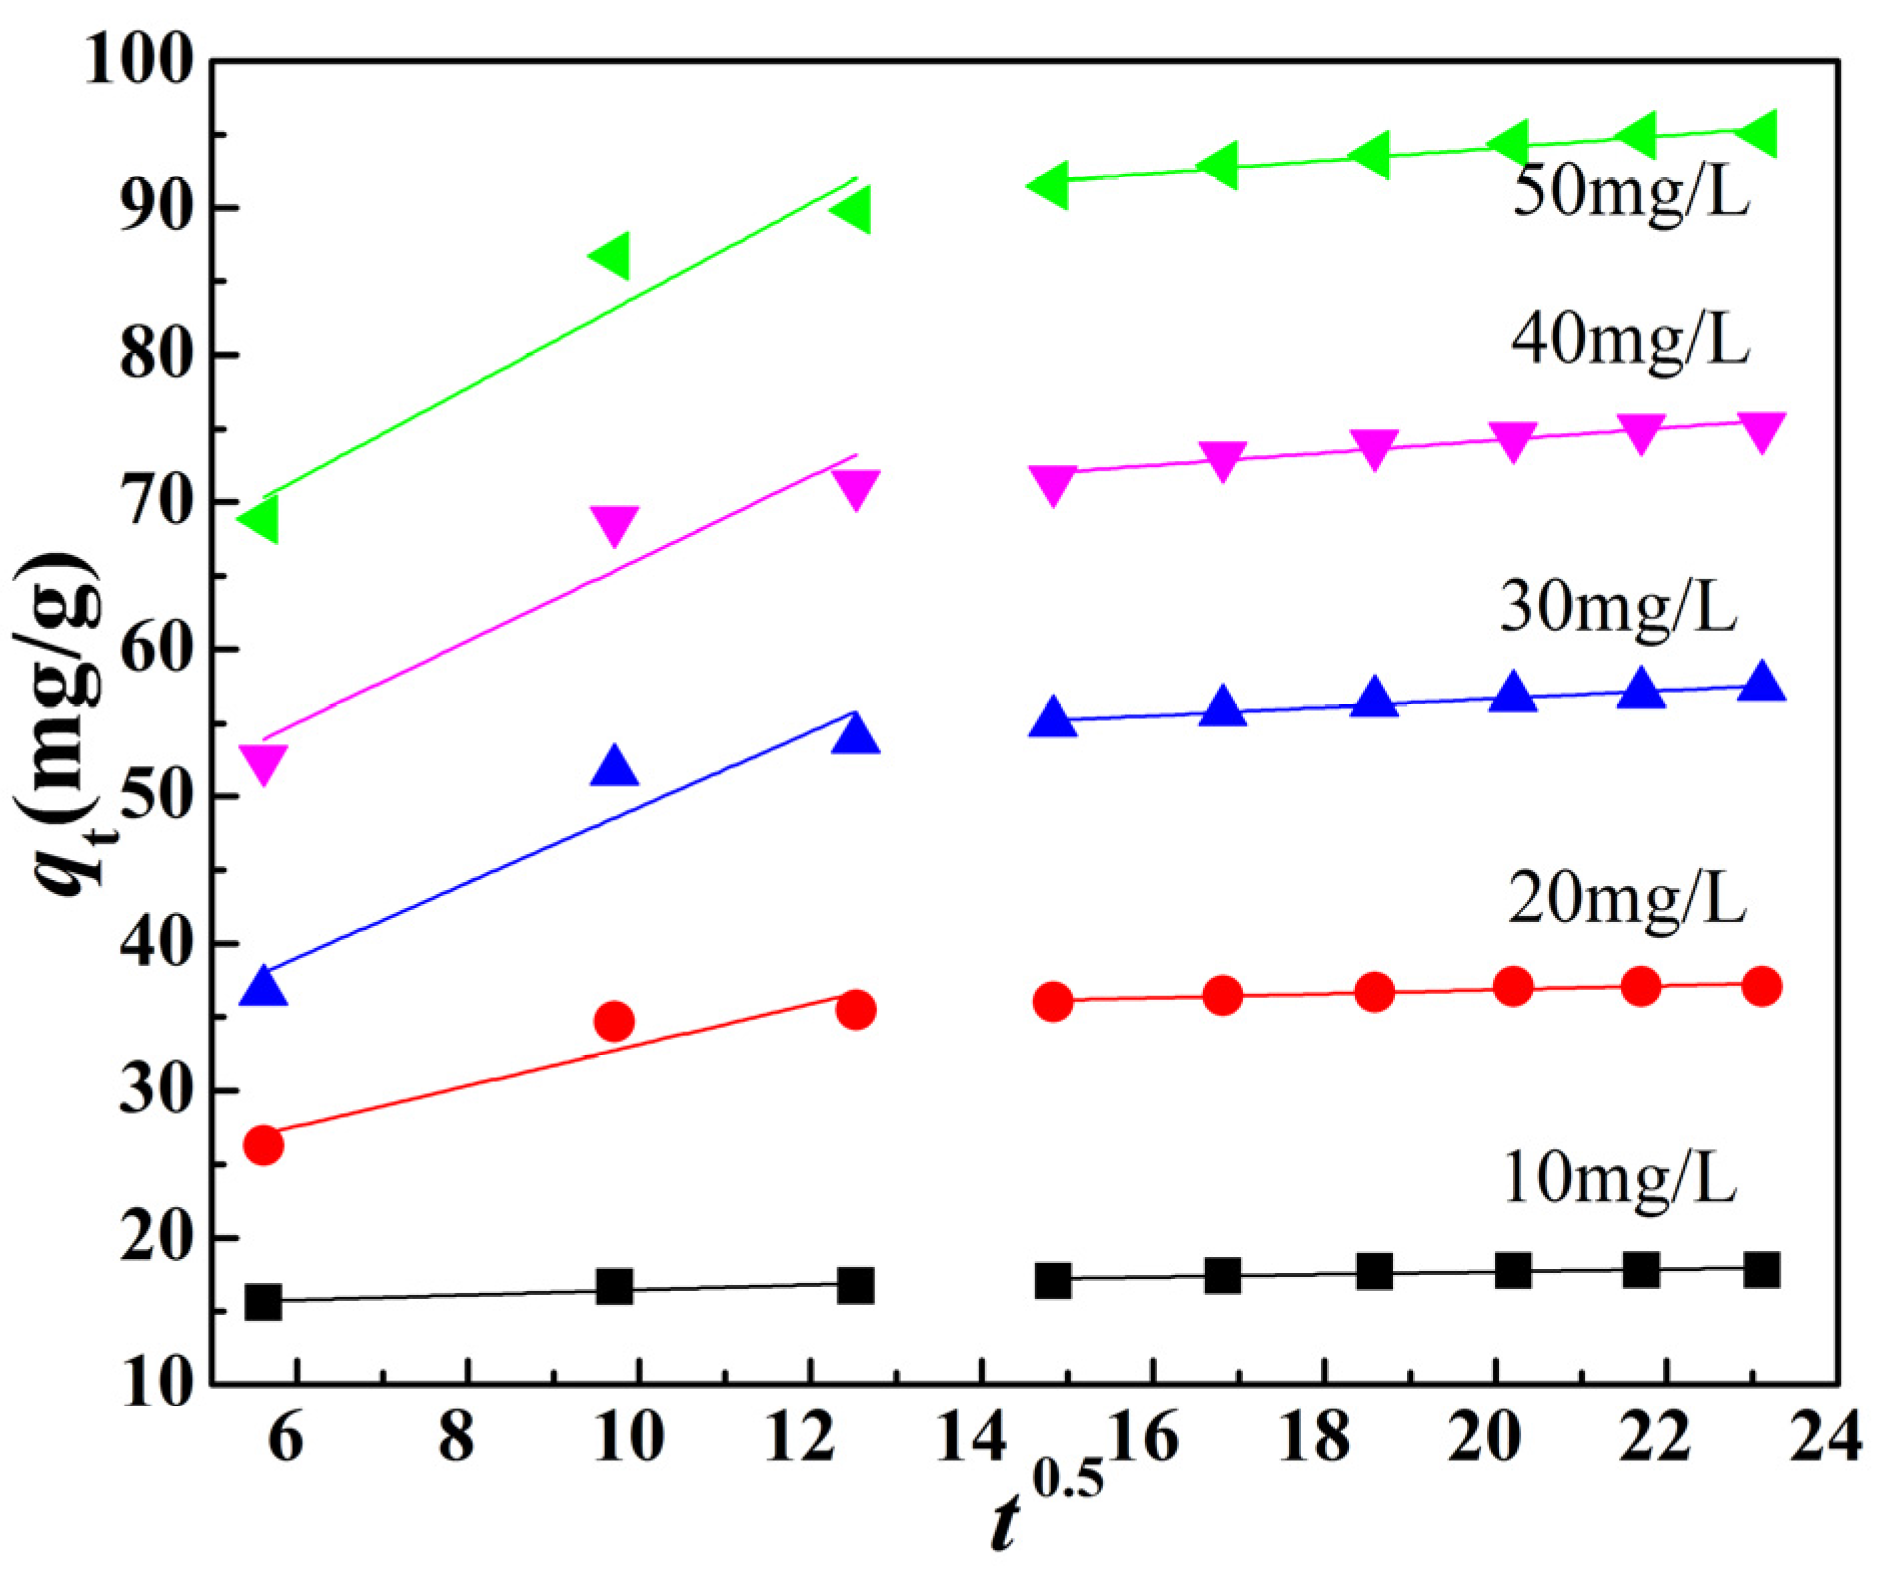
2.2.3. Adsorption Kinetics

In order to understand the mechanism and potential rate controlling steps involved in the process of adsorption, pseudo first-order and pseudo second order kinetic models were exploited to test the experimental data. The pseudo-first-order kinetic model can be represented by the following Lagergren rate equation [40]:
ln(qeqt) = lnqek1 × t
where qe and qt are the amounts of MV adsorbed (mg/g) at equilibrium and at contact time t (min), respectively, and k1 (min−1) represents the pseudo-first-order rate constant. The values of qe and k1 can be determined from the intercepts and slopes of the plots of log (qeqt) versus t, respectively (Figure 7a). The k1 values, qe values, and correlation coefficient values (R2) are summarized in Table 3.
The pseudo-second-order kinetic model can be expressed in the following form [41]:
t/qt = 1/(k2·qe2) + t/qe
where k2 (g/(mg min)) is the rate constant of pseudo-second-order adsorption model. The k2 and qe values were determined from the slopes and intercepts of the plot of t/qt against t (Figure 7b). The k2 values and the qe values are also presented in Table 3 along with the corresponding correlation coefficients.
The initial adsorption rate, h (mg/g·min), is given as follows:
H = k2 × qe2
With the help of Figure 7, drawn on the basis of Equations (6)–(8), the kinetic constants have been calculated and the results are shown in Table 3. As shown in Figure 7, the R2 values of the pseudo-second-order exceeded 0.999 for all MV concentrations, which were higher than those of pseudo-first-order, and the experimental qe values (qe,exp) were closer with the theoretical calculated values (qe,cal) compared to the pseudo-first-order model. This indicated the applicability of the pseudo-second-order kinetic model to describe the adsorption process of MV on the prepared α-Fe2O3@PHCMs. It suggested that the adsorption process was controlled by chemisorptions [42]. Moreover, the initial adsorption rate h (mg/g·min) increased with the increase of dye concentration, which is due to the existence of a large number of active sites on the adsorbent. Furthermore, the rate constant (k2) decreased with the increasing initial MV concentrations, which was attributed to the striking hindrance of higher concentrations of MV [43]. All the illustrations mentioned above showed that the adsorption of MV onto α-Fe2O3@PHCMs followed the pseudo-second-order kinetic model well, and the chemical sorption might be involved in the adsorption process, which was similar to the results reported by Li's group [15].
To further evaluate the controlling step of the adsorption process of MV onto α-Fe2O3@PHCMs, the kinetic results were further analyzed by the intra-particle diffusion model according to the method proposed by Weber and Morris [44]. The intra-particle diffusion equation is expressed as follows:
qt = Kid1/2 + C
where Kid is the intra-particle diffusion constant (mg/g·min1/2) and the constant (C) reflects the boundary layer effect which means that the larger the intercept, the greater the contribution of the surface sorption in the rate-controlling step. The value of Kid and C were calculated from the slope and intercept of plots of qt versus t0.5 (Figure 8) and were tabulated in Table 3. From Figure 8, it was clearly depicted that the whole adsorption process was separated by two segments, which means that more than one mode of sorption was involved in the MV adsorption. The first one presents the diffusion of dye molecules through the external surface of α-Fe2O3@PHCMs or boundary layer diffusion. The second stage was a gradual adsorption process, where intra-particle diffusion rate was rate controlling. Table 4 shows the calculated intra-particle diffusion parameters for the adsorption process. It can be seen from Figure 7 that there was a linear relationship over a period of time, but they did not pass through the origin. It suggested that intra-particle diffusion was present, but not the only rate controlling step, and that some other mechanism might be involved [33].

2.2.4. Adsorption Thermodynamics

The thermodynamic parameters such as standard Gibbs energy (ΔG0), standard enthalpy (ΔH0) and standard entropy (ΔS0) can be calculated from the van’t Hoff plot as following:
k0 = as/ae = vs/ve × qe/Ce
ΔG0 = −RT × lnK0
lnK0 = ΔS0/R − ΔH0/RT
where R (8.314 J/mol·K) denotes the universal gas constant, T (K) represents the absolute temperature, and K0 is the distribution coefficient. The values of K0 were calculated from the intercepts of the linear plots of ln(qe/Ce) versus qe and the values of ΔG0 were calculated from Equation (10). ΔH0 and ΔS0 can be obtained from the slope and intercept of the plot of lnK0 versus 1/T, and the results are shown in Table 5. All values of ΔG0 are negative, indicating that the adsorption of MV onto α-Fe2O3@PHCMs was spontaneous and thermodynamically favorable. Meanwhile, the value of ΔG0 became more negative with increasing temperature, which demonstrates that higher temperature is conducive to adsorption.
The values of ΔG0 were between −20 and 0 kJ/mol and the ΔH0 value (2.739 kJ/mol) was lower than 20 kJ/mol, both of which indicate that physisorption might dominate the MV adsorption process [45,46]. At the same time, the positive value of ΔH0 further suggests the endothermic nature of adsorption of MV while the positive value of ΔS0 (19.96 J/mol·K) reveals an increasing randomness at the solid-solution interface and the affinity of the α-Fe2O3@PHCMs for MV. Similar results have been previously published [12,15]. Above all, the adsorption of MV on α-Fe2O3@PHCMs was a spontaneous and endothermic process.

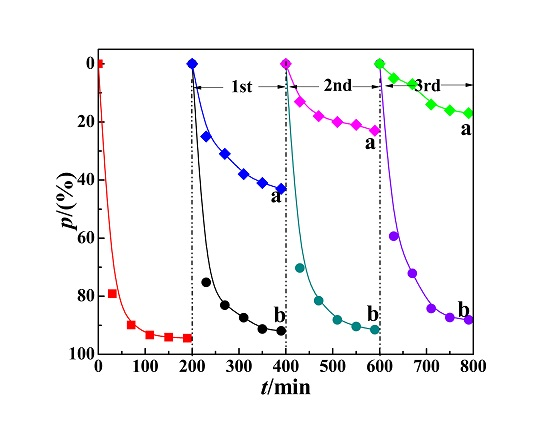
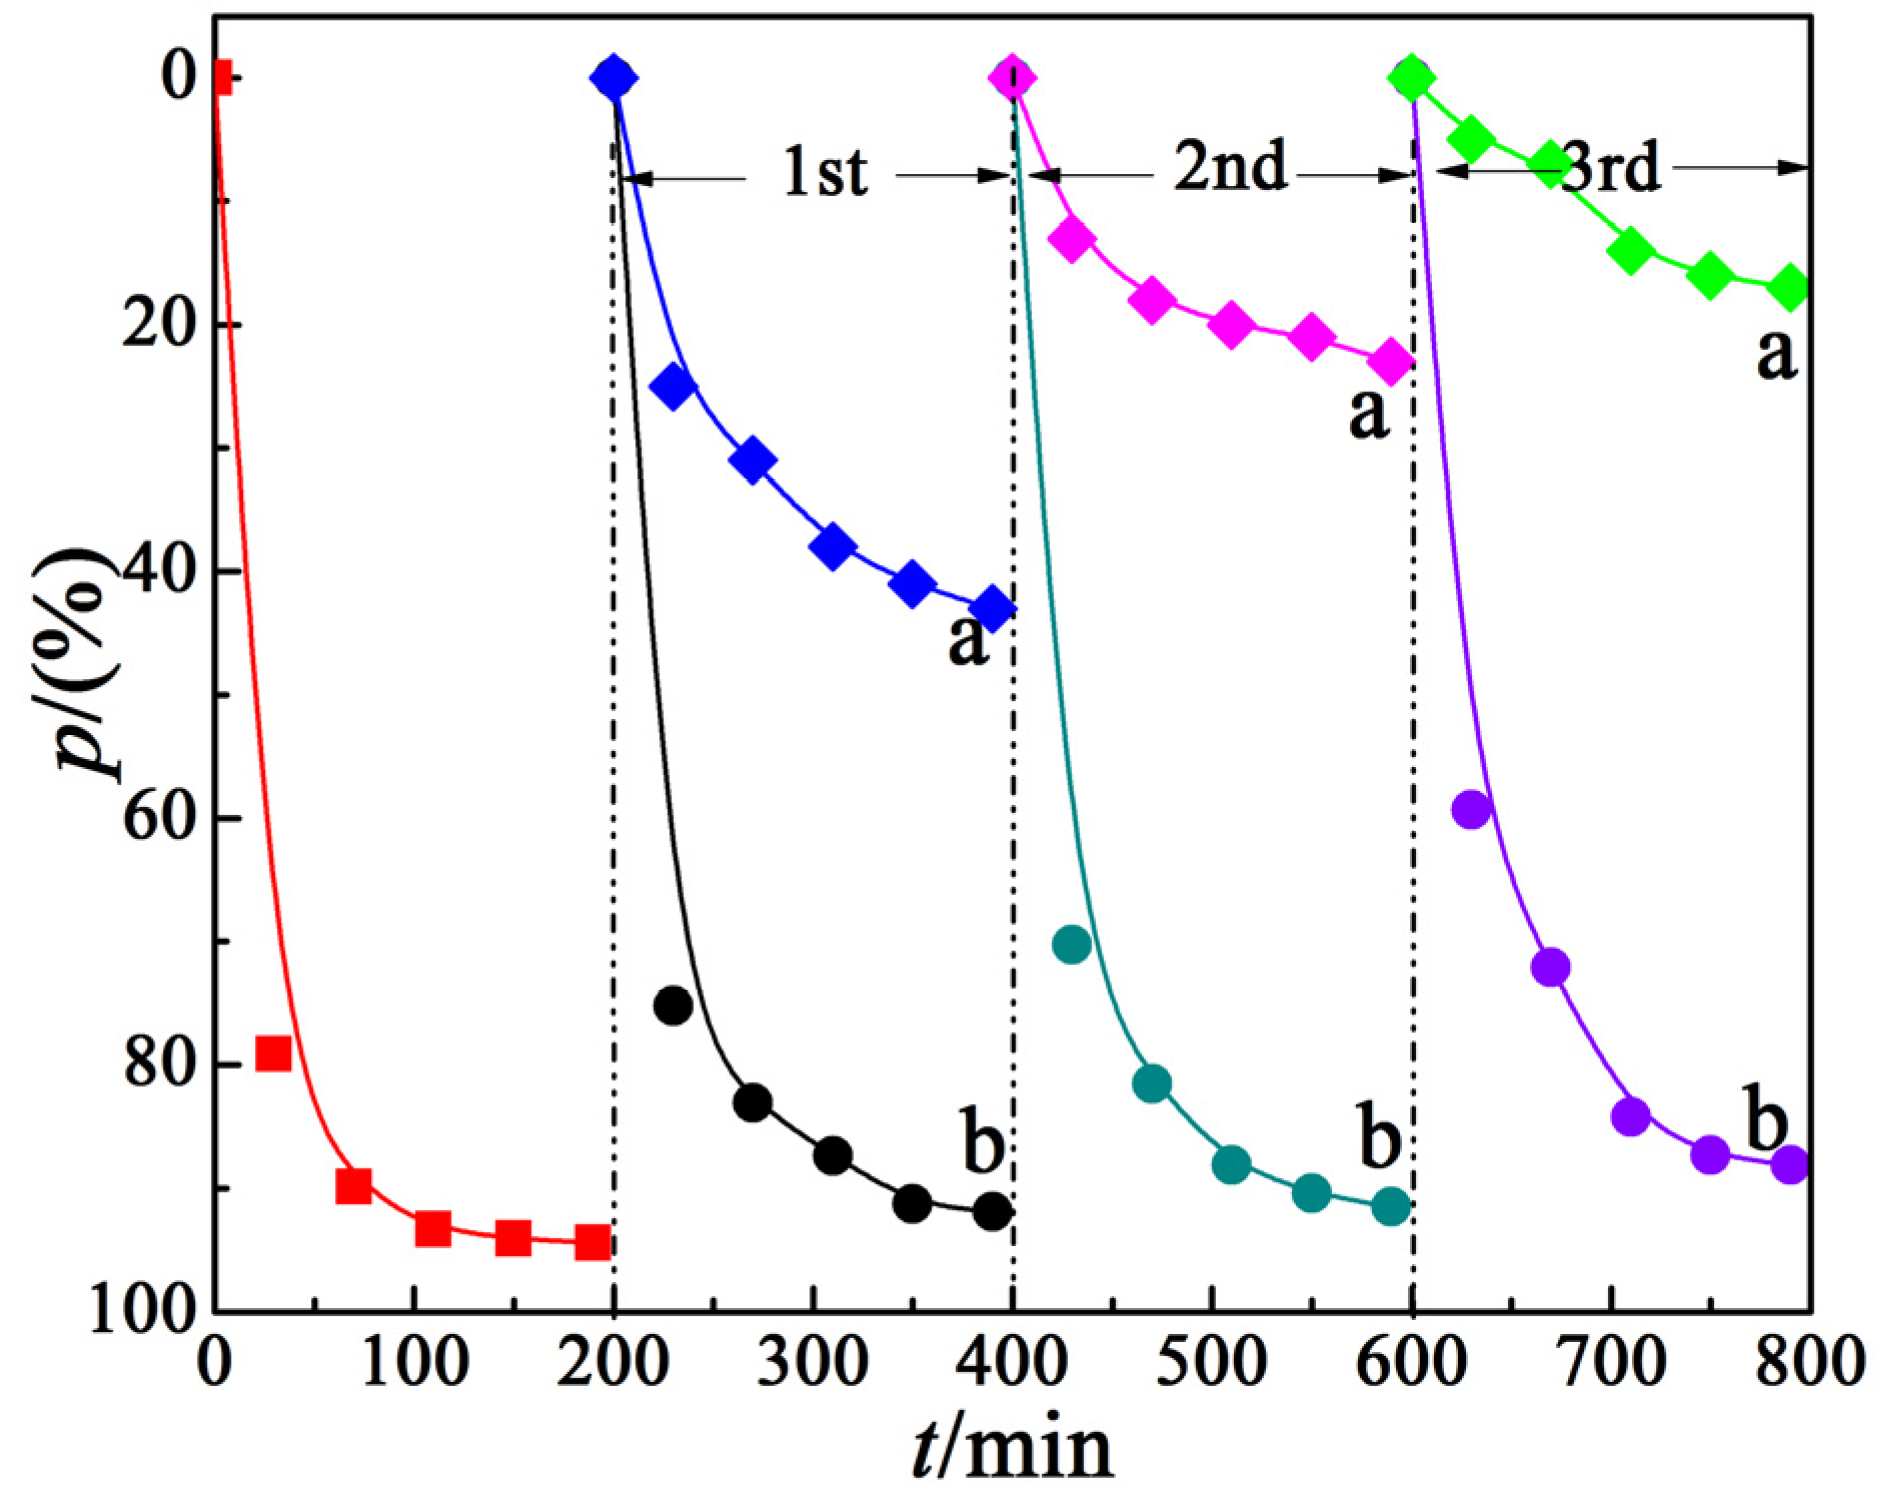
2.3. Regeneration of α-Fe2O3@PHCMs

Renewability is an important factor to evaluate the adsorbent for dye adsorption. In order to know the renewability of as-synthesized α-Fe2O3@PHCMs composites, the employed α-Fe2O3@PHCMs was washed out and then reused in the new experiments with fresh MV solution to evaluate its cycle performance. In this study, H2O2 was used for the adsorbent regeneration and the results are illustrated in Figure 9. In Figure 9, the α-Fe2O3@PHCMs without regeneration exhibited remarkable decrease in the percentage removal of MV from approximately 94.4% to 17.0% with prolonged cycling. In contrast, α-Fe2O3@PHCMs regenerated by H2O2 showed a slight decrease and still maintained a relatively high percentage removal of 88.0% after three cycles of regeneration, which proved the high regeneration ability of the α-Fe2O3@PHCMs.
This provides an excellent method for the regeneration of α-Fe2O3@PHCMs adsorbent. The possible regeneration mechanism can be speculated using both the synergistic effect between PHCMs and α-Fe2O3 particles as well as the Fenton-like oxidation reaction of α-Fe2O3/H2O2. The detailed mechanism can be illustrated as follows: the MV molecules were gathered from aqueous solution by adsorption and pre-concentrated on the surface of α-Fe2O3@PHCMs microspheres; the existence of Fe3+ on the oxide surface plays a major role to initiate the Fenton reaction (Equation (13)). Specifically, Fe3+ species on the surface of the α-Fe2O3@PHCMs adsorbent reacts with hydrogen peroxide and leads to the formation of various active intermediates such as [FeIIIOOH]2+, [FeIVO]2+ and [FeVO]3+ to produce OH and OOH radicals (Equations (14)–(17)) to decompose the MV molecules adsorbed on the α-Fe2O3@PHCMs [47,48]. It worth note that Fe2+ species formed in the reaction process (Equation (14)) also reacts with H2O2 to generate Fe3+ species, [FeIVO]2+ (Equation (18)) and hydroxyl radical (Equation (17)), which are capable of degrading MV [49]. Meanwhile, active adsorption sites on the surface of the α-Fe2O3@PHCMs microspheres were successfully recovered and can be used to carry out the next adsorption reaction.
Fe3+ + H2O2 → [FeIIIOOH]2+ + H+
[FeIIIOOH]2+ → Fe2+ +·OOH
[FeIIIOOH]2+ → [FeIVO]2+ +·OH
[FeIIIOOH]2+ → [FeVO]3+ + –OH
Fe2+ + H2O2 → Fe3+ +·OH + –OH
Fe2+ + H2O2 → [FeIVO]2+ + H2O
To further verify the renewability and stability of the α-Fe2O3@PHCMs adsorbent, the nanoparticles were characterized before and after three successive adsorption-regeneration cycles. FTIR spectra of the samples are presented in Figure 10. The strong bands between 700 cm−1 and 450 cm−1 are attributed to the Fe–O bonds vibration [50]. After three adsorption-regeneration treatments, the FTIR spectrum of α-Fe2O3@PHCMs was still similar to that of the original adsorbent. The adsorbent stability was confirmed by XRD analysis (Figure 11). It can be seen in Figure 11 that all the characteristic XRD peaks of α-Fe2O3 are still visible after three adsorption-regeneration treatments. This might make the α-Fe2O3@PHCMs process cost effective because the adsorbent does not have to be replaced over a relatively long period of time.

3. Experimental Section

3.1. Materials

Yeast powder used in the experiment was purchased from Angel Yeast Company, Beijing, China. All of the chemical agents including sodium hydroxide, sulfuric acid, ferrous sulfate, dithizone, acetone, methanol, and hydrogen peroxide (30%) were supplied by Xi’an Chemical Agent Corp, Xi’an, China. Diluted solutions of sodium hydroxide or sulfuric acid were used for pH adjustments. For the adsorption, methyl violet provided by Xi’an Chemical Agent Corp. was chosen to investigate the adsorption performance and its chemical structure was presented in Figure 12. All the other reagents were of analytical purity, and were utilized as received without further purification. Absolute ethanol and double-distilled water were used in the present work.

3.2. Synthesis of α-Fe2O3@PHCMs

PHCMs were synthesized by mild hydrothermal method. In a typical procedure, yeast powder (3 g) was firstly washed using distilled water and ethanol three times. Subsequently, the pre-treated yeast were dispersed in 4% (v/v) methanol aqueous solution (40 mL) and mixed thoroughly, which was then transferred into a stainless steel Teflon-sealed autoclave (50 mL) and maintained at 180 °C for 5 h. After cooling to room temperature, the puce products were rinsed three times with ethanol and distilled water, respectively, and then oven-dried for 2 h at 80 °C. The resultant materials were denoted as PHCMs.
Afterwards, 0.1 g of PHCMs were added into 50 mg/L of dithizone acetone solution (100 mL, dissolved in acetone), and subjected to magnetic stirring for 1 h. Dithizone functioned as a chelating agent and complexed with ferrous ion. Then, the samples were centrifugal separated, and dispersed by three cycles of impregnation/centrifugation/redispersion into saturated ferrous sulfate solution, and dried at 80 °C for 2 h in an oven. Finally, the products were pyrolyzed in a tubular reactor with nitrogen at temperature of 300 °C for 1 h. The as-prepared material was referred to as α-Fe2O3@PHCMs and collected for characterization and adsorption study. Scanning electron microscopy (SEM) images were taken on a Hitachi S-2700 scanning electron microscope (Hitachi, Tokyo, Japan) at an accelerating voltage of 20 kV.

3.3. Batch Adsorption Experiments

The adsorption of MV was performed using the standard batch method. Typically, certain amount of adsorbent was added into 100 mL dye solution of known concentration under various experimental parameters such as initial dye concentration (10–50 mg/L), pH (3–11), adsorbent dosage (0.25–1.25 g/L) and temperature (20–40 °C). All adsorption experiments were conducted in glass beakers and mechanically agitated in a thermostated shaker at a constant temperature until equilibrium was achieved. A portion of the sample was collected from the beakers at certain time intervals, then centrifuged. Subsequently, the supernatant was withdrawn and analyzed using a Jenway 6405 UV-vis spectrophotometer (Jenway, Cambridge, UK) to determine the left out concentration of MV at characteristic wavelength (λmax = 580 nm). Moreover, the amount of MV adsorbed at equilibrium (qe, mg/g), the amount of MV adsorbed at time t (qt, mg/g) and the percentage removal of dyes from aqueous solution (q, %) were calculated according to Equations (1)–(3), and different theoretical kinetic and isotherm models are applied to experimental data in order to determine the best-fitting model.
qe = (C0Ce)V/m
qt = (C0Ct)V/m
q(%) = (C0Ce)100%/C0
where C0, Ce and Ct are the dye concentration at initial, equilibrium and t time (mg/L), respectively, V is the volume of solution (L), and m is the amount of dry adsorbent (g).

3.4. Regeneration Studies

In order to investigate the reusability of the adsorbent, 0.1 g α-Fe2O3@PHCMs loaded with MV was introduced into 10 mL H2O2 solution (10%), and then the mixture was magnetically stirred to maintain a uniform suspension. After 30 min, the recycled adsorbent was centrifuged, washed thoroughly with double-distilled water and reconditioned for the next adsorption. Three cycles of adsorption-desorption studies were carried out accordingly. For comparison, the α-Fe2O3@PHCMs without regeneration were recycled using the same method aforementioned.

4. Conclusions

In this study, α-Fe2O3@PHCMs microspheres were prepared through a combination of hydrothermal and calcination methods and evaluated as an adsorbent for adsorption of MV from aqueous solutions. The experimental results suggest that the Langmuir isothermal model was suitable to predict adsorption equilibrium. The experimental data concerning the Langmuir constant (kL), maximum adsorption capacity (qm) were 0.2094 mg L−1 and 539.8 mg g−1 at 313.15 K, respectively. The kinetics of the adsorption process were shown to be better described by a pseudo-second-order model. Moreover, the thermodynamic data showed that the adsorption of MV onto α-Fe2O3@PHCMs composite is a spontaneous and exothermal process by physisorption. The employed α-Fe2O3@PHCMs composite could also be efficiently regenerated at least three times using 10% hydrogen peroxide and was proved to be a promising adsorbent for the removal of cationic dye MV.

Acknowledgements

This work was financially supported by National Natural Science Foundation of China (No.21176031), Shanxi Provincial Natural Science Foundation of China (No. 2015JM2071), the China Scholarship Council (CSC Nos. 201506560012) and FundamentalResearch Funds for the Central Universities-Excellent Doctoral Dissertation Cultivation Project of Chang’an University (No.310829150004) and the Fundamental Research Funds for the Central Universities (No. 310829162014, 310811160211).

Author Contributions

Bo Bai contributed to the experimental design; Zhiqing Tong, Honglun Wang and Yourui Suo contributed to all the experimental data collection; and Pei Zheng wrote the paper.

Conflicts of Interest

The authors declare no conflict of interest.

References

  1. Lia, J.; Ng, D.H.L.; Song, P.; Kong, C.; Song, Y. Synthesis of SnO2-activated carbon fiber hybrid catalyst for theremoval of methyl violet from water. Mater. Sci. Eng. B 2015, 194, 1–8. [Google Scholar] [CrossRef]
  2. Pal, J.; Deb, M.; Deshmukh, D.; Sen, B. Microwave-assisted synthesis of platinum nanoparticles and their catalytic degradation of methyl violet in aqueous solution. Appl. Nanosci. 2014, 4, 61–65. [Google Scholar] [CrossRef]
  3. Saji, M.; Taguchi, S.; Uchiyama, K.; Osono, E.; Hayama, N.; Ohkuni, H. Efficacy of gentian violet in the eradication of methicillin-resistant Staphylococcus aureus from skin lesions. J. Hosp. Infect. 1995, 31, 225–228. [Google Scholar] [CrossRef]
  4. Li, P.; Su, Y.J.; Wang, Y.; Liu, B.; Sun, L.M. Bioadsorption of methyl violet from aqueous solution onto Pu-erh tea powder. J. Hazard. Mater. 2010, 179, 43–48. [Google Scholar] [CrossRef] [PubMed]
  5. Bonetto, L.R.; Ferrarini, F.; de Marco, C.; Crespo, J.S.; Guégan, R.; Giovanela, M. Removal of methyl violet 2B dye from aqueous solution using a magnetic composite as an adsorbent. J. Water Process. Eng. 2015, 6, 11–20. [Google Scholar] [CrossRef] [Green Version]
  6. Wu, J.; Eiteman, M.A.; Law, S.E. Evaluation of membrane filtration and ozonation processes for treatment of reactive-dye wastewater. J. Environ. Eng. 1998, 124, 272–277. [Google Scholar] [CrossRef]
  7. Vimonses, V.; Lei, S.; Jin, B.; Chow, C.W.K.; Saint, C. Kinetic study and equilibrium isotherm analysis of Congo Red adsorption by clay materials. Chem. Eng. J. 2009, 148, 354–364. [Google Scholar] [CrossRef]
  8. Moghaddam, S.S.; Moghaddam, M.R.A.; Arami, M. Coagulation/flocculation process for dye removal using sludge from water treatment plant: optimization through response surface methodology. J. Hazard. Mater. 2010, 175, 651–657. [Google Scholar] [CrossRef] [PubMed]
  9. Hisaindee, S.; Meetani, M.A.; Rauf, M.A. Application of LC-MS to the analysis of advanced oxidation process (AOP) degradation of dye products and reaction mechanisms. TrAC Trends Anal. Chem. 2013, 49, 31–44. [Google Scholar] [CrossRef]
  10. Turhan, K.; Durukan, I.; Ozturkcan, S.A.; Turgut, Z. Decolorization of textile basic dye in aqueous solution byozone. Dyes Pigments 2012, 92, 897–901. [Google Scholar] [CrossRef]
  11. Wang, L.; Zhang, J.; Zhao, R.; Li, C.; Li, Y.; Zhang, C. Adsorption of basic dyes on activated carbon prepared from Polygonum orientale Linn: Equilibrium, kinetic and thermodynamic studies. Desalination 2010, 254, 68–74. [Google Scholar] [CrossRef]
  12. Rahchamani, J.; Mousavi, H.Z.; Behzad, M. Adsorption of methyl violet from aqueous solution by polyacrylamide as an adsorbent: Isotherm and kinetic studies. Desalination 2011, 267, 256–260. [Google Scholar] [CrossRef]
  13. Ni, D.; Wang, L.; Sun, Y.; Guan, Z.; Yang, S.; Zhou, K. Amphiphilic hollow carbonaceous microspheres with permeable shells. Angew. Chem. Int. Ed. Engl. 2010, 49, 4223–4227. [Google Scholar] [CrossRef] [PubMed]
  14. Mahmoodi, N.M. Binary catalyst system dye degradation using photocatalysis. Fibers Polym. 2014, 15, 73–280. [Google Scholar] [CrossRef]
  15. Li, C.; Dong, Y.; Yang, J.; Li, Y.; Huang, C. Modified nano-graphite/Fe3O4 composite as efficient adsorbent for the removal of methyl violet from aqueous solution. J. Mol. Liq. 2014, 196, 348–356. [Google Scholar] [CrossRef]
  16. Zheng, P.; Zhang, K.; Dang, Y.; Bai, B.; Guan, W.; Suo, Y. Adsorption of organic dyes by TiO2@yeast-carbon composite microspheres and their in situ regeneration evaluation. J. Nanomater. 2015, 198304, 1–13. [Google Scholar]
  17. Saikia, J.; Sikdar, Y.; Saha, B.; Das, G. Malachite nanoparticle: A potent surface for the adsorption of xanthene dyes. J. Environ. Chem. Eng. 2013, 1, 1166–1173. [Google Scholar] [CrossRef]
  18. Mahmoud, D.K.; Salleh, M.A.M.; Karim, W.A.; Idris, A.; Abidin, Z.Z. Batch adsorption of basic dye using acid treated kenaf fibre char: Equilibrium, kinetic and thermodynamic studies. Chem. Eng. J. 2012, 181, 449–457. [Google Scholar] [CrossRef]
  19. Tian, Y.; Jia, C.; Zhao, M.; Xu, M.; Zhang, Y.; Wang, R. Preparation and characterization of baker’s yeast modified by nano-Fe3O4: Application of biosorption of methyl violet in aqueous solution. Chem. Eng. J. 2010, 165, 474–481. [Google Scholar] [CrossRef]
  20. Hameed, B.H. Equilibrium and kinetic studies of methyl violet sorption by agricultural waste. J. Hazard. Mater. 2008, 154, 204–212. [Google Scholar] [CrossRef] [PubMed]
  21. Duan, J.M.; Liu, R.C.; Chen, T.; Zhang, B.; Liu, A.D. Halloysite nanotube-Fe3O4 composite for removal of methyl violet from aqueous solutions. Desalination 2012, 293, 46–52. [Google Scholar] [CrossRef]
  22. Xu, R.K.; Xiao, S.C.; Yuan, J.H.; Zhao, A.Z. Adsorption of methyl violet from aqueous solutions by the biochars derived from crop residues. Bioresource Technol. 2011, 102, 10293–10298. [Google Scholar] [CrossRef] [PubMed]
  23. Çelekli, A.; Birecikligil, S.S.; Geyik, F.; Bozkurt, H. Prediction of removal efficiency of Lanaset Red G on walnut husk using artificial neural network model. Bioresour. Technol. 2012, 103, 64–70. [Google Scholar] [CrossRef] [PubMed]
  24. Kumar, P.S.; Ramalingam, S.; Senthamarai, C.; Niranjanaa, M.; Vijayalakshmi, P.; Sivanesan, S. Adsorption of dye from aqueous solution by cashew nut shell: Studies on equilibrium isotherm, kinetics and thermodynamics of interactions. Desalination 2010, 261, 52–60. [Google Scholar] [CrossRef]
  25. Ahmad, M.A.; Alrozi, R. Removal of malachite green dye from aqueous solution using rambutan peel-based activated carbon: Equilibrium, kinetic and thermodynamic studies. Chem. Eng. J. 2011, 171, 510–516. [Google Scholar] [CrossRef]
  26. Chen, L.; Bai, B. Equilibrium, Kinetic, Thermodynamic, and in situ Regeneration Studies about Methylene Blue Adsorption by the Raspberry-like TiO2@yeast Microspheres. Ind. Eng. Chem. Res. 2013, 52, 15568–15577. [Google Scholar] [CrossRef]
  27. Wu, Q.; Feng, C.; Wang, C.; Wang, Z. A facile one-pot solvothermal method to produce superparamagnetic grapheme-Fe3O4 nanocomposite and its application in the removal of dye from aqueous solution. Colloids Surf. B 2013, 101, 210–214. [Google Scholar] [CrossRef] [PubMed]
  28. Kalur, G.C.; Frounfelker, B.D.; Cipriano, B.H.; Norman, A.I.; Raghavan, S.R. Viscosity Increase with Temperature in Cationic Surfactant Solutions Due to the Growth of Wormlike Micelles. Langmuir 2005, 21, 10998–11004. [Google Scholar] [CrossRef] [PubMed]
  29. Chowdhury, S.; Mishra, R.; Saha, P.; Kushwaha, P. Adsorption thermodynamics, kinetics and isosteric heat of adsorption of malachite green onto chemically modified rice husk. Desalination 2011, 265, 159–168. [Google Scholar] [CrossRef]
  30. Langmuir, I. The constitution and fundamental properties of solids and liquids. Part I. solids. J. Am. Chem. Soc. 1916, 38, 2221–2295. [Google Scholar] [CrossRef]
  31. Weber, T.W.; Chakravorti, R.K. Pore and solid diffusion models for fixed-bed adsorbers. AIChE J. 1974, 20, 228–238. [Google Scholar] [CrossRef]
  32. Freundlich, H.M.F. Over the adsorption in solution. J. Phys. Chem. 1906, 57, 1100–1107. [Google Scholar]
  33. Chen, S.; Zhang, J.; Zhang, C.; Yue, Q.; Li, Y.; Li, C. Equilibrium and kinetic studies of methyl orange and methyl violet adsorption on activated carbon derived from Phragmites australis. Desalination 2010, 252, 149–156. [Google Scholar] [CrossRef]
  34. Temkin, M.I.; Pyzhev, V. Kinetics of ammonia synthesis on promoted iron catalysts. Acta Physiochim. URSS 1940, 12, 217–222. [Google Scholar]
  35. Sips, R. Combined form of Langmuir and Freundlich equations. J. Chem. Phys. 1948, 16, 490–495. [Google Scholar] [CrossRef]
  36. Wu, J.S.; Liu, C.H.; Chu, K.H.; Suen, S.Y. Removal of cationic dye methyl violet 2B from water by cation exchange membranes. J. Membr. Sci. 2008, 309, 239–245. [Google Scholar] [CrossRef]
  37. Ofomaja, A.E. Kinetic study and sorption mechanism of methylene blue and methyl violet onto mansonia (Mansonia altissima) wood sawdust. Chem. Eng. J. 2008, 143, 85–95. [Google Scholar] [CrossRef]
  38. Musyoka, S.M.; Mittal, H.; Mishra, S.B.; Ngila, J.C. Effect of functionalization on the adsorption capacity of cellulose for the removal of methyl violet. Int. J. Biological Macromol. 2014, 65, 389–397. [Google Scholar] [CrossRef] [PubMed]
  39. Liu, R.; Zhang, B.; Mei, D.; Zhang, H.; Liu, J. Adsorption of methyl violet from aqueous solution by halloysite nanotubes. Desalination 2011, 268, 111–116. [Google Scholar]
  40. Lagergren, S. About the theory of so-called adsorption of soluble substances. Kungliga Svenska Vetenskapsakademiens Handlingar 1898, 24, 1–39. [Google Scholar]
  41. Ho, Y.S.; McKay, G. Kinetic models for the sorption of dye from aqueous solution by wood. Process. Saf. Environ. 1998, 76, 183–191. [Google Scholar] [CrossRef]
  42. Hameed, B.H. Spent tea leaves: A new non-conventional and low-cost adsorbent for removal of basic dye from aqueous solutions. J. Hazard. Mater. 2009, 161, 753–759. [Google Scholar] [CrossRef] [PubMed]
  43. Ai, L.; Li, M.; Li, L. Adsorption of methylene blue from aqueous solution with activated carbon/cobalt ferrite/alginate composite beads: Kinetics, isotherms, and thermodynamics. J. Chem. Eng. Data 2011, 56, 3475–3483. [Google Scholar] [CrossRef]
  44. Weber, W.J.; Morris, J.C. Kinetics of adsorption on carbon from solution. J. Sanit. Eng. Div. ASCE 1963, 89, 31–60. [Google Scholar]
  45. Ding, L.L.; Zou, B.; Gao, W.; Liu, Q.; Wang, Z.C.; Guo, Y.P.; Wang, X.F.; Liu, Y.H. Adsorption of Rhodamine-B from aqueous solution using treated rice husk-based activated carbon. Colloids Surf. A 2014, 446, 1–7. [Google Scholar] [CrossRef]
  46. Konicki, W.; Cendrowski, K.; Chen, X.; Mijowska, E. Application of hollow mesoporous carbon nanospheres as an high effective adsorbent for the fast removal of acid dyes from aqueous solutions. Chem. Eng. J. 2013, 228, 824–833. [Google Scholar] [CrossRef]
  47. Gokulakrishnan, N.; Pandurangan, A.; Sinha, P.K. Catalytic wet peroxide oxidation technique for the removal of decontaminating agents ethylenediaminetetraacetic acid and oxalic acid from aqueous solution using efficient Fenton type Fe-MCM-41 mesoporous materials. Ind. Eng. Chem. Res. 2009, 48, 1556–1561. [Google Scholar] [CrossRef]
  48. Panda, N.; Sahoo, H.; Mohapatra, S. Decolourization of Methyl Orange using Fenton-like mesoporous Fe2O3-SiO2 composite. J. Hazard. Mater. 2011, 185, 359–365. [Google Scholar] [CrossRef] [PubMed]
  49. Haber, F.; Weiss, J. The catalytic decomposition of hydrogen peroxide by iron salts. Proc. R. Soc. Lond. Ser. A 1934, 147, 332–351. [Google Scholar] [CrossRef]
  50. Tiya-Djowe, A.; Acayanka, E.; Lontio-Nkouongfo, G.; Laminsi, S.; Gaigneaux, E.M. Enhanced discolouration of methyl violet 10B in a gliding arc plasma reactor by the maghemite nanoparticles used as heterogeneous catalyst. J. Environ. Chem. Eng. 2015, 3, 953–960. [Google Scholar] [CrossRef]
Figure 1. FE-SEM images of α-Fe2O3@PHCMs under different magnifications.
Catalysts 06 00058 g001
Figure 2. Effect of the pH on MV adsorption on α-Fe2O3@PHCMs.
Catalysts 06 00058 g002
Figure 3. Effect of adsorbent dosage on the adsorption.
Catalysts 06 00058 g003
Figure 4. Effect of initial dye concentration and contact time on the adsorption.
Catalysts 06 00058 g004
Figure 5. Effect of temperature on the initial concentration dependence for the uptake of MV onto α-Fe2O3@PHCMs.
Catalysts 06 00058 g005
Figure 6. Comparison of the (a) Langmuir, Freundlich, Sips and (b) Temkin isotherm models for MV adsorption onto α-Fe2O3@PHCMs composites at different temperatures.
Catalysts 06 00058 g006
Figure 7. (a) Pseudo-first-order and (b) pseudo-second-order kinetics for adsorption of MV onto α-Fe2O3@PHCMs at different initial concentrations.
Catalysts 06 00058 g007
Figure 8. Intra-particle diffusion treatment of MV onto α-Fe2O3@PHCMs at initial concentrations.
Catalysts 06 00058 g008
Figure 9. Recycle use of α-Fe2O3@PHCMs on adsorption of MV: (a) without regeneration; and (b) with H2O2 regeneration.
Catalysts 06 00058 g009
Figure 10. FTIR spectra of α-Fe2O3@PHCMs before (a) and after (b) three repeated treatments.
Catalysts 06 00058 g010
Figure 11. XRD spectra of α-Fe2O3@PHCMs before (a) and (b) after three repeated treatments.
Catalysts 06 00058 g011
Figure 12. Chemical structure of methyl violet.
Catalysts 06 00058 g012
Table 1. Isotherm Constants for the adsorption of MV onto α-Fe2O3@PHCMs Composites.
Isotherm ModelsParametersTemperature (K)
293.15 K303.15 K313.15 K
Langmiurqmax (mg/g)297.8344.9539.8
b (L/mg)0.12710.12430.07552
R20.99580.98870.9821
RL0.13590.13860.2094
FreundlichKf (mg/g)29.9132.7642.84
1/n0.77180.82810.8073
R20.93770.94270.9729
TemkinA (L/mg)2.5122.7033.471
B40.3942.7238.12
R20.95350.94900.8919
SipsKS38.2838.8747.29
aS0.16900.21210.3793
βS0.97710.95780.9645
R20.99520.98840.9812
Table 2. Comparison of adsorption capacities of various adsorbents for MV.
Adsorbentqmax (mg·g−1)Reference
Cation exchange membranes10.1Wu et al. [36]
Mansonia wood sawdust16.1Ofomaja et al. [37]
HNT-Fe3O4 composite20.0Bonetto et al. [5]
Sunflower seed hull92.59Hameed et al. [20]
Functionalized cellulose106.38Musyoka et al. [38]
Halloysite nanotubes113.64Liu et al. [39]
SnO2/activated carbon fiber135Lia et al. [1]
α-Fe2O3@PHCMs539.8This study
Table 3. Kinetic Constants of Pseudo-First-Order and Pseudo-Second-Order Kinetic Models.
Kinetic ModelKinetic ConstantInitial Concentration (mg/L)
1020304050
Pseudo-first-orderk1 × 10−2 (min−1)3.7304.5492.9303.6073.320
qe,exp (mg/g)17.8337.0957.4275.1295.05
qe,cal (mg/g)7.20421.5424.7938.5738.24
R20.91020.93170.91780.91140.9188
Pseudo-second-orderk2 × 10−3 (g/mg·min)30.1117.097.6396.4005.198
qe,exp (mg/g)17.8337.0957.4275.1295.05
qe,cal (mg/g)17.9637.3457.7475.5995.69
h (mg/g·min)9.57623.5125.1836.1146.96
Table 4. Intra-particle rate parameters and diffusion coefficients at different initial concentrations.
Initial Concentration (mg/L)Intraparticle Diffusion Model
Kid,1 (mg/g·min1/2)Kid,2 (mg/g·min1/2)CR2
100.17260.0871215.940.8144
201.3830.137634.090.8816
302.5610.282050.980.9743
402.7910.429565.640.9097
503.1330.430085.440.9562
Table 5. Thermodynamics parameters for MV adsorption onto α-Fe2O3@PHCMs composites with different temperatures.
T (K)K0ΔG0 (kJ/mol)ΔH0 (kJ/mol)ΔS0 (J/mol·K)
293.153.604−3.135--
303.153.683−3.2962.73919.96
313.153.873−3.537--

