
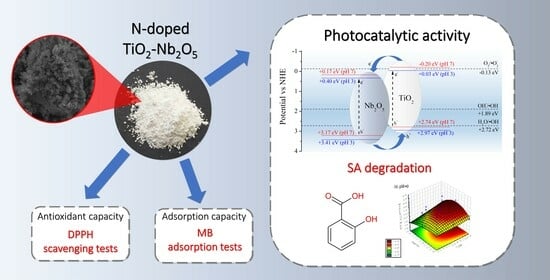
N-Doped TiO2-Nb2O5 Sol–Gel Catalysts: Synthesis, Characterization, Adsorption Capacity, Photocatalytic and Antioxidant Activity
 ,
,  , , , , and
Abstract
:
1. Introduction
2. Results and Discussion
2.1. Characterization Results
2.2. Photocatalytic Activity Tests
2.2.1. The 24-Factorial Design: Screening Tests
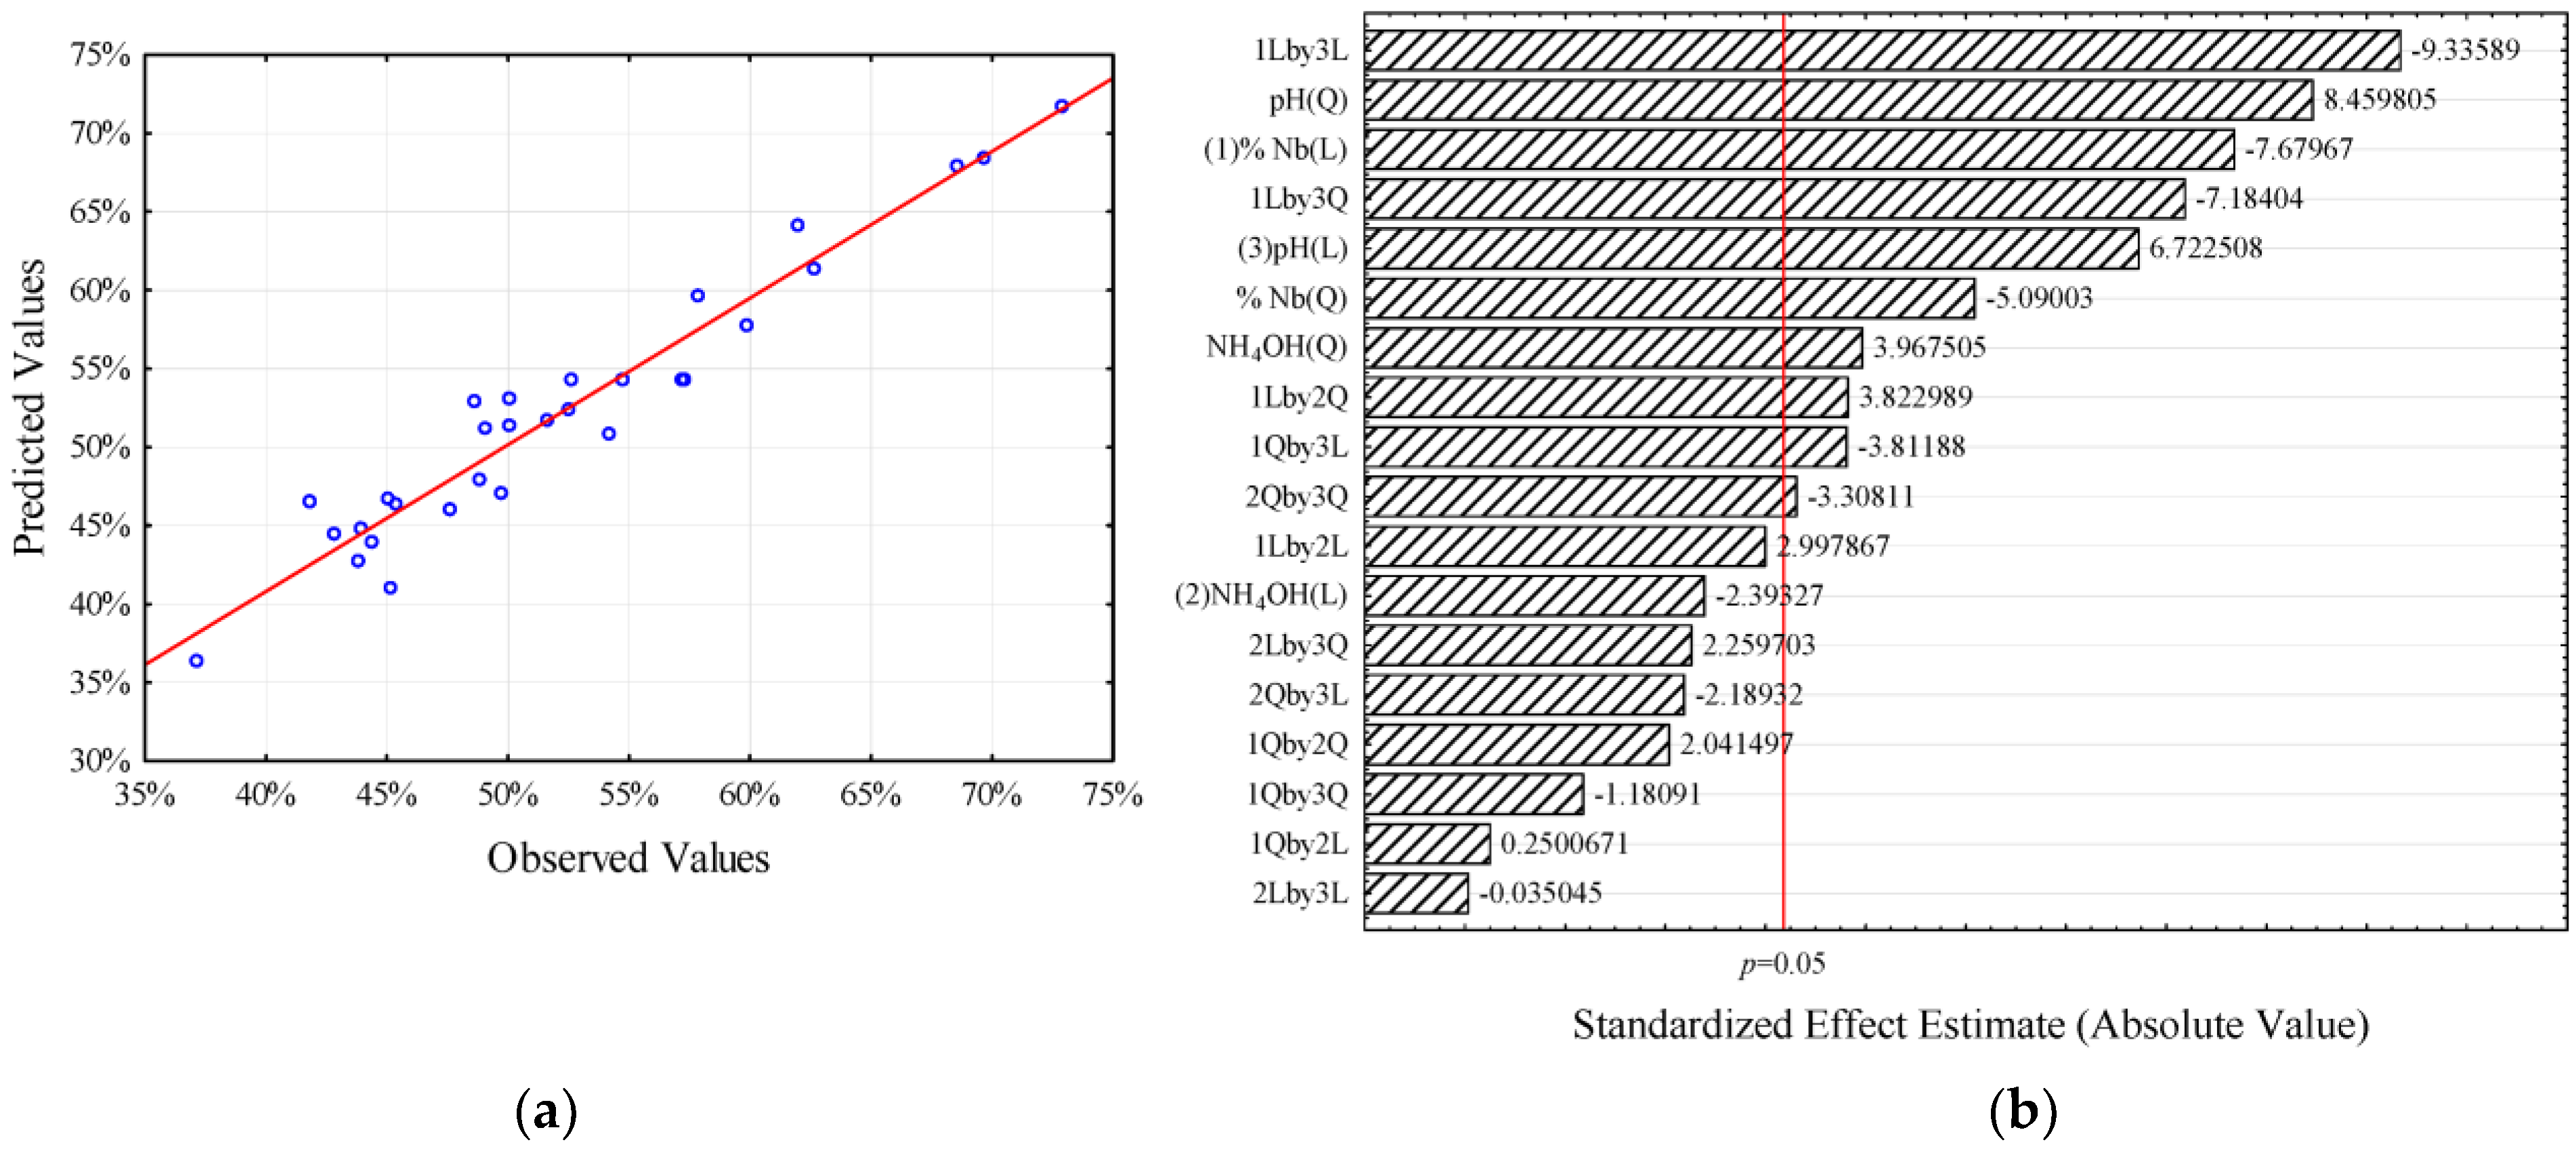
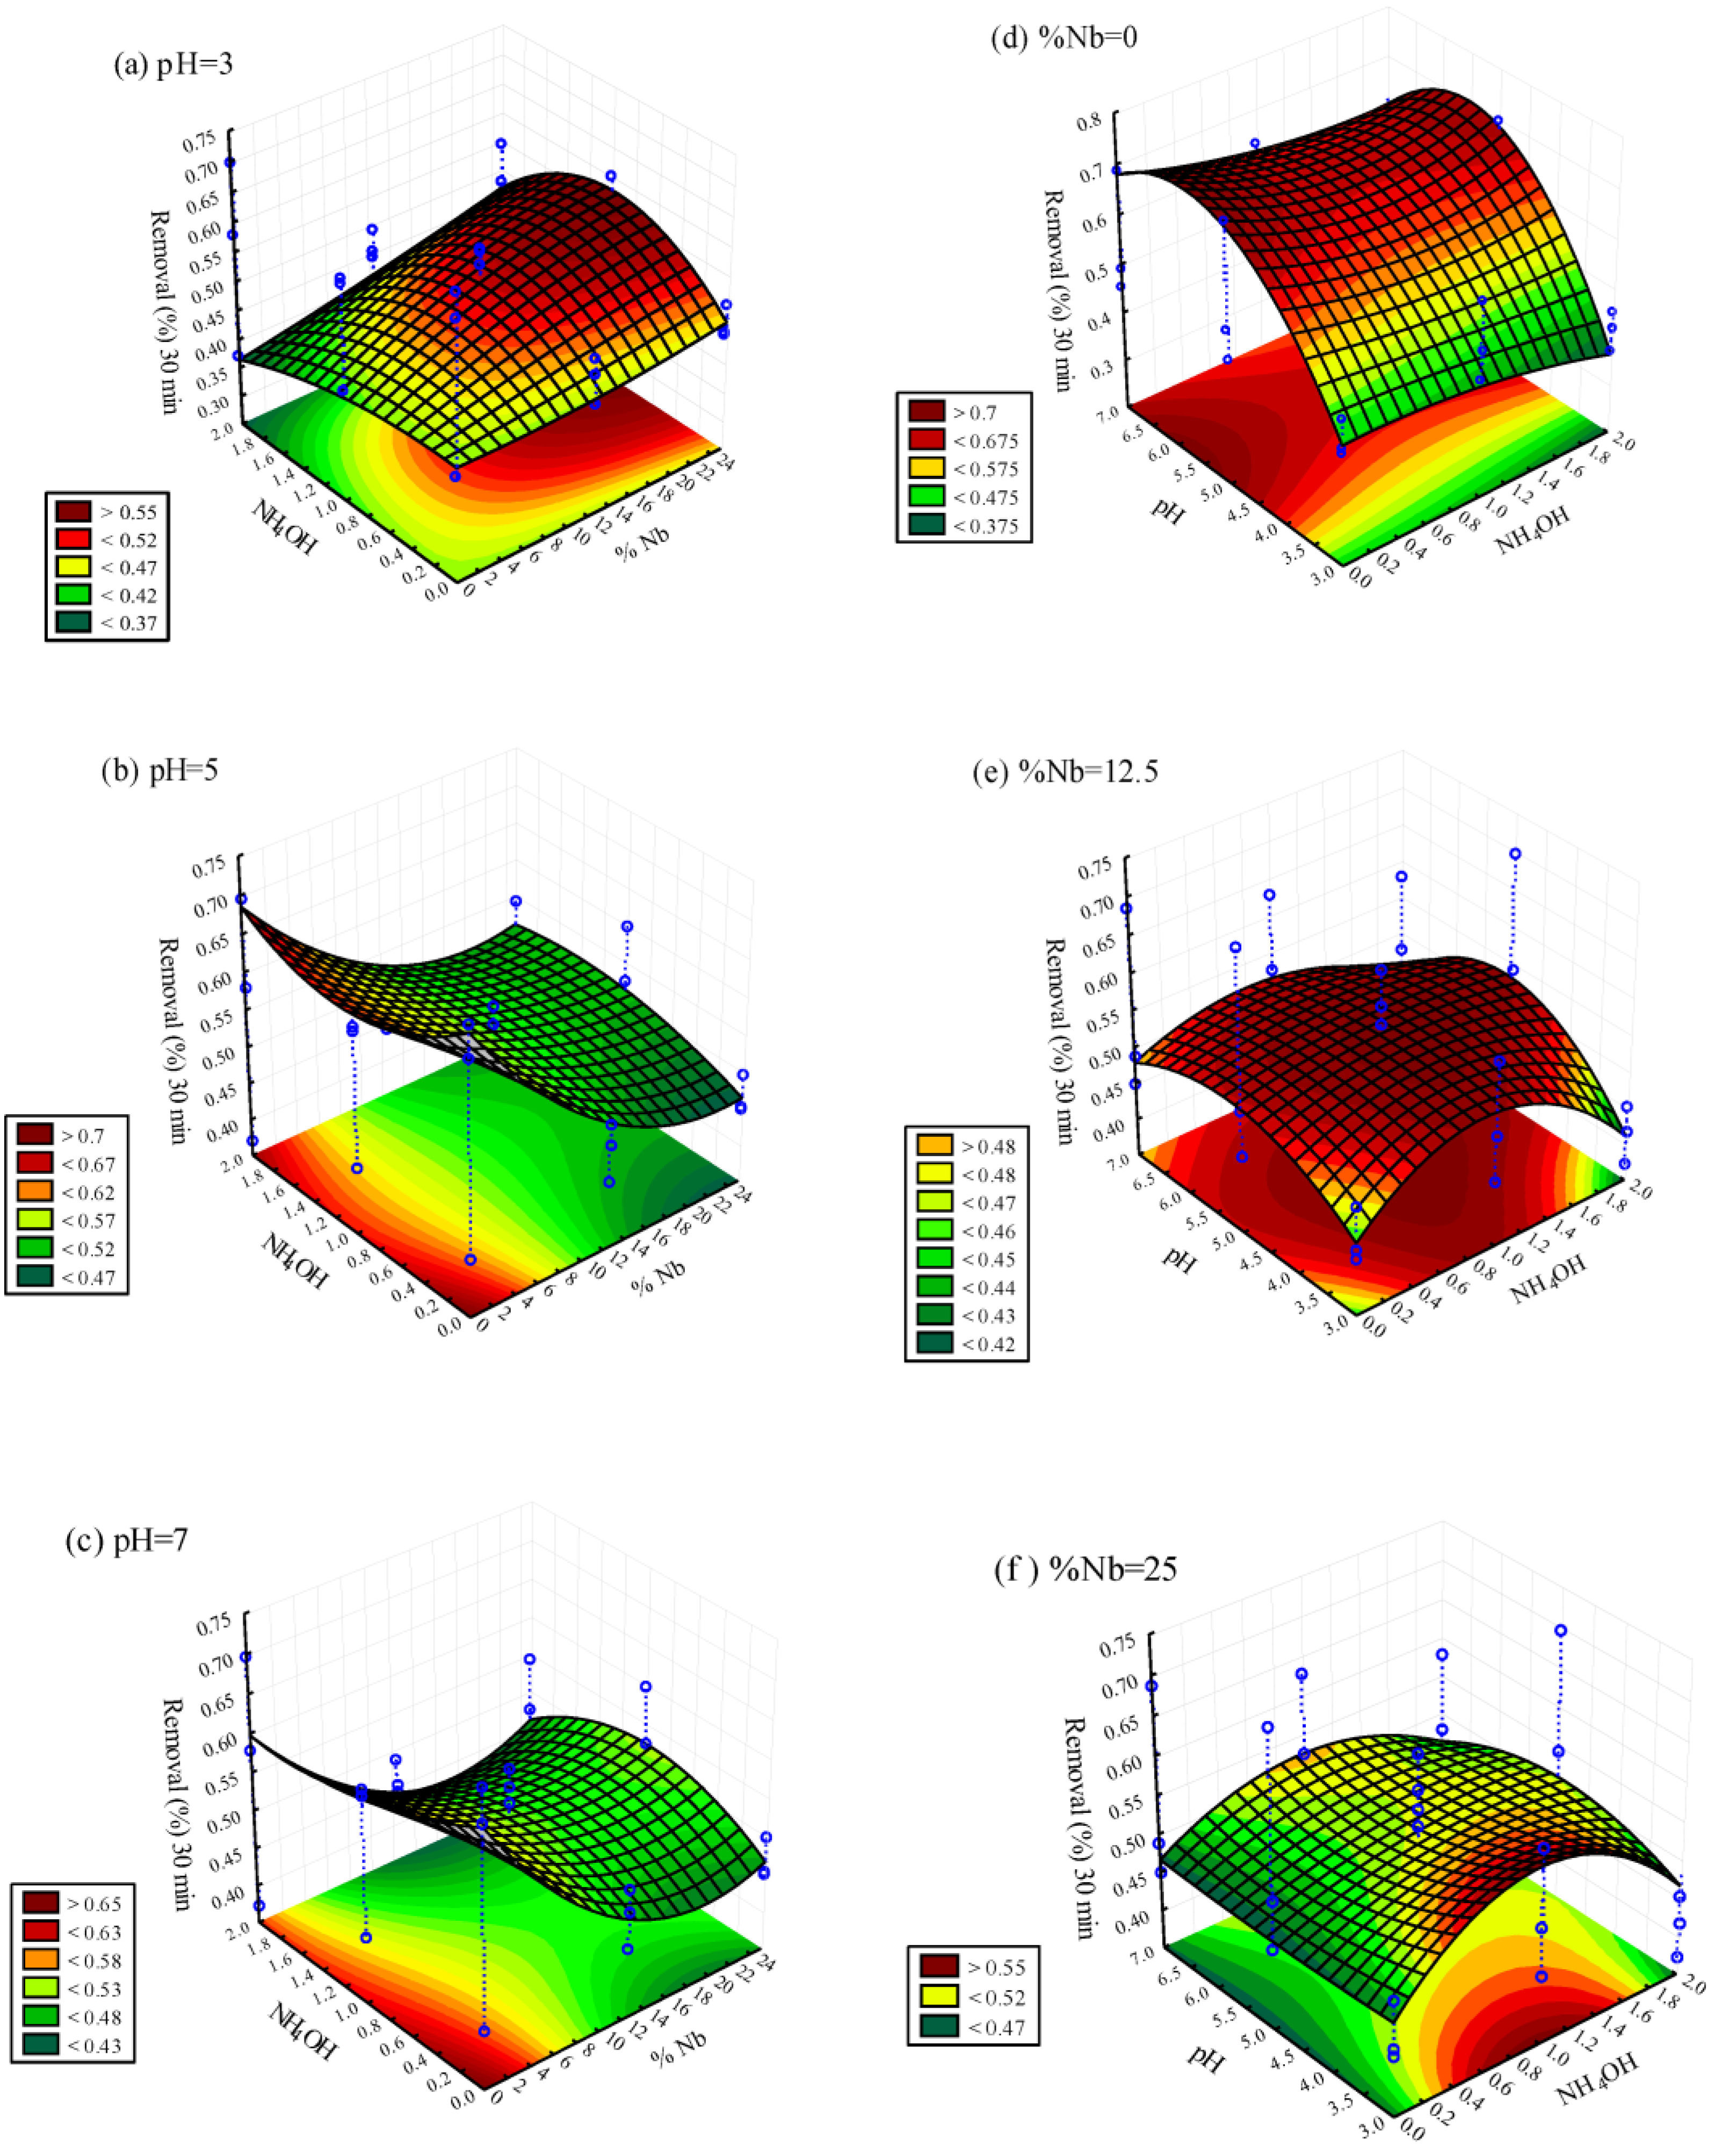
2.2.2. The 33-Factorial Design: Optimization
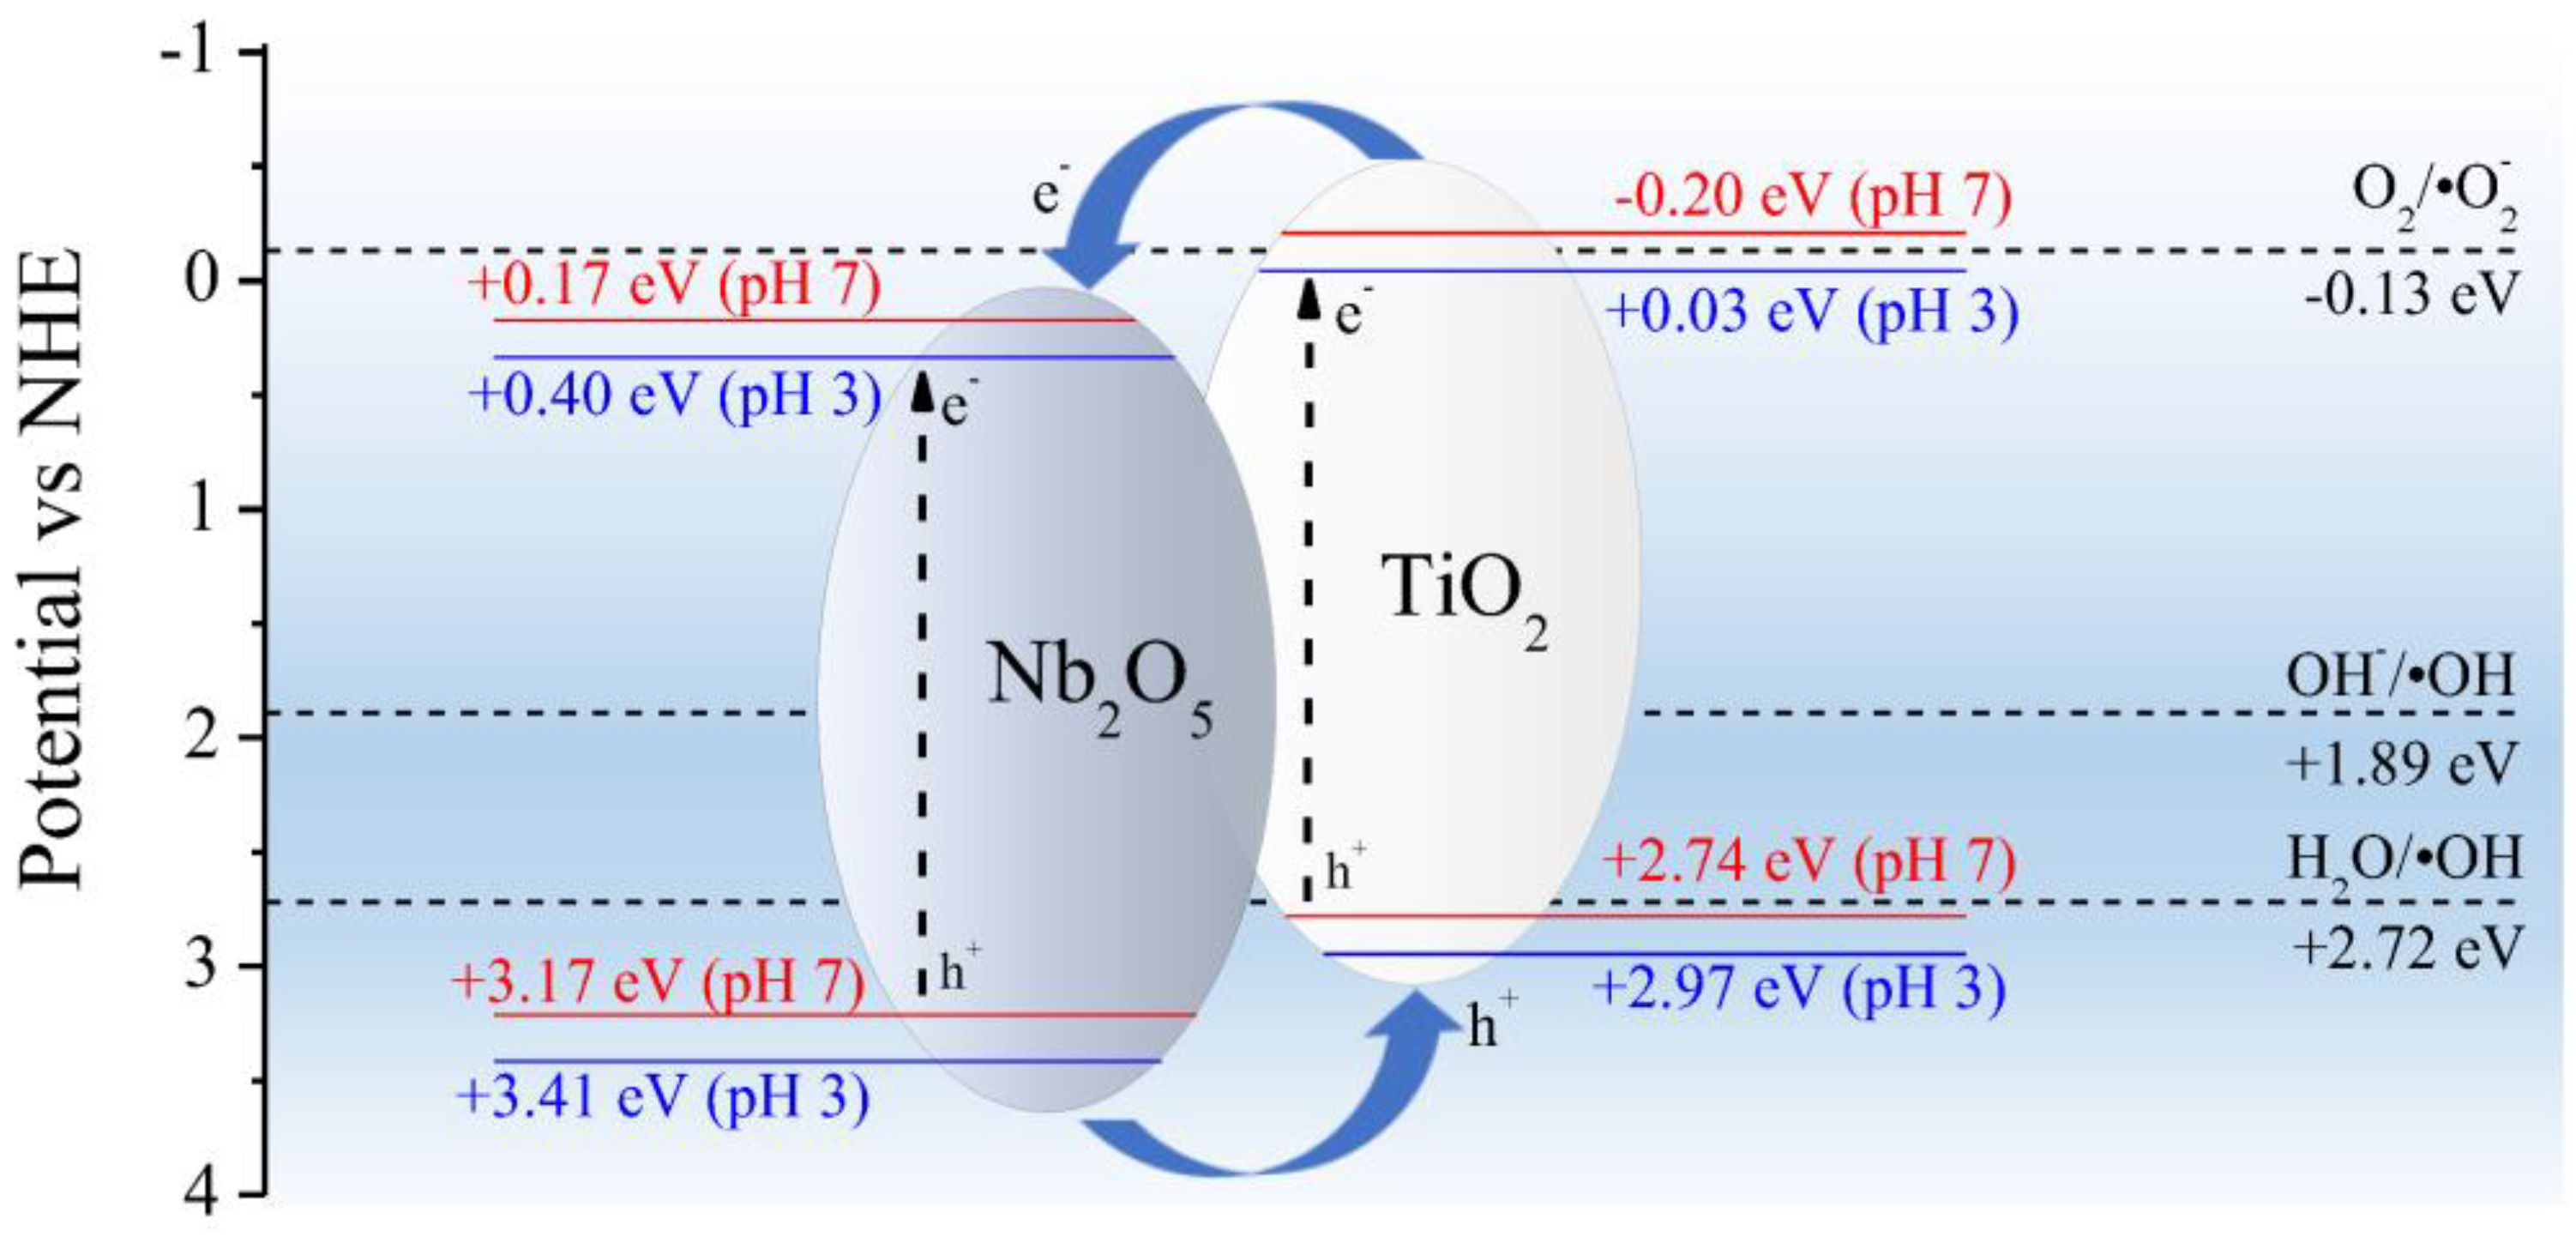
2.3. Quenching Tests: Contribution of Radicals
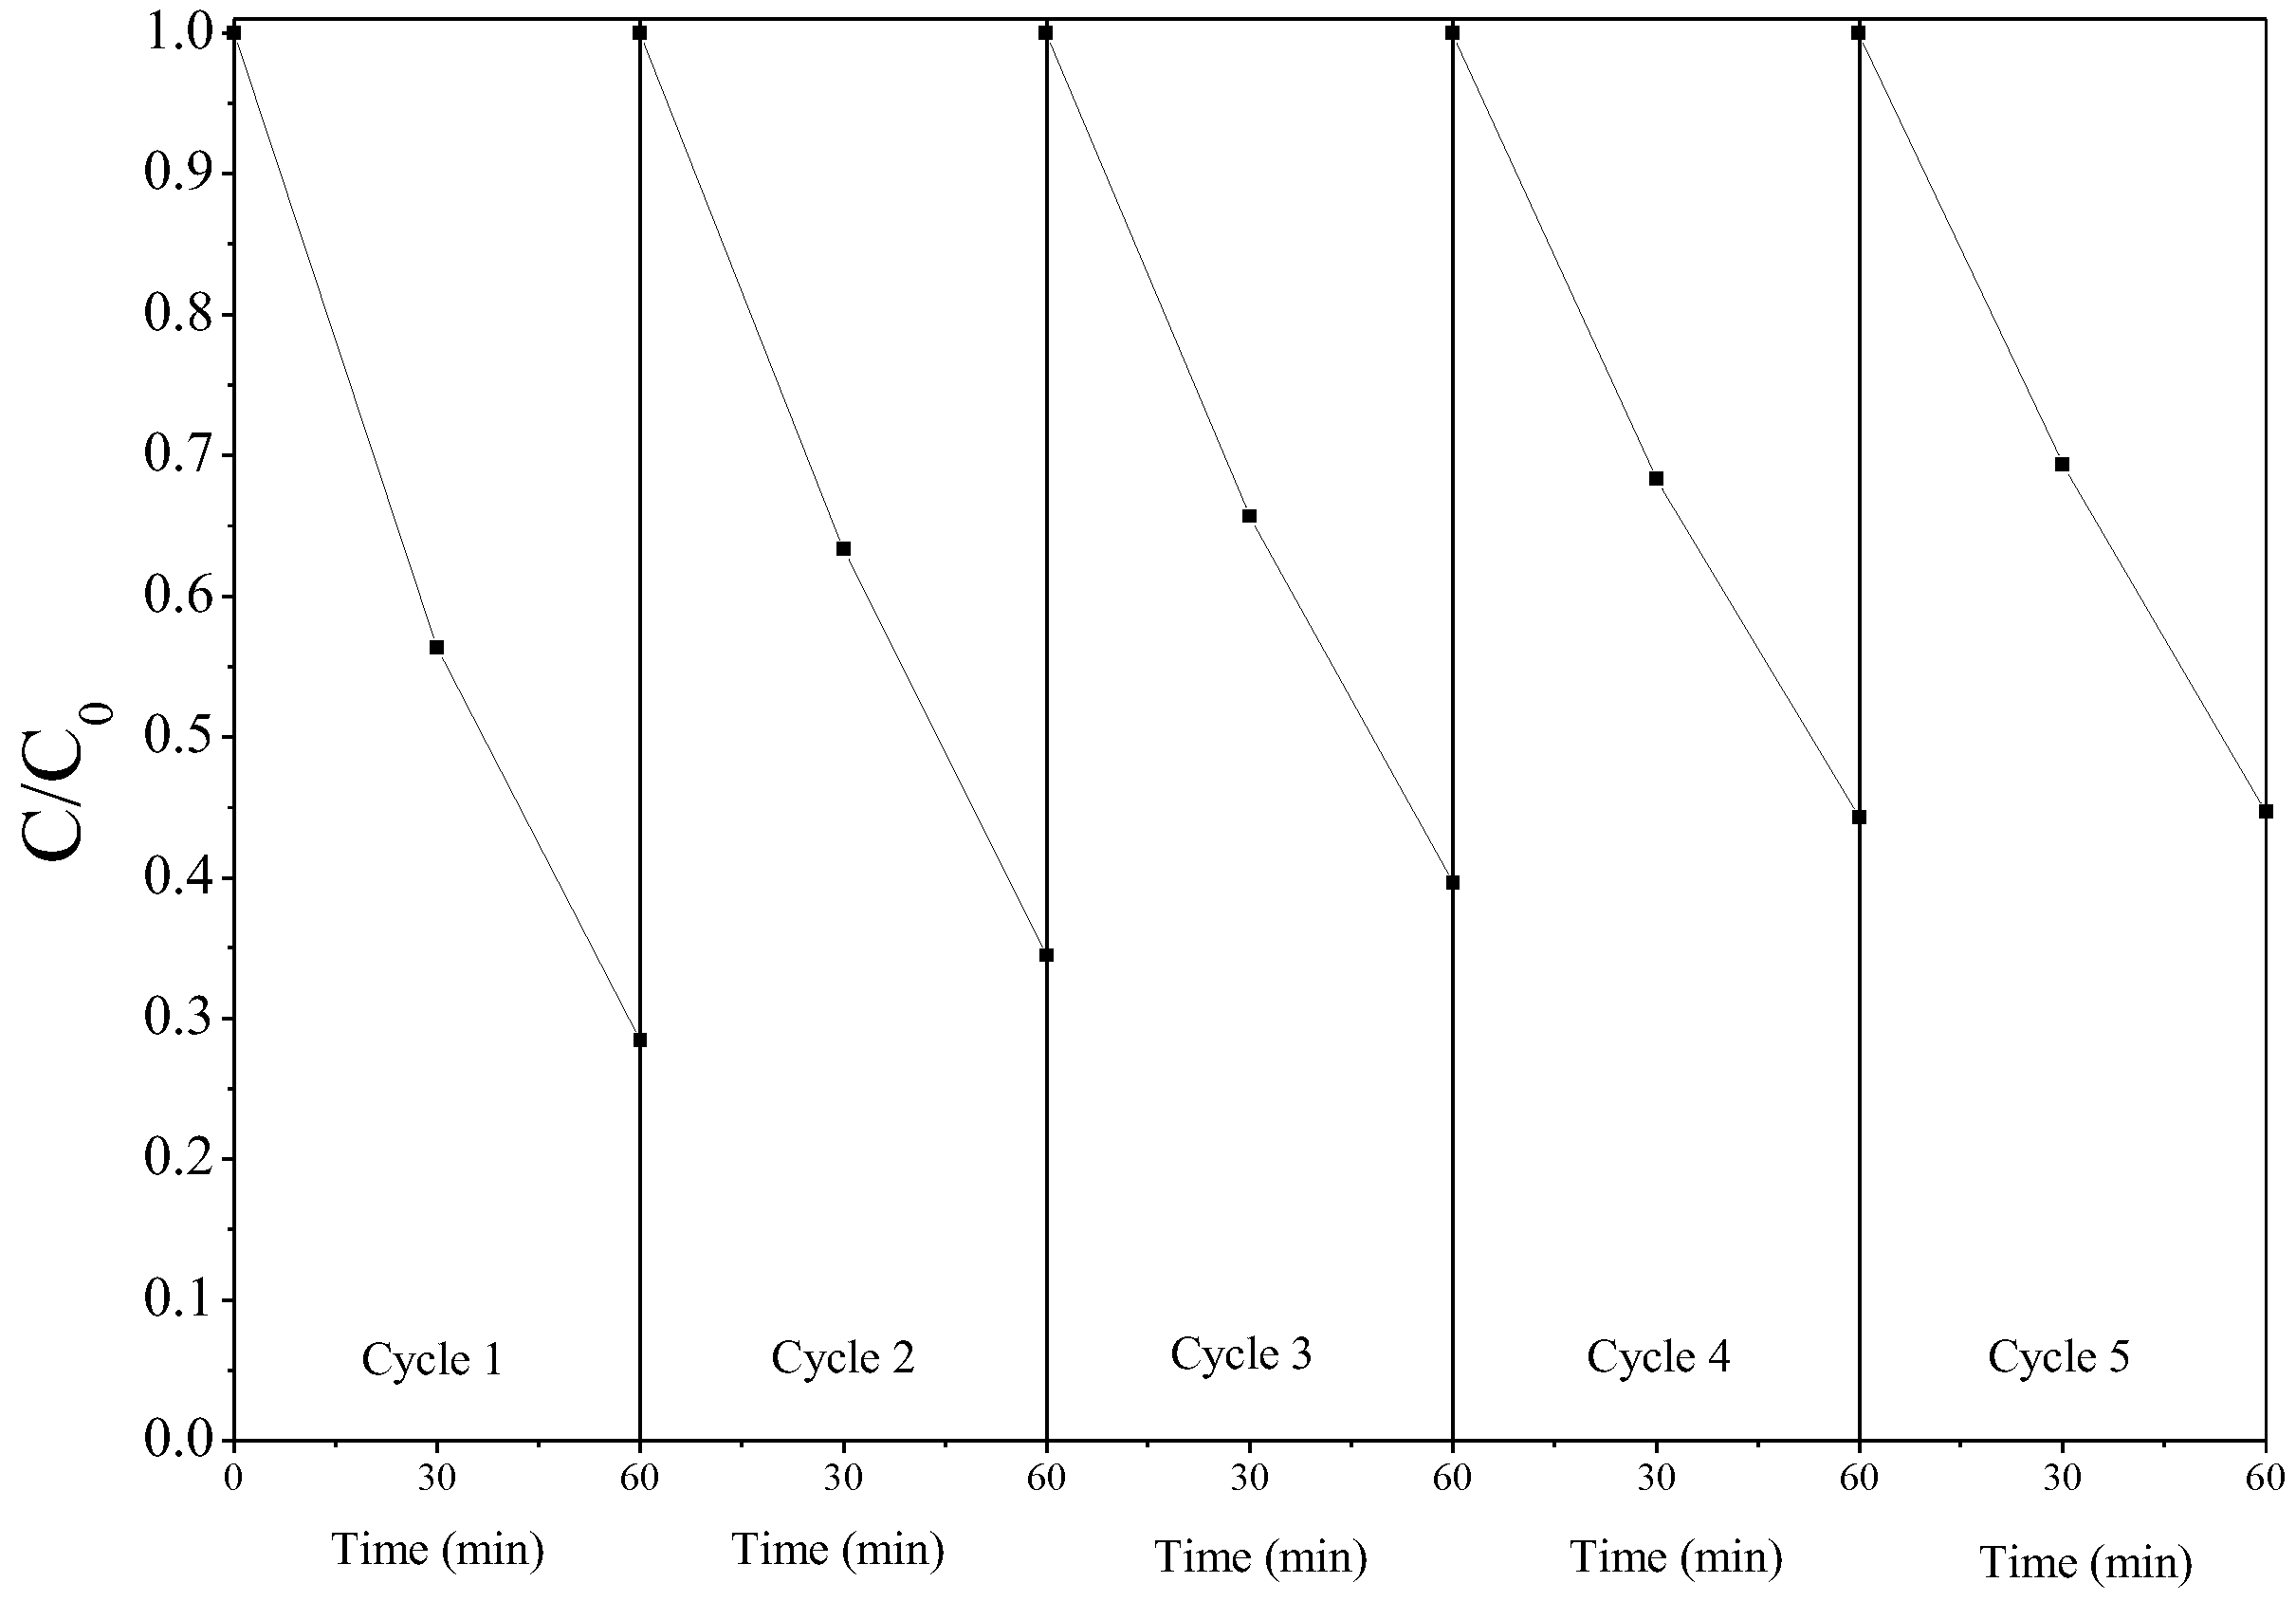
Reusability Tests
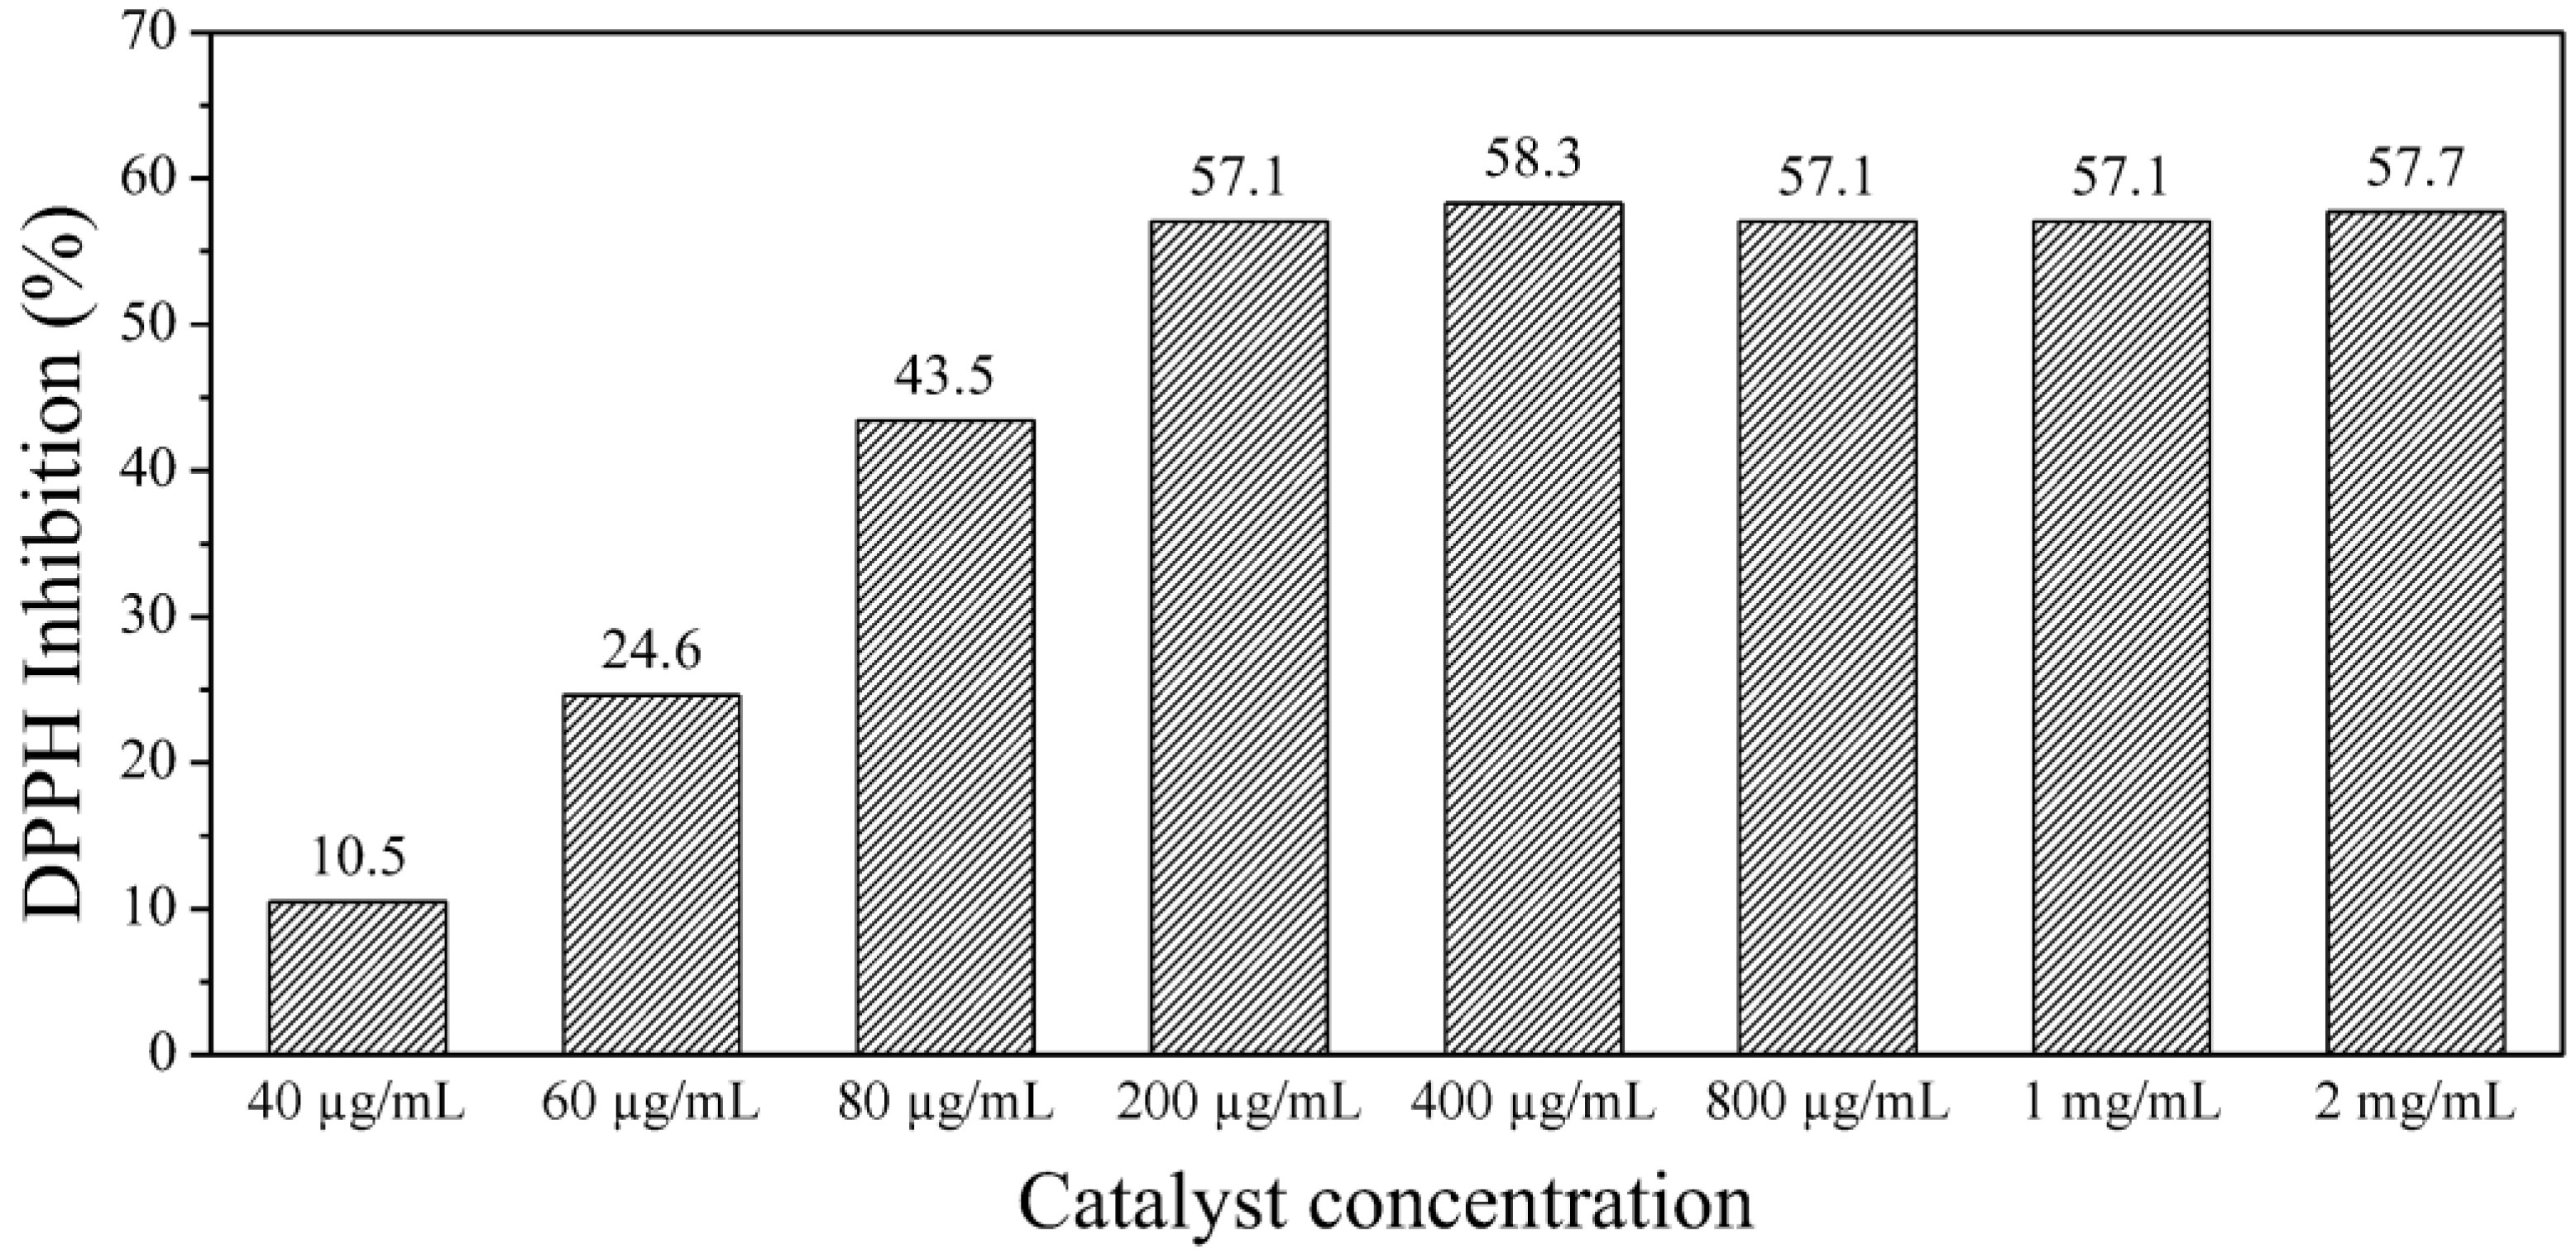
2.4. DPPH Assays: Antioxidant Capacity
2.5. Methylene Blue Adsorption Tests
3. Materials and Methods
3.1. Chemicals
3.2. Synthesis of the Catalysts
3.3. Characterization of the Photocatalysts
3.4. Desing of Experiments (DoE)
3.5. Photocatalytic Activity Tests
3.6. High-Performance Liquid Chromatography (HPLC)
3.7. Quenching Experiments
3.8. DPPH Assays
3.9. Methylene Blue Adsorptions Tests
4. Conclusions
Supplementary Materials
Author Contributions
Funding
Data Availability Statement
Acknowledgments
Conflicts of Interest
References
- Boulkhessaim, S.; Gacem, A.; Khan, S.H.; Amari, A.; Yadav, V.K.; Harharah, H.N.; Elkhaleefa, A.M.; Yadav, K.K.; Rather, S.U.; Ahn, H.J.; et al. Emerging Trends in the Remediation of Persistent Organic Pollutants Using Nanomaterials and Related Processes: A Review. Nanomaterials 2022, 12, 2148. [Google Scholar] [CrossRef] [PubMed]
- Aravind Kumar, J.; Krithiga, T.; Sathish, S.; Renita, A.A.; Prabu, D.; Lokesh, S.; Geetha, R.; Namasivayam, S.K.R.; Sillanpaa, M. Persistent Organic Pollutants in Water Resources: Fate, Occurrence, Characterization and Risk Analysis. Sci. Total Environ. 2022, 831, 154808. [Google Scholar] [CrossRef] [PubMed]
- Abreu, E.; Fidelis, M.Z.; Fuziki, M.E.; Malikoski, R.M.; Mastsubara, M.C.; Imada, R.E.; Diaz de Tuesta, J.L.; Gomes, H.T.; Anziliero, M.D.; Baldykowski, B.; et al. Degradation of Emerging Contaminants: Effect of Thermal Treatment on Nb2O5 as Photocatalyst. J. Photochem. Photobiol. A Chem. 2021, 419, 113484. [Google Scholar] [CrossRef]
- Gholamian, S.; Hamzehloo, M.; Farrokhnia, A. Enhanced Visible-Light Photocatalysis of TiO2/Fe3O4/BiOI Nanocomposites as Magnetically Recoverable for the Degradation of Dye Pollutants. J. Environ. Chem. Eng. 2021, 9, 104937. [Google Scholar] [CrossRef]
- Olea, M.A.U.; Bueno, J.D.J.P.; Pérez, A.X.M. Nanometric and Surface Properties of Semiconductors Correlated to Photocatalysis and Photoelectrocatalysis Applied to Organic Pollutants—A Review. J. Environ. Chem. Eng. 2021, 9, 106480. [Google Scholar] [CrossRef]
- Rabani, I.; Tahir, M.S.; Afzal, F.; Truong, H.B.; Kim, M.; Seo, Y.S. High-Efficient Mineralization Performance of Photocatalysis Activity towards Organic Pollutants over Ruthenium Nanoparticles Stabilized by Metal Organic Framework. J. Environ. Chem. Eng. 2023, 11, 109235. [Google Scholar] [CrossRef]
- Akpan, U.G.; Hameed, B.H. Parameters Affecting the Photocatalytic Degradation of Dyes Using TiO2-Based Photocatalysts: A Review. J. Hazard. Mater. 2009, 170, 520–529. [Google Scholar] [CrossRef]
- Al-Mamun, M.R.; Kader, S.; Islam, M.S.; Khan, M.Z.H. Photocatalytic Activity Improvement and Application of UV-TiO2 Photocatalysis in Textile Wastewater Treatment: A Review. J. Environ. Chem. Eng. 2019, 7, 103248. [Google Scholar] [CrossRef]
- Prado, A.G.S.; Bolzon, L.B.; Pedroso, C.P.; Moura, A.O.; Costa, L.L. Nb2O5 as Efficient and Recyclable Photocatalyst for Indigo Carmine Degradation. Appl. Catal. B 2008, 82, 219–224. [Google Scholar] [CrossRef]
- Marques, R.R.N.; Sampaio, M.J.; Carrapiço, P.M.; Silva, C.G.; Morales-Torres, S.; Dražić, G.; Faria, J.L.; Silva, A.M.T. Photocatalytic Degradation of Caffeine: Developing Solutions for Emerging Pollutants. Catal. Today 2013, 209, 108–115. [Google Scholar] [CrossRef]
- Chen, D.; Cheng, Y.; Zhou, N.; Chen, P.; Wang, Y.; Li, K.; Huo, S.; Cheng, P.; Peng, P.; Zhang, R.; et al. Photocatalytic Degradation of Organic Pollutants Using TiO2-Based Photocatalysts: A Review. J. Clean. Prod. 2020, 268, 121725. [Google Scholar] [CrossRef]
- Hashimoto, K.; Irie, H.; Fujishima, A. TiO2 Photocatalysis: A Historical Overview and Future Prospects. Jpn. J. Appl. Phys. 2005, 44, 8269–8285. [Google Scholar] [CrossRef]
- Raba, A.M.; Bautista-Ruíz, J.; Joya, M.R. Synthesis and Structural Properties of Niobium Pentoxide Powders: A Comparative Study of the Growth Process. Mater. Res. 2016, 19, 1381–1387. [Google Scholar] [CrossRef]
- Zhao, Y.; Eley, C.; Hu, J.; Foord, J.S.; Ye, L.; He, H.; Tsang, S.C.E. Shape-Dependent Acidity and Photocatalytic Activity of Nb2O5 Nanocrystals with an Active TT (001) Surface. Angew. Chem. Int. Ed. 2012, 51, 3846–3849. [Google Scholar] [CrossRef] [PubMed]
- Castro, D.C.; Cavalcante, R.P.; Jorge, J.; Martines, M.A.U.; Oliveira, L.C.S.; Casagrande, G.A.; Machulek, A. Synthesis and Characterization of Mesoporous Nb2O5 and Its Application for Photocatalytic Degradation of the Herbicide Methylviologen. J. Braz. Chem. Soc. 2016, 27, 303–313. [Google Scholar] [CrossRef]
- Sacco, O.; Murcia, J.J.; Lara, A.E.; Hernández-Laverde, M.; Rojas, H.; Navío, J.A.; Hidalgo, M.C.; Vaiano, V. Pt–TiO2–Nb2O5 Heterojunction as Effective Photocatalyst for the Degradation of Diclofenac and Ketoprofen. Mater. Sci. Semicond. Process 2020, 107, 104839. [Google Scholar] [CrossRef]
- Rafael, R.A.; Noronha, F.B.; Gaspar, A.B. Synthesis and Characterization of Ti-Nb2O5 Catalysts for Discoloration Reaction of Bromophenol Blue and Indigo Carmine Dyes. Top. Catal. 2020, 63, 1066–1076. [Google Scholar] [CrossRef]
- De Andrade, F.V.; De Lima, G.M.; Augusti, R.; Coelho, M.G.; Assis, Y.P.Q.; Machado, I.R.M. A New Material Consisting of TiO2 Supported on Nb2O5 as Photocatalyst for the Degradation of Organic Contaminants in Aqueous Medium. J. Environ. Chem. Eng. 2014, 2, 2352–2358. [Google Scholar] [CrossRef]
- López, A.L.B.; Castro, I.M. Niobium-Titanium-Based Photocatalysts: Its Potentials for Free Cyanide Oxidation in Residual Aqueous Effluent. Front. Chem. 2020, 8, 499621. [Google Scholar] [CrossRef]
- Topare, N.S.; Raut, S.J.; Khedkar, S.V.; Renge, V.C. A Study of Process Variables for the Photocatalytic Degradation of Rhodamine-B Using TiO2 and Nb2O5. J. Indian. Chem. Soc. 2013, 90, 2193–2198. [Google Scholar]
- Fontana, K.B.K.B.; Chaves, E.S.E.S.; Kosera, V.S.V.S.; Lenzi, G.G.G.G. Barium Removal by Photocatalytic Process: An Alternative for Water Treatment. J. Water Process Eng. 2018, 22, 163–171. [Google Scholar] [CrossRef]
- Cui, H.; Dwight, K.; Soled, S.; Wold, A. Surface Acidity and Photocatalytic Activity of Nb2O5/TiO2 Photocatalysts. J. Solid. State Chem. 1995, 115, 187–191. [Google Scholar] [CrossRef]
- Ferraz, N.P.; Marcos, F.C.F.; Nogueira, A.E.; Martins, A.S.; Lanza, M.R.V.; Assaf, E.M.; Asencios, Y.J.O. Hexagonal-Nb2O5/Anatase-TiO2 Mixtures and Their Applications in the Removal of Methylene Blue Dye under Various Conditions. Mater. Chem. Phys. 2017, 198, 331–340. [Google Scholar] [CrossRef]
- Yan, J.; Wu, G.; Guan, N.; Li, L. Nb2O5/TiO2 Heterojunctions: Synthesis Strategy and Photocatalytic Activity. Appl. Catal. B 2014, 152–153, 280–288. [Google Scholar] [CrossRef]
- Ferrari-Lima, A.M.; Marques, R.G.; Gimenes, M.L.; Fernandes-Machado, N.R.C. Synthesis, Characterisation and Photocatalytic Activity of N-Doped TiO2-Nb2O5 Mixed Oxides. Catal. Today 2015, 254, 119–128. [Google Scholar] [CrossRef]
- Sedneva, T.A.; Lokshin, E.P.; Belikov, M.L.; Belyaevskii, A.T. TiO2- and Nb2O5-Based Photocatalytic Composites. Inorg. Mater. 2013, 49, 382–389. [Google Scholar] [CrossRef]
- Bi, X.; Du, G.; Kalam, A.; Sun, D.; Zhao, W.; Yu, Y.; Su, Q.; Xu, B.; Al-Sehemi, A.G. Constructing Anatase TiO2/Amorphous Nb2O5 Heterostructures to Enhance Photocatalytic Degradation of Acetaminophen and Nitrogen Oxide. J. Colloid. Interface Sci. 2021, 601, 346–354. [Google Scholar] [CrossRef]
- Shiraishi, Y.; Imai, J.; Yasumoto, N.; Sakamoto, H.; Tanaka, S.; Ichikawa, S.; Hirai, T. Doping of Nb5+ Species at the Au-TiO2 Interface for Plasmonic Photocatalysis Enhancement. Langmuir 2019, 35, 5455–5462. [Google Scholar] [CrossRef]
- Ücker, C.L.; Riemke, F.; Goetzke, V.; Moreira, M.L.; Raubach, C.W.; Longo, E.; Cava, S. Facile Preparation of Nb2O5/TiO2 Heterostructures for Photocatalytic Application. Chem. Phys. Impact 2022, 4, 100079. [Google Scholar] [CrossRef]
- Ahmad, A.; Shah, J.A.; Buzby, S.; Shah, S.I. Structural Effects of Codoping of Nb and Sc in Titanium Dioxide Nanoparticles. Eur. J. Inorg. Chem. 2008, 2008, 948–953. [Google Scholar] [CrossRef]
- Brahimi, R.; Bessekhouad, Y.; Bouguelia, A.; Trari, M. CuAlO2/TiO2 Heterojunction Applied to Visible Light H2 Production. J. Photochem. Photobiol. A Chem. 2007, 186, 242–247. [Google Scholar] [CrossRef]
- Xu, Y.; Schoonen, M.A.A. The Absolute Energy Positions of Conduction and Valence Bands of Selected Semiconducting Minerals. Am. Mineral. 2000, 85, 543–556. [Google Scholar] [CrossRef]
- Gondal, M.A.; Sayeed, M.N.; Seddigi, Z. Laser Enhanced Photocatalytic Removal of Phenol from Water Using p-Type NiO Semiconductor Catalyst. J. Hazard. Mater. 2008, 155, 83–89. [Google Scholar] [CrossRef]
- Ratola, N.; Cincinelli, A.; Alves, A.; Katsoyiannis, A. Occurrence of Organic Microcontaminants in the Wastewater Treatment Process. A Mini Review. J. Hazard. Mater. 2012, 239–240, 1–18. [Google Scholar] [CrossRef]
- Nikolopoulou, V.; Ajibola, A.S.; Aalizadeh, R.; Thomaidis, N.S. Wide-Scope Target and Suspect Screening of Emerging Contaminants in Sewage Sludge from Nigerian WWTPs by UPLC-QToF-MS. Sci. Total Environ. 2023, 857, 159529. [Google Scholar] [CrossRef] [PubMed]
- Vione, D.; Picatonotto, T.; Carlotti, M.E. Photodegradation of Phenol and Salicylic Acid by Coated Rutile-Based Pigments: A New Approach for the Assessment of Sunscreen Treatment Efficiency. J. Cosmet. Sci. 2003, 54, 513–524. [Google Scholar] [PubMed]
- Bertinetti, S.; Minella, M.; Barsotti, F.; Maurino, V.; Minero, C.; Özensoy, E.; Vione, D. A Methodology to Discriminate between Hydroxyl Radical-Induced Processes and Direct Charge-Transfer Reactions in Heterogeneous Photocatalysis. J. Adv. Oxid. Technol. 2016, 19, 236–245. [Google Scholar] [CrossRef]
- Chhor, K.; Bocquet, J.F.; Colbeau-Justin, C. Comparative Studies of Phenol and Salicylic Acid Photocatalytic Degradation: Influence of Adsorbed Oxygen. Mater. Chem. Phys. 2004, 86, 123–131. [Google Scholar] [CrossRef]
- Barbero, N.; Vione, D. Why Dyes Should Not Be Used to Test the Photocatalytic Activity of Semiconductor Oxides. Environ. Sci. Technol. 2016, 50, 2130–2131. [Google Scholar] [CrossRef]
- Karimi, F.; Rezaei-savadkouhi, N.; Uçar, M.; Aygun, A.; Elhouda Tiri, R.N.; Meydan, I.; Aghapour, E.; Seckin, H.; Berikten, D.; Gur, T.; et al. Efficient Green Photocatalyst of Silver-Based Palladium Nanoparticles for Methyle Orange Photodegradation, Investigation of Lipid Peroxidation Inhibition, Antimicrobial, and Antioxidant Activity. Food Chem. Toxicol. 2022, 169, 113406. [Google Scholar] [CrossRef]
- Sinha, T.; Ahmaruzzaman, M.; Adhikari, P.P.; Bora, R. Green and Environmentally Sustainable Fabrication of Ag-SnO2 Nanocomposite and Its Multifunctional Efficacy as Photocatalyst and Antibacterial and Antioxidant Agent. ACS Sustain. Chem. Eng. 2017, 5, 4645–4655. [Google Scholar] [CrossRef]
- Eskikaya, O.; Ozdemir, S.; Tollu, G.; Dizge, N.; Ramaraj, R.; Manivannan, A.; Balakrishnan, D. Synthesis of Two Different Zinc Oxide Nanoflowers and Comparison of Antioxidant and Photocatalytic Activity. Chemosphere 2022, 306, 135389. [Google Scholar] [CrossRef] [PubMed]
- Muthuvel, A.; Said, N.M.; Jothibas, M.; Gurushankar, K.; Mohana, V. Microwave-Assisted Green Synthesis of Nanoscaled Titanium Oxide: Photocatalyst, Antibacterial and Antioxidant Properties. J. Mater. Sci. Mater. Electron. 2021, 32, 23522–23539. [Google Scholar] [CrossRef]
- Hwang, K.J.; Lee, J.W.; Shim, W.G.; Jang, H.D.; Lee, S.I.; Yoo, S.J. Adsorption and Photocatalysis of Nanocrystalline TiO2 Particles Prepared by Sol-Gel Method for Methylene Blue Degradation. Adv. Powder Technol. 2012, 23, 414–418. [Google Scholar] [CrossRef]
- Yukselen, Y.; Kaya, A. Suitability of the Methylene Blue Test for Surface Area, Cation Exchange Capacity and Swell Potential Determination of Clayey Soils. Eng. Geol. 2008, 102, 38–45. [Google Scholar] [CrossRef]
- Yener, N.; Bier, C.; Önal, M.; Sarikaya, Y. Simultaneous Determination of Cation Exchange Capacity and Surface Area of Acid Activated Bentonite Powders by Methylene Blue Sorption. Appl. Surf. Sci. 2012, 258, 2534–2539. [Google Scholar] [CrossRef]
- Gürses, A.; Karaca, S.; Doǧar, Ç.; Bayrak, R.; Açikyildiz, M.; Yalçin, M. Determination of Adsorptive Properties of Clay/Water System: Methylene Blue Sorption. J. Colloid. Interface Sci. 2004, 269, 310–314. [Google Scholar] [CrossRef]
- da Silva, A.L.; Hotza, D.; Castro, R.H.R.R. Surface Energy Effects on the Stability of Anatase and Rutile Nanocrystals: A Predictive Diagram for Nb2O5-Doped-TiO2. Appl. Surf. Sci. 2017, 393, 103–109. [Google Scholar] [CrossRef]
- Da Silva, A.L.; Muche, D.N.F.; Dey, S.; Hotza, D.; Castro, R.H.R. Photocatalytic Nb2O5-Doped TiO2 Nanoparticles for Glazed Ceramic Tiles. Ceram. Int. 2016, 42, 5113–5122. [Google Scholar] [CrossRef]
- Kumari, N.; Gaurav, K.; Samdarshi, S.K.; Bhattacharyya, A.S.; Paul, S.; Rajbongshi, B.M.; Mohanty, K. Dependence of Photoactivity of Niobium Pentoxide (Nb2O5) on Crystalline Phase and Electrokinetic Potential of the Hydrocolloid. Sol. Energy Mater. Sol. Cells 2020, 208, 110408. [Google Scholar] [CrossRef]
- Atanacio, A.J.; Bak, T.; Nowotny, J. Niobium Segregation in Niobium-Doped Titanium Dioxide (Rutile). J. Phys. Chem. C 2014, 118, 11174–11185. [Google Scholar] [CrossRef]
- Vaizoğullar, A.İ. Ternary CdS/MoS2/ZnO Photocatalyst: Synthesis, Characterization and Degradation of Ofloxacin Under Visible Light Irradiation. J. Inorg. Organomet. Polym. Mater. 2020, 30, 4129–4141. [Google Scholar] [CrossRef]
- Rahman, M.M.; Muttakin, M.; Pal, A.; Shafiullah, A.Z.; Saha, B.B. A Statistical Approach to Determine Optimal Models for IUPAC-Classified Adsorption Isotherms. Energies 2019, 12, 4565. [Google Scholar] [CrossRef]
- Yurdakal, S.; Garlisi, C.; Özcan, L.; Bellardita, M.; Palmisano, G. (Photo)Catalyst Characterization Techniques: Adsorption Isotherms and BET, SEM, FTIR, UV-Vis, Photoluminescence, and Electrochemical Characterizations. In Heterogeneous Photocatalysis: Relationships with Heterogeneous Catalysis and Perspectives; Elsevier: Amsterdam, The Netherlands, 2019; pp. 87–152. ISBN 9780444640154. [Google Scholar]
- Gomes, G.H.M.; Mohallem, N.D.S. Insights into the TT-Nb2O5 Crystal Structure Behavior. Mater. Lett. 2022, 318, 132136. [Google Scholar] [CrossRef]
- Maver, K.; Arčon, I.; Fanetti, M.; Emin, S.; Valant, M.; Lavrenčič Štangar, U. Improved Photocatalytic Activity of Anatase-Rutile Nanocomposites Induced by Low-Temperature Sol-Gel Sn-Modification of TiO2. Catal. Today 2021, 361, 124–129. [Google Scholar] [CrossRef]
- Souza, R.P.; Ambrosio, E.; Souza, M.T.F.; Freitas, T.K.F.S.; Ferrari-Lima, A.M.; Garcia, J.C. Solar Photocatalytic Degradation of Textile Effluent with TiO2, ZnO, and Nb2O5 Catalysts: Assessment of Photocatalytic Activity and Mineralization. Environ. Sci. Pollut. Res. 2017, 24, 12691–12699. [Google Scholar] [CrossRef]
- Hu, R.; Zhang, L.; Hu, J. Study on the Kinetics and Transformation Products of Salicylic Acid in Water via Ozonation. Chemosphere 2016, 153, 394–404. [Google Scholar] [CrossRef]
- Fuziki, M.E.K.; Ribas, L.S.; Tusset, A.M.; Brackmann, R.; Dos Santos, O.A.A.; Lenzi, G.G. Pharmaceutical Compounds Photolysis: PH Influence. Heliyon 2023, 9, e13678. [Google Scholar] [CrossRef]
- Lu, J.; Jin, H.; Dai, Y.; Yang, K.; Huang, B. Effect of Electronegativity and Charge Balance on the Visible-Light- Responsive Photocatalytic Activity of Nonmetal Doped Anatase TiO2. Int. J. Photoenergy 2012, 2012, 928503. [Google Scholar] [CrossRef]
- Parr, R.G.; Pearson, R.G. Absolute Hardness: Companion Parameter to Absolute Electronegativity; ACS Publications: Washington, DC, USA, 1983; Volume 105. [Google Scholar]
- Xian, T.; Yang, H.; Di, L.J.; Dai, J.F. Enhanced Photocatalytic Activity of BaTiO3@g-C3N4 for the Degradation of Methyl Orange under Simulated Sunlight Irradiation. J. Alloys Compd. 2015, 622, 1098–1104. [Google Scholar] [CrossRef]
- Chang, C.Y.; Hsieh, Y.H.; Hsieh, L.L.; Yao, K.S.; Cheng, T.C. Establishment of Activity Indicator of TiO2 Photocatalytic Reaction-Hydroxyl Radical Trapping Method. J. Hazard. Mater. 2009, 166, 897–903. [Google Scholar] [CrossRef] [PubMed]
- Vamathevan, V.; Amal, R.; Beydoun, D.; Low, G.; Mcevoy, S. Photocatalytic Oxidation of Organics in Water Using Pure and Silver-Modified Titanium Dioxide Particles. J. Photochem. Photobiol. A Chem. 2002, 148, 233–245. [Google Scholar] [CrossRef]
- Bracco, E.; Butler, M.; Carnelli, P.; Candal, R. TiO2 and N-TiO2-Photocatalytic Degradation of Salicylic Acid in Water: Characterization of Transformation Products by Mass Spectrometry. Environ. Sci. Pollut. Res. 2020, 27, 28469–28479. [Google Scholar] [CrossRef] [PubMed]
- Zupanc, M.; Petkovšek, M.; Zevnik, J.; Kozmus, G.; Šmid, A.; Dular, M. Anomalies Detected during Hydrodynamic Cavitation When Using Salicylic Acid Dosimetry to Measure Radical Production. Chem. Eng. J. 2020, 396, 125389. [Google Scholar] [CrossRef]
- Plavac, B.; Grčić, I.; Brnardić, I.; Grozdanić, V.; Papić, S. Kinetic Study of Salicylic Acid Photocatalytic Degradation Using Sol–Gel Anatase Thin Film with Enhanced Long-Term Activity. React. Kinet. Mech. Catal. 2017, 120, 385–401. [Google Scholar] [CrossRef]
- Leite dos Santos, A.; Almeida Dias, J.; Tiago dos Santos Tavares, G.; Romito de Mendonça, V.; Giraldi, T.R. Niobium Pentoxide as an Adsorbent for Methylene Blue Removal: Synthesis, Characterization and Thermal Stability. Mater. Chem. Phys. 2023, 301, 127659. [Google Scholar] [CrossRef]
- Tamura, H.; Mita, K.; Tanaka, A.; Ito, M. Mechanism of Hydroxylation of Metal Oxide Surfaces. J. Colloid. Interface Sci. 2001, 243, 202–207. [Google Scholar] [CrossRef]
- Chu, L.; Liu, W.; Yu, A.; Qin, Z.; Hu, R.; Shu, H.; Luo, Q.P.; Min, Y.; Yang, J.; Li, X. Effect of TiO2 Modification on Urchin-like Orthorhombic Nb2O5 Nanospheres as Photoelectrodes in Dye-Sensitized Solar Cells. Solar Energy 2017, 153, 584–589. [Google Scholar] [CrossRef]
- Oliveira, I.R.; Barbosa, A.M.; Santos, K.W.; Lança, M.C.; Lima, M.M.R.A.; Vieira, T.; Silva, J.C.; Borges, J.P. Properties of Strontium-Containing BG 58S Produced by Alkali-Mediated Sol-Gel Process. Ceram. Int. 2022, 48, 11456–11465. [Google Scholar] [CrossRef]
- Khalil, K.M.S.; Zaki, M.I. Synthesis of High Surface Area Titania Powders via Basic Hydrolysis of Titanium(IV) Isopropoxide. Powder Technol. 1997, 92, 233–239. [Google Scholar] [CrossRef]
- Ghoreishian, S.M.; Seeta Rama Raju, G.; Pavitra, E.; Kwak, C.H.; Han, Y.K.; Huh, Y.S. Controlled Synthesis of Hierarchical α-Nickel Molybdate with Enhanced Solar-Light-Responsive Photocatalytic Activity: A Comprehensive Study on the Kinetics and Effect of Operational Factors. Ceram. Int. 2019, 45, 12041–12052. [Google Scholar] [CrossRef]
- Szekeres, M.; Tombácz, E. Surface Charge Characterization of Metal Oxides by Potentiometric Acid-Base Titration, Revisited Theory and Experiment. Colloids Surf. A Physicochem. Eng. Asp. 2012, 414, 302–313. [Google Scholar] [CrossRef]
- Fuziki, M.E.K.; Brackmann, R.; Dias, D.T.; Tusset, A.M.; Specchia, S.; Lenzi, G.G. Effects of Synthesis Parameters on the Properties and Photocatalytic Activity of the Magnetic Catalyst TiO2/CoFe2O4 Applied to Selenium Photoreduction. J. Water Process Eng. 2021, 42, 102163. [Google Scholar] [CrossRef]
- Makuła, P.; Pacia, M.; Macyk, W. How To Correctly Determine the Band Gap Energy of Modified Semiconductor Photocatalysts Based on UV-Vis Spectra. J. Phys. Chem. Lett. 2018, 9, 6814–6817. [Google Scholar] [CrossRef] [PubMed]
- Gervasi, S.; Blangetti, N.; Freyria, F.S.; Guastella, S.; Bonelli, B. Undoped and Fe-Doped Anatase/Brookite TiO2 Mixed Phases, Obtained by a Simple Template-Free Synthesis Method: Physico-Chemical Characterization and Photocatalytic Activity towards Simazine Degradation. Catalysts 2023, 13, 667. [Google Scholar] [CrossRef]
- Shenoy, S.; Farahat, M.M.; Chuaicham, C.; Sekar, K.; Ramasamy, B.; Sasaki, K. Mixed-Phase Fe2O3 Derived from Natural Hematite Ores/C3N4 Z-Scheme Photocatalyst for Ofloxacin Removal. Catalysts 2023, 13, 792. [Google Scholar] [CrossRef]
- Zangeneh, H.; Mousavi, S.A.; Eskandari, P.; Amarloo, E.; Farghelitiyan, J.; Mohammadi, S. Comparative Study on Photocatalytic Performance of TiO2 Doped with Different Amino Acids in Degradation of Antibiotics. Water 2023, 15, 535. [Google Scholar] [CrossRef]
- Li, X.; Wan, T.; Qiu, J.; Wei, H.; Qin, F.; Wang, Y.; Liao, Y.; Huang, Z.; Tan, X. In-Situ Photocalorimetry-Fluorescence Spectroscopy Studies of RhB Photocatalysis over Z-Scheme g-C3N4@Ag@Ag3PO4Nanocomposites: A Pseudo-Zero-Order Rather than a First-Order Process. Appl. Catal. B 2017, 217, 591–602. [Google Scholar] [CrossRef]
- Wang, Y.; Zhang, Y.; Zhang, T.C.; Xiang, G.; Wang, X.; Yuan, S. Removal of Trace Arsenite through Simultaneous Photocatalytic Oxidation and Adsorption by Magnetic Fe3O4@PpPDA@TiO2Core-Shell Nanoparticles. ACS Appl. Nano Mater. 2020, 3, 8495–8504. [Google Scholar] [CrossRef]
- Ghaffar, S.; Abbas, A.; Naeem-ul-Hassan, M.; Assad, N.; Sher, M.; Ullah, S.; Alhazmi, H.A.; Najmi, A.; Zoghebi, K.; Al Bratty, M.; et al. Improved Photocatalytic and Antioxidant Activity of Olive Fruit Extract-Mediated ZnO Nanoparticles. Antioxidants 2023, 12, 1201. [Google Scholar] [CrossRef]
- Nawaz, M.; Almofty, S.A.; Qureshi, F. Preparation, Formation Mechanism, Photocatalytic, Cytotoxicity and Antioxidant Activity of Sodium Niobate Nanocubes. PLoS ONE 2018, 13, e0204061. [Google Scholar] [CrossRef] [PubMed]


| Catalyst | SBET m2 g−1 | Slangmuir m2 g−1 | Vtotal mm3 g−1 | Identified Phases | dm (nm) |
|---|---|---|---|---|---|
| 0Nb-0N-400 | 18 | 154 | 45 | Anatase | 27.0 |
| Rutile | 41.3 | ||||
| 0Nb-2N-400 | 18 | 229 | 49 | Anatase | 23.5 |
| 25Nb-0N-400 | 86 | 395 | 132 | Anatase | 10.2 |
| 25Nb-2N-400 | 86 | 601 | 178 | Anatase | 16.1 |
| 75Nb-0N-400 | 29 | 230 | 71 | Amorphous | - |
| 75Nb-2N-400 | 27 | 276 | 78 | Amorphous | - |
| 100Nb-0N-400 | 22 | 260 | 76 | TT-Nb2O5 | 32.5 |
| 100Nb-2N-400 | 20 | 215 | 72 | TT-Nb2O5 | 32.1 |
| 0Nb-0N-800 | 4 | 14 | 5 | Rutile | 96.1 |
| 0Nb-2N-800 | 3 | 19 | 6 | Rutile | 99.4 |
| 25Nb-0N-800 | 0 | 0 | 0 | Rutile | 77.3 |
| TiNb2O7 | 61.8 | ||||
| 25Nb-2N-800 | 0 | 0 | 0 | Rutile | 79.6 |
| TiNb2O7 | 92.9 | ||||
| 75Nb-0N-800 | 0 | 0 | 0 | TiNb2O7 | - |
| Ti2Nb10O29 | - | ||||
| 75Nb-2N-800 | 0 | 0 | 0 | TiNb2O7 | - |
| Ti2Nb10O29 | - | ||||
| 100Nb-0N-800 | 0 | 0 | 0 | Monoclinic Nb2O5 | 60.57 |
| 100Nb-2N-800 | 2 | 8 | 2 | Monoclinic Nb2O5 | 54.63 |
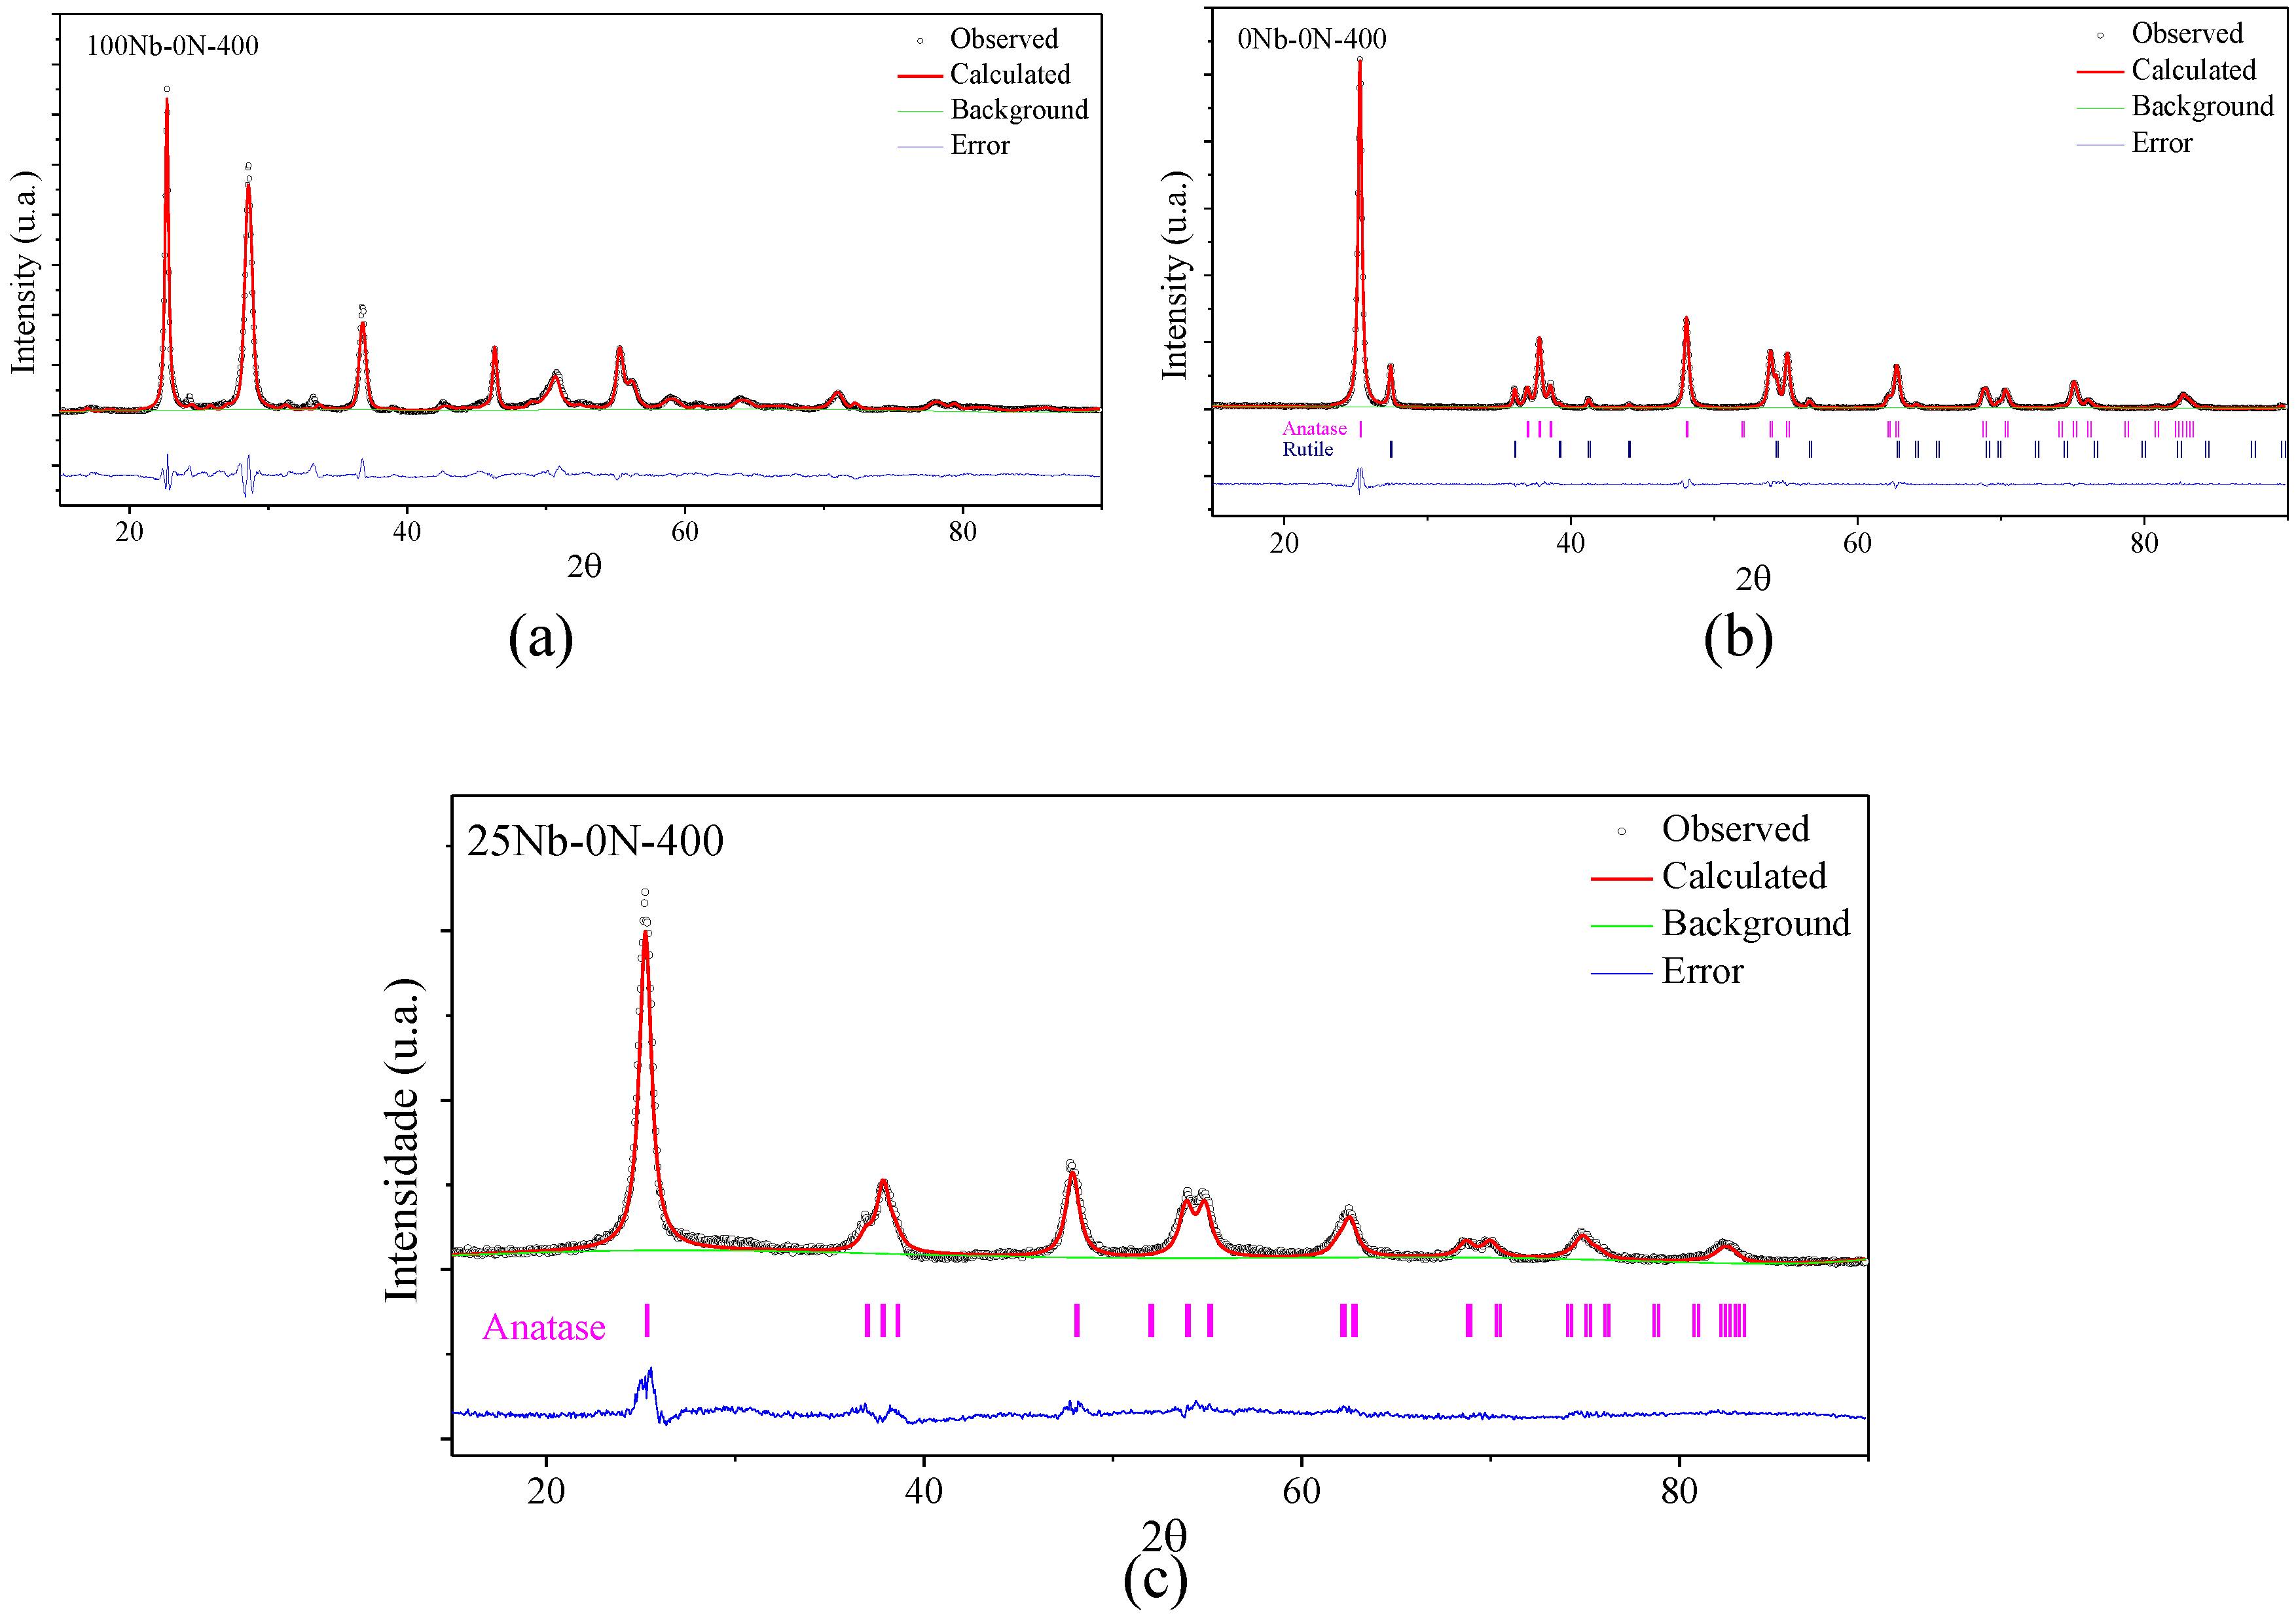
| χ2 | Sample | Phase | a | b | c | Alfa | Beta | Gamma | Volume |
|---|---|---|---|---|---|---|---|---|---|
| 1.271 | 0Nb-0N-400 | anatase | 3.784329 | 3.784329 | 9.511708 | 90 | 90 | 90 | 136.219 |
| rutile | 4.59335 | 4.59335 | 2.959285 | 90 | 90 | 90 | 62.438 | ||
| 2.901 | 25Nb-0N-400 | anatase | 3.805582 | 3.805582 | 9.524768 | 90 | 90 | 90 | 137.942 |
| 5.244 | 100Nb-0N-400 | TT-Nb2O5 | 6.221601 | 29.05318 | 3.926213 | 90 | 90 | 90 | 709.691 |
| Band Gap Energy (Eg) | ||
|---|---|---|
| Sample | Direct | Indirect |
| 0Nb-0N-400 | 3.04 | 2.94 |
| 0Nb-1N-400 | 3.04 | 2.94 |
| 0Nb-2N-400 | 3.04 | 2.93 |
| 12.5Nb-0N-400 | 3.04 | 2.98 |
| 12.5Nb-1N-400 | 3.16 | 3.04 |
| 12.5Nb-2N-400 | 3.17 | 3.01 |
| 25Nb-0N-400 | 3.12 | 2.98 |
| 25Nb-1N-400 | 3.18 | 3.03 |
| 25Nb-2N-400 | 3.17 | 3.00 |
| 100Nb-0N-400 | 3.14 | 3.01 |
| 100Nb-2N-400 | 3.11 | 2.99 |
| Sample | MB Removal % |
|---|---|
| 0Nb-0N-400 | 10.14 |
| 0Nb-1N-400 | 0.69 |
| 0Nb-2N-400 | 9.61 |
| 12.5Nb-0N-400 | 71.37 |
| 12.5Nb-1N-400 | 84.41 |
| 12.5Nb-2N-400 | 84.44 |
| 25Nb-0N-400 | 74.56 |
| 25Nb-1N-400 | 90.49 |
| 25Nb-2N-400 | 88.60 |
| 100Nb-0N-400 | 4.85 |
| 100Nb-2N-400 | 6.82 |
| Level (Coded Variables) | %Nb (Molar) | NH4OH:M (Molar Ratio) | Tcalc (°C) | pH (Photocatalytic Tests) |
|---|---|---|---|---|
| −1 | 25 | 0 | 400 | 3 |
| 0 | 50 | 1 | 600 | 5 |
| +1 | 75 | 2 | 800 | 7 |
| Level (Coded Variables) | %Nb (Molar) | NH4OH:M (Molar Ratio) | pH (Photocatalytic Tests) |
|---|---|---|---|
| −1 | 0 | 0 | 3 |
| 0 | 12.5 | 1 | 5 |
| +1 | 25 | 2 | 7 |
| Level (Coded Variables) | %Nb (Molar) | NH4OH:M (Molar Ratio) |
|---|---|---|
| −1 | 0 | 0 |
| 0 | 12.5 | 1 |
| +1 | 25 | 2 |
Disclaimer/Publisher’s Note: The statements, opinions and data contained in all publications are solely those of the individual author(s) and contributor(s) and not of MDPI and/or the editor(s). MDPI and/or the editor(s) disclaim responsibility for any injury to people or property resulting from any ideas, methods, instructions or products referred to in the content. |
© 2023 by the authors. Licensee MDPI, Basel, Switzerland. This article is an open access article distributed under the terms and conditions of the Creative Commons Attribution (CC BY) license (https://creativecommons.org/licenses/by/4.0/).
Share and Cite
Fuziki, M.E.K.; Ribas, L.S.; Abreu, E.; Fernandes, L.; dos Santos, O.A.A.; Brackmann, R.; de Tuesta, J.L.D.; Tusset, A.M.; Lenzi, G.G. N-Doped TiO2-Nb2O5 Sol–Gel Catalysts: Synthesis, Characterization, Adsorption Capacity, Photocatalytic and Antioxidant Activity. Catalysts 2023, 13, 1233. https://doi.org/10.3390/catal13091233
Fuziki MEK, Ribas LS, Abreu E, Fernandes L, dos Santos OAA, Brackmann R, de Tuesta JLD, Tusset AM, Lenzi GG. N-Doped TiO2-Nb2O5 Sol–Gel Catalysts: Synthesis, Characterization, Adsorption Capacity, Photocatalytic and Antioxidant Activity. Catalysts. 2023; 13(9):1233. https://doi.org/10.3390/catal13091233
Chicago/Turabian StyleFuziki, Maria E. K., Laura S. Ribas, Eduardo Abreu, Luciano Fernandes, Onélia A. A. dos Santos, Rodrigo Brackmann, Jose L. D. de Tuesta, Angelo M. Tusset, and Giane G. Lenzi. 2023. "N-Doped TiO2-Nb2O5 Sol–Gel Catalysts: Synthesis, Characterization, Adsorption Capacity, Photocatalytic and Antioxidant Activity" Catalysts 13, no. 9: 1233. https://doi.org/10.3390/catal13091233