Article

Using a Surface-Response Approach to Optimize the Photocatalytic Activity of rGO/g-C3N4 for Bisphenol A Degradation

by
Chubraider Xavier
1,
Bianca Rebelo Lopes
2,
Cleyryson de Sousa Lima
1,
Caue Ribeiro
3,* and
Eduardo Bessa Azevedo
1
1
Laboratório de Desenvolvimento de Tecnologias Ambientais (LDTAmb), Chemistry Institute of São Carlos (IQSC), University of São Paulo (USP), Avenida Trabalhador São-Carlense, 400—Centro, P.O. Box 780, São Carlos 13560-970, SP, Brazil
2
Department of Chemistry (DQ), Separare–Núcleo de Pesquisa em Cromatografia, Federal University of São Carlos (UFSCar), Rodovia Washington Luis, s/nº km 235—Monjolinho, P.O. Box 676, São Carlos 13565-905, SP, Brazil
3
Laboratório de Nanotecnologia para o Agronegócio—LNNA, Embrapa Instrumentation—Brazilian Agricultural Research Corporation, Rua XV de Novembro, nº 1.452—Centro, P.O. Box 741, São Carlos 13560-970, SP, Brazil
*
Author to whom correspondence should be addressed.
Catalysts 2023, 13(7), 1069; https://doi.org/10.3390/catal13071069
Submission received: 24 May 2023 / Revised: 24 June 2023 / Accepted: 29 June 2023 / Published: 4 July 2023

Abstract

:
Although environmental and clean energy research has identified graphitic carbon nitride impregnated with reduced graphene oxide (rGO/g-C3N4) as a potential, efficient non-metallic photocatalyst, its efficacy against Contaminants of Emerging Concern (CECs) is relatively unknown. This study reports an optimized photocatalyst (response surface methodology, RSM) to remove the plasticizer and endocrine disruptor bisphenol A (BPA) from water. The synthetic procedure included sonication of prepared particles of g-C3N4 and graphite oxide (rGO), followed by reduction with hydrazine (24 h reflux), increasing specific surface areas, and improving synthesis reproducibility. In optimal conditions, the produced photocatalyst (50 mg L–1) removed 90% of BPA (100 mL, 100 μg L−1) in 90 min (30 min in the dark + 60 min irradiated) using a UV source (centered at 365 nm, 26 W) and exhibiting pseudo-first-order kinetics. For comparison purposes, under the same experimental conditions, pure g-C3N4 removed 50% of the BPA solution. Radical scavenging tests identified the superoxide radical as the main reactive oxygen species involved in the degradation. Two major degradation products were identified by mass spectrometry, both of them less ecotoxic than BPA to a variety of test organisms, according to in silico estimations (ECOSAR 2.0).

Graphical Abstract

1. Introduction

The use of water resources is a subject for discussion and it is essential for any technological advancement. A total of 2.2 billion people lack safe drinking water and 4.2 billion lack wastewater treatment, causing the pollution of vital water sources. Therefore, developing water and wastewater treatment technologies is crucial [1].
Traditional water treatment involves floc coagulation, decantation, and disinfection; those processes cannot efficiently remove contaminants ranging from ng L−1 to μg L−1, concentrations usually not regulated by environmental agencies. Those pollutants are called Contaminants of Emerging Concern (CECs), and are reported to induce chronic effects in a variety of organisms [2]. Bisphenol A (BPA), a plasticizer used in many sectors, is one of them. BPA-contaminated water may cause infertility, obesity, cancer, and attention deficit hyperactivity disorder [3,4,5]. BPA is resistant to chlorination and ozonation [6].
Heterogeneous photocatalysis is a feasible BPA abatement approach that complements drinking water technologies. In this process, semiconductors absorb light to generate electron-hole pairs for redox processes, and the charge carrier recombination time mostly determines the process efficiency [7,8].
Titanium dioxide (TiO2) is the most common semiconductor used as a photocatalyst due to its low recombination rates. On the other hand, it can only be activated by near ultraviolet light, which represents less than 4% of the solar light that reaches the planet’s surface [9], therefore, making solar-based treatments less efficient, and making visible-light-activated semiconductors necessary [7,8,10,11]. ZnO, MnxOy, and CdS are better solar-light activated than TiO2. However, metal-based semiconductors (a) may contaminate treated waters with metallic ions (secondary pollution), (b) have low photo-corrosion resistance when non-noble metals are used, and (c) may be poisoned by degradation products, prompting research on metal-free semiconductors [12,13,14,15].
Graphitic carbon nitride (g-C3N4) is a good candidate due to its easy manufacture from low-cost precursors (e.g., melamine or urea), high synthesis throughput, and visible light activation (although this also means high charge recombination rates [13,16,17]). To improve charge separation in g-C3N4, it can be combined with reduced graphene oxide (rGO), resulting in a metal-free composite. For reducing graphene oxide (GO) from graphite oxide (GrO), exfoliation is a good route for high throughput synthesis. The rGO acts as an electron acceptor and boosts photocatalytic activity in semiconductors [18,19,20,21].
In this composite, rGO and g-C3N4 are responsible for concentrating electrons and holes, respectively [22,23,24,25,26]. Thermal or sonochemical methods may create rGO/g-C3N4 composites [25,27]. The thermal method typically poorly distributes rGO into the g-C3N4 matrix, while the sonochemical one can provide materials with increased specific surface areas, improved reduction, and lower energy usage. This approach also improves synthesis control and reproducibility [28].
Although there are few reports on rGO/g-C3N4 composite preparation, the reported photocatalytic efficiencies varied greatly, even in similar works that typically study the photocatalytic degradation of synthetic dyes, phenol halides, and antibiotics like ciprofloxacin and tetracycline [13,27,29,30]. Chen, Wang, and Hou studied rGO/g-C3N4 for degrading BPA [22]. However, all of these studies used a univariate approach to enhance degradation, which probably resulted in non-optimal conditions [31].
By using the response surface methodology (RSM) with BPA photodegradation as the response variable, this study optimized the rGO/g-C3N4 composite synthesis and its photocatalytic activity. The synthesized composite was characterized, the BPA degradation kinetics and mechanism were elucidated, and the photodegradation products ecotoxicities were estimated.

2. Results

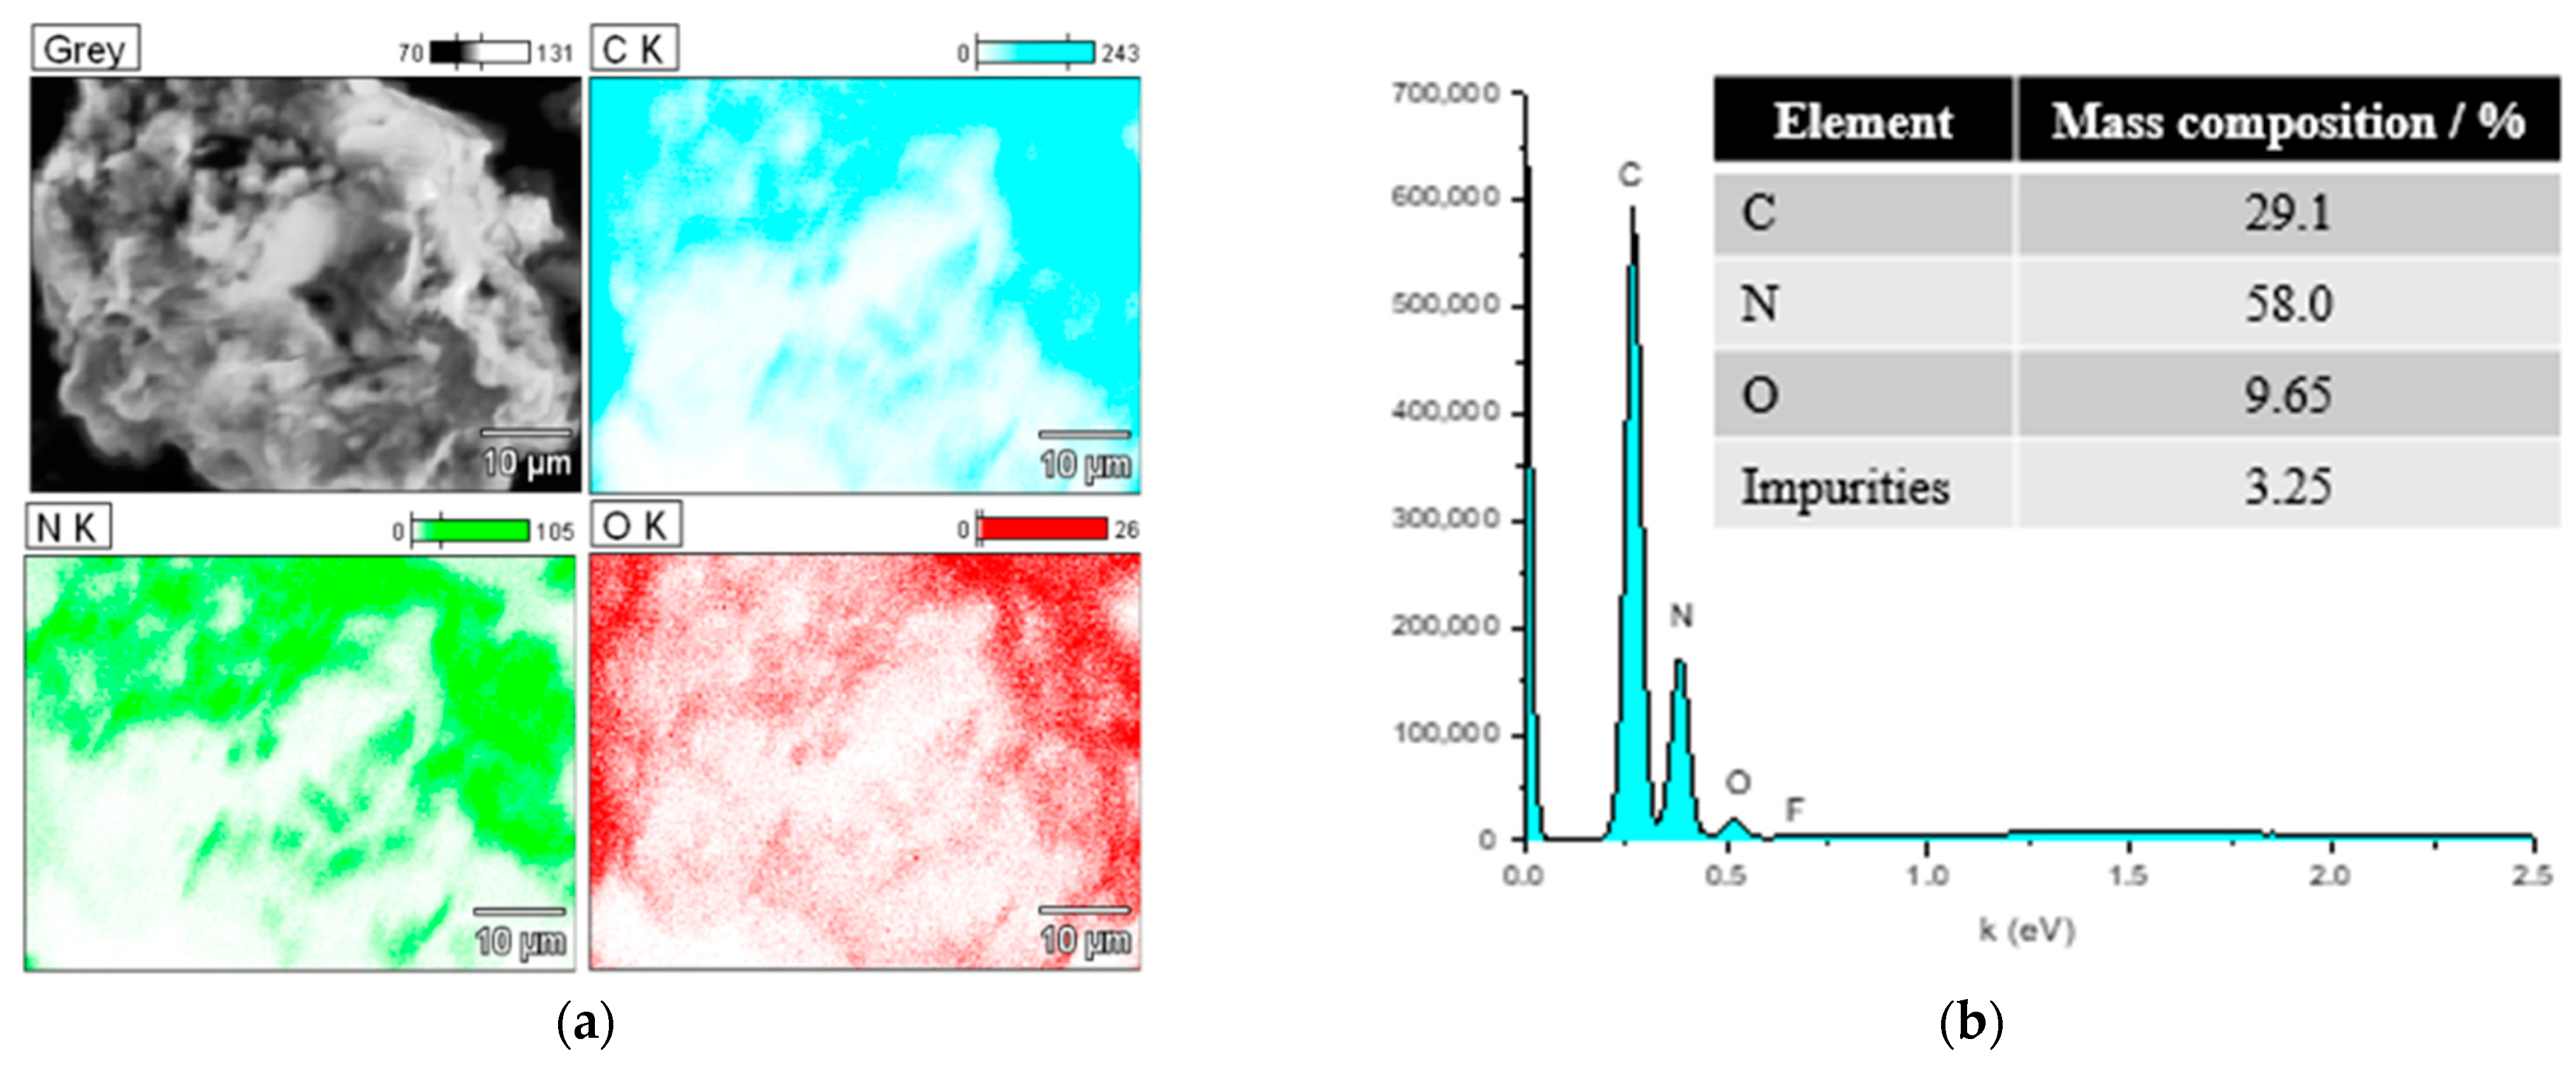
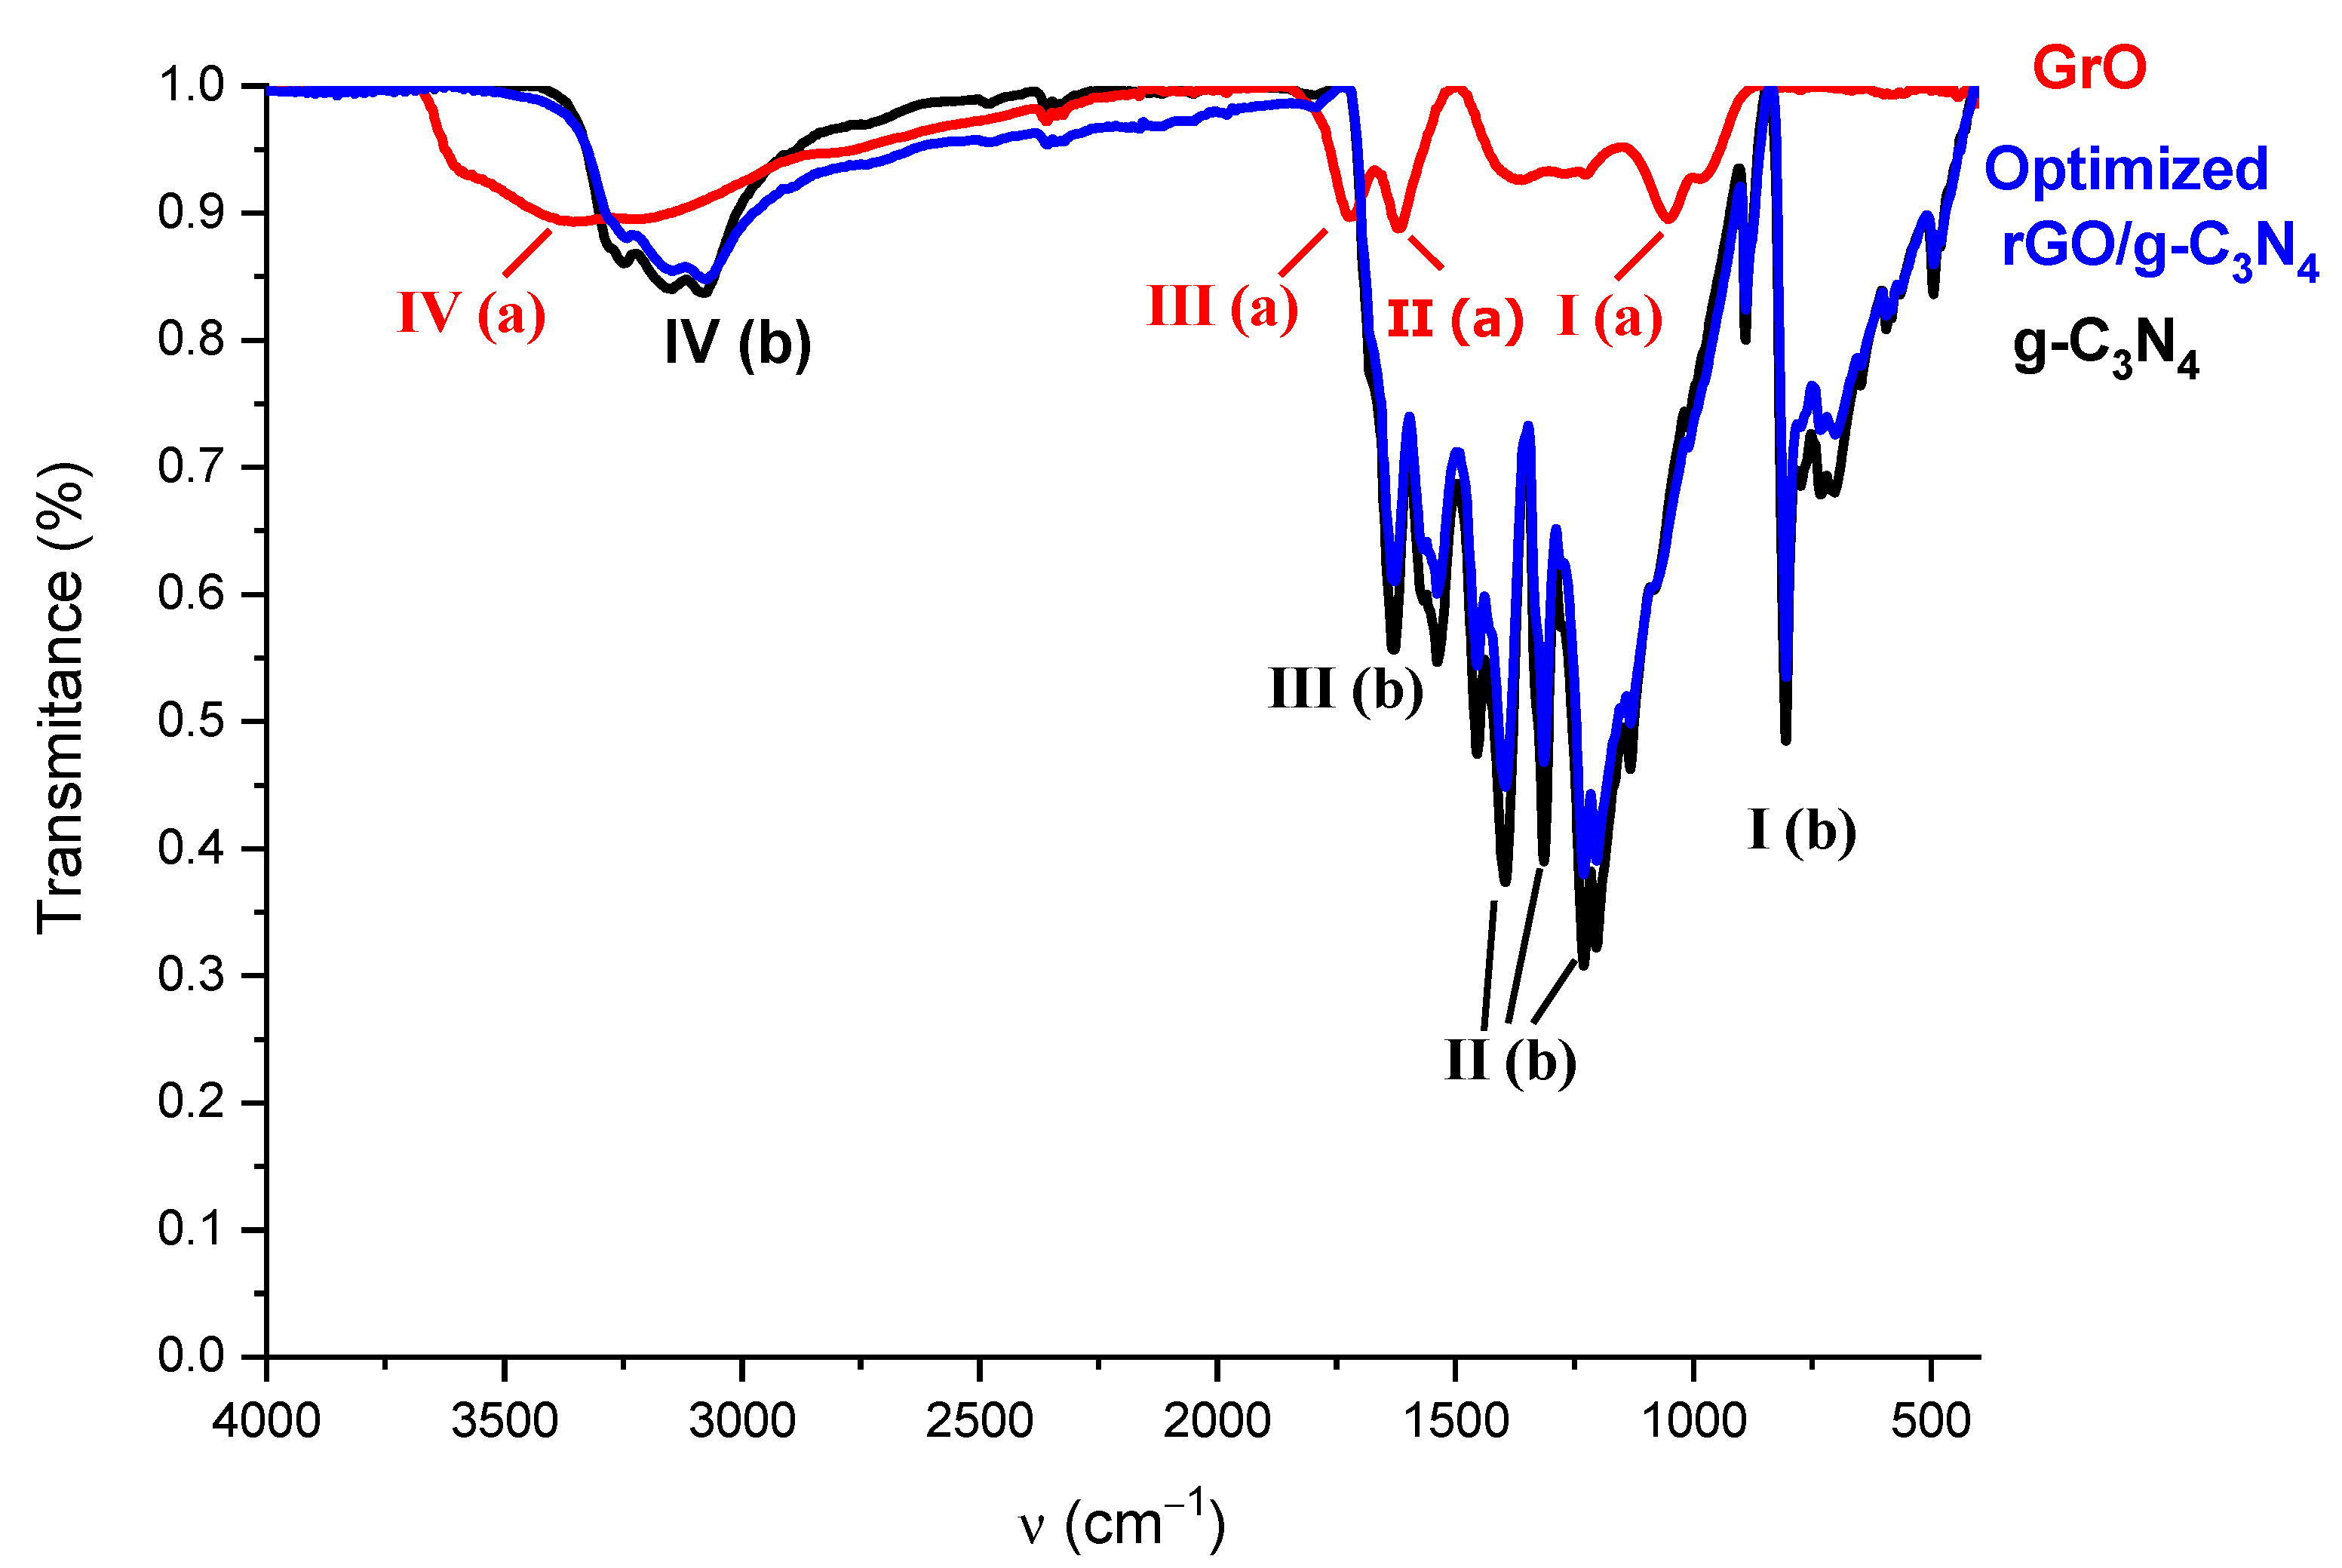
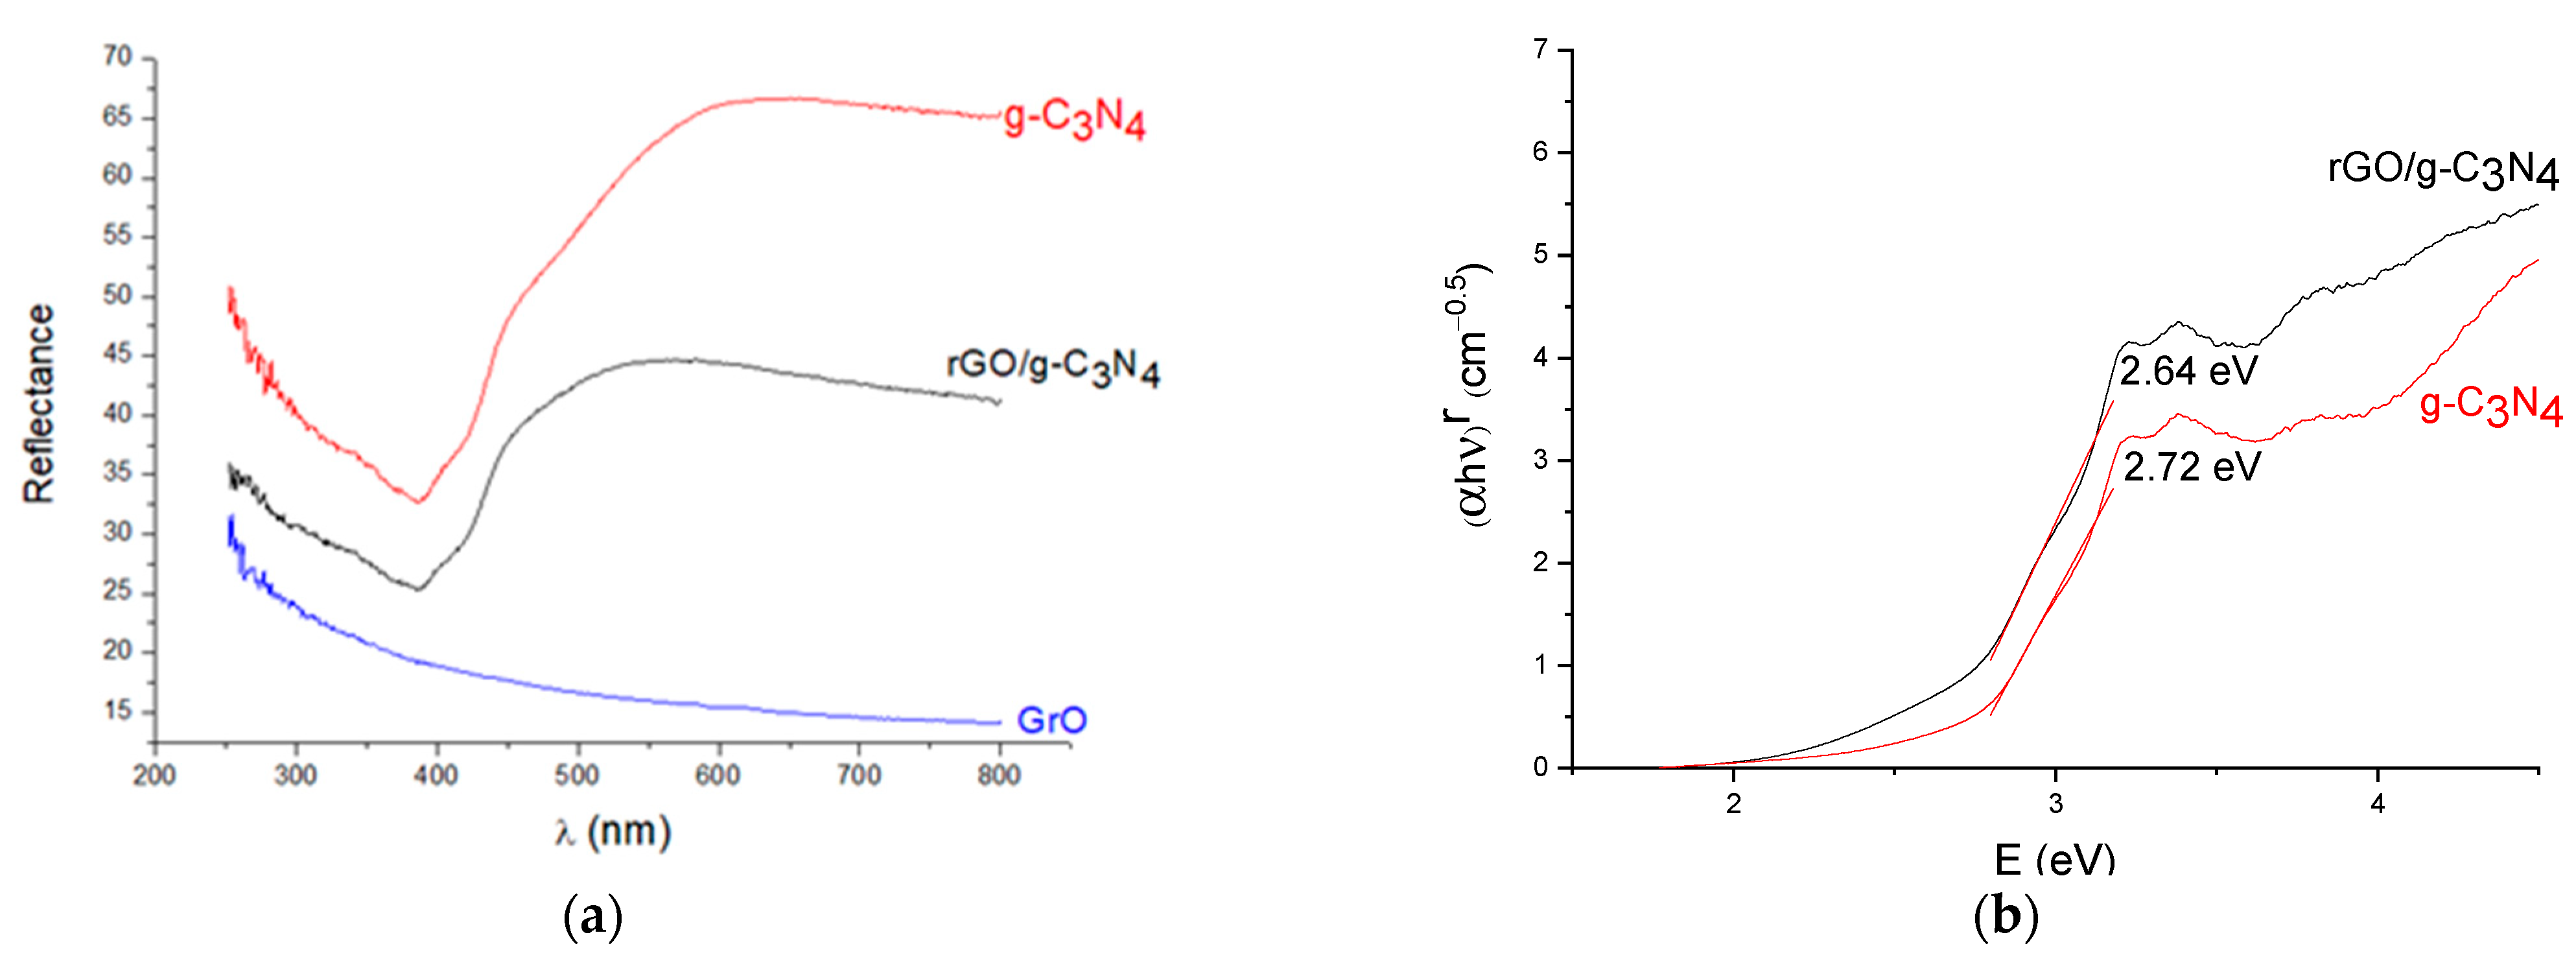
2.1. The rGO/g-C3N4 Preparation and Characterization

As the electrostatic agglomeration of pre-formed particles is one of the crucial stages in the composite formation, the zeta potential (ZP) was measured at various pH values to determine the pH at which the precursors had opposite charges. According to Figure S1, at pH 3.0, the surface charges of g-C3N4 and the exfoliated rGO (also known as graphene oxide, GO), respectively, are roughly +7.96 and −32.7 eV. All processes were carried out at that pH.
As shown in Table S1, an initial 23 (3 factors, 2 levels) full factorial design in duplicate was performed, producing 16 experiments. The estimated experimental error was 1.9% (Equation S1). That error may be considered quite low as it reflects all stages (catalyst synthesis, photocatalytic experiments, extraction, and HPLC analyses). The findings of this initial factorial design were adjusted to a first-order polynomial model (Equation (1)), where x 1 , x 2 , and x 3 represent the codified factors (by Equation S2) of the mixture’s sonication time, the weight ratio of N2H4 to rGO, and the weight percentage of rGO in the mixture prior to reduction, respectively.
R e m o v a l   %   =   23.5   +   5.25 x 1     2.45 x 2   +   5.20 x 1 x 2   +   6.32 x 1 x 3     ± 0.465     ± 0.930     ± 0.930     ± 0.930     ± 0.930
Figure S2 displays the main and interaction effects, their statistical significance, and their 95% confidence interval. One can observe that GrO concentration and sonication time, as well as their interaction, were statistically significant. Moreover, decreasing the sonication time increases the answer, as increasing GrO amount also does. This probably occurred because increasing the amount of rGO results in more electron acceptors in the material, allowing for extended charge separation; decreasing the sonication time reduces the exfoliation of the formed composite, allowing for the separation of g-C3N4 from GO (instead of a true composite, one would simply get a physical mixture). The GrO:N2H4 weight ratio factor was not statistically significant within the studied values, even though the interaction between the GrO amount and GrO:N2H4 weight ratio was. This could imply that there was too much hydrazine at both selected levels. Therefore, in the subsequent tests, the hydrazine concentration was kept at its lower level.
Next, the experimental conditions that resulted in the best BPA removal (Table S2) along the path of steepest ascent were used as the central point of a central composite design (CCD) (Table S3). Equation (2) presents the estimated model for the CCD.
R e m o v a l   %   =   61.0     8.65 x 1     2.52 x 2   +   4.73 x 1 x 2     8.98 x 1 2     7.83 x 2 2   +   5.78 x 1 3        ± 0.917     ± 1.78     ± 0.562     ± 0.794     ± 0.669     ± 0.669     ± 1.12
The surface shown in Figure S3 is produced by Equation (2). The ANOVA (Table S4) and Fisher statistics both indicated that the model was well adjusted. The maximum (ideal synthetic conditions) was calculated as follows: x 1 = −0.039 and x 2 = −0.26, or, respectively, %GrO = 15% and sonication time = 7 min 20 s. One can observe the gain achieved in BPA removal, which increased roughly threefold from 24% (central point conditions, initial 23 full factorial design) to 65% (optimal conditions, CCD).
The composite’s crystalline structure was consistent with that of g-C3N4 according to the X-ray diffraction (XRD) analysis (Figure 1), which agrees with Gu et al. [19] and Liu et al. [29]. This is explained by the fact that (a) rGO emits weak signals in XRD and (b) there is little rGO present in the compound, which is insufficient to change the crystalline structure of g-C3N4. According to the literature [16,27,32,33], GrO is distinguished by a single peak at 11.6° related to the (1 0 0) plane, matching JCPDS file 75-2078 [34]. According to JCPDS file 87-1526, g-C3N4 exhibits two main peaks at 13.2° (1 0 0) and 26.6° (0 0 2), as well as minor peaks at 44.6° (2 0 0) and 56.4° (0 0 4). Cao et al. [12], Ma et al. [35], and Sun et al. [36] also described these features.
According to the microstructures shown in Figure 2, precursors and composite particles do not appear to have any specific habits on a micro-scale. As the composite is made of groups of precursor layers, the materials are indistinguishable. The observed lamellar grouping (Figure 2c) might be related to a synthesis that relied on bidimensional precursors self-assembly. The specific surface areas (SSA) of g-C3N4 and GrO were roughly 25.8 and 160 m2 g1, respectively. The optimized composite SSA was 85.9 m2 g1, whereas the SSA of g-C3N4 under similar exfoliation conditions (without GrO) was 31.7 m2 g1. This difference suggests that rGO increased the composite SSA, probably by unpacking g-C3N4 layers due to an electrostatic effect. This hypothesis was confirmed by measuring the SSA of a simple mixture of g-C3N4 and GrO at the same content (16% GrO): 47 m2 g1.
As pH influences how well the material exfoliates and aggregates, the pH at which the composite was formed (3.0) can also be linked to its SSA [37]. The composite ZP curve (Figure S4) was close to that of pure g-C3N4 (Figure S1).
The Energy Dispersive Spectroscopy (EDS) analyses (Figure S5) showed that the produced g-C3N4 was quite pure, given that the solid-phase synthetic method used just one reagent. The detected impurities (1.92%) can be attributed to the sample holder. It appears that the limited contact with atmospheric air during annealing was enough to allow for a partial oxidation of the material. This would account for the oxygen found in the EDS tests. Even after the extensive purification performed, GrO (Figure S6) was impregnated with tiny amounts of sulfur, chlorine, and manganese. However, due to the minimal residual contamination (2.21%), the material was deemed suitable for the following synthetic stages. The only visible impurity in the optimized composite (Figure 3) came from the sample holder at 3.25%.
Elemental analyses (CHNSO) were performed to estimate the rGO concentration in the synthesized photocatalyst. The nitrogen concentration of the g-C3N4 precursor was first calculated. Second, the composite was also examined, and the amount of g-C3N4 was determined using the previously mentioned nitrogen content. The rGO mass was determined by deducting the g-C3N4 mass from the composite mass. As a result, it was determined that the composite rGO concentration was roughly 4.0%.
The Fourier Transform Infrared Spectrophotometry (FTIR) spectra of the precursors and the optimized material were also used to describe them (Figure 4, Table 1). Bands were identified according to Aleksandrzak et al. [27]. Nearly oxygen-free rGO was primarily made of carbon and hydrogen (small electronegativity difference). As the magnet dipoles of the chemical bonds are not strong enough to couple with infrared waves, the spectrum of the optimized material resembles that of g-C3N4.
The rGO changed the bright yellow g-C3N4 into a dark gray material, which explains why the composite has reduced reflectance (Figure 5a). One can observe from the Diffuse Reflectance Spectroscopy (DRS) analysis that the existence of rGO in the structure had no discernible effect on the band gap of g-C3N4 (Figure 5b). The rGO is a conductor species (no substantial charge separation) with an allowed and direct transition (r = 0.5). As g-C3N4 favors oxidation, it is possible that the material enhanced photocatalytic activity resulted from its increased SSA and low recombination rates, transferring charge to the rGO [38].
The empirical Equations S6–S8 were used to determine the VB and CB potentials of g-C3N4 (+1.55 and –1.09 eV, respectively) [39]. The estimated band positions for g-C3N4 were assumed to be the same for the composite because rGO showed no noticeable charge separation (Figure 5a) and the band gaps of pure g-C3N4 and the composite were nearly identical (Figure 5b).

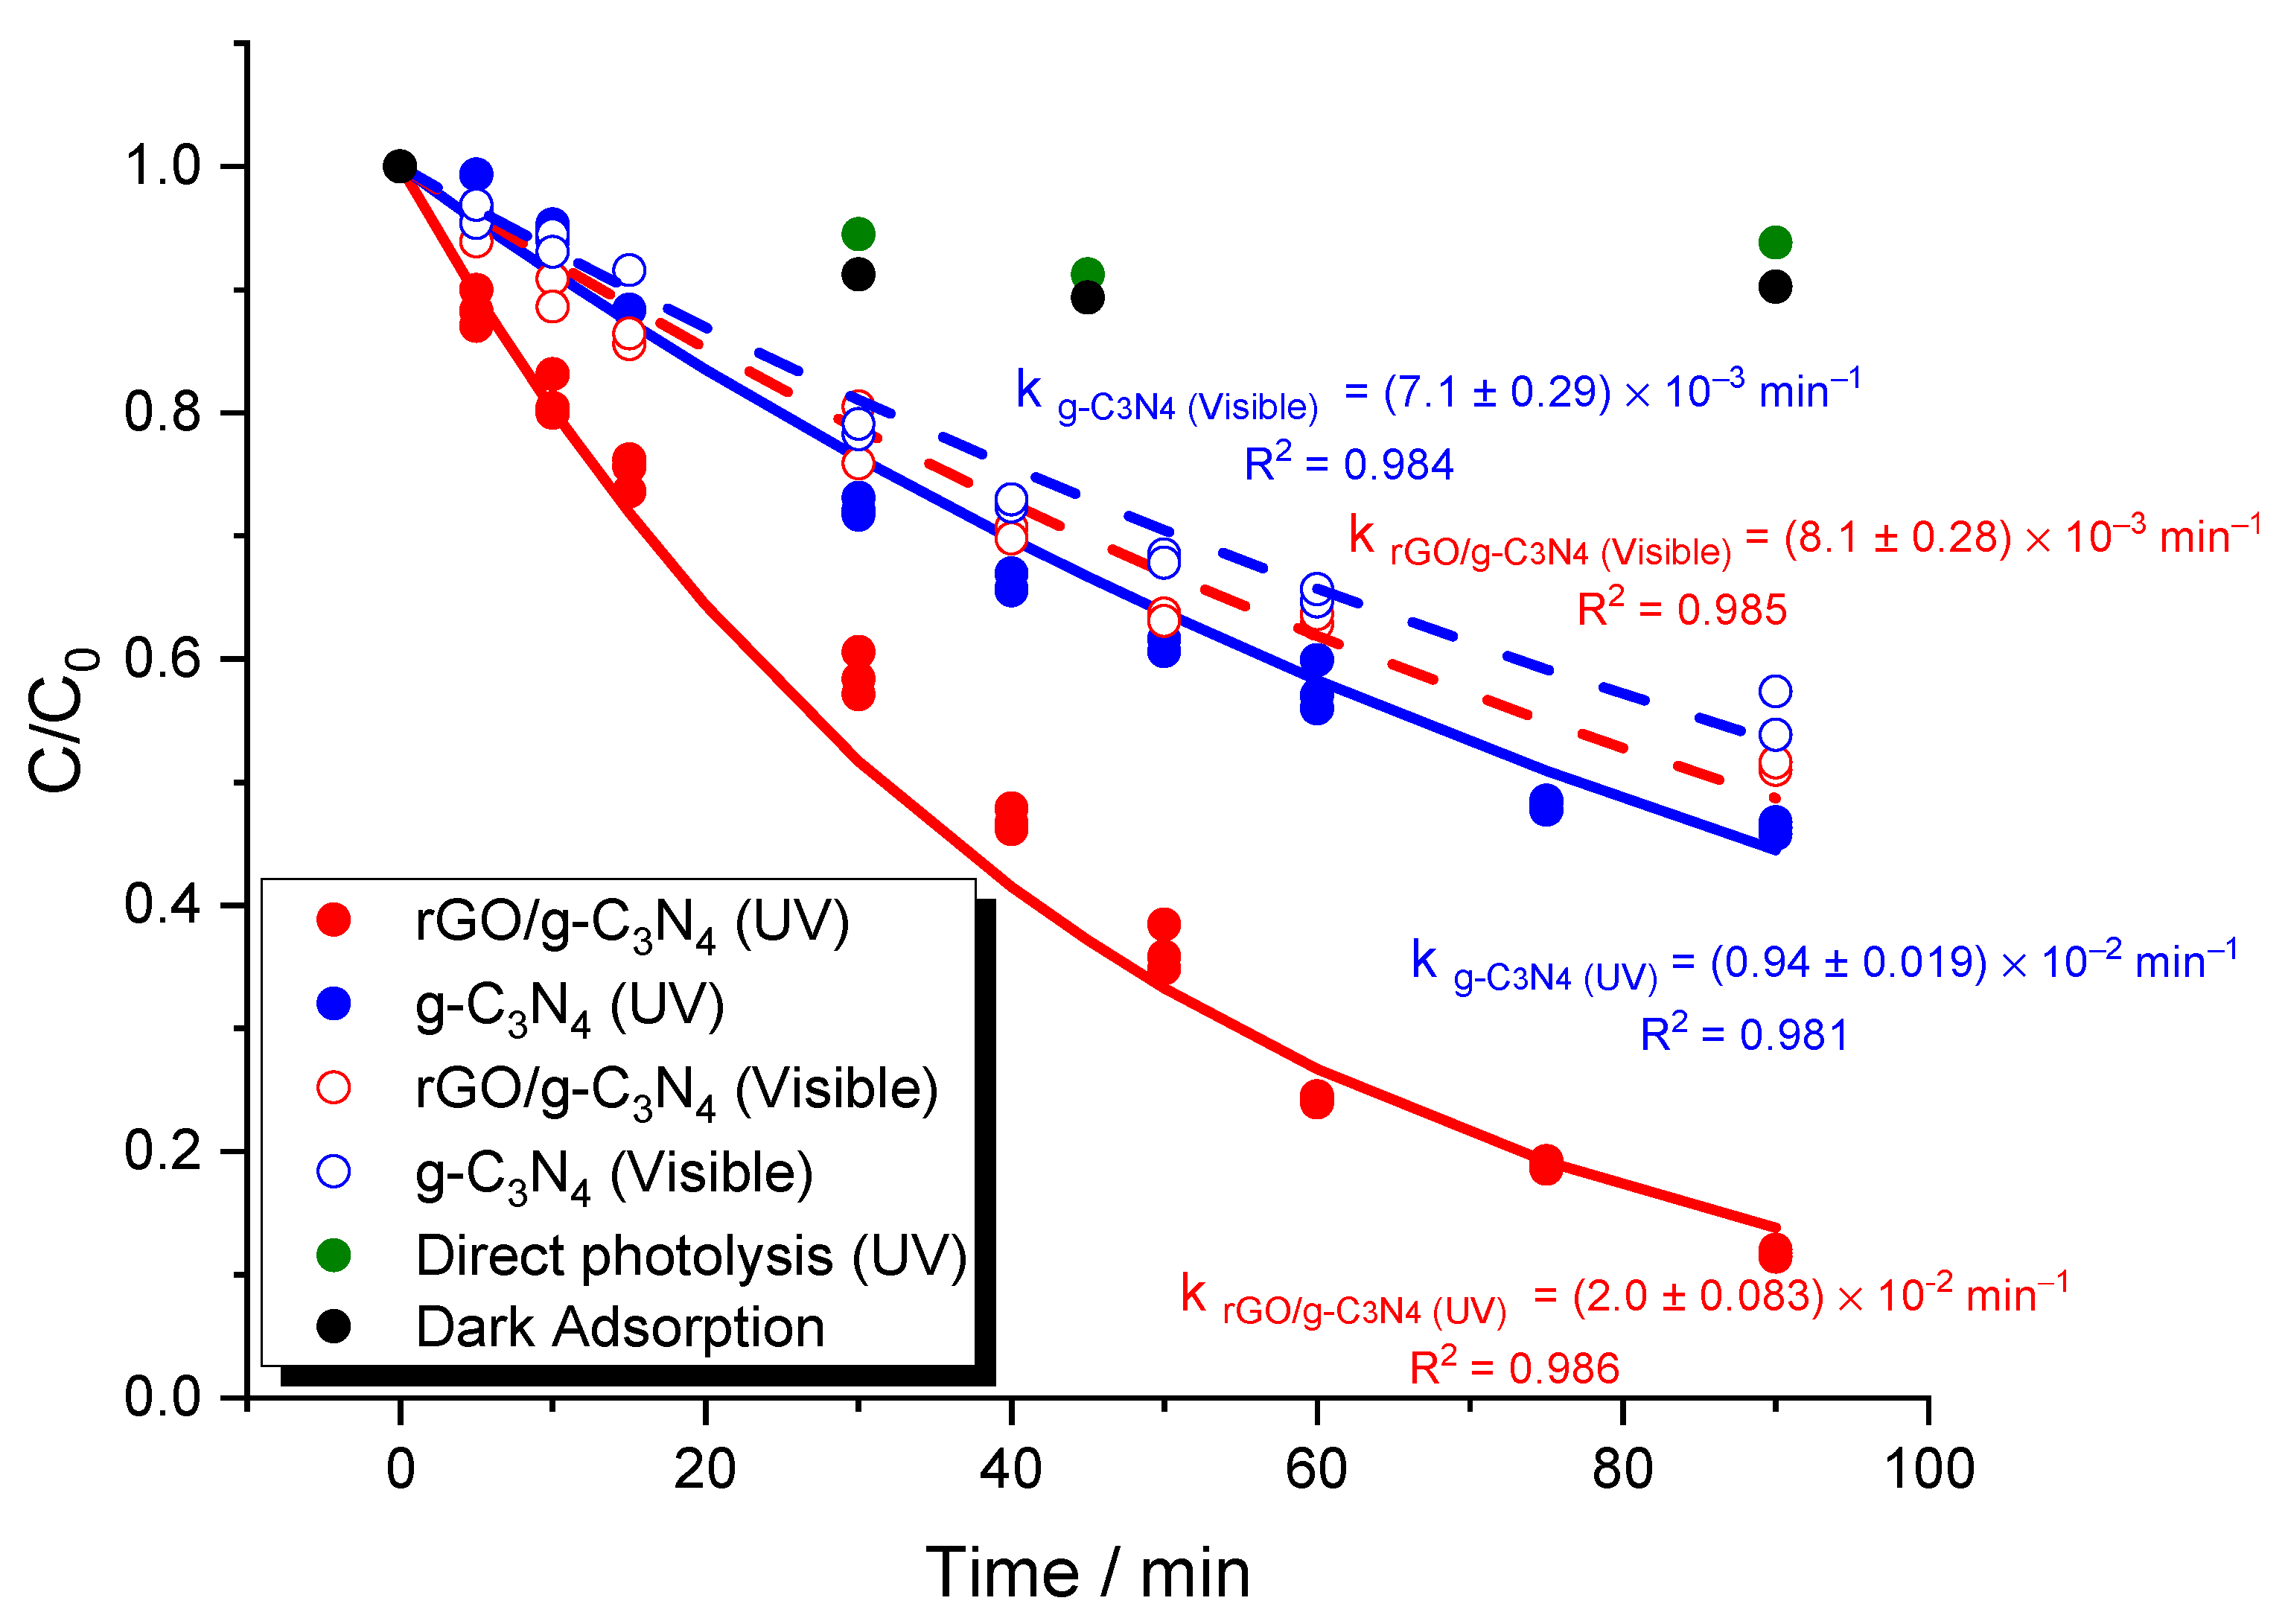
2.2. BPA Degradation Kinetics and Scavenging Tests

BPA degradation rates under UV and visible lights are shown in Figure 6. Both pure g-C3N4 and optimized rGO/g-C3N4 followed a pseudo-first-order behavior for both light sources: k g - C 3 N 4   U V = (0.94 ± 0.019) × 10−2 min−1 (R2 = 0.981), k r G O / g - C 3 N 4   U V   = (2.0 ± 0.083) × 10−2 min−1 (R2 = 0.986), k g - C 3 N 4   V i s i b l e = (7.1 ± 0.29) × 10−3 min−1 (R2 = 0.984), and k r G O / g - C 3 N 4   V i s i b l e   = (8.1 ± 0.28) × 10−3 min−1 (R2 = 0.985). In 90 min, rGO/g-C3N4, under UV light, degraded BPA approximately 2.1 and 2.8 times faster than g-C3N4 under UV and visible light, achieving 90 and 50% removals, respectively. In contrast, dark absorption and direct photolysis removed 10.7 and 6.2%, respectively.
Scavenging tests pointed out that superoxide radical was the main reactive oxygen species in BPA degradation (Table 2) [40,41], as the only scavenger that caused a significant reduction in its removal was benzoquinone, a known inhibitor of superoxide radicals. It was also possible to observe that holes and hydroxyl radicals played a relatively minor role (IPA and KI scavengers, respectively). Considering the scavenging test results, the calculated VB and CB potentials, and the required potentials for producing O2●– and OH, one can realize that aqueous O2●– could be readily formed in the presence of the composite once its CB potential was –1.09 eV and the reduction potential of O2 into O2●– was 0.33 eV [42], which is about three times lower (in absolute value). It is also possible to understand why OH did not contribute significantly to the degradation process. H2O has an oxidation potential of +2.80 eV [43], which is about two times greater than the VB potential of +1.55 eV. However, because the VB potential is higher than +1.23 eV, the catalyst can decompose H2O into O2 [43]. Chen et al. [22] and Sepehrmansourie et al. [44] also pointed out that the primary species to be activated under visible light was the superoxide radical, which is produced when the composite CB reduces dissolved molecular oxygen.

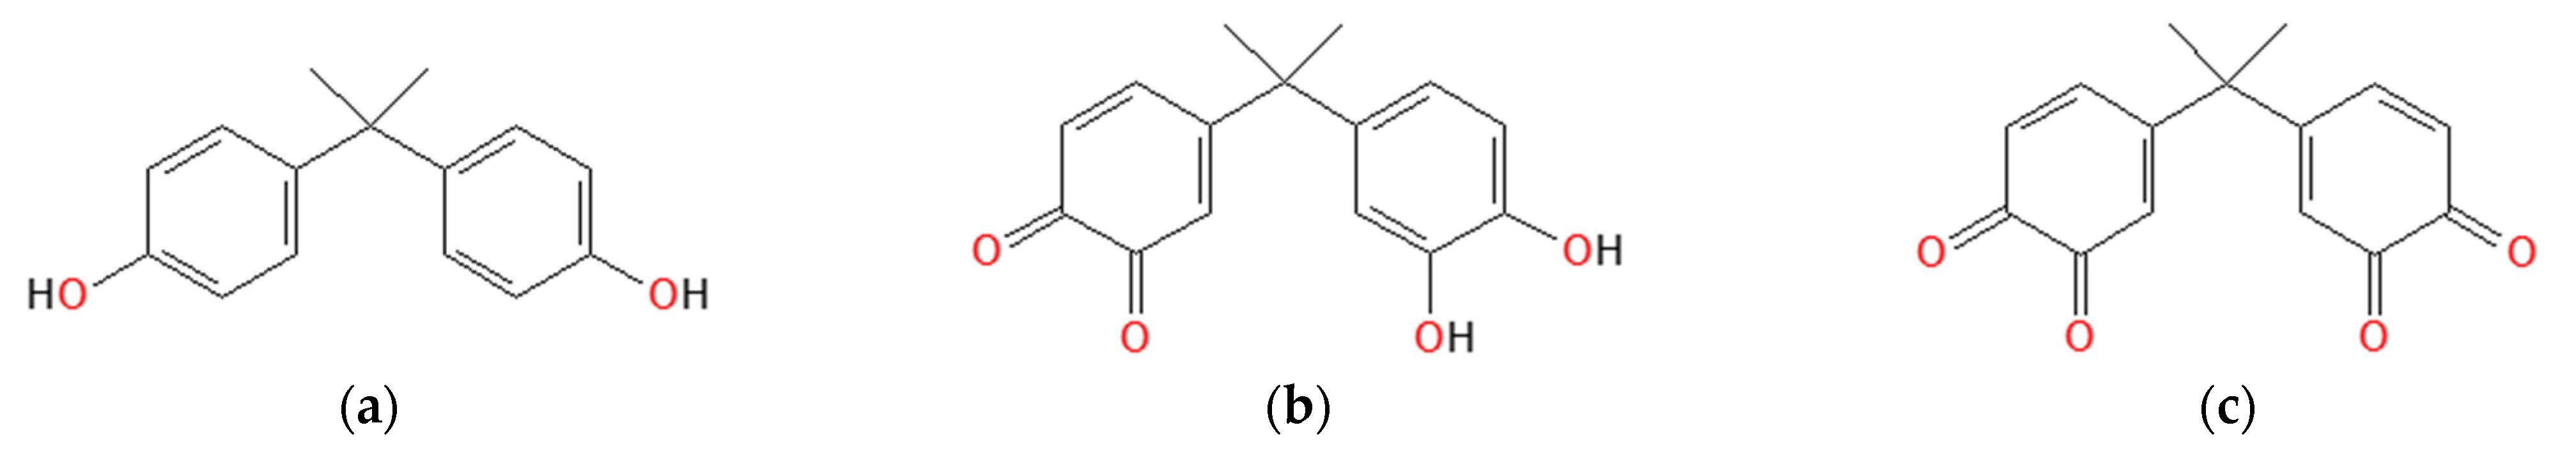
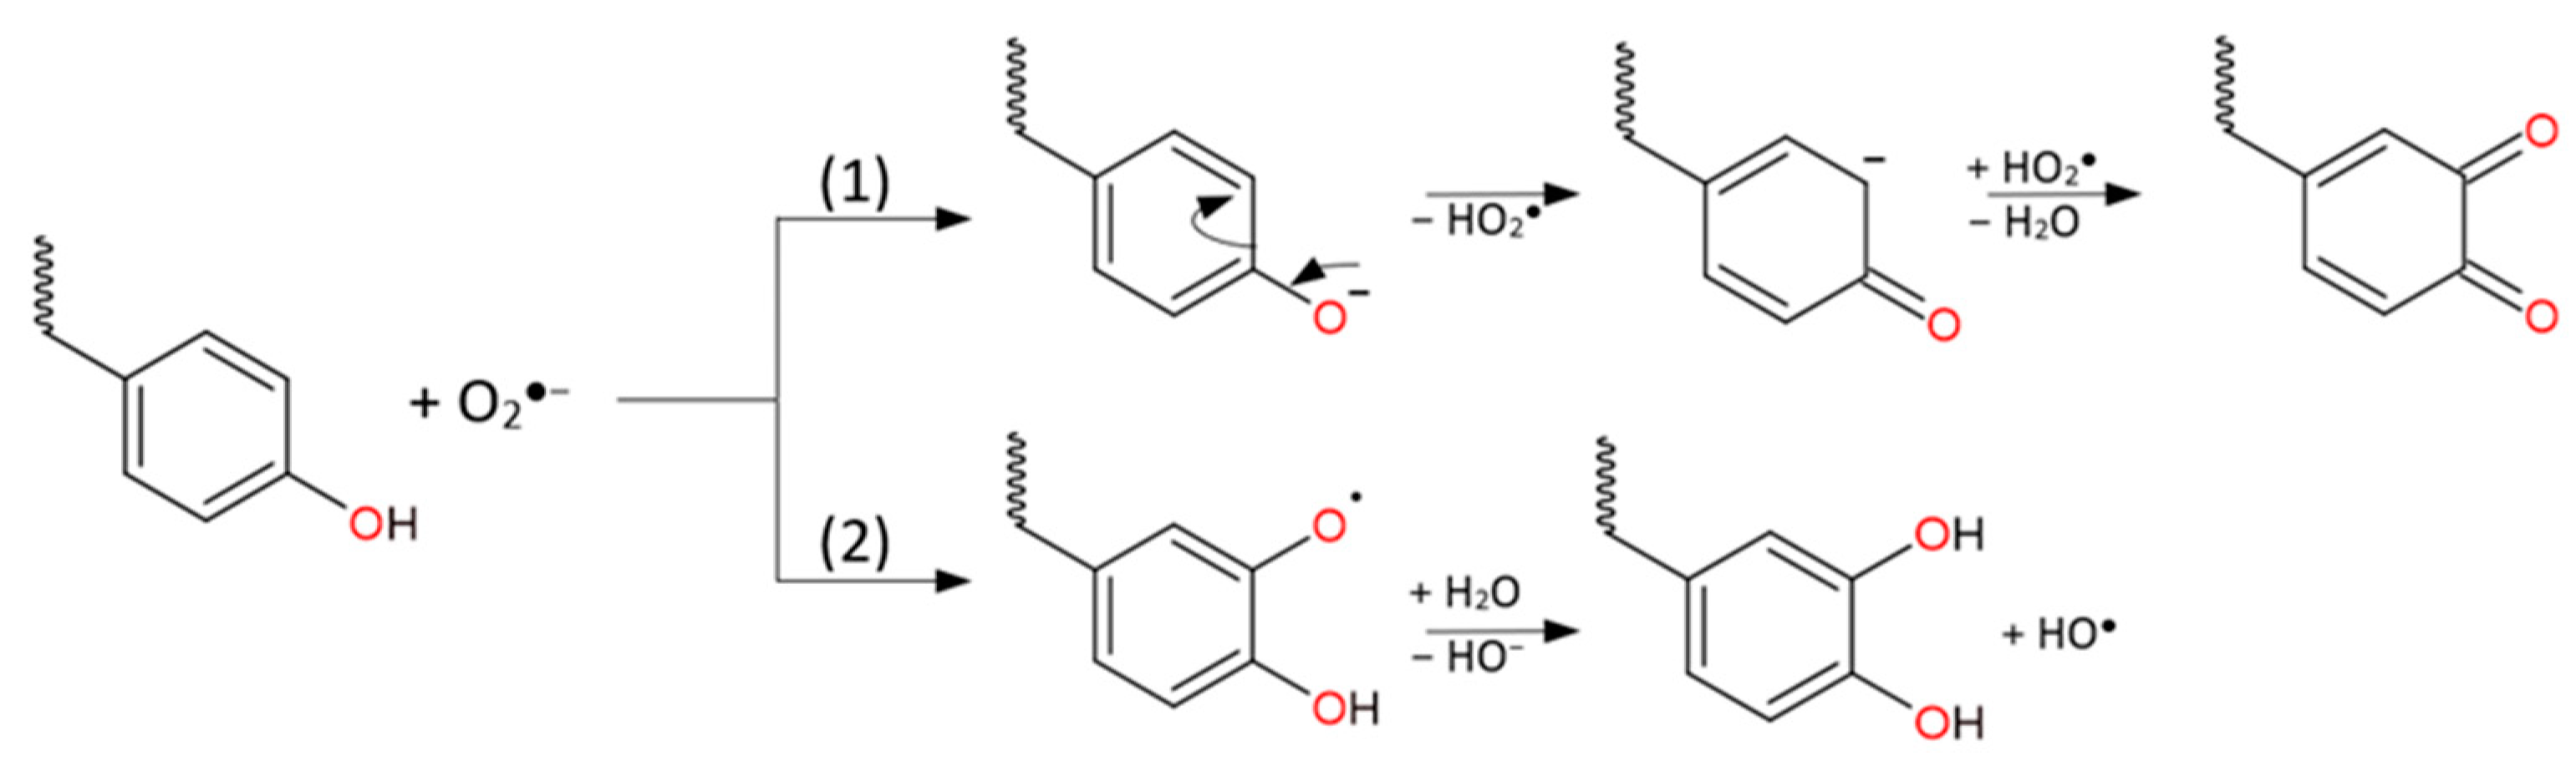
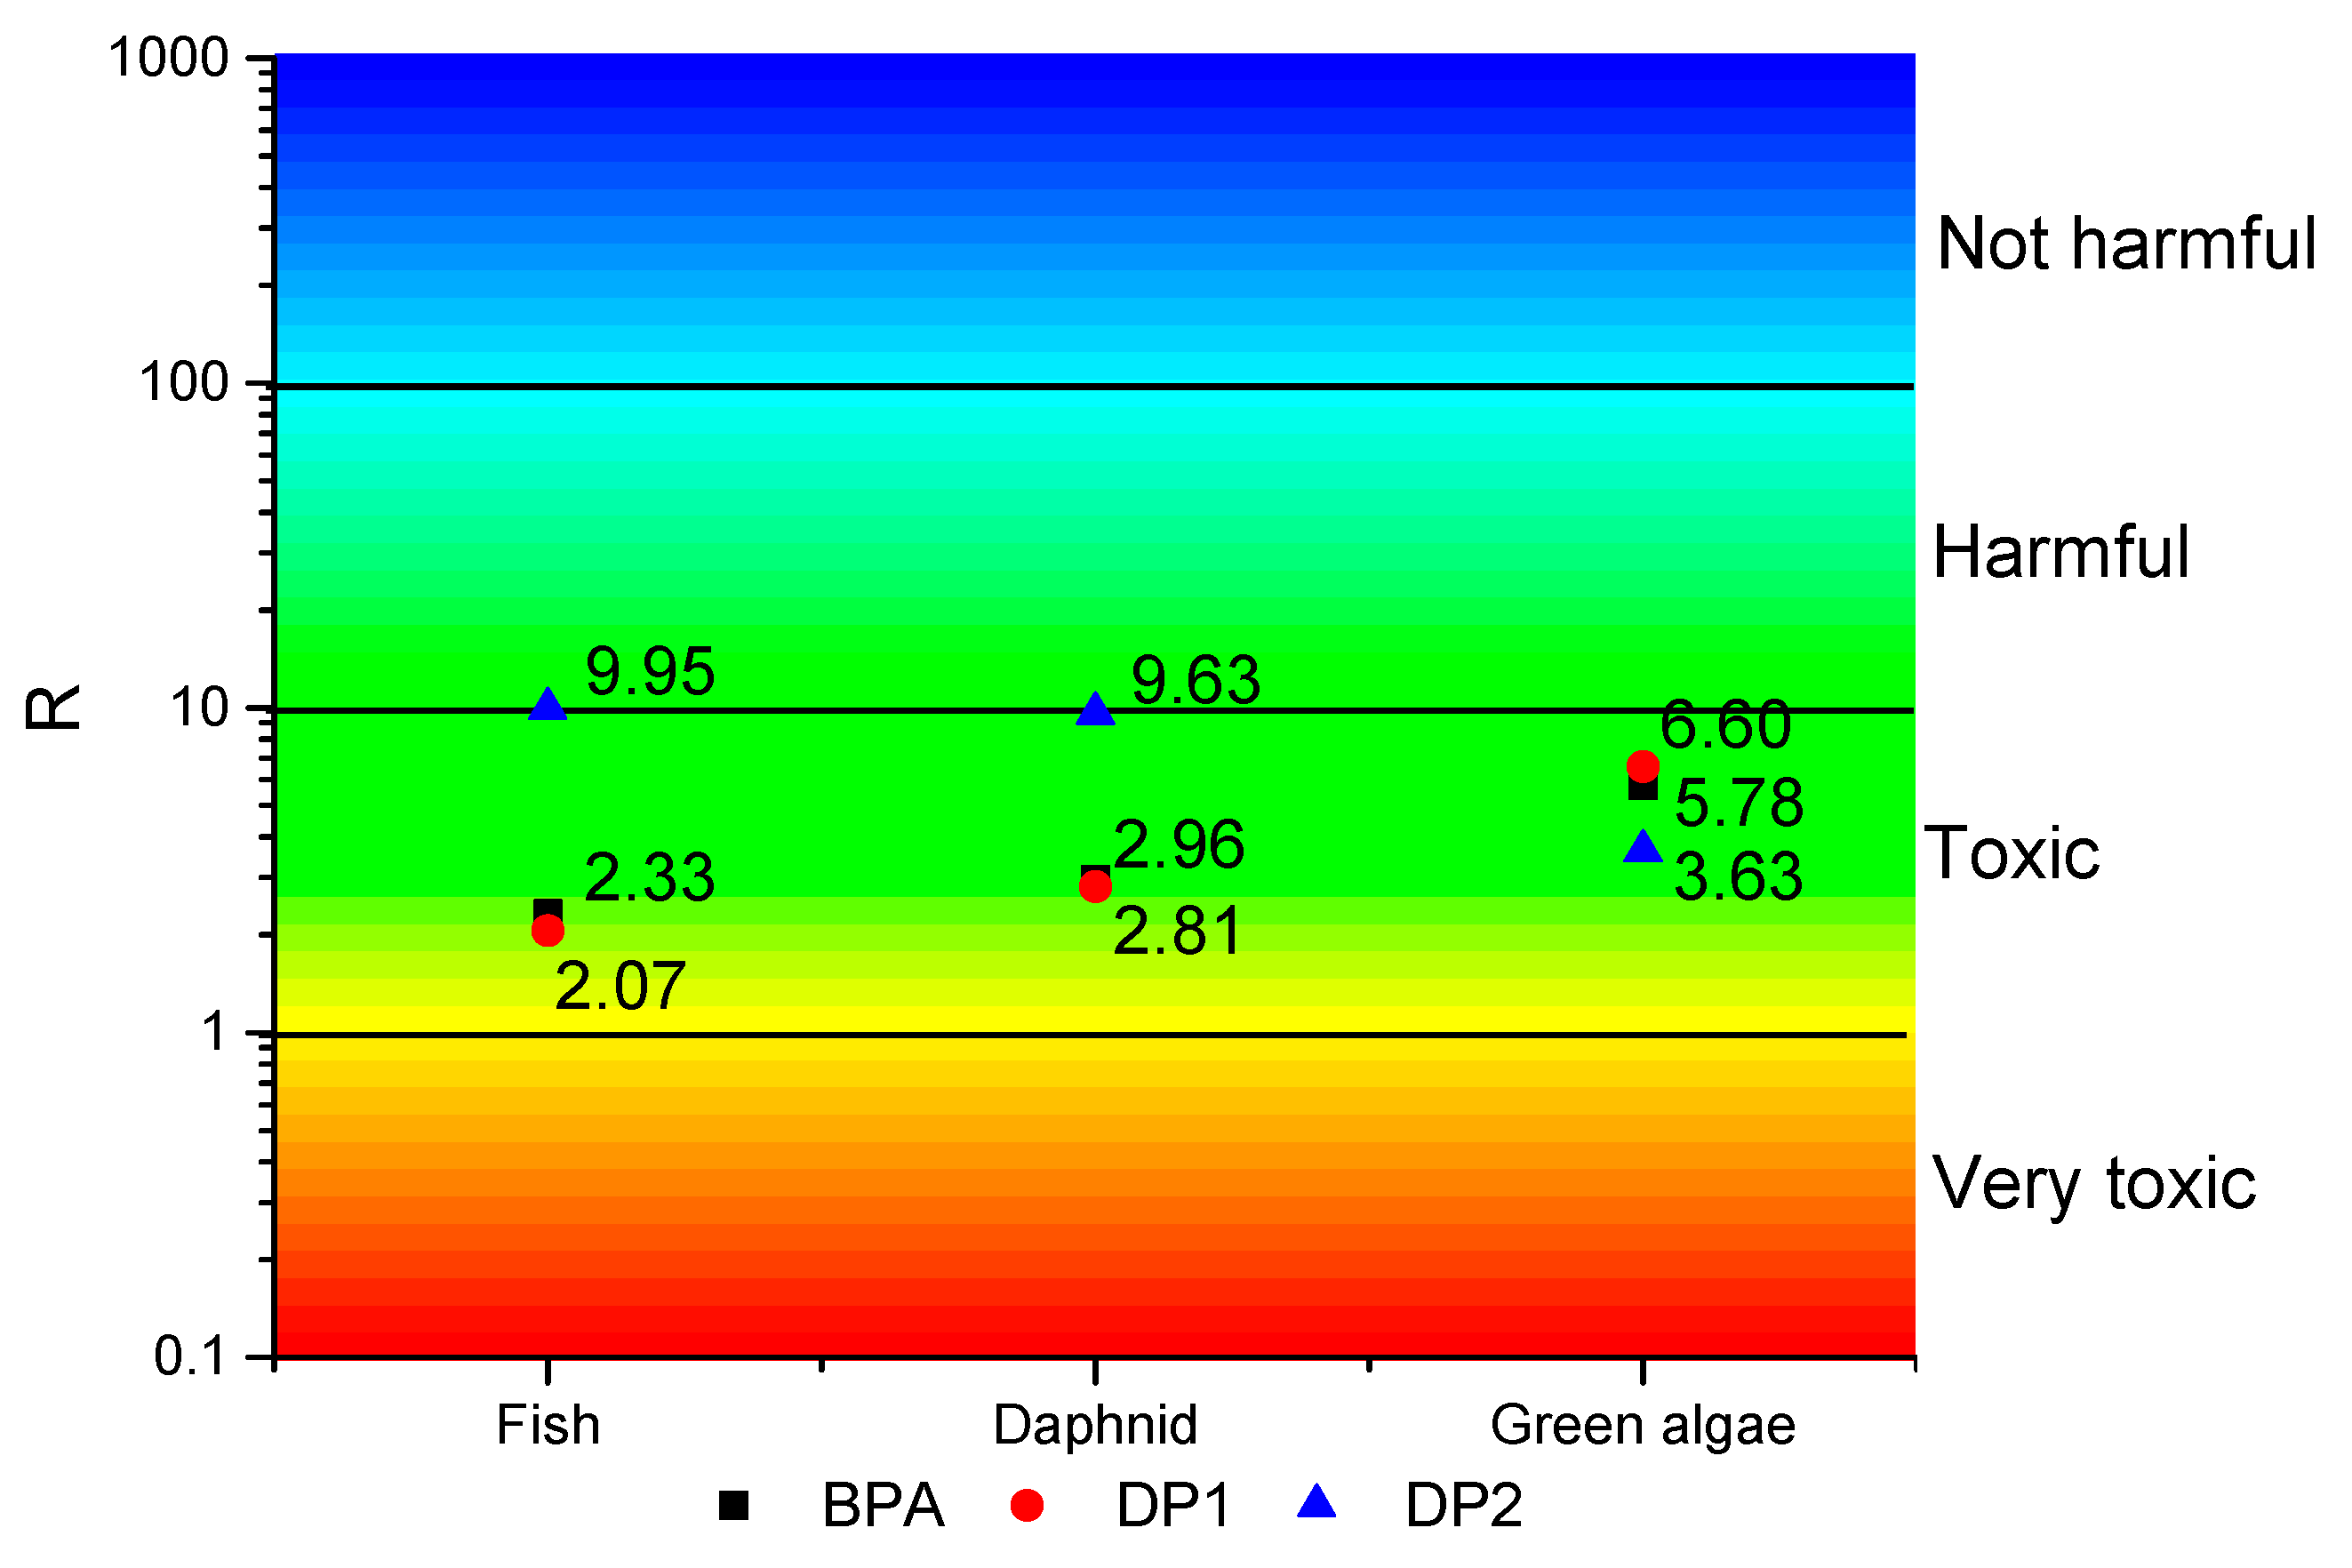
2.3. Degradation Product Identification and Ecotoxicity

Two main degradation products (DPs) were identified: 4,4’-(propane-2,2-diyl)bis(cyclohexa-3,5-diene-1,2-dione) (DP1) and 4-(2-(3,4-dihydroxyphenyl)propan-2-yl)cyclohexa-3,5-diene-1,2-dione) (DP2). Figure 7 depicts their structures, and Figure S7 presents their mass spectra. Those compounds were also found by Kondrakov et al. [45]. As superoxide radical was the main oxidizing agent present in the treatment, two concurrent degradation mechanisms were suggested (Figure 8). In the first pathway, hydroperoxyl radical is created when superoxide radical removes a proton from the BPA OH moiety. Hydroperoxyl radical attacks the carbon next to the formed ketone, forming a double bond with the deprotonated oxygen atom. A proton is taken away from that carbon by an additional hydroperoxyl radical, which results in the removal of water and the formation of a double bond with the last oxygen atom. In the second pathway, hydroxyl ion is eliminated while superoxide radical attaches an oxygen radical to BPA (vicinal carbon to the OH moiety). A proton is removed from water by the radical oxygen, creating hydroxyl radical. As a result, DP1 is produced when BPA reacts via both pathways, while DP2 is produced when BPA reacts only via pathway (1) or when DP1 is oxidized [46,47].
The ECOSAR 2.0 software was used to predict the ecotoxicities of BPA and suggested DPs (Figure 9). The LC50 and EC50 endpoints are the concentrations at which a sole exposure to a chemical over a specific period of time causes 50% of the tested population to die or experience negative effects, respectively (L—Lethal; E—Effect). The chronic value (ChV) is the concentration at which a continuous exposure causes chronic effects [48]. The Globally Harmonized System of Classification and Labeling of Chemicals states that the ecotoxicity of a compound is determined by the ratio (R) between the acute effect (LC50 or EC50) and the chronic one (ChV): This way, if R ≤ 1, the compound is Very Toxic; if 1 < R ≤ 10, than it is Toxic; if 10 < R ≤ 100, it is Harmful; and it will be Not harmful if R > 100 [49].
BPA was toxic to all of the test organisms, as anticipated. DP1 was nearly as harmful as BPA. DP2, on the other hand, was not toxic, but was harmful to fish and daphnids. Those slight variations in toxicities are probably due to the fact that DP1 and DP2 are quite similar to BPA. Therefore, to fully remove BPA and, more importantly, remove ecotoxicity, longer irradiation times would be required. This is crucial because BPA, DP1, and DP2 were all toxic to green algae, which forms the base of many food systems.

3. Materials and Methods

3.1. Materials

Melamine (99%, Sigma-Aldrich, St. Louis, MO, USA), graphite powder (99%, Synth LDT, São Paulo, Brazil), potassium permanganate (99%, Synth LDT), hydrogen peroxide (30%, Synth LDT), sulfuric acid (96%, AppliChem Panreac, Darmstadt, Germany), hydrochloric acid (37%, Chemis, São Paulo, Brazil), and aqueous hydrazine (80%, Merck, Darmstadt, Germany) were used as received.

3.2. Synthesis of g-C3N4, rGO, and rGO/g-C3N4

The g-C3N4 was produced by adapting prior methods [17]. A muffle furnace (EDG 7000 coupled to an EDG heater EDGCON 3P) was used for pyrolyzing 2.00 g of melamine in a porcelain crucible with a lid. The material was first heated (10 °C min−1) from room temperature to 50 °C, and maintained for 30 min. Then, the powder was heated (6 °C min–1) from 50 to 605 °C, and maintained for 183 min. Finally, the muffle oven was allowed to cool down to room temperature. The yellowish material obtained inside the crucible was ground in an agate mortar/pestle, transferred to Falcon® tubes (50 mL), and kept in the dark until usage.
The rGO was produced using a modified Hummers process [50] (see Supplementary Material). To a mixture of graphite powder (1.00 g) and concentrated sulfuric acid (70 mL), potassium permanganate (9.00 g) was added. The mixture was then magnetically stirred at 40 °C for 40 min and ultrapure water (150 mL) was added. The flask was filled with more ultrapure water (500 mL), concentrated hydrogen peroxide (10 mol L–1, 10.0 mL), and magnetically stirred for more than 15 min. The solid was vacuum filtered through a 0.45-µm cellulose acetate membrane, suspended again in hydrochloric acid 1.0 mol L–1 (250 mL), and vacuum filtered once again. The generated GrO was homogenized, frozen, ground, and dialyzed with a 8000–14,000 Da membrane that removed the impregnated ions. The outside solution was exchanged every 2 h on the first day, every 4 h on the second one, and then every 12 h until the pH of the spent water and that of ultrapure water were the same (pHmeter Marconi PA 200). The purified material was air dried and lyophilized for six days. Then, this material was finally pulverized in an agate mortar/pestle and kept in the dark inside Falcon® tubes (50 mL).
Composites were prepared by a sonochemical approach. To obtain 1.0 g L–1 suspensions, the required amounts of g-C3N4 and GrO were weighed and sonicated in parallel for 1.5 h with two ultrasonic (tip) devices (BRANSON models 450 and 550, for GO and g-C3N4) at 14 W in pulses (3 s on, 7 s off). Those suspensions were magnetically stirred and H2SO4 (3.0 mol L–1) was added to adjust the pH to 3.0. This acidified suspension was sonicated for 20 min more using the same pulse routine. The sonicated mixture received a certain amount of hydrazine and was refluxed at 98 °C for 24 h. Before vacuum filtration, the suspension naturally cooled to room temperature. The obtained composite was vacuum filtered and air dried for 24 h in a dark environment, pulverized with an agate mortar/pestle, and stored in 1.5-mL Eppendorf® tubes.
The RSM was used to improve the composite synthesis [31]. The response-variable was BPA degradation (see Supplementary Material). First, a 23 full-factorial design was duplicated. The %rGO, sonication time, and N2H4:rGO weight ratio were assessed. Second, a polynomial was fitted to the data, and a series of experiments (according to Equation S4) was performed along the path of steepest ascent, i.e., towards increasing BPA degradation. Finally, a CCD was performed over the region of maximum BPA degradation. A new polynomial was adjusted to the data and used for estimating the optimal synthetic BPA degradation conditions. An ANOVA tested the model goodness of fit.
Several characterizations were performed in the precursors and in the optimized composite: XRD, FTIR, Dynamic Light Scattering—ZPs, Scanning Electron Microscopy with Field Emission Gun, EDS, DRS with the Tauc plot approach [51], and elemental analyses.

3.3. Photodegradation Experiments

The photodegradation studies were performed in a 250 mL, temperature-controlled (20 °C) open-jacketed reactor. Typically, the reactor was fed with BPA 100 µg L–1 (100 mL) at pH 6.0 (adjusted with aqueous ammonia) and the photocatalyst (composite, 5.0 mg). That suspension was magnetically stirred and bubbled with air (approximately 270 mL min–1) for 30 min in the dark. Then, a black light bulb lamp (BLB) (Empalux®, 25 W) was turned on (60 min) and placed 15 cm above the suspension surface. After irradiation, the suspension was put into amber flasks, refrigerated (5 °C), and filtered using cellulose acetate membranes (0.45 µm pore size). Identical procedures were used for the adsorption and photolysis tests, without the lamp and photocatalyst, respectively.
A vortex-assisted liquid–liquid microextraction approach, based on Yangzi et al. [52], was used to extract residual BPA from the samples (filtered suspensions). Then, n-octanol (100 µL) was added with the aid of a 10–100 µL micropipette to a glass tube containing the sample (10.0 mL) without spraying it deep into the solution. The tube was centrifuged with a relative centrifugal force of 1264 g at 25 °C for 20 min after being vortex stirred at 3800 rpm for 2.5 min. Using a liquid chromatographic syringe (25 µL, Hamilton Series 700 with fused needle), the organic phase was collected and put into a 100 µL insert inside a 1.5 mL amber chromatographic vial. One used a Shimadzu Prominence 20A liquid chromatograph LC-20AT single pump (Kyoto, Japan), manual injection six-port valve (20 µL of loop injection), CBM-20A controller running LCsolutions® software, DGU-20A5 degasser, SPD-20A UV-vis detector for quantifying the samples’ residual BPA. Column: Luna® C8(2) (5 µm, 100 Å; 150 × 4.6 mm). Mobile phase: 1:1 mixture of water (2% acetic acid in volume) and acetonitrile. Chromatographic parameters: injection volume (20 µL), reversed mode of elution, isocratic mode, flow rate (1.00 mL min–1), detection (λ = 230 nm), total run time (8 min), and BPA retention time (5.3 min).
The degradation kinetics was estimated at the optimized conditions, but using 10.0 mg of the photocatalyst instead of 5.0 mg. The experiments were performed at random in the visible (Taschibra, daylight 20 W) and ultraviolet (Empalux, 24 W) regions. In accordance with Wang et al. [53], experiments with scavengers (2.0 mmol L–1) were also performed. The scavengers were added just before the BLB lamp was turned on (Table 3).

3.4. Identification of the DPs and Ecotoxicity Estimation

The LC-MS/MS analyses were performed in the following equipment: LC-20AD Prominence Series UHPLC connected to an Esquire 6000 Ion Trap (IT) from Bruker Daltonics (Bremen, Germany), electrospray ion source. Column x-TERRA MS (WatersTM, Milford, MA, USA) 5.0 µm 150 × 2.1 mm, gradient elution with 0.05% ammonium hydroxide in water (A) and acetonitrile (B) from 20% (B) to 90% (B) in 10 min, hold for 2 min, then to 20% in 15 min, flow rate (0.250 mL min–1), injection volume (15 µL). The following parameters were applied to the mass spectrometer: negative ionization mode, scan mode in the 50–500 Da range, drying gas flow rate (8.0 L min–1), nebulizer pressure (20 psi), drying temperature (300 °C), capillary voltage (3500 V). Ecotoxicities were estimated with EPA’s freeware ECOlogical Structure-Activity Relationships (ECOSAR), version 2.0.

4. Conclusions

One may conclude that the RSM (multivariate approach) was effective for synthesizing a material with optimized photocatalytic properties. Moreover, ultrasound, during the exfoliation step of the synthesis, improved reproducibility and boosted the material specific surface area.
Although fully characterizing the composite was challenging due to the similarity of the precursors, increased specific surface area and photocatalytic activity indicated the presence of rGO, helping it also to explain the higher photocatalytic activity towards BPA of the synthesized composite against pure g-C3N4, regardless of the light source used.
Regarding the environmental application of the material, using BPA as a model-pollutant at a near-environmental concentration (100 µg L–1) was crucial to deal with treatment conditions close to the ones in real-life situations, despite the analytical challenges.
It was also possible to determine that the superoxide radical was the main reactive oxygen species generated by the composite and that the material was able to almost completely degrade BPA and partially detoxify the treated solution in a short period of time.

Supplementary Materials

The following supporting information can be downloaded at: https://www.mdpi.com/article/10.3390/catal13071069/s1. Figure S1: Zeta potential versus pH curve of g-C3N4 and GO; Figure S2: Pareto’s chart for the 23 full factorial design; Figure S3: CCD response surface; Figure S4: Zeta Potential versus pH curve for the optimized composite; Figure S5: EDS (a) distribution and (b) spectrum for g-C3N4; Figure S6: EDS (a) distribution and (b) spectrum for GrO; Figure S7: Mass Spectra for BPA, DP1, and DP2; Table S1: Factors, levels, experimental matrix, and results of the initial 23 full factorial design; Table S2: Path of steepest ascent; Table S3: Factors, levels, experimental matrix, and results of CCD; Table S4: ANOVA analysis; Additional Information about the experimental procedures (Details regarding the GrO synthesis; Optmization of the rGO/g-C3N4 synthesis; Characterization); Details about the pre-optimization experiments; Optimization of the formation of rGO/g-C3N4; the precursors characterizations; Equations S1–S8.

Author Contributions

C.X. wrote the paper and performed the majority of the experiments. C.d.S.L. performed part of the kinetic experiments. B.R.L. performed the mass spectrometry experiments and wrote the respective procedure found in the Material and Methods section. C.R. discussed the ideas with the authors and reviewed the paper. E.B.A. discussed the ideas, supervised the work, and reviewed the paper. All authors have read and agreed to the published version of the manuscript.

Funding

The authors would like to thank The National Council for Scientific and Technological Development (CNPq), grant # 140410/2019-8, The Coordination for the Improvement of Higher Education Personnel (CAPES—Finance Code 001), São Paulo Research Foundation (FAPESP), process # 2018/01258-5 and The Research Network of Nanotechnology Applied to Agribusiness (AgroNano Network/Embrapa, MCTI-SisNano) for financial support.

Data Availability Statement

The data presented in this study are available on request from the corresponding author.

Acknowledgments

The authors also thank Quezia Bezerra Cass for making the mass spectrometry analyses possible.

Conflicts of Interest

The authors declare no conflict of interest. Furthermore, the funders had no role in the design of the study; in the collection, analyses, or interpretation of data; in the writing of the manuscript; or in the decision to publish the results.

References

  1. Padovan, R.N.; de Carvalho, L.S.; de Souza Bergo, P.L.; Xavier, C.; Leitão, A.; dos Santos Neto, A.J.; Lanças, F.M.; Azevedo, E.B. Degradation of hormones in tap water by heterogeneous solar TiO2-photocatalysis: Optimization, degradation products identification, and estrogenic activity removal. J. Environ. Chem. Eng. 2021, 9, 106442. [Google Scholar] [CrossRef]
  2. Krzeminski, P.; Tomei, M.C.; Karaolia, P.; Langenhoff, A.; Almeida, C.M.R.; Felis, E.; Gritten, F.; Andersen, H.R.; Fernandes, T.; Manaia, C.M.; et al. Performance of secondary wastewater treatment methods for the removal of contaminants of emerging concern implicated in crop uptake and antibiotic resistance spread: A review. Sci. Total Environ. 2019, 648, 1052–1081. [Google Scholar] [CrossRef] [PubMed] [Green Version]
  3. Ziv-Gal, A.; Flaws, J.A. Evidence for bisphenol A-induced female infertility: A review (2007–2016). Fertil. Steril. 2016, 106, 827–856. [Google Scholar] [CrossRef] [PubMed] [Green Version]
  4. Wassenaar, P.N.H.; Trasande, L.; Legler, J. Systematic review and meta-analysis of early-life exposure to bisphenol A and obesity-related outcomes in rodents. Environ. Health Perspect. 2017, 125, 106001-1–106001-15. [Google Scholar] [CrossRef] [PubMed] [Green Version]
  5. Rochester, J.R.; Bolden, A.L.; Kwiatkowski, C.F. Prenatal exposure to bisphenol A and hyperactivity in children: A systematic review and meta-analysis. Environ. Int. 2018, 114, 343–356. [Google Scholar] [CrossRef] [PubMed]
  6. Reddy, P.V.L.; Kim, K.-H.; Kavitha, B.; Kumar, V.; Raza, V.; Kalagara, S. Photocatalytic degradation of bisphenol A in aqueous media: A review. J. Environ. Manag. 2018, 213, 189–205. [Google Scholar] [CrossRef]
  7. Moma, J.; Baloyi, J. Modified titanium dioxide for photocatalytic applications. In Photocatalysts: Applications and Attributes, 1st ed.; Khan, S.B., Akhtar, K., Eds.; IntechOpen Limited: London, UK, 2019. [Google Scholar]
  8. Liu, C.; Zhang, Y.; Wu, J.; Dai, H.; Ma, C.; Zhang, Q.; Zou, Z. Ag-Pd alloy decorated ZnIn2S4 microspheres with optimal Schottky barrier height for boosting visible-light-driven hydrogen evolution. J. Mater. Sci. 2022, 114, 81–89. [Google Scholar] [CrossRef]
  9. Zhou, P.; Navid, I.A.; Ma, Y.; Xiao, Y.; Wang, P.; Ye, Z.; Zhou, B.; Sun, K.; Mi, Z. Solar-to-hydrogen efficiency of more than 9% in photocatalytic water splitting. Nature 2023, 613, 66–70. [Google Scholar] [CrossRef]
  10. Liu, C.; Zhang, Q.; Zou, Z. Recent advances in designing ZnIn2S4-based heterostructured photocatalysts for hydrogen evolution. J. Mater. Sci. 2023, 139, 167–188. [Google Scholar] [CrossRef]
  11. Zhu, H.; Zhang, C.; Xie, K.; Li, X.; Liao, G. Photocatalytic degradation of organic pollutants over MoS2/Ag-ZnFe2O4 Z-scheme heterojunction: Revealing the synergistic effects of exposed crystal facets, defect engineering, and Z-scheme mechanism. Chem. Eng. J. 2023, 453, 139775. [Google Scholar] [CrossRef]
  12. Cao, S.-W.; Yuan, Y.-P.; Fang, J.; Shahjamali, M.M.; Boey, F.Y.; Barber, J.; Loo, S.C.; Xue, C. In-situ growth of CdS quantum dots on g-C3N4 nanosheets for highly efficient photocatalytic hydrogen generation under visible light irradiation. Int. J. Hydrogen Energ 2013, 38, 1258–1266. [Google Scholar] [CrossRef]
  13. Ai, B.; Duan, X.; Sun, H.; Qiu, X.; Wang, S. Metal-free graphene-carbon nitride hybrids for photodegradation of organic pollutants in water. Catal. Today 2015, 258, 668–675. [Google Scholar] [CrossRef] [Green Version]
  14. Zhang, W.; Low, J.; Long, R.; Xiong, Y. Metal-free electrocatalysts for nitrogen reduction reaction. EnergyChem 2020, 2, 100040. [Google Scholar] [CrossRef]
  15. He, F.; Xing, C.; Xue, Y. Metal-free amino-graphdiyne for applications in electrocatalytic hydrogen evolution. J. Catal. 2021, 395, 129–135. [Google Scholar] [CrossRef]
  16. Chen, K.; Chai, Z.; Li, C.; Shi, L.; Liu, M.; Xie, Q.; Zhang, Y.; Xu, D.; Manivannan, A.; Liu, Z. Catalyst-free growth of three-dimensional graphene flakes and graphene/g-C3N4 composite for hydrocarbon oxidation. ACS Nano 2016, 10, 3665–3673. [Google Scholar] [CrossRef]
  17. Cadan, F.M.; Ribeiro, C.; Azevedo, E.B. Improving g-C3N4:WO3 Z-scheme photocatalytic performance under visible light by multivariate optimization of g-C3N4 synthesis. Appl. Surf. Sci 2021, 537, 147904. [Google Scholar] [CrossRef]
  18. Mural, P.K.S.; Sharma, M.; Madras, G.; Bose, S. A critical review on in situ reduction of graphene oxide during preparation of conducting polymeric nanocomposites. RSC Advances 2015, 5, 32078–32087. [Google Scholar] [CrossRef] [Green Version]
  19. Nikokavoura, A.; Trapalis, C. Alternative photocatalysts to TiO2 for the photocatalytic reduction of CO2. Appl. Surf. Sci. 2017, 391, 149–174. [Google Scholar] [CrossRef]
  20. Nikokavoura, A.; Trapalis, C. Graphene and g-C3N4 based photocatalysts for NOx removal: A review. Appl. Surf. Sci. 2018, 430, 18–52. [Google Scholar] [CrossRef]
  21. Meng, X.; Zhang, Z. Two dimensional graphitic materials for photoelectrocatalysis: A short review. Cat. Today 2018, 315, 2–8. [Google Scholar] [CrossRef]
  22. Hao, Q.; Hao, S.; Niu, X.; Li, X.; Chen, D.; Ding, H. Enhanced photochemical oxidation ability of carbon nitride by π–π stacking interactions with graphene. Chin. J Catal. 2017, 38, 278–286. [Google Scholar] [CrossRef]
  23. Gu, Y.; Yu, Y.; Zou, J.; Shen, T.; Xu, Q.; Yue, X.; Meng, J.; Wang, J. The ultra-rapid synthesis of rGO/g-C3N4 composite via microwave heating with enhanced photo-catalytic performance. Mater. Lett. 2018, 232, 107–109. [Google Scholar] [CrossRef]
  24. Qian, J.; Yan, J.; Shen, C.; Xi, F.; Dong, X.; Liu, J. Graphene quantum dots-assisted exfoliation of graphitic carbon nitride to prepare metal-free zero-dimensional/two-dimensional composite photocatalysts. J. Mater. Sci. 2018, 53, 12103–12114. [Google Scholar] [CrossRef]
  25. Wan, J.; Pu, C.; Wang, R.; Liu, E.; Du, X.; Bai, X.; Fan, J.; Hu, X. A facile dissolution strategy facilitated by H2SO4 to fabricate a 2D metal-free g-C3N4/rGO heterojunction for efficient photocatalytic H2 production. Int. J. Hydrogen Energ. 2018, 43, 7007–7019. [Google Scholar] [CrossRef]
  26. Chen, Y.-H.; Wang, B.-K.; Hou, W.-C. Graphitic carbon nitride embedded with graphene materials towards photocatalysis of bisphenol A: The role of graphene and mediation of superoxide and singlet oxygen. Chemosphere 2021, 278, 130334. [Google Scholar] [CrossRef] [PubMed]
  27. Aleksandrzak, M.; Kukulka, W.; Mijowska, E. Graphitic carbon nitride/graphene oxide/reduced graphene oxide nanocomposites for photoluminescence and photocatalysis. Appl. Surf. Sci. 2017, 398, 56–62. [Google Scholar] [CrossRef]
  28. Duan, H.; Wang, D.; Li, Y. Green chemistry for nanoparticle synthesis. Chem. Soc. Rev. 2015, 44, 5778–5792. [Google Scholar] [CrossRef] [PubMed]
  29. Liu, Q.; Guo, Y.; Chen, Z.; Zhang, Z.; Fang, X. Constructing a novel ternary Fe(III)/graphene/g-C3N4 composite photocatalyst with enhanced visible-light driven photocatalytic activity via interfacial charge transfer effect. Appl. Catal. B-Environ. 2016, 183, 231–241. [Google Scholar] [CrossRef]
  30. Kasinathan, M.; Thiripuranthagan, S.; Sivakumar, A. Fabrication of metal-free 2D/2D g-C3N4/rGO composite towards the degradation of harmful organics. Optik 2020, 219, 165023. [Google Scholar] [CrossRef]
  31. Bruns, R.E.; Scaramino, I.S.; Barros Neto, B. Statistical Design—Chemometrics, 1st ed.; Elsevier: Amsterdam, The Netherlands, 2006; p. 422. [Google Scholar]
  32. He, H.; Huang, L.; Zhong, Z.; Tan, S. Constructing three-dimensional porous graphene-carbon quantum dots/g-C3N4 nanosheet aerogel metal-free photocatalyst with enhanced photocatalytic activity. Appl. Surf. Sci. 2018, 441, 285–294. [Google Scholar] [CrossRef]
  33. Chen, Q.; Cai, D.; Zhan, H. Construction of reduced graphene oxide nanofibers and cobalt sulfide nanocomposite for pseudocapacitors with enhanced performance. J. Alloy Compd. 2017, 706, 126–132. [Google Scholar] [CrossRef]
  34. Blanton, T.N.; Majumdar, D. Characterization of X-ray irradiated graphene oxide coatings using X-ray diffraction, X-ray photoelectron spectroscopy, and atomic force microscopy. Powder Diffr. 2013, 28, 68–71. [Google Scholar] [CrossRef] [Green Version]
  35. Ma, T.Y.; Tang, Y.; Dai, S.; Qiao, S.Z. Proton-functionalized two-dimensional graphitic carbon nitride nanosheet: An excellent metal-/label-free biosensing platform. Small 2014, 10, 2382–2389. [Google Scholar] [CrossRef] [PubMed]
  36. Sun, B.-W.; Yu, H.-Y.; Yang, Y.-J.; Li, H.-J.; Zhai, C.-Y.; Qian, D.-J.; Chen, M. New complete assignment of X-ray powder diffraction patterns in graphitic carbon nitride using discrete Fourier transform and direct experimental evidence. Phys. Chem. Chem. Phys. 2017, 19, 26072–26084. [Google Scholar] [CrossRef] [PubMed]
  37. Silva, G.T.; Carvalho, K.T.; Lopes, O.F.; Ribeiro, C. g-C3N4/Nb2O5 heterostructures tailored by sonochemical synthesis: Enhanced photocatalytic performance in oxidation of emerging pollutants driven by visible radiation. Appl. Catal. B-Environ. 2017, 216, 70–79. [Google Scholar] [CrossRef]
  38. Malagutti, A.R.; Mourão, H.A.J.L.; Garbin, J.R.; Ribeiro, C. Deposition of TiO2 and Ag:TiO2 thin films by the polymeric precursor method and their application in the photodegradation of textile dyes. Appl. Catal. B Environ. 2009, 90, 205–212. [Google Scholar] [CrossRef]
  39. Mousavi, M.; Habibi-Yangjeh, A.; Abitorabi, M. Fabrication of novel magnetically separable nanocomposites using graphitic carbon nitride, silver phosphate and silver chloride and their applications in photocatalytic removal of different pollutants using visible-light irradiation. J. Colloid Interf. Sci. 2016, 480, 218–231. [Google Scholar] [CrossRef]
  40. Ji, H.; Chang, F.; Hu, X.; Qin, W.; Shen, J. Photocatalytic degradation of 2,4,6-trichlorophenol over g-C3N4 under visible light irradiation. Chem. Eng. J. 2013, 218, 183–190. [Google Scholar] [CrossRef]
  41. Wang, Y.; Cao, D.; Liu, M.; Zhao, X. Insights into heterogeneous catalytic activation of peroxymonosulfate by Pd/g-C3N4: The role of superoxide radical and singlet oxygen. Catal. Commun. 2017, 102, 85–88. [Google Scholar] [CrossRef]
  42. Bauer, R.; Fallmann, H. The photo-Fenton oxidation—A cheap and efficient wastewater treatment method. Res. Chem. Intermediat. 1997, 23, 341–354. [Google Scholar] [CrossRef]
  43. Zhao, J.; Wang, X.; Xu, Z.; Loo, J.S.C. Hybrid catalysts for photoelectrochemical reduction of carbon dioxide: A prospective review on semiconductor/metal complex co-catalyst systems. J. Mater. Chem. 2014, 2, 15228–15233. [Google Scholar] [CrossRef]
  44. Sepehrmansourie, H.; Alamgholiloo, H.; Noroozi Pesyan, N.; Zolfigol, M.A. A MOF-on-MOF strategy to construct double Z-scheme heterojunction for high-performance photocatalytic degradation. Appl. Catal. B 2023, 321, 122082. [Google Scholar] [CrossRef]
  45. Kondrakov, A.O.; Ignatev, A.N.; Frimmel, F.H.; Bräse, S.; Horn, H.; Revelsky, A.I. Formation of genotoxic quinones during bisphenol A degradation by TiO2 photocatalysis and UV photolysis: A comparative study. Appl. Catal. B Environ. 2014, 160–161, 106–114. [Google Scholar] [CrossRef]
  46. Li, K.Y.; Kuo, C.H.; Weeks Junior, J.L. A kinetic study of ozone-phenol reaction in aqueous solutions. AIChE J. 1979, 25, 583–591. [Google Scholar] [CrossRef]
  47. Lerner, H.-W.; Margraf, G.; Kretz, T.; Schiemann, O.; Bats, J.; Dürner, G.; Fabrizi de Biani, F.; Zanello, P.; Bolte, M.; Wagner, M. Redox behavior of pyrazolyl-substituted 1,4-dihydroxyarenes: Formation of the corresponding semiquinones, quinhydrones and quinones. Z. Naturforsch. B 2006, 61, 252–264. [Google Scholar] [CrossRef]
  48. Gupta, P.K. (Ed.) General toxicology. In Illustrated Toxicology: With Study Questions, 1st ed.; Academic Press: London, UK, 2018; pp. 1–65. [Google Scholar]
  49. de Furtado, R.X.S.; Sabatini, C.A.; Zaiat, M.; Azevedo, E.B. Perfluorooctane sulfonic acid (PFOS) degradation by optimized heterogeneous photocatalysis (TiO2/UV) using the response surface methodology (RSM). J. Water Process. Eng. 2021, 41, 101986. [Google Scholar] [CrossRef]
  50. Chen, J.; Yao, B.; Li, C.; Shi, G. An improved Hummers method for eco-friendly synthesis of graphene oxide. Carbon 2013, 64, 225–229. [Google Scholar] [CrossRef]
  51. Khan, H.; Rigamonti, M.G.; Patience, G.S.; Boffito, D.C. Spray dried TiO2/WO3 heterostructure for photocatalytic applications with residual activity in the dark. Appl. Catal. B Environ. 2017, 226, 311–323. [Google Scholar] [CrossRef]
  52. Yiantzi, E.; Psillakis, E.; Tyrovola, K.; Kalogerakis, N. Vortex-assisted liquid–liquid microextraction of octylphenol, nonylphenol and bisphenol-A. Talanta 2010, 80, 2057–2062. [Google Scholar] [CrossRef]
  53. Wang, Y.; Wang, Y.; Yu, L.; Wang, J.; Du, B.; Zhang, X. Enhanced catalytic activity of templated-double perovskite with 3D network structure for salicylic acid degradation under microwave irradiation: Insight into the catalytic mechanism. Chem. Eng. J. 2019, 368, 115–128. [Google Scholar] [CrossRef]
Figure 1. XRD of graphite oxide (GrO), graphitic carbon nitride (g-C3N4), and the composite in optimized conditions.
Catalysts 13 01069 g001
Figure 2. Scanning Electron Microscopy of (a) GrO, (b) g-C3N4, and (c) optimized rGO/g-C3N4.
Catalysts 13 01069 g002
Figure 3. EDS (a) distribution and (b) spectrum for the optimized rGO/g-C3N4.
Catalysts 13 01069 g003
Figure 4. FTIR spectra of precursors and the optimized composite: (a) GrO signals; (b) g-C3N4 and rGO/g-C3N4 signals.
Catalysts 13 01069 g004
Figure 5. (a) DRS and (b) Tauc’s plot of precursors and the optimized composite.
Catalysts 13 01069 g005
Figure 6. BPA removal kinetics.
Catalysts 13 01069 g006
Figure 7. (a) BPA structure and the proposed ones for (b) DP1 and (c) DP2.
Catalysts 13 01069 g007
Figure 8. Proposed oxidative mechanism of BPA phenolic rings.
Catalysts 13 01069 g008
Figure 9. Estimated BPA, DP1, and DP2 acute * and chronic ** ecotoxicities (ECOSAR 2.0 software). * Fish and Daphnid (LC50), Green algæ (EC50). ** Fish, Daphnid, and Green algæ (ChV).
Catalysts 13 01069 g009
Table 1. Attribution of the bands from the FTIR analysis.
BandWave Number (cm−1)Attribution
I (a)1057stretching vibration of C–O bonds of alkoxy groups
II (a)1620stretching and bending vibration of OH groups
III (a)1726stretching vibration of C=O of carboxyl groups
IV (a)3320Stretching of the O–H bonds in hydroxyl groups
I (b)806breathing mode of the triazine units
II (b)1234; 1313; 1398stretching modes of C–N bond in heterocycles
III (b)1625stretching mode of C=N bonds
IV (b)3130stretching modes of secondary and primary amines
Table 2. BPA degradations with scavengers.
ScavengerRemoval (%)
None65.0
IPA64.5
BQ42.0
KI60.0
IPA = propan-2-ol; BQ = benzoquin-1,4-one; KI = potassium iodide.
Table 3. Scavengers and respective inhibited species.
ScavengerInhibited Species
propan-2-ol (IPA)hydroxyl radical (OH)
benzoquin-1,4-one (BQ)superoxide radical (O2●–)
potassium iodide (KI)holes in the valence band (hBV+)
Disclaimer/Publisher’s Note: The statements, opinions and data contained in all publications are solely those of the individual author(s) and contributor(s) and not of MDPI and/or the editor(s). MDPI and/or the editor(s) disclaim responsibility for any injury to people or property resulting from any ideas, methods, instructions or products referred to in the content.

