Article

The Construction of p/n-Cu2O Heterojunction Catalysts for Efficient CO2 Photoelectric Reduction

1
College of Chemical Engineering, Fuzhou University, Fuzhou 350108, China
2
CAS Key Laboratory of Design and Assembly of Functional Nanostructures, and Fujian Provincial Key Laboratory of Nanomaterials, Fujian Institute of Research on the Structure of Matter, Chinese Academy of Sciences, Fuzhou 350002, China
3
Xiamen Key Laboratory of Rare Earth Photoelectric Functional Materials, Xiamen Institute of Rare-Earth Materials, Haixi Institutes, Chinese Academy of Sciences, Xiamen 361021, China
4
Fujian Science & Technology Innovation Laboratory for Optoelectronic Information of China, Fuzhou 350108, China
5
Fujian College, University of Chinese Academy of Sciences, Fuzhou 350108, China
*
Authors to whom correspondence should be addressed.
Catalysts 2023, 13(5), 857; https://doi.org/10.3390/catal13050857
Submission received: 23 March 2023 / Revised: 18 April 2023 / Accepted: 26 April 2023 / Published: 8 May 2023

Abstract

:
Cu2O is a p-type direct bandgap semiconductor with a band gap of 2~2.2 eV, which has excellent visible light absorption and utilization. However, slow charge transfer and poor stability hinder its practical application. In this paper, a facile electrodeposition approach successfully synthesized the heterostructure of p-Cu2O and n-Cu2O. The protective layer of n-Cu2O on the surface of p-Cu2O nanoparticles forms a p/n heterojunction. Due to the p/n heterojunction, the PEC performance of p/n-Cu2O is enhanced significantly. The charge separation efficiency of photogenerated electron/hole pairs in p/n-Cu2O is greatly improved. Therefore, p/n-Cu2O shows superior photoelectrochemical (PEC) CO2 reduction reaction (CO2RR) efficiency when used as a photocathode.

1. Introduction

The continuous consumption of fossil fuels to support human society’s development causes serious environmental issues and energy crises [1,2,3]. For instance, the concentration of carbon dioxide (CO2) in the air has increased to 400 ppm from 275 ppm since the industrial revolution [4]. Therefore, developing and establishing sustainable CO2-reduction technology has become one of the important ways to solve environmental problems and energy crises. Commonly used CO2 reduction methods include photocatalytic (PC) reduction, electrochemical (EC) reduction, photoelectrochemical (PEC) reduction, and coupling reduction [5,6]. Among these methods, the photocatalytic reduction has the advantages of mild reaction conditions and of being environmentally friendly. However, it has the disadvantage of low photon utilization due to low catalyst activity and weak light absorption ability [7,8,9]. Electrochemical reduction is also characterized by mild reaction conditions. Still, it has the disadvantages of low efficiency and relatively high energy consumption, leading to the problem of secondary carbon emissions [10,11]. In addition, the coupled reduction has the advantages of controllable and high-value-added products. However, it often involves multi-step reactions and expensive catalysts, which inevitably lead to the shortcomings of a complex route, poor economy, and high energy consumption, which limit its large-scale application in the industrial field [12]. Similar to photothermal synergy [13,14], photoelectrochemical CO2 reduction (CO2RR), as a practical extension of photocatalytic reduction and electrocatalytic reduction, combines the advantages of photocatalytic reduction and electrocatalytic reduction and utilizes photoelectric coordination to effectively promote carrier separation, enhance surface catalytic activity, and improve the efficiency and selectivity of CO2 conversion while reducing energy consumption [15,16]. As it is a CO2-reduction technology with excellent development potential, photoelectrocatalysis received widespread attention as soon as it was proposed [17,18]. Photoelectrochemical (PEC) conversion of CO2 reduction using solar energy is a promising technology for achieving carbon neutrality [19].
PEC systems contain p-type semiconductors as photocathodes for CO2 reduction. However, the number of semiconductors absorbing visible light with high charge separation efficiency is minimal [20]. In addition, CO2 with a linear and center-symmetric structure is highly stable, requiring about 750 kJ/mol to break the initial C=O bond [21]. The main challenges for photoelectrochemical reduction of CO2 are the intrinsic stability of CO2, the low potential of the CO2 reduction reaction (CO2RR), and the low selectivity for reduction products [22,23]. Electrons reduce the CO2 to various carbon fuels, such as CO and CH4, in a typical catalytic CO2RR. During the reaction, the catalyst plays a crucial role in providing high energy to the charge carriers and breaking the C=O bond of CO2. Regarding photocatalysts for CO2RR, several issues are generally considered, such as the absorption efficiency of sunlight, a conduction band negative enough for CO2RR, and photostability [24,25]. Therefore, photoelectrocatalysts for CO2RR with high selectivity, good stability, and excellent activity are highly anticipated.
At present, the general view is that the process of PEC CO2 reduction can be divided into five main steps: (i) light absorption, (ii) charge separation, (iii) carbon dioxide adsorption on the catalyst surface, (iv) surface redox reaction and (v) product desorption [26,27]. Together, these five processes determine the efficiency and selectivity of the reaction. In light absorption, the width of the catalyst band gap affects the light response range and determines the energy strength of photogenerated electrons [28,29,30]. So, the catalyst should have a suitable band gap to ensure a sizeable light response range. At the same time, it is sufficient to provide the high-energy photoelectrons required for carbon dioxide reduction. Previous studies considered 2–3 eV the most suitable bandgap width for CO2 photoelectroreduction [31,32]. Cuprous oxide (Cu2O) is a p-type semiconductor with a direct band gap of 2–2.2 eV [33,34,35].
Moreover, Cu2O also has high carrier mobility, sufficient Cu active sites for CO2 activation, extensive absorption of visible light, low toxicity, low processing cost, and increased natural abundance [36,37,38]. All these virtues make it a promising candidate for PEC CO2 reduction [39,40,41,42]. However, the slow charge transfer and poor stability of Cu2O seriously hinder its practical application for PEC CO2RR [43]. Therefore, it is of great research and industrial value to modify Cu2O by appropriate methods to improve the photoelectrochemical performance of Cu2O.
Constructing heterojunctions is an effective modification method. By creating a heterojunction, photogenerated electrons move from the built-in electric field to n-type semiconductors. In contrast, photogenerated holes move to p-type semiconductors, improving photo-corrosion and leading to a high electron/hole recombination rate [44,45]. Aside from the properties mentioned earlier, p-n heterojunctions have been shown to possess exceptional photoelectrochemical capabilities in CO2 reduction [2]. These heterojunctions facilitate superior charge transfer and increased photocatalytic activity due to their direct contact with CO2, reduced by the electron-enriched n-type semiconductor. n-Cu2O covers the surface of p-Cu2O to form a two-layer structure, avoiding direct exposure of p-Cu2O to light and direct contact with the electrolyte, improving problems such as photo-corrosion and high electron/hole recombination. Mixing two materials does not achieve this effect. Thus, constructing p-n heterojunctions such as In2O3@InP/Cu2O ternary heterojunction catalysts and Cu@Cu2O core-shell catalysts [46,47] has been widely used to enhance CO2 reduction efficiencies. However, using a complex multi-component catalyst strategy or a complex regulation of reaction conditions to generate specific structural heterojunction catalysts may result in a lack of stable reproducibility. Therefore, it is imperative to utilize uncomplicated and viable techniques for catalyst assembly to create p-n heterojunctions to achieve consistency and precision in the development of catalysts.
In this paper, we successfully synthesized p-Cu2O nanoparticles by electrodeposition. By depositing a protective layer of n-Cu2O nanoparticles on the surface of p-Cu2O nanoparticles, the p/n heterojunction is formed. The structure and PEC performance for CO2RR is comprehensively studied through a series of tests such as XRD, XPS, LSV, IPCE, etc. This work provides a simple and efficient approach for preparing photocathodes for high-yield PEC CO2RR.

2. Results

A series of Cu2O catalysts having different p/n heterojunction ratios were synthesized and subjected to characterization for morphology and preliminary PEC CO2 reduction activity screening, as depicted in Figures S1 and S2. The p/n Cu2O sample exhibiting the best PEC CO2 reduction performance was selected for further experimentation.

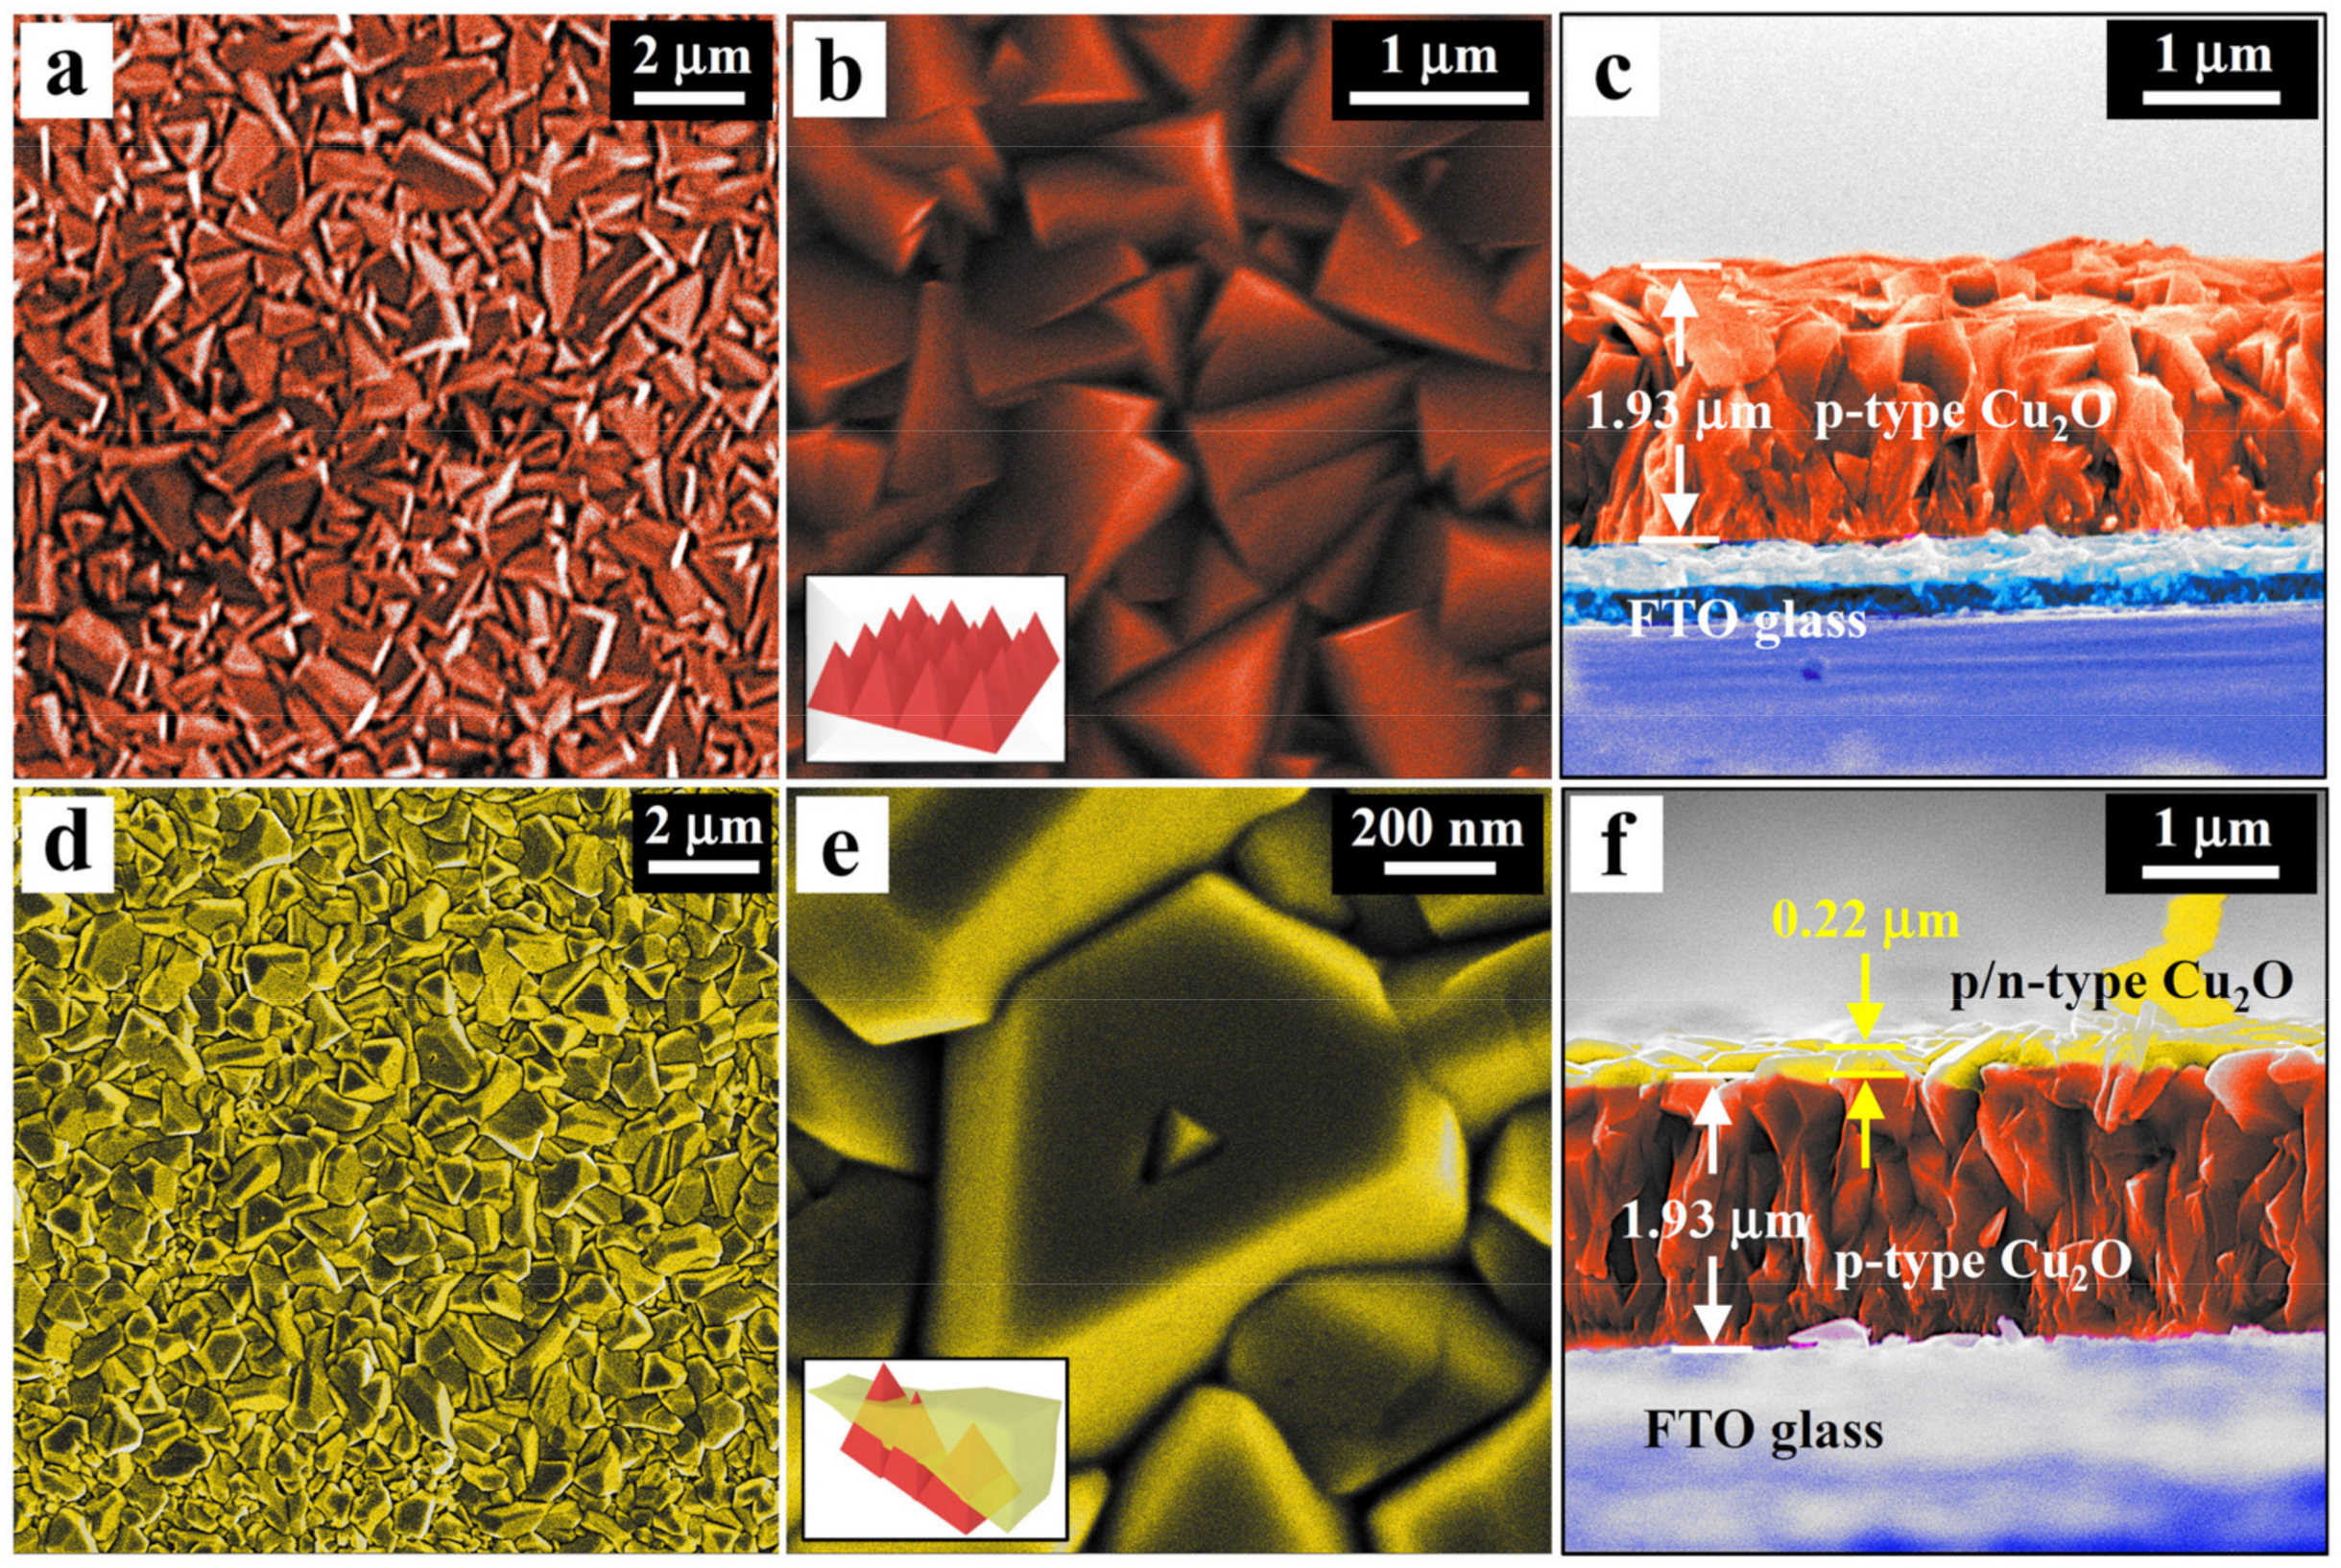
2.1. Structure and Morphology

The crystal structures of as-prepared Cu2O samples were studied by X-ray diffraction (XRD), as shown in Figure 1. The XRD peaks are mainly due to Cu2O and SnO2 substrates. The X-ray diffraction peaks of prepared p-Cu2O and p/n-Cu2O films can be well-indexed to Cu2O (PDF#77-0199). No diffraction peaks of impurities were found according to the XRD pattern. Specifically, the diffraction peaks at 29.9°, 36.72°, 42.56°, and 73.8° are attributed to the (110), (111), (200), and (311) crystal planes of Cu2O, respectively [48]. From the intensity of the diffraction peak, it is clear that p-Cu2O and p/n-Cu2O exhibit a predominant (111) orientation. The p-Cu2O and p/n-Cu2O samples have the crystal phase with no apparent peak position and intensity change, which indicates that the addition of the n-type layer did not significantly affect the crystal structure of Cu2O. Overall, the XRD results confirm the formation of high-quality p-Cu2O and p/n-Cu2O thin films with good crystallinity and no detectable impurities.
The surface morphology of the p-Cu2O and p/n Cu2O was observed using the scanning electron microscope (SEM). Figure 2a,b shows that the p-Cu2O nanoparticles are uniformly and densely deposited on a relatively smooth FTO surface. The p-Cu2O film is composed of tiny crystals in the shape of sharp pyramids. The morphology of Cu2O nanoparticles can be affected by the pH of the electrolyte and the sedimentary matrix, etc. It can be seen from Figure 2d,e that an ultra-thin protective layer of n-Cu2O on the surface of p-Cu2O makes the surface of the p-Cu2O film smoother. The cross-sectional diagram Figure 2c,f shows that the average thickness of p-type and n-type Cu2O is 1.93 μm and 0.22 μm, respectively, achieved by controlling the amount of deposited charge. In addition, the grain size of p/n-Cu2O is smaller than that of pristine p-Cu2O, which exposes more active crystal planes and retains sufficient CO2 adsorption sites for CO2RR.
The examination of the internal microstructures of both p-Cu2O and p/n-Cu2O was conducted through the utilization of sophisticated techniques and equipment such as a transmission electron microscope (TEM), a high-resolution transmission electron microscope (HRTEM), selected area electron diffraction (SAED), and energy dispersive spectrometer (EDS) mapping, as illustrated in Figure 3 and Figure 4. Figure 3a,b and Figure 4a show the HRTEM images of p-Cu2O and p/n-Cu2O, respectively. A lattice spacing of 0.308 nm corresponds to the (110) crystal plane of Cu2O, as shown in Figure 3b. The HRTEM results for p/n-Cu2O (Figure 4a) show a lattice spacing of 0.301 nm, corresponding to the (110) crystal plane of Cu2O. The EDS mapping results for p-Cu2O (see Figure 3c–e) and p/n-Cu2O (see Figure 4b–d) also confirm the uniform element distribution of Cu and O in p/n-Cu2O. The TEM, HRTEM, SAED, and EDS mapping results provide a better understanding of the structural and elemental properties of p-Cu2O and p/n-Cu2O, essential for optimizing their photoelectrochemical applications.

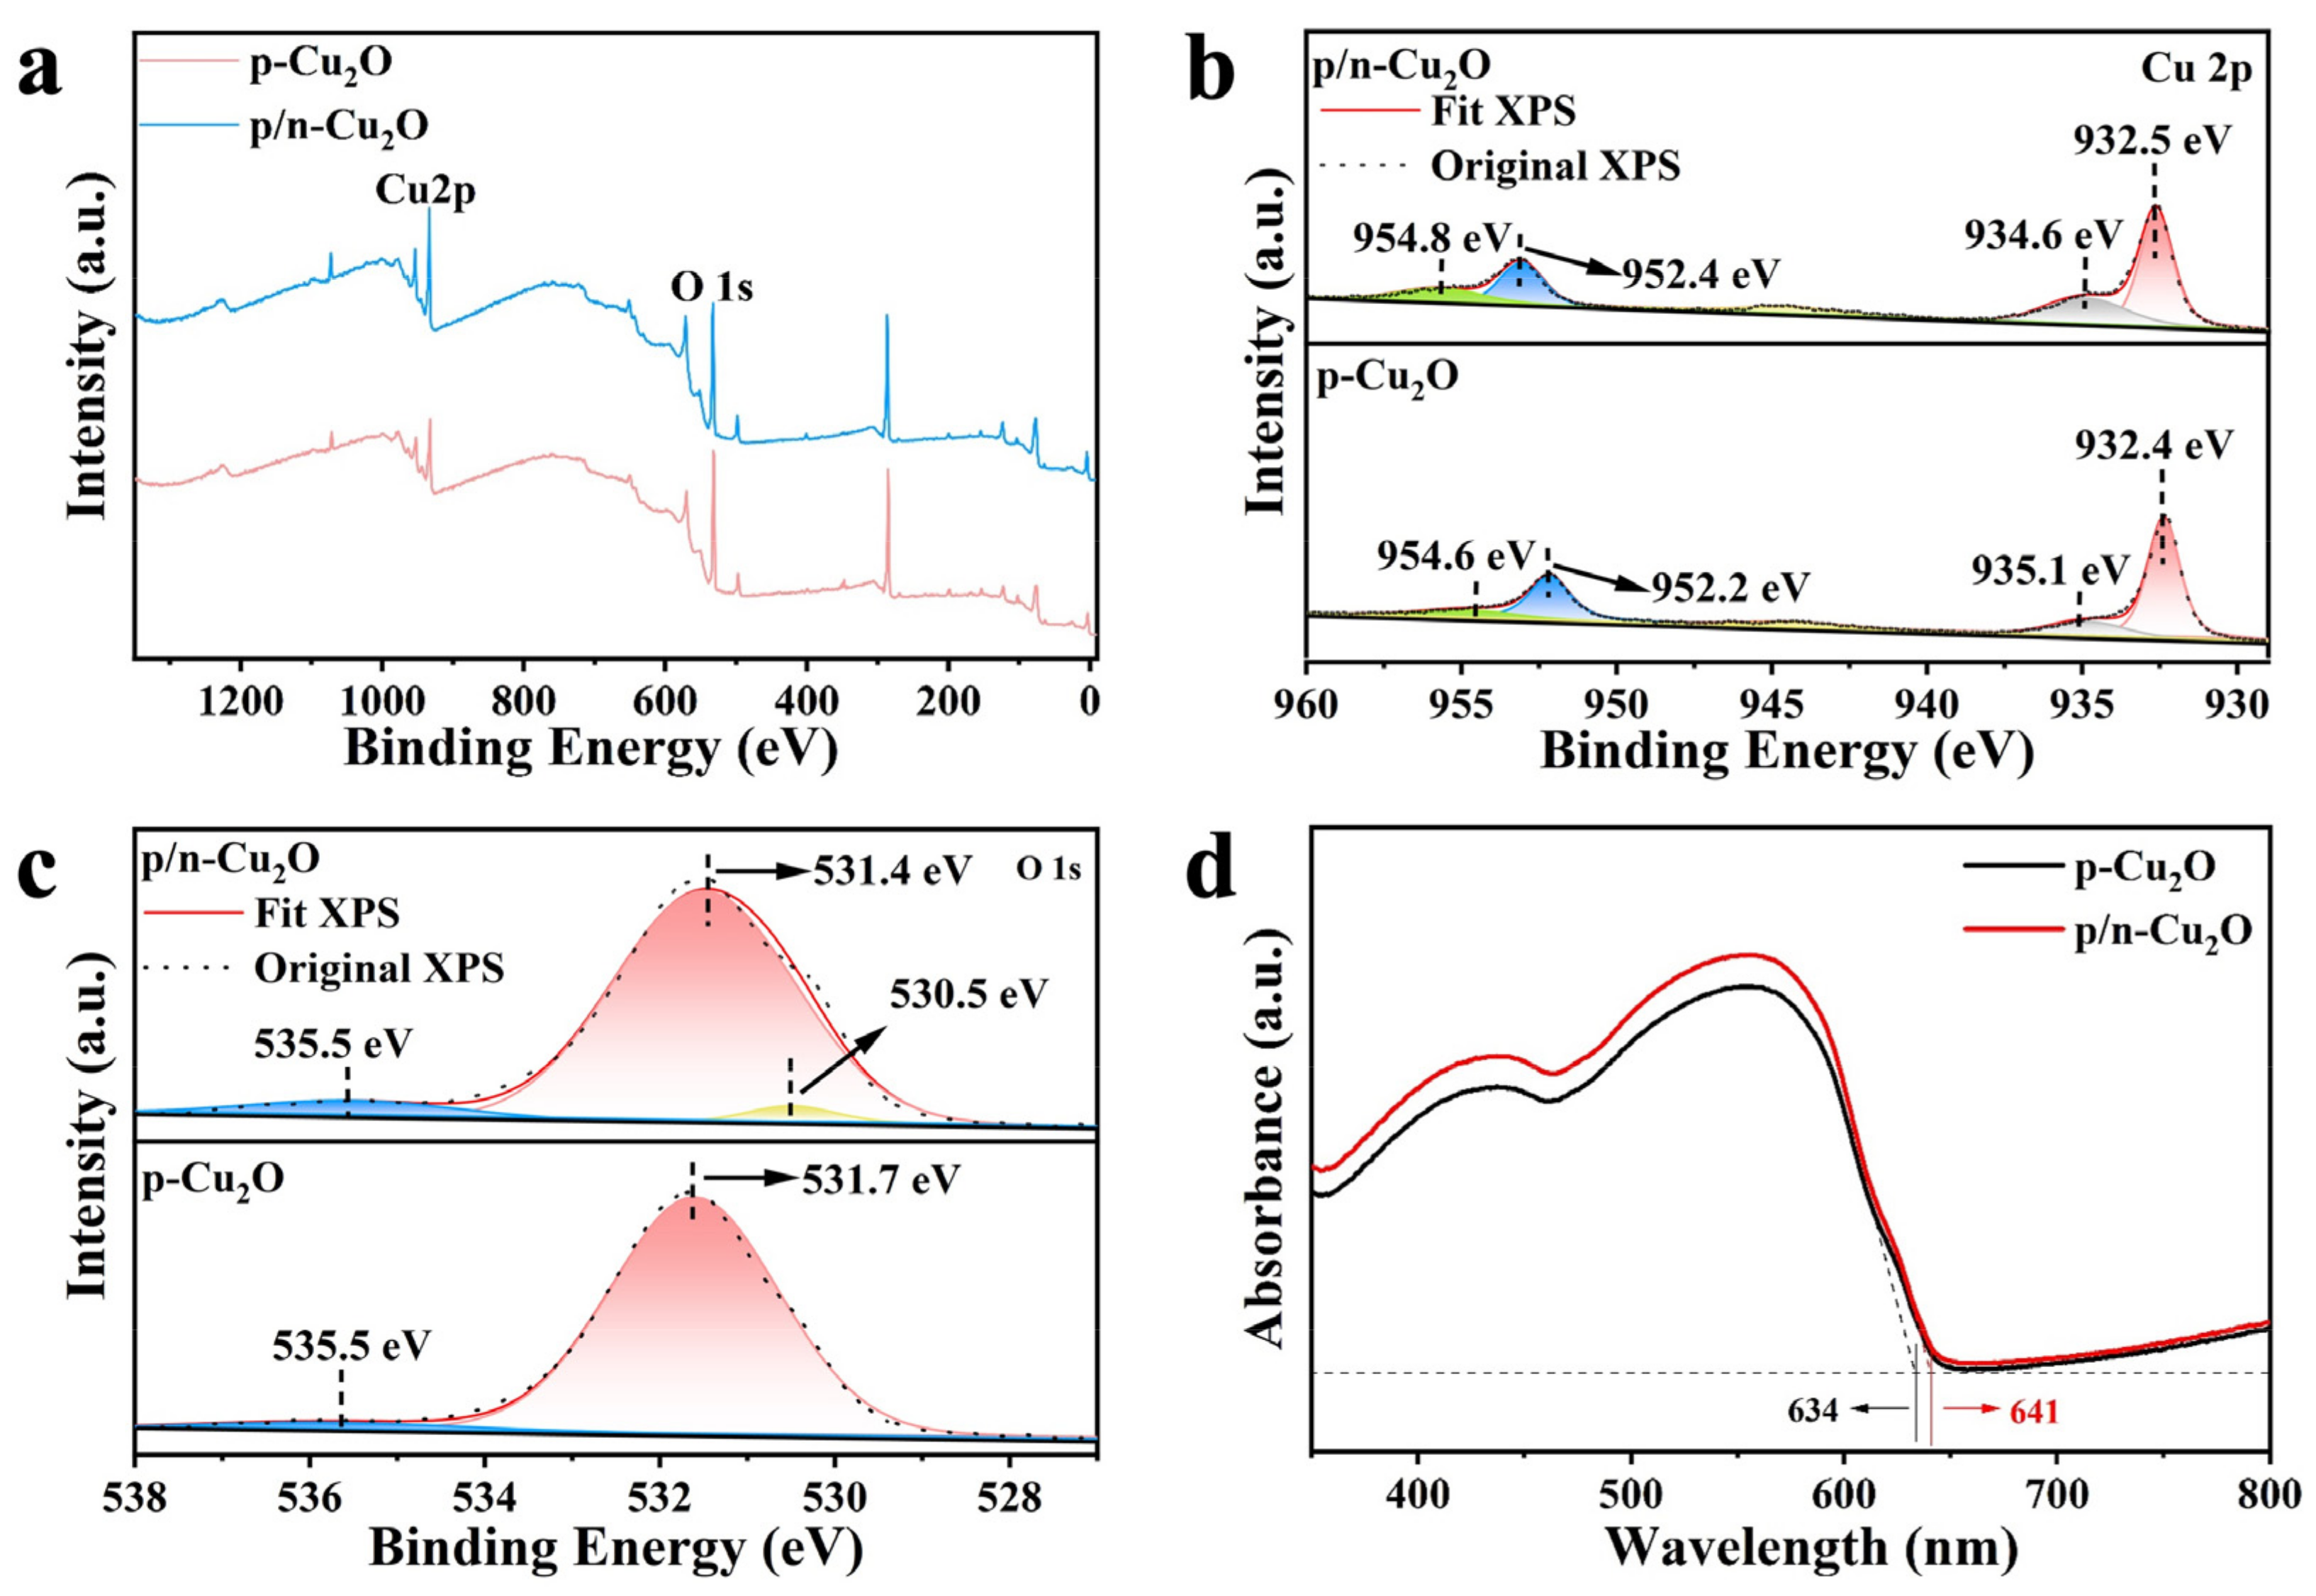
2.2. Chemical Composition and Surface Information

Since the XRD could not detect the small content of Cu (II) and Cu (0) impurities in the as-prepared Cu2O film, X-ray photoelectron spectroscopy (XPS) measurements were conducted to obtain the surface chemical composition and valence state of the p-Cu2O and p/n Cu2O samples.
As shown in Figure 5a, in the survey spectra, Cu and O can be attributed to the basic components in p-Cu2O and p/n-Cu2O, as verified by the XRD and EDS mapping results. In the Cu 2p spectra, as shown in Figure 5b, the p-Cu2O sample has two peaks at 952.2 eV and 932.4 eV with a binding difference of 19.8 eV, corresponding to the Cu+ 2p1/2 and the Cu+ 2p3/2 [49], respectively. In addition, two satellite peaks at 954.6 eV and 935.1 eV are attributed to Cu2+ 2p1/2 and Cu2+ 2p3/2, respectively. The sample of p/n-Cu2O has two peaks at 952.4 eV and 932.5 eV with a binding difference of 19.9 eV, which originate from Cu+ 2p1/2 and Cu+ 2p3/2, respectively. In addition, two satellite peaks at 954.8 eV and 934.6 eV are attributed to Cu2+ 2p3/2 and Cu2+ 2p3/2, respectively. Clearly, p-Cu2O and p/n-Cu2O contain the primary state of Cu+ and a small amount of Cu2+. In the O 1s spectra (Figure 5c), the p-Cu2O has two peaks at 535.5 eV and 531.7 eV, which are attributed to chemically adsorbed oxygen and lattice oxygen, respectively. However, the sample p/n-Cu2O has three peaks of 535.5 eV, 531.4 eV, and 530.5 eV, which are attributed to chemically adsorbed oxygen, Cu2O lattice oxygen, and CuO lattice oxygen, respectively. The presence of CuO impurities might be due to the reaction of Cu+ ions with oxygen in the air during the preparation or storage of the sample. Overall, the XPS results indicate that both p-Cu2O and p/n-Cu2O samples are predominantly comprised of Cu+ ions with a small amount of Cu2+ and impurities.

3. Photocatalytic Activity for CO2RR

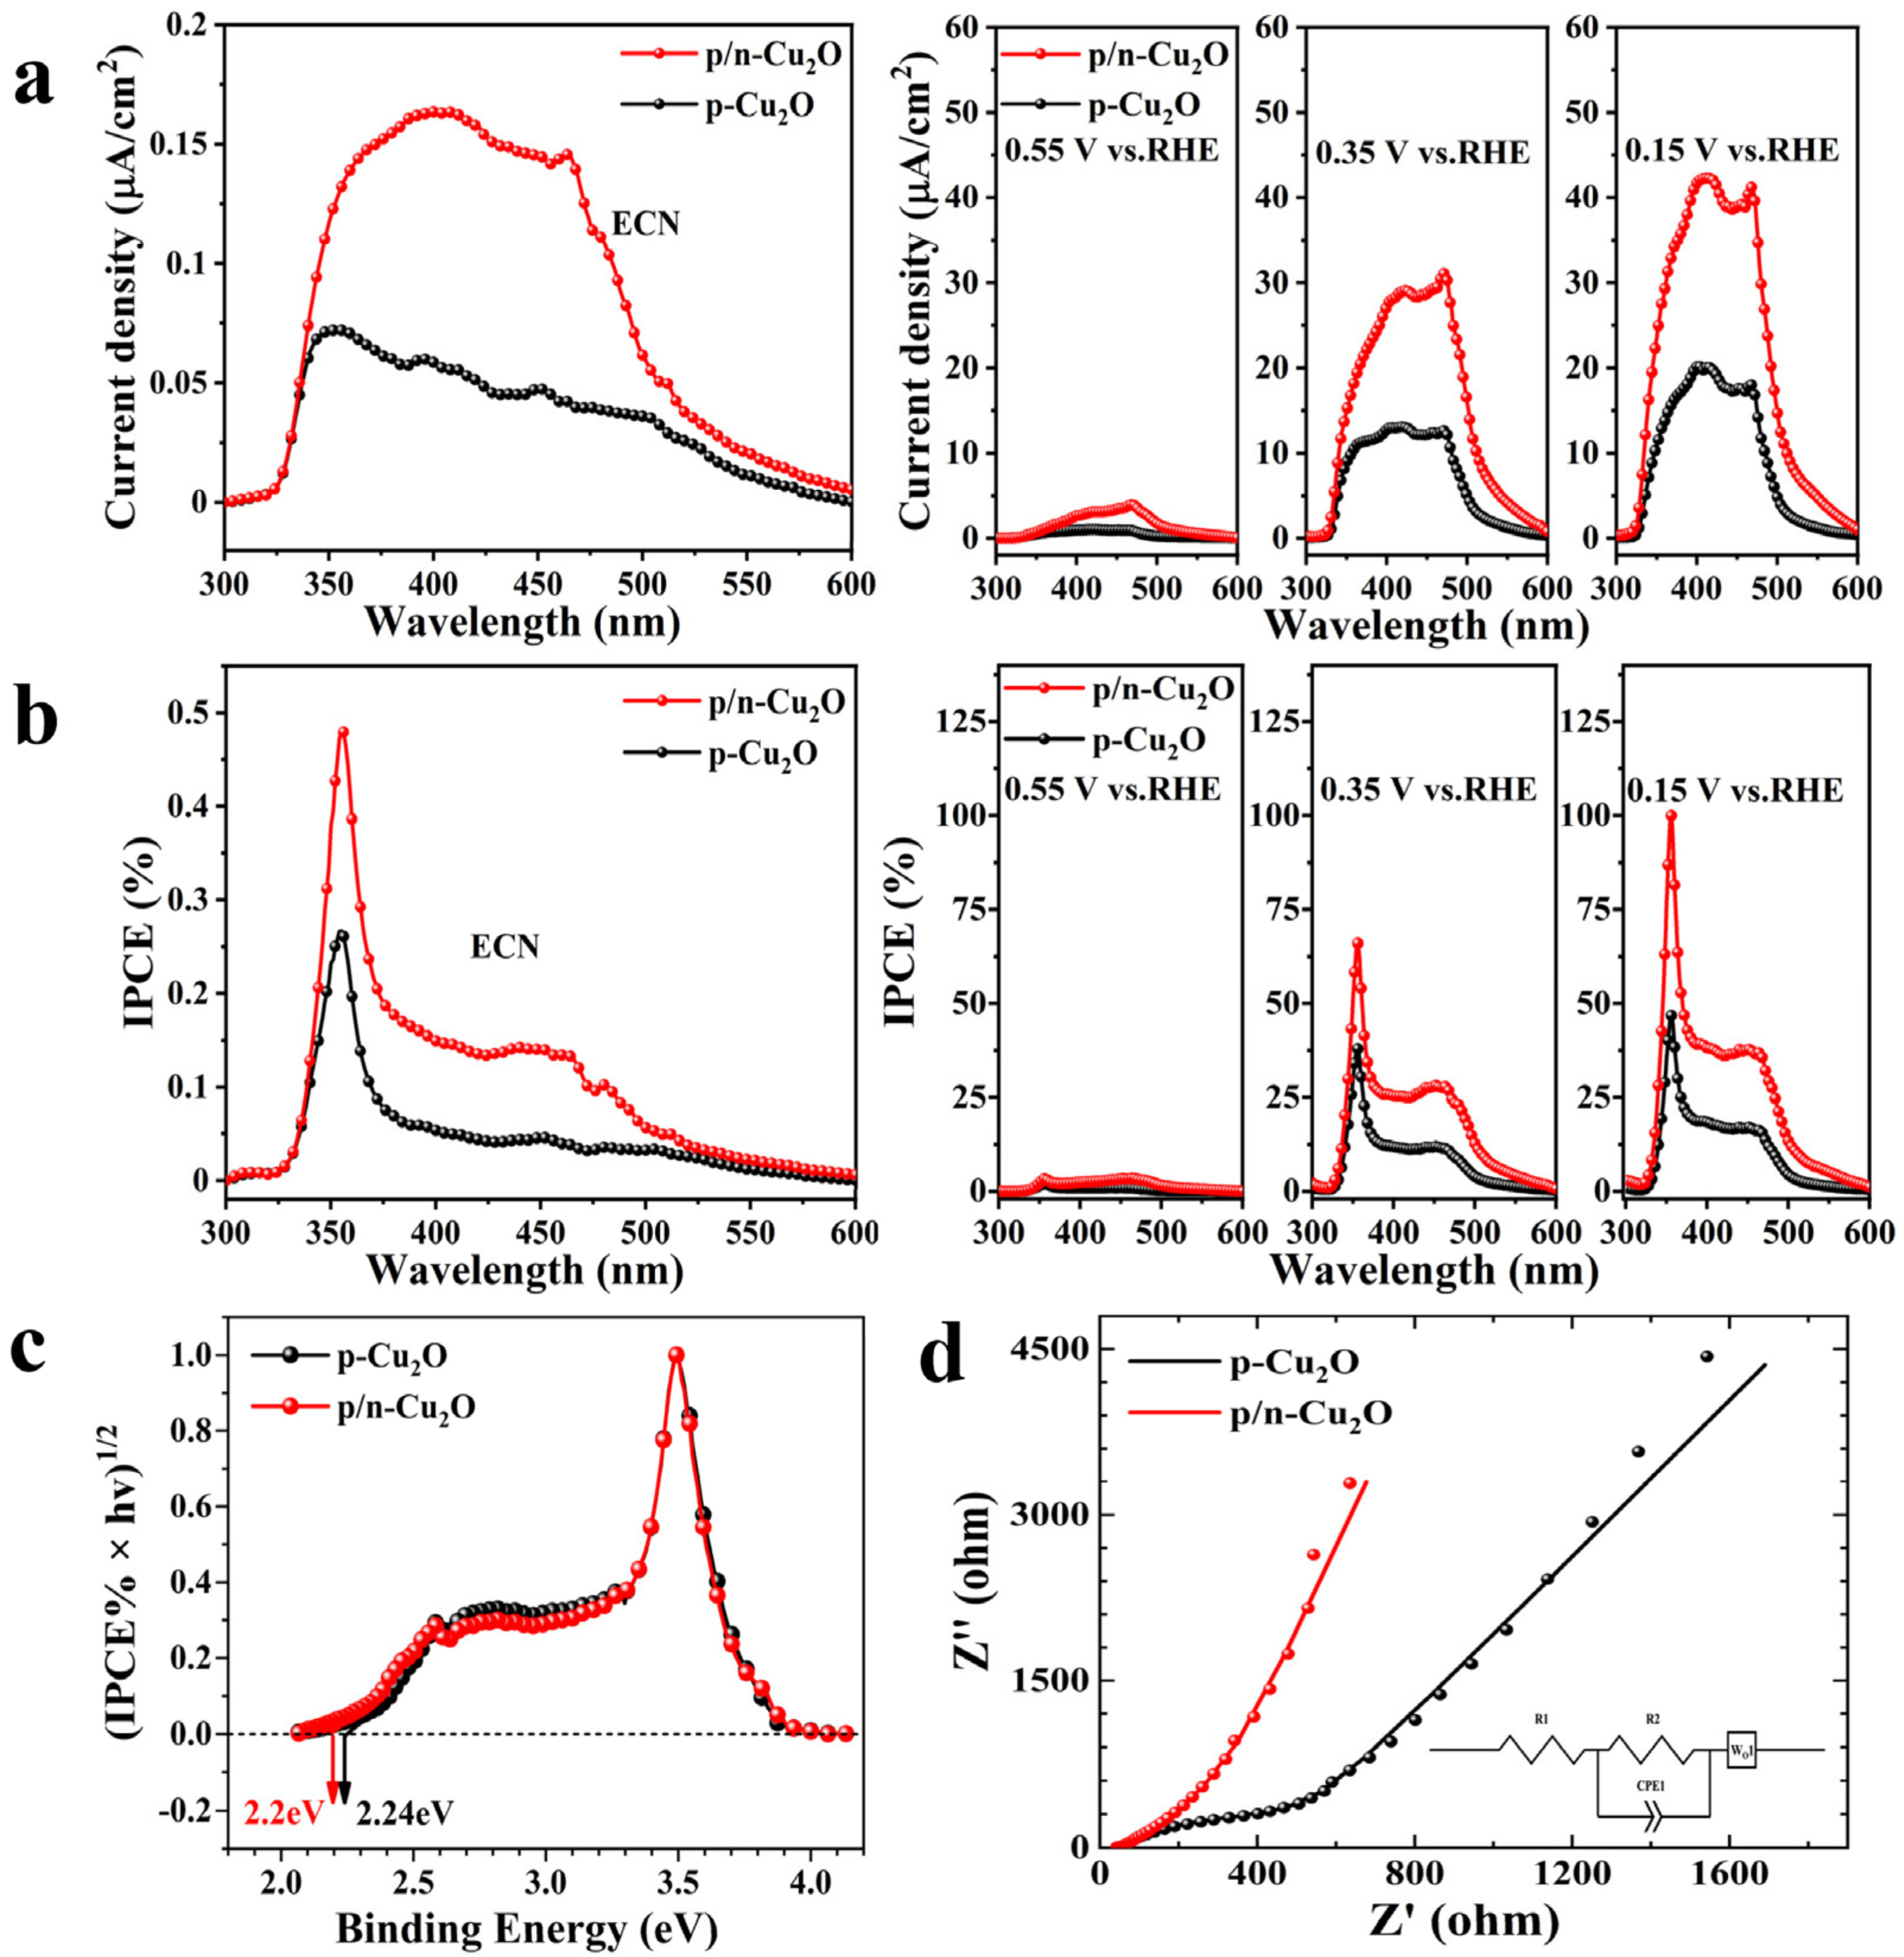
3.1. Photoelectrochemical Performance

The UV–Vis absorption spectra of Cu2O photocathodes in Figure 5d show that p-Cu2O and p/n-Cu2O have a visible response. Moreover, the light absorption of p/n-Cu2O is stronger than that of p-Cu2O in the wavelength range of 350–600 nm. Obviously, the p/n junction of Cu2O enhances light utilization. It extends the absorption edge to 641 nm, which suggests that forming a p/n junction in Cu2O can significantly improve its photoconversion efficiency and expand its spectral response. Additionally, the p/n junction enables efficient charge separation and collection, reducing recombination losses and enhancing photocurrent generation.
A series of photoelectric tests of the p-Cu2O and p/n-Cu2O samples was performed to further study their photoelectric properties. Under chopping irradiation, linear sweep voltammetry (LSV) measurement was carried out under AM 1.5 G light, as presented in Figure 6a. The photocurrent density of p/n-Cu2O is significantly higher than that of p-Cu2O. The maximum photocurrent density of p/n-Cu2O is −0.35 mA/cm2, which is 1.75 times that of p-Cu2O (−0.2 mA/cm2) at 0.15 V vs. RHE. The significantly augmented photocurrent exhibited by p/n-Cu2O can be attributed to its effective charge separation mechanism. As illustrated in Figure S4, the n-Cu2O sample shows a comparatively low photocurrent density when contrasted with the p-Cu2O and p/n-Cu2O. The primary objective of utilizing n-Cu2O is to enable the effective separation of photogenerated carriers by constructing a heterojunction with p-Cu2O, which ultimately leads to the strong photocurrent response of p/n-Cu2O. This mechanism significantly enhances the efficiency of CO2 reduction.
The chronoamperometry (I-t) measurement was used to investigate the chemical stability of the samples at 0.65 V vs. RHE, as presented in Figure 6b. The p/n-Cu2O showed a higher photocurrent density than the p-Cu2O, which resulted from the heterojunction between the p-Cu2O and the n-Cu2O. The p/n-Cu2O sample exhibited steady photocurrent densities during the long cycling, implying its photostability improved significantly.
Figure 7 shows the Mott–Schottky curve for each sample. The Mott–Schottky curves provide essential information about the flat band potential of the semiconductor material. The flat band potentials of p-Cu2O and p/n-Cu2O can be fitted using the Mott–Schottky equation of 0.802 V and 0.882 V vs. RHE, respectively. The flat band potential is infinitely close to the bottom of the semiconductor material’s valence band, indicating the valence band position of p-Cu2O and p/n-Cu2O.
The incident photon current efficiency (IPCE) of p-Cu2O and p/n-Cu2O was further evaluated. The samples of p-Cu2O and p/n-Cu2O have a photocurrent response in the 300 nm–600 nm range. The photocurrent density of p-Cu2O and p/n-Cu2O increases with the increase to applied bias, as shown in Figure 8a. In addition, the photocurrent density of p/n-Cu2O is significantly larger than that of p/n-Cu2O. Due to the n-Cu2O protective layer on the p-Cu2O, the charge separation efficiency of photogenerated electron/hole pairs of p/n-Cu2O is enhanced. The IPCE values of p-Cu2O and p/n-Cu2O gradually increase as the voltage increases, see Figure 8b. The IPCE value of p/n-Cu2O is greater than that of p-Cu2O. The bandgap of p-Cu2O and p/n-Cu2O can be evaluated by the Tauc plotting method, as shown in Figure 8c. The sample of p-Cu2O has a band gap of 2.24 eV, while p/n-Cu2O has a narrower band gap of 2.2 eV. The narrower bandgap of p/n-Cu2O facilitates visible light absorption, potentially useful for practical applications in solar energy conversion.
Moreover, the electrochemical impedance spectroscopy (EIS) shown in Figure 8d demonstrates the decreased charge transfer resistance in p/n-Cu2O due to the formed p/n heterojunction. Both holes and electrons move away from the interface, and the space charge region is widened, strengthening the internal electric field. Thus, the resistance of the internal electric field to the diffusion of electrons is enhanced, while the diffusion current is significantly reduced. At this time, the drift current of the minority carriers is formed in the p/n junction area derived from the action of the internal electric field. The drift current is greater than the diffusion current, which can be ignored. Therefore, the p/n junction presents low resistance.

3.2. CO2 Photoelectric Reduction

As shown in Figure 9, the PEC CO2RR of p-Cu2O and p/n-Cu2O was further evaluated with an automated online trace gas analysis system (Labsolar-6A) and a gas chromatograph (GC9790). The test system was assisted with an electrochemical workstation (CHI 760E) under a 300W Xenon lamp light source with an optical power of 1.9 W cm–2 (PLS-SXE300D). The electrolyte used for the measurement was prepared with acetonitrile (CH3CN), tetrabutylammonium hexafluorophosphate (C16H36F6NP), and triethanolamine (C6H15NO3) to obtain a solution with a pH of 9.3. The photoelectrochemical CO2 reduction was carried out at 0.148 V vs. RHE. The reaction temperature was 5 °C.
The active surface area was 2 × 3 cm2, the deposition charge of p-Cu2O was 3 mAh, and the deposition charge of n-Cu2O was 0.18 mAh. If Faraday efficiency is 100%, we can calculate that the masses of p-Cu2O and n-Cu2O are 7.11 mg and 0.462 mg, respectively. The reaction chamber was 500 mL, and 1 mL was sampled from the Labsolar-6A each time and sent to gas chromatography for product analysis. Figure 9a shows that during the test, the CO2 reduction rate of the p/n-Cu2O samples increased cumulatively with the products of CO and CH4. The main product is CO. By generating more effective charge separation and transfer and increasing the CO2 adsorption active site, the sample p/n-Cu2O had better PEC CO2 reduction efficiency, which is essential for converting CO2 to valuable chemical compounds. Figure 9b shows that with light illumination, no apparent product was observed when no bias voltage was applied. Therefore, we believe that electrons and photons play a synergistic role in the current system. Electrons or photons alone will not achieve the effect we want. Figure 9c shows no apparent product is produced when only bias voltage was applied (0.75 V vs. RHE, 0.45 V vs. RHE, 0.15 V vs. RHE) without light illumination. Figure 9d shows that the p/n-Cu2O exhibited excellent reduction performance within 6 h. At the fourth hour, a bias voltage of 0.15 V vs. RHE was maintained, and with the addition of a light source, there was significant product production. Figure 9d shows that the results showed that during the first 11 h, the product yield continued to increase as the reaction progressed. When the reaction time reached 11 h, the sample was inactivated, and there was almost no product regeneration. In addition, we confirmed that CO and CH4 are produced from CO2 reduction and not from other contaminations, see Figure S3.
Based on the above results, the mechanism of p/n-Cu2O for PEC CO2 reduction performance was proposed, and the energy band diagram of p-Cu2O and p/n-Cu2O is also illustrated in Figure 10. Owing to the deposition of n-Cu2O on the p-Cu2O, an internal electric field was formed in the p/n-Cu2O heterojunction under visible light irradiation. Thus, an internal electric field could effectively separate the photogenerated carriers. Photogenerated electrons move from the built-in electric field to the n-Cu2O, while holes move to the p-Cu2O. Photogenerated electrons are used for CO2 reduction. Furthermore, the p/n heterojunction narrows the band gap of Cu2O and significantly enhances the charge separation efficiency of the photogenerated electron/hole pairs. Therefore, p/n-Cu2O exhibits a high performance for improved PC/PEC CO2 reduction.

4. Materials and Methods

4.1. Materials

Fluorine-Doped Tin Oxide- (FTO) coated glass (2.2 mm thick, South China Xiang’s Science & Technology, Yiyang, Hunan, China) was used as the cathode substrate. In the experiment, acetone (C3H6O, AR ≥ 99.5%, Sinopharm Chemical Reagent Co., Ltd., Shanghai, China), absolute ethanol (C2H6O, AR ≥ 99.7%, Sinopharm Chemical Reagent Co., Ltd., Shanghai, China), lactic acid (C3H6O3, ACS ≥ 85%, Aladdin Holdings Group Co., Ltd., Beijing, China), copper sulfate pentahydrate (Cu2SO4·5H2O, AR ≥ 99%, Sinopharm Chemical Reagent Co., Ltd., Shanghai, China), sodium hydroxide (NaOH, AR, Sinopharm Chemical Reagent Co., Ltd., Shanghai, China), copper acetate (C4H6CuO4, AR ≥ 98%, Shanghai Titan Scientific Co., Ltd., Shanghai, China), acetic acid (C2H4O2, AR, Sinopharm Chemical Reagent Co., Ltd., Shanghai, China), acetonitrile (CH3CN, AR ≥ 99.9%, water ≤ 50 ppm, Adamas-Beta, Shanghai Titan Scientific Co., Ltd., Shanghai, China), tetrabutylammonium hexafluorophosphate (C16H36F6NP, AR ≥ 97%, Bide Pharmatech Co., Ltd., Shanghai, China), and triethanolamine (C6H15NO3, AR ≥ 99.0%, Shanghai Titan Scientific Co., Ltd., Shanghai, China) were all purchased from commercial sources. Deionized water was used in all the experiments (prepared by a laboratory ultrapure water machine, GZY-P10-W, Hunan Kertone Water Treatment Co., Ltd., Changsha, China).

4.2. Synthesis Methods

The process for preparing p-Cu2O and p/n-Cu2O is illustrated in Figure 11. The FTO substrate was cleaned by sonication in acetone, deionized water, and absolute ethanol for 30 min, then dried in a nitrogen stream. The p/n-Cu2O was then deposited onto the FTO substrate using a simple two-step electrodeposition method. The FTO substrate served as the working electrode, while Pt and Ag/AgCl were used as counter and reference electrodes, respectively. The electrodeposition was carried out using an electrochemical workstation (CHI-760E, Shanghai Chenhua, Shanghai, China).
In the first step, we prepared an aqueous solution of 1.5 M lactic acid and 0.2 M copper sulfate pentahydrate (1:1 in volume). A total of 4.0 M sodium hydroxide solution was added to adjust the pH to 10. The electrodeposition was performed at −0.5 V vs. Ag/AgCl in a water bath at 60 °C, with a deposited charge of 0.5 mAh/cm2. After deposition, the sample was rinsed with deionized water and dried at room temperature.
The second step used an aqueous solution containing 0.02 mol/L copper acetate and 0.08 mol/L acetic acid. A total of 4.0 M sodium hydroxide solution was added to adjust the pH to 4.9. The electrodeposition was performed at 0.02 V vs. Ag/AgCl in a water bath at 70 °C, with a deposited charge of 0.03 mAh/cm2. After deposition, p/n-Cu2O nanoparticles were obtained by rinsing the sample with deionized water and drying it at room temperature [50].

4.3. Electrochemistry (EC) and Photoelectrochemical (PEC) Testing

The PEC performance of p-Cu2O and p/n-Cu2O was measured using a standard three-electrode configuration with a side quartz window. The solution used for the measurement was prepared with acetonitrile, tetrabutylammonium hexafluorophosphate (0.1 mol/L), and triethanolamine (0.1 mol/L) to obtain a solution with a pH of 9.3. Before PEC measurements, the solution was deoxygenated by bubbling high-purity CO2 for 20 min. Platinum and Ag/AgCl electrodes (saturated with KCl) were used as working and reference electrodes. The working electrode was fabricated on a fluorine-doped tin oxide (FTO) glass substrate (1 × 2 cm2) and utilized for PEC measurements.
For testing linear sweep voltammetry (LSV) and chronoamperometry (I-t), a three-electrode side window electrolytic cell was used to form the PEC reaction system, along with a high uniformity integrated Xenon light source (PLS-FX300HU, Beijing Perfectlight Technology Co., Ltd., Beijing, China) and an AM 1.5G filter (100 mW/cm2). The PEC reaction system was connected to an electrochemical workstation (CHI-760E).
LSV measurements were conducted by scanning the potential over a range of 0 to −0.6 V (relative to Ag/AgCl) at a scanning speed of 5 mV/s, with the light being cut off by a shutter at a frequency of 5 s−1. Chronoamperometry (I-t) was performed under alternating illumination at −0.1 V (relative to Ag/AgCl) for a test duration of 950 s with a 30 s interval. During the test, the working electrode was fully submerged in the electrolyte and had a guaranteed illuminated area of 1 cm2. The voltage measurements were converted to the Reversible Hydrogen Electrode (RHE) scale using the Nernst equation:
E R H E = E A g / A g C l + 0.0592 × p H + E A g / A g C l 0  
where E Ag / AgCl 0 = 0.1976 V vs. Ag/AgCl at room temperature.
A photo-electrochemical test system (IPCE1000, Beijing Perfectlight Technology Co., Ltd., Beijing, China) was used for testing incident photon-to-current efficiency (IPCE). This system consisted of a 300 W Xenon lamp light source (PLS-SXE300D, Beijing Perfectlight Technology Co., Ltd., Beijing, China), a grating monochromator (7ISU, SOFN instruments co., Ltd., Beijing, China) with filters to eliminate higher order diffraction, and an electrochemical workstation (CS350H, Wuhan Corrtest Instrument Corp., Ltd., Wuhan, China). The IPCE was calculated using the following equation:
I P C E % = 1240 × J λ × I 0 × 100 %  
where J is the photocurrent density measured at a specific wavelength, λ is the specific wavelength, and I0 is the intensity of the incident light.
The EC performance of p-Cu2O and p/n-Cu2O was evaluated using a standard three-electrode configuration with a side quartz window. The electrolyte solution consisted of acetonitrile and tetrabutylammonium hexafluorophosphate (0.1 mol/L), producing a pH of 7. Before measurements, the solution was deaerated by bubbling high-purity Ar for 20 min.
An electrochemical workstation (Squidstat Plus, Admiral Instruments, Tempe, AZ, USA) was used to conduct electrochemical impedance spectroscopy (EIS) and Mott–Schottky (M-S) curves. The fitted circuit can be obtained from the EIS curve, which calculates the CPE element. The impedance of the CPE in an AC circuit is:
C P E = σ ω m cos m π 2 j s i n m π 2
where σ is the prefactor of the CPE, ω is the angular frequency, m is the CPE index (0 ≤ m ≤ 1), and j is an imaginary number j = 1 ; if m = 1, then the CPE denotes the ideal capacitor C.
The frequency range of the electrochemical analyzer was 0.01 to 100,000 Hz with voltage increments of 0.005 V and an AC amplitude of 10 mV. The working electrodes were tested at 1000 Hz, 1500 Hz, and 2000 Hz.

4.4. Photoelectrochemical (PEC) CO2 Reduction Reaction Performances Testing

The PEC CO2 reduction reaction test was conducted using an automated online trace gas analysis system (Labsolar-6A, Beijing Perfectlight Technology Co., Ltd., Beijing, China) and a gas chromatograph (GC9790, Fuli Instruments, Wenling, Zhejiang, China). A 300 W Xenon lamp (PLS-SXE300D, Beijing Perfectlight Technology Co., Ltd., Beijing, China) was used with an optical power of 1.9 W cm–2. The electrolyte used for the measurement was prepared with acetonitrile, tetrabutylammonium hexafluorophosphate (0.1 mol/L), and triethanolamine (0.1 mol/L) to obtain a solution with a pH of 9.3. The photoelectrochemical CO2 reduction was carried out at –0.6 V vs. Ag/AgCl (0.148 V vs. RHE) at the Labsolar-6A, which was assisted by an electrochemical workstation (CHI-760E). The reaction temperature was maintained at 5 °C using a water-cooling system that circulated condensed water throughout the reaction process. Samples were taken with a sampling needle every 1 h and analyzed using the gas chromatograph to obtain the peak area. The content of the gas phase product was then calculated using the standard external method. The following equation was used to calculate the yield for CO2 reduction products:
Y = n × V S
where S is the sample area, S = 6 cm2; V is the volume of the reaction chamber in the Labsolar-6A, V= 500 mL; and n is the molar amount of the product.

4.5. Materials Characterization

The morphology of the samples was observed using a Scanning Electron Microscope (SEM, Apreo S LoV ac, Thermo Fisher Scientific, Waltham, MA, USA) with an operating voltage of 10 kV.
X-ray diffraction (XRD) data were collected using an X-ray diffractometer (Miniflex 600, Akishima, Rigaku, Tokyo, Japan) with CuK radiation within a measurement range of 20–80°.
Transmission Electron Microscopy (TEM), selected area electron diffraction (SAED), and High-Resolution Transmission Electron Microscopy (HRTEM) images were performed on a TF20 (FEI) operating at 200 kV (Thermo Fisher Scientific, Waltham, MA, USA).
The samples’ atomic composition and surface state were characterized using X-ray photoelectron spectroscopy using Al Ka rays as the excitation source (XPS, Thermo Scientific K–Alpha, Waltham, MA, USA)
The UV–vis absorption spectra were obtained using a Cary 5000 spectrophotometer (Agilent, Santa Clara, CA, USA).

5. Conclusions

In summary, by a simple electrochemical deposition method, the heterostructure of p/n-Cu2O was successfully synthesized by depositing n-type Cu2O onto p-type Cu2O on an FTO substrate. The as-prepared p-Cu2O and p/n-Cu2O were employed for PEC CO2RR. SEM and TEM images showed the ordered nanofilms of n-Cu2O on the p-Cu2O. XRD and XPS demonstrated the crystal structure and chemical states of p-Cu2O and p/n-Cu2O. The catalysts with a band gap of 2~2.2 eV can be excited by visible light with a wavelength of less than 600 nm resulting in excellent PEC performance. Moreover, linear voltammetry and IPCE tests show that the photocurrent response p/n-Cu2O is improved significantly after modification. The modified catalyst of p/n-Cu2O exhibits much higher activity than pristine p-Cu2O. Therefore, the sample of p/n-Cu2O behaves with superior PEC performance for CO2RR, with the main products being CO and CH4. This work provides an insightful and effective design of catalysts for achieving promising CO2 photoelectric reduction.

Supplementary Materials

The following supporting information can be downloaded at: https://www.mdpi.com/article/10.3390/catal13050857/s1, Figure S1: The top view SEM images of (a) p-0.5mAh/n-0.02mAh Cu2O, (b) p-0.5mAh/n-0.03mAh Cu2O, (c) p-0.5mAh/n-0.04mAh Cu2O, (d) p-0.5mAh/n-0.05mAh Cu2O; Figure S2: (a) LSV curves of p-Cu2O with different amounts of deposited charge, the electrolyte: (0.1 mol/L NaHCO3); (b) LSV curves of n-Cu2O with different quantities of deposited charge, the electrolyte: (0.1 mol/L NaHCO3); (c) Time-current curves of p-Cu2O with different amounts of deposited charge; (d) Time-current curves of n-Cu2O with varying quantities of deposited charge, substrate: p-Cu2O (0.5 mAh/cm2); Figure S3: (a) CO2 reduction yield (0.1 mol/L C6H15NO3/CH3CN + 0.1 mol/L C16H36F6NP/CH3CN, pH = 9.3, the sample is FTO); (b) CO2 reduction yield (0.1 mol/L C6H15NO3/CH3CN + 0.1 mol/L C16H36F6NP/CH3CN, pH = 9.3, pass Ar); Figure S4: (a) LSV of p-Cu2O, n-Cu2O, p/n-Cu2O; (b) LSV of n-Cu2O. The electrolyte: (0.1 mol/L NaHCO3), the deposited charge: (p-Cu2O: 0.5 mAh/cm2, n-Cu2O: 0.03 mAh/cm2); Figure S5: LSV curves of multiple samples of (a) p-Cu2O (p-0.5mAh Cu2O). LSV curves of multiple samples of (b) p/n-Cu2O (p-0.5mAh/n-0.03mAh Cu2O).

Author Contributions

Conceptualization, Y.C.; methodology, Q.Z. and H.S.; investigation, R.C.; validation, M.J. and K.L.; formal analysis, X.J.; data curation, H.W.; writing—original draft preparation, Q.Z.; writing—review and editing, Y.C. and C.L.; supervision, Y.C. and C.L.; project administration, Y.C. and C.L.; funding acquisition, Y.C. and C.L. All authors have read and agreed to the published version of the manuscript.

Funding

This research was funded by the Youth Innovation Foundation of Xiamen City (3502Z20206085), the Strategic Priority Research Program of the Chinese Academy of Sciences (XDB20000000), the National Natural Science Foundation of China (21805280, 22275185 and 21962006), the Major Research Project of Xiamen (3502Z20191015), the Fujian Science & Technology Innovation Laboratory for Optoelectronic Information of China (2021ZR132, 2021ZZ115), the Natural Science Foundation of Fujian Province (2006L2005), and the Key Program of Frontier Science, CAS (QYZDJ-SSW-SLH033).

Data Availability Statement

Not applicable.

Acknowledgments

Not applicable.

Conflicts of Interest

The authors declare no conflict of interest.

References

  1. Wang, S.-Q.; Zhang, X.-Y.; Dao, X.-Y.; Cheng, X.-M.; Sun, W.-Y. Cu2O@Cu@UiO-66-NH2 ternary nanocubes for photocatalytic CO2 reduction. ACS Appl. Nano Mater. 2020, 3, 10437–10445. [Google Scholar] [CrossRef]
  2. Zhang, F.; Li, Y.-H.; Qi, M.-Y.; Tang, Z.-R.; Xu, Y.-J. Boosting the activity and stability of Ag-Cu2O/ZnO nanorods for photocatalytic CO2 reduction. Appl. Catal. B Environ. 2020, 268, 118380. [Google Scholar] [CrossRef]
  3. Li, Y.; Hu, X.-S.; Huang, J.-W.; Wang, L.; She, H.-D.; Wang, Q.-Z. Development of iron-based heterogeneous cocatalysts for photoelectrochemical water oxidation. Acta Phys.-Chim. Sin. 2021, 37, 2009022. [Google Scholar] [CrossRef]
  4. Zhang, L.-Q.; Cao, H.-Z.; Lu, Y.-H.; Zhang, H.-B.; Hou, G.-Y.; Tang, Y.-P.; Zheng, G.-Q. Effective combination of CuFeO2 with high temperature resistant Nb-doped TiO2 nanotube arrays for CO2 photoelectric reduction. J. Colloid. Interface Sci. 2020, 568, 198–206. [Google Scholar] [CrossRef] [PubMed]
  5. Navarro-Jaén, S.; Virginie, M.; Bonin, J.; Robert, M.; Wojcieszak, R.; Khodakov, A.Y. Highlights and challenges in the selective reduction of carbon dioxide to methanol. Nat. Rev. Chem. 2021, 5, 564–579. [Google Scholar] [CrossRef]
  6. Li, H.; Li, F.; Yu, J.-G.; Cao, S.-W. 2D/2D FeNi-LDH/g-C3N4 hybrid photocatalyst for enhanced CO2 photoreduction. Acta Phys.-Chim. Sin. 2020, 37, 2010073. [Google Scholar] [CrossRef]
  7. Qiu, H.-X.; Yamamoto, A.; Yoshida, H. Gallium oxide assisting ag-loaded calcium titanate photocatalyst for carbon dioxide reduction with water. ACS Catal. 2023, 13, 3618–3626. [Google Scholar] [CrossRef]
  8. Chen, Y.-X.; Gombac, V.; Montini, T.; Lavacchi, A.; Filippi, J.; Miller, H.A.; Fornasiero, P.; Vizzaa, F. An increase in hydrogen production from light and ethanol using a dual scale porosity photocatalyst. Green Chem. 2018, 20, 2299–2307. [Google Scholar] [CrossRef]
  9. Jiang, X.; Chen, Y.-X.; Lu, C.-Z. Bio-inspired materials for photocatalytic hydrogen production. Chin. J. Struct. Chem. 2020, 39, 2123–2130. [Google Scholar]
  10. Yang, F.; Elnabawy, A.O.; Schimmenti, R.; Song, P.; Wang, J.-W.; Peng, Z.-Q.; Yao, S.; Deng, R.-P.; Song, S.-Y.; Lin, Y.; et al. Bismuthene for highly efficient carbon dioxide electroreduction reaction. Nat. Commun. 2020, 11, 1088. [Google Scholar] [CrossRef]
  11. Wang, L.-Q.; Bevilacqua, M.; Chen, Y.-X.; Filippi, F.; Innocenti, M.; Lavacchi, A.; Marchionni, A.; Miller, H.; Vizza, F. Enhanced electro-oxidation of alcohols at electrochemically treated polycrystalline palladium surface. J. Power Sources 2013, 242, 872–876. [Google Scholar] [CrossRef]
  12. Yao, R.; Pinals, J.; Dorakhan, R.; Herrera, J.E.; Zhang, M.-H.; Deshlahra, P.; Chin, Y.-H. Cobalt-molybdenum oxides for effective coupling of ethane activation and carbon dioxide reduction catalysis. ACS Catal. 2022, 12, 12227–12245. [Google Scholar] [CrossRef]
  13. Yu, F.; Wang, C.-H.; Li, Y.-Y.; Ma, H.; Wang, R.; Liu, Y.-C.; Suzuki, N.; Terashima, C.; Ohtani, B.; Ochiai, T.; et al. Enhanced solar photothermal catalysis over solution plasma activated TiO2. Adv. Sci. 2020, 7, 2000204. [Google Scholar] [CrossRef] [PubMed]
  14. Yan, J.-Y.; Wang, C.-H.; Ma, H.; Li, Y.-Y.; Liu, Y.-C.; Suzuki, N.; Terashima, C.; Fujishima, A.; Zhang, X.-T. Photothermal synergic enhancement of direct Z-scheme behavior of Bi4TaO8Cl/W18O49 heterostructure for CO2 reduction. Appl. Catal. B Environ. 2020, 268, 118401. [Google Scholar] [CrossRef]
  15. Karim, K.M.R.; Tarek, M.; Sarkar, S.M.; Mouras, R.; Ong, H.R.; Abdullah, H.; Cheng, C.K.; Khan, M.M.R. Photoelectrocatalytic reduction of CO2 to methanol over CuFe2O4@PANI photocathode. Int. J. Hydrog. Energy 2021, 46, 24709–24720. [Google Scholar] [CrossRef]
  16. Wang, H.-Y.; Li, J.; Shi, H.-J.; Xie, S.-Q.; Zhang, C.-J.; Zhao, G.-H. Enhanced photoelectrocatalytic reduction and removal of atrazine: Effect of co-catalyst and cathode potential. ACS Appl. Mater. Interfaces 2019, 11, 38663–38673. [Google Scholar] [CrossRef]
  17. Silva, B.C.; Irikura, K.; Flora, J.B.S.; Santos, R.M.M.; Lachgar, A.; Frem, R.C.G.; Zanoni, M.V.B. Electrochemical preparation of Cu/Cu2O-Cu(BDC) metal-organic framework electrodes for photoelectrocatalytic reduction of CO2. J. CO2 Util. 2020, 42, 101299. [Google Scholar] [CrossRef]
  18. Liu, G.-J.; Zheng, F.; Li, J.-R.; Zeng, G.-S.; Ye, Y.-F.; Larson, D.M.; Yano, J.; Crumlin, E.J.; Ager, J.W.; Wang, L.-W.; et al. Investigation and mitigation of degradation mechanisms in Cu2O photoelectrodes for CO2 reduction to ethylene. Nat. Energy 2021, 6, 1124–1132. [Google Scholar] [CrossRef]
  19. Ding, P.; Jiang, T.-H.; Han, N.; Li, Y.-G. Photocathode engineering for efficient photoelectrochemical CO2 reduction. Mater. Today Nano 2020, 10, 100077. [Google Scholar] [CrossRef]
  20. Deng, X.; Li, R.; Wu, S.-K.; Wang, L.; Hu, J.-H.; Ma, J.; Jiang, W.-B.; Zhang, N.; Zheng, X.-S.; Gao, C.; et al. Metal-organic framework coating enhances the performance of Cu2O in photoelectrochemical CO2 reduction. J. Am. Chem. Soc. 2019, 141, 10924–10929. [Google Scholar] [CrossRef]
  21. Wang, Y.-J.; He, T. ZnTe-based nanocatalysts for CO2 reduction. Curr. Opin. Green Sustain. Chem. 2019, 16, 7–12. [Google Scholar] [CrossRef]
  22. Feng, J.-P.; Zeng, S.-J.; Liu, H.-Z.; Feng, J.-Q.; Gao, H.-S.; Bai, L.; Dong, H.-F.; Zhang, S.-J.; Zhang, X.-P. Insights into carbon dioxide electroreduction in ionic liquids: Carbon dioxide activation and selectivity tailored by ionic microhabitat. ChemSusChem 2018, 11, 3191–3197. [Google Scholar] [CrossRef]
  23. Li, C.-H.; Tong, X.; Yu, P.; Du, W.; Wu, J.; Rao, H. Carbon dioxide photo/electroreduction with cobalt. J. Mater. Chem. A 2019, 7, 16622–16642. [Google Scholar] [CrossRef]
  24. Jiao, X.-C.; Zheng, K.; Hu, Z.-X.; Sun, Y.-F.; Xie, Y. Broad-spectral-response photocatalysts for CO2 reduction. ACS Cent. Sci. 2020, 6, 653–660. [Google Scholar] [CrossRef]
  25. AlOtaibi, B.; Kong, X.; Vanka, S.; Woo, S.Y.; Pofelski, A.; Oudjedi, F.; Fan, S.; Kibria, M.G.; Botton; Ji, W.; et al. Photochemical carbon dioxide reduction on Mg-doped Ga(In)N nanowire arrays under visible light irradiation. ACS Energy Lett. 2016, 1, 246–252. [Google Scholar] [CrossRef]
  26. Fu, J.-W.; Jiang, K.-X.; Qiu, X.-Q.; Yu, J.-G.; Liu, M. Product selectivity of photocatalytic CO2 reduction reactions. Mater. Today 2020, 3, 222–243. [Google Scholar] [CrossRef]
  27. Tang, T.-M.; Wang, Z.-L.; Guan, J.-Q. Optimizing the electrocatalytic selectivity of carbon dioxide reduction reaction by regulating the electronic structure of single-atom M-N-C materials. Adv. Funct. Mater. 2022, 32, 2111504. [Google Scholar] [CrossRef]
  28. Abdullah, H.; Md. Khan, M.M.R.; Ong, H.R.; Yaakob, Z. Modified TiO2 photocatalyst for CO2 photocatalytic reduction: An overview. J. CO2 Util. 2017, 22, 15–32. [Google Scholar] [CrossRef]
  29. Talapaneni, S.N.; Singh, G.; Kim, I.Y.; AlBahily, K.; Al-Muhtaseb, A.H.; Karakoti, A.S.; Tavakkoli, E.; Vinu, A. Nanostructured carbon nitrides for CO2 capture and conversion. Adv. Mater. 2020, 32, 1904635. [Google Scholar] [CrossRef]
  30. Wang, Q.-T.; Fang, Z.-X.; Zhang, W.; Zhang, D. High-efficiency g-C3N4 based photocatalysts for CO2 reduction: Modification methods. Adv. Fiber Mater. 2022, 4, 342–360. [Google Scholar] [CrossRef]
  31. Gao, W.; Li, S.; He, H.-C.; Li, X.-N.; Cheng, Z.-X.; Yang, Y.; Wang, J.-L.; Shen, Q.; Wang, X.-Y.; Xiong, Y.-J.; et al. Vacancy-defect modulated pathway of photoreduction of CO2 on single atomically thin AgInP2S6 sheets into olefiant gas. Nat. Commun. 2021, 12, 4747. [Google Scholar] [CrossRef] [PubMed]
  32. Zhu, H.-M.; Li, Y.; Jiang, X.-C. Room-temperature synthesis of cuprous oxide and its heterogeneous nanostructures for photocatalytic applications. J. Alloy. Compd. 2019, 772, 447–459. [Google Scholar] [CrossRef]
  33. Yu, L.; Li, G.-J.; Zhang, X.-S.; Ba, X.; Shi, G.-D.; Li, Y.; Wong, P.K.; Yu, J.C.; Yu, Y. Enhanced activity and stability of carbon-decorated cuprous oxide mesoporous nanorods for CO2 reduction in artificial photosynthesis. ACS Catal. 2016, 6, 6444–6454. [Google Scholar] [CrossRef]
  34. Wang, B.-S.; Li, R.-Y.; Zhang, Z.-Y.; Zhang, W.-W.; Yan, X.-L.; Wu, X.-L.; Cheng, G.-A.; Zheng, R.-T. Novel Au/Cu2O multi-shelled porous heterostructures for enhanced efficiency of photoelectrochemical water splitting. J. Mater. Chem. A 2017, 5, 14415–14421. [Google Scholar] [CrossRef]
  35. Chen, D.; Liu, Z.-F.; Guo, Z.-G.; Yan, W.-G.; Ruan, M.-N. Decorating Cu2O photocathode with noble-metal-free Al and NiS cocatalysts for efficient photoelectrochemical water splitting by light harvesting management and charge separation design. Chem. Eng. J. 2020, 381, 122655. [Google Scholar] [CrossRef]
  36. Alizadeh, M.; Tong, G.B.; Qadir, K.W.; Mehmood, M.S.; Rasuli, R. Cu2O/InGaN heterojunction thin films with enhanced photoelectrochemical activity for solar water splitting. Renew. Energy 2020, 156, 602–609. [Google Scholar] [CrossRef]
  37. He, X.-F.; Chen, X.; Chen, R.; Zhu, X.; Liao, Q.; Ye, D.-D.; Yu, Y.-X.; Zhang, W.; Li, J.-W. A 3D oriented CuS/Cu2O/Cu nanowire photocathode. J. Mater. Chem. A 2021, 9, 6971–6980. [Google Scholar] [CrossRef]
  38. Wang, T.; Wei, Y.-J.; Chang, X.-X.; Li, C.-C.; Li, A.; Liu, S.-S.; Zhang, J.-J.; Gong, J.-L. Homogeneous Cu2O p-n junction photocathodes for solar water splitting. Appl. Catal. B Environ. 2018, 226, 31–37. [Google Scholar] [CrossRef]
  39. Cao, D.-W.; Nasori, N.; Wang, Z.-J.; Wen, L.-Y.; Xu, R.; Mi, Y.; Lei, Y. Facile surface treatment on Cu2O photocathodes for enhancing the photoelectrochemical response. Appl. Catal. B Environ. 2016, 198, 398–403. [Google Scholar] [CrossRef]
  40. Luo, J.-S.; Steier, L.; Son, M.K.; Schreier, M.; Mayer, M.T.; Grätzel, M. Cu2O nanowire photocathodes for efficient and durable solar water splitting. Nano Lett. 2016, 16, 1848–1857. [Google Scholar] [CrossRef]
  41. Liang, T.-Y.; Chan, S.-J.; Patra, A.S.; Hsieh, P.L.; Chen, Y.-A.; Ma, H.H.; Huang, M.H. Inactive Cu2O cubes become highly photocatalytically active with Ag2S deposition. ACS Appl. Mater. Interfaces 2021, 13, 11515–11523. [Google Scholar] [CrossRef]
  42. Lee, K.; Lee, S.; Cho, H.; Jeong, S.; Kim, W.D.; Lee, S.; Lee, D.C. Cu+-incorporated TiO2 overlayer on Cu2O nanowire photocathodes for enhanced photoelectrochemical conversion of CO2 to methanol. J. Energy Chem. 2018, 27, 264–270. [Google Scholar] [CrossRef]
  43. Huo, H.-L.; Liu, D.; Feng, H.; Tian, Z.-H.; Liu, X.; Li, A. Double-shelled Cu2O/MnOx mesoporous hollow structure for CO2 photoreduction with enhanced stability and activity. Nanoscale 2020, 12, 13912–13917. [Google Scholar] [CrossRef]
  44. Chen, J.; Shen, S.-H.; Guo, P.-H.; Wang, M.; Wu, P.; Wang, X.-X.; Guo, L.-J. In-situ reduction synthesis of nano-sized Cu2O particles modifying g-C3N4 for enhanced photocatalytic hydrogen production. Appl. Catal. B Environ. 2014, 152–153, 335–341. [Google Scholar] [CrossRef]
  45. Zhu, B.-C.; Hong, X.-Y.; Tang, L.-Y.; Liu, Q.-Q.; Tang, H. Enhanced photocatalytic CO2 Reduction over 2D/1D BiOBr0.5Cl0.5/WO3 S-Scheme Heterostructure. Acta Phys.-Chim. Sin. 2022, 38, 2111008. [Google Scholar] [CrossRef]
  46. Shang, L.-M.; Lv, X.-M.; Shen, H.; Shao, Z.-Z.; Zheng, G.-F. Selective carbon dioxide electroreduction to ethylene and ethanol by core-shell copper/cuprous oxide. J. Colloid Interface Sci. 2019, 552, 426–431. [Google Scholar] [CrossRef]
  47. Wang, Y.; Xu, J.-X.; Wan, J.; Wang, J.; Wang, L. A tube-like dual Z-scheme indium oxide@indium phosphide/cuprous oxide photocatalyst based on metal–organic framework for efficient CO2 reduction with water. J. Colloid Interface Sci. 2022, 616, 532–539. [Google Scholar] [CrossRef]
  48. Shoute, L.C.T.; Alam, K.M.; Vahidzadeh, E.; Manuel, A.P.; Zeng, S.; Kumar, P.; Kar, P.; Shankar, K. Effect of morphology on the photoelectrochemical performance of nanostructured Cu2O photocathodes. Nanotechnology 2021, 32, 374001. [Google Scholar] [CrossRef]
  49. An, X.-Q.; Li, K.; Tang, J.-W. Cu2O/reduced graphene oxide composites for the photocatalytic conversion of CO2. Chem. Sustain. Energy Mater. 2014, 7, 1086–1093. [Google Scholar] [CrossRef]
  50. McShane, C.M.; Choi, K.S. Photocurrent enhancement of n-type Cu2O electrodes achieved by controlling dendritic branching growth. J. Am. Chem. Soc. 2009, 131, 2561–2569. [Google Scholar] [CrossRef]
Figure 1. (a) XRD patterns of p-Cu2O (red line) and p/n-Cu2O (black line); (b) 29.5–30.3° Refined spectrum of (a).
Catalysts 13 00857 g001
Figure 2. The top view SEM images of (a,b) p-Cu2O, (d,e) p/n-Cu2O; the side view SEM images of (c) p-Cu2O, and (f) p/n-Cu2O.
Catalysts 13 00857 g002
Figure 3. (a) The TEM image and the corresponding SAED patterns, (b) the HRTEM images, (ce) the elemental mapping of p-Cu2O.
Catalysts 13 00857 g003
Figure 4. (a) The HRTEM images of the p/n-Cu2O; (bd) the elemental mapping of p/n-Cu2O.
Catalysts 13 00857 g004
Figure 5. XPS spectra of p-Cu2O, p/n-Cu2O: (a) the survey spectra, (b) Cu 2p, (c) O 1s; (d) UV–vis absorption profile.
Catalysts 13 00857 g005
Figure 6. (a) Linear sweep voltammetry (LSV) curves of p-Cu2O (black line), p/n-Cu2O (red line); (b) chronoamperometry (I-t) data plots of p-Cu2O (black line), p/n-Cu2O (red line) obtained at 0.65 V vs. RHE, the electrolyte: (0.1 mol/L C6H15NO3/CH3CN + 0.1 mol/L C16H36F6NP / CH3CN, pH = 9.3).
Catalysts 13 00857 g006
Figure 7. The Mott-Schottky curves of p-Cu2O (a) and p/n-Cu2O (b), obtained in the electrolyte 0.1 mol/L C6H15NO3/CH3CN, PH = 7.
Catalysts 13 00857 g007
Figure 8. (a) Photocurrent density and (b) IPCE (%) spectra of the p-Cu2O (black line) and p/n-Cu2O (red line) versus the monochromatic light at electrochemical noise mode (ECN means no bias voltage applied), or at different applied bias voltage (c) Bandgap of p-Cu2O (black line) and p/n-Cu2O (red line) samples; the electrolyte is 0.1 mol/L C6H15NO3/CH3CN + 0.1 mol/L C16H36F6NP/CH3CN, pH = 9.3; (d) the EIS Nyquist plots with the fitted equivalent circuit of p-Cu2O (black line) and p/n-Cu2O (red line) samples (0.1 mol/L C6H15NO3/CH3CN, pH = 7).
Catalysts 13 00857 g008
Figure 9. (a) CO2 reduction yield and (b) CO2 reduction yield rate of p/n-Cu2O (0.1 mol/L C6H15NO3/CH3CN + 0.1 mol/L C16H36F6NP/CH3CN, pH = 9.3); the test conditions of p/n-Cu2O were (c) 0.75 V vs. RHE, 0.45 V vs. RHE, 0.15 V vs. RHE, 0.15 V vs. RHE and light. (d) only light (0.1 mol/L C6H15NO3/CH3CN + 0.1 mol/L C16H36F6NP/CH3CN, pH = 9.3).
Catalysts 13 00857 g009
Figure 10. The proposed band structures of p-Cu2O, p/n-Cu2O.
Catalysts 13 00857 g010
Figure 11. Schematic diagram of cuprous oxide photocathode preparation procedures.
Catalysts 13 00857 g011
Disclaimer/Publisher’s Note: The statements, opinions and data contained in all publications are solely those of the individual author(s) and contributor(s) and not of MDPI and/or the editor(s). MDPI and/or the editor(s) disclaim responsibility for any injury to people or property resulting from any ideas, methods, instructions or products referred to in the content.

