Review

Advances in Catalysts for Water–Gas Shift Reaction Using Waste-Derived Synthesis Gas

1
Department of Chemical Engineering, Wonkwang University, 460 Iksan-daero, Iksan-si 54538, Republic of Korea
2
Department of Environmental and Energy Engineering, Kyungnam University, 7 Kyungnamdaehak-ro, Changwon-si 51767, Republic of Korea
3
Department of Environmental and Energy Engineering, Yonsei University, 1 Yonseidae-gil, Wonju-si 26493, Republic of Korea
4
Nanoscale Environmental Sciences and Technology Institute, Wonkwang University, 460 Iksan-daero, Iksan-si 54538, Republic of Korea
*
Authors to whom correspondence should be addressed.
These authors contributed equally to this work.
Catalysts 2023, 13(4), 710; https://doi.org/10.3390/catal13040710
Submission received: 6 March 2023 / Revised: 30 March 2023 / Accepted: 6 April 2023 / Published: 7 April 2023
(This article belongs to the Special Issue Advances in Catalysts for Water-Gas Shift Reaction)

Abstract

:
Hydrogen is mainly produced by steam reforming of fossil fuels. Thus, research has been continuously conducted to produce hydrogen by replacing fossil fuels. Among various alternative resources, waste is attracting attention as it can produce hydrogen while reducing the amount of landfill and incineration. In order to produce hydrogen from waste, the water–gas shift reaction is one of the essential processes. However, syngas obtained by gasifying waste has a higher CO concentration than syngas produced by steam reforming of fossil fuels, and therefore, it is essential to develop a suitable catalyst. Research on developing a catalyst for producing hydrogen from waste has been conducted for the past decade. This study introduces various catalysts developed and provides basic knowledge necessary for the rational design of catalysts for producing hydrogen from waste-derived syngas.

Graphical Abstract

1. Introduction

The amount of waste generated globally is gradually increasing due to rising population, urbanization, and industrialization [1,2,3,4,5,6,7,8,9]. In 2020, eight billion people generated 2.5 billion tons of wastes, and this amount is predicted to rise to 5.9 billion tons by 2050 [8,10]. As a result, there is a growing interest in environmental sustainability research. Wastes are processed using incineration, landfill, and other techniques. When wastes are processed in this manner, there is an issue of insufficient landfill sites and air pollution caused by the gas generated during incineration. Thus, substantial waste treatment research is ongoing. One example is the process of transforming waste into hydrogen [4,11]. Through the process of gasification, purification, water–gas shift (WGS), and separation, the waste-to-energy conversion (WtE) employing waste can create high-purity hydrogen [12]. Among these processes, the WGS reaction is a key step for producing high-purity hydrogen from waste [4,11].
Considering the thermodynamic characteristics of the WGS reaction, this reaction is operated in two stages: the high-temperature shift (HTS) reaction carried out at a temperature range of 350–500 °C and the low-temperature shift (LTS) reaction carried out at a temperature range of 200–250 °C [12,13,14,15,16,17,18,19]. The Fe-Cr catalyst is used as a commercial catalyst in the HTS reaction, while the Cu-Zn-Al catalyst is used as a commercial catalyst in the LTS reaction [11,12,20,21,22,23,24,25,26]. However, there is a downside in the case of the Fe-Cr catalyst utilized in the HTS process in that it produces hexavalent chromium, which is a carcinogen [27,28,29,30]. To address these issues, research into using a catalyst other than the Fe-Cr catalyst is under way. Various studies are being undertaken to find catalysts for the WGS reaction in the WtE process.
Active metals have a significant impact on the catalysts utilized in the WGS process. There are two categories of materials utilized as active metals: noble and non-noble metals. According to current research, non-noble metal catalysts such as Fe-based, Cu-based, Ni-based, and Co-based catalysts, as well as noble metal catalysts such as Pt-based catalysts, are utilized in the WtE process. In the HTS reaction, the Fe-based catalyst reduces Fe2O3 to the active species Fe3O4 [31,32,33]. Cr is a substance that prevents sintering of Fe3O4, enhances stability in the Fe-Cr catalyst, and modifies catalytic behavior of Fe3O4 in the Fe-Cr catalyst, which is a commercial catalyst [34,35,36,37,38,39]. However, as previously stated, Cr6+ materials have the potential to pollute the environment [40,41,42,43]. Al, Cu, and Ni metals have recently received a lot of interest owing to their strong activity in the HTS reaction. The physicochemical properties and synergistic effects of Fe-based catalysts employing metal oxides as supports have been explored, and numerous investigations are being undertaken on techniques that do not utilize Cr [11,12,13,28,44]. Commercially, Cu-based catalysts are used in the LTS process, and Cu catalysts with oxide supports have shown significant activity in the WGS reaction [27]. The Cu catalyst, on the other hand, has the problem of quickly deactivating at high temperatures, making it unsuitable for the HTS reaction. Consequently, many researchers have investigated thermally stable supports, such as CeO2 and Al2O3, that may increase the performance of the catalyst in order to employ the Cu catalyst in the HTS process [27,45,46,47,48]. Oxide-supported Cu-based catalysts have received significant attention over the last few decades due to their high activity in WGS reactions [27]. In the HTS reaction, the Co-based catalyst interacts with Co0 as an active species [1,6,49,50]. Lee et al. researched the Co/CeO2 catalyst in anticipation of Co3O4 activity in the HTS process, based on the fact that Co3O4 was chosen as an effective catalyst for oxidizing CO to CO2 [1,51]. There has been a lot of research utilizing Co as an active metal and CeO2 as a support, as well as work on adding metal components to improve catalysts and boost catalytic activity [1,6,52]. Pt-based catalysts have been investigated with an emphasis on the sulfur resistance necessary in the industrial WtE process [53]. In the WGS process, sulfur acts as a poison to the catalyst, becoming highly adsorbed on the active site of the catalyst, thus inactivating it [54,55,56,57,58,59]. Therefore, it is crucial to develop a catalyst capable of removing sulfur, and the sulfur resistance and regeneration of catalyst impact catalyst activity. Promoters also play an important role in the WGS reaction. Barium enhances the strong metal–support interaction between active Cu metal and Ce-Al support, thereby improving the catalytic performance for the HTS reaction. Barium also enhances the sintering resistance of metallic cobalt and improves the reducibility of the Co-based catalyst. Calcium increases the formation of oxygen vacancies for the Ni-CeO2 catalyst, which are important for the WGS reaction.
This review article focuses on catalysts for hydrogen production from waste-derived synthesis gas. Among WGS reaction catalysts for hydrogen production from combustible municipal solid waste, Fe-, Cu-, Ni-, Co-, and Pt-based catalysts, which are known to have outstanding performance and features, will be examined. Furthermore, the simple reducibility of the Fe-based catalyst, which considerably influences the performance in the WGS process, the degree of dispersion and redox capacity of Cu, the oxygen storage capacity of Ni and Co catalysts supported on CeO2, and a noble metal-based catalyst are all described in detail. The objective of this study is to obtain a better knowledge of the critical factors that must be considered while designing catalysts in changing conditions.

2. Overview

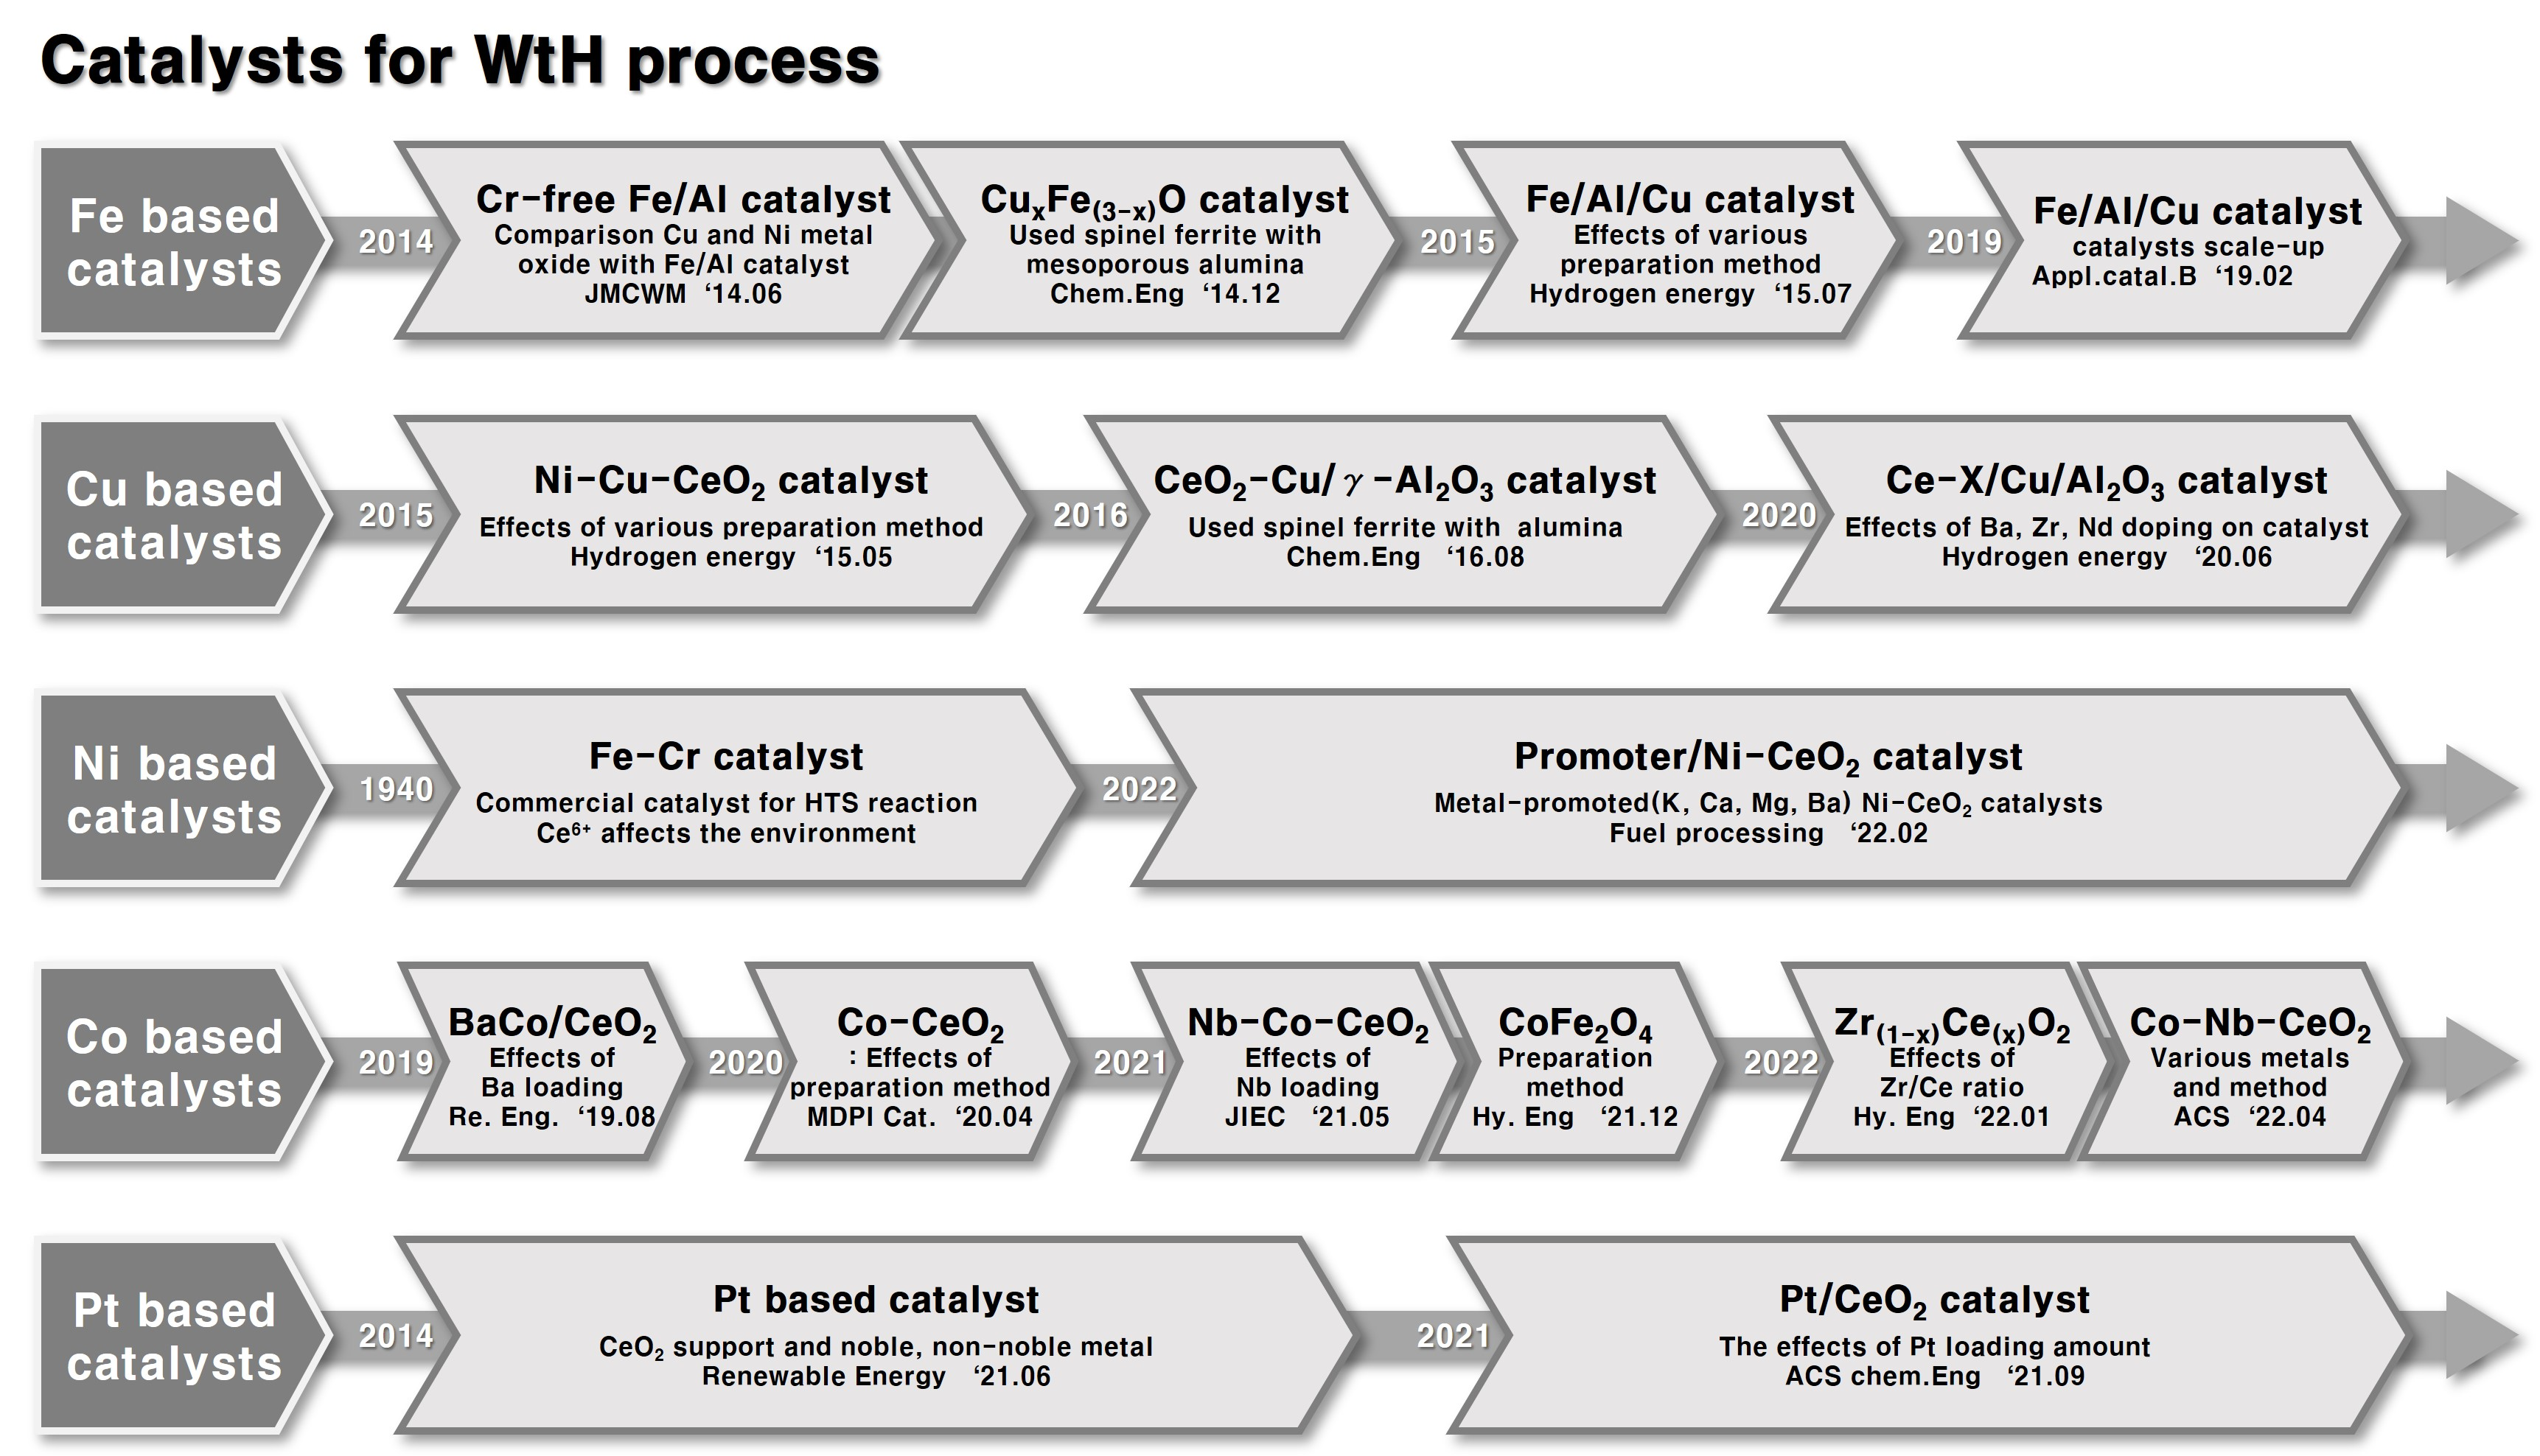
2.1. Brief History of Water–Gas Shift Reaction and Catalysts

“Water gas” is a mixture of hydrogen and carbon monoxide which is typically produced by the reaction of hydrocarbons such as natural gas, coal, waste, and biomass with oxidizing agents such as steam, oxygen, or carbon dioxide [60]. The water–gas shift (WGS) reaction was used to produce hydrogen for the synthesis of NH3, which is well-known for the Haber process [61,62,63]. During the recent several decades, the WGS reaction has received great attention again in parallel with the utilization of hydrogen as a clean and sustainable energy carrier [64,65]. Currently, the steam reforming of natural gas (SRNG) is one of the most economical ways to produce hydrogen [66,67,68]. The hydrogen production via SRNG comprises desulfurization, reforming, CO conversion (WGS), and CO elimination. Herein, the CO conversion step means the WGS reaction, which is a process to convert CO with H2O into CO2 and H2 (CO + H2O = H2 + CO2, ΔH = −41.2 kJ/mol). The industrial WGS process consists of two stages at two temperature ranges considering the thermodynamic and kinetic aspects: high-temperature shift (HTS, 350~500 °C) and low-temperature shift (LTS, 200~250 °C) [12,13,14,15,16,17,18,19]. Fe2O3-Cr2O3 and CuO-ZnO-Al2O3 catalysts have been commercially used for the sequential process of HTS and LTS, respectively.
Conventional commercial HTS catalysts are composed of ca. 80–90% of Fe2O3, 8–10% of Cr2O3, and the balance being promoter and stabilizer such as CuO, Al2O3, alkali, MgO, ZnO, etc. [69,70]. Fe3O4(magnetite), which is formed by the partial reduction of α-Fe2O3(hematite), is an active phase for the WGS reaction in the high-temperature range [33,71]. Cr2O3 mainly functions as a textual promoter to prevent the sintering of active Fe3O4 phase and loss of surface area during start-up and operation [33,71]. Fe2O3-Cr2O3 catalysts have been commercially used for more than 70 years despite low performance at a low temperature because they showed the excellent catalytic performance at a high temperature [72].
Commercial LTS catalysts are a mixture of ca. 60–70% of CuO, 20–30% of ZnO, 10% of Al2O3, and the balance being promoter and stabilizer such as Cr2O3, Cs, or MnO [73,74]. In general, Cu metal crystallites are known to be an active species for the WGS reaction in the low-temperature range [74,75]. ZnO and Cr2O3 provide the structural support for the catalyst and Al2O3, which is inactive for the WGS reaction, enhances the Cu dispersion, and minimizes the collapse of pellet [76]. Cs helps to improve the selectivity to the WGS reaction. The commercial LTS catalysts were prone to Cu sintering and this resulted in the subsequent loss of Cu surface area [77,78]. Moreover, the catalysts were sensitive to temperature and pyrophoric in air [79,80]. In spite of these problems, the catalytic performance of the commercial LTS catalysts in a low temperature is excellent and comparable to that of noble-metal-based catalysts [77,81]. Thus, Cu-ZnO-Al2O3 catalysts are commercially still in use.
However, both commercial HTS and LTS catalysts were designed for the conversion of synthesis gas that was produced by the steam reforming of natural gas. Recently, the optimization of WGS catalysts is required in parallel with the different compositions of synthesis gas produced from various resources such as waste, biomass, and coal [82,83,84]. Many researchers have focused on the production of hydrogen using waste due to the lack of hydrocarbon resources [85,86,87]. Thus, the WGS catalysts have been widely studied to produce hydrogen from waste-derived synthesis gas. The following section will discuss in detail various catalysts of Fe-, Cu-, Ni-, Co-, and Pt-based catalysts and their catalytic properties.

2.2. The Composition of Waste-Derived Synthesis Gas

Table 1 summarizes the composition of the waste-derived syngas utilized in the HTS process. Most catalysts had gas concentrations of 38.2 vol% CO, 21.5 vol% CO2, 2.3 vol% CH4, 29.2 vol% H2, and 8.8 vol% N2. The formula for H2O was H2O/(CH4 + CO + CO2) = 2.0 [1,11,12,28]. Furthermore, the synthesis gas composition of the Fe-, Cu-, Co-, and Pt-based catalysts, including H2O, was determined to be 55.20 vol% H2O, 17.02 vol% CO, 9.55 vol% CO2, 1.03 vol% CH4, 13.14 vol% H2, and 4.06 vol% N2. Furthermore, omitting H2O, the gas composition was determined to be 37.99 vol% CO, 21.32 vol% CO2, 2.30 vol% CH4, 29.33 vol% H2, and 9.06 vol% N2 [6,8,13,48,53]. The Cu-based catalyst’s gas concentration was 38.0 vol% CO, 21.3 vol% CO2, 2.3 vol% CH4, 29.3 vol% H2, and 9.1 vol% N2 [26,27]. The Co-based and Pt-based catalysts’ syngas compositions were 39.7 vol% CO, 21.5 vol% CO2, 2.35 vol% CH4, 27.05 vol% H2, and 9.40 vol% N2 [57,88]. The Co-based and Ni-based catalysts had syngas compositions of 37.87 vol% CO, 21.47 vol% CO2, 2.30 vol% CH4, 29.31 vol% H2, and 9.05 vol% N2 [87,89].

3. Overview of Catalyst Results

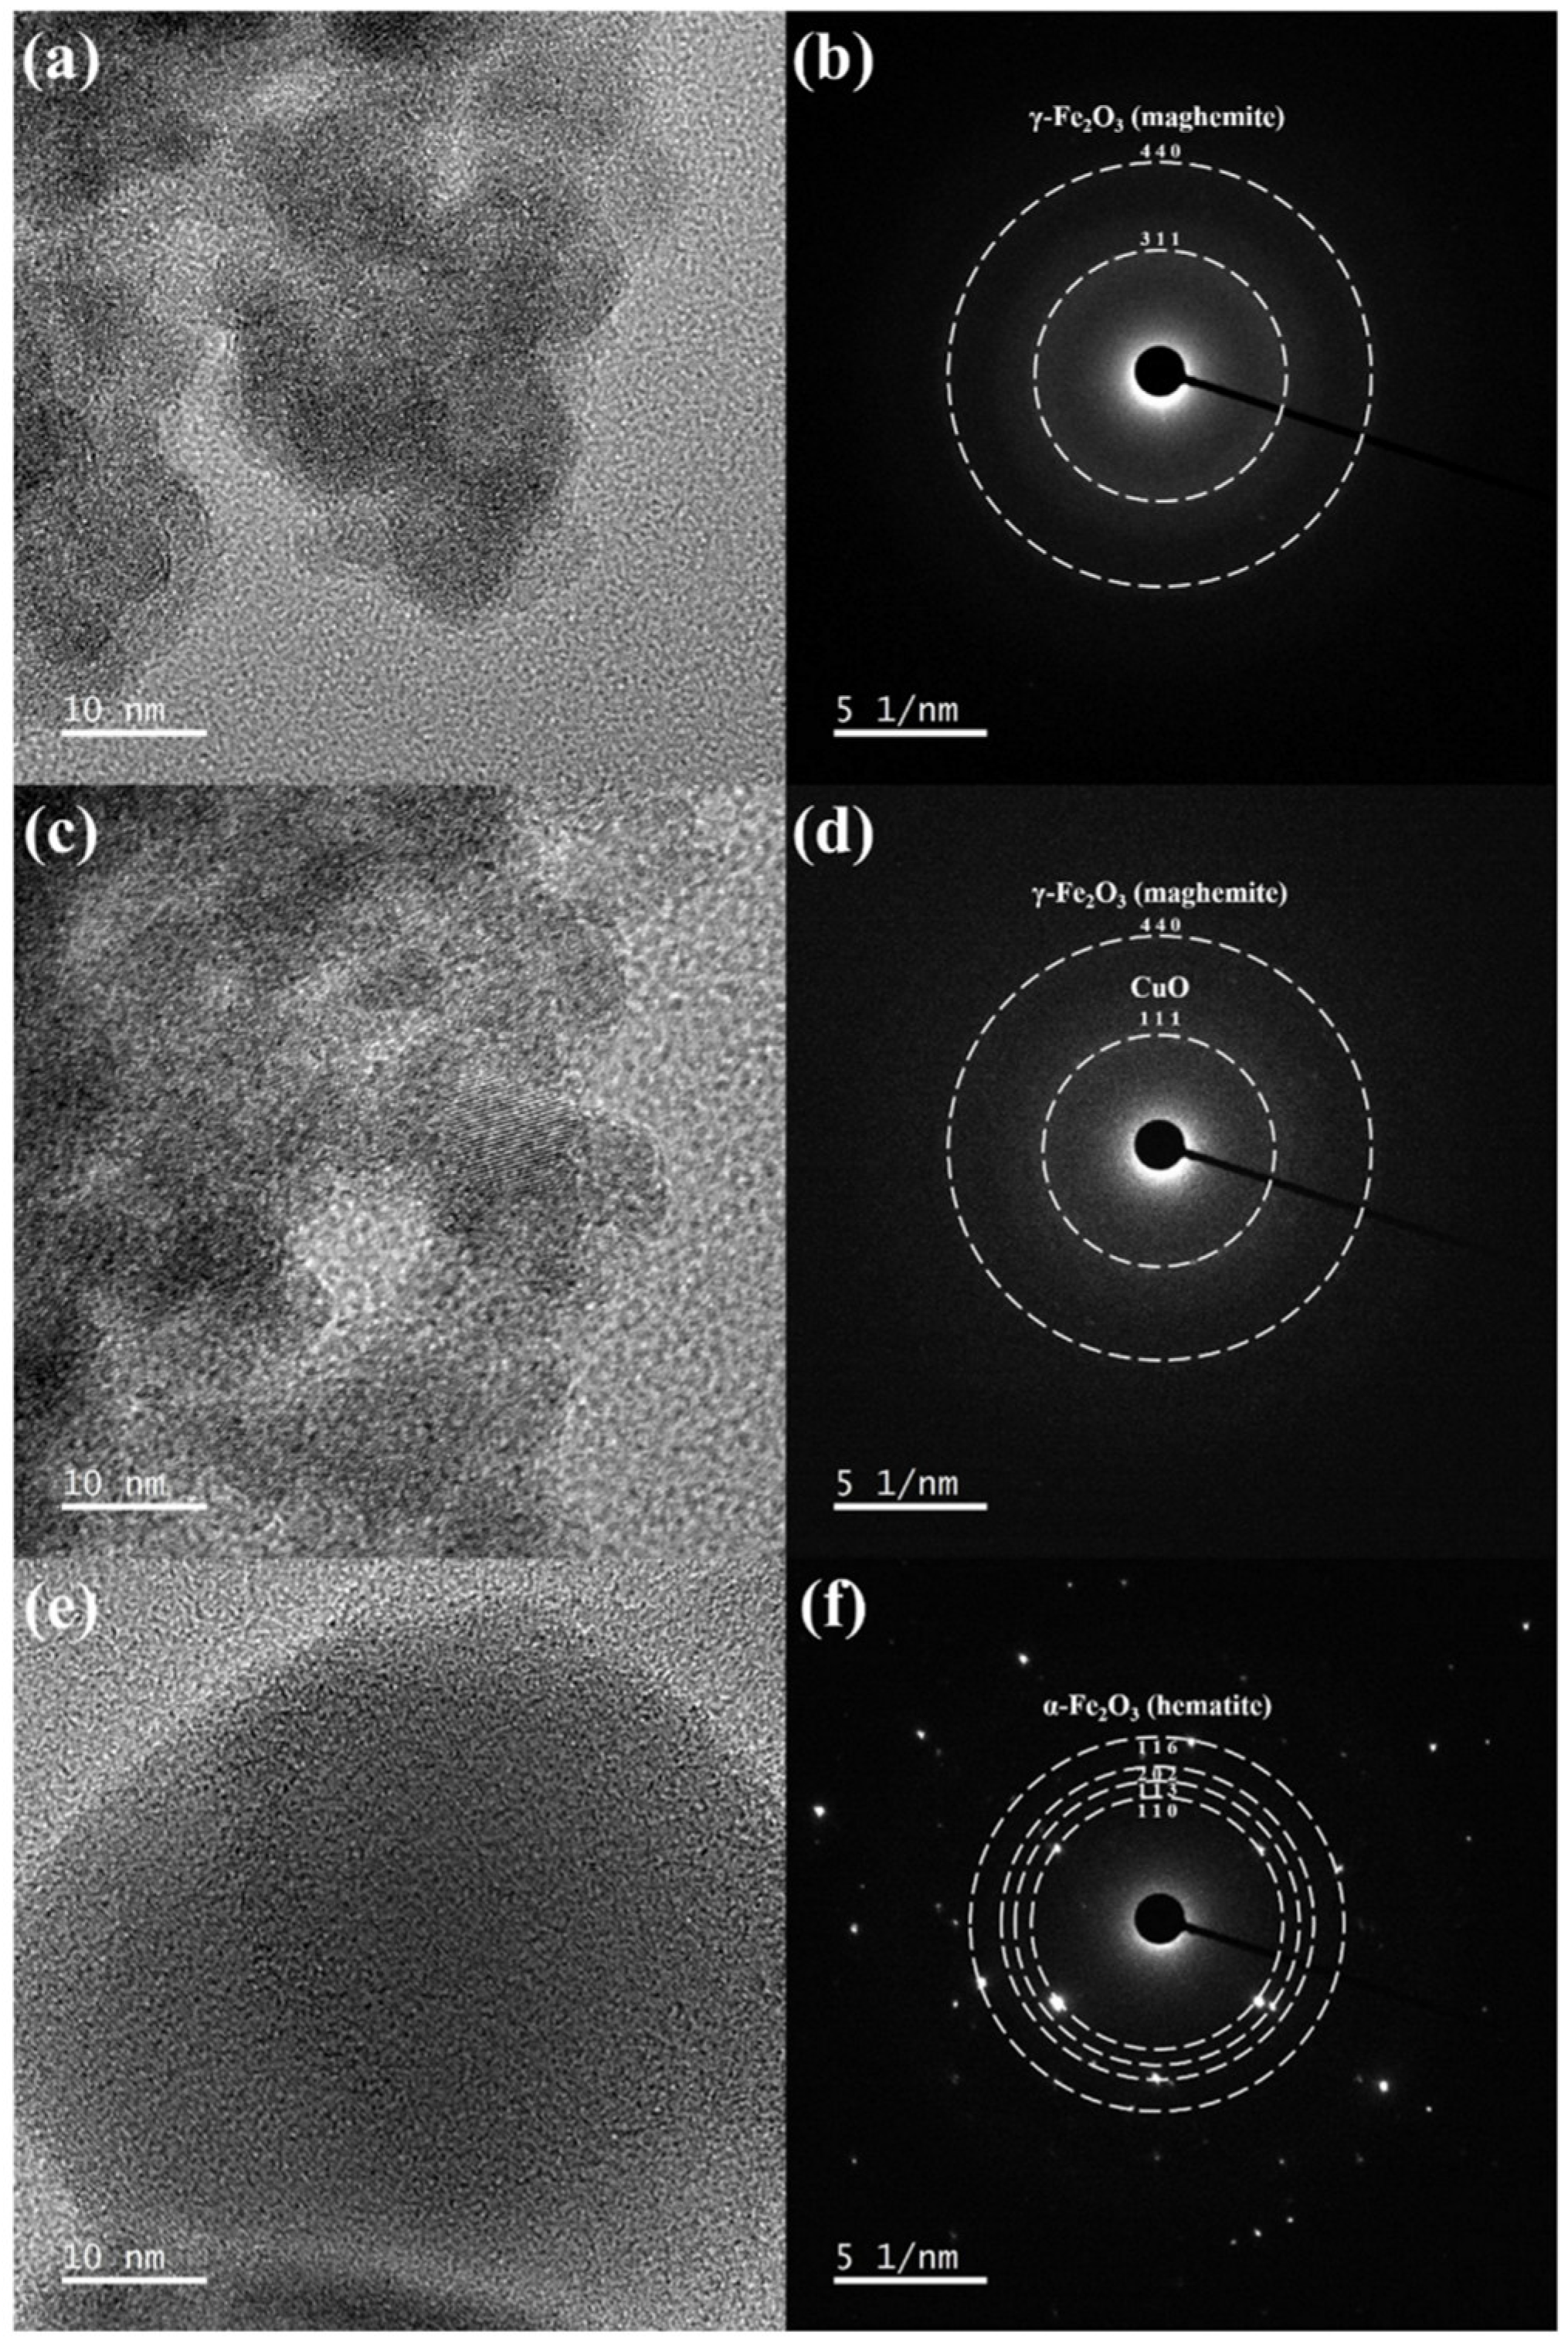
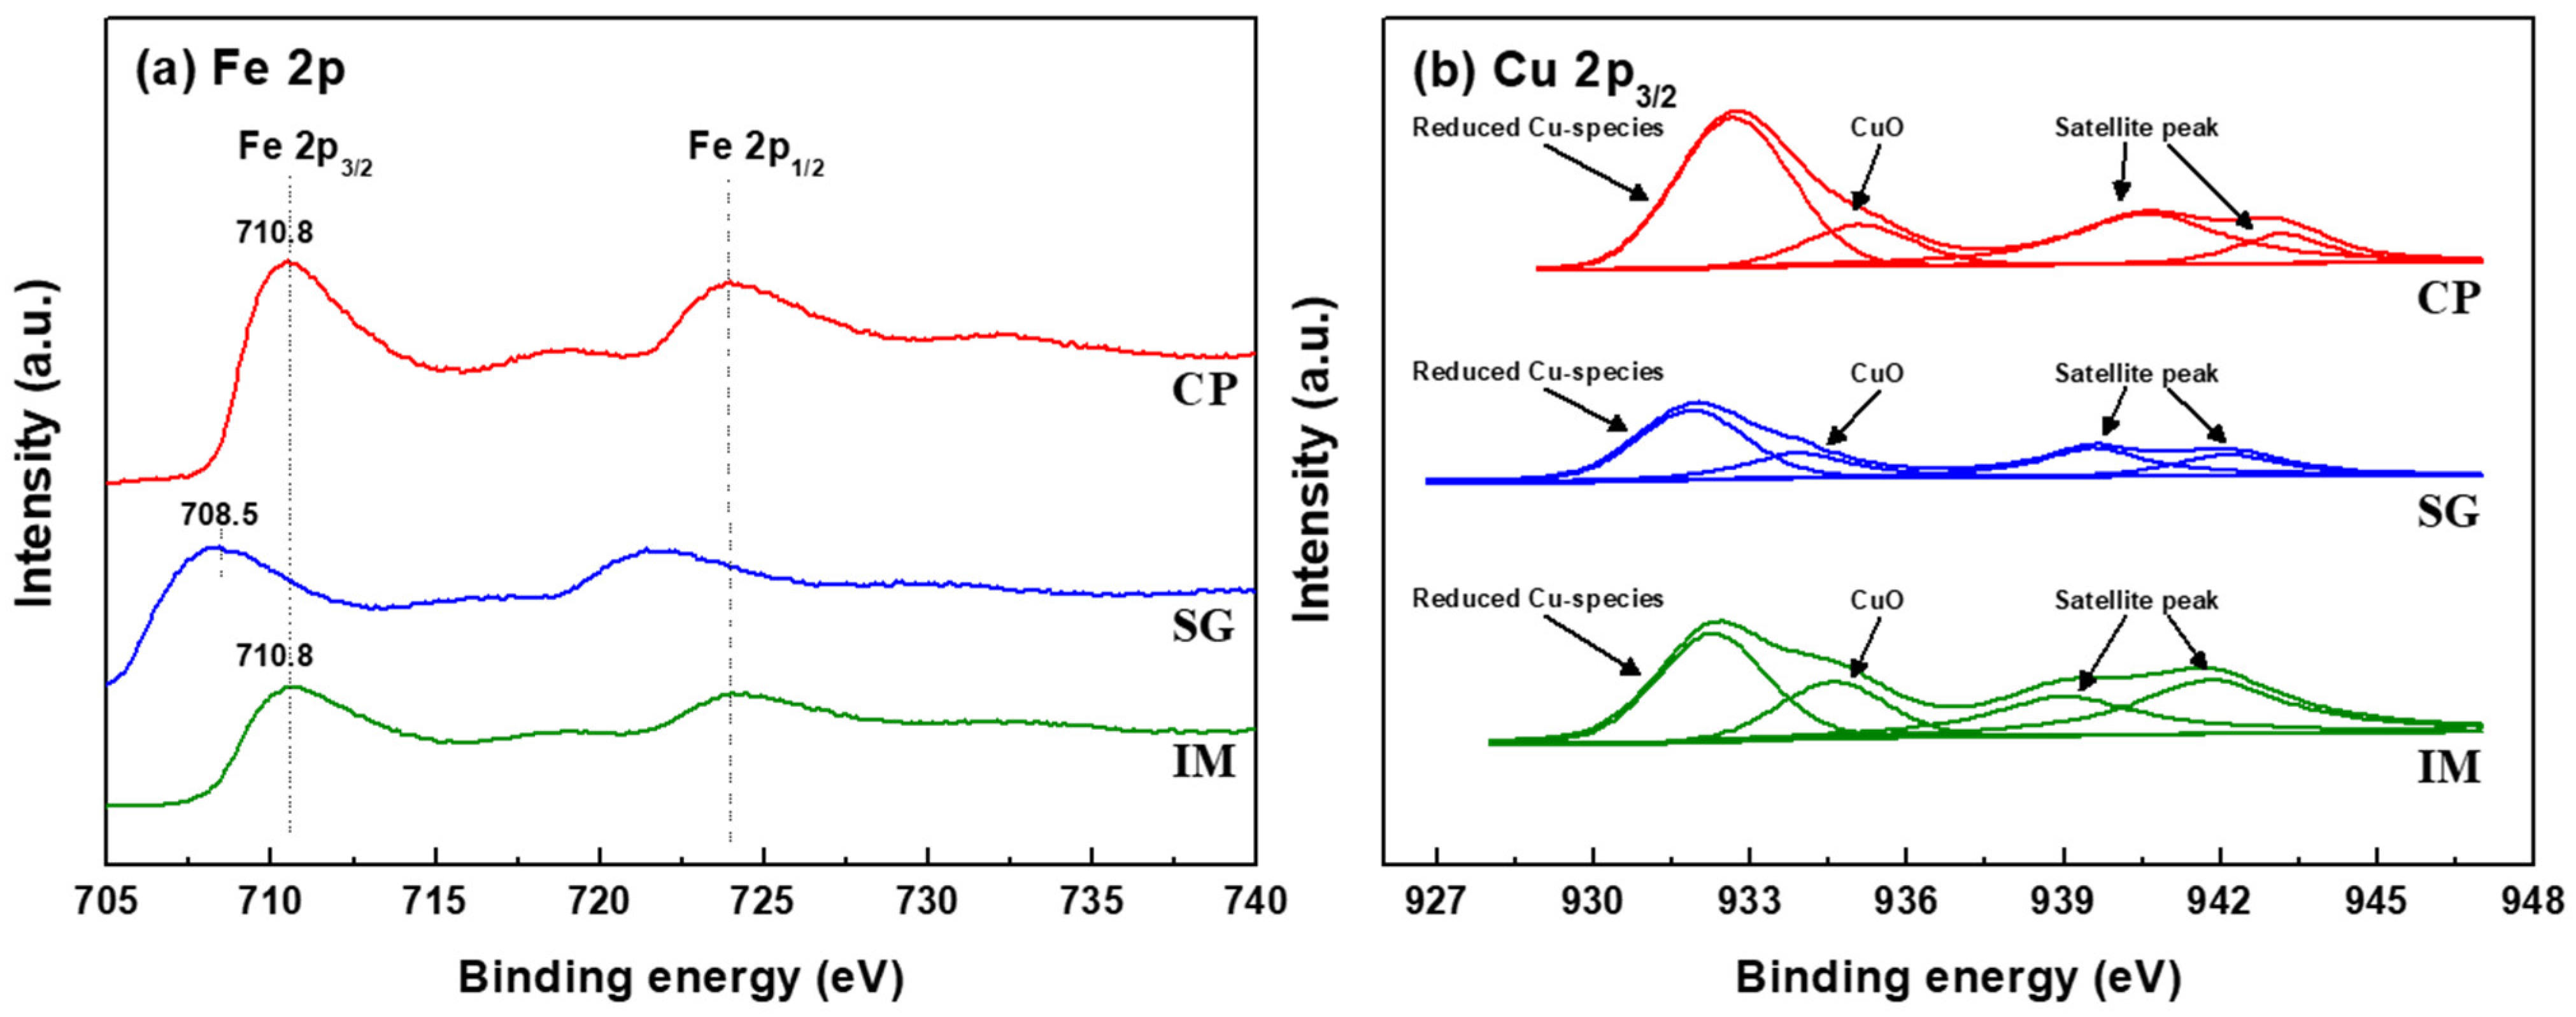
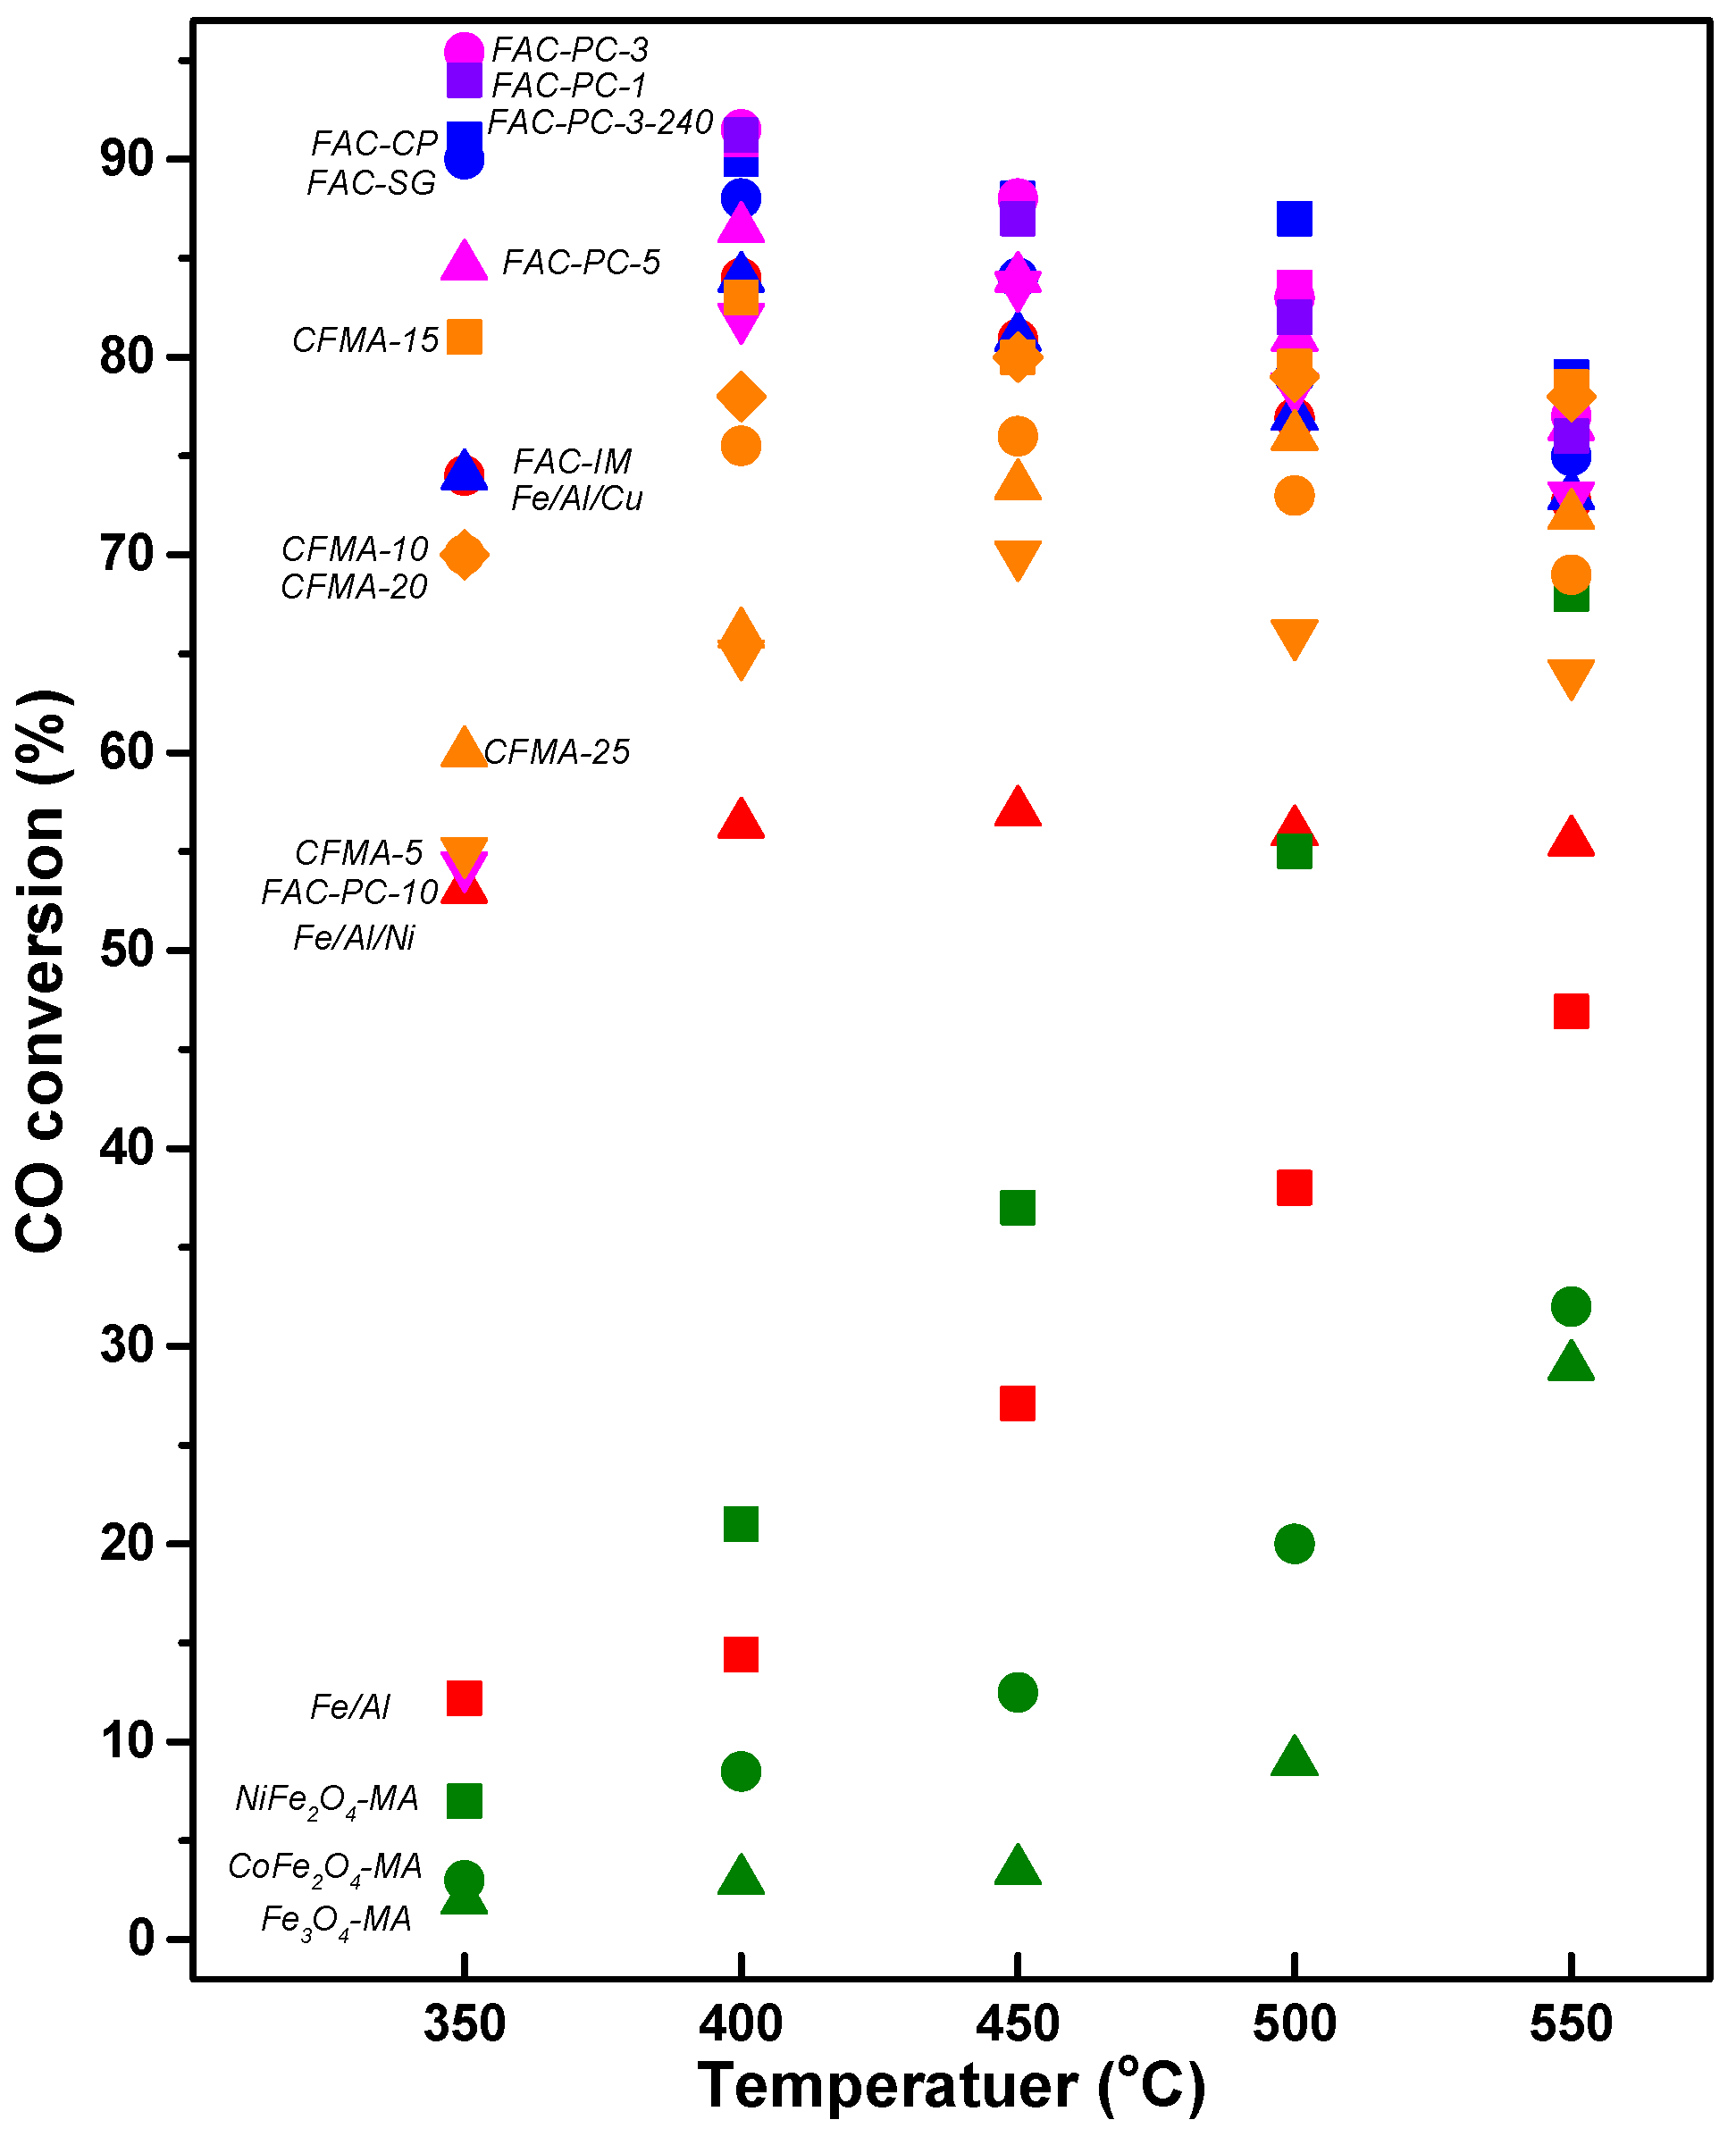
3.1. Fe-Based Catalyst (Easy Reducibility of Fe2O3)

Fe-based catalysts are typically used for the conversion of synthesis gas derived from waste at a high temperature. Since the carcinogenic nature of hexavalent chromium (Cr6+) was reported, the development of a Cr-free catalyst is a matter of great significance to replace a commercial Fe-Cr catalyst. Attempts at adding the substitute materials or using various preparation methods have been reported to obtain a small size of particle and to improve the reducibility of Fe, which is one possible way to enhance the catalytic activity resulting from the rapid redox cycle between Fe2+ and Fe3+. In this section, four papers related to Fe-based catalysts are summarized and distinguished by naming [FAC], [FACP], [FACS], and [CFMA] in front of descriptions for each characteristic analysis.
[FAC] Among these, studies have demonstrated that a modest amount of metal oxide doped into the Fe/Al catalyst increases catalytic activity. Fe/Al catalysts, Fe/Al/Cu catalysts doped with metal oxides (Cu, Ni), and Fe/Al/Ni catalysts were thus compared. The Fe/Al/Cu catalyst achieved the 80.9% (450 °C) of CO conversion and 100% CO2 selectivity, which is a higher value than that of the Fe/Al and Fe/Al/Ni catalysts. The high catalytic performance of the Fe/Al/Cu catalyst is mainly attributed to the synergistic effect between Fe and Cu, which results from enhanced reducibility [12]. [FACP] After establishing that doping, the Fe/Al catalyst with Cu, a metal oxide, improved catalytic activity; the effect of the catalyst manufacturing process on catalytic activity was examined. Co-precipitation (CP), sol-gel (SG), and impregnation (IM) were used to synthesize Fe/Al/Cu catalysts. It was found that the CP-method-prepared catalyst had the maximum activity. The high activity of catalysts was found to be attributable to its large BET surface area, small crystal size of Fe3O4, easy reducibility, and production of reduced Cu species [11]. [FACS] The production amount per batch of the Fe/Al/Cu catalyst prepared by the co-precipitation method was increased. Based on the FAC-PC-1 catalyst, which produced 2 g of catalyst per batch, the catalyst with a three-fold increase in production (6 g) was named FAC-PC-3, the catalyst with a five-fold increase (10 g) was named FAC-PC-5, and the catalyst with a ten-fold increase (20 g) was named FAC-PC-10. As a consequence, when three-fold scaled up, it demonstrated good activity comparable to the current catalytic process. Thus, based on the FAC-PC-3 catalyst, the FAC-PC-3-240 catalyst was developed, which increased the production amount by 40 times. Only the Fe3O4 crystallite size rose somewhat as compared to the FAC-PC-3 catalyst, while the rest of the characteristics remained consistent [28]. [FAC] Through the characterization results of the used catalysts summarized in Table 2, the cause of the high activity of the Fe/Al/Cu catalyst was elucidated. The catalyst exhibited higher activity when the BET surface area of the used catalyst was larger and the crystal size of Fe3O4 was smaller. In comparison to the Fe/Al and Fe/Al/Ni catalysts, the Fe/Al/Cu catalyst had the largest surface area and the lowest Fe3O4 crystallite size [12]. [FACP] The FAC catalyst exhibited the highest BET surface area and the smallest Fe3O4 crystal size when prepared using the co-precipitation method [11]. [FACS] The FAC-PC-3 catalyst, which increased the production amount by three times compared to the FAC-PC-1 catalyst, exhibited almost the same BET surface area and Fe3O4 crystal size as the FAC-PC-1 catalyst. Furthermore, when compared to other catalysts, the FAC-PC-3 catalyst had a higher Cu dispersion of 5.7%. This is comparable to the previous FAC-PC-1 catalyst’s Cu dispersion of 5.9%, and the FAC-PC-240 catalyst’s Cu dispersion of 5.6% [28].
[FACS] The FAC-PC-3 catalyst, which had been grown up three-fold, exhibited unique particles identical to the previous FAC-PC-1 catalyst. SAED pattern analysis verified this, as shown in Figure 1. Unlike other catalysts, which exhibited α-Fe2O3 (JCPDS #33-0664) at (110), (113), (202), and (116) in SAED pattern analysis, FAC-PC-3 showed γ-Fe2O3 (JCPDS #39-1346) at (311) and (440) [28]. In the WGS reaction, the production of γ-Fe2O3 is important to form active Fe3O4 species. Fe3O4 is widely recognized as the active phase of the target reaction in the case of Fe-based catalysts, and it has an inverted spinel structure represented by [Fe3+]tetra[Fe3+Fe2+]octaO4. In contrast to completely oxidized α-Fe2O3, which contains only octahedral FeO6, γ-Fe2O3 can be quickly converted into Fe3O4. This is because γ-Fe2O3 and Fe3O4 have structural similarities with a twist of tetrahedral FeO4 or octahedral FeO6 [28]. H2-TPR analysis was performed to assess the catalyst’s reducibility, as shown in Table 3. [FAC] All catalysts in the Fe/Al/Cu family displayed three reduction temperature ranges as a consequence of TPR (Table 3). At 178, 325, and 660 °C, the Fe/Al/Cu catalyst separated into three reduction temperatures. The first reduction temperature was caused by the reduction of CuO species, the second by a reduction of Fe2O3 (Fe3+) to Fe3O4 (Fe8/3+), and the third by a reduction of Fe3O4 (Fe8/3+) to FeO (Fe2+). Fe2O3 (Fe3+), the second reduction temperature, was reduced to Fe3O4 (Fe8/3+), and the Fe3O4 (Fe8/3+) generated was an active species in WGS. The Fe/Al/Cu catalyst’s second reduction temperature began at a lower temperature than the other catalysts. This means that the Fe/Al/Cu catalyst had an easy reducibility due to the synergistic effect between Fe/Al and Cu. [FACP] Similar to the aforementioned findings, the FAC-CP catalyst exhibited the first reduction temperature as reduced CuO species, the second reduction temperature as reduction of Fe2O3 to Fe3O4, and the third reduction temperature as reduction of Fe3O4 (Fe8/3+) to FeO (Fe2+). The FAC-CP catalyst exhibited the easier reducibility because it had the lowest reduction temperature for the Fe2O3 species. [FACS] Bare Fe showed two reduction temperatures of 405 and 700 °C, where Fe2O3 is reduced to Fe3O4 and Fe3O4 to FeO, respectively [28]. The reduction temperatures of Fe species in the scaled-up FAC catalyst shifted to a lower temperature compared to bare Fe. This suggests that the presence of Al and Cu facilitates the formation of the Fe3O4 active phase. Reduction temperatures for FAC-PC-1 and FAC-PC-3 were detected at substantially lower temperatures than for the other catalysts. As a consequence, both FAC-PC-1 and FAC-PC-3 were predicted to exhibit outstanding catalytic activity with enhanced reducibility in the HT-WGS process [28].
[FACP] XPS analysis was performed to investigate the active species of Fe/Al/Cu catalysts synthesized using different production processes, and the results are outlined in Figure 2. As a result of XPS analysis, the Fe 2p peaks showed Fe 2p1/2 and Fe 2p3/2 peaks due to spin-orbit coupling, while the FAC-CP and FAC-IM catalysts showed similar tendencies. The peak at 710.8 eV was caused by Fe2O3. The FAC-SG catalyst changed slightly to 708.5 eV to suggest the Fe3O4 phase, which matches the XRD data. Cu 2p was deconvolved into three peaks, which are classified as reduced Cu species (Cu1+/Cu0), CuO (Cu2+), and satellite peaks generated by CuO from Cu2+. The surface composition of the catalyst was determined by calculating the area of the peak, and 47% of reduced Cu species were found on the surface of the FAC-CP catalyst. This indicates that the concentration of reduced Cu species was greater than that of other catalysts. The greater the concentration of the reduced Cu species, the greater the activity in the WGS reaction; hence, the FAC-CP catalyst is predicted to have more activity in the WGS process [11]. The catalytic reaction results are compatible with the results of the catalyst properties analysis and are presented in Figure 3. These data suggest that reducibility has a significant effect on the CO conversion rate. [FAC] Based on the calculated deconvoluted peak areas in Figure 2b, it was confirmed that the FAC-CP catalyst had 47% of reduced Cu species. This indicates that the concentration of reduced Cu species was greater than that of other catalysts. The greater the concentration of the reduced Cu species, the greater the activity in the WGS reaction; hence, the FAC-CP catalyst is predicted to have more activity in the WGS process [11]. The catalytic reaction results are compatible with the results of the catalyst properties analysis and are presented in Figure 3. These data suggest that reducibility has a significant effect on the CO conversion rate. [FAC] When the Fe/Al and metal-oxide-doped catalysts were reacted at a GHSV of 40,057 h−1 and the results were compared, the Fe/Al/Cu catalyst showed the highest CO conversion rate across all temperature ranges. The Fe/Al/Cu catalyst demonstrated high CO conversion rates of 74.0% at 350 °C, 84.0% at 400 °C, 80.9% at 450 °C, and 76.9% at 500 °C. Over the reaction temperature range, the Fe/Al/Ni catalyst demonstrated rather stable CO conversion rates, but lower CO conversion than the Fe/Al/Cu catalyst. The following were derived from the CO conversion rate results. (1) The reducibility of catalyst is an essential factor in the HTS reaction, as shown by TPR findings. As a result of TPR, the Fe/Al/Cu catalyst had the lowest reduction temperature, indicating easy reducibility when compared to other catalysts, and the CO conversion rate indicated that it had superior catalytic performance than other catalysts. (2) Because of the synergistic effect of Cu, it provides a new active site and improves catalytic performance in the HTS process. Cu metal provides active oxygen species to oxidize CO to CO2 by temporarily reducing CuO to Cu, and Cu is oxidized again to obtain oxygen from H2O in HT-WGS [12]. Furthermore, the Fe/Al/Cu catalyst exhibited 100% CO2 selectivity and 0% CH4 selectivity, as well as very stable CO conversion after a 100 h stability test at 400 °C [12]. [FACP] Catalytic activity analysis of the Fe/Al/Cu catalyst for each production process was also performed under the identical conditions as the previous research findings (GHSV = 40,057 h−1, CO concentration = 38.2%). The FAC-CP catalyst was projected to have increased catalytic activity owing to its easier reducibility, according to the findings of catalyst characterization. The FAC-CP catalyst demonstrated the maximum CO conversion in all temperature ranges from 350 to 550 °C, as predicted. This is related to the reducibility of the catalyst, which is consistent with earlier study findings. As implied by TPR, the FAC-CP catalyst has the lowest reduction temperature, and redox reaction from Fe2+ to Fe3+ happens. Furthermore, the catalytic activity is influenced by the easy reducibility of CuO species, the high BET surface area, and the small crystal size. The FAC-CP catalyst demonstrated the maximum thermal stability without catalytic deactivation after 25 h of time on stream at 450 °C under a GHSV of 40,057 h−1 [11]. [FACS] Finally, the reaction of the scaled-up FAC catalysts resulted in CO conversion rates of 94.9 and 95.4% at 350 °C for FAC-PC-1 and FAC-PC-3, respectively. They performed well in all temperature ranges with 100% CO2 selectivity and 0% CH4 selectivity, and the process proceeded without any side reactions. This is due, like the previous studies, to the high BET surface area, small Fe3O4 crystal size, great reducibility, and high degree of Cu dispersion [28]. According to the previous study’s findings, substituting the Fe/Cr catalyst with a Fe-/Al-based catalyst enhances catalytic stability in the HT-WGS process. Furthermore, since Al (0.675 Å) and Fe (0.690 Å) have comparable ionic radii, Al may be readily absorbed into the Fe lattice, which can substitute Cr-free catalysts.
[CFMA] In a previous study, a CuFe2O4 catalyst integrated with mesoporous alumina was investigated, and it was proven that at low temperatures, Fe2O3 was reduced to Fe3O4 and had better catalytic activity. Meanwhile, Cu enhances reduction and speeds the WGS process, replaces Fe2+ with Cu2+, increases electron hopping between Fe2+ and Fe3+, and improves catalytic activity via the creation of Fe2+/Fe3+ and Cu2+/Cu+ redox pairs. The use of additional metals, such as Ni and Co, in addition to Cu, was shown to be advantageous in boosting the CO conversion rate; thus, the change in catalytic activity was investigated. The HTS process was catalyzed by mesoporous alumina (MA) and spinel ferrite (MFe2O4) catalysts (M = Ni, Co, Fe, Cu). Table 4 summarizes the physical characteristics of catalysts. The CoFe2O4-MA catalyst has a Co3O4 spinel structure with the lowest crystallite size (3.7 nm). When Co, Ni, and Cu are doped here, the oxidation state of Fe shifts from Fe2+ to Fe3+. The Cu-doped catalyst switched from metal ferrites (MFe2O4) to magnetite (Fe3O4), which is a reduction temperature, at a lower temperature as a consequence of TPR to prove the reducibility of the catalyst. This is due to the fact that CuFe2O4 is quickly transformed to Cu and Fe3O4, allowing for easier reduction than other catalysts. The CuFe2O4-MA catalyst had the largest CO conversion rate of 69% at 350 °C as a result of the process. The reason for this is that copper ferrite is better converted to magnetite at lower temperatures. Furthermore, all of the catalysts displayed 100% CO2 selectivity and 0% CH4 selectivity. The CuFe2O4-MA catalyst utilizing Cu demonstrated the largest catalytic performance among different metal materials, optimizing the Cu/Fe ratio. The CuxFe(3-x)O4-MA catalyst was synthesized and examined to compare the structure and physicochemical characteristics according to the Cu/Fe ratio. Catalysts were produced using the SG method in various Cu/Fe ratios of 0.2, 0.5, 1, 2, and 5, which were designated as Cu0.5Fe2.5O4-MA (CFMA-5), Cu1.0Fe2.0O4-MA (CFMA-10), Cu1.5Fe1.5O4-MA (CFMA-15), Cu2.0Fe1.0O4-MA (CFMA-20), and Cu2.5Fe0.5O4-MA (CFMA-25), respectively. The catalyst’s crystallite size increased as the Cu/Fe ratio rose. However, following the reaction, CFMA-20 and CFMA-25 catalysts were found to have greater crystal sizes than other catalysts. Table 4 summarizes these findings. As the Cu/Fe ratio rose, the BET surface area and pore volume decreased. The Fe2+/Fe3+ ratios were calculated as 1.3 (CFMA-5 cat.), 1 (CFMA-10 cat.), 0.7 (CFMA-15 cat.), 1.4 (CFMA-20 cat.), and 1.9 (CFMA-25 cat.), and the CFMA-15 catalyst had the highest Fe3+ ratio among them. The CFMA-15 catalyst has the largest Fe3+ concentration based on area calculations. This is due to the abundance of CuFe2O4 formation on the surface. All catalysts produced in Cu 2p were found to have similar positions. As a result of estimating the catalyst’s surface composition, the concentration of reduced Cu species grew until the Cu/Fe ratio reached 1, at which point bulk CuO species formed on the surface. All catalysts revealed just one reduction temperature between 120 and 300 °C as a result of TPR to validate the reducibility of the catalyst. This reduction temperature appears when reduced CuO and CuFe2O4 are converted to CuO and Fe2O3. At the lowest temperature of 179 °C, the CFMA-15 catalyst reduced CuO species. This is due to the fact that Cu species (Cu+, Cu0) are quickly reduced on the surface. CuFe2O4 is reduced to Cu and Fe3O4 using the reduced Cu species (Cu+) as a hydrogen donor center. The displacement of the CuO reduction temperature boosts the reduction capacity of catalyst and demonstrates significant activity in HTS due to the strong interaction between Cu/Fe and mesoporous alumina. Furthermore, the CFMA-15 catalyst shows the largest H2 consumption and is projected to be very active in the HT-WGS process. Figure 3 shows the catalytic reaction results. The CFMA-15 catalyst had the largest CO conversion rate, as predicted by the above-mentioned properties. Furthermore, all catalysts demonstrated 100% CO2 selectivity and 0% CH4 selectivity. The spinel copper and tetragonal structures were observed in the fresh and utilized CFMA-15 catalysts. This improves catalytic activity by increasing electron hopping between Fe2+ and Fe3+. The CFMA-15 catalyst demonstrated a CO conversion rate of 78% at 450 °C and sustained catalytic activity throughout time on stream. As a result, the CFMA-15 catalyst with optimized Cu/Fe ratio seems to have better activity in WGS than the previous study’s CFMA-10 catalyst [13]. As a result of conducting the reaction with Fe-based catalysts under the GHSV of about 40,000~42,000 h−1, the FAC-PC-3 catalyst showed a highest CO conversion in the temperature range of 350 to 450 °C. Related to the reaction results, the BET surface area, Fe3O4 crystallite size, reducibility, and Cu dispersion of all Fe-based catalysts depended on precursor concentration. The high activity of the FAC-CP-3 catalyst is attributed to the easy reducibility of Fe2O3 and Cu active species according to the characterization results. Therefore, the FAC catalyst was developed enough to replace the commercial Fe-Cr catalyst and showed commercialization potential.

3.2. Cu-Based Catalysts (Excellent Redox Ability of Cu)

Because of the toxicity of Cr, a commercial catalyst used in the HTS reaction, studies on Cr-free catalysts have been conducted for over 20 years. Among them, Cu-based catalysts are now being researched. Cu-based catalysts are less expensive than precious metals and exhibit high activity in the WGS process, making them popular as active metals in catalysts. Numerous studies are being conducted to introduce various supports into Cu [90]. Because of its low catalytic activity and stability, CeO2 is not employed as an active metal in the catalyst. When CeO2 is utilized as a support, it offers a larger surface area to boost metal oxide dispersion and increases water dissociation in the WGS process [91,92]. In this section, three papers related to Cu-based catalysts are summarized, and descriptions are distinguished by naming [NCC], [CCA], and [CBCA] in front of descriptions for each characteristic analysis.
[NCC] A recent study found that the mesoporous Ni-Cu-CeO2 catalyst (NCC) had higher activity than a single metal oxide catalyst in the HTS process. The developed and optimized Ni-Cu-CeO2 catalyst outperformed the single metal oxide catalysts in terms of performance, and the methanation reaction, a side reaction, did not occur. The combination of CeO2 with Ni and Cu metal oxides was shown to have greater activity and thermal stability than the previous Cu-CeO2 catalyst. Various synthesis methods were applied to improve the performance of the Ni-Cu-CeO2 catalyst. The Ni-Cu-CeO2 catalysts were made via evaporation-induced self-assembly (EISA), CP, solvothermal (ST) method, and IM, and were designated Ni-Cu-CeO2-SG (NCC-SG), Ni-Cu-CeO2-CP (NCC-CP), Ni-Cu-CeO2-ST (NCC-ST), and Ni-Cu-CeO2-IM (NCC-IM), respectively. Table 5 outlines the physical parameters of Ni-Cu-CeO2 catalysts synthesized using different approaches. The NCC-SG catalyst generated by the EISA method had the lowest crystal size (5 nm) and the highest surface area (102 m2/g) of the developed catalysts. Table 6 depicts the TPR data used to validate the catalyst’s reducibility. All of the produced catalysts displayed three reduction temperatures in the temperature range of 100 to 400 °C. The highest reduction temperature (187 °C) for CuO interacting with the support was observed in NCC-CP, which might be attributable to the almost unreduced Cu species trapped in the CeO2 lattice. Because the TPR findings of the EISA and CP catalysts were comparable, in the HTS process, oxygen vacancy is known to inhibit sintering by stabilizing the transition metal nanoparticles supported on the oxide surface. Figure 4 depicts the catalytic reaction results. Among the produced catalysts, EISA and CP demonstrated comparable CO conversion rates in the temperature range of 350 to 550 °C. The EISA method’s high activity is attributed to the mesoporous architecture scattered in active spots on the catalyst surface. The interaction between the CeO2 support and the metal oxide to generate a form in which Cu and Ni are reduced on the catalyst surface is responsible for the high activity of the NCC-CP catalyst. To compare the activities of the two catalysts in more detail, the activity was assessed at a higher GHSV of 161,000 h−1, and the catalyst produced using the EISA method had greater activity. This is due to the mesoporous structure, which enables gas to move freely while maintaining high activity. Furthermore, as a consequence of EISA, the catalyst synthesized by the EISA method has a high reaction rate in all temperature ranges. This finding showed that as the surface area increased, so did the response rate. The phase shift of the catalyst after the reaction. Because Ni was equally diffused in the catalyst, it did not reveal the oxide phase of Ni in the catalysts produced using the EISA and CP methods. The stability test of the EISA and CP catalysts revealed that both demonstrated stable performance when reacting at 450 °C for 25 h, with the EISA method catalyst showing somewhat greater activity. Thus, it was determined that this is an appropriate catalyst for the HTS reaction [26]. At high temperatures, the CeO2 catalyst initiates the WGS process through a redox mechanism. The redox process adsorbs CO on the metal site and subsequently oxidizes it with CeO2 lattice oxygen to produce CO2 and oxygen vacancy. H2O oxidizes reduced CeO2 again to create hydrogen. According to Djinovic et al., the activity of Cu-based catalysts employing CeO2 as a support in the WGS process is owing to the strong interaction between CuO and CeO2, which influence the creation of oxygen vacancy. Previous research has shown that oxygen vacancy is directly related to catalytic performance in WGS reactions. [CCA] The activity difference between several synthesis techniques of Cu/γ-Al2O3 (CuA) catalyst utilizing CeO2 as a support was investigated in this study. Ce/Cu/γ-Al2O3 (CeCuA) catalysts, Cu/Ce/γ-Al2O3 (CuCeA) catalysts, and Cu-Ce/γ-Al2O3 (Cu-CeA) catalysts were developed based on the impregnation order difference from the Cu/γ-Al2O3 catalyst. The catalyst surface area declined in the following order: CuA (124.5 m2/g) > CuCeA (116.1 m2/g) > Cu-CeA (114.0 m2/g). Table 5 summarizes the N2O chemisorption data. The CeCuA catalyst was found to have a high Cu dispersion of 1.7% and a small Cu crystal size. The TPR result to validate the catalyst reduction is given in Table 6. At a lower temperature than the other catalysts, the CeCuA catalyst deconvolved into three reduction temperatures. Accordingly, the CeCuA catalyst should be quite active in the WGS process. These findings indicate that adding CeO2 to the CuA catalyst surface improves the redox characteristics of copper oxide.
Figure 5 shows the Raman spectroscopy data. In addition, it has the highest A600/A460 value when compared to other catalysts. Figure 4 shows the reaction results used to determine the activity of the catalyst. In comparison to other catalysts, the CeCuA catalyst had the highest CO conversion rate throughout the process. This is consistent with earlier analysis and oxygen vacancy results. All catalysts had 0% and 100% CH4 and CO2 selectivity, respectively. The CeCuA catalyst has the largest turn over frequency (TOF) value, which explains why it has the maximum activity in HTS. In addition, the Ea value was 67 ± 1 kJ/mol, which was the lowest when compared to other catalysts. The CeCuA catalyst slightly decreased from 78% to 76% in the first 5 h when the CO conversion rate was reacted with a GHSV of 50,056 h−1 at 450 °C as a result of time on stream to evaluate the stability of the catalyst, but stable performance was maintained for 40 h. According to the redox mechanism of the WGS reaction, the concentration of oxygen vacancy is a significant component in the WGS reaction, as is the amount of reduced Cu species. In the WGS process, the reduced copper species are catalytically active. Consequently, the CeCuA catalyst demonstrated the best CO conversion despite a very high GHSV of 50,056 h−1 and a high CO concentration in the reactant gas [27]. Because of the high concentration of oxygen vacancy and the substantial amount of reduced Cu species, the CeCuA catalyst demonstrated strong catalytic activity in the HTS process. However, significant enhancements to the performance of current CeCuA catalysts are necessary to boost the efficiency of waste-to-hydrogen production. [CBCA] Ba, Zr, and Nd were doped into Ce/Cu/γ-Al2O3 catalysts in this study to examine their influence on the physicochemical parameters and catalytic performance of HTS. Table 5 summarizes the catalyst’s physical properties. As a result of BET surface area analysis, it decreased in the order of Ce/Cu/γ-Al2O3 (CeCuA) > Ce-Nd/Cu/Al2O3 (CNCA) > Ce-Ba/Cu/Al2O3 (CBCA) > Ce-Zr/Cu/Al2O3 (CZCA). The copper oxide crystal size of the CeCuA catalyst is 27.4 nm; whereas, the copper oxide crystal size of the Ba-doped catalyst is 28.2 nm. The CeCuA catalyst has the maximum Cu dispersion of 1.7%, followed by the Zr-doped catalyst at 1.5%, and the Ba-doped catalyst at 1.7%. The Ba-doped catalyst has a comparable Cu dispersion to conventional catalysts and is predicted to have stronger catalytic activity than other catalysts. Figure 5 shows the Raman spectrum results. All catalysts had a maximum between 460 and 600 cm−1. The oxygen vacancy in the CBCA and CZCA catalysts was high. Table 6 shows the reduction characteristics of prepared catalysts. The CBCA and CZCA catalysts moved to a higher temperature as a consequence of the analysis than the CeCuA catalysts. Figure 4 shows the strong metal to support interaction (SMSI) results. Because the SMSI of CBCA and CZCA catalysts may block copper sintering, these catalysts have greater catalysts during WGS reaction than CeCuA and CNCA catalysts. It is anticipated to show stable catalytic activity. The CBCA catalyst demonstrated better catalytic activity than other catalysts as a consequence of the catalytic process. This is because the addition of Ba increased the concentration of oxygen vacancy. The TOF decreased in the following order: CBCA > CZCA > CeCuA > CNCA. The CBCA and CZCA catalysts demonstrated greater catalytic stability than other catalysts and were reacted at 500 °C for 40 h at 50,000 h−1 GHSV. The lowest hydrogen yield reduction rate (27.9%) and production rate (36.1%) were achieved by the CBCA catalyst. This is mostly owing to its high resistance to sintering by Ba addition and its complete CO2 selectivity. The addition of Ba and Zr to the CeCuA catalyst enhanced the HTS reaction activity and SMSI effect, which raised the oxygen vacancy concentration and improved the catalyst stability. Nd doping, on the other hand, enhances the reducibility of the catalyst but has low catalytic efficiency. The association between characterization data and catalytic performance was found to be highly reliant on the interaction between the oxygen vacancy concentration supporting the interaction and the metal supported on the supporter. Because the SMSI effect was enhanced and the oxygen vacancy concentration was raised, the CBCA catalyst in the produced CeCuA demonstrated outstanding catalytic performance for HTS reaction. Therefore, the CBCA catalyst is the best choice for the HTS reaction to boost hydrogen production efficiency from waste-simulating syngas [48]. As a result of the reaction of the NCC catalyst, the NCC-SG catalyst showed high catalytic activity at a GHSV of 84,000 h−1. The higher activity of the NCC-SG catalyst was due to the mesoporous nature of the catalyst which provides the higher surface area and facilitates the uninterrupted diffusion of molecules to and from active sites of the catalysts. Other Cu-based catalysts reacted at GHSV of 50,000 h−1; CBCA catalysts showed high catalytic activity at 400~550 °C. The higher activity of the CBCA catalyst was due to enhanced SMSI effect and increased oxygen vacancy concentration.

3.3. Ni-Based Catalyst (High OSC)

A prior study showed outstanding catalytic activity by doping a CeO2 support with metal oxides, such as Ni and Cu, in order to develop a Cr-free catalyst for the HT-WGS process. CeO2 reacts significantly with active metal compounds, resulting in increased catalytic characteristics. Among numerous non-precious metals, Ni exhibits outstanding activity by increasing catalytic surface area [93,94]. Thus, it is a suitable catalyst for the HT-WGS process. However, since methanation reaction is a side reaction of Ni-based catalysts, research on improving the activity of the catalyst without methanation reaction is necessary. According to research, alkali metals impede the methanation process. In this section, one paper related to Ni-based catalysts is summarized. Previous research found that Fe-Al-Ni catalysts doped with Ba helped decrease side reactions. The Ni-CeO2 catalyst was doped with the alkali and alkaline promoters K, Ca, Mg, and Ba. This catalyst was chosen to inhibit a key side reaction, methanation, and the activity and side reaction of the produced catalyst, which were investigated. Table 7 summarizes the physical parameters of Ni-based catalysts. The Ni-CeO2 catalyst has the largest BET surface area among the prepared catalysts, according to the BET analysis. The BET surface area of the promoter/Ni-CeO2 catalyst decreased relative to the catalyst without the promoter when the promoter was introduced. The prepared catalysts had a BET surface area in the descending order of Ni-CeO2 (131.29 m2/g) > Ba/Ni-CeO2 (118.83 m2/g) > Ca/Ni-CeO2 (112.45 m2/g) > K/Ni-CeO2 (110.34 m2/g) > Mg/Ni-CeO2 (109.85 m2/g). The XRD data are given in Figure 6A, and peaks associated with CeO2 were found at 28.6°, 33.1°, 47.5°, 56.4°, 59.1°, 69.4°, 76.7°, and 79.1°. This is the cubic phase of CeO2 (ICDD card No. 34-0394). Peaks related to Ni were also discovered at 44.7° and 51.7°, which are cubic Ni0 (ICDD card No. 98-6960). The promoter peak was not visible because of the low concentration of 2%. Table 7 lists the H2 chemisorption data. The active metal dispersion decreased in the order of Ni-CeO2 (4.00%) > Ca/Ni-CeO2 (3.28%) > Ba/Ni-CeO2 (3.20%) > K/Ni-CeO2 (3.16%) > Mg/Ni-CeO2 (1.39%). It was proven that the dispersion decreased when the promoter was added. The dispersion of the Mg/Ni-CeO2 catalyst was substantially smaller than that of other catalysts. This is due to a significant contact between MgO and NiO, which decreases the production of active Ni species capable of reacting with hydrogen. Table 7 summarizes the results of the active Ni site calculation. The Ni-CeO2 catalyst had the highest value of 1.37 × 10⁻⁶ mol/gcat, followed by the Ba/Ni-CeO2 catalyst at 1.14 × 10⁻⁶ mol/gcat. The TPR analysis results are given in Figure 6B, and all catalyst reduction peaks were deconvolved into four peaks. The initial peak (α) was caused by a decrease in the amount of oxygen adsorbed on the surface. Ni ions entered the CeO2 lattice and a few Ce4+ ions were replaced in the Ni-CeO2 catalyst. Oxygen vacancy formed because of the difference in ionic radii of Ni2+ (0.81 Å) and Ce4+ (0.97 Å), and the adsorbed oxygen species could be readily reduced.
The second largest and broadest peak may be divided into two reduction peaks (β, γ), which correspond to free NiO and complex NiO reduction, respectively. Free NiO has a low interaction with CeO2, but complex NiO has a high interaction with CeO2, hindering the reduction. The last reduction peak (δ) is generated by CeO2 reduction. When compared to the traditional Ni-CeO2 catalyst, the promoter-introduced catalyst is displaced to the right, showing an enhanced interaction between Ni and the support. It is well recognized that the catalyst’s easy reducibility improves electron transfer capacity and consequently WGS activity. Thus, Ni-CeO2 catalysts having NiO reduction peaks at low temperatures should have higher WGS activity. The CO2-TPD results are displayed in Figure 6C, and the K/Ni-Ce O2 catalyst exhibited the largest amount of CO2 desorption. The prepared catalyst desorbs CO2 at the following rates: K/Ni-CeO2 (154.03 cm3CO2/gcat) > Ca/Ni-CeO2 (109.10 cm3CO2/gcat) > Mg/Ni-CeO2 (101.91 cm3CO2/gcat) > Ba/Ni-CeO2 (88.44 cm3CO2/gcat) > Ni-CeO2 (87.75 cm3CO2/gcat). It was proven that except for the K/Ni-CeO2 catalyst, the methanation process was repressed and the WGS activity enhanced. The reaction results are given in Figure 6D and Figure 7, and it was verified that all of the produced catalysts showed low activity at 350 °C. The CO conversion rates for the Ni/CeO2 and Ca/Ni-CeO2 catalysts were 33% and 14%, respectively; whereas, the other catalysts exhibited no activity. The Ni/CeO2 and Ca/Ni-CeO2 catalysts enhanced CO conversion rates to 94% and 71%, respectively, at 400 °C. The Ni/CeO2 catalyst had the best CO conversion rate across all temperature ranges; whereas, the Ca/Ni-CeO2 catalyst showed strong activity at low temperatures. This is due to the Ca/Ni-CeO2 catalyst’s surface having a high oxygen storage capacity (OSC). The Ni/CeO2 catalyst, however, demonstrated that the methanation process happened in all temperature ranges, as shown in Figure 6E. When the promoter was introduced, the methanation reaction was repressed. Figure 6F shows the outcome of estimating the H2 yield. The Ni-CeO2 catalyst had the best yield at around 350 °C, but the Ca/Ni-CeO2 catalyst grew fast at 400 °C. Mg/Ni-CeO2 catalysts at 450 °C and K/Ni-Ce O2 catalysts at 550 °C had the largest values, and Ca/Ni-Ce O2 and Mg/Ni-CeO2 catalysts also had large values. The Ca/Ni-CeO2 and Mg/Ni-CeO2 catalysts were reacted for 60 h at 450 °C with a GHSV of 315,282 h−1 for the stability test results. Without deactivation, the Ca/Ni-CeO2 and Mg/Ni-CeO2 catalysts converted CO at rates of 91% and 69%, respectively. As a result, when compared to commercial and other catalysts, the Ca/Ni-CeO2 catalyst had good hydrogen production capability as well as high activity and stability [87]. As a result of the reaction of the Ni-based catalyst, the Ca/Ni-CeO2 catalyst exhibited superior HTS activity, compared to other promoted Ni-CeO2 catalysts. The higher activity of Ca/Ni-CeO2 catalyst was due to the high OSC. Similarly, the Ca/Ni-CeO2 catalyst had stability for 18 h at a very high GHSV of 1,050,957 h−1.

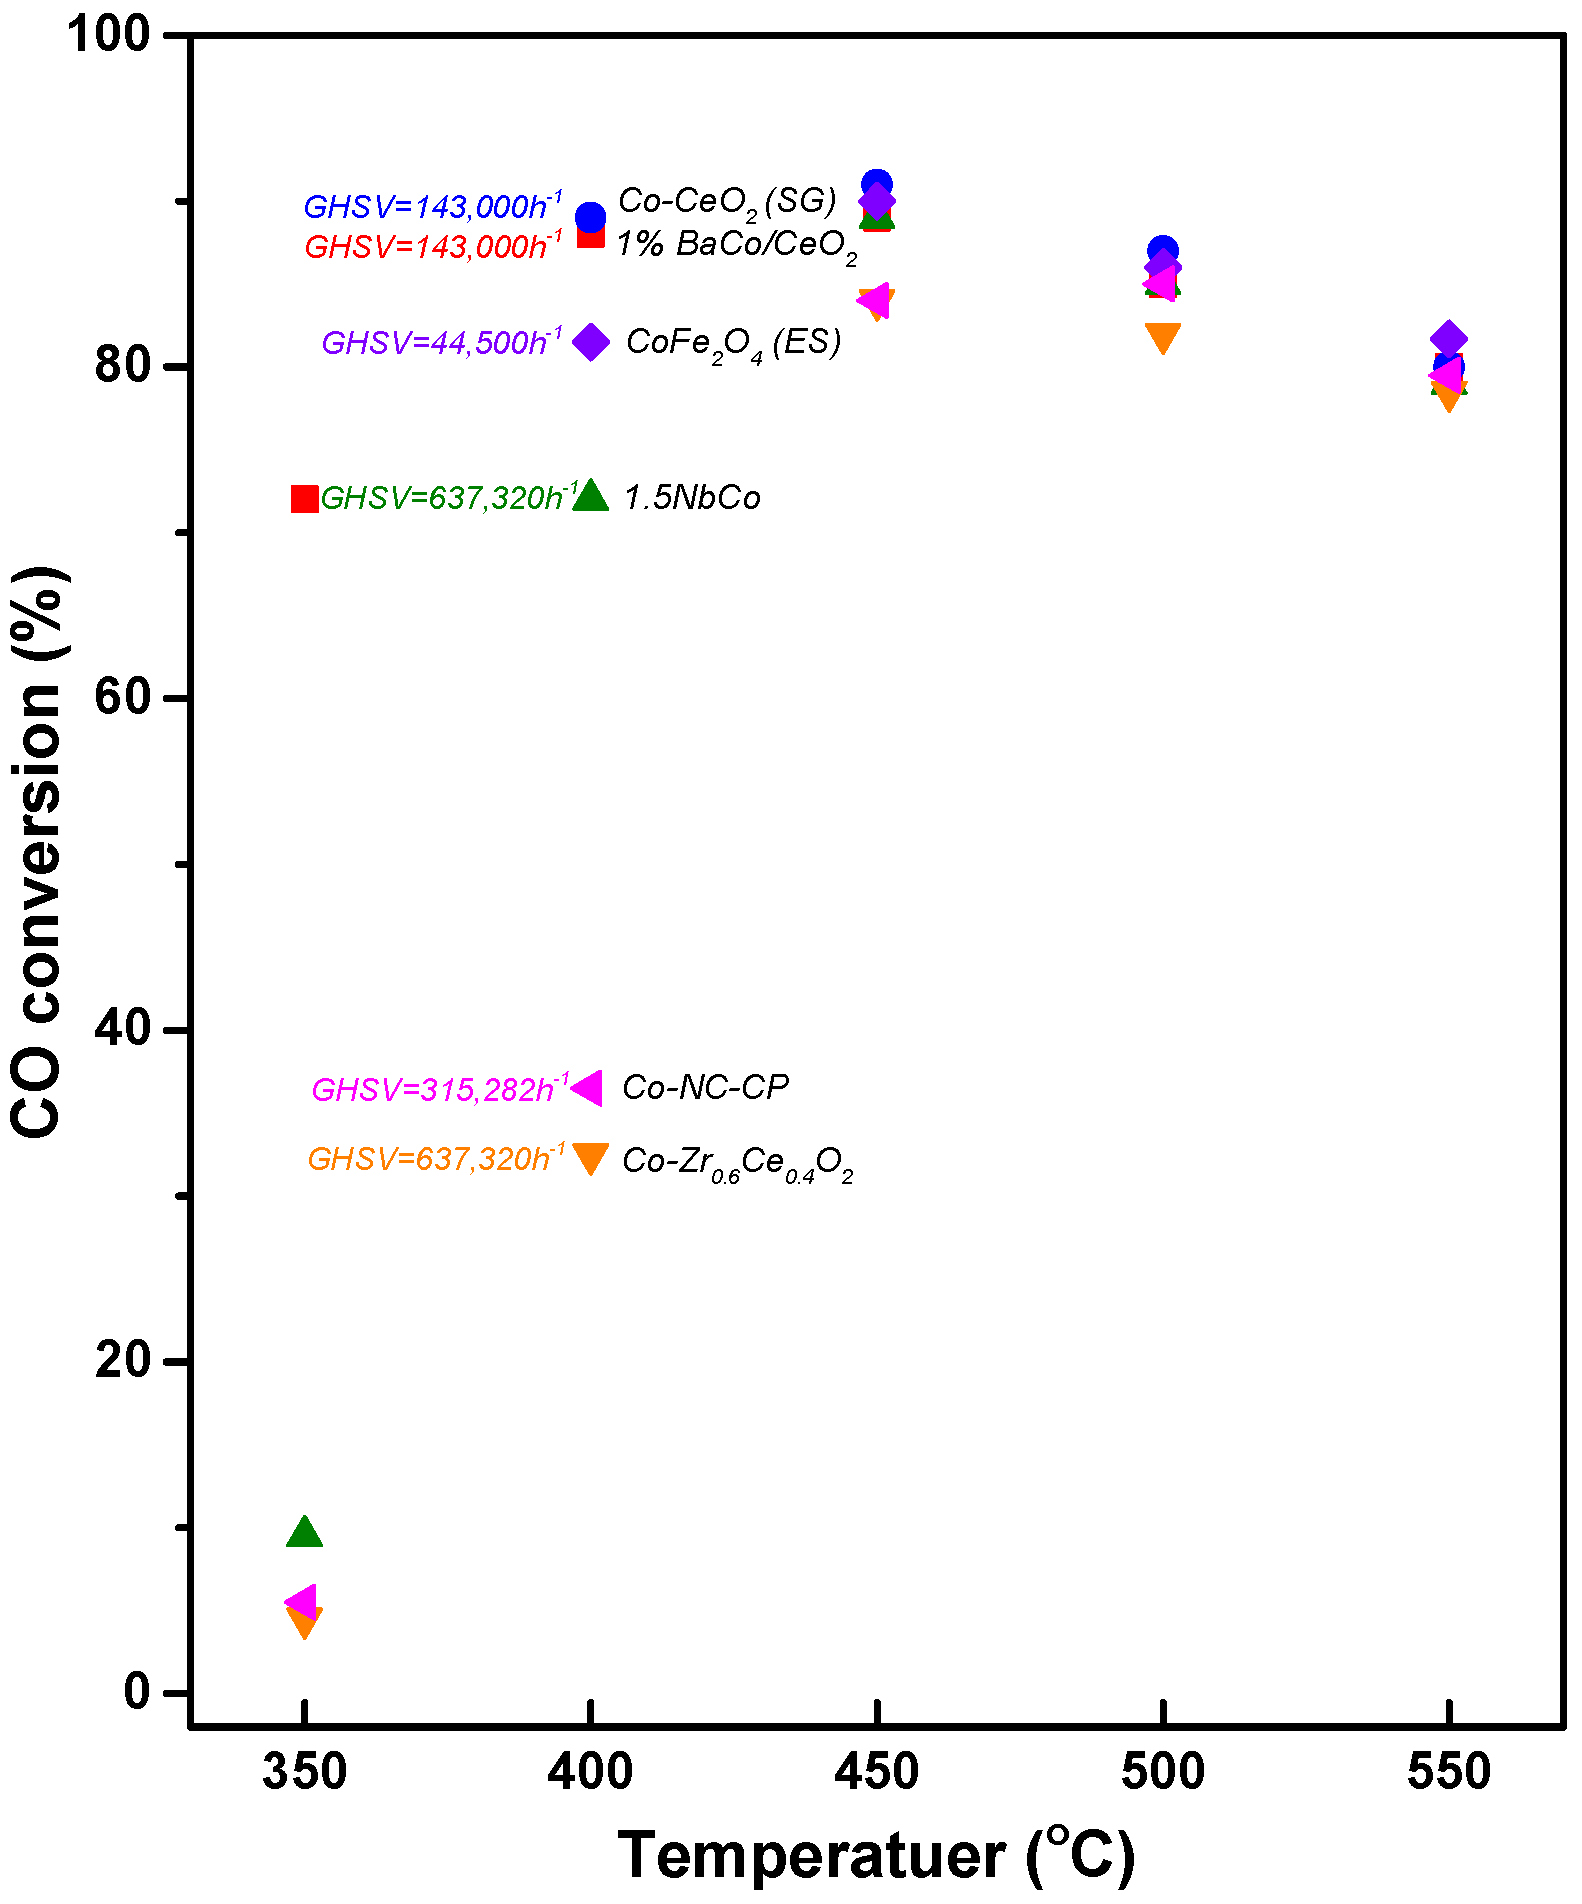
3.4. Co-Based Catalyst

As discussed in the previous section (Ni), Co is also one of the non-precious candidates for the WGS reaction. A number of active sites and oxygen storage capacity are the key properties of the Co/CeO2 catalyst. Research has tried to improve the characteristics of Co/CeO2 by adding the promoter, optimizing the composition, and using various synthesis methods. In this section, four papers related to Co-based catalysts are summarized, and descriptions are distinguished by naming [BCC], [CZC], [CC-M], [C-NC], and [CF] in front of descriptions for each characteristic analysis.
[BCC] A catalyst study in which Ba was added to Co/CeO2 was conducted. Catalysts were produced using CP and IWI (incipient wetness impregnation) method. The loading amount of Ba promoter in the 15 wt% Co/CeO2 catalyst system was varied from 0, 1, 2, and 3 wt%, which were designated as Co/CeO2 (BCC-0), 1% BaCo/CeO2 (BCC-1), 2% BaCo/CeO2 (BCC-2), and 3% BaCo/CeO2 (BCC-3), respectively. Table 8 summarizes the physical properties of Co-based catalysts. The Co/CeO2 catalyst with 1% Ba had a high BET surface area of 60 m2/g and a high surface Co0 dispersion value [1]. Catalyst optimization studies using the Co-CeO2 production technique revealed varied BET surface areas. When the BET surface area of the catalyst before and after the reaction was evaluated, it revealed a declining trend [6]. It was proven that there was no correlation between the BET surface area and the catalytic activity of the Co-CeO2 catalyst related to the production process [6]. In NbCo-CeO2 studies, where niobium oxide was added to Co-CeO2, BET analysis was performed. As a result, Co-CeO2 catalysts including Nb had equal BET surface areas and lower specific surface areas than catalysts containing no Nb [53]. [CZC] A catalyst study in the Co-CeO2 catalyst promoted with ZrO2. The Co-CeO2 (C-C), Co-ZrO2 (C-Z), and Co-Zr(1-x)Ce(x)O2 catalysts were prepared using a previously reported co-precipitation method [8]. The Co content of all the catalysts was fixed at 15 wt%. The CeO2:ZrO2 molar ratio of the Co-Zr(1-x)Ce(x)O2 catalysts was varied from ZrO2:CeO2 = 2:8, 4:6, 6:4, and 8:2, which were designated as Co-Zr0.2Ce0.8O2 (CZ2C8), Co-Zr0.4Ce0.6O2 (CZ4C6), Co-Zr0.6Ce0.4O2 (CZ6C4), and Co-Zr0.8Ce0.2O2 (CZ8C2), respectively. In a catalyst study in which ZrO2 was introduced to Co-CeO2, BET analysis revealed that as the Zr concentration rose, the BET surface area increased, but the catalytic activity remained unchanged [8]. [CC-M] Co-CeO2 catalysts were prepared by various manufacturing methods such as sol-gel, incipient wetness impregnation, co-precipitation, and hydrothermal, which were designated as Co-CeO2-SG (CC-SG), Co-CeO2-IWI (CC-IWI), Co-CeO2-CP (CC-CP), and Co-CeO2-HT (CC-HT), respectively. Catalyst structure and oxygen vacancy concentration were probed by Raman spectroscopy. In the case of the CC-SG catalyst, this peak was clearly shifted to lower wave numbers, which was indicative of CeO2 structural distortion that generated lattice strain and defects in the CeO2 lattice, and thus promoted the formation of oxygen vacancies [6]. This indicates that the largest amount of oxygen vacancy was formed in the CC-SG catalyst. [CF] CoFe2O4 catalysts were prepared by various manufacturing methods such as electrospinning, sol-gel, hydrothermal, and co-precipitation, which were designated as CoFe2O4-ES, CoFe2O4-SG, CoFe2O4-HT, and CoFe2O4-CP, respectively. The CoFe2O4 (CP) catalyst had the largest BET surface area in a study on the production technique of CoFe2O4, and the BET surface area declined in the order of CoFe2O4 (CP) > CoFe2O4 (HT) > CoFe2O4 (ES) > CoFe2O4 (SG) [88]. In the catalyst study using the CoFe2O4 production process, the XRD analysis revealed the same CoFe2O4 peak [88]. [C-NC] Nb-doped Co-CeO2 catalysts with 15 wt%. Co were prepared using a co-precipitation method. The Nb-doped Co-CeO2 catalysts were denoted xNbCo, with “x” representing the weight percentage of 0.5 wt% Nb, 1.5 wt% Nb, and 2.5 wt% Nb. In addition, 0.5 wt% Nb-doped Co-CeO2 catalysts were prepared by various manufacturing methods such as co-precipitation, incipient wetness impregnation, sol-gel, and hydrothermal, which were designated as Co-NC-CP (CNC-CP), Co-NC-IWI (CNC-IWI), Co-NC-SG (CNC-SG), and Co-NC-HT (CNC-HT), respectively. The BET analysis revealed surface area values in the order of Co-NC > Cu-NC > Fe-NC > Zn-NC in the metal material optimization study utilizing Nb-CeO2 as a support. The Co-NC catalyst had the largest BET surface area value, and its increased surface area enhanced the mass transfer coefficient of reactants and products. Consequently, Co-NC and Cu-NC catalysts were expected to perform better than Fe-NC and Zn-NC catalysts [89]. The Co-NC-CP catalyst had the largest BET surface area in the optimization study of the Co-NC manufacturing process, and the value decreased in the order of Co-NC-CP > Co-NC-HT > Co-NC-IM > Co-NC-SG. CO chemisorption analysis revealed that the Co dispersion of the Co-NC catalyst decreased in the following order: Co-NC-HT > Co-NC-CP > Co-NC-SG > Co-NC-IM. Co dispersion impacts catalytic activity because it is proportional to the number of active species in contact with the reactants [89]. There was a difference in lattice parameter values between CeO2 and the manufactured catalyst in a metal material optimization study utilizing Nb-CeO2 as a support owing to the difference in ionic radii between the active material and Ce ions [89]. Following the metal material optimization study using Nb-CeO2 as a support, the production technique of the Co-NC catalyst with high activity was optimized. All catalysts had a CeO2 peak, but only catalysts produced with SG and IM had a broad and small Co peak at 44.5 °C [89]. Table 9 shows the TPR findings of the Co-based catalyst. [BCC] All Co/CeO2 catalysts with 1 wt% Ba added decreased at a lower temperature than other catalysts in a study in which Ba was added to Co/CeO2 catalysts. The reducibility of cobalt oxide improved as the amount of Ba rose, as did the reduction temperature. This is due to the fact that the interaction between CeO2 and Co was diminished with the addition of Ba [1]. The TPR analysis performed in the catalyst optimization study using the Co-CeO2 production process revealed two primary temperatures, as shown in Table 9. At the largest temperature, the Co-CeO2 catalyst produced with SG is reduced from CoO to Co0. Consequently, CoO, an active species, was generated at a higher temperature in the HTS reaction than other catalysts, and it was hypothesized that the interaction between Co0 and CeO2 may be enhanced [6]. The Co-CeO2 catalyst with Nb moved to a lower temperature than the Co-CeO2 catalyst in the H2-TPR data from the NbCo-CeO2 study, in which niobium oxide was added to Co-CeO2. Because of the addition of Nb, the concentration of electron mediators rose as Ce4+ was replaced by Nb5+, causing structural deformation of CeO2 and increased oxygen defects. Because high OSC demonstrates high activity in the WGS process, the catalyst with Nb added was predicted to display better catalytic activity than the Co-CeO2 catalyst. However, the reduction temperature of Nb2O5 was not detected, which seems to be due to the requirement for a high temperature of 900 °C or more [53]. [CZC] A study of catalysts containing ZrO2 and Co-CeO2 revealed four reduction temperatures. The first reduction temperature was created by Co3O4 reduction with large crystals, while the second reduction temperature was caused by Co3O4 reduction with small crystals to CoO. The third reduction temperature was the result of CoO to Co0 reduction, while the fourth reduction temperature was thought to be a broad reduction temperature range created by bulk CeO2 reduction [8]. [CC-M] The reduction at 211–327 °C was attributed to the reduction of Co3O4 to CoO, while the second reduction at 262–414 °C represented the reduction of CoO to Co0. The temperature of the Co3O4 to CoO increased in the order of CC-HT < CC-SG < CC-CP < CC-IWI, while that of the CoO to Co0 increased in the order of CC-HT < CC-CP < CC-IWI < CC-SG. The reduction of CoO to the Co0 in CC-SG catalyst occurred at the highest temperature. This means that the active species in HTS, Co0 (metallic cobalt), is formed at a higher temperature than other catalysts in the case of the CC-SG catalyst. [C-NC] H2-TPR analysis of each catalyst was performed in the metal optimization study utilizing Nb-CeO2 as a support. The first temperature was the reduction temperature of Co3+ to Co2+ in the H2-TPR analysis of the Co-NC catalyst, the second temperature was the reduction temperature of Co2+ to metallic Co, and the third temperature was the reduction temperature of bulk CeO2 on the catalyst reduction temperatures, a key feature in the oxidation–reduction process in the WGS surface. The first temperature in the Cu-NC catalyst’s H2-TPR analysis was the reduction temperature from Cu2+ to Cu+, while the second temperature was the reduction temperature from Cu+ to metallic Cu. Lower reaction and the reduction temperature increased in the order Cu-NC < Co-NC < Fe-NC < Zn-NC [89]. The reduction temperatures of the manufactured catalysts displayed distinct patterns as a consequence of H2-TPR in the Co-NC manufacturing technique optimization study. This suggests that the preparation process influences the reducibility of the Co-NC catalyst. The reduction temperature increased in the order of Co-NC-SG < Co-NC-IM < Co-NC-CP < Co-NC-HT [89]. [CF] Table 10 shows the TPR findings of the CoFe2O4 catalyst. Only in the case of the catalyst manufactured by electrospinning did a distinct reduction peak occur at a temperature of around 300 °C as a result of H2-TPR analysis in the catalyst study according to the production technique of CoFe2O4. Similar findings have been reported for nanowire-structured CoFe2O4 spinel catalysts. Complex overlapping peaks emerged owing to iron reduction (Fe3O4 to FeO; FeO to Fe0), and Co appeared at temperatures over 400 °C. Catalysts generated by means other than electrospinning exhibited overlapping peaks, including conversion of Fe2O3 to Fe3O4 [88]. [BCC] As a consequence of the catalytic reaction, the Co/CeO2 catalyst with 1 wt% Ba showed the largest CO conversion rate in the catalyst study in which Ba was added to the Co/CeO2 catalyst. It had the maximum stability and catalytic activity in the stability test [1]. Figure 8 shows CO conversion results. The reaction of the catalyst synthesized with SG demonstrated the largest CO conversion rate (90%) in the catalyst optimization study according to the production technique of the CeO2 catalyst. Furthermore, all other catalysts, with the exception of the hydrothermal synthesis catalyst, did not create side reactions [6]. The catalytic reaction of NbCo-CeO2 with niobium oxide added to Co-CeO2 exhibited high CO conversion in the descending order of 1.5 wt% NbCo-CeO2 > 0.5 wt% NbCo-CeO2 > 2.5 wt% NbCo-CeO2 > Co-CeO2. Even at high space velocity conditions, the 1.5 wt% NbCo-CeO2 catalyst demonstrated good activity and stability with no side reactions [53]. [CC-Z] At 450 °C, the catalysts in which ZrO2 was added to Co-CeO2 decreased in the order of Zr0.6Ce0.4O2 > Zr0.4Ce0.6O2 > Zr0.2Ce0.8O2 > Zr0.8Ce0.2O2 > CeO2 > ZrO2. All catalysts demonstrated comparable CO conversion rates at reaction temperatures of 500 °C and 550 °C. High CO conversion rates were observed for Co-Zr0.6Ce0.4O2, Co-Zr0.4Ce0.6O2, and Co-Zr0.2Ce0.8O2 catalysts with high OSC values. However, the Co-Zr0.4Ce0.6O2 catalyst with the highest OSC showed a lower CO conversion rate than the Co-Zr0.6Ce0.4O2 catalyst. This result may be attributable to the Co-Zr0.6Ce0.4O2 catalyst’s easier reducibility [8]. [CF] Only the catalyst generated by electrospinning had a high CO conversion rate of more than 80% during the HTS process; whereas, other catalysts showed low CO conversion rates. Furthermore, only the catalyst produced by electrospinning did not exhibit side reactions in all ranges. Catalysts other than those generated by electrospinning seem to have low oxygen vacancy, making formation of an active phase problematic [88]. [C-NC] The Co-NC catalyst demonstrated high CO conversion after 450 °C in a metal optimization study utilizing Nb-CeO2 as a support. It had a 100% CO2 selectivity, and no side reactions occurred. The Co-NC catalyst demonstrated a consistent conversion rate after 60 h of reaction with the Cu-NC catalyst. Among the prepared catalysts, the Co-NC catalyst was the most active [89]. The catalyst synthesized with CP had the largest oxygen vacancy concentration in the study of optimizing the production technique of Co-NC. Because of the high OSC and Co dispersion, the maximum CO conversion rate was higher than 500 °C. Furthermore, the high OSC and robust contact between the Co and NC supports resulted in consistent Co-NC-CP catalytic activity [89]. As a reaction result of the Co-based catalyst, catalyst activity was measured in a various range of GHSV. The CoFe2O4-ES catalyst showed relatively high catalytic activity at the GHSV of 44,500 h−1. The high catalytic activity of the CoFe2O4-ES catalyst is due to its superior redox property. This superior redox property may easily induce the formation of an active phase (Co0 and Fe2O3) in the CoFe2O4.

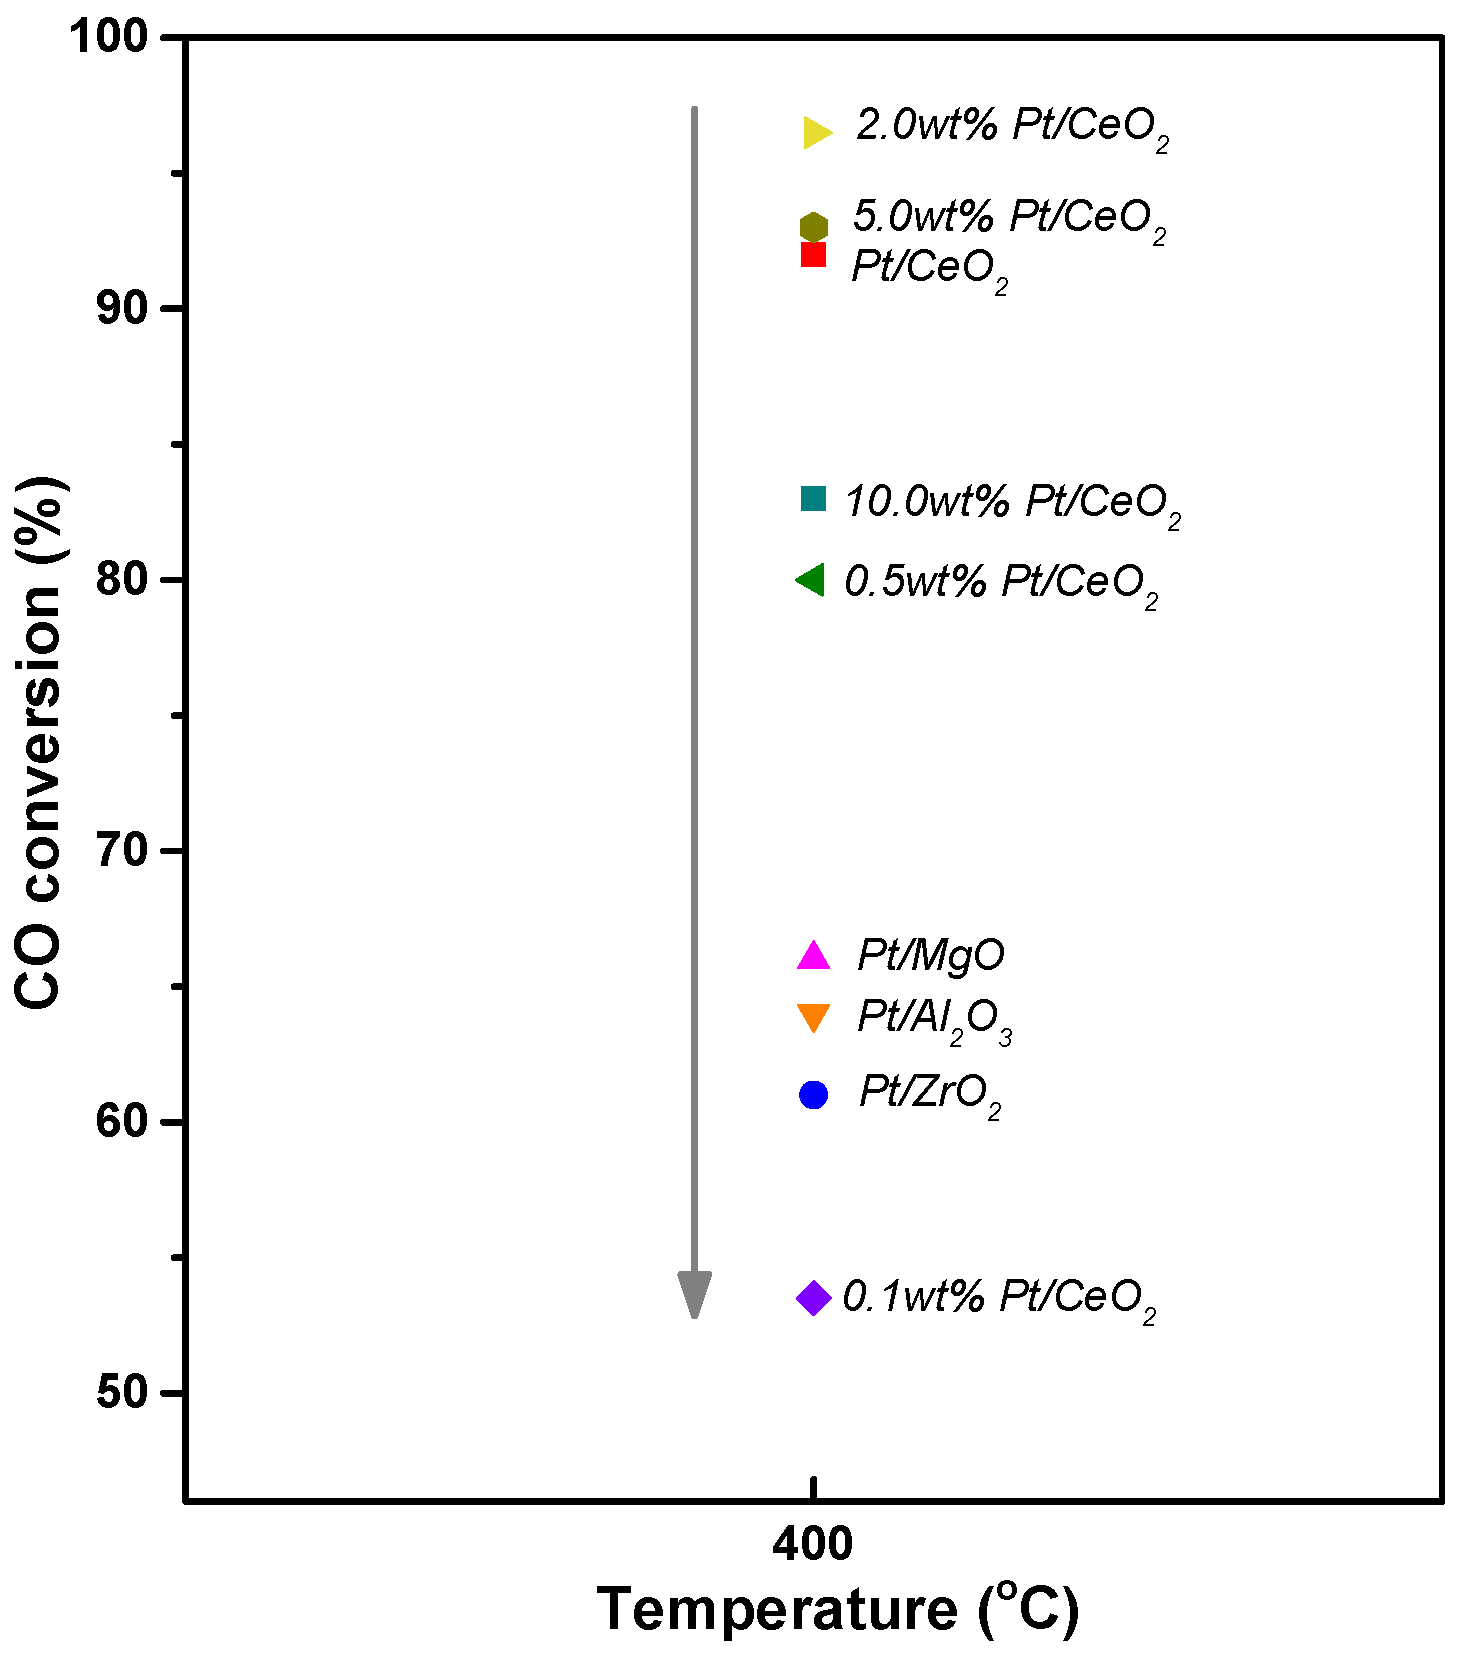
3.5. Pt-Based Catalyst

Various precious metals were applied for the WGS reaction, but Pt-based catalysts were known to be useful for the WGS reaction of waste synthesis gas because of their excellent activity and operation in a wide range of temperatures. In addition, Pt-based catalysts have been reported to have a high activity even in the presence of impurity (H2S), which typically exists in the renewable resources. In this section, two papers related to Pt-based catalysts are summarized, and descriptions are distinguished by naming [Pt-S] and [Pt-L] in front of descriptions for each characteristic analysis.
[Pt-S] Various supports were prepared by precipitation, and Pt/CeO2, Pt/MgO, Pt/Al2O3, and Pt/ZrO2 catalysts were produced using the IWI method. The loading amount of Pt on various supports was fixed at 2 wt% [59]. [Pt-L] A catalyst study in which Pt was added to CeO2 was conducted. Catalysts were produced using precipitation and the IWI method.
The loading amount of Pt in the CeO2 supports varied at 0.1 wt%, 0.5 wt%, 2.0 wt%, 5.0 wt%, and 10.0 wt%. Table 11 summarizes the physical properties of Pt-based catalysts [57]. [Pt-S] The Pt/CeO2 catalyst had the lowest surface area value of 77 m2/g as a result of BET analysis in the study of Pt catalysts utilizing different supports. Despite having the smallest surface area, the degree of Pt0 dispersion was the most significant. This seems to be related to the high amount of deficient oxygen in CeO2 [59]. [Pt-L] According to BET analysis in a study where Pt/CeO2 catalysts were made by changing the amount of Pt, the surface area when Pt was added decreased compared to CeO2. Among the Pt/CeO2 catalysts, the catalyst with 2 wt% Pt added had the largest surface area [57]. Table 12 shows the TPR results of the Pt-based catalyst. [Pt-S] Only the Pt/CeO2 catalyst consumed a substantial amount of hydrogen at less than 100 °C as a result of H2-TPR analysis in the study of Pt catalysts employing different supports. PtOx species with weak interactions with the support seem to be diminished even at room temperature [59]. [Pt-L] Two reduction temperatures were found in the H2-TPR analysis results for all catalysts in the study of synthesizing Pt/CeO2 catalysts by altering the amount of Pt. The first temperature was the reduction temperature of PtOx to metal Pt0, while the second temperature was the bulk CeO2 reduction temperature. Among the produced catalysts, the 2% Pt/CeO2 catalyst had the lowest reduction temperature and the highest hydrogen consumption at around 75 °C. As reverse spillover of CeO2 lattice oxygen developed at a low temperature, the second reduction temperature of the 2% Pt/CeO2 catalyst diminished. When CeO2 and Pt-added CeO2 are compared, it can be concluded that adding Pt causes oxygen reverse spillover [57]. Figure 9 shows CO conversion results. As a result of a Pt-based catalyst reaction, Pt catalysts were tested in reaction using various supports. [Pt-S] Because the concentration of sulfur in waste-derived syngas varies greatly, the stability test was carried out while varying the quantity of H2S from 0 to 1000 ppm. When H2S was supplied at less than 100 ppm, thermodynamic equilibrium was virtually attained without deactivation for over 100 h. The catalytic activity decreased when H2S was introduced at 500 and 1000 ppm, although it remained above 60% for 100 h. When the H2S infusion was halted, the catalytic activity was totally recovered. Catalysts supported by CeO2 showed good oxidation–reduction characteristics. The Pt/CeO2 catalyst performed best in terms of activity and sulfur tolerance. Furthermore, it demonstrated a remarkable regeneration rate owing to high OSC and persistent catalytic activity even when H2S concentrations were raised to 1000 ppm [59]. [Pt-L] Reactions were performed to demonstrate sulfur resistance and catalytic activity in a study in which Pt/CeO2 catalysts were produced by changing the amount of Pt. As a consequence, the catalyst with a Pt/CeO2 content of 2% demonstrated good initial CO conversion, sulfur resistance, and regeneration. When exposed to 500 ppm H2S, catalysts with 0.1 and 0.5 wt% Pt demonstrated low sulfur tolerance. Catalysts with 5 and 10% wt% Pt included a significant amount of scattered Pt0. However, since the amount of Pt is substantial, the particle size may be rather large, and this has the disadvantage that it is easy to sinter during high-temperature reactions. In conclusion, the 2 wt% Pt/CeO2 catalyst is best suited as a sulfur-resistant catalyst for the practical use of waste-derived syngas [57]. As a result of the reaction of the Pt-L catalysts, the 2 wt% Pt/CeO2 catalyst showed the highest catalytic activity. Among prepared Pt-L catalysts, the 2 wt% Pt/CeO2 catalyst demonstrated the best redox characteristics, with the highest number of Ov and Ce3+ species related to oxygen vacancy, the highest OSC, and the most dispersed Pt0 species. In the Pt-S catalyst, the reaction between sulfur adsorbed to Pt by the Pt/CeO2 catalyst and the mobile oxygen generated by the CeO2 support influenced the regeneration mechanism and had high sulfur tolerance.

4. Conclusions and Perspectives

The waste policies of many countries have focused on energy recovery in line with the so-called “waste-to-energy” (WtE) strategy. In particular, it is very useful to produce hydrogen from a product that is obtained from a thermal process of waste such as pyrolysis and gasification (excluding incineration). However, the primary issues are a wide range of product composition and high concentrations of CO, which in turn lead to the restriction of their upgrade to hydrogen via the WGS reaction. Therefore, research has continuously studied the improvement of catalytic performance for the WGS reaction. In this review, we discussed the characterization and catalytic performance of Fe-, Cu-, Ni-, Co-, and Pt-based catalysts for the WGS reaction in order to provide a guideline for designing an appropriate catalyst. It was necessary to obtain the catalysts having the largest number of active sites in common. In addition, the redox ability was the one of the core characteristics, considering the redox mechanism of the WGS reaction. The detailed results depending on the composition of catalysts are as follows: First, the easier reducibility was one of the most significant properties for Fe-based catalysts. The rapid redox cycle between Fe2+ and Fe3+ mainly determined the catalytic activity for the WGS reaction. Cu played a key role in enhancing the reducibility of Fe and provided additional active sites. In addition, a harmless textural promoter, such as Al, was necessary for Fe-based catalysts which were prone to be a sintering. Second, Cu dispersion and oxygen storage capacity importantly affected the catalytic activity of Cu/CeO2 and promoted catalysts. The strong interaction between CuO and CeO2 was related to the redox cycle of Cu2+ ↔ Cu1+ and Ce4+ ↔ Ce3+. Third, it was of paramount importance to prevent the occurrence of methanation reaction over Ni- and Ni/CeO2-based catalysts, apart from enhancing the dispersion and oxygen storage capacity. Alkali or alkali-earth metals were effective for the suppression of methanation reactions. Fourth, the amounts of Co active sites and oxygen storage capacity were significant for Co/CeO2 and promoted catalysts, which was significant for the Cu/CeO2 catalyst. Fifth, the resistance against impurity was one of the key parameters because of the importance and practicality of the renewable resources. The Pt/CeO2 catalyst showed excellent activity with high resistance to H2S even at a 550 ppm of H2S. A lot of breakthrough research in this area will provide appropriate directions for the improvement of FWGS catalysts in order to establish the industrialization of hydrogen production processes from waste. Fe-Al-Cu catalysts with improved reducibility and the addition of new active sites are promising to replace a commercial Fe-Cr catalyst as the WGS catalyst for hydrogen production from waste. In addition, it is reasonable to combine the Ni and Co active metals with a CeO2 support which has a high OSC. These non-noble metals-based catalysts are useful and economically feasible, but they are active under the conditions where impurities are eliminated. Pt/CeO2 only exhibits excellent catalytic performance even under conditions containing impurities, thus it can be useful for a small-scale facility which restricts the installation of processes to eliminate impurities.

Author Contributions

Writing—original draft, R.-R.L. and I.-J.J.; conceptualization, J.-O.S., W.-J.J. and H.-S.R.; supervision, J.-O.S., W.-J.J. and H.-S.R. All authors have read and agreed to the published version of the manuscript.

Funding

This research received no external funding.

Institutional Review Board Statement

Not applicable.

Informed Consent Statement

Not applicable.

Acknowledgments

This paper was supported by Wonkwang University in 2021.

Conflicts of Interest

The authors declare no conflict of interest.

References

  1. Lee, Y.L.; Kim, K.J.; Jang, W.J.; Shim, J.O.; Jeon, K.W.; Na, H.S.; Kim, H.M.; Bae, J.W.; Nam, S.C.; Jeon, B.H.; et al. Increase in stability of BaCo/CeO2 catalyst by optimizing the loading amount of Ba promoter for high-temperature water-gas shift reaction using waste-derived synthesis gas. Renew. Energy 2020, 145, 2715–2722. [Google Scholar] [CrossRef]
  2. Ellabban, O.; Abu-Rub, H.; Blaabjerg, F. Renewable energy resources: Current status, future prospects and their enabling technology. Renew. Sustain. Energy Rev. 2014, 39, 748–764. [Google Scholar] [CrossRef]
  3. Gallastegi-Villa, M.; Aranzabal, A.; González-Marcos, J.A.; González-Velasco, J.R. Tailoring dual redox-acid functionalities in VOx/TiO2/ZSM5 catalyst for simultaneous abatement of PCDD/Fs and NOx from municipal solid waste incineration. Appl. Catal. B 2017, 205, 310–318. [Google Scholar] [CrossRef]
  4. Jeong, D.W.; Subramanian, V.; Shim, J.O.; Jang, W.J.; Seo, Y.C.; Roh, H.S.; Gu, J.H.; Lim, Y.T. High-Temperature Water Gas Shift Reaction Over Fe/Al/Cu Oxide Based Catalysts Using Simulated Waste-Derived Synthesis Gas. Catal. Lett. 2013, 143, 438–444. [Google Scholar] [CrossRef]
  5. Arena, U. Process and technological aspects of municipal solid waste gasification. A review. Waste Manag. 2012, 32, 625–639. [Google Scholar] [CrossRef] [PubMed]
  6. Kim, K.J.; Lee, Y.L.; Na, H.S.; Ahn, S.Y.; Shim, J.O.; Jeon, B.H.; Roh, H.S. Efficient Waste to Energy Conversion Based on Co-CeO2 Catalyzed Water-Gas Shift Reaction. Catalysts 2020, 10, 420. [Google Scholar] [CrossRef] [Green Version]
  7. Yoon, B.S.; Kim, K.J.; Cho, E.H.; Park, H.R.; Roh, H.S.; Ko, C.H. Enhanced Fe–Cr dispersion on mesoporous silica support using surfactant-assisted melt-infiltration for the water-gas shift reaction in waste-to-hydrogen processes. Int. J. Hydrogen Energy 2022, Article in press. [Google Scholar] [CrossRef]
  8. Choi, T.Y.; Kim, H.M.; Park, M.J.; Jeong, C.H.; Jeong, D.W. Effect of ZrO2 on the performance of Co–CeO2 catalysts for hydrogen production from waste-derived synthesis gas using high-temperature water gas shift reaction. Int. J. Hydrogen Energy 2022, 47, 14294–14303. [Google Scholar] [CrossRef]
  9. Abdel-Shafy, H.I.; Mansour, M.S.M. Solid waste issue: Sources, composition, disposal, recycling, and valorization. Egypt. J. Pet. 2018, 27, 1275–1290. [Google Scholar] [CrossRef]
  10. Vijayan, D.S.; Parthiban, D. Effect of Solid waste based stabilizing material for strengthening of Expansive soil—A review. Environ. Technol. Innov. 2020, 20, 101108. [Google Scholar] [CrossRef]
  11. Na, H.S.; Jeong, D.W.; Jang, W.J.; Shim, J.O.; Roh, H.S. The effect of preparation method on Fe/Al/Cu oxide-based catalyst performance for high temperature water gas shift reaction using simulated waste-derived synthesis gas. Int. J. Hydrogen Energy 2015, 40, 12268–12274. [Google Scholar] [CrossRef]
  12. Jeong, D.W.; Jang, W.J.; Shim, J.O.; Han, W.B.; Jeon, K.W.; Seo, Y.C.; Roh, H.S.; Gu, J.H.; Lim, Y.T. A comparison study on high-temperature water–gas shift reaction over Fe/Al/Cu and Fe/Al/Ni catalysts using simulated waste-derived synthesis gas. J. Mater. Cycles Waste Manag 2014, 16, 650–656. [Google Scholar] [CrossRef]
  13. Jeong, D.W.; Jha, A.; Jang, W.J.; Han, W.B.; Roh, H.S. Performance of spinel ferrite catalysts integrated with mesoporous Al2O3 in the high temperature water–gas shift reaction. Chem. Eng. J. 2015, 265, 100–109. [Google Scholar] [CrossRef]
  14. Jeong, D.W.; Potdar, H.S.; Roh, H.S. Comparative Study on Nano-Sized 1 wt% Pt/Ce0.8Zr0.2O2 and 1 wt% Pt/Ce0.2Zr0.8O2 Catalysts for a Single Stage Water Gas Shift Reaction. Catal. Lett. 2012, 142, 439–444. [Google Scholar] [CrossRef]
  15. Roh, H.S.; Jeong, D.W.; Kim, K.S.; Eum, I.H.; Koo, K.Y.; Yoon, W.L. Single Stage Water–Gas Shift Reaction Over Supported Pt Catalysts. Catal. Lett. 2011, 141, 95–99. [Google Scholar] [CrossRef]
  16. Newsome, D.S. The Water–Gas Shift Reaction. Catal. Rev. 1980, 21, 275–318. [Google Scholar] [CrossRef]
  17. Hutchings, G.J.; Copperthwaitet, R.G.; Gottschalk, F.M.; Hunter, R.; Mellor, J.; Orchard, S.W.; Sangiorgio, T. A comparative evaluation of cobalt chromium oxide, cobalt manganese oxide, and copper manganese oxide as catalysts for the water–gas shift reaction. J. Catal. 1992, 137, 408–422. [Google Scholar] [CrossRef]
  18. Jeong, D.W.; Potdar, H.S.; Shim, J.O.; Jang, W.J.; Roh, H.S. H2 production from a single stage water–gas shift reaction over Pt/CeO2, Pt/ZrO2, and Pt/Ce(1−x)Zr(x)O2 catalysts. Int. J. Hydrogen Energy 2013, 38, 4502–4507. [Google Scholar] [CrossRef]
  19. Subramanian, V.; Potdar, H.S.; Jeong, D.W.; Shim, J.O.; Jang, W.J.; Roh, H.S.; Jung, U.H.; Yoon, W.L. Synthesis of a Novel Nano-Sized Pt/ZnO Catalyst for Water Gas Shift Reaction in Medium Temperature Application. Catal. Lett. 2012, 142, 1075–1081. [Google Scholar] [CrossRef]
  20. Thomas, J.M.; Thomas, W.J. Principles and Practice of Heterogeneous Catalysis; John Wiley & Sons: Hoboken, NJ, USA, 1997. [Google Scholar]
  21. Jeong, D.W.; Potdar, H.S.; Kim, K.S.; Roh, H.S. The effect of sodium in activity enhancement of nano-sized Pt/CeO2 catalyst for water gas shift reaction at low temperature. Bull. Korean Chem. Soc. 2011, 32, 3557–3558. [Google Scholar] [CrossRef] [Green Version]
  22. Jeong, D.W.; Jang, W.J.; Shim, J.O.; Han, W.B.; Roh, H.S.; Jung, U.H.; Yoon, W.L. Low-temperature water–gas shift reaction over supported Cu catalysts. Renew. Energy 2014, 65, 102–107. [Google Scholar] [CrossRef]
  23. Lee, D.W.; Lee, M.S.; Lee, J.Y.; Kim, S.M.; Eom, H.J.; Moon, D.J.; Lee, K.Y. Hydrogen production by the water-gas shift reaction using CuNi/Fe2O3 catalyst. Catal. Sci. Technol. 2015, 5, 2752. [Google Scholar] [CrossRef]
  24. Jeong, D.W.; Na, H.S.; Shim, J.O.; Jang, W.J.; Roh, H.S.; Jung, U.H.; Yoon, W.L. Hydrogen production from low temperature WGS reaction on co-precipitated Cu–CeO2 catalysts: An optimization of Cu loading. Int. J. Hydrogen Energy 2014, 39, 9135–9142. [Google Scholar] [CrossRef]
  25. Li, L.; Song, L.; Chen, C.; Zhang, Y.; Zhan, Y.; Lin, X.; Zheng, Q.; Wang, H.; Ma, H.; Ding, L.; et al. Modified precipitation processes and optimized copper content of CuO–CeO2 catalysts for water–gas shift reaction. Int. J. Hydrogen Energy 2014, 39, 19570–19582. [Google Scholar] [CrossRef]
  26. Jha, A.; Jeong, D.W.; Jang, W.J.; Lee, Y.L.; Roh, H.S. Hydrogen production from water–gas shift reaction over Ni–Cu–CeO2 oxide catalyst: The effect of preparation methods. Int. J. Hydrogen Energy 2015, 40, 9209–9216. [Google Scholar] [CrossRef]
  27. Shim, J.O.; Na, H.S.; Jha, A.; Jang, W.J.; Jeong, D.W.; Nah, I.W.; Jeon, B.H.; Roh, H.S. Effect of preparation method on the oxygen vacancy concentration of CeO2-promoted Cu/γ-Al2O3 catalysts for HTS reactions. Chem. Eng. J. 2016, 306, 908–915. [Google Scholar] [CrossRef]
  28. Jang, W.J.; Shim, J.O.; Jeon, K.W.; Na, H.S.; Kim, H.M.; Lee, Y.L.; Roh, H.S.; Jeong, D.W. Design and scale-up of a Cr-free Fe-Al-Cu catalyst for hydrogen production from waste-derived synthesis gas. Appl. Catal. B 2019, 249, 72–81. [Google Scholar] [CrossRef]
  29. Grevatt, P.C. Toxicological Review of Hexavalent Chromium. In Summary Information on the Integrated Risk Information System; Environmental Protection Agency: Washington, DC, USA, 1998. [Google Scholar]
  30. Del Rey, I.; Ayuso, J.; Galvín, A.P.; Jiménez, J.R.; López, M.; García-Garrido, M.L. Analysis of chromium and sulphate origins in construction recycled materials based on leaching test results. Waste Manag. 2015, 46, 278–286. [Google Scholar] [CrossRef]
  31. Twigg, M.V. Catalyst Handbook; Wolfe Scientific Books; Routledge: New York, NY, USA, 1989. [Google Scholar] [CrossRef]
  32. Reddy, G.K.; Boolchand, P.; Smirniotis, P.G. Unexpected Behavior of Copper in Modified Ferrites during High Temperature WGS Reaction—Aspects of Fe3+ ↔ Fe2+ Redox Chemistry from Mössbauer and XPS Studies. J. Phys. Chem. C. 2012, 116, 11019–11031. [Google Scholar] [CrossRef]
  33. Martos, C.; Dufour, J.; Ruiz, A. Synthesis of Fe3O4-based catalysts for the high-temperature water gas shift reaction. Int. J. Hydrogen Energy 2009, 34, 4475–4481. [Google Scholar] [CrossRef]
  34. Natesakhawat, S.; Wang, X.; Zhang, L.; Ozkan, U.S. Development of chromium-free iron-based catalysts for high-temperature water-gas shift reaction. J. Mol. Catal. A Chem. 2006, 260, 82–94. [Google Scholar] [CrossRef]
  35. Meshkani, F.; Rezaei, M. Preparation of mesoporous nanocrystalline iron-based catalysts for high temperature water gas shift reaction: Effect of preparation factors. Chem. Eng. J. 2015, 260, 107–116. [Google Scholar] [CrossRef]
  36. Zhu, M.; Rocha, T.C.R.; Lunkenbein, T.; Knop-Gericke, A.; Schlögl, R.; Wachs, I.E. Promotion Mechanisms of Iron Oxide-Based High Temperature Water–Gas Shift Catalysts by Chromium and Copper. ACS Catal. 2016, 6, 4455–4464. [Google Scholar] [CrossRef]
  37. Zhu, M.; Wachs, I.E. Iron-Based Catalysts for the High-Temperature Water–Gas Shift (HT-WGS) Reaction: A Review. ACS Catal. 2016, 6, 722–732. [Google Scholar] [CrossRef]
  38. Keturakis, C.J.; Zhu, M.; Gibson, E.K.; Daturi, M.; Tao, F.; Frenkel, A.I.; Wachs, I.E. Dynamics of CrO3–Fe2O3 Catalysts during the High-Temperature Water-Gas Shift Reaction: Molecular Structures and Reactivity. ACS Catal. 2016, 6, 4786–4798. [Google Scholar] [CrossRef] [Green Version]
  39. Zhu, M.; Yalçın, Ö.; Wachs, I.E. Revealing structure-activity relationships in chromium free high temperature shift catalysts promoted by earth abundant elements. Appl. Catal. B 2018, 232, 205–212. [Google Scholar] [CrossRef]
  40. Sun, Y.; Hla, S.S.; Duffy, G.J.; Cousins, A.J.; French, D.; Morpeth, L.D.; Edwards, J.H.; Roberts, D.G. Effect of Ce on the structural features and catalytic properties of La(0.9−x)CexFeO3 perovskite-like catalysts for the high temperature water–gas shift reaction. Int. J. Hydrogen Energy 2011, 36, 79–86. [Google Scholar] [CrossRef]
  41. Jha, A.; Jeong, D.W.; Lee, Y.L.; Jang, W.J.; Shim, J.O.; Jeon, K.W.; Rode, C.V.; Roh, H.S. Chromium free high temperature water–gas shift catalyst for the production of hydrogen from waste derived synthesis gas. Appl. Catal. A Gen. 2016, 522, 21–31. [Google Scholar] [CrossRef]
  42. Jeong, D.W.; Jang, W.J.; Jha, A.; Han, W.B.; Jeon, K.W.; Kim, S.H.; Roh, H.S. The Effect of Metal on Catalytic Performance over MFe2O4 Catalysts for High Temperature Water-Gas Shift Reaction. J. Nanoelectron. Optoe. 2015, 10, 530–534. [Google Scholar] [CrossRef]
  43. Lang, C.; Sécordel, X.; Kiennemann, A.; Courson, C. Water gas shift catalysts for hydrogen production from biomass steam gasification. Fuel Process. Technol. 2017, 156, 246–252. [Google Scholar] [CrossRef]
  44. Lee, D.W.; Lee, M.S.; Lee, J.Y.; Kim, S.M.; Eom, H.J.; Moon, D.J.; Lee, K.Y. The review of Cr-free Fe-based catalysts for high-temperature water-gas shift reactions. Catal. Today 2013, 210, 2–9. [Google Scholar] [CrossRef]
  45. Park, P.W.; Ledford, J.S. The influence of surface structure on the catalytic activity of cerium promoted copper oxide catalysts on alumina: Oxidation of carbon monoxide and methane. Catal. Lett. 1998, 50, 41–48. [Google Scholar] [CrossRef]
  46. Reina, T.R.; Ivanova, S.; Delgado, J.J.; Ivanov, I.; Idakiev, V.; Tabakova, T.; Centeno, M.A.; Odriozola, J.A. Viability of Au/CeO2–ZnO/Al2O3 Catalysts for Pure Hydrogen Production by the Water–Gas Shift Reaction. ChemCatChem 2014, 6, 1401–1409. [Google Scholar] [CrossRef] [Green Version]
  47. Shiau, C.Y.; Ma, M.W.; Chuang, C.S. CO oxidation over CeO2-promoted Cu/γ-Al2O3 catalyst: Effect of preparation method. Appl. Catal. A Gen 2006, 302, 89–95. [Google Scholar] [CrossRef]
  48. Na, H.S.; Ahn, S.Y.; Lee, Y.L.; Kim, K.J.; Jang, W.J.; Shim, J.O.; Roh, H.S. The role of additives (Ba, Zr, and Nd) on Ce/Cu/Al2O3 catalyst for water-gas shift reaction. Int. J. Hydrogen Energy 2020, 45, 24726–24737. [Google Scholar] [CrossRef]
  49. Liotta, L.F.; Ousmane, M.; Carlo, G.D.; Pantaleo, G.; Deganello, G.; Marcì, G.; Retailleau, L.; Giroir-Fendler, A. Total oxidation of propene at low temperature over Co3O4–CeO2 mixed oxides: Role of surface oxygen vacancies and bulk oxygen mobility in the catalytic activity. Appl. Catal. A Gen. 2008, 347, 81–88. [Google Scholar] [CrossRef] [Green Version]
  50. Lee, Y.L.; Jha, A.; Jang, W.J.; Shim, J.O.; Rode, C.V.; Jeon, B.H.; Bae, J.W.; Roh, H.S. Effect of alkali and alkaline earth metal on Co/CeO2 catalyst for the water-gas shift reaction of waste derived synthesis gas. Appl. Catal. A Gen. 2018, 551, 63–70. [Google Scholar] [CrossRef]
  51. Jha, A.; Jeong, D.W.; Lee, Y.L.; Nah, I.W.; Roh, H.S. Enhancing the catalytic performance of cobalt oxide by doping on ceria in the high temperature water–gas shift reaction. RSC Adv. 2015, 5, 103023–103029. [Google Scholar] [CrossRef]
  52. Jeong, C.H.; Jeon, K.W.; Byeon, H.J.; Choi, T.Y.; Kim, H.M.; Jeong, D.W. Effects of niobium addition on active metal and support in Co–CeO2 catalyst for the high temperature water gas shift reaction. J. Ind. Eng. Chem 2021, 100, 149–158. [Google Scholar] [CrossRef]
  53. Silva, L.P.C.; Terra, L.E.; Coutinho, A.C.S.L.S.; Passos, F.B. Sour water–gas shift reaction over Pt/CeZrO2 catalysts. J. Catal. 2016, 341, 1–12. [Google Scholar] [CrossRef]
  54. Vaezi, M.; Passandideh-Fard, M.; Moghiman, M.; Charmchi, M. Gasification of heavy fuel oils: A thermochemical equilibrium approach. Fuel 2011, 90, 878–885. [Google Scholar] [CrossRef]
  55. Breault, R.W. Gasification Processes Old and New: A Basic Review of the Major Technologies. Energies 2010, 3, 216–240. [Google Scholar] [CrossRef] [Green Version]
  56. Bhadra, B.N.; Jhung, S.H. Oxidative desulfurization and denitrogenation of fuels using metal-organic framework-based/-derived catalysts. Appl. Catal. B 2019, 259, 118021. [Google Scholar] [CrossRef]
  57. Lee, Y.L.; Kim, K.J.; Hong, G.R.; Ahn, S.Y.; Kim, B.J.; Park, H.R.; Yun, S.J.; Bae, J.W.; Jeon, B.H.; Roh, H.S. Sulfur-Tolerant Pt/CeO2 Catalyst with Enhanced Oxygen Storage Capacity by Controlling the Pt Content for the Waste-to-Hydrogen Processes. ACS Sustain. Chem. Eng. 2021, 9, 15287–15293. [Google Scholar] [CrossRef]
  58. Hulteberg, C. Sulphur-tolerant catalysts in small-scale hydrogen production, a review. Int. J. Hydrogen Energy 2012, 37, 3978–3992. [Google Scholar] [CrossRef]
  59. Lee, Y.L.; Kim, K.J.; Hong, G.R.; Ahn, S.Y.; Kim, B.J.; Shim, J.O.; Roh, H.S. Highly sulfur tolerant and regenerable Pt/CeO2 catalyst for waste to energy. Renew. Energy 2021, 178, 334–343. [Google Scholar] [CrossRef]
  60. Hiller, H.; Reimert, R.; Stönner, H.M. Gas Production, 1. Introduction. In Ullmann’s Encyclopedia of Industrial Chemistry; Wiley: Hoboken, NJ, USA, 2011. [Google Scholar] [CrossRef]
  61. Tamaru, K. The History of the Development of Ammonia Synthesis. In Catalytic Ammonia Synthesis; Springer: New York, NY, USA, 1991; pp. 1–18. [Google Scholar] [CrossRef]
  62. Ambrosi, A.; Denmark, S.E. Harnessing the Power of the Water-Gas Shift Reaction for Organic Synthesis. Angew. Chem. Int. Ed. 2016, 55, 12164–12189. [Google Scholar] [CrossRef]
  63. Smith, C.; Hill, A.K.; Torrente-Murciano, L. Current and future role of Haber–Bosch ammonia in a carbon-free energy landscape. Energy Environ. Sci. 2020, 13, 331–344. [Google Scholar] [CrossRef]
  64. Ebrahimi, P.; Kumar, A.; Khraisheh, M. A review of recent advances in water-gas shift catalysis for hydrogen production. Emergent. Mater. 2020, 3, 881–917. [Google Scholar] [CrossRef]
  65. Gradisher, L.; Dutcher, B.; Fan, M. Catalytic hydrogen production from fossil fuels via the water gas shift reaction. Appl. Energy 2015, 139, 335–349. [Google Scholar] [CrossRef]
  66. Boretti, A.; Banik, B.K. Advances in Hydrogen Production from Natural Gas Reforming. Adv. Energy. Sustain. Res. 2021, 2, 2100097. [Google Scholar] [CrossRef]
  67. Turner, J.A. Sustainable Hydrogen Production. Science 2004, 305, 972–974. [Google Scholar] [CrossRef] [PubMed]
  68. Franchi, G.; Capocelli, M.; De Falco, M.; Piemonte, V.; Barba, D. Hydrogen Production via Steam Reforming: A Critical Analysis of MR and RMM Technologies. Membranes 2020, 10, 10. [Google Scholar] [CrossRef] [Green Version]
  69. Ertl, G.; Knözinger, H.; Weitkamp, J. Handbook of Heterogeneous Catalysis; Wiley VCH: Weinheim, Germany, 1997. [Google Scholar]
  70. Subramanian, V.; Jeong, D.W.; Han, W.B.; Jang, W.J.; Shim, J.O.; Roh, H.S. H2 production from high temperature shift of the simulated waste derived synthesis gas over magnetite catalysts prepared by citric acid assisted direct synthesis method. Int. J. Hydrogen Energy 2013, 38, 8699–8703. [Google Scholar] [CrossRef]
  71. Ariëns, M.I.; Chlan, V.; Novák, P.; van de Water, L.G.A.; Dugulan, A.I.; Brück, E.; Hensen, E.J.M. The role of chromium in iron-based high-temperature water-gas shift catalysts under industrial conditions. Appl. Catal. B 2021, 297, 120465. [Google Scholar] [CrossRef]
  72. Mendes, D.; Mendes, A.; Madeira, L.M.; Iulianelli, A.; Sousa, J.M.; Basile, A. The water-gas shift reaction: From conventional catalytic systems to Pd-based membrane reactors—A review. Asia-Pac. J. Chem. Eng. 2009, 5, 111–137. [Google Scholar] [CrossRef]
  73. Li, J.L.; Inui, T. Characterization of precursors of methanol synthesis catalysts, copper/zinc/aluminum oxides, precipitated at different pHs and temperatures. Appl. Catal. A Gen. 1996, 137, 105–117. [Google Scholar] [CrossRef]
  74. Shim, J.O.; Na, H.S.; Ahn, S.Y.; Jeon, K.W.; Jang, W.J.; Jeon, B.H.; Roh, H.S. An important parameter for synthesis of Al2O3 supported Cu-Zn catalysts in low-temperature water-gas shift reaction under practical reaction condition. Int. J. Hydrogen Energy 2019, 44, 14853–14860. [Google Scholar] [CrossRef]
  75. Kondrat, S.A.; Smith, P.J.; Lu, L.; Bartley, J.K.; Taylor, S.H.; Spencer, M.S.; Kelly, G.J.; Park, C.W.; Kiely, C.J.; Hutchings, G.J. Preparation of a highly active ternary Cu-Zn-Al oxide methanol synthesis catalyst by supercritical CO2 anti-solvent precipitation. Catal. Today 2013, 317, 12–20. [Google Scholar] [CrossRef]
  76. Smith RJ, B.; Loganathan, M.; Shantha, M.S. A Review of the Water Gas Shift Reaction Kinetics. Int. J. Chem. React. Eng. 2010, 8. [Google Scholar] [CrossRef]
  77. Etim, U.J.; Song, Y.; Zhong, Z. Improving the Cu/ZnO-Based Catalysts for Carbon Dioxide Hydrogenation to Methanol, and the Use of Methanol as a Renewable Energy Storage Media. Front. Energy Res. 2020, 8, 545431. [Google Scholar] [CrossRef]
  78. Lucarelli, C.; Molinari, C.; Faure, R.; Fornasari, G.; Gary, D.; Schiaroli, N.; Vaccari, A. Novel Cu-Zn-Al catalysts obtained from hydrotalcite-type precursors for middle-temperature water-gas shift applications. Appl. Clay Sci. 2018, 155, 103–110. [Google Scholar] [CrossRef]
  79. Houston, R.; Labbé, N.; Hayes, D.; Daw, C.S.; Abdoulmoumine, N. Intermediate Temperature Water-Gas Shift Kinetics for Hydrogen Production. React. Chem. Eng. 2019, 4, 1814–1822. [Google Scholar] [CrossRef]
  80. Kalamaras, C.M.; Gonzalez, I.D.; Navarro, R.M.; Fierro, J.L.G.; Efstathiou, A.M. Effects of Reaction Temperature and Support Composition on the Mechanism of Water–Gas Shift Reaction over Supported-Pt Catalysts. J. Phys. Chem. C 2011, 115, 11595–11610. [Google Scholar] [CrossRef]
  81. Mierczynski, P.; Maniukiewicz, W.; Maniecki, T.P. Comparative studies of Pd, Ru, Ni, Cu/ZnAl2O4 catalysts for the water gas shift reaction. Cent. Eur. J. Chem. 2013, 11, 912–919. [Google Scholar] [CrossRef]
  82. Alptekin, F.M.; Celiktas, M.S. Review on Catalytic Biomass Gasification for Hydrogen Production as a Sustainable Energy Form and Social, Technological, Economic, Environmental, and Political Analysis of Catalysts. ACS Omega 2022, 7, 24918–24941. [Google Scholar] [CrossRef] [PubMed]
  83. Bukur, D.B.; Todic, B.; Elbashir, N. Role of water-gas-shift reaction in Fischer–Tropsch synthesis on iron catalysts: A review. Catal. Today 2016, 275, 66–75. [Google Scholar] [CrossRef] [Green Version]
  84. Eloffy, M.G.; Elgarahy, A.M.; Saber, A.N.; Hammad, A.; El-Sherif, D.M.; Shehata, M.; Mohsen, A.; Elwakeel, K.Z. Biomass-to-sustainable biohydrogen: Insights into the production routes, and technical challenges. Chem. Eng. J. Adv. 2022, 12, 100410. [Google Scholar] [CrossRef]
  85. Shin, J.E. Hydrogen Technology Development and Policy Status by Value Chain in South Korea. Energies 2022, 15, 8983. [Google Scholar] [CrossRef]
  86. Lee, D.; Kim, K. Research and Development Investment and Collaboration Framework for the Hydrogen Economy in South Korea. Sustainability 2021, 13, 10686. [Google Scholar] [CrossRef]
  87. Byeon, H.J.; Jeon, K.W.; Kim, H.M.; Lee, Y.H.; Heo, Y.S.; Park, M.J.; Jeong, D.W. Promotion of methanation suppression by alkali and alkaline earth metals in Ni-CeO2 catalysts for water–gas shift reaction using waste-derived synthesis gas. Fuel Process. Technol. 2022, 231, 107229. [Google Scholar] [CrossRef]
  88. Lee, Y.L.; Kim, H.Y.; Kim, K.J.; Hong, G.R.; Shim, J.O.; Ju, Y.W.; Roh, H.S. Nanofiber structured oxygen defective CoFe2O4-x catalyst for the water-gas shift reaction in waste-to-hydrogen processes. Int. J. Hydrogen Energy 2022, 47, 30950–30958. [Google Scholar] [CrossRef]
  89. Jeon, K.W.; Byeon, H.J.; Kim, H.M.; Choe, B.; Jeong, C.H.; Choi, T.Y.; Won, W.; Jeong, D.W. Development of Co–Nb–CeO2 Catalyst for Hydrogen Production from Waste-Derived Synthesis Gas Using Techno-Economic and Environmental Assessment. ACS Sustain. Chem. Eng. 2022, 10, 6289–6303. [Google Scholar] [CrossRef]
  90. Ahn, S.Y.; Kim, K.J.; Kim, B.J.; Shim, J.O.; Jang, W.J.; Roh, H.S. Unravelling the active sites and structure-activity relationship on Cu–ZnO–Al2O3 based catalysts for water-gas shift reaction. Appl. Catal. B Environ. 2023, 325, 122320. [Google Scholar] [CrossRef]
  91. Ahn, S.Y.; Jang, W.J.; Shim, J.O.; Jeon, B.H.; Roh, H.S. CeO2-based oxygen storage capacity materials in environmental and energy catalysis for carbon neutrality: Extended application and key catalytic properties. Catal. Rev. 2023, 1–84. [Google Scholar] [CrossRef]
  92. Lee, Y.L.; Kim, K.J.; Hong, G.R.; Roh, H.S. Target-oriented water–gas shift reactions with customized reaction conditions and catalysts. Chem. Eng. J. 2023, 458, 141422. [Google Scholar] [CrossRef]
  93. Valizadeh, S.; Hakimian, H.; Farooq, A.; Jeon, B.H.; Chen, W.H.; Lee, S.H.; Jung, S.C.; Seo, M.W.; Park, Y.K. Valorization of biomass through gasification for green hydrogen generation: A comprehensive review. Bioresour. Technol. 2022, 365, 128143. [Google Scholar] [CrossRef] [PubMed]
  94. Valizadeh, S.; Jang, S.H.; Rhee, G.H.; Lee, J.; Show, P.L.; Khan, M.A.; Jeon, B.H.; Lin, K.Y.A.; Ko, C.H.; Chen, W.H.; et al. Biohydrogen production from furniture waste via catalytic gasification in air over Ni-loaded Ultra-stable Y-type zeolite. Chem. Eng. J. 2022, 433, 133793. [Google Scholar] [CrossRef]
Figure 1. TEM images and SAED patterns of fresh FAC-PC-3, FAC-PC-3-240, and Fe-Al catalysts: (a,b) FAC-PC-3, (c,d) FAC-PC-3-240, (e,f) SAED Fe-Al. Adapted from Ref. [28]. Copyright 2019 Elsevier.
Catalysts 13 00710 g001
Figure 2. XPS spectra of the fresh FAC catalysts prepared by different methods. (a) Fe 2p; (b) Cu 2p. Adapted from Ref. [11]. Copyright 2015 Elsevier.
Catalysts 13 00710 g002
Figure 3. CO conversion of Fe-based catalysts.
Catalysts 13 00710 g003
Figure 4. CO conversion of Cu-based catalysts.
Catalysts 13 00710 g004
Figure 5. Raman spectra of the Cu-based catalysts: (a) Cu/γ–Al2O3 catalyst and CeO2–promoted Cu/γ–Al2O3 catalysts. Adapted from Ref. [27]. Copyright 2016 Elsevier. (b) Ce/Cu/Al2O3 catalysts with various additives. Adapted from Ref. [48]. Copyright 2020 Elsevier.
Catalysts 13 00710 g005
Figure 6. (A) XRD patterns of Ni-based catalysts; (B) H2-TPR of Ni-based catalysts; (C) CO2-TPD patterns of Ni-based catalysts; (D) CO conversion of Ni-based catalysts. (E) Selectivity to CH4 and CO2 of Ni-based catalysts; (F) H2 yield of Ni-based catalysts. Adapted from Ref. [87]. Copyright 2022 Elsevier.
Catalysts 13 00710 g006
Figure 7. CO conversion of Ni-based catalysts.
Catalysts 13 00710 g007
Figure 8. CO conversion of Co-based catalysts.
Catalysts 13 00710 g008
Figure 9. CO conversion of Pt-based Catalysts.
Catalysts 13 00710 g009
Table 1. Composition of gaseous mixture used in HT-WGS reaction.
CatalystCO (vol%)CO2 (vol%)CH4 (vol%)H2 (vol%)N2 (vol%)H2O (vol%)Ref.
Fe-based38.221.52.329.28.8-[11,12,28]
17.029.551.0313.144.0655.20[13]
37.9921.322.3029.339.06-[13]
Cu-based38.021.32.329.39.1-[26,27]
37.9921.282.3129.349.08-[48]
Co-based38.221.52.329.28.8-[1]
17.029.551.0313.144.0655.20[6,8,53]
37.9921.322.3029.339.06-[6,8,53]
39.7021.502.3527.059.40-[88]
37.8721.472.3029.319.05-[89]
Pt-based37.9921.282.3129.349.08-[59]
39.7021.502.3527.059.40-[57]
Ni-based37.8721.472.3029.319.05-[87]
Table 2. Characteristics of Fe-based catalysts.
CatalystBET Surface Area (m2/g) aCrystallite Size (nm) bRef.
FreshUsedFresh (Fe2O3)Used (Fe3O4)
Fe/Al56.612.518.424.4[12]
Fe/Al/Cu73.020.317.317.9[12]
Fe/Al/Ni81.411.214.920.6[12]
FAC-CP165.132.6N.A. c18.1[11]
FAC-SG104.920.1-23.0[11]
FAC-IM73.015.517.327.4[11]
FAC-PC-1
(Cu dispersion: 5.9%)
168--13.4[28]
FAC-PC-3
(Cu dispersion: 5.7%)
165--13.7[28]
FAC-PC-5
(Cu dispersion: 4.7%)
132--16.6[28]
FAC-PC-10
(Cu dispersion: 2.8%)
60--22.3[28]
FAC-PC-3-240
(Cu dispersion: 5.6%)
166--15.9[28]
a Estimated from the N2 adsorption isotherm at −196 °C. b Calculated from (2 0 0) peak of metallic Cu using the Scherrer equation. c Not available due to very broad and weak XRD peaks.
Table 3. Reduction characteristics of Fe-based catalysts.
CatalystCuO to Cu0 (°C)Fe2O3 to Fe3O4 (°C)Fe3O4 to FeO (°C)Ref.
Fe/Al-381580[12]
Fe/Al/Cu178325660
Fe/Al/Ni-380580 (560 Ni)
FAC-CP154177600~700[11]
FAC-SG166203600~700
FAC-IM178325660
Bare Fe-405700[28]
FAC-PC-1126155-[28]
FAC-PC-3127159-
FAC-PC-5153185-
FAC-PC-10205253-
FAC-PC-3-240128158-
Table 4. Characteristics of Fe3O4-MA and MFe2O4-MA (M=Cu, Ni, Co) and CuxFe(3-x)O4-MA (x = 0.5, 1.0, 1.5, 2.0, 2.5) catalysts.
CatalystBET Surface Area (m2/g)Crystallite Size
(nm)
Crystallite Size of Metallic Cu (nm) b
FreshUsedFresh aUsed a
CuFe2O4-MA1631107.8--
NiFe2O4-MA2121077.5--
CoFe2O4-MA188593.7--
Fe3O4-MA1769110.6--
CFMA-5176828.012.6N.A. c
CFMA-101631107.812.318.2
CFMA-1597729.412.219.1
CFMA-20424111.313.823.7
CFMA-25362317.319.626.1
a Calculated from (3 1 1) peak of spinel ferrite using the Scherrer equation. b Calculated from (2 0 0) peak of metallic Cu using the Scherrer equation. c Not available due to very broad and weak XRD peaks.
Table 5. Characteristics of Cu-based catalysts.
CatalystBET Surface Area
(m2/g) a
Cu Surface Area
(m2/g) b
Crystallite Size (nm)Lattice ParameterCu Dispersion (%) bRef.
Fresh aUsed aCu bCuO cCeO2 c
CeO281-9----5.45-[26]
NCC-SG102-56---5.43-[26]
NCC-CP96-88---5.39-[26]
NCC-ST79-1011---5.41-[26]
NCC-IM14-1313---5.34-[26]
CuA163.42.5--34.4---2.9[27]
CeCuA124.52.2--50.727.49.6-1.7[27,48]
Cu-CeA 114.02.0--56.3---1.5[27]
CuCeA116.11.5--75.4---1.2[27]
CBCA114.0----28.29.8-1.7[48]
CZCA111.9----29.410.2-1.5[48]
CNCA122.0----30.29.9-1.4[48]
a Estimated from N2 adsorption isotherm at −196 °C. b Estimated from N2O chemisorption. c Calculated from XRPD.
Table 6. Reduction Temperature of Cu-based catalysts.
CatalystCuO Species Interacted with CeO2 (°C)CuO Species Not Interacted with CeO2 (°C)Bulk CuO (°C)Ref.
NCC-SG169257-[26]
NCC-CP187--
NCC-ST165200265
NCC-IM182261302
CuA--197[27]
CeCuA136158183
Cu-CeA141-177
CuCeA--188
CBCA170186215[48]
CZCA134163203
CNCA114143180
Table 7. Characteristics of Ni-based catalysts.
CatalystBET Surface Area (m2/g) aCrystallite Size
(nm)
Ni0 Dispersion c (%)Active Ni Site c (mol/gcat)Ref.
FreshUsedFresh b (Fe2O3)Used b (Fe3O4)Ni0 c
Fe/Al/Ni81.411.214.920.6---[12]
Ni-CeO2131.29---21.034.001.37 × 10−6[87]
K/Ni-CeO2110.34---26.713.161.08 × 10−6[87]
Ca/Ni-CeO2112.45---25.613.281.13 × 10−6[87]
Mg/Ni-CeO2109.85---61.131.393.16 × 10−6[87]
Ba/Ni-CeO2118.83---26.333.201.14 × 10−6[87]
a Estimated from N2 adsorption isotherm at −196 °C. b Calculated from XRD. c Estimated from the H2 chemisorption.
Table 8. Characteristics of Co-based catalysts.
CatalystsBET Surface Area (m2/g) aCo0 Crystallite Size (nm) bLattice Parameter (A) bCo Dispersion (%) cCo0/
(Co0 + Co2+
+ Co3+) (%) d
Ref.
BCC-160N.A. a-0.6349.8[1]
CC-SG30--1.61-[6]
1.5NbCo1144.75.4303.4726[53]
CZ6C4186.88.75.3801.9642.3[8]
CoFe2O4-ES5.835.3--34.4[88]
CNC-CP115.39-5.4283.4150.80[89]
a Estimated from N2 adsorption isotherm at −196 °C. b Calculated from XRD. c Estimated from the CO chemisorption results. d Estimated from the CO 2p XPS profiles.
Table 9. Reduction characteristics of Co-based catalysts.
CatalystCo3O4 to CoO (°C)CoO to Co0 (°C)Surface Oxygen Species of CeO2 (°C)Ref.
BCC-0327376-[1]
BCC-1264333-
BCC-2285354-
BCC-3299390-
CC-SG224414-[6]
CC-IWI327377-
CC-CP295367-
CC-HT211262-
CZ2C8335430-[8]
CZ4C6326411-
CZ6C4335420-
CZ8C2326411-
C-Z308353-
C-C320414573
0.5NbCo304414532[53]
1.5NbCo304414532
2.5NbCo304414532
CNC-CP304414532[89]
CNC-IWI333385424
CNC-SG302354491
CNC-HT322436768
Table 10. Reduction characteristics of CoFe2O4 catalysts.
CatalystFe2O3 to Fe3O4 (°C)Ref.
CoFe2O4-ES351[88]
CoFe2O4-SG558
CoFe2O4-HT598
CoFe2O4-CP544
Table 11. Characteristics of Pt-based Catalysts.
CatalystsBET Surface Area (m2/g)Pt0 Dispersion (%)OSC
(10−4 gmol/gcat)
Ref.
Pt/CeO27776.296.66[59]
Pt/ZrO228459.142.04[59]
Pt/MgO16776.180.86[59]
Pt/Al2O320261.101.87[59]
CeO2105-3.93[57]
0.1 wt% Pt/CeO26294.16.30[57]
0.5 wt% Pt/CeO26681.36.46[57]
2.0 wt% Pt/CeO27776.36.66[57]
5.0 wt% Pt/CeO27338.16.34[57]
10.0 wt% Pt/CeO25610.55.27[57]
Table 12. Reduction characteristics of Pt-based Catalysts.
CatalystPtOx to Pt0 (°C)Bulk CeO2 (°C)Ref.
Pt/CeO275-[60]
Pt/ZrO2426-
Pt/MgO261-
Pt/Al2O380-
CeO2-774[57]
0.1% Pt/CeO2238758
0.5% Pt/CeO2129758
2.0% Pt/CeO275532
5.0% Pt/CeO2120752
10.0% Pt/CeO2155752
Disclaimer/Publisher’s Note: The statements, opinions and data contained in all publications are solely those of the individual author(s) and contributor(s) and not of MDPI and/or the editor(s). MDPI and/or the editor(s) disclaim responsibility for any injury to people or property resulting from any ideas, methods, instructions or products referred to in the content.

