Article

Water-Based Photocatalytic Sol–Gel TiO2 Coatings: Synthesis and Durability

Department of Chemistry, Materials and Chemical Engineering “Giulio Natta”, Politecnico di Milano, Via Mancinelli 7, 20131 Milan, Italy
*
Author to whom correspondence should be addressed.
Catalysts 2023, 13(3), 494; https://doi.org/10.3390/catal13030494
Submission received: 18 January 2023 / Revised: 21 February 2023 / Accepted: 23 February 2023 / Published: 28 February 2023
(This article belongs to the Special Issue 10th Anniversary of Catalysts—Feature Papers in Photocatalysis)

Abstract

:
The environmental impact of industrial technologies and related remediation methods are major research trend lines. Unfortunately, in the development of materials for wastewater treatment or air purification, hazardous reactants are often employed, reducing the overall beneficial contribution of such technology on the environment. We here synthesize stable titanium dioxide (TiO2) sols using a green route, with titanium tetraisopropoxide (TTIP) as precursor, water as solvent and acetic acid acting as catalyst, chelating agent and peptizing agent. The sol was deposited on glass by dip-coating and then analyzed using XRD, SEM and spectrophotometry. Wastewater purification ability was evaluated in the photocatalytic degradation of two organic dyes (Rhodamine B and Methylene Blue). Results on RhB showed > 85% degradation in 6 h maintained along a series of 7 tests, confirming good efficiency and reusability, and 100% in 3 h on MB; efficiency mostly depended on calcination temperature and layer thickness. High photodegradation efficiency was found in nonannealed samples, suggesting TiO2 nanoparticles crystallization during sol–gel production. Yet, such samples showed a gradual decrease in photoactivity in repeated tests, probably due to a partial release of TiO2 particles in solution, while on calcined samples a good adhesion was obtained, leading to a more durable photoactive layer.

1. Introduction

Environmental pollution represents one of the most serious concerns for modern society. Contamination of water, soil and air caused by the progressive development of the industrial society has strong repercussions on the entire ecosystem. Particularly, many organic compounds are considered hazardous due to their adverse effects, such as toxicity of dyes released in waters by industrial activities on aquatic fauna and possible carcinogenicity of several volatile organic compounds (VOCs). For this reason, these compounds should be degraded or removed before their discharge into the environment [1,2,3,4].
Several methods for organic compounds abatement have been developed, such as membrane filtration, adsorption, centrifugation, gravitational separation, and flocculation. Nevertheless, these traditional remediation techniques frequently generate harmful byproducts, which require further treatments, and proved to be inadequate for some chemical compounds, such as aromatic hydrocarbons [5,6,7,8].
Therefore, many research efforts have been made to improve the abatement of these hazardous organic pollutants through new sustainable and eco-friendly approaches, and advanced oxidation processes (AOPs) have been widely studied for this aim. In particular, heterogeneous titanium dioxide (TiO2) photocatalysis has emerged as a promising technique since it is more efficient and economic with respect to traditional methods, and it can result in a complete mineralization of organic molecules to CO2, H2O and salts under solar or artificial light illumination by operating under ambient temperature and pressure conditions [9,10,11,12,13].
In order to obtain the immobilization of TiO2 on different substrate to get photocatalytic coatings and to eliminate issues of powder slurries, particularly photocatalyst recovery and agglomeration, several deposition techniques are used, including physical vapor deposition (PVD), chemical vapor deposition (CVD) and hydrothermal synthesis [14,15]. Among various production methods, sol–gel is one of the most popular techniques used to produce both TiO2 thin films and nanoparticles, since it offers low temperature and ambient pressure processing, easy coverage of large surfaces, relatively low cost, and the possibility to control the physicochemical properties of nanostructures [13,16]. Yet, most of the research often neglects the effects reagents such as organic solvents (ethanol, propanol, etc.) or surfactants on the environment. Furthermore, the exposure to strong acids (hydrochloric acid, nitric acid or sulfuric acid) as well as other harmful chemicals such as acetylacetone, propylene oxide, dimethylacetamide or ethanolamine represents a risk for both human health and for the environment [17,18,19,20,21].
Nevertheless, sol formulation is what most affects the production of TiO2 and its photocatalytic activity. Among all, the most influencing parameters are those that allow to control the rate of hydrolysis and condensation, specifically, concentrations and types of both precursor and solvent, water content, solution pH and type and concentration of additives (catalysts, chelating agents, peptizing agents, surfactants). The management of these parameters allows to manipulate the sol–gel process stages, thus influencing TiO2 content in the film, morphology, particle size distribution and crystallinity [16]. The following considerations try to tackle the aspects related to sol components with a specific focus on green formulations.
As precursors, metal alkoxides are often employed since these chemicals, although quite expensive, are not hazardous or toxic. Among them, titanium (IV) isopropoxide (TTIP) is particularly used due to its relatively low hydrolysis ratio in low-molecular weight organic solvents, allowing to produce stable TiO2 colloidal solutions [22,23].
When working with water instead of organic solvents, which is crucial to reduce the environmental impact of sol–gel, the formation of TiO2 nanoparticles proceeds so rapidly that precipitates of titanium oxide are formed in a short time. In order to better control the strong reactivity of titanium alkoxides with water, and so reaction rates, catalysts are added, such as nitric acid, hydrochloric acid and acetic acid. In fact, in acid conditions the hydrolysis reaction is favored by the protonation of hydroxyl groups, leading to the simultaneous formation of positively charged monomers or small oligomers; repulsive forces among charged cluster reduce aggregation, thus delaying condensation and precipitation [14,16,24,25].
Even though the addition of the catalyst avoids the formation of precipitates, the key to preparing stable TiO2 sols is to decrease the hydrolysis rate of alkoxides. Chelating agents such as acetylacetone, carboxylic acids or other ligands have been demonstrated to effectively reduce the hydrolysis rate thanks to the generation of stable complexes [26]. In particular, acetic acid shows numerous advantages since it acts as both catalyst and chelating agent. Being an acid, it favors the rapid formation of titanium hydroxide, thus suppressing the growth of oligomeric titanium dioxide and so leading to small-size TiO2 nanoparticles. On the other hand, it reduces hydrolysis rate by acting as a modifier of the alkoxides molecular structure, as acetate ligands partially substitute -OR groups, which sterically hinder hydrolysis and increase gelation time [27,28,29].
To date, few research works have been performed relying on a green chemistry approach, i.e., using nontoxic, harmless chemicals to reduce the hazard of products and wastes and so the impact of sols production on human and environment [30].
In the present work, nanostructured TiO2 coatings were prepared via a green sol–gel route by the hydrolysis and condensation of TTIP in water, with a new formulation using acetic acid as both catalyst and chelating agent, thus avoiding the use of organic solvents or any carcinogenic or hazardous reactants, in contrast with common formulations where organic solvents are considered vital.
The so-obtained solvent-free stable sol was used to deposit TiO2 thin films by dip-coating on glass supports. The photocatalytic activity of the so obtained coatings was evaluated in the photocatalytic degradation of two model pollutants in water (Rhodamine B and Methylene Blue). Durability, stability and reusability of the photocatalytic coatings were also evaluated.

2. Results and Discussion

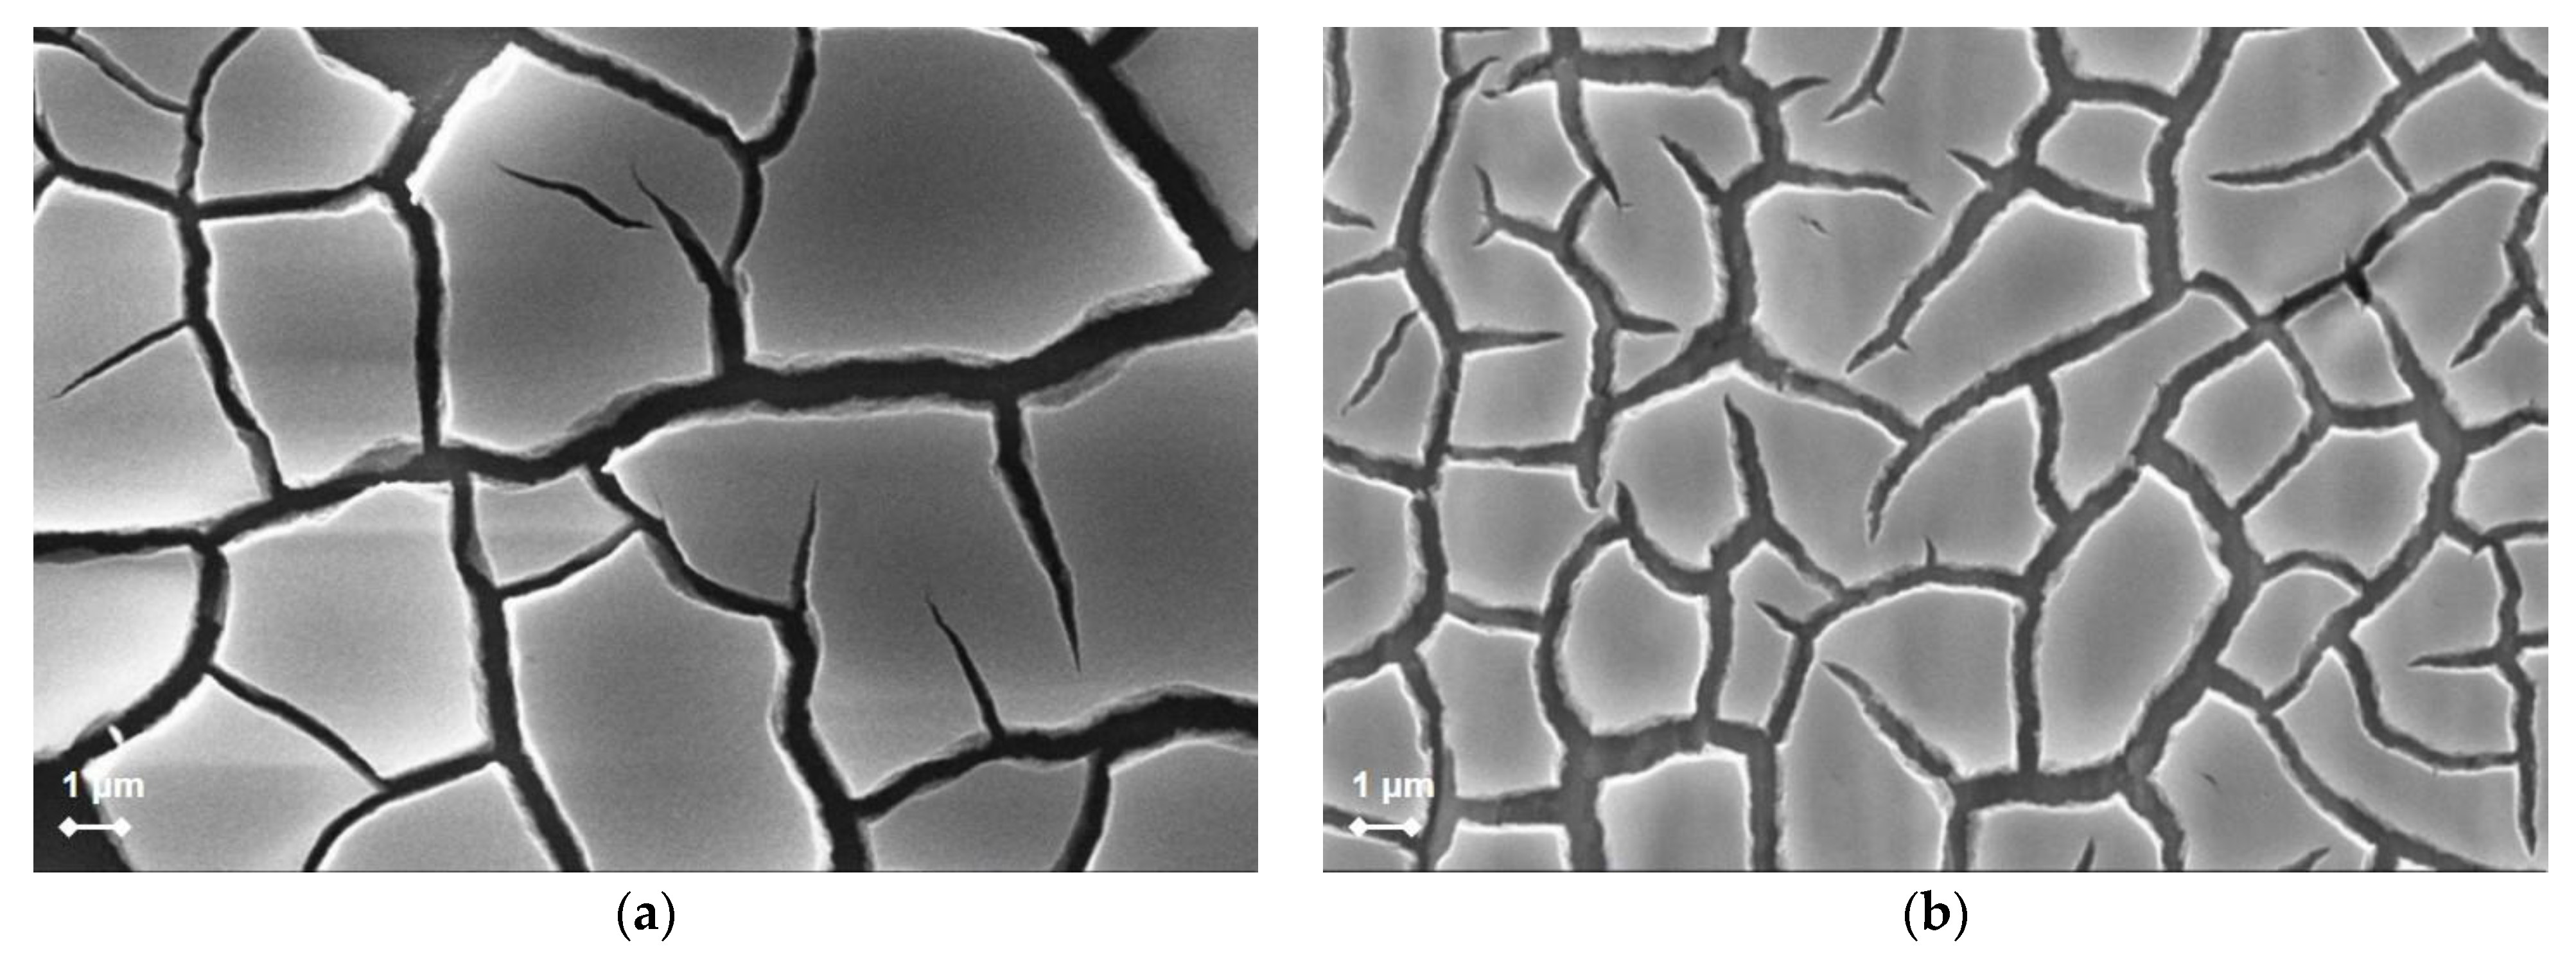
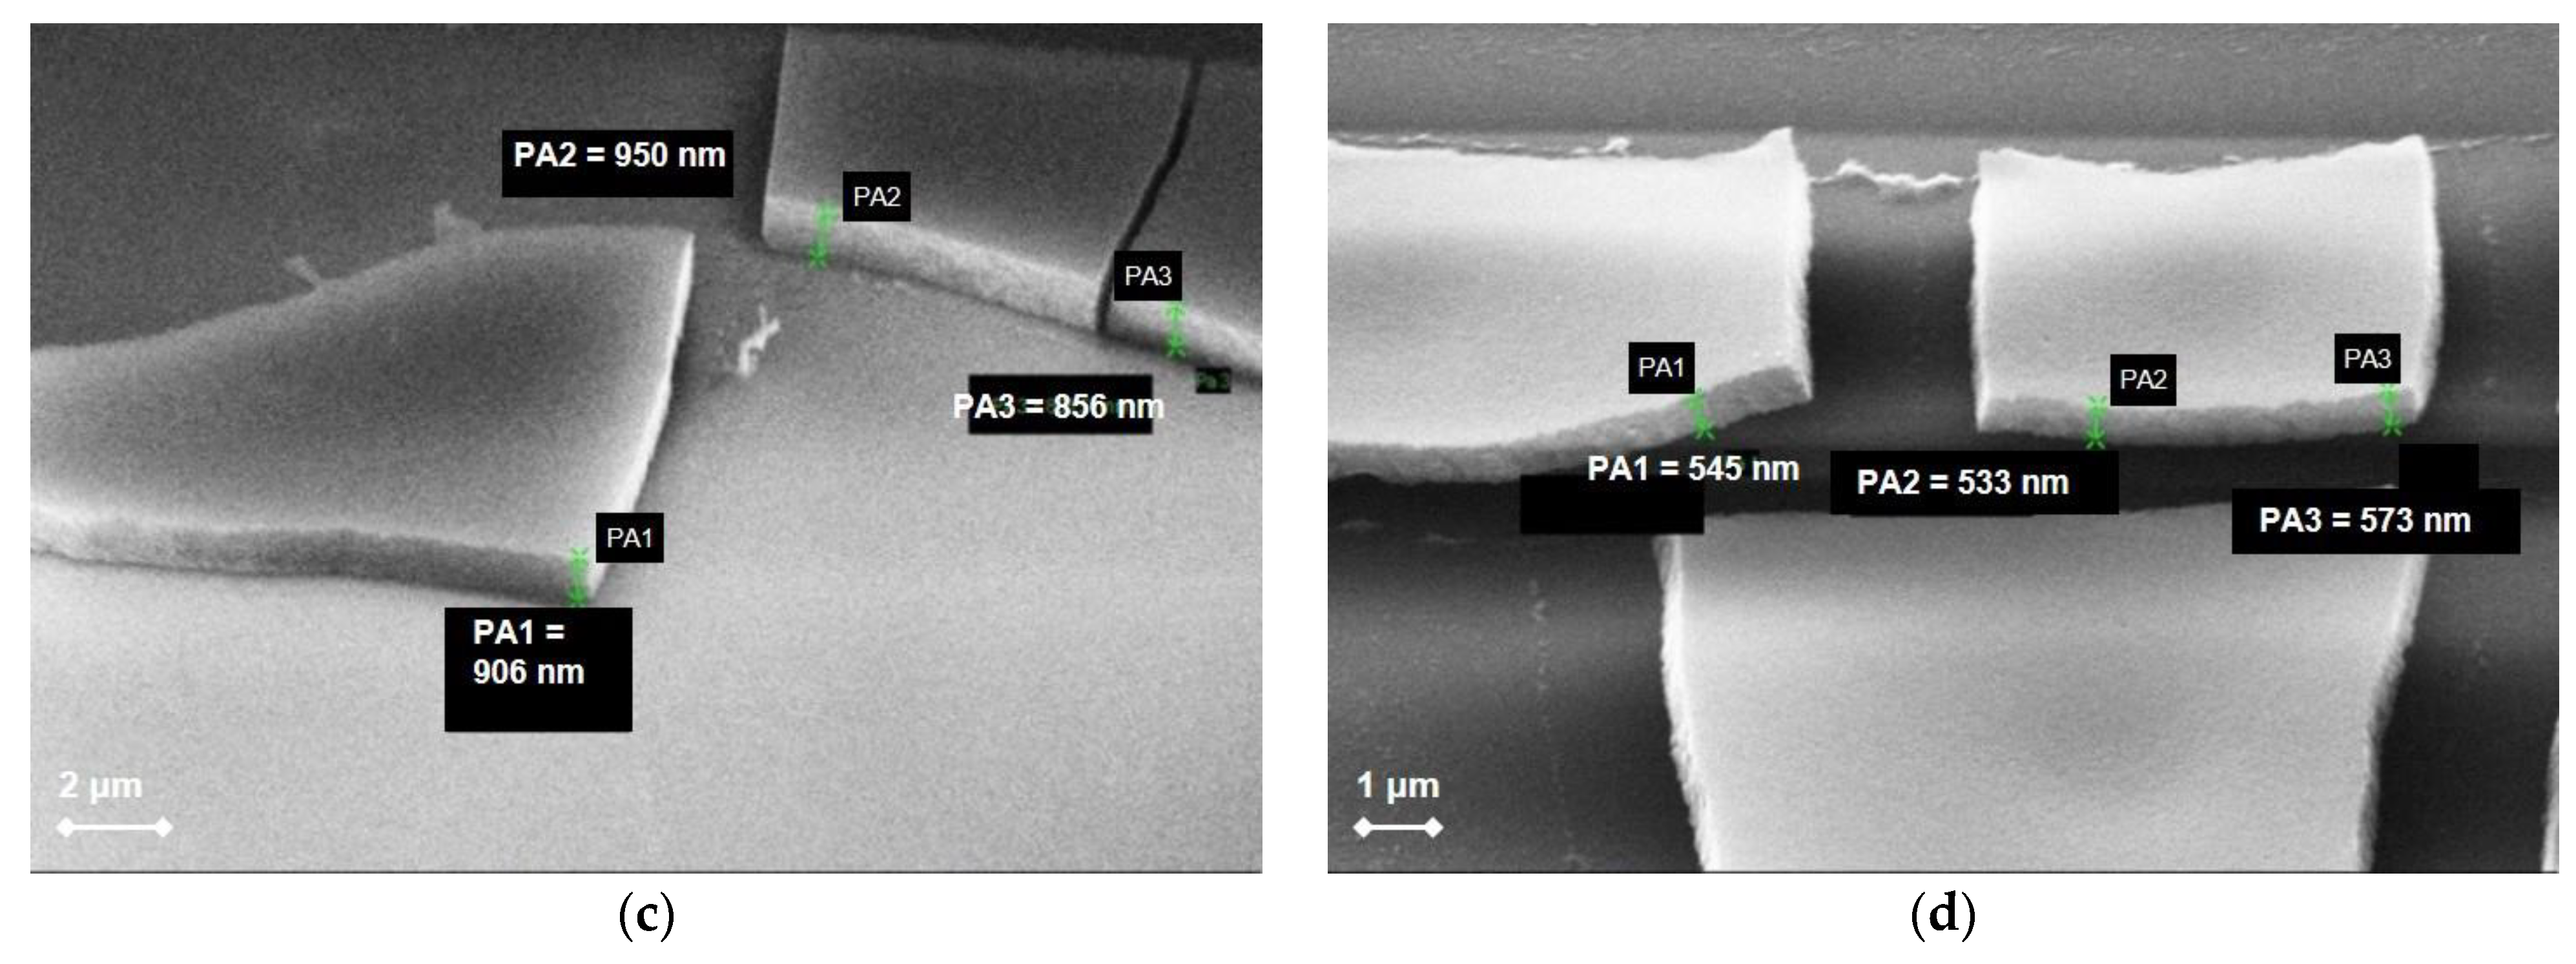
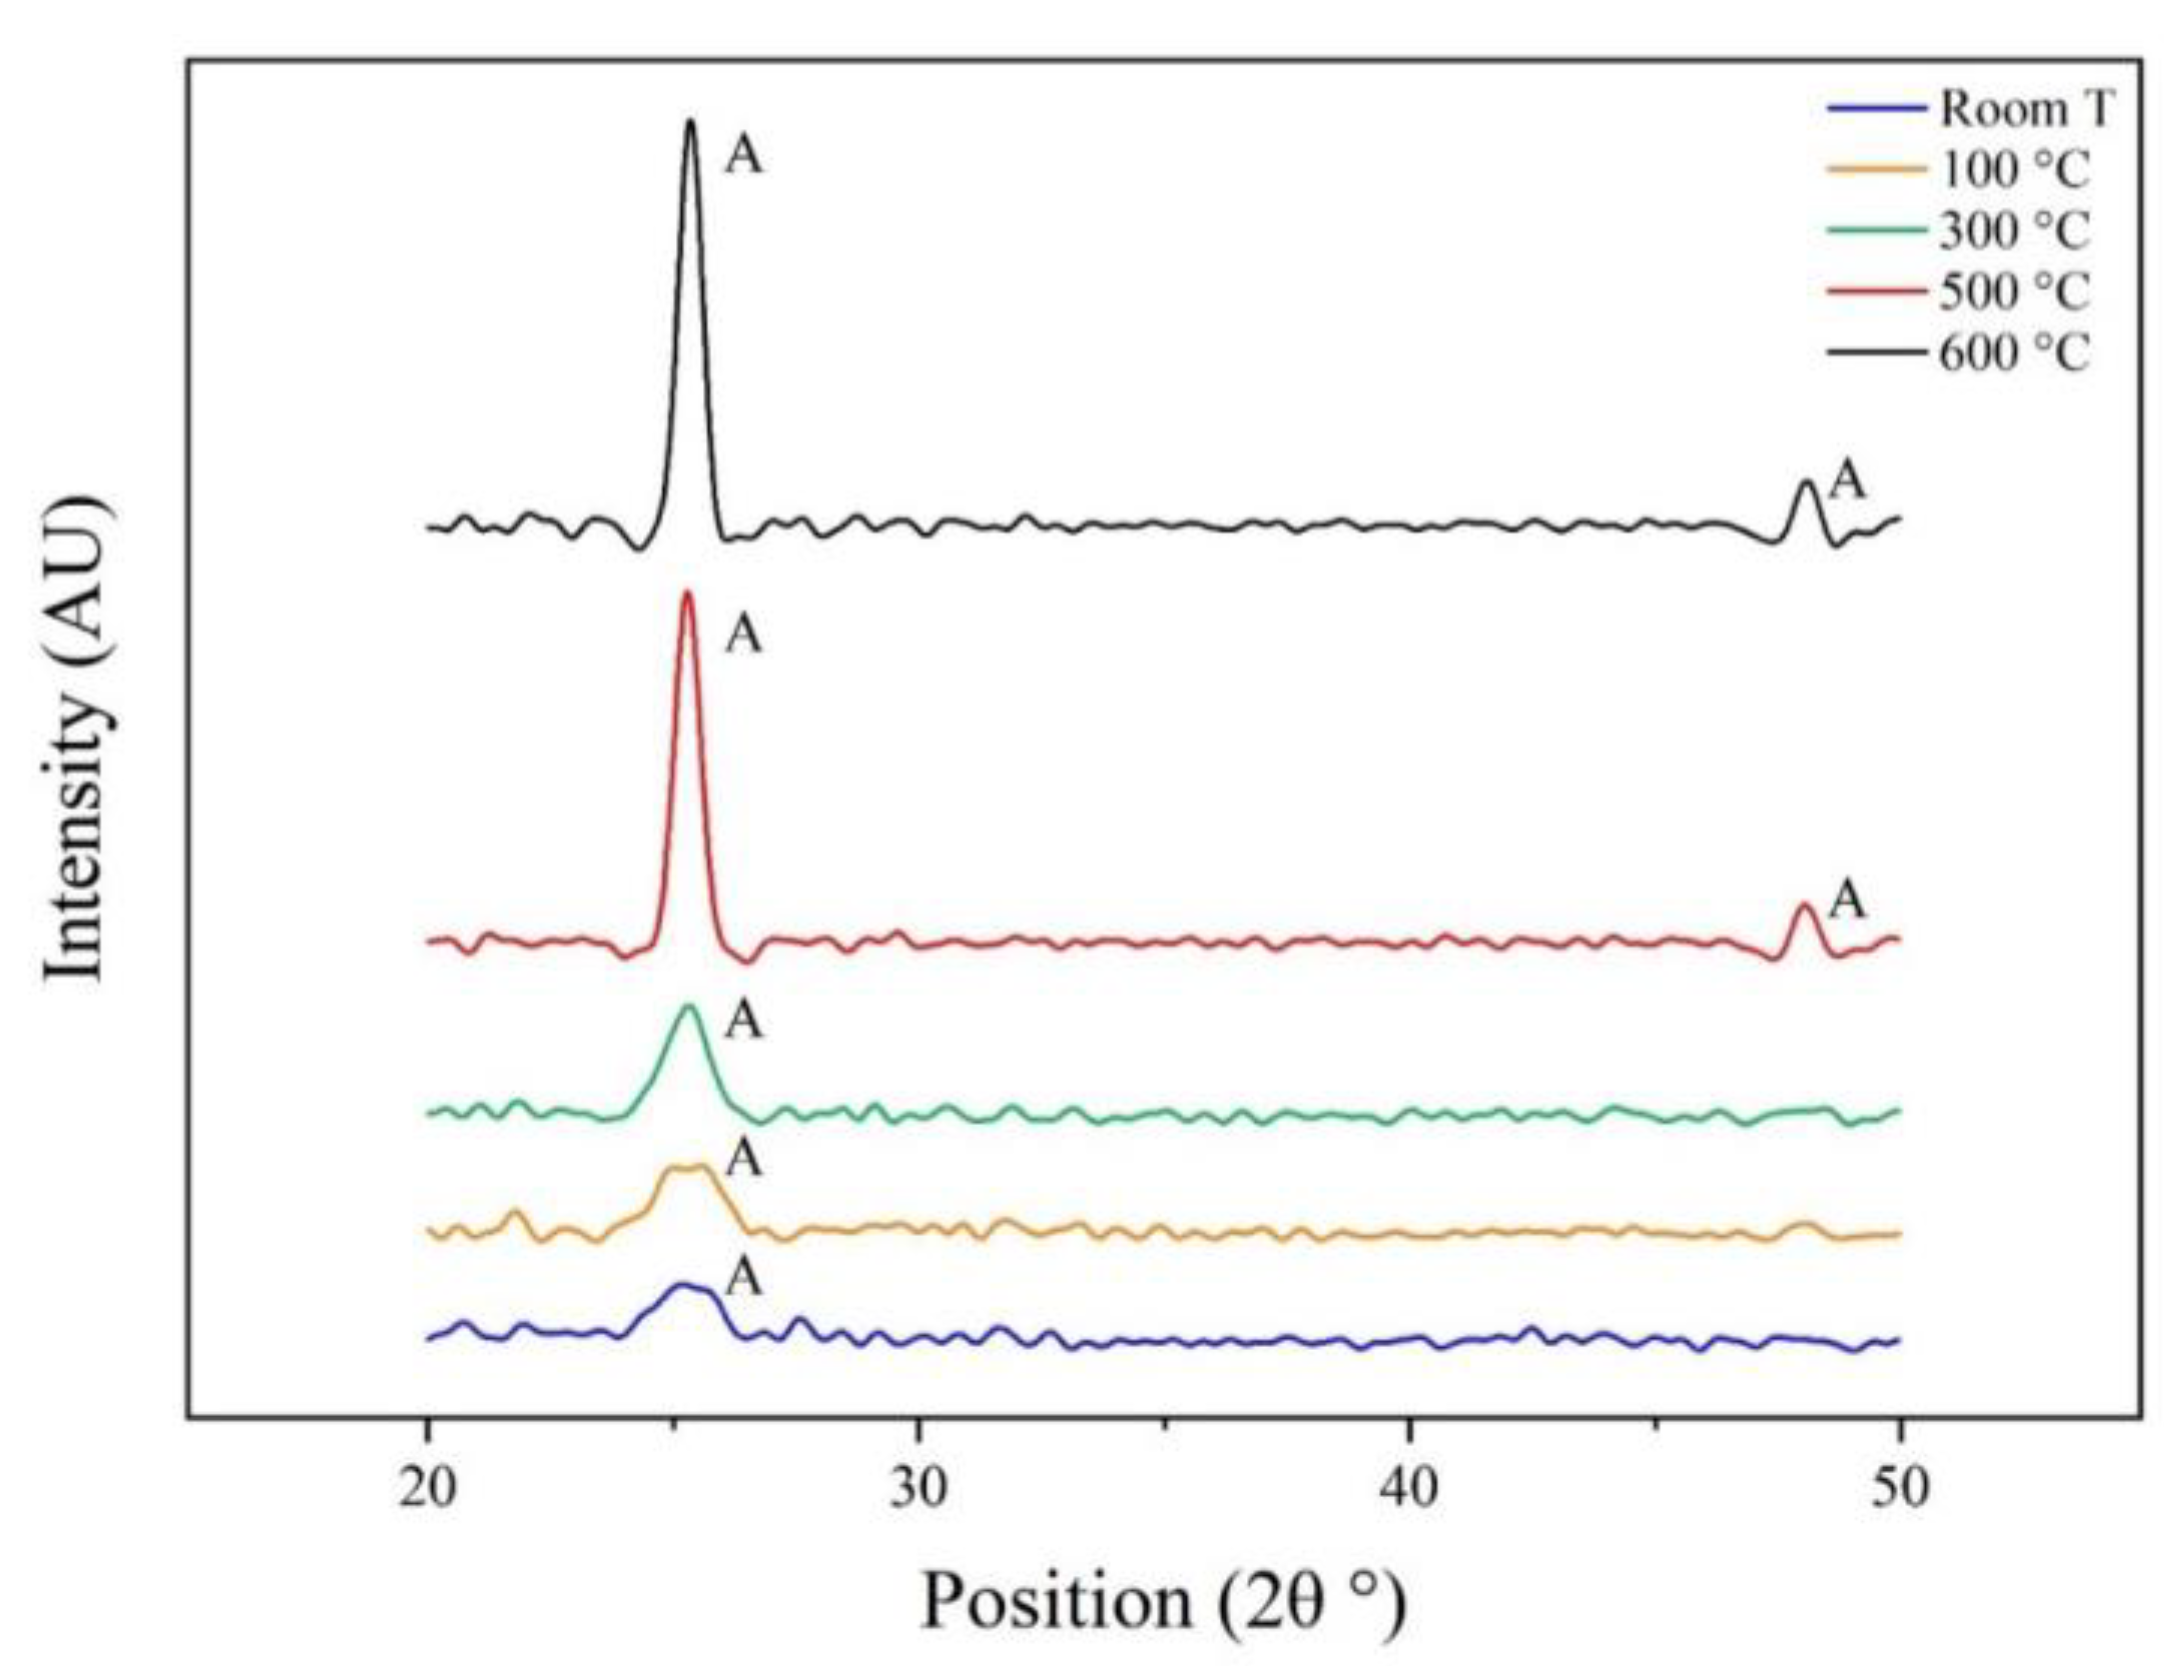
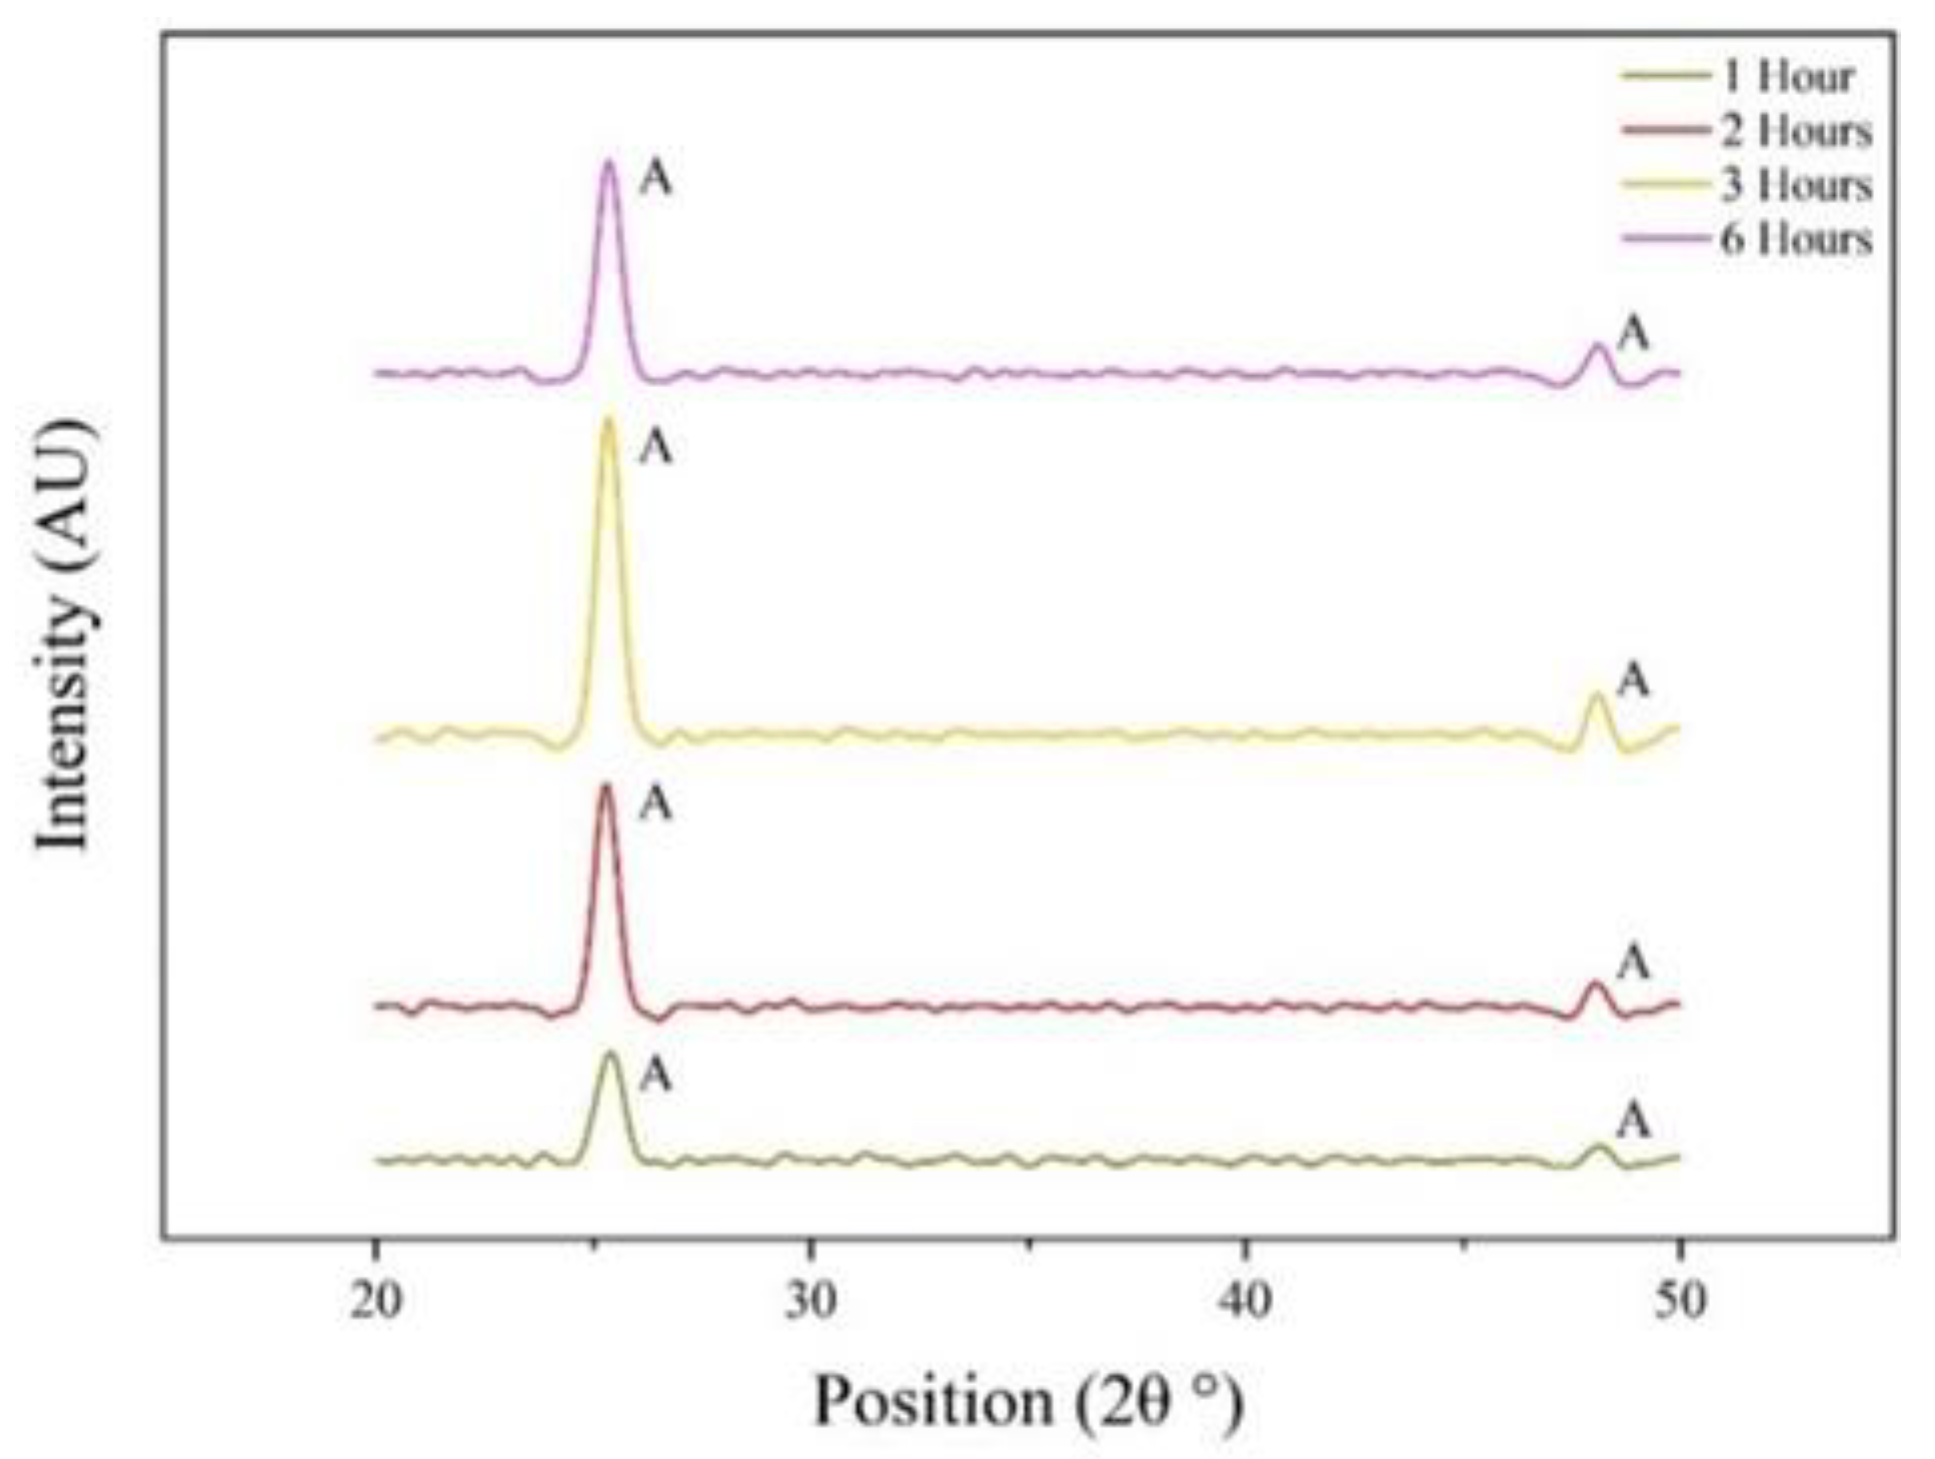
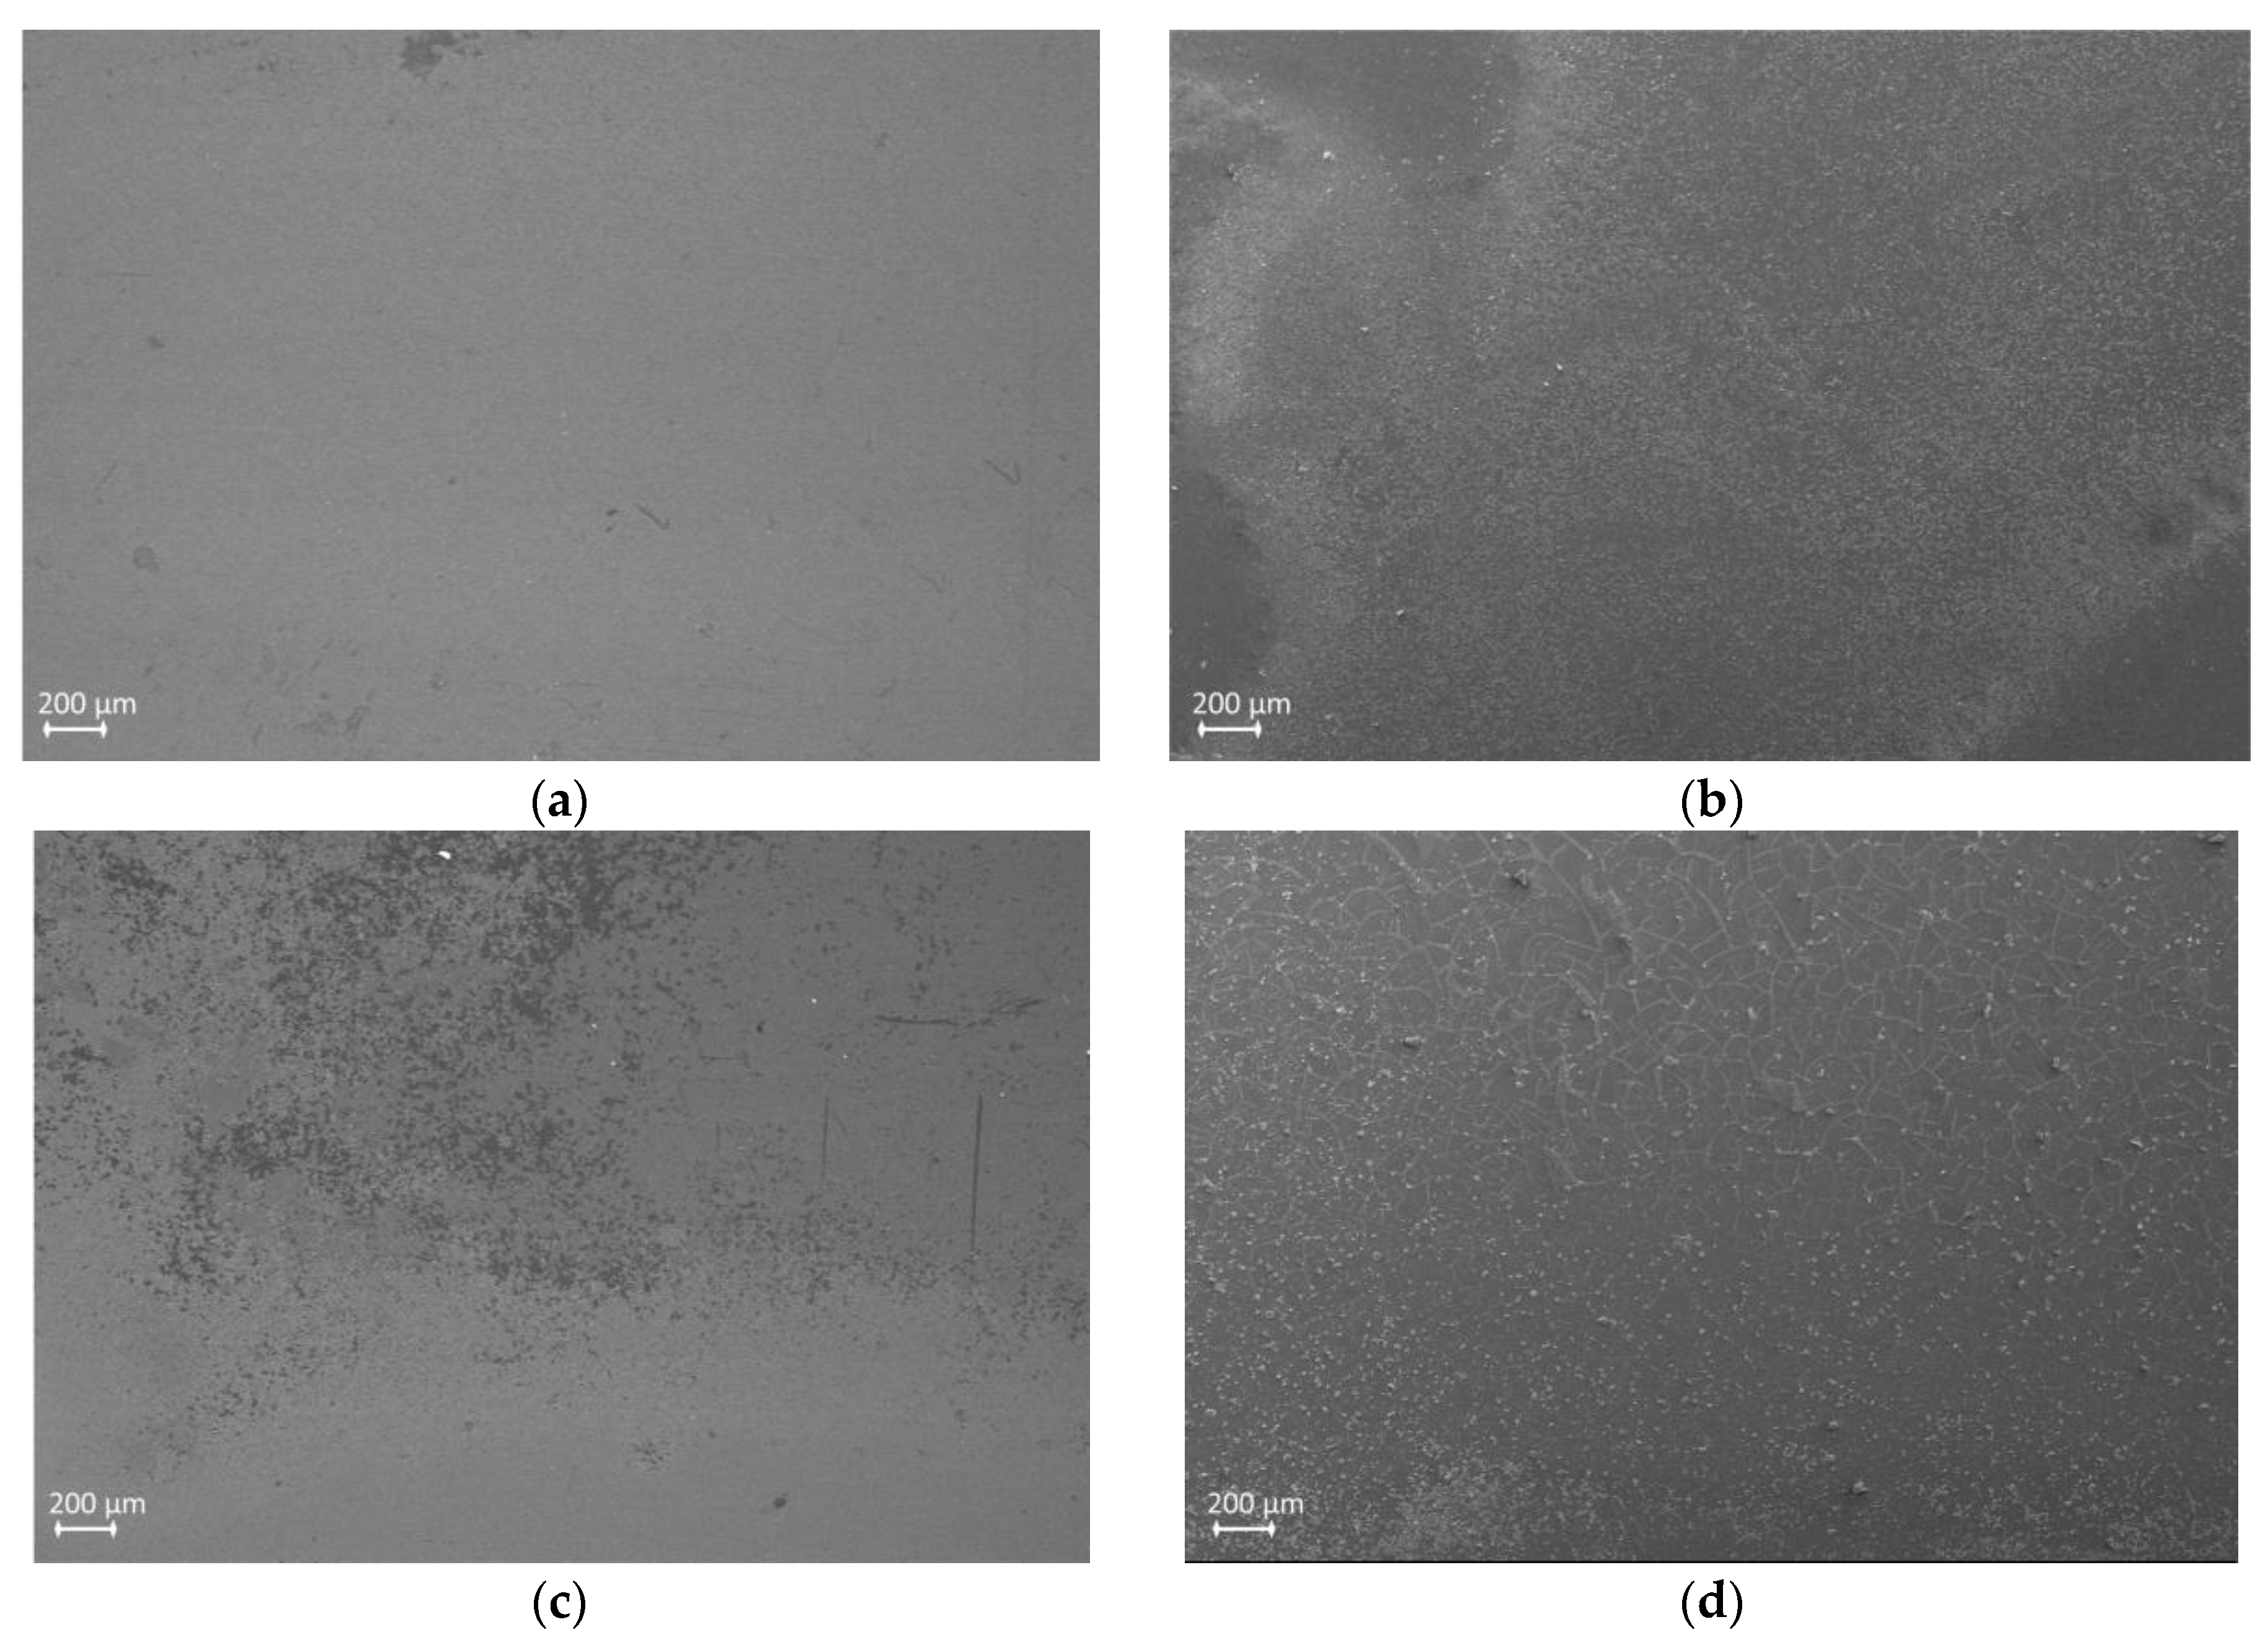
2.1. TiO2 Film Structural Characterization

SEM analyses were performed on nonannealed (Figure 1a) and annealed (Figure 1b) samples. In both cases, the coating appeared nonhomogeneous, and severe cracking was observed. This was ascribed to solvent evaporation during the drying phase, which involves the formation of strong internal stresses in the TiO2 coating. Indeed, water-based sols induced the formation of cracked layers regardless possible annealing treatments, due to reduced evaporation kinetics and wettability if compared with organic solvent-based sols, whose deposition is generally more homogeneous. The non-homogeneity induced by the presence of water as solvent may also explain the presence of some areas in which titanium oxide is lacking (see Figure S1). Indeed, EDS analyses and elemental mapping showed that titanium seems homogeneously distributed in the areas in which the coating is present, whereas silicon can be identified both in coated and uncoated areas, with a signal increase where TiO2 is not present (Figures S2 and S3). Moreover, internal stresses and film shrinkage may be caused by the considerable content of TTIP (0.45 M), since an increase in precursor concentration leads to higher sol viscosity [31].
Although cracking occurred in both annealed and nonannealed coatings, this phenomenon seemed to worsen in the annealed ones, being cracks wider and denser. This was ascribed to a combination of different factors.
First, annealing favors the crystallization of the deposited titanium dioxide, so that a rearrangement of the lattice structure may induce the formation of a more compact crystalline structure. Moreover, high temperature favored the evaporation of trapped water molecules, thus increasing film shrinkage.
Lastly, acetate ligands formed during the chemical reaction between TTIP and acetic acid are very stable and remain in the TiO2 structure at temperatures up to 400 °C, affecting the amorphous-to-anatase transition temperature and the final properties of TiO2 coatings [26]. At 500 °C, the removal of these ligands induced the formation of new -O–Ti–O bonds and so a rearrangement of the lattice structure.
These assumptions were confirmed by the measured average coating thickness, being equal to 904 ± 47 nm and 551 ± 21 nm for as-deposited and annealed coatings, respectively (Figure 1c,d). To validate the measured thickness, laser profilometry was performed on both annealed and nonannealed coated samples; results are in agreement with SEM measurements, being the coating thickness equal to about 1 μm and about 0.5 μm for as-deposited and annealed samples, respectively (Figure S4).
Figure 2 shows XRD patterns performed on films annealed at different temperatures. Results shows the presence of anatase phase, whereas rutile is not detectable in the obtained spectra.
Interestingly, the presence of anatase is confirmed in all the evaluated samples by the diffraction peak at 25.3°, i.e., (101) anatase plane; sharper peaks with higher intensity are observed at temperatures above 300 °C, reaching the maximum intensity at 600 °C. In parallel, the diffraction peak at 48.2° corresponding to the (200) anatase plane appears at annealing temperatures above 500 °C. These results clearly demonstrate that an increase in the annealing temperature results in an improvement in the TiO2 crystallization to anatase phase, being the peaks of (101) and (200) anatase planes more intense for annealing treatment at 500 °C and 600 °C.
Table 1 shows the anatase crystallite size of TiO2 thin films with different annealing temperature, using Scherrer’s equation at peak 25.3°. Crystallite size increased in size passing from as deposited coating (∼6 nm) to samples annealed at 600 °C (∼16 nm), with a remarkable size increase in the temperature range of 300–500 °C (∼8 nm at 300 °C and ∼14 nm at 500 °C), indicating that crystallites growth and dehydration with the removal of hydroxyl groups on the surface occur upon annealing [32]. Although the increase in temperature greatly affects both the crystallization and the anatase crystal size, in the evaluated conditions, the maximum calculated crystal size is still in the nanometer range (∼16 nm).
Figure 3 shows the XRD patterns of samples annealed at 500 °C with different thermal treatment duration. Results showed that an increase in annealing time is favorable up to 2 h, being the intensity of anatase peak at 25.3° doubled with respect to the one measured after 60 min of annealing. Crystallinity seemed not to be improved for longer thermal treatment duration. Crystallite size was not affected by annealing duration.
In general, it was found that anatase nanocrystals form even in absence of any thermal treatment, suggesting that anatase crystals are already present in the sol prior to annealing, although in small quantity and dimensions (Figure 2), while other TiO2 crystalline phases (rutile or brookite) were not identified in the obtained XRD patterns. Indeed, the rather high concentration of TTIP used for the preparation of the sol may have influenced the resulting titanium dioxide structure, as it is believed to promote anatase formation, to the detriment of brookite and, above all, rutile [31,33]. Even more, the absence of brookite seems to be consistent with use of the dip-coating technique, this metastable phase being promoted when spin-coating is used [34].
The presence of acetic acid in the sol is considered the key factor to forming nanometric anatase crystallites. TTIP dissolution in acetic acid allows both to prevent TTIP from water nucleophilic attack and to control hydrolysis and condensation reactions: in fact, the -OR groups of TTIP are replaced by acetate anions that may coordinate in different modes. When water is added, the nonreplaced -OR groups are removed, thus promoting condensation of the hydrolyzed molecules. On the other side, possible acetate bridges are removed, giving rise to further acetate ligands whose hydrolysis is more difficult than that of -OR groups. Therefore, when acetic acid is used as catalyst, the formation of TiO2 nanoparticles is favored due to the protonation of hydroxyl groups that lead to the formation of repulsive clusters, thus inhibiting particle agglomeration. The complexation of acetate ligands and the presence of acetate anions that may adsorbs on the TiO2 surface are considered responsible for a decrease in crystallite size. The formation of acetate binding complex may also improve nanoparticles crystallinity and surface area due to their tight binding on the surface that lead to a better control of the forming nanostructures [35,36,37]. The formation of the anatase phase specifically is related to the small crystallites’ dimension, as it is known that the anatase-to-rutile transition occurs when anatase particles reach a critical size (20–30 nm), below which the phase transformation is energetically unfavorable [35,37,38].
The use of acetic acid is also seen as responsible for the presence of crystallites in the nonannealed sol. Unlike the conventional sol–gel process, when water is used as solvent, the presence of a peptizing agent induces not only the dispersion of precipitates but also their recrystallization at low temperatures, resulting in crystalline TiO2 nanoparticles without any heat treatment step; particularly, inorganic acids seem to promote the production of rutile or (in very acidic conditions, i.e., pH < 1) anatase and brookite phases, whereas pure anatase can be obtained by using weak carboxylic acids, such as acetic acid, due to their chelating behavior [39,40].
Indeed, crystallization is only possible if precipitates are transited to a metastable state, and this can be achieved by adding an acid peptizing agent that improves both the disaggregation of agglomerates by altering surface charge, and the mobility of the dissociated ions. The alteration of surface charges of the amorphous titanium hydroxide formed as a TTIP–water reaction product leads to the breaking of oxo- bonds and to surface protonation of the so formed particles, thus resulting in an increase in nucleation rate rather than particle growth. However, in previous works it is reported that the maximum growth of TiO2 crystallites is inexplicably achieved in water-based solutions, despite the high hydrolysis of TTIP or any other titanium alkoxide [41,42].

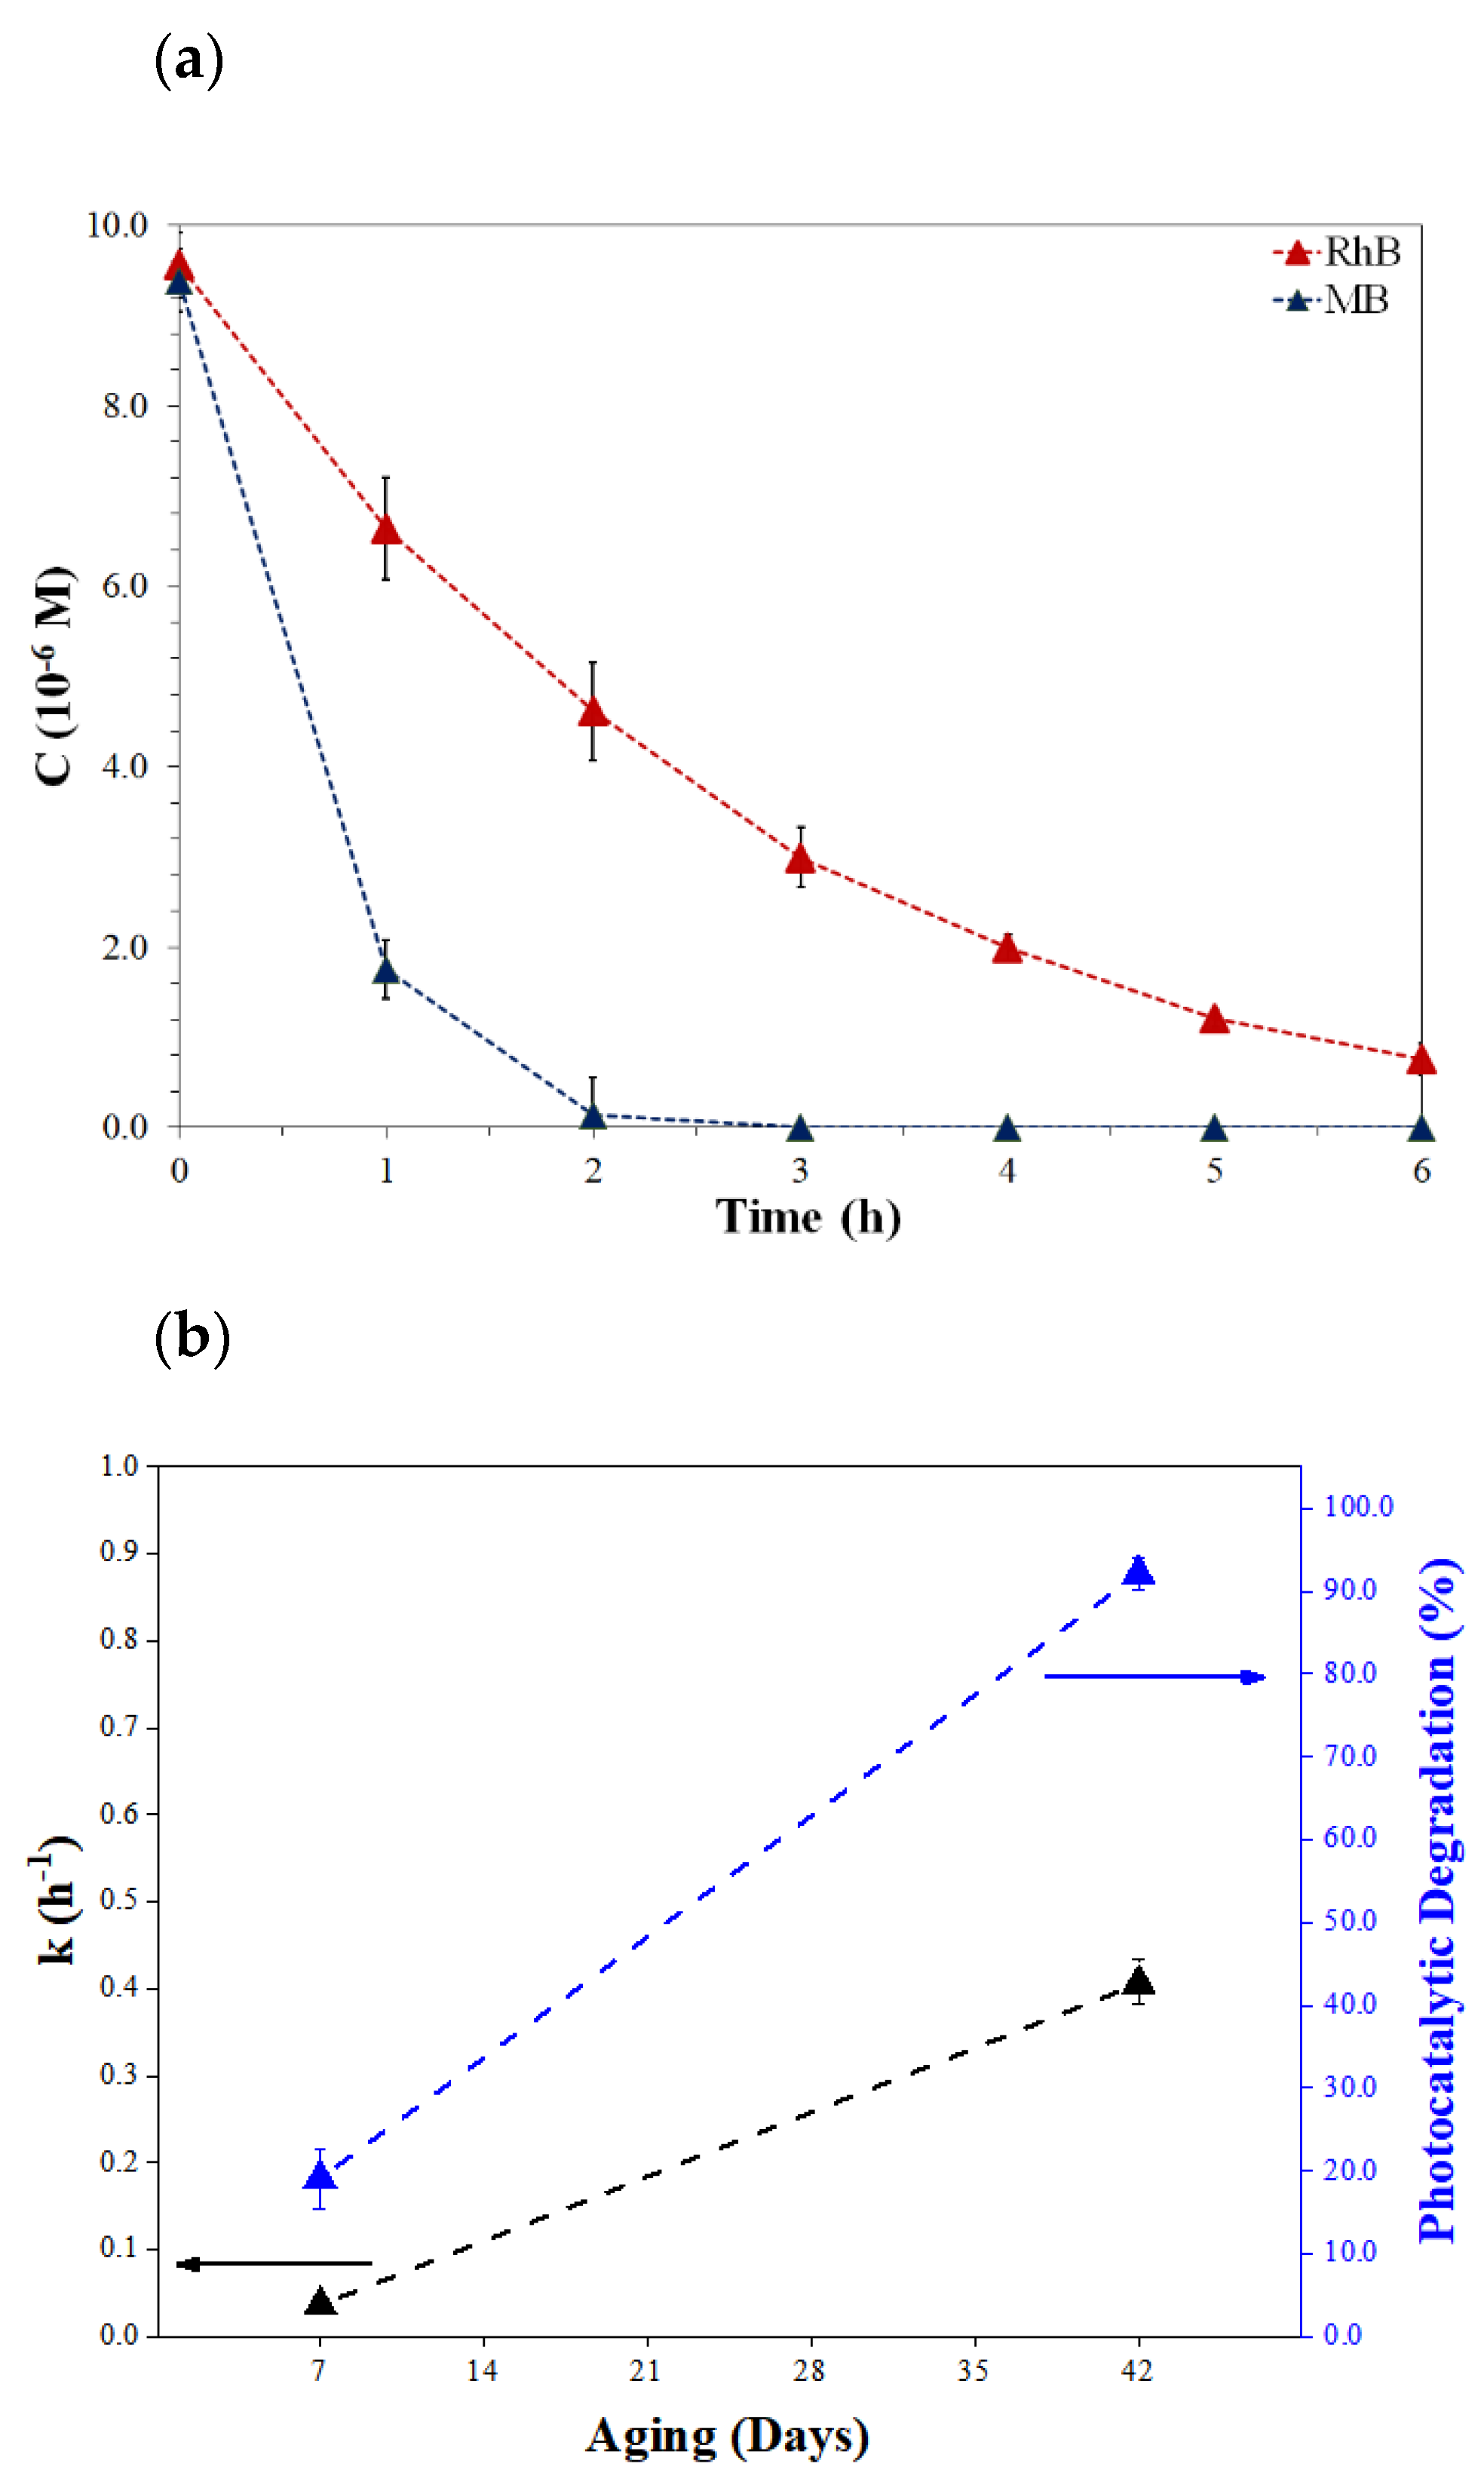
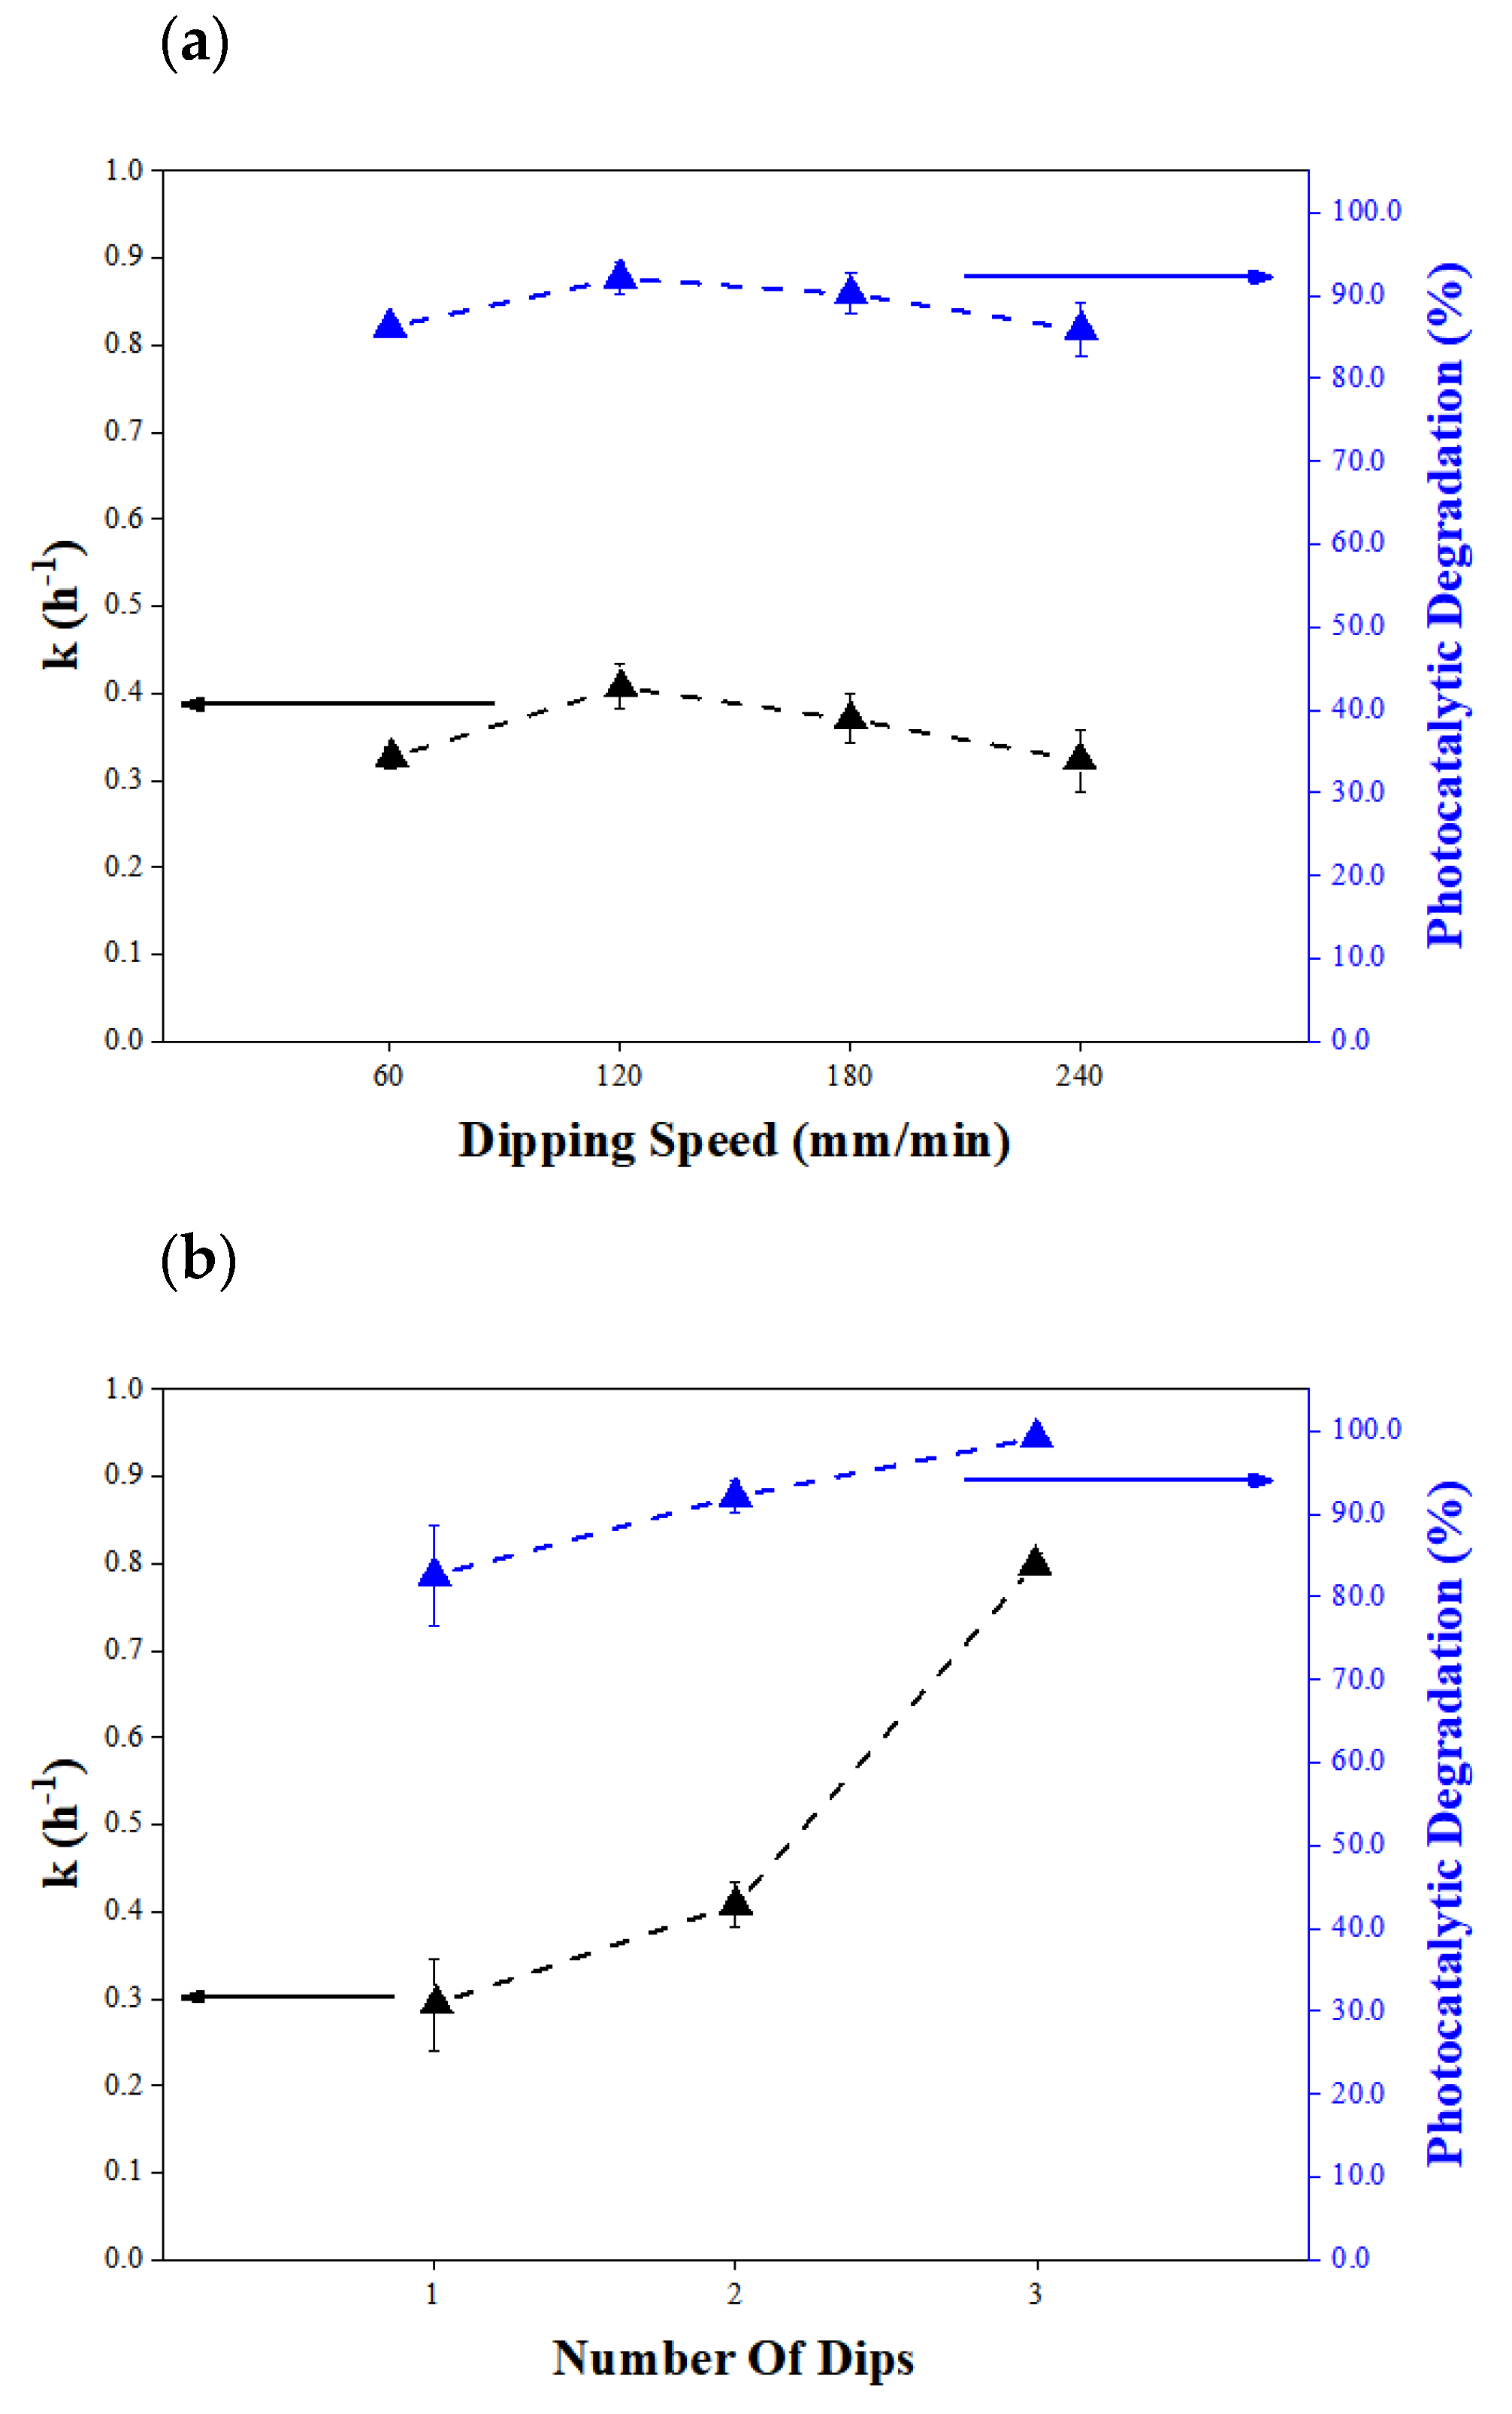
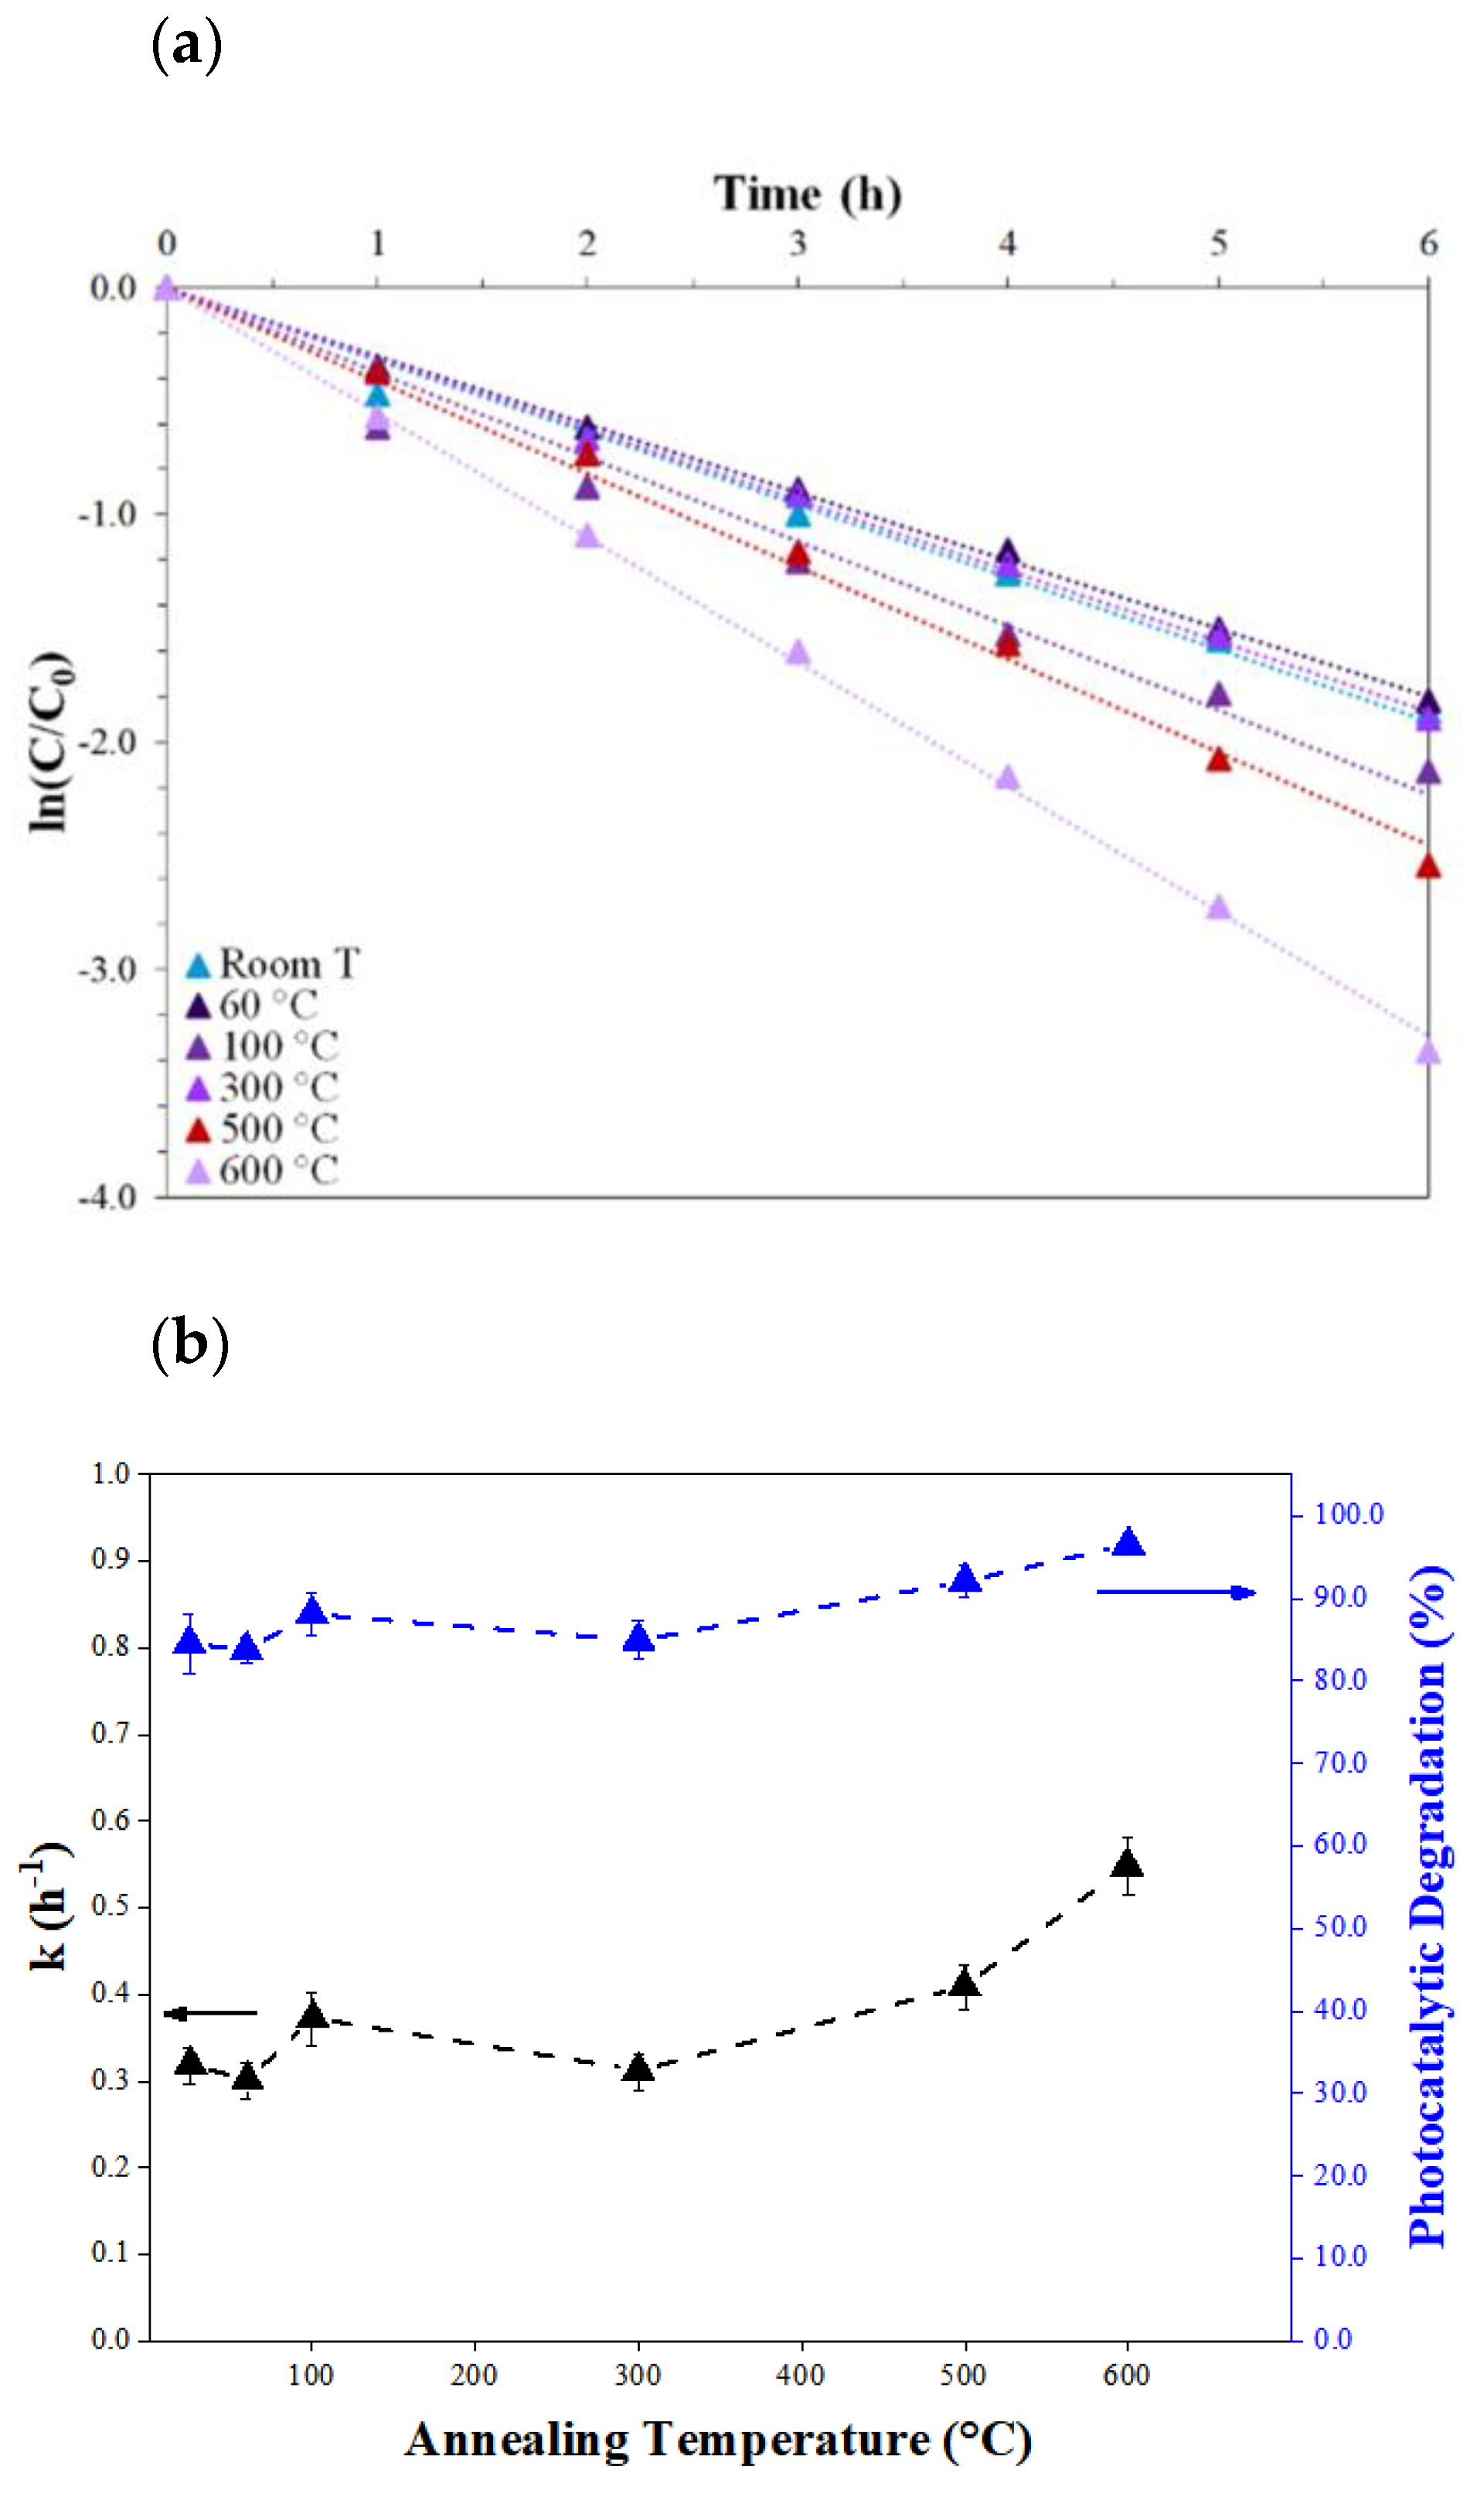
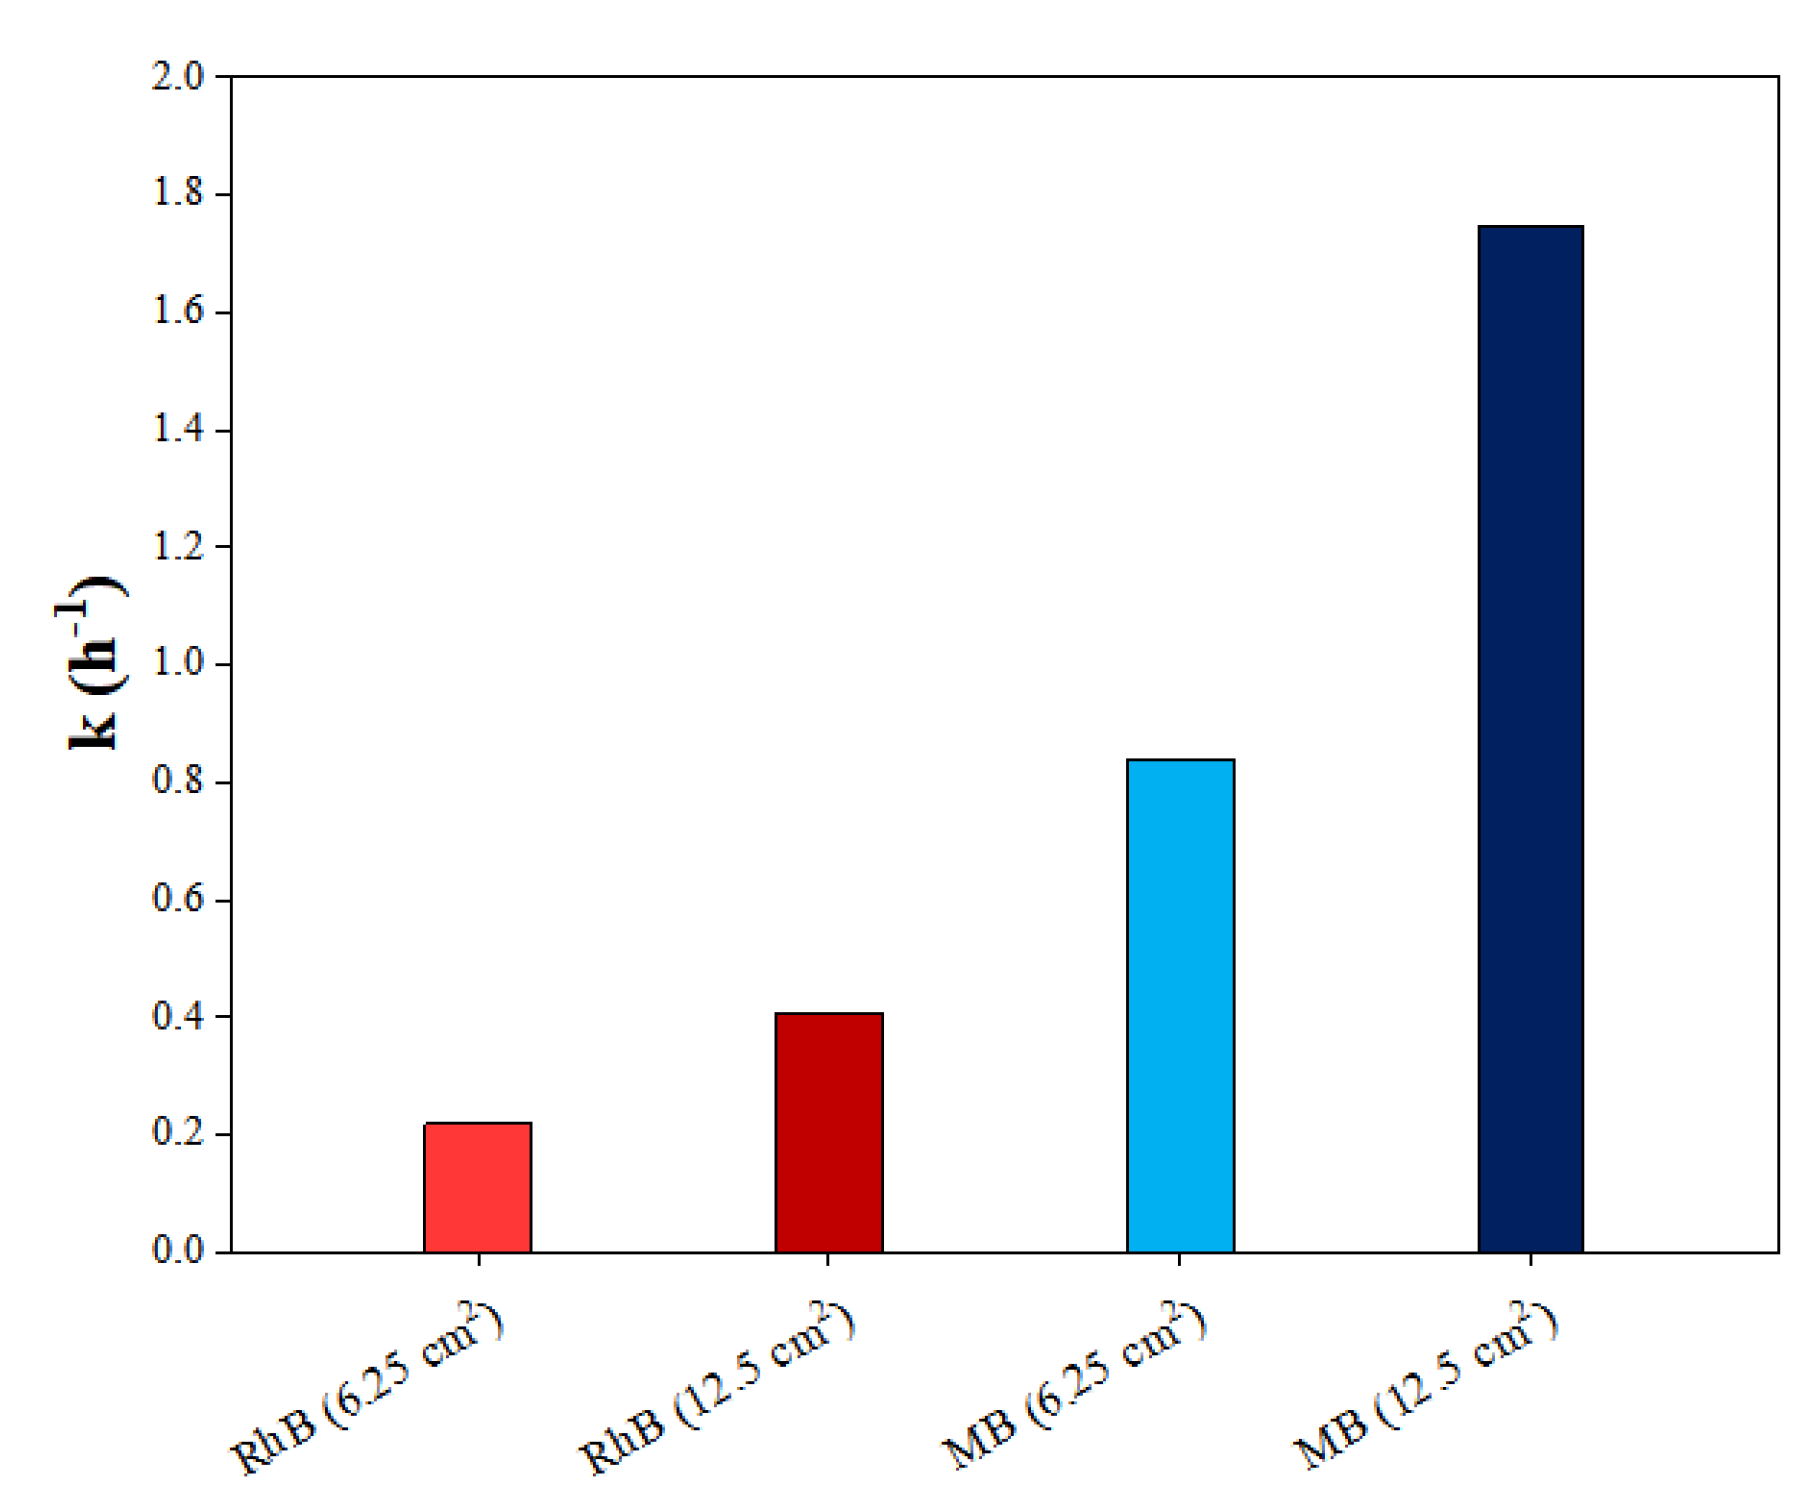
2.2. Photocatalytic Activity of Synthesized Coatings

In general, photocatalytic tests performed on two-side coated glass samples in the reference conditions listed in Materials and Methods, Section 3 (Table 2) showed that RhB is degraded by more than 90%, reaching an efficiency close to 100% for MB water-based solution (Figure 4a). Photolysis and adsorption control tests were performed in absence of photocatalyst under UV-A illumination and in dark storage, respectively; results showed that photolysis and adsorption can be considered negligible with respect to the overall discoloration process, confirming that dye degradation shall be attributed exclusively to photocatalytic degradation.
The high efficiency of the coatings can be ascribed, first of all, to the presence of the anatase phase, which is known to have the best photocatalytic properties among TiO2 crystal phases, and then to the medium-high TTIP molarity of the sol, since an increase in the precursor content leads to higher amounts of TiO2 in the sol [31,43]. Nonetheless, the relative inhomogeneity of the coatings, regardless annealing or dipping conditions, may influence their photoactivity, with particular reference to coating adherence to the substrate. For this reason, further tests were performed to investigate the durability of coating performances on multiple runs; this aspect is discussed in Section 2.4.
Interestingly, sol deposited 7 days after its synthesis provided rather poor results. Deposition performed after 42 days aging allowed to obtain much higher photodegradation, with a kinetic constant increased by one order of magnitude (Figure 4b). Results were repeated both by reproducing the same sol, and by redepositing the initial sol on new glass slides (error bars in Figure 4).
The increased activity at longer aging time was ascribed to the fact that aging allows further nucleation of TiO2 nanocrystals, allowing for higher nanoparticles content in the sol to be deposited. This was confirmed by a visual inspection of the sol. In the first week, the sol appeared homogeneous and transparent, with a yellowish hue shown by the chelating effect of acetic acid [26]. After 42 days from the synthesis, the aesthetic appearance of the sol was translucent and whitish, confirming the formation of TiO2 nanoparticles in the colloidal solution. Their slow nucleation was ascribed to the relatively high TTIP:acetic acid molar ratio (1:5) that strongly influenced hydrolysis and condensation reactions. Still, no sol gelation or TiO2 precipitation were noticed during the whole experimental phase, suggesting that after 4 weeks the sol reached an equilibrium, and then maintained good stability also in the following weeks.
As for deposition parameters, the effect of dipping speed on the kinetic constant—calculated using a regression analysis of the kinetic curves (ln C/C0)—is shown in Figure 5a. It is possible to see good reproducibility of the tests, with a standard error generally lower than 6%. The only exception is at a dipping speed of 240 mm/min, where the error increases to 10%. This was ascribed to the fact that higher dipping speed may lead to lower coating homogeneity, as confirmed by spectrophotometric analyses (Section 3.5).
All kinetic constants are in a range of 0.32–0.4 h−1, with a slight increase in photoactivity for coatings deposited at 120 mm/min; no significant variations in terms of photodegradation percentage were observed, suggesting that differences in terms of coating photoactivity are rather limited.
These results could be considered inconsistent with the effect of dipping speed on coating morphology. Different authors [44,45,46] reported that an increase in withdrawal speed leads to an increase in coating thickness, and so to higher photoactivity of the deposited TiO2 film, as a result of a modified equilibrium between the adhesion of the fluid on the substrate and gravity-induced viscous drag forces [47,48]. Still, results shown in Figure 5 can be explained by considering that the low adhesion forces between glass substrate and the aqueous sol led to a strong predominance of drag forces in the whole considered dipping speed range.
The effect of number of dips on the kinetics of the photocatalytic process is shown in Figure 5b. Photocatalytic efficiency is promoted as the number of dips increases, on account of an increased amount of TiO2 on substrates [44], thus reaching a complete discoloration of RhB (100% removal) and doubling of kinetic constant for samples coated with three dips. Moreover, the standard error decreased progressively as number of dips increased.
The more marked increase in photoactivity with the third dip can be ascribed to an increase in wettability. When the first dip is performed, the low wetting of the sol on glass leads to a prevalence of drag forces that tend to make the sol flow over the surface, reducing the deposition extent; therefore, coatings with higher inhomogeneity are obtained. With the second dip, the deposition of the sol leads to an increased homogeneity by also covering areas where photocatalyst was lacking. When the third dip is performed, the sol will be no longer deposited on glass, but on the previous two layers, granting an increase in wettability and adhesion forces and favoring the deposition of greater quantities of titanium dioxide if compared with the previous dips; this is in agreement with spectrophotometric analyses (Section 3.5).
On the other hand, it is interesting to notice how annealing affected the linearity of the pseudo-first-order kinetic curves (Figure 6). High linearity was found when tests were performed on samples annealed at a temperature higher than 300 °C (R2 > 0.997). At lower temperatures, a fast RhB photodegradation was measured in the first two hours of UV-A irradiation, followed by a nonlinear decrease in photoactivity that led to a gradual reduction in reaction rate. This was particularly evident on nonannealed samples and those heated only at 100 °C. The reliability of these data was confirmed by test repeatability, being the standard error lower than 7%.
Nonlinearity was ascribed to poor coating adherence on the substrate before annealing, with consequent TiO2 mass loss during samples immersion in RhB solutions. Indeed, higher annealing temperatures both promote crystallization (higher kinetic constant) and enhance adhesion on the substrate (better linearity), thus increasing the mechanical stability of the coatings.
An exception to this behavior was found for samples annealed at 60 °C for 8 h (R2 = 0.998) (Figure 6a). An increase in annealing duration may therefore enhance the adherence of the coating, even at low temperatures, although with no beneficial influence on coating crystallization, being the kinetic constant comparable with the nonannealed sample.
An analogous absence of variations with annealing time was also obtained at 500 °C, confirming that crystallization takes place in the first 1 or 2 h of treatment, and its prolongation only allows a better consolidation (Figure S5).
Upon annealing between 100 and 500 °C, only limited increases in photoactivity were noticed; conversely, a strong improvement was recorded for samples annealed at 600 °C (+40% in kinetic constant and almost complete RhB discoloration). This aspect was expected and ascribed to a balance between the beneficial and detrimental effects provided by crystal size reduction. In fact, nanocrystals have been reported to enhance photoactivity not only on account of their higher surface area, but also due to a reduction of the diffusion path length of photogenerated charge carriers, thus favoring the interfacial electrons and holes transfer at the TiO2 surface. On the other hand, in very small nanoparticles an increase in band gap energy due to quantum confinement effect and an increase in e--h+ recombination due to an enhancement of surface charge carriers trapping lead to a decrease in photoactivity [49,50,51]. The latter effect was therefore considered to prevail on the increase in crystallites surface area, and together with a higher crystallinity (higher intensity of XRD peaks) this led to an increased efficiency at higher annealing temperatures.
Still, a relatively high photoactivity was recorded even for low-temperature annealed samples, which was ascribed to the presence of highly photoactive anatase TiO2 nanocrystals even at room temperature (Figure 2). Indeed, this opens the way to applications on thermally unstable substrates by considering a prolonged room temperature consolidation.

2.3. Comparison with Previous TiO2 Coatings

To compare photoactivity with previous works from the same research group, tests were repeated on MB solutions. As previously tested samples had different size, tests were performed on samples with different exposed surface area (namely, 6.25 cm2 and 12.5 cm2) by depositing the sol either on one side or both sides of the glass substrate. The reference deposition conditions were used; tests are also compared with RhB degradation (Figure 7).
As expected, the kinetic constant is doubled by passing from one coated side (RhB: 0.22 h−1, MB: 0.84 h−1) to two coated sides (RhB: 0.41 h−1, MB: 1.75 h−1). Similarly, the photocatalytic degradation percentage strongly increases as well. The higher photoactivity in presence of MB, with respect to RhB, was ascribed both to the presence of a thiazine group in its heterocycle chemical structure that favors bond cleavage and to its lower molecular weight [52].
Given the strong linearity of kinetic constant with surface area exposed (Figure S6) for both dyes and considering that samples were exposed to light from the top surface, it was concluded that both sides are equally photoactive, and that the coated samples are transparent to UV-A irradiation.
The reaction rate per unit area was compared with results of photocatalytic tests performed with a previously studied ethanol-based sol [53]; more conventional, nongreen reagents were used to obtain a homogeneous photocatalytic sol whose biggest merit was a transparent appearance, allowing application without altering the aesthetics of the substrate. A reaction rate equal to 0.024 h−1 cm−2 was found on MB, significantly lower than the one obtained in the present work (0.14 h−1∙cm−2). This was ascribed to the lower content of anatase that may have reduced the photocatalytic activity.

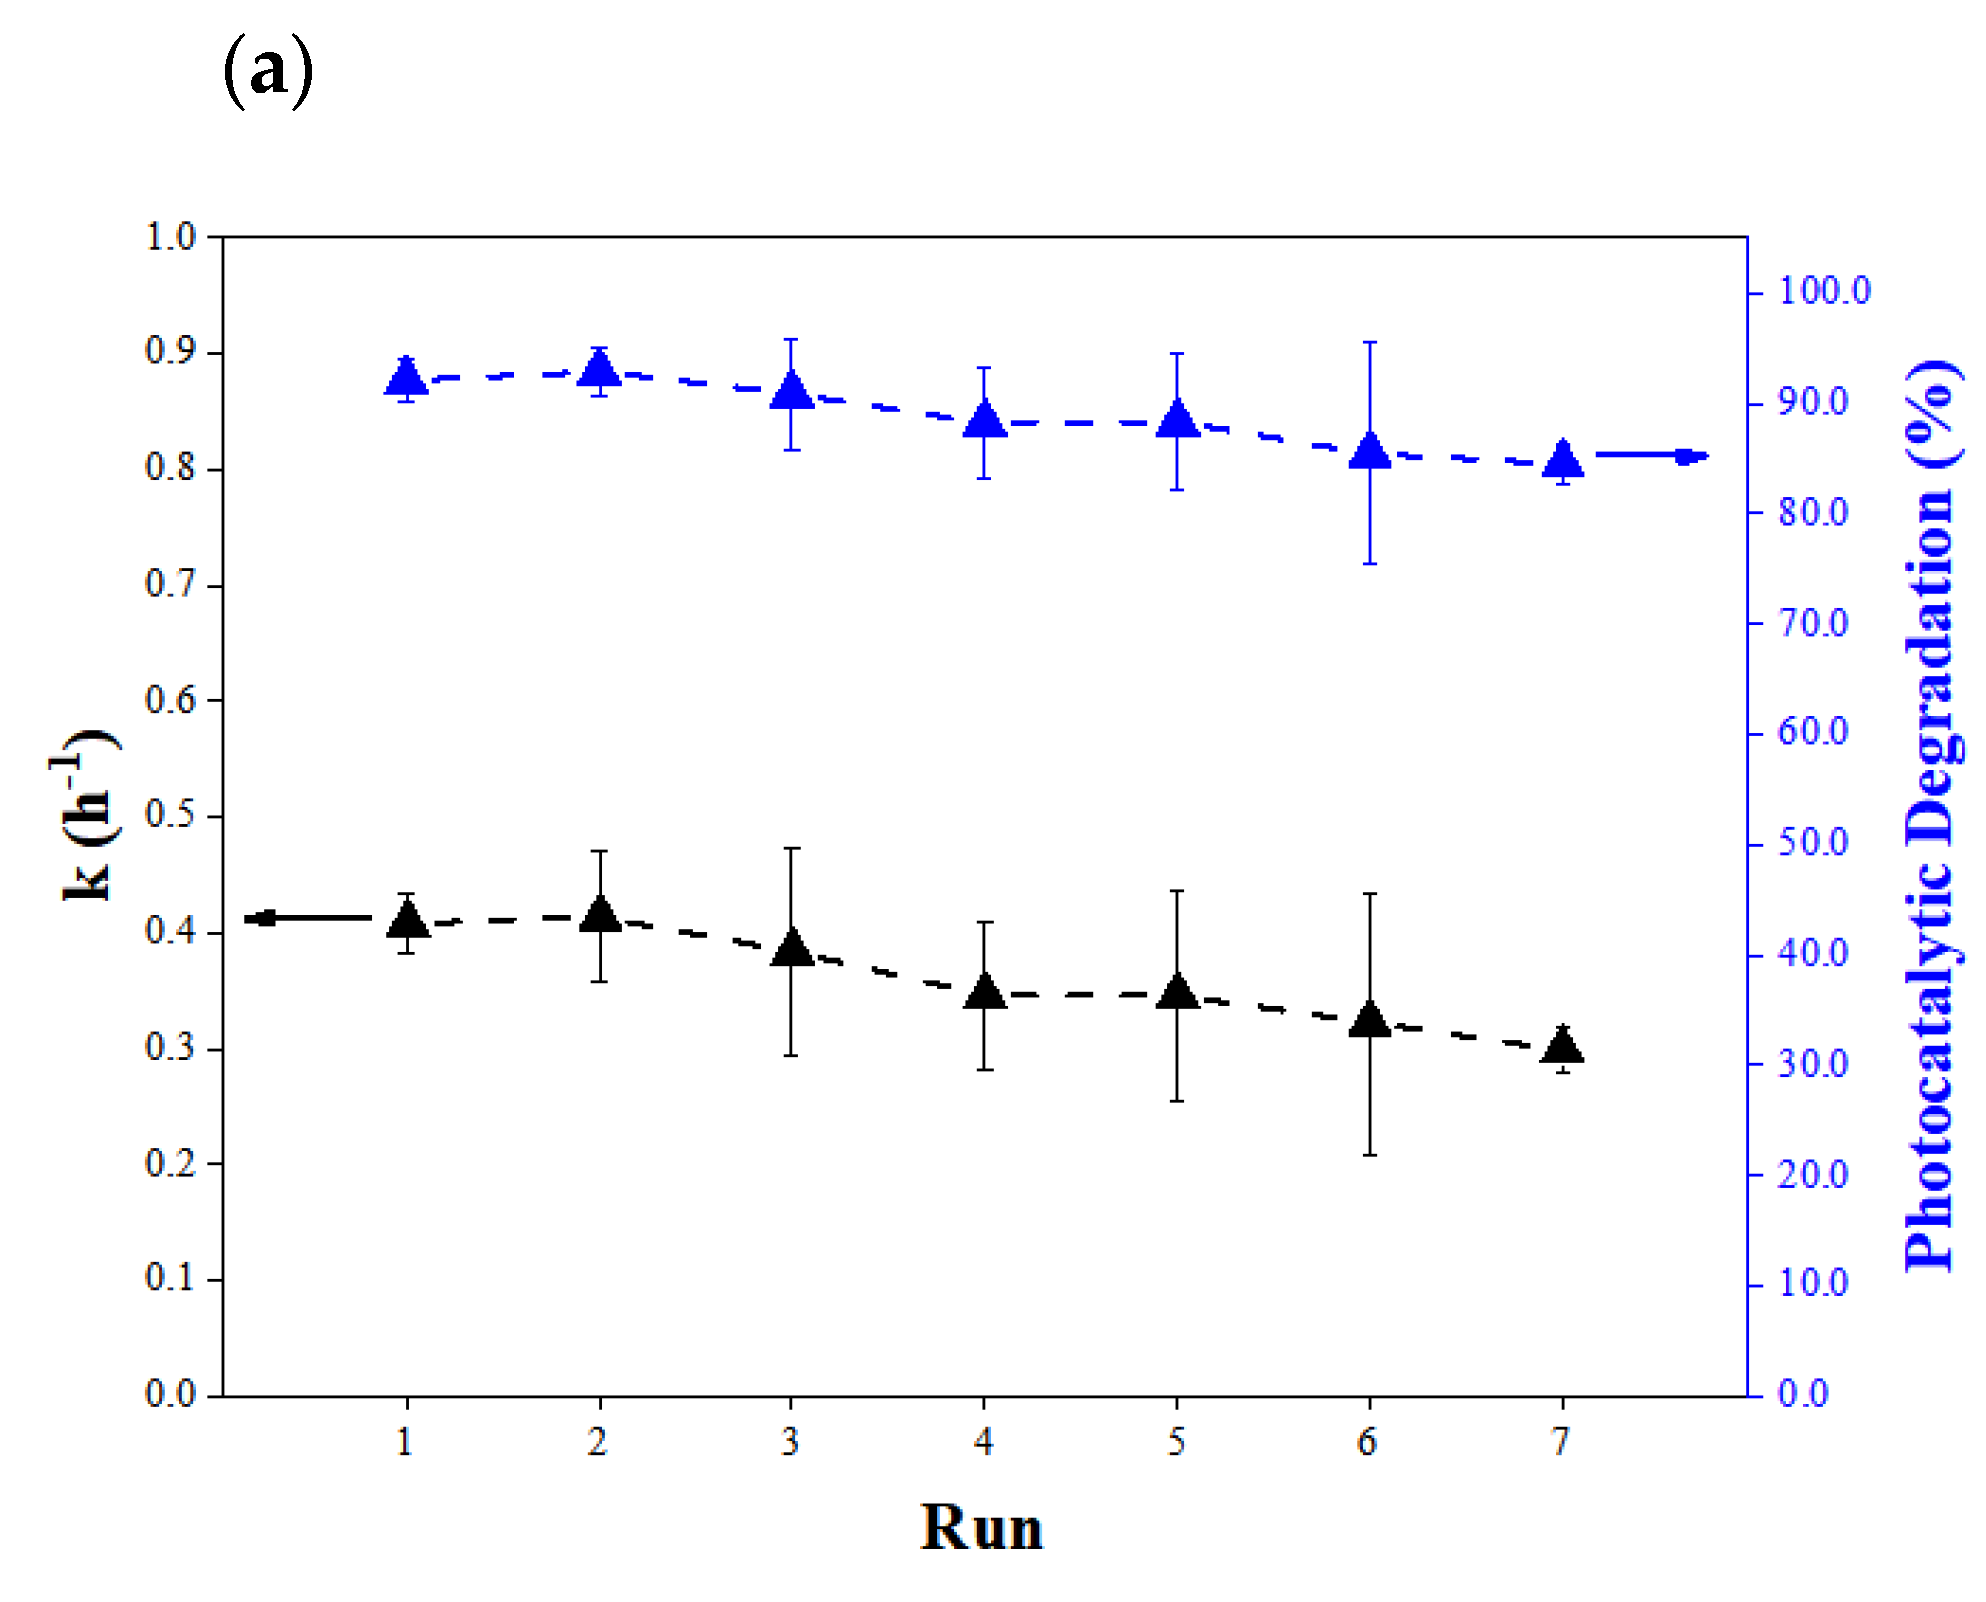
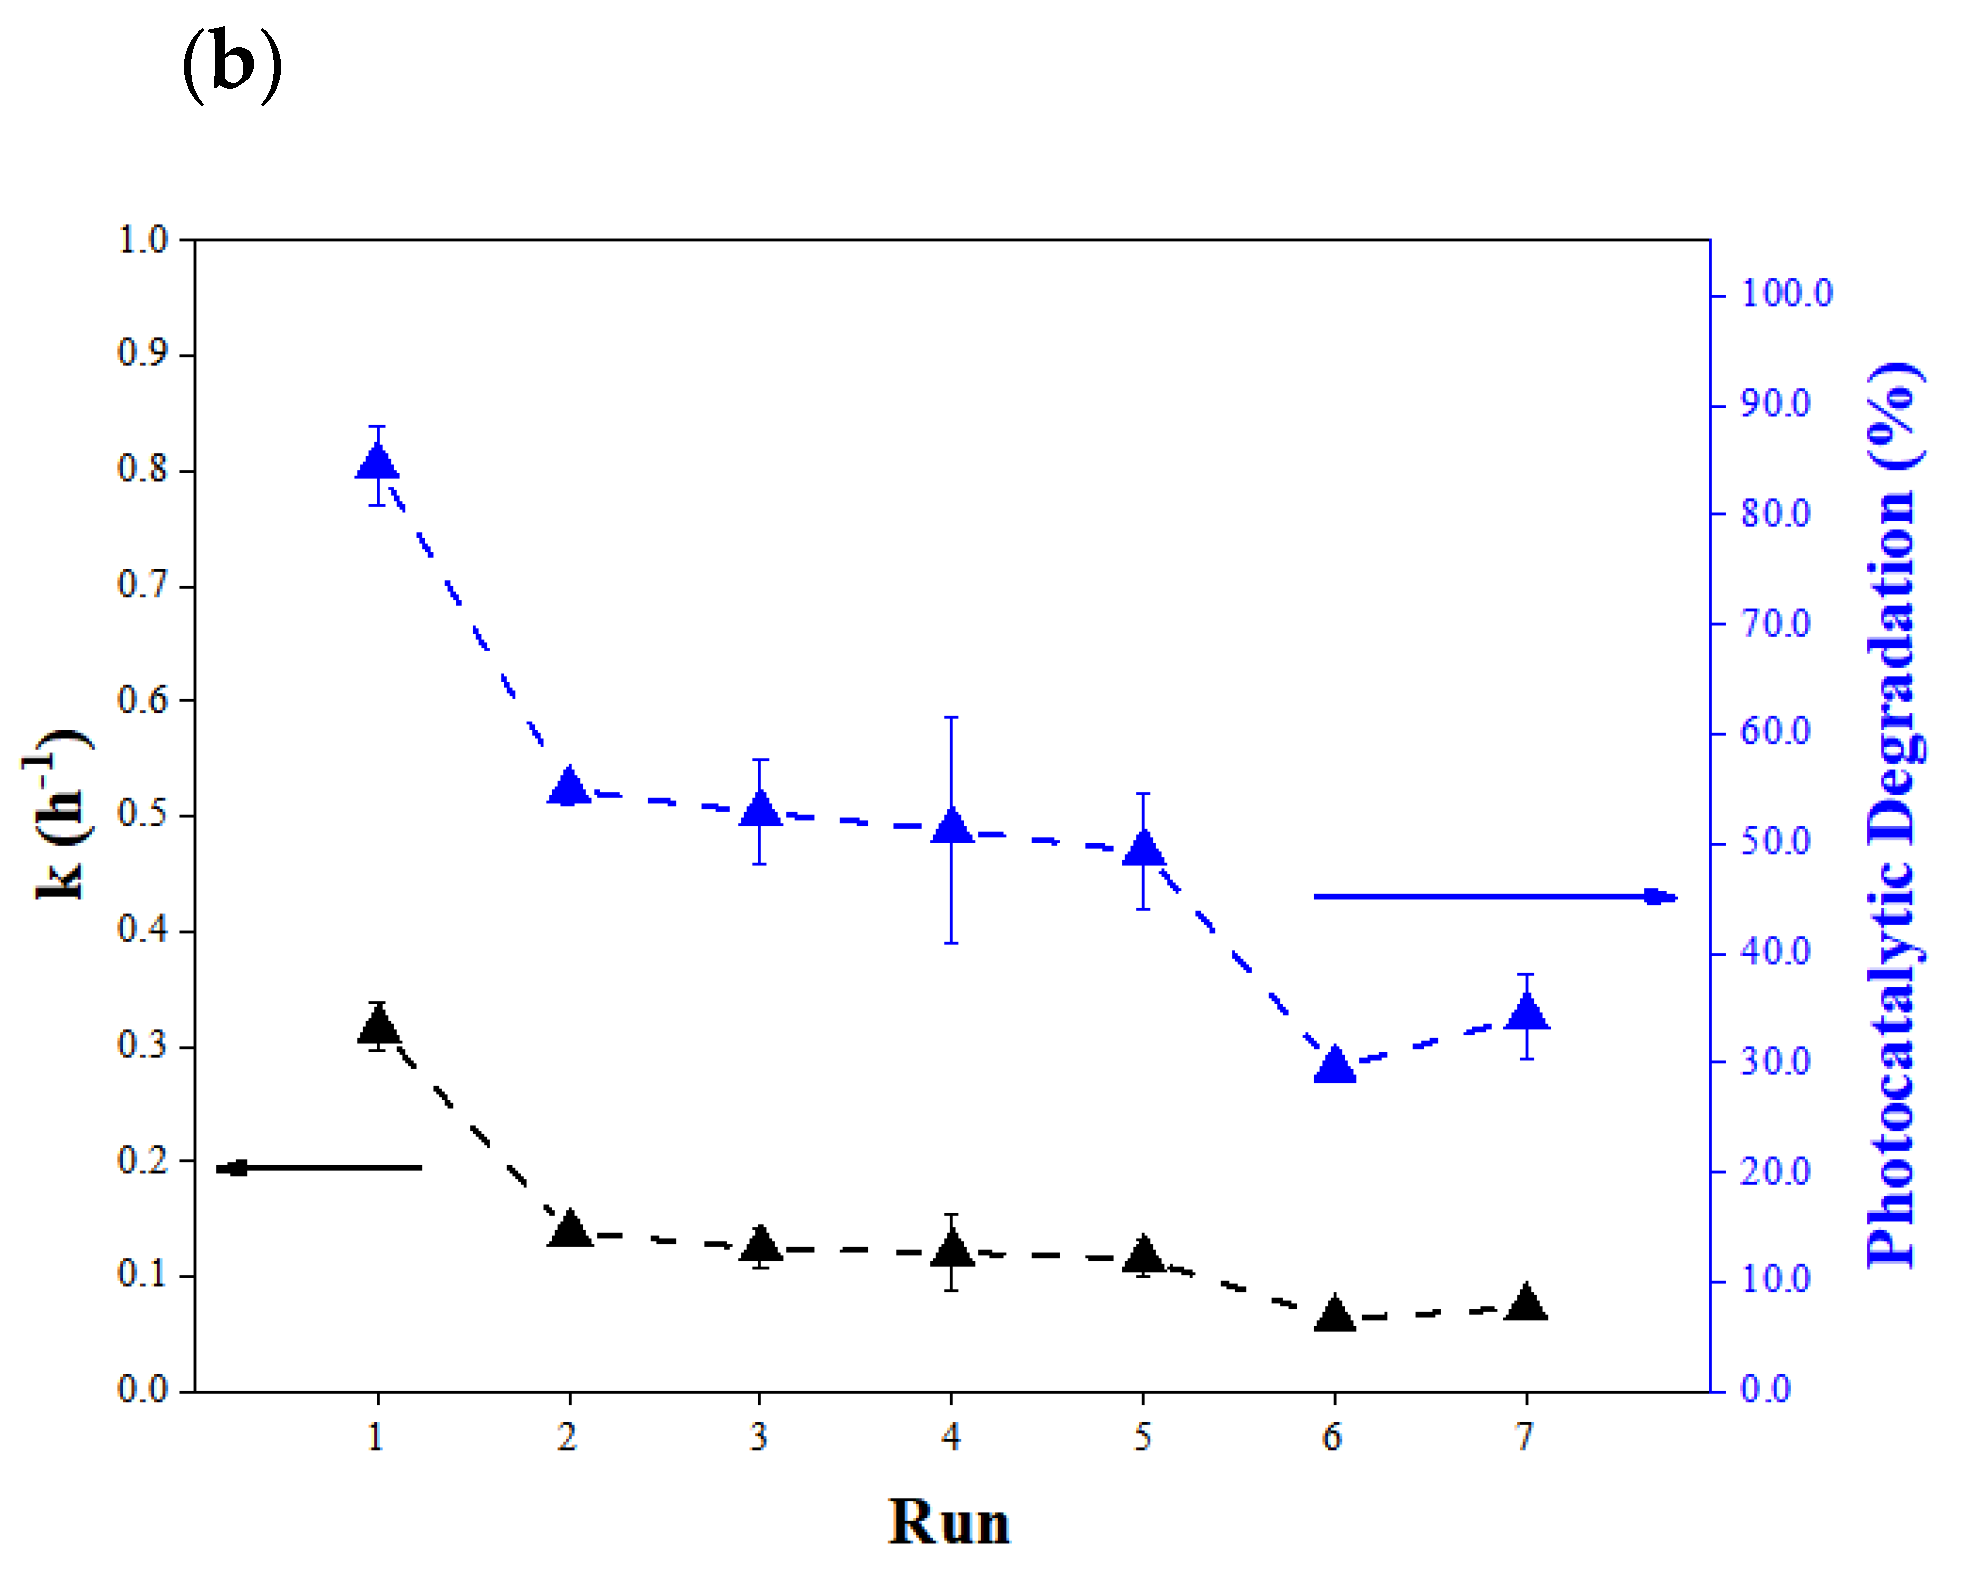
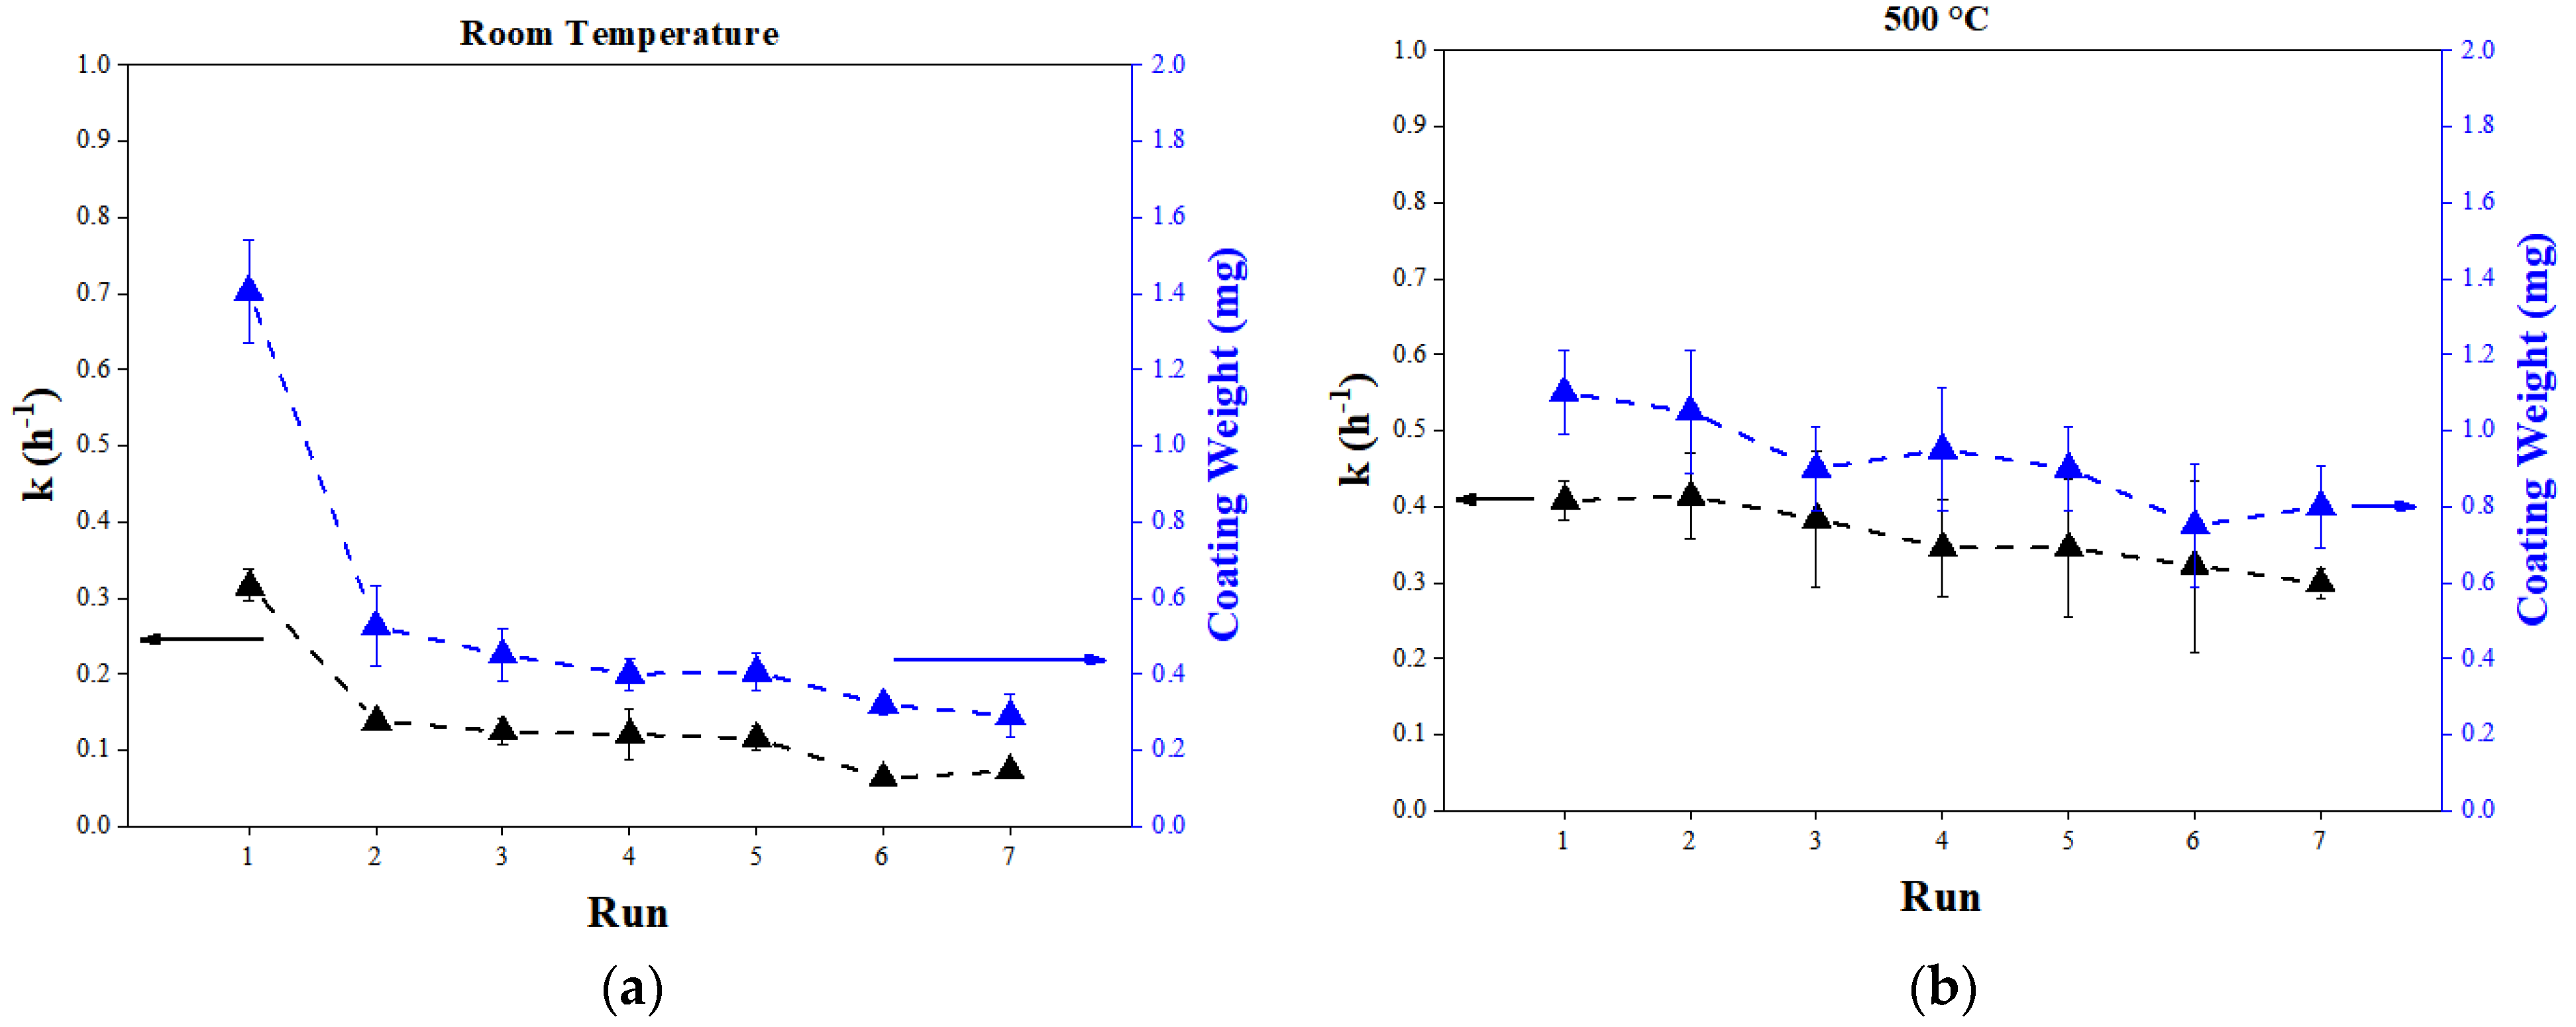
2.4. Durability and Stability of the Coatings

The durability and stability of a photocatalyst is an important technical and economical factor that cannot be overlooked. For this reason, nonannealed coatings and coatings annealed at 500 °C were tested for seven consecutive photocatalytic tests in RhB solutions on two different samples for each analyzed condition.
Concerning annealed samples (Figure 8), RhB concentration is generally halved within the second hour and the concentration profiles are subjected to an exponential decay, thus implying a high photoactivity all over seven runs. While sample 1 shows an apparently constant behavior until the 6th cycle, sample 2 undergoes a slight reduction in photoactivity starting from the 3rd cycle. Such variations in concentration profiles may be partially related to possible release of TiO2 nanoparticles into the solution.
To quantify these variations, kinetic curves and apparent reaction rates are shown in Figure 9a. The regression analysis performed produced R2 values higher than 0.994, confirming a high linearity even for repeated tests. Results show that the maximum photocatalytic efficiency was reached in the first two cycles, after which a slight decrease in efficiency was registered. Specifically, photodegradation percentage decreased from 92% to 85% after seven runs (i.e., a loss of 7%) while the apparent reaction rate constant decreased gradually over the seven runs from 0.41 h−1 to 0.3 h−1.
As the decrease in the kinetic constant was relatively modest, it is possible to say that the coating features a good stability and adhesion in spite of prolonged immersion in Rhodamine B solutions alternated with rinsing and drying cycles, which could have severely damaged a nonadherent coating.
On the other hand, nonannealed samples showed a significant loss of photoactivity starting from the second run, with a strong decrease in the kinetic constant over the seven cycles of test (Figure 8b). The coating features a lower photocatalytic stability, thus suffering from poor adhesion upon immersion in the tested solutions. This is confirmed by kinetic curves showing a lower linearity, being R2 in a range of 0.982–0.99 (Figure 9b). The maximum photocatalytic efficiency was reached only at the first run, after which a sharp decrease was registered. Apparent reaction rate constant dropped over the first and second runs from 0.32 h−1 to 0.14 h−1, then decreasing progressively until the seventh run (0.07 h−1). Photodegradation percentage decreased as well, from 84% to 34% after seven runs.
The high photoactivity of annealed samples and the progressive loss in efficiency for nonannealed samples was ascribed to a different adhesion of the coating on the substrate, i.e., a different weight loss rate for the considered conditions. This was confirmed by the coating weight profile over seven runs for both nonannealed and annealed coatings (Figure 10). Such findings were further confirmed using SEM images, indicating very small coating losses on the annealed sample in contrast with larger areas of coating spalling observed on the nonannealed one (Figure 11).
Results clearly showed that a significant weight loss was assessed on nonannealed samples between the first and the second cycle, after which the coating gradually kept releasing TiO2 nanoparticles in the solution until reaching a very low coating weight (0.3 mg) after seven runs. This trend justified the sharp decrease in photocatalysis kinetics between the first and second run. The most significant mass lost took place before the fourth cycle, after which the remaining amount of TiO2 seemed to be more adherent on the substrate. Conversely, annealed samples showed a better adhesion; indeed, a weight loss of 25% was recorded over seven runs of immersion in a stirred solution followed by rinsing and drying, passing from 1.1 mg to 0.8 mg, which is coherent with the decrease in kinetic constant from 0.41 to 0.3 h−1. The lower TiO2 loss justifies the more stable trend in photocatalysis kinetics, suggesting that the annealing treatment strongly promote the adherence on the glass substrate.

2.5. Spectrophotometric Analyses

Spectrophotometric analyses were performed to examine possible color modifications or gloss variations induced by the coating that may vary the aesthetic appearance of the substrates by monitoring ΔE*. For ΔE* values lower than 1, the coating can be considered transparent and colorless, ΔE* values between 1 and 10 implies some alterations, while ΔE* values higher than 10 mean a strong color change.
The collected color coordinates (a*, b*, L*) and the relative differences (Δa*, Δb* and ΔE*) are shown in Tables S1–S3. The total variation before and after photocatalysis were taken into account using the uncoated sample as reference, where the first value is indicative of coating aesthetic quality, while the latter indicates possible residual dye adsorbed at the sample surface.
Results showed that the overall ΔE* variation prior photocatalysis process falls in a range of 3–8, this indicating that alterations influence the sample aesthetic. This was ascribed to the fact that the starting sol transparency decreased during the aging period due to crystallites formation, so that its deposition on glass substrates inevitably caused the formation of a white patina. Even more, coatings resulted inhomogeneous, which is connected to the low evaporation kinetics and wettability of water-based sols, leading to the formation of areas in which titanium dioxide seemed to be more concentrated.
In the evaluated conditions, Δa* and Δb* values were negligible, being generally lower than 1 and confirming that color variations were related with surface whitening, as also observable with the naked eye (Figure S7a,b). Moreover, negligible Δa* and Δb* after photocatalytic tests allow to exclude relevant RhB or MB adsorption phenomena.
Color was significantly affected by the number of dips (Table S1); this was ascribed to an increasing amount of deposited sol on the substrate passing from 1 to 2 layers. No relevant further variation was seen with a third layer deposited. Moreover, the effects of dipping speed (Table S2) and annealing temperature (Table S3) were assessed. Results show that the less intense color variations were observed at low deposition speed; this was ascribed to the fact that sol has more time to flow down and redistribute on the surface, thus increasing the homogeneity of the deposited layer. Instead, annealing temperatures higher than 60 °C led to a lightness decrease (ΔL* > 2), suggesting that water evaporation more than crystallization is responsible for color variations.

3. Materials and Methods

3.1. Materials

Titanium (IV) isopropoxide (97%) (TTIP), glacial acetic acid (≥ 99%) (CH3COOH), rhodamine B (RhB) and methylene blue (MB) were purchased from Sigma Aldrich (Milan, Italy). All the reagents used in this research were analytical grade and they were used without further purifications. Deionized water (DI) was used throughout the research.

3.2. Synthesis of Sol

For the preparation of the green TiO2 sol TTIP was used as precursor, deionized DI as solvent and acetic acid as catalyst, chelating agent and peptizing agent. No surfactants were used in the synthesis.
TiO2 sol was prepared by adding dropwise 6 g of acetic acid into 5.7 g of TTIP in a 1:5 Ti:CH3COOH molar ratio at room temperature.
The TTIP and acetic acid solution was left under vigorous magnetic stirring for 2 min to achieve complete homogenization; subsequently, the precursor was hydrolyzed by slowly adding an excess of DI (36 g), thus instantaneously showing a whitish precipitate. However, the sol became lighter after about 10 min of stirring due to the peptizing effect of acetic acid, which converted precipitates into a colloidal solution. The mixture was then vigorously stirred for five hours at room temperature to allow the formation of a stable and transparent sol.
The so-formed sol was then aged for 6 weeks at ambient conditions to allow the formation of TiO2 nanoparticles. In this sol–gel route, the molar ratio of the reactants was TTIP:H2O:acetic acid = 1:100:5, being the TTIP molarity of 0.45 M. The concentration of the precursor has significant effects on TiO2 crystallinity and crystallite size; in particular, an increased concentration leads to higher photocatalytic activity [31]. For this reason, higher precursor: water ratios were tested, but precipitation occurred, hence those formulations were discarded.

3.3. Deposition of Thin Films

The so-formed TiO2 sol was deposited on 2.5 × 2.5 × 0.2 cm3 glass plates using the dip-coating method.
Glass was degreased in ultrasonic bath for 10 min with acetone to remove all impurities, washed with DI and dried prior to deposition.
A custom dip-coater machine was used, managed by Arduino. During the experimental stage, the dipping immersion was always equal to the dipping withdrawal speed, with a fixed dwelling time of 5 s and a fixed dipping angle of 90° in agreement with previous work [53]. Different number of dips (1, 2 and 3, with a drying period of 30 min in between) and different dipping speeds (60 mm/min, 120 mm/min, 180 mm/min and 240 mm/min) were selected to evaluate the effects of these parameters on the photocatalytic activity of the TiO2 thin films obtained. After deposition, films were allowed a consolidation phase at different temperatures (room temperature, 60 °C, 100 °C, 300 °C, 500 °C and 600 °C) and different duration (1 h, 2 h, 3 h and 6 h). The annealing at 60 °C lasted 8 h to improve the film adherence on the substrate, while room temperature consolidation lasted at least 24 h.
A dipping immersion and withdrawal speed of 120 mm/min, a number of dips equal to 2 and a calcination treatment of 500 °C for 2 h on glass samples were selected as reference conditions for the comparison of different samples. The evaluated conditions are summarized in Table 2.

3.4. Characterization of TiO2 Thin Films

The structure and morphology of the deposited TiO2 thin coatings were examined using scanning electron microscopy—SEM—with an EVO 50VP microscope (Carl Zeiss AG, Oberkochen, Germany), equipped with a Bruker energy-dispersive X-ray spectrometer for chemical microanalysis—EDS (Bruker, Billerica, MA, USA).
Coating thickness of both annealed and nonannealed samples was evaluated using cross-sectional SEM and laser profilometry with an UBM Microfocus UBR-200 LASER profilometer, collecting 500 points per mm of linear scan.
X-ray diffraction analyses—XRD—were performed on deposited samples to investigate crystallinity at different temperature and thermal treatment duration. Diffraction patterns were acquired using an Empyrean diffractometer (Malvern Panalytical, Malvern, UK) with Cu Kα radiation (1.54060 Å) operating at 40 kV and 40 mA in the in 2θ range 20–50° with a step size of 0.026°. When appropriate, crystallite size was evaluated at the strongest XRD lines according to Scherrer’s equation:
    D = K λ β cos θ
where D is the crystallite size (nm), K is the shape factor (0.94), λ is the wavelength of Cu Kα radiation (0.154 nm), β is the full-width at half-maximum (FWHM, rad) and θ is the Bragg’s angle of the phase under analysis (2θ of 25.3° for (101) anatase plane and 27.4° for (110) rutile plane) [31,52,54].
Spectrophotometric analyses to evaluate color or transparency variations caused by deposition, annealing and photocatalytic tests were performed by using a portable spectrophotometer Konika Minolta CM-2500d (Konica Minolta, Kontich, Belgium) working in reflectance mode (D65 artificial light source). The spectrophotometric measurements were performed on the bare glass, after each dip, after thermal treatment, and lastly after the photocatalytic test. Colorimetric parameters were collected and evaluated according to the CIELAB (1976) standard system in which each color can be represented by three coordinates a*, b* and L*, corresponding to colors ranging from green to red, yellow to blue and black to white, respectively. The color difference (ΔE*) was calculated according to the following equation:
Δ E * = Δ a * 2 + Δ b * 2 + Δ L * 2
where Δa*, Δb* and ΔL* refer to the differences in a*, b* and L*, respectively, before and after the process under consideration. As ΔE* value increases, color variation is more significant; color changes cannot be perceived by human eye when ΔE* value is lower than 1 [55,56]. To evaluate glass, color measurements were performed using a white tile as reference below the glass slide; any deviation from the initial color is then considered not only as color variation, but also as loss of transparency.

3.5. Photocatalytic Tests in Liquid Phase

The photoactivity of TiO2 coatings was evaluated in liquid phase by analyzing the photodegradation of two target pollutants, RhB and MB, under UV-A LED irradiation. In a typical experiment, each sample was tested in a built-in batch reactor containing 40 mL of RhB or MB water-based solution 10−5 M, under magnetic stirring in turbulent regime for solution homogenization. The experimental setup is reported in Figure S8. The photocatalyst was positioned at a fixed distance of 3 cm from the UV-A LED (Nichia NCSU033B, λ = 365 nm, UV-A intensity = 11.1 mW·cm−2, Tokushima, Japan), which was sustained by a 3D-printed PLA support. LED working conditions of 3.8 V and 500 mA were provided by an AIM PLH120 power supply. Tests were performed over 6 h, with absorbance measurements performed every 60 min with a UV-Vis spectrophotometer (Thermo Fisher Scientific SPECTRONIC 200E, Les Ulis, France) at 555 nm and 666 nm, which are the maximum absorbance peaks in the visible light range of RhB and MB, respectively.
Dye absorbance was correlated with its concentration using the Beer–Lambert law and, by assuming that a pseudo-first-order Langmuir–Hinshelwood kinetic model valid for low dye concentrations controls the photocatalytic degradation of both MB and RhB [19,57], the photodegradation apparent reaction rate constant was evaluated as follows:
        ln C C 0 = k app t
where C0 is the initial dye concentration, C the dye concentration at reaction time t and kapp the apparent rate constant, which is the slope of the curve ln(C/C0) versus t.
Finally, photocatalytic degradation (%) was evaluated using the following equation:
      Photocatalytic   degradation   % = C 0 C t C 0 × 100
where C0 is the initial dye concentration and Ct is the remaining concentration at reaction time t.
All samples reported in Table 1 were subjected to photocatalytic tests to evaluate the effect of operational parameters on the photodegradation of RhB. Moreover, the reference condition was analyzed by depositing the sol on either one side or both sides of the glass samples; these were used for carrying out photocatalysis tests in the presence of either RhB or MB to evaluate the effects of the exposed surface area.
The amount of deposited TiO2 was calculated by subtracting the mass of the bare glass from the mass of the sample after two dips and annealing at 500 °C for two hours. An analytical balance Sartorius PRACTUM124-1S (±0.1 mg) was used throughout this experimental work.
Separately, photolysis and adsorption experiments were performed by testing RhB and MB solution in the same experimental conditions previously described, the former under UV-A light in the absence of any photocatalyst, the latter in presence of photocatalyst but in dark conditions, to investigate possible side effects that may alter the evaluation of the photocatalytic activity. Both effects were considered negligible due to the small absorbance variations, especially if compared with photocatalytic degradation tests (Figure S9). The results proved that dye degradation is mainly ascribable to the photocatalytic process.
Photocatalytic activity was assessed by repeating each test at least twice on two separated samples to ensure reproducibility; the results were consistent, with a variation lower than 7%, which is in line with the error measured during photocatalysis tests with the experimental setup employed here [52].

3.6. Durability and Stability of TiO2 Thin Films

Reproducibility and repeatability tests were performed to evaluate the trend of the photocatalytic activity as the time of use increases, as well as the adhesion of the coating to the substrate in long-term use. Photocatalytic tests in RhB water-based solution were performed on two reference samples and on two as-deposited samples, i.e., not subjected to annealing, to evaluate the effects of calcination on the durability and stability of the coatings.
Each sample was tested in seven successive photocatalytic tests. At the end of each test, samples were washed with distilled water and dried with air, and then weighed to evaluate possible mass loss over the seven runs.

4. Conclusions

Photocatalytic TiO2 coatings were successfully deposited on glass substrates using the dip-coating method. The selected green sol–gel route allowed us to obtain stable and highly photoactive coatings, with full degradation of MB and almost full degradation on RhB, by employing a simple formulation that does not require the use of hazardous chemicals, in accordance with green chemistry principles. To obtain such photoactivity, a prolonged sol aging was needed to promote TiO2 crystallites formation.
Results showed a low coating homogeneity due to the low wettability of water on the substrates and its slow evaporation, particularly if compared with organic solvent-based sols. Nevertheless, acetic acid allowed us to obtain photoactive coatings even in absence of annealing treatment, thus enlarging the field of application of this sol to all heat-sensitive materials. Annealed coatings showed a slightly higher photocatalytic activity and, most importantly, better durability and stability over multiple runs of photocatalytic tests, with only slight deterioration after seven tests and related photocatalyst washing and drying, while on nonannealed samples the coating was almost completely removed after four runs. This suggests that annealing promotes the adhesion of TiO2 films to the substrate, allowing for their reuse several times.

Supplementary Materials

The following supporting information can be downloaded at: https://www.mdpi.com/article/10.3390/catal13030494/s1, Figure S1: Top-view SEM analyses of the TiO2 coating on glass samples as deposited (a) and after annealing at 500 °C for 2 h (b). It is possible to notice in both samples that there are some areas in which the TiO2 coating is lacking; Figure S2: (a) Top-view SEM analysis of the TiO2 coating on glass substrate as deposited. (b) EDS oxygen map. (c) EDS silicon map. (d) EDS titanium map. (e) EDS analysis of the area shown in figure (a); Figure S3: (a) Top-view SEM analysis of the TiO2 coating on glass substrate after annealing at 500 °C for 2 h. (b) EDS oxygen map. (c) EDS silicon map. (d) EDS titanium map. (e) EDS analysis of the area shown in figure (a); Figure S4: Laser profilometry on coated glass samples as deposited (a) and after annealing at 500 °C for 2 h (b); Figure S5: (a) Kinetics of RhB photocatalytic degradation for different annealing durations. (b) Effect of annealing duration on the photocatalysis kinetics and on the photocatalytic degradation percentage; Figure S6: Effect of coated sides on the photocatalysis kinetics of RhB and MB per unit of area; Figure S7: Visual aspect of TiO2 coatings on glass substrate as deposited (a) and after annealing (b); Figure S8: (a) Schematic representation of the batch reactor used in the present research. (b) Photo of the batch reactor used in the present research: Figure S9: Absorbance spectra of aqueous single-dye solutions (10−5 M) in the visible range before the degradation process, after 6 h of photolysis and after 6 h of photocatalysis under UV-A light. The impact of the photolysis process on the total photodegradation process is about 0.9% for RhB and 1.6% for MB; Table S1: Measured colorimetric parameters for different number of dips. The condition selected as reference is reported underlined; Table S2: Measured colorimetric parameters for different dipping speeds. The condition selected as reference is reported underlined; Table S3: Measured colorimetric parameters for different annealing temperatures. The condition selected as reference is reported underlined.

Author Contributions

Conceptualization, M.V.D.; methodology, U.B. and M.V.D.; validation, U.B.; investigation, D.S.; resources, B.D.C. and M.P.; visualization, U.B.; supervision, B.D.C., M.P. and M.V.D.; writing—original draft preparation, U.B.; writing—review and editing, M.V.D.; project administration, M.V.D. All authors have read and agreed to the published version of the manuscript.

Funding

This research received no external funding.

Data Availability Statement

Data available on request: The data presented in this study are mostly contained in the article; raw data are available on request from the corresponding author.

Conflicts of Interest

The authors declare no conflict of interest.

References

  1. Li, Y.H.; Cheng, S.W.; Yuan, C.S.; Lai, T.F.; Hung, C.H. Removing volatile organic compounds in cooking fume by nano-sized TiO2 photocatalytic reaction combined with ozone oxidation technique. Chemosphere 2018, 208, 808–817. [Google Scholar] [CrossRef] [PubMed]
  2. Manisalidis, I.; Stavropoulou, E.; Stavropoulos, A.; Bezirtzoglou, E. Environmental and Health Impacts of Air Pollution: A Review. Front. Public Health 2020, 8, 14. [Google Scholar] [CrossRef] [PubMed] [Green Version]
  3. Wang, X.; Jiang, J.; Gao, W. Reviewing textile wastewater produced by industries: Characteristics, environmental impacts, and treatment strategies. Water Sci. Technol. 2022, 85, 2076–2096. [Google Scholar] [CrossRef]
  4. Tsai, W. A Survey on Toxic Volatile Organic Compounds (VOCs): Toxicological Profiles, Health Exposure Risks, and Regulatory Strategies for Mitigating Emissions from Stationary Sources in Taiwan. Atmosphere 2023, 14, 242. [Google Scholar] [CrossRef]
  5. Al-Mamun, M.R.; Kader, S.; Islam, M.S.; Khan, M.Z.H. 209—Photocatalytic activity improvement and application of UV-TiO2 photocatalysis in textile wastewater treatment: A review. J. Environ. Chem. Eng. 2019, 7, 103248. [Google Scholar] [CrossRef]
  6. Krakowiak, R.; Musial, J.; Bakun, P.; Spychała, M.; Czarczynska-Goslinska, B.; Mlynarczyk, D.T.; Koczorowski, T.; Sobotta, L.; Stanisz, B.; Goslinski, T. Titanium dioxide-based photocatalysts for degradation of emerging contaminants including pharmaceutical pollutants. Appl. Sci. 2021, 11, 8674. [Google Scholar] [CrossRef]
  7. Abujazar, M.S.S.; Karaağaç, S.U.; Abu Amr, S.S.; Alazaiza, M.Y.D.; Bashir, M.J.K. Recent advancement in the application of hybrid coagulants in coagulation-flocculation of wastewater: A review. J. Clean. Prod. 2022, 345, 131133. [Google Scholar] [CrossRef]
  8. Lee, H.; Park, Y.K.; Jung, S.C. Preparation of N and Eu doped TiO2 using plasma in liquid process and its photocatalytic degradation activity for diclofenac. Korean J. Chem. Eng. 2022, 39, 2080–2088. [Google Scholar] [CrossRef]
  9. Rueda-Marquez, J.J.; Levchuk, I.; Fernández Ibañez, P.; Sillanpää, M. A critical review on application of photocatalysis for toxicity reduction of real wastewaters. J. Clean. Prod. 2020, 258, 120694. [Google Scholar] [CrossRef]
  10. Byrne, C.; Subramanian, G.; Pillai, S.C. Recent advances in photocatalysis for environmental applications. J. Environ. Chem. Eng. 2018, 6, 3531–3555. [Google Scholar] [CrossRef]
  11. Mahmoud, A.E.D. Recent Advances of TiO2 Nanocomposites for Photocatalytic Degradation of Water Contaminants and Rechargeable Sodium Ion Batteries. In Advances in Nanocomposite Materials for Environmental and Energy Harvesting Applications; Shalan, A.E., Hamdy Makhlouf, A.S., Lanceros-Méndez, S., Eds.; Springer International Publishing: Cham, Switzerland, 2022; pp. 757–770. ISBN 978-3-030-94319-6. [Google Scholar]
  12. Ajmal, Z.; ul Haq, M.; Naciri, Y.; Djellabi, R.; Hassan, N.; Zaman, S.; Murtaza, A.; Kumar, A.; Al-Sehemi, A.G.; Algarni, H.; et al. Recent advancement in conjugated polymers based photocatalytic technology for air pollutants abatement: Cases of CO2, NOx, and VOCs. Chemosphere 2022, 308, 136358. [Google Scholar] [CrossRef] [PubMed]
  13. Pant, B.; Park, M.; Park, S.J. Recent advances in TiO2 films prepared by sol-gel methods for photocatalytic degradation of organic pollutants and antibacterial activities. Coatings 2019, 9, 613. [Google Scholar] [CrossRef] [Green Version]
  14. Diamanti, M.V.; Lorenzi, A. Nanostructured Titanium Dioxide Films: Sol-Gel and Other Techniques. In Dekker Encyclopedia of Nanoscience and Nanotechnology; CRC Press: Boca Raton, FL, USA, 2014; pp. 37–41. [Google Scholar] [CrossRef]
  15. Peng, T.; Lalman, J.A. TiO2 Nanomaterials for Enhanced Photocatalysis. In Catalysis by Metal Complexes and Nanomaterials: Fundamentals and Applications; ACS Symposium Series; American Chemical Society: Washington, DC, USA, 2019; Volume 1317, pp. 135–165, SE–7; ISBN 9780841234376. [Google Scholar]
  16. Esposito, S. “Traditional” sol-gel chemistry as a powerful tool for the preparation of supported metal and metal oxide catalysts. Materials 2019, 12, 668. [Google Scholar] [CrossRef] [PubMed] [Green Version]
  17. Cui, H.; Zayat, M.; Levy, D. Sol-gel synthesis of nanoscaled spinels using propylene oxide as a gelation agent. J. Sol-Gel Sci. Technol. 2005, 35, 175–181. [Google Scholar] [CrossRef]
  18. Cui, H.; Ren, W.; Wang, W. Highly transparent UV absorption TiO2-SiO2-Fe2O3 films without oxidation catalytic activity prepared by a room temperature sol-gel route. J. Sol-Gel Sci. Technol. 2011, 58, 476–480. [Google Scholar] [CrossRef]
  19. Bellè, U.; Invernizzi, M.; Polvara, E.; Lucotti, A.; Diamanti, M.V.; Sironi, S.; Pedeferri, M.P. A novel nanotubular TiO2-based Plug-Flow reactor for gas phase photocatalytic degradation of toluene. Chem. Eng. J. 2022, 437, 135323. [Google Scholar] [CrossRef]
  20. Pala, L.P.R.; Uday, V.; Gogoi, D.; Peela, N.R. Surface and photocatalytic properties of TiO2 thin films prepared by non-aqueous surfactant assisted sol-gel method. J. Environ. Chem. Eng. 2020, 8, 104267. [Google Scholar] [CrossRef]
  21. Bernardes, J.C.; Müller, D.; Pinheiro, G.K.; Rambo, C.R. Enhancing the optical transparency of TiO2 aerogels with high surface area through water-based synthesis. Opt. Mater. 2020, 109, 110359. [Google Scholar] [CrossRef]
  22. Pathan, H.M.; Min, S.K.; Desai, J.D.; Jung, K.D.; Joo, O.S. Preparation and characterization of titanium dioxide thin films by SILAR method. Mater. Chem. Phys. 2006, 97, 5–9. [Google Scholar] [CrossRef]
  23. Khade, G.V.; Suwarnkar, M.B.; Gavade, N.L.; Garadkar, K.M. Green synthesis of TiO2 and its photocatalytic activity. J. Mater. Sci. Mater. Electron. 2015, 26, 3309–3315. [Google Scholar] [CrossRef]
  24. Siwińska-Stefańska, K.; Zdarta, J.; Paukszta, D.; Jesionowski, T. The influence of addition of a catalyst and chelating agent on the properties of titanium dioxide synthesized via the sol–gel method. J. Sol-Gel Sci. Technol. 2015, 75, 264–278. [Google Scholar] [CrossRef] [Green Version]
  25. Simonsen, M.E.; Søgaard, E.G. Sol-gel reactions of titanium alkoxides and water: Influence of pH and alkoxy group on cluster formation and properties of the resulting products. J. Sol-Gel Sci. Technol. 2010, 53, 485–497. [Google Scholar] [CrossRef] [Green Version]
  26. Attar, A.S.; Ghamsari, M.S.; Hajiesmaeilbaigi, F.; Mirdamadi, S. Modifier ligands effects on the synthesized TiO2 nanocrystals. J. Mater. Sci. 2008, 43, 1723–1729. [Google Scholar] [CrossRef]
  27. Doeuff, S.; Henry, M.; Sanchez, C.; Livage, J. Hydrolysis of titanium alkoxides: Modification of the molecular precursor by acetic acid. J. Non. Cryst. Solids 1987, 89, 206–216. [Google Scholar] [CrossRef]
  28. Maeng, W.Y.; Yoo, M. Effect of chelating agents on the stability of nano-TiO2 sol particles for sol-gel coating. J. Nanosci. Nanotechnol. 2015, 15, 8429–8433. [Google Scholar] [CrossRef]
  29. Javed, S.; Islam, M.; Mujahid, M. Synthesis and characterization of TiO2 quantum dots by sol gel reflux condensation method. Ceram. Int. 2019, 45, 2676–2679. [Google Scholar] [CrossRef]
  30. Muniandy, S.S.; Mohd Kaus, N.H.; Jiang, Z.T.; Altarawneh, M.; Lee, H.L. Green synthesis of mesoporous anatase TiO2 nanoparticles and their photocatalytic activities. RSC Adv. 2017, 7, 48083–48094. [Google Scholar] [CrossRef] [Green Version]
  31. Yazid, S.A.; Rosli, Z.M.; Juoi, J.M. Effect of titanium (IV) isopropoxide molarity on the crystallinity and photocatalytic activity of titanium dioxide thin film deposited via green sol-gel route. J. Mater. Res. Technol. 2019, 8, 1434–1439. [Google Scholar] [CrossRef]
  32. Muthee, D.K.; Dejene, B.F. The effect of tetra isopropyl orthotitanate (TIP) concentration on structural, and luminescence properties of titanium dioxide nanoparticles prepared by sol-gel method. Mater. Sci. Semicond. Process. 2020, 106, 104783. [Google Scholar] [CrossRef]
  33. Fagnern, N.; Leotphayakkarat, R.; Chawengkijwanich, C.; Gleeson, M.P.; Koonsaeng, N.; Sanguanruang, S. Effect of titanium-tetraisopropoxide concentration on the photocatalytic efficiency of nanocrystalline thin films TiO2 used for the photodegradation of textile dyes. J. Phys. Chem. Solids 2012, 73, 1483–1486. [Google Scholar] [CrossRef]
  34. Johari, N.D.; Rosli, Z.M.; Juoi, J.M.; Yazid, S.A. Comparison on the TiO2 crystalline phases deposited via dip and spin coating using green sol-gel route. J. Mater. Res. Technol. 2019, 8, 2350–2358. [Google Scholar] [CrossRef]
  35. Muñiz-Serrato, O.; Serrato-Rodríguez, J. Nanostructuring anatase through the addition of acetic acid by the sol-gel low temperature aqueous processing. Ceram. Int. 2014, 40, 8631–8635. [Google Scholar] [CrossRef]
  36. Visuttipitukul, P.; Sooksaen, P.; Yongvanich, N. Sol-gel synthesis of SrTiO3 nanoparticles using acetic acid as a chelating agent. Ferroelectrics 2013, 457, 82–88. [Google Scholar] [CrossRef]
  37. Cihlar, J.; Navarro, L.K.T.; Cihlar, J.; Kasparek, V.; Michalicka, J.; Castkova, K.; Lazar, I.; Kastyl, J.; Celko, L.; Vesely, M.; et al. Influence of substituted acetic acids on “bridge” synthesis of highly photocatalytic active heterophase TiO2 in hydrogen production. J. Sol-Gel Sci. Technol. 2022, 105, 471–488. [Google Scholar] [CrossRef]
  38. Su, C.; Hong, B.Y.; Tseng, C.M. Sol-gel preparation and photocatalysis of titanium dioxide. Catal. Today 2004, 96, 119–126. [Google Scholar] [CrossRef]
  39. Mahmoud, H.A.; Narasimharao, K.; Ali, T.T.; Khalil, K.M.S. Acidic peptizing agent effect on anatase-rutile ratio and photocatalytic performance of TiO2 nanoparticles. Nanoscale Res. Lett. 2018, 13, 48. [Google Scholar] [CrossRef] [PubMed]
  40. Mahy, J.G.; Lejeune, L.; Haynes, T.; Lambert, S.D.; Marcilli, R.H.M.; Fustin, C.A.; Hermans, S. Eco-friendly colloidal aqueous sol-gel process for TiO2 synthesis: The peptization method to obtain crystalline and photoactive materials at low temperature. Catalysts 2021, 11, 768. [Google Scholar] [CrossRef]
  41. Vinogradov, A.V.; Vinogradov, V.V. Low-temperature sol-gel synthesis of crystalline materials. RSC Adv. 2014, 4, 45903–45919. [Google Scholar] [CrossRef]
  42. Vinogradov, A.V.; Vinogradov, V.V. Effect of acidic peptization on formation of highly photoactive TiO2 films prepared without heat treatment. J. Am. Ceram. Soc. 2014, 97, 290–294. [Google Scholar] [CrossRef]
  43. Luttrell, T.; Halpegamage, S.; Tao, J.; Kramer, A.; Sutter, E.; Batzill, M. Why is anatase a better photocatalyst than rutile?—Model studies on epitaxial TiO2 films. Sci. Rep. 2015, 4, 4043. [Google Scholar] [CrossRef] [Green Version]
  44. Alavi, S.; Bazrafshan, H.; Nikazar, M. An investigation into the simultaneous influence of withdrawal speed and number of coated layers on photocatalytic activity of ZnO thin films. J. Sol-Gel Sci. Technol. 2017, 81, 652–661. [Google Scholar] [CrossRef]
  45. Ceratti, D.R.; Louis, B.; Paquez, X.; Faustini, M.; Grosso, D. A New Dip Coating Method to Obtain Large-Surface Coatings with a Minimum of Solution. Adv. Mater. 2015, 27, 4958–4962. [Google Scholar] [CrossRef] [PubMed]
  46. Malengreaux, C.M.; Timmermans, A.; Pirard, S.L.; Lambert, S.D.; Pirard, J.P.; Poelman, D.; Heinrichs, B. Optimized deposition of TiO2 thin films produced by a non-aqueous sol-gel method and quantification of their photocatalytic activity. Chem. Eng. J. 2012, 195–196, 347–358. [Google Scholar] [CrossRef] [Green Version]
  47. Jongnavakit, P.; Amornpitoksuk, P.; Suwanboon, S.; Ratana, T. Surface and photocatalytic properties of ZnO thin film prepared by sol-gel method. Thin Solid Films 2012, 520, 5561–5567. [Google Scholar] [CrossRef]
  48. Hwang, J.; Shoji, N.; Endo, A.; Daiguji, H. Effect of withdrawal speed on film thickness and hexagonal pore-array dimensions of SBA-15 mesoporous silica thin film. Langmuir 2014, 30, 15550–15559. [Google Scholar] [CrossRef] [PubMed]
  49. Lee, S.Y.; Park, S.J. TiO2 photocatalyst for water treatment applications. J. Ind. Eng. Chem. 2013, 19, 1761–1769. [Google Scholar] [CrossRef]
  50. Ahmad, R.; Ahmad, Z.; Khan, A.U.; Mastoi, N.R.; Aslam, M.; Kim, J. Photocatalytic systems as an advanced environmental remediation: Recent developments, limitations and new avenues for applications. J. Environ. Chem. Eng. 2016, 4, 4143–4164. [Google Scholar] [CrossRef]
  51. Pelaez, M.; Nolan, N.T.; Pillai, S.C.; Seery, M.K.; Falaras, P.; Kontos, A.G.; Dunlop, P.S.M.; Hamilton, J.W.J.; Byrne, J.A.; O’Shea, K.; et al. A review on the visible light active titanium dioxide photocatalysts for environmental applications. Appl. Catal. B Environ. 2012, 125, 331–349. [Google Scholar] [CrossRef] [Green Version]
  52. Bellè, U.; Pelizzari, F.; Lucotti, A.; Castiglioni, C.; Ormellese, M.; Pedeferri, M.; Diamanti, M.V. Immobilized Nano-TiO2 photocatalysts for the degradation of three organic dyes in single and multi-dye solutions. Coatings 2020, 10, 919. [Google Scholar] [CrossRef]
  53. Mokhtarifar, M.; Kaveh, R.; Bagherzadeh, M.; Lucotti, A.; Pedeferri, M.P.; Diamanti, M.V. Heterostructured TiO2/SiO2/γ-Fe2O3/rGO Coating with Highly Efficient Visible-Light-Induced Self-Cleaning Properties for Metallic Artifacts. ACS Appl. Mater. Interfaces 2020, 12, 29671–29683. [Google Scholar] [CrossRef]
  54. Wiranwetchayan, O.; Promnopat, S.; Thongtem, T.; Chaipanich, A.; Thongtem, S. Effect of polymeric precursors on the properties of TiO2 films prepared by sol-gel method. Mater. Chem. Phys. 2020, 240, 122219. [Google Scholar] [CrossRef]
  55. Diamanti, M.V.; Pozzi, P.; Randone, F.; Del Curto, B.; Pedeferri, M.P. Robust anodic colouring of titanium: Effect of electrolyte and colour durability. Mater. Des. 2016, 90, 1085–1091. [Google Scholar] [CrossRef] [Green Version]
  56. García, O.; Malaga, K. Definition of the procedure to determine the suitability and durability of an anti-graffiti product for application on cultural heritage porous materials. J. Cult. Herit. 2012, 13, 77–82. [Google Scholar] [CrossRef]
  57. Ćurković, L.; Ljubas, D.; Šegota, S.; Bačić, I. Photocatalytic degradation of Lissamine Green B dye by using nanostructured sol-gel TiO2 films. J. Alloys Compd. 2014, 604, 309–316. [Google Scholar] [CrossRef]
Figure 1. SEM analyses of the TiO2 coating on glass samples. (a) As deposited. (b) After annealing at 500 °C for 2 h. (c) Thickness of as-deposited coating. (d) Thickness of coating after annealing at 500 °C for 2 h.
Catalysts 13 00494 g001aCatalysts 13 00494 g001b
Figure 2. XRD patterns of coatings annealed at different temperatures.
Catalysts 13 00494 g002
Figure 3. XRD patterns of coatings annealed at 500 °C with different durations.
Catalysts 13 00494 g003
Figure 4. (a) RhB and MB concentration profiles versus irradiation time in presence of reference photocatalyst. (b) Effect of sol aging on photocatalysis kinetics of rhodamine B and its degradation percentage.
Catalysts 13 00494 g004
Figure 5. (a) Effect of dipping speed on photocatalysis kinetics and degradation percentage; (b) effect of number of dips on photocatalysis kinetics and degradation percentage.
Catalysts 13 00494 g005
Figure 6. (a) Kinetics of RhB photocatalytic degradation for different annealing temperatures. (b) Effect of annealing temperature on photocatalysis kinetics and degradation percentage.
Catalysts 13 00494 g006
Figure 7. Effect of coated surface area on photocatalysis kinetics of RhB and MB.
Catalysts 13 00494 g007
Figure 8. (a) Concentration–time curves for two different annealed samples and its average over seven runs; (b) concentration–time curves for two different nonannealed samples and its average over seven runs.
Catalysts 13 00494 g008
Figure 9. (a) Photocatalysis kinetics and degradation percentage for annealed samples over seven runs; (b) photocatalysis kinetics and degradation percentage for nonannealed samples over seven runs.
Catalysts 13 00494 g009aCatalysts 13 00494 g009b
Figure 10. Photocatalysis kinetics and coating weight for nonannealed (a) and annealed (b) coatings over 7 runs.
Catalysts 13 00494 g010
Figure 11. SEM images of annealed coatings before (a) and after (b) annealing, and of nonannealed coatings before (c) and after (d) annealing.
Catalysts 13 00494 g011
Table 1. Anatase crystallite sizes at different annealing temperatures. At room temperature and 100 °C, no crystallite size was calculated due to poor peak definition.
Thermal Treatment
Temperature (°C)
Anatase Crystallite
Size (nm)
Room Temperaturen.a.1
100n.a.1
3007.9
50013.9
60016.1
n.a.1—not available.
Table 2. List of evaluated conditions for thin film deposition on glass. The reference one is reported in italic as first condition.
Number of DipsDipping Speed (mm/min)Annealing
Temperature (°C)
Annealing Duration (h)
21205002
21205001
2
3
6
2120Room temperature2
60
100
300
500
600
2605002
120
180
240
11205002
2
3
Disclaimer/Publisher’s Note: The statements, opinions and data contained in all publications are solely those of the individual author(s) and contributor(s) and not of MDPI and/or the editor(s). MDPI and/or the editor(s) disclaim responsibility for any injury to people or property resulting from any ideas, methods, instructions or products referred to in the content.

