Article

Enhanced Titania Photocatalyst on Magnesium Oxide Support Doped with Molybdenum

by
Anatoly Kulak
1,* and
Alexander Kokorin
2,3,4
1
Institute of General and Inorganic Chemistry, National Academy of Sciences of Belarus, Surganova str. 9/1, 220072 Minsk, Belarus
2
Department of Dynamics of Chemical and Biological Processes, N.N. Semenov Federal Research Center for Chemical Physics, Russian Academy of Sciences, Kosygin str. 4, 119991 Moscow, Russia
3
Department of Chemistry, Plekhanov Russian University of Economics, Stremyannyi per. 36, 115093 Moscow, Russia
4
Infochemistry Scientific Center, ITMO University, Lomonosova str. 9, 191002 St. Petersburg, Russia
*
Author to whom correspondence should be addressed.
Catalysts 2023, 13(3), 454; https://doi.org/10.3390/catal13030454
Submission received: 11 November 2022 / Revised: 9 February 2023 / Accepted: 15 February 2023 / Published: 21 February 2023
(This article belongs to the Special Issue Catalysts and Photocatalysts Based on Mixed Metal Oxides)

Abstract

:
Titania photocatalysts supported on mesoporous MgO carriers doped with Mo(VI) ions were prepared and characterized by XRD, BET nitrogen adsorption, FT-IR, and EPR methods. The photocatalytic activity was evaluated by bleaching an aqueous dye solution in the presence of a dispersed photocatalyst and by bleaching the dry surface of a solid tablet of photocatalyst using rhodamine B and nigrosin as model organic pollutants. It was established that TiO2 photocatalyst based on MgO carrier doped with 1 wt.% Mo(VI) ions, with the ratio of MgO:TiO2 = 1:0.5, possessed the highest activity under UV radiation. The increase in the content of molybdenum up to 10 wt.% leads to the formation of a MoO3 nanophase on the MgO surface, the formation of an isotype nn heterojunction at the MoO3/TiO2 interface, and photocatalytic activity under the action of visible light.

Graphical Abstract

1. Introduction

Titanium dioxide is the most studied photocatalyst capable of destroying many organic substances under UV radiation and exhibiting the photoinduced superhydrophilicity; it is used in photocatalytic systems for water and air purification from organic impurities, as well as to produce self-cleaning building materials [1,2]. The use of micro- and nanoparticles of titanium dioxide in slurry photocatalytic reactors, although allows for achieving high efficiency of the water purification process, is associated with the need to ensure the complete extraction of the photocatalyst from the reaction medium upon completion of the process. Therefore, the development of a carrier-deposited titanium dioxide photocatalyst in the form of particles with sizes optimized for its removal by relatively simple methods such as settling, filtration, or centrifugation, is of considerable interest. Inactive in photo-induced processes titanium, aluminum, zirconium, magnesium phosphates [3], hydroxyapatite [4], silicon dioxide [5], zeolites [6,7], clays [8,9], as well as photoactive forming a semiconductor heterojunction at the interface [10] such as tungsten and molybdenum oxides [11,12], Fe2O3 [13], carbon nanotubes [14], CdS [15], Fe3O4 [16], ZnO [17], SnO2 [18], WO3 [19], (Ba, Sr)TiO3 [20], BiVO4 [21], VO2 [22], BiFeO3 [23], Cu2O [24], V2O5 [25] are used as carriers for titania photocatalysts.
To enhance the functional characteristics of a titania photocatalyst, in particular, increase activity and sensitization in the visible spectral region, is possible by doping it with various ions—vanadium [26,27], molybdenum [28], iron [29,30], chromium [31], etc. In this case, it is necessary to justify the optimal concentration of the introduced dopant, as its excess usually leads to enhanced recombination of photogenerated electron–hole pairs. It should be noted that a large number of original works on the combination of titanium dioxide with other components (carriers) and its doping are summarized in a number of reviews [32,33,34,35,36,37,38,39].
Nevertheless, a number of problems arising in the development of TiO2-based photocatalysts are still unresolved. In particular, the choice of a carrier could be limited by the release of extraneous, including environmentally undesirable ions, fragmented micro- and nanoparticles resulting from mechanical abrasion and photocorrosion, erosion, and chemical corrosion during the operation of the deposited photocatalyst [40,41]. Doping of titania with metal ions, atoms, or nanoparticles also has limitations related to the gradual removal of doping ions from the surface of the photocatalyst, it is poisoning due to the binding of doping ions into stable chemical compounds, for example, by sulfide ions, and, as a rule, a relatively narrow range of dopant concentrations in which it shows high activity.
The purpose of this work was to study the doping of the deposited titanium dioxide photocatalyst by introducing a doping agent into the volume of the inert carrier rather than onto the surface or into the near-surface TiO2 layer. The Mo(VI) ion capable of incorporating into the TiO2 lattice or entering the photocatalyst as a MoO3 nanophase, was chosen as a dopant.
It should be noted that a number of studies have shown that doping of TiO2 with molybdenum increased the activity of the photocatalyst in the photodegradation of organic compounds including exposure to visible light [42,43] and provided high antimicrobial activity [44]. In addition, the formation of MoO3-TiO2 heterostructure made it possible to carry out the process of water splitting [45], the shifting process of organic dyes photodestruction [46,47] to the visible light region, in the form of nanofibers [48], thin films [49], Langmuir–Blodgett films [50] and for photocatalytic energy-storage systems [51]. Some studies have demonstrated the inhibitory effect of Mo ions and MoO3 on TiO2 photocatalysts. Thus, the MoO3-TiO2 photocatalyst showed lower activity as compared to the initial TiO2 in photodestruction of 2-propanol [52], doping of TiO2 with V5+ ions reduced the photoactivity in chlorpyrifos oxidation [53], deposition of MoO3 shell on the surface of TiO2 core also led to reducing in photoactivity due to the loss of photogenerated charge carriers involved them in electrochromic processes in the MoO3 layer [54]. The examples illustrate the sensitivity of the TiO2 photocatalyst both to the doping method with molybdenum and to its specific content in the photocatalyst.
The choice of magnesium oxide MgO as a photocatalyst carrier is based on the combination of its photochemical inertness and complete environmental safety of Mg2+ ions that can be released into the treated medium, the possibility to obtain mesoporous materials with high specific surface area by fairly simple methods, as well as its optical transparency and the absence of negative involvement in the recombination of charge carriers photogenerated in TiO2 layer.
It is worth noting that as a component of the TiO2-MgO photocatalyst, magnesium oxide was used as a coating on the porous TiO2 microspheres during CO2 photo-reduction [55]; TiO2/MgO bilayer was tested during the oxidation of 2-chlorophenol, 2,4-dichlorophenol (2,4-DCP) and 4-aminobenzoic acid in an aqueous solution [56]; mixed oxides with a low MgO content (1–2 mol%) were found to be more UV-active photocatalysts than Degussa P25 during acetaldehyde degradation [57], and in dye-sensitized solar cells [58].
In this work, the MgO carrier was synthetized by a method that provides a mesoporous structure and a high specific surface area, which ensure extensive contact with the TiO2 coating and enhance the contribution of molybdenum doping ions or MoO3 nanophase to photocatalytic processes on the TiO2 surface.

2. Results and Discussion

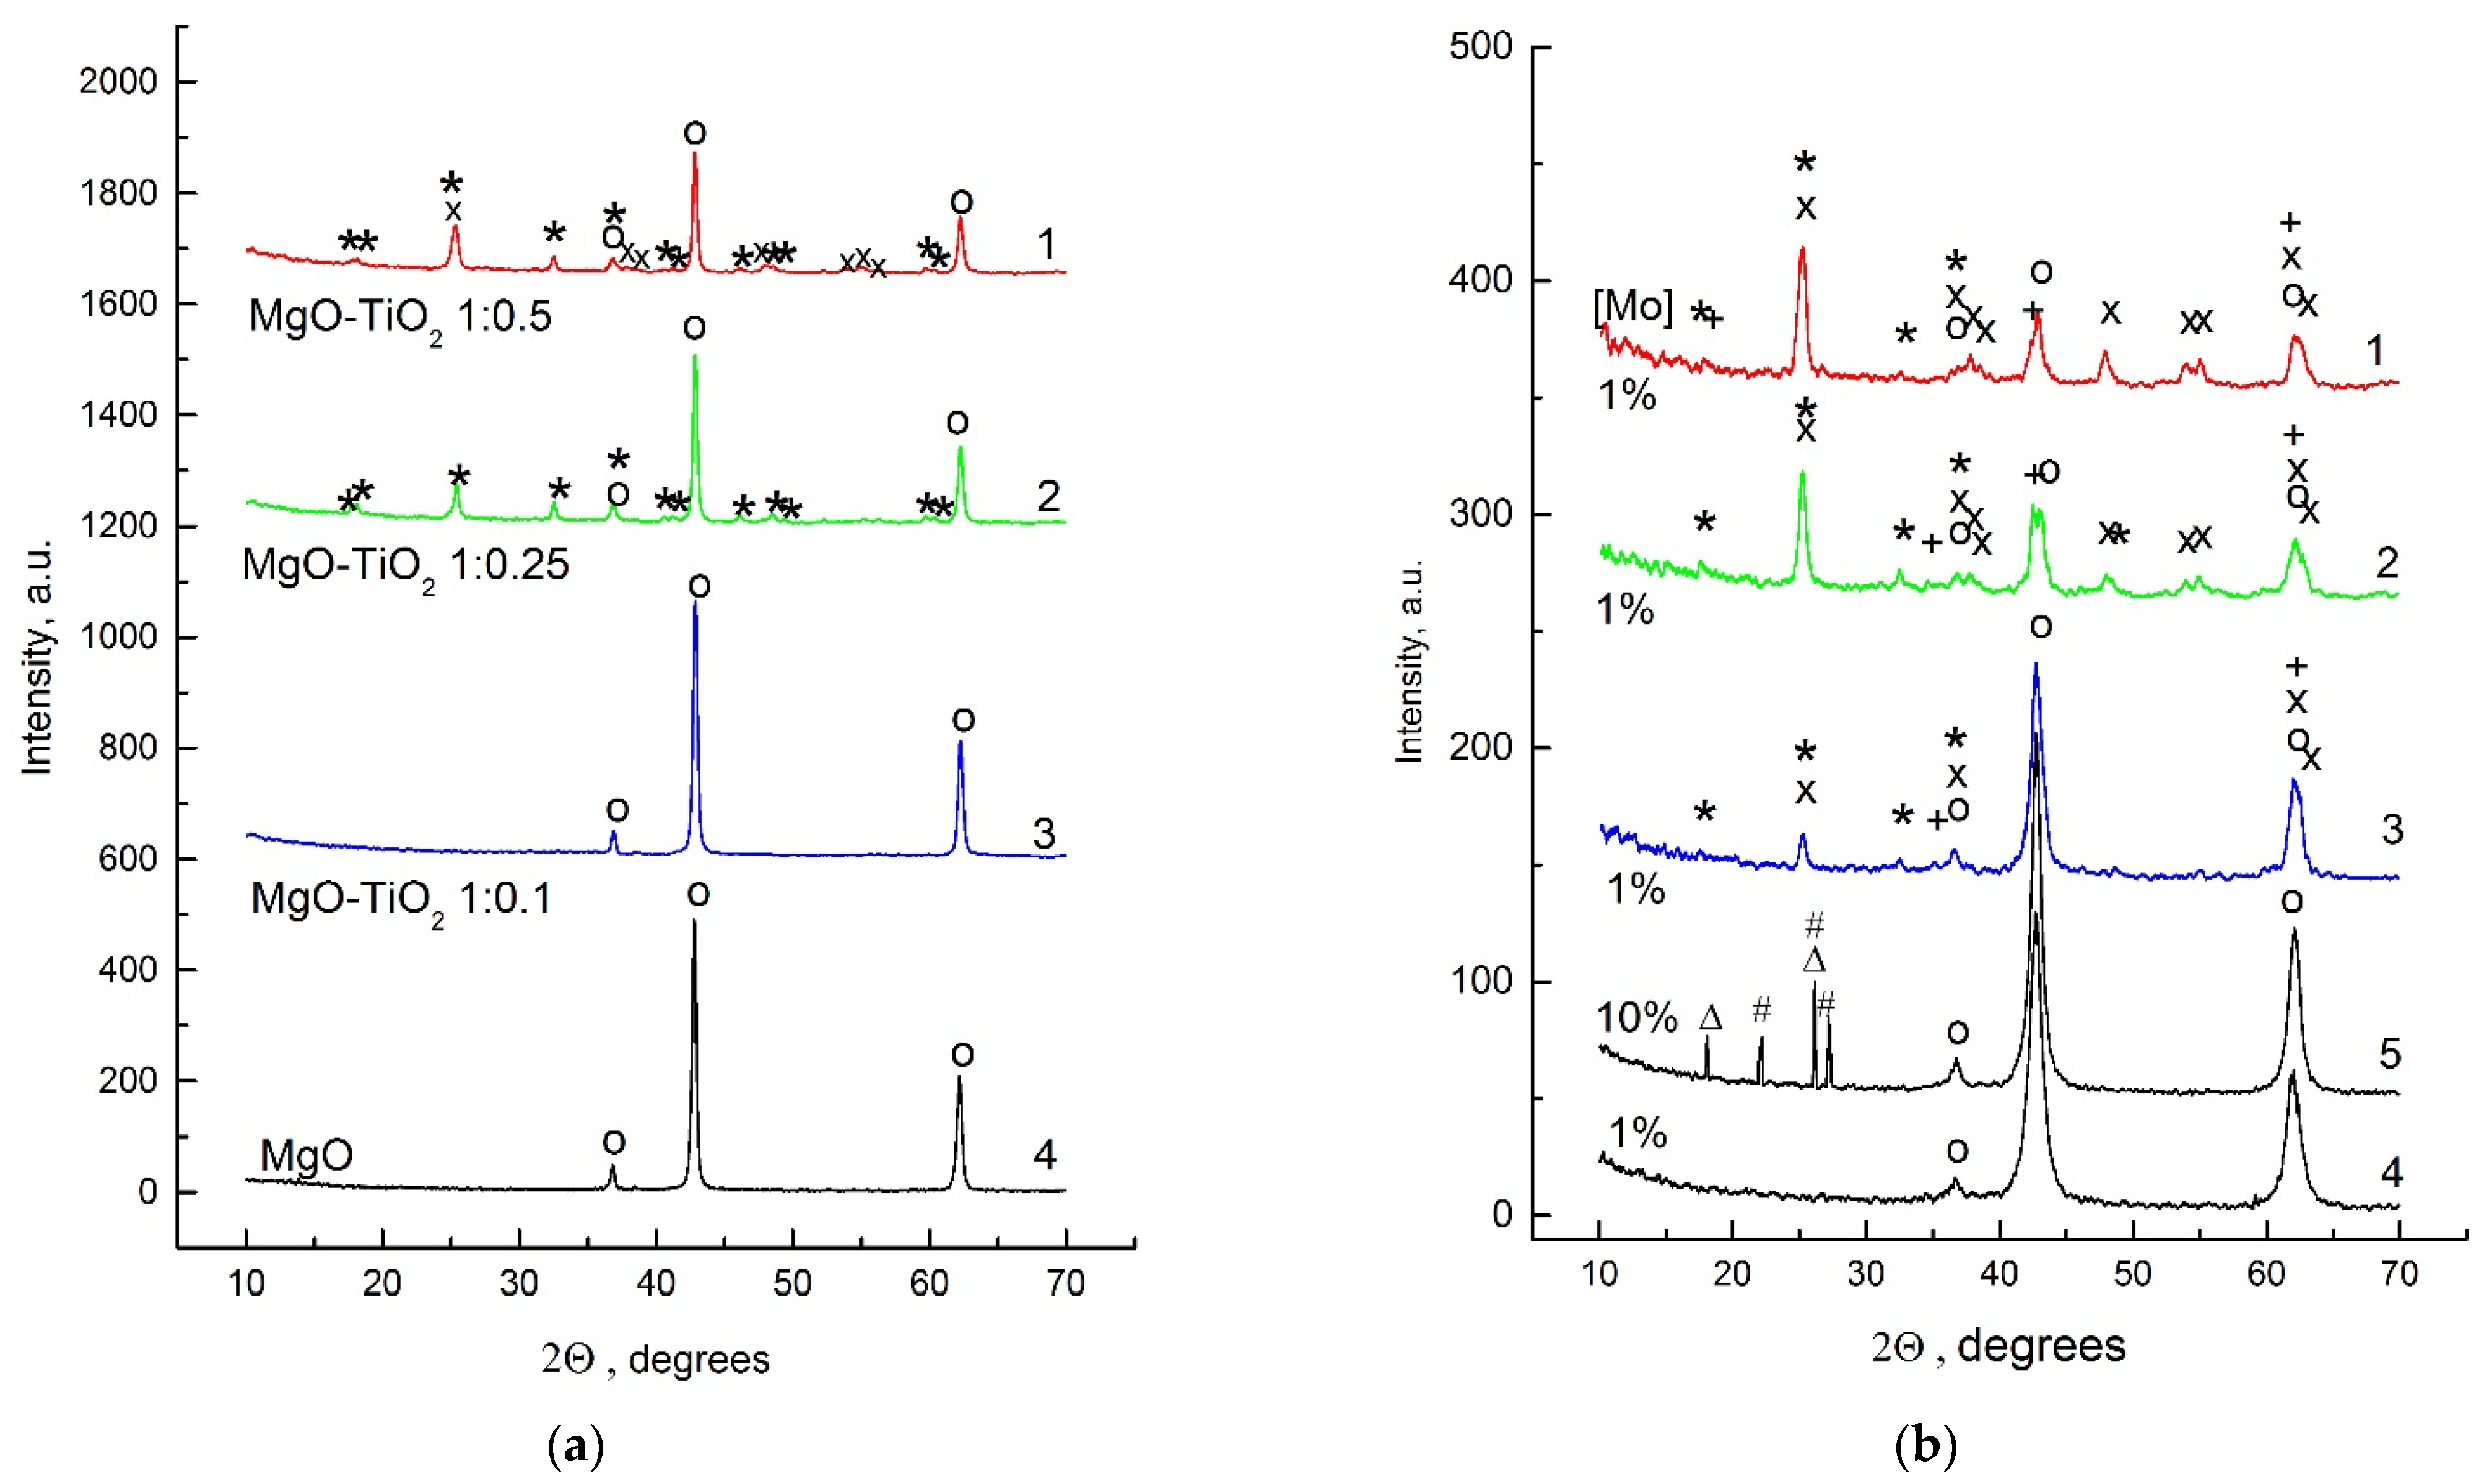
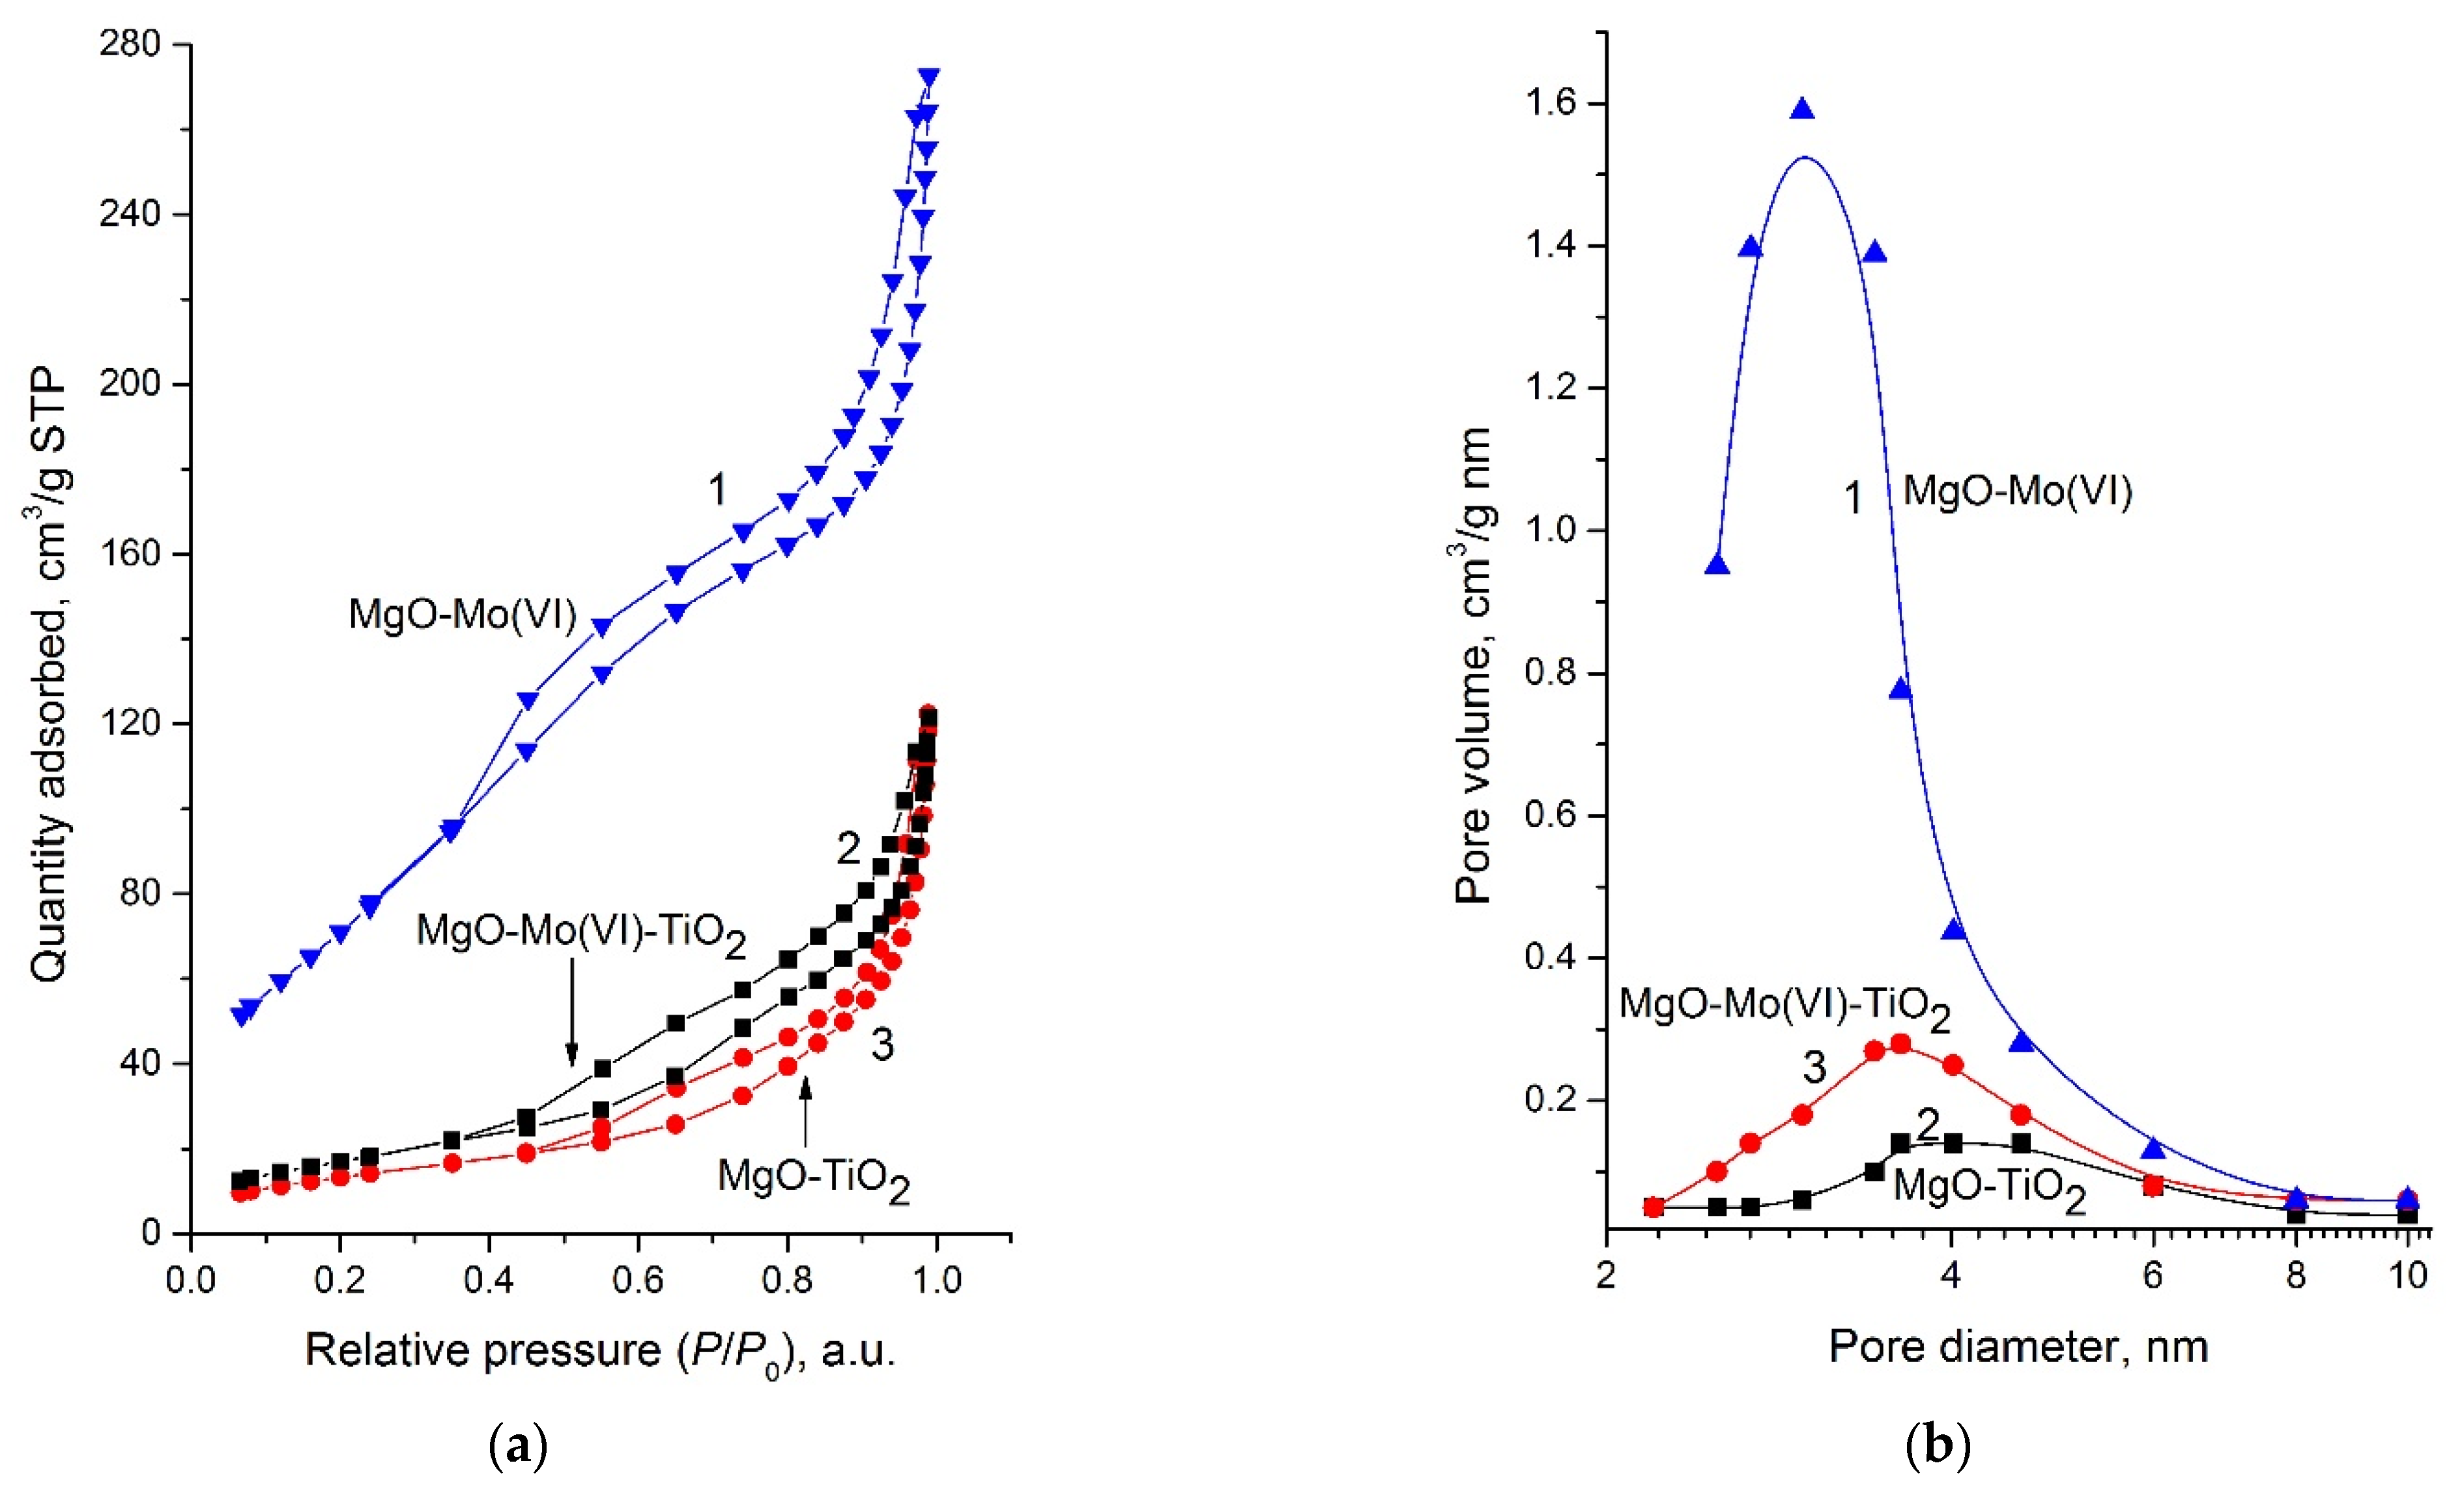
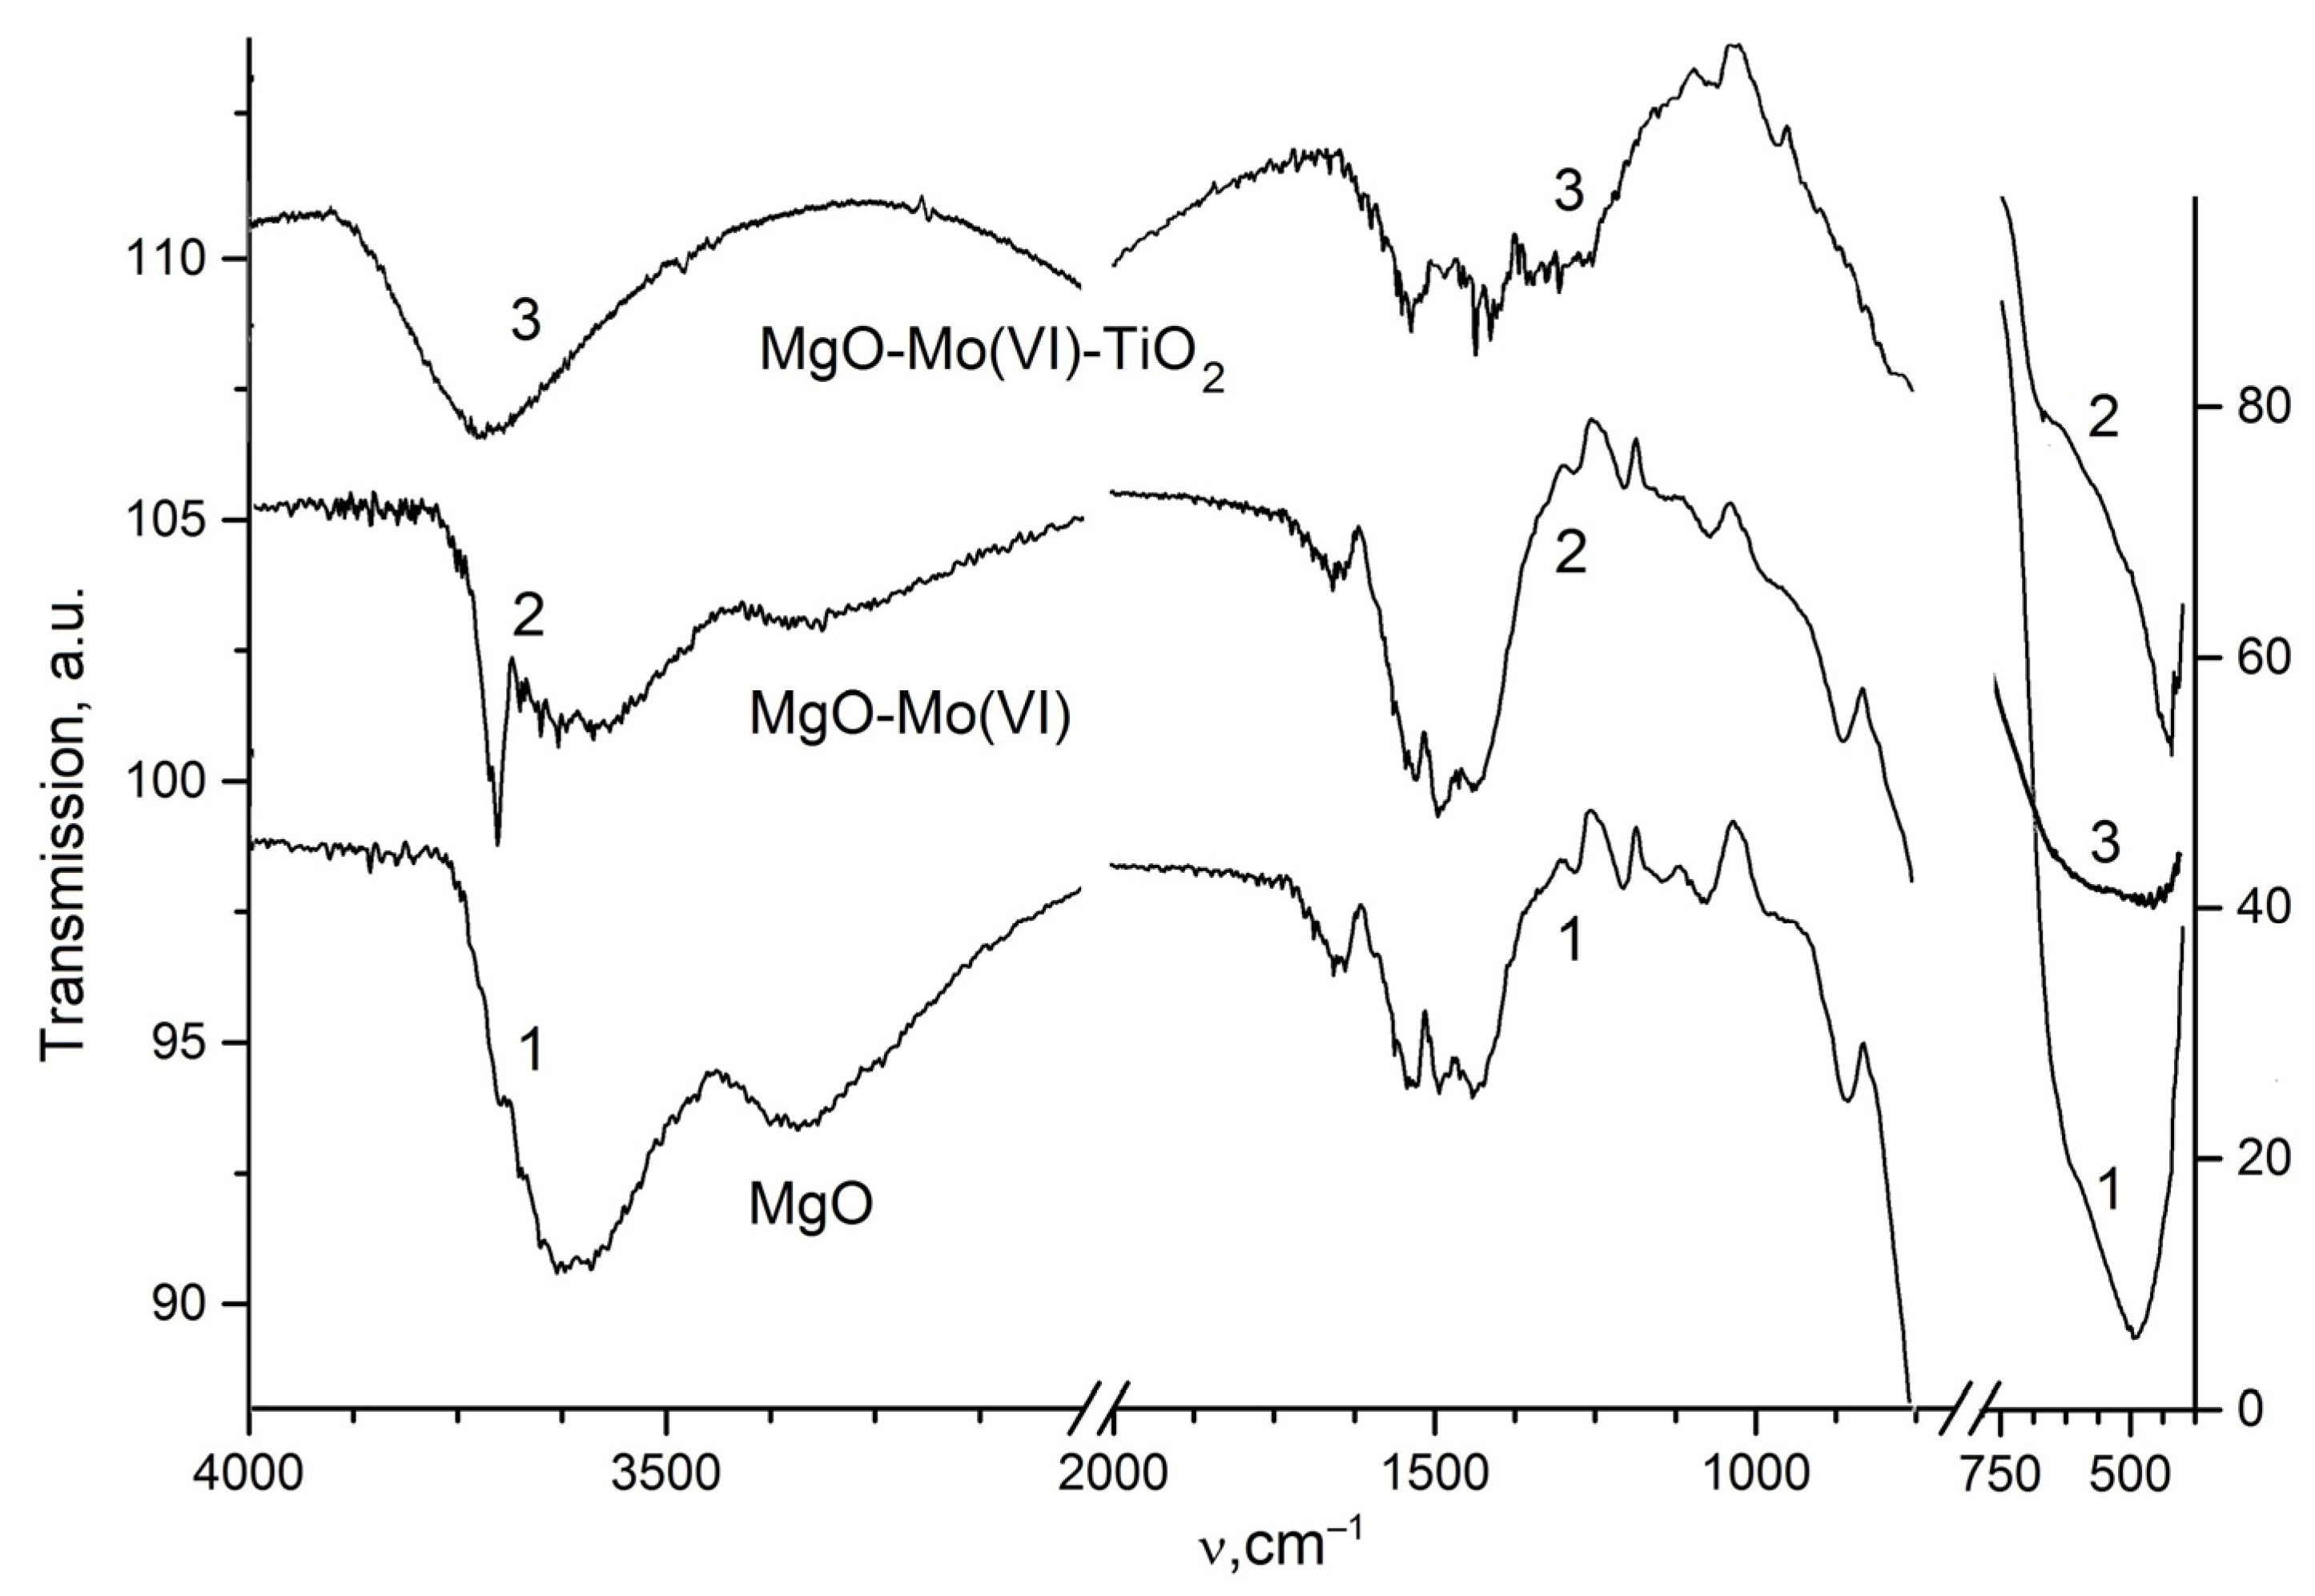
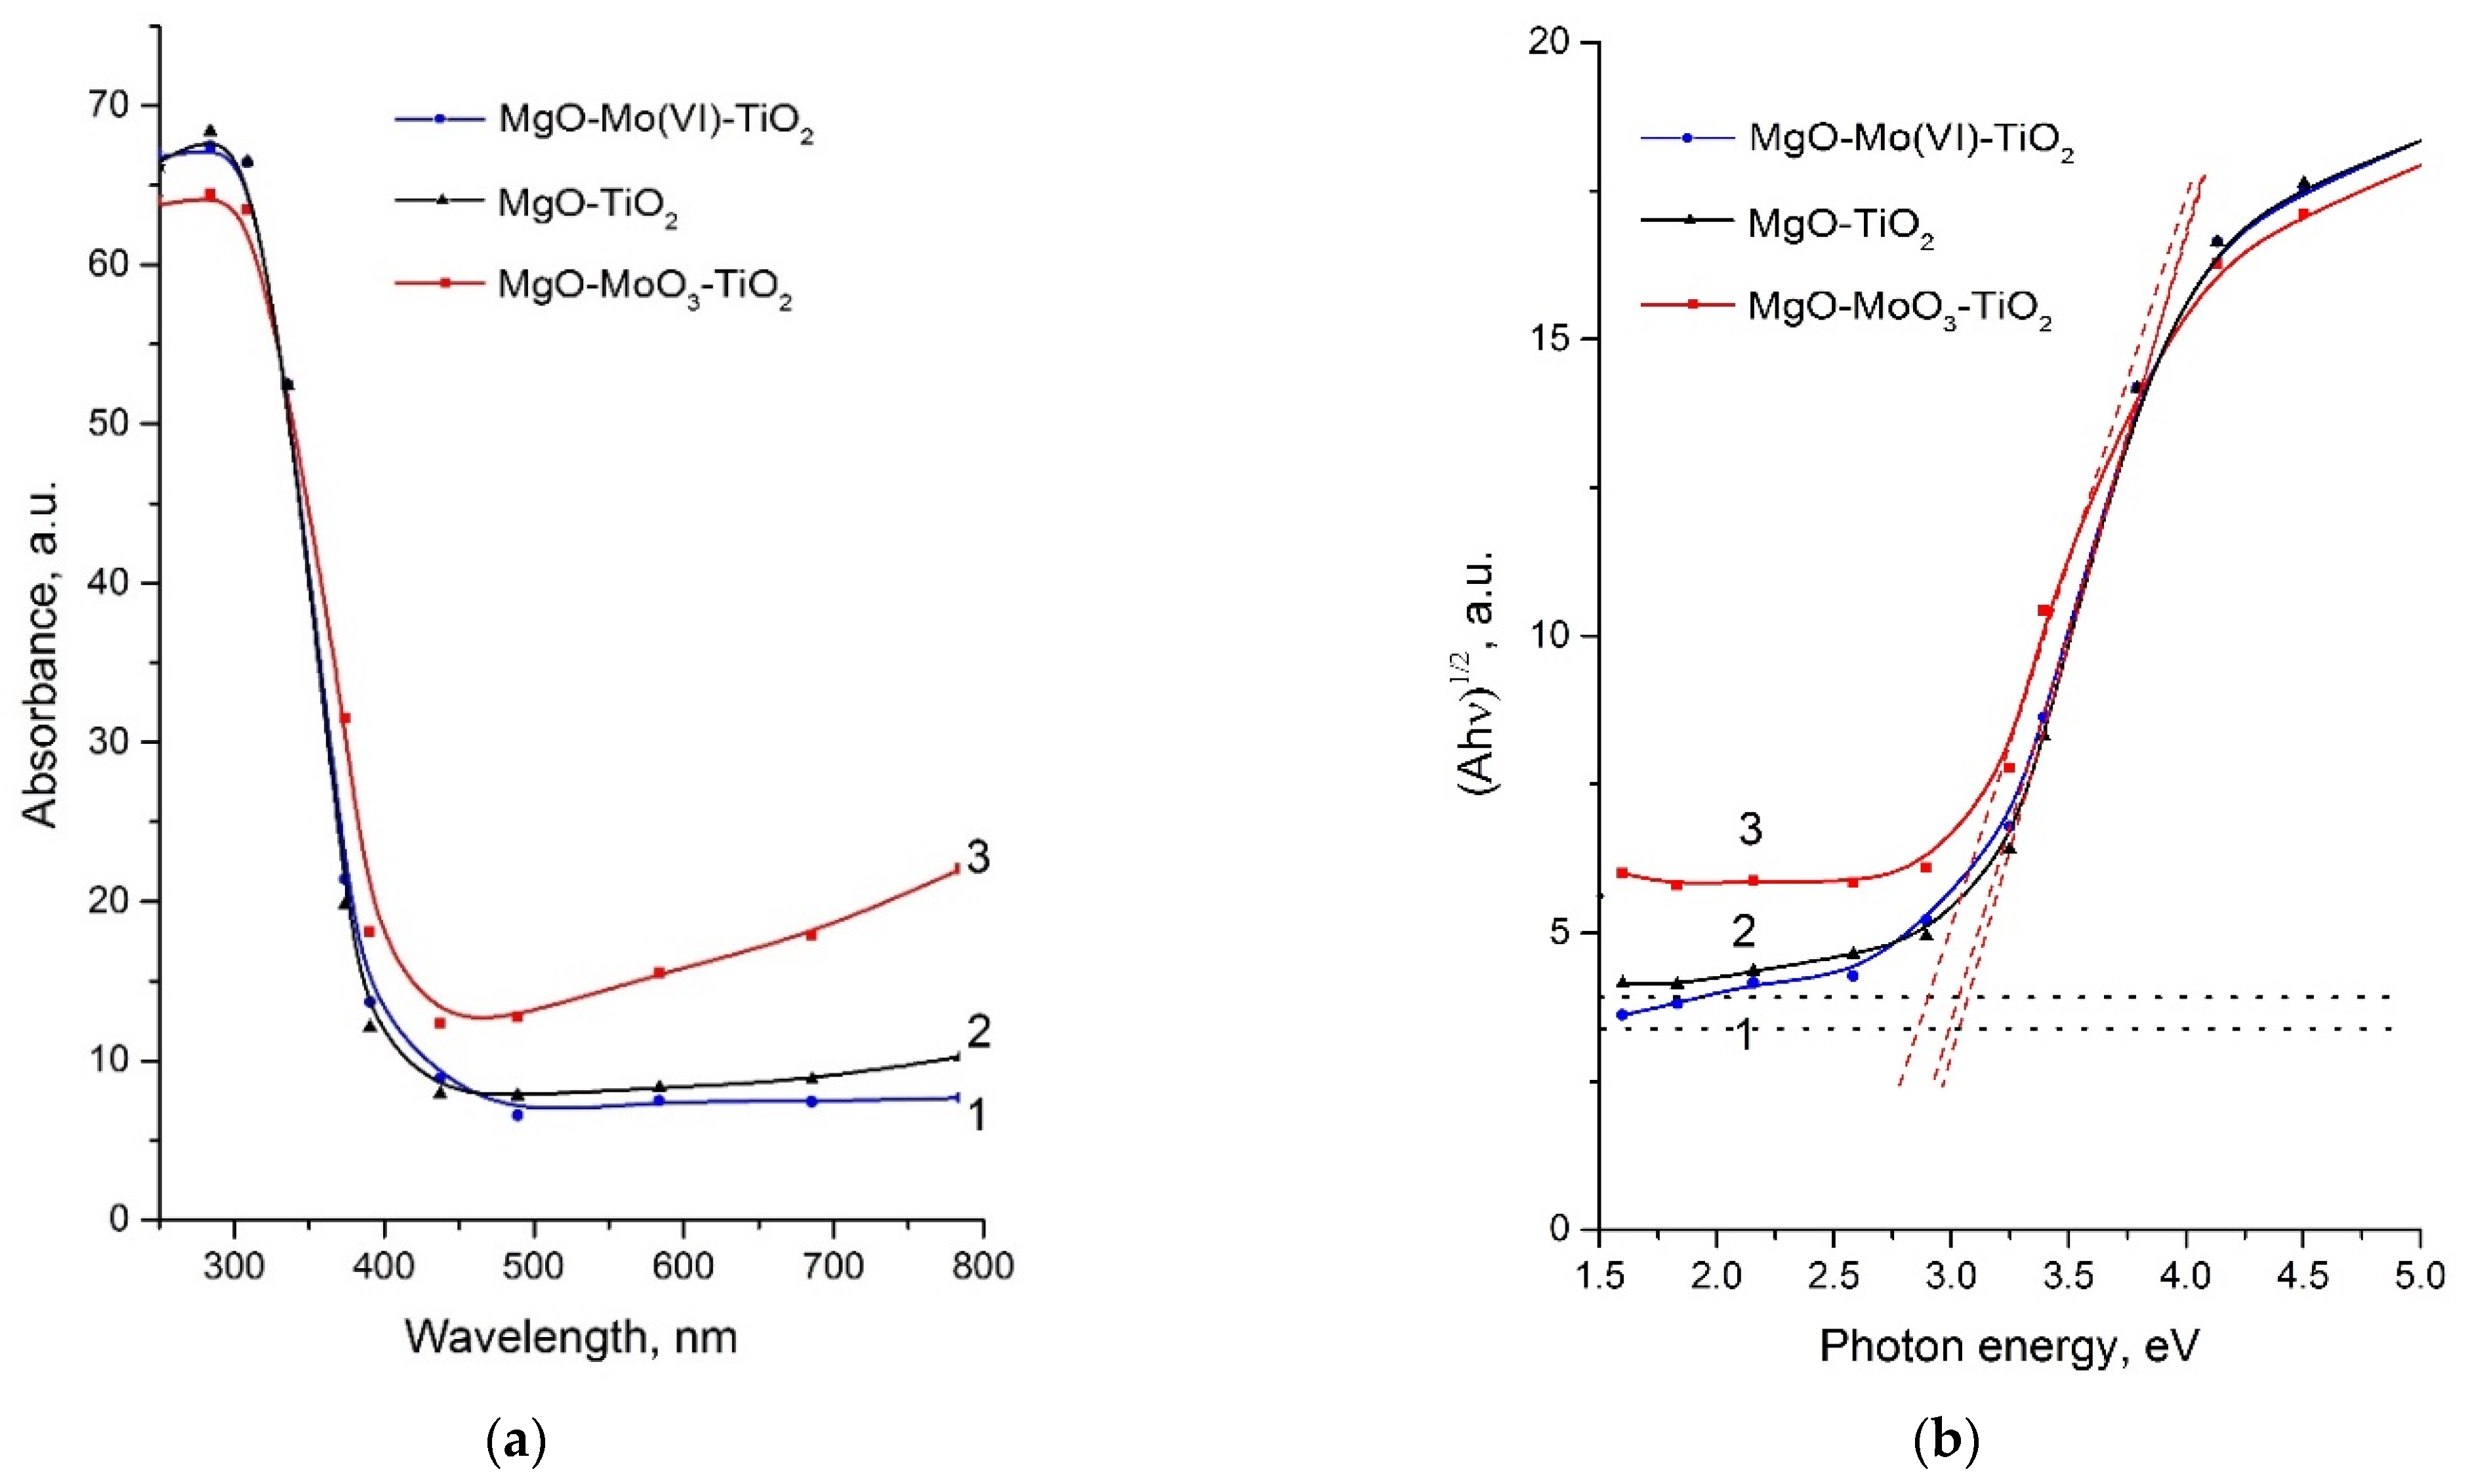
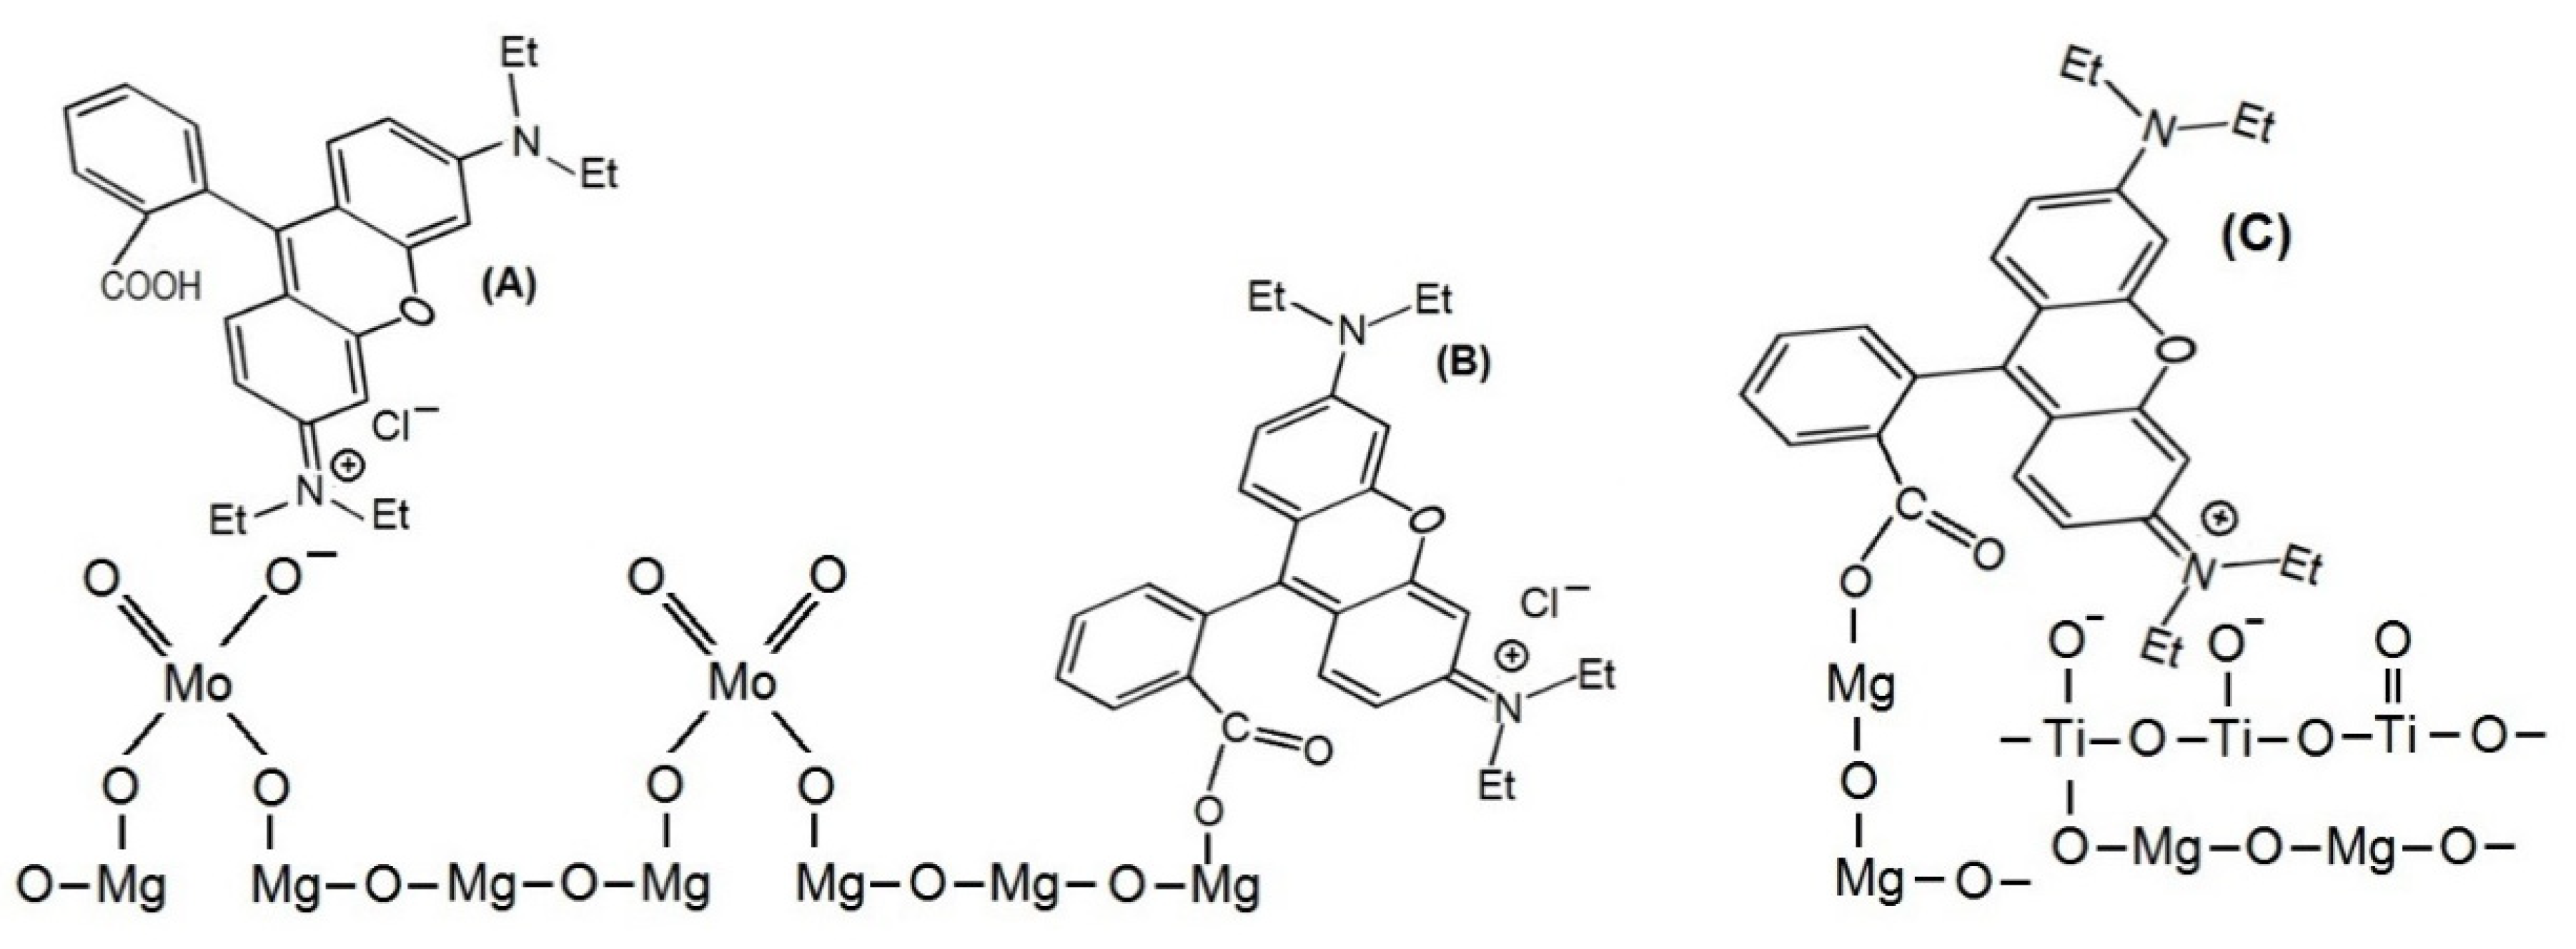
2.1. Preparation of Active Photocatalyst and Its Characterization

When preparing Mo(VI)-doped MgO, it was found that the addition of a small (1 wt.% Mo vs. MgO mass) (NH4)6Mo6O24 amount to the freshly made MgO suspension led to complete peptization of the precipitate. Therefore, to prepare MgO-Mo(VI) powder, the pH of the colloidal system was increased by adding an aqueous ammonia solution until the formation of the precipitate was suitable for separation by centrifugation or filtration. Heat treatment at 400 °C of MgO-Mo(VI) samples obtained in this way leads to the formation of magnesium oxide, which is characterized by a significantly greater broadening of reflections on the XRD patterns compared to those for the initial MgO obtained without introducing Mo(VI) ions and, accordingly, without the stages of peptization and re-deposition (Figure 1). Molybdenum in the form of MoO3 phase inclusions does not appear on the XRD patterns of these samples not only because of its small amount but, probably, because of the distribution of Mo(VI) ions in the MgO matrix without MoO3 phase formation. An increase in molybdenum ions concentration up to 10 wt.% leads to the noticeable MoO3 phase inclusions (Figure 1b, curve 5) and MgO-MoO3-TiO2 heterostructure formation.
XRD pattern of MgO-TiO2 composite based on the pristine MgO with the component ratio MgO:TiO2 = 1:0.1 contains only pure MgO phase (Figure 1a, curve 3), and anatase reflections appear only at the significant TiO2 content (MgO:TiO2 = 1:0.5). In addition, in samples with MgO:TiO2 = 1:0.25 and 1:0.5 ratios, MgTi2O5 phase is crystallized as a result of heat treatment at the temperature of 500 °C. The patterns of MgO-TiO2 composite based on Mo-doped MgO show anatase reflections already for the samples with MgO:TiO2 = 1:0.1 ratio. MgTi2O5 and Mg1.5Ti1.5O4 phases, which are also noticeable for composites with a high content of TiO2 (Figure 1b), also begin to crystallize in these samples. Such a difference between composites based on pure MgO and Mo-doped is quite understandable, given the significantly larger specific surface area of the doped samples and their increased surface reactivity (Table 1).
Thus, the crystallite sizes calculated from the broadening of XRD reflections decrease from 43.6 ± 10.7 nm for the pristine MgO to 9.4 ± 2.9 nm for molybdenum (1 wt.%) doped samples. Such a significant change in the size of crystallites leads to a considerable increase in porosity and specific surface area Sa of MgO samples as a result of their doping with Mo(VI) (Table 1). The Sa values determined from N2 adsorption isotherms (Figure 2a) sharply increase from 42–50 m2/g for the pristine MgO and MgO-TiO2 to 208 ± 22 m2/g for 1 wt.% Mo(VI) doped MgO. As follows from Figure 2a, adsorption isotherms of these samples correspond to the IV IUPAC type. All samples belong to the class of mesoporous materials with a high porous volume (Figure 2b, Table 1), especially for MgO doped with molybdenum. It is characteristic that the deposition of the TiO2 layer on the MgO-Mo(VI) surface significantly reduces the surface porosity, leading to a decrease in its Sa value to 63 ± 5 m2/g, thereby compensating for its significant increase caused by the peptization of precipitated MgO by Mo(VI) ions. For the Mo-doped MgO, the cumulative pore volume (diameter from 1.7 nm to 300 nm) calculated by the BJH desorption method is 0.45 cm3/g, and the average pore diameter is 5.46 nm. The deposition of a titanium dioxide layer on a MgO carrier doped with 1 wt.% Mo(VI) leads to a significant (by a factor of 2.4) decrease in the cumulative pore volume and a decrease in the average pore diameter by a factor of 1.4 (Table 1). It can be expected that the shift of the pore size distribution towards larger diameters will favor the accessibility of inner-pore space in photocatalytic processes.
The enhanced reactivity of the Mo-doped MgO substrate is confirmed by infrared spectroscopy data. Figure 3 shows that in the FTIR spectrum of the pristine magnesium oxide, in addition to the bands of ν (Mg–O) at 853 and 1485 cm−1 [59] there are strain and valence vibration bands of residual or sorbed water (1529, 1643 and 3600 cm−1) [60]. The doping of MgO with Mo(VI) ions leads to the appearance of bands at 407, 413, 672, and 3702 cm−1. The band at 3700 cm–1 may be related to the valence vibrations of the hydroxyl ion [60,61] indicating incomplete dehydration of magnesium hydroxide under heat treatment during sample preparation.
Despite the fact that XRD analysis of Mo-doped MgO sample indicates the presence of magnesium oxide as the only crystalline phase, the presence of a sharp and strong band in the FTIR spectrum associated with the valence vibrations of hydroxyl ion inherent in Mg(OH)2 [60], indicates the presence of a hydroxide layer on MgO surface. Hydration of Mo-doped MgO surface can be considered as a significant reason for the increased reactivity of Mo-doped samples compared to the pristine ones.

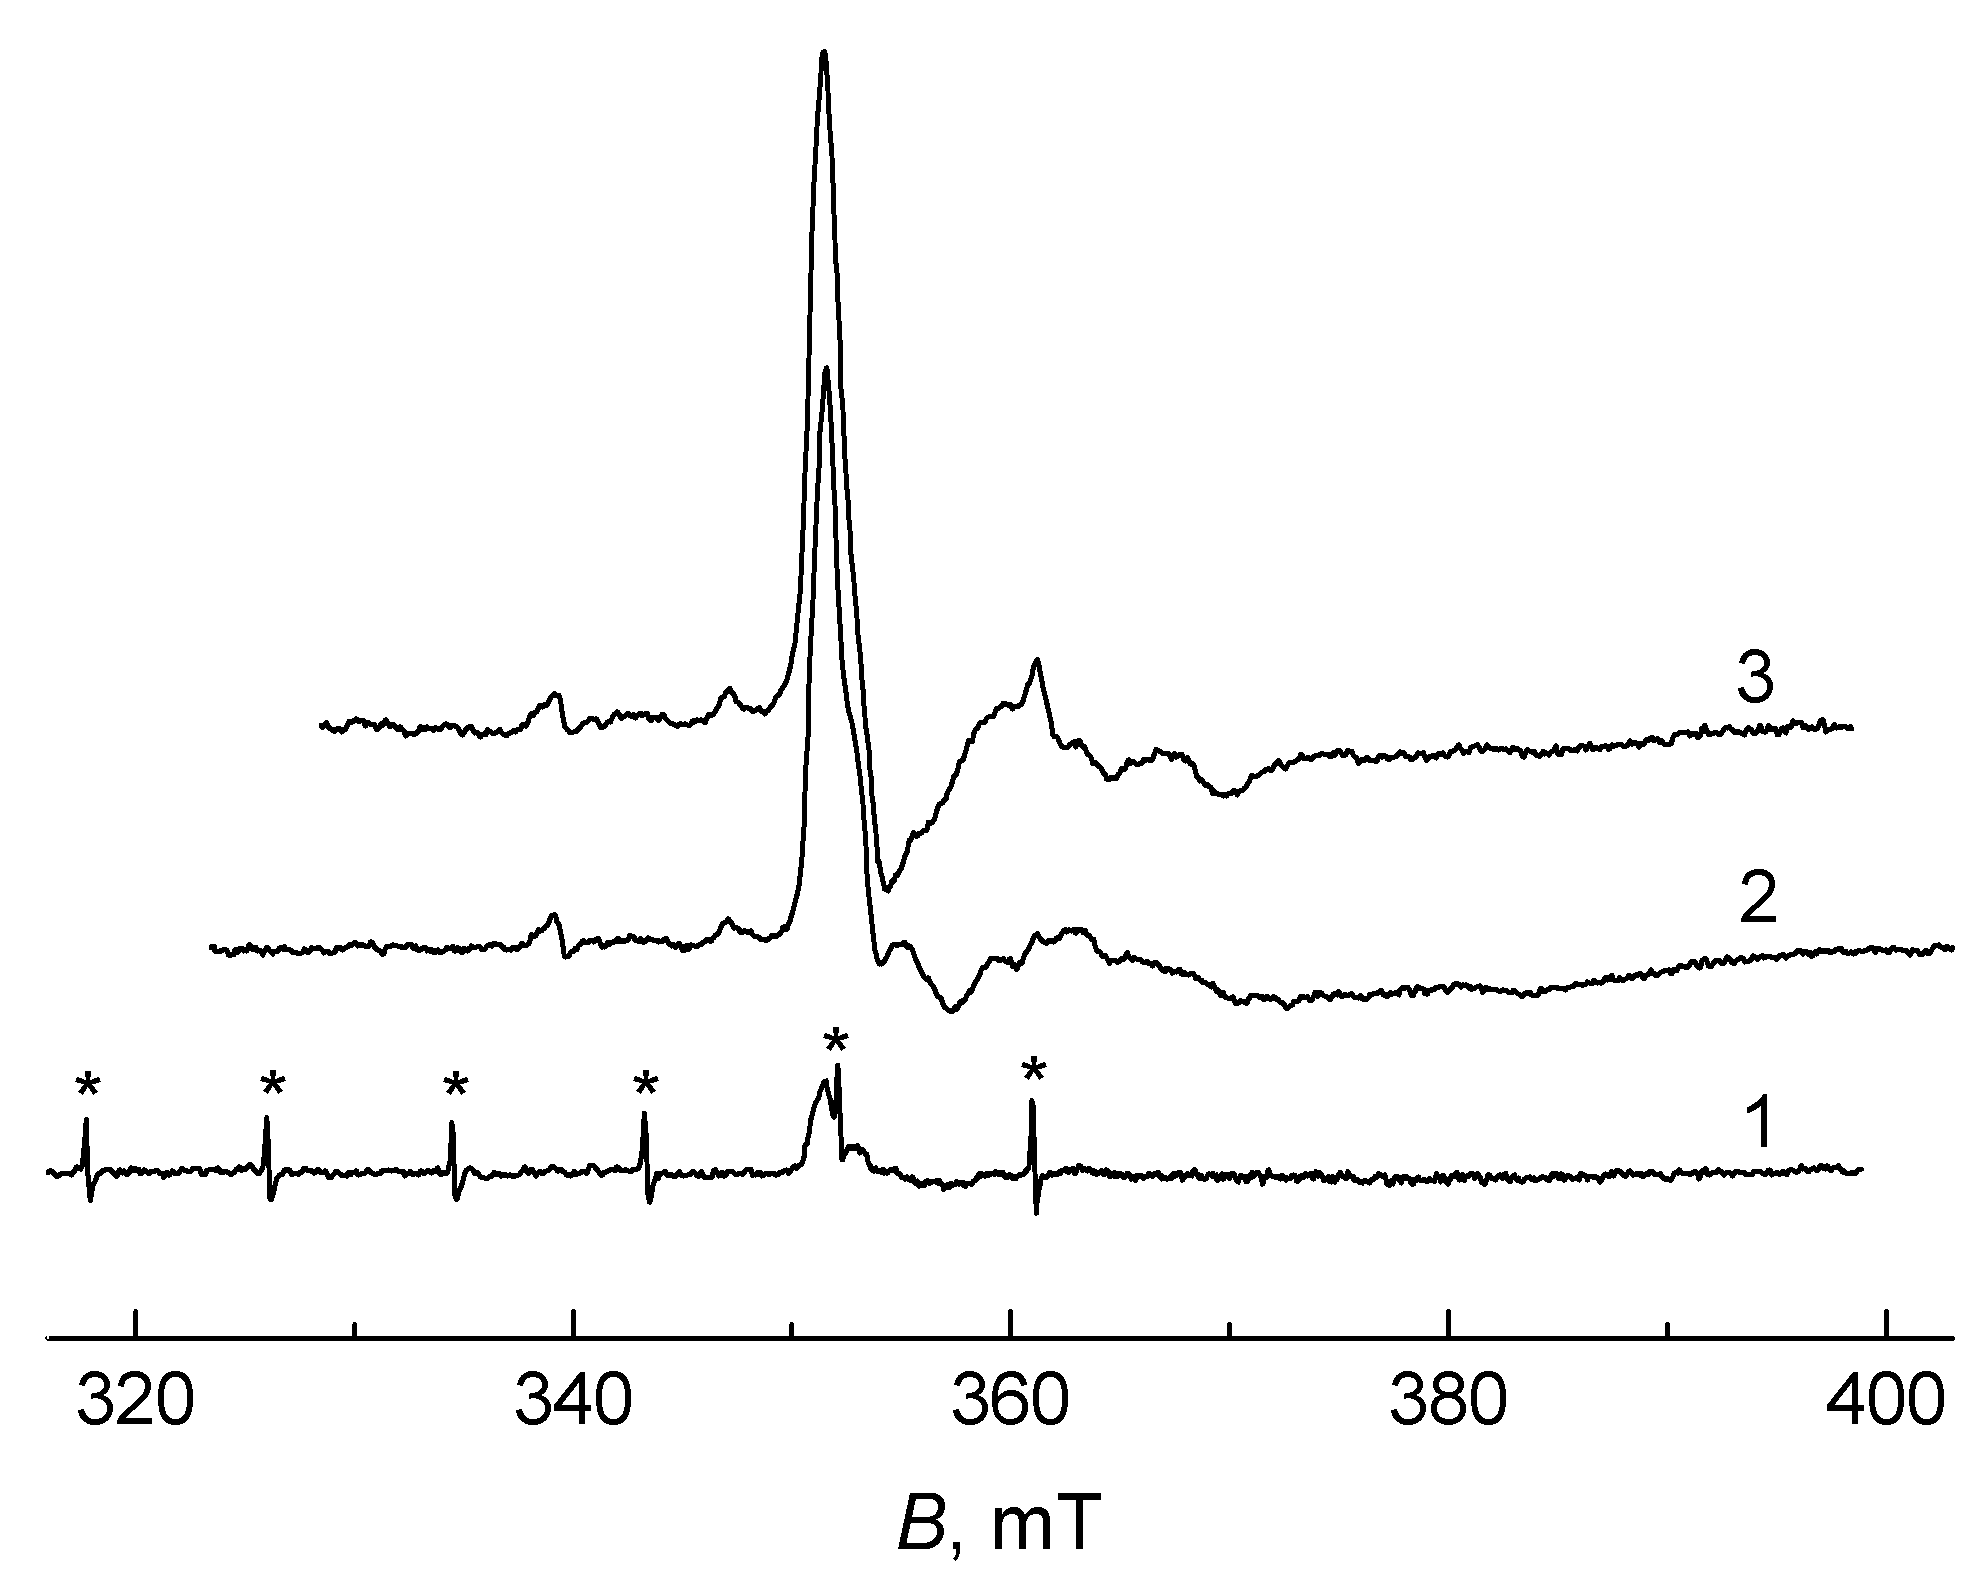
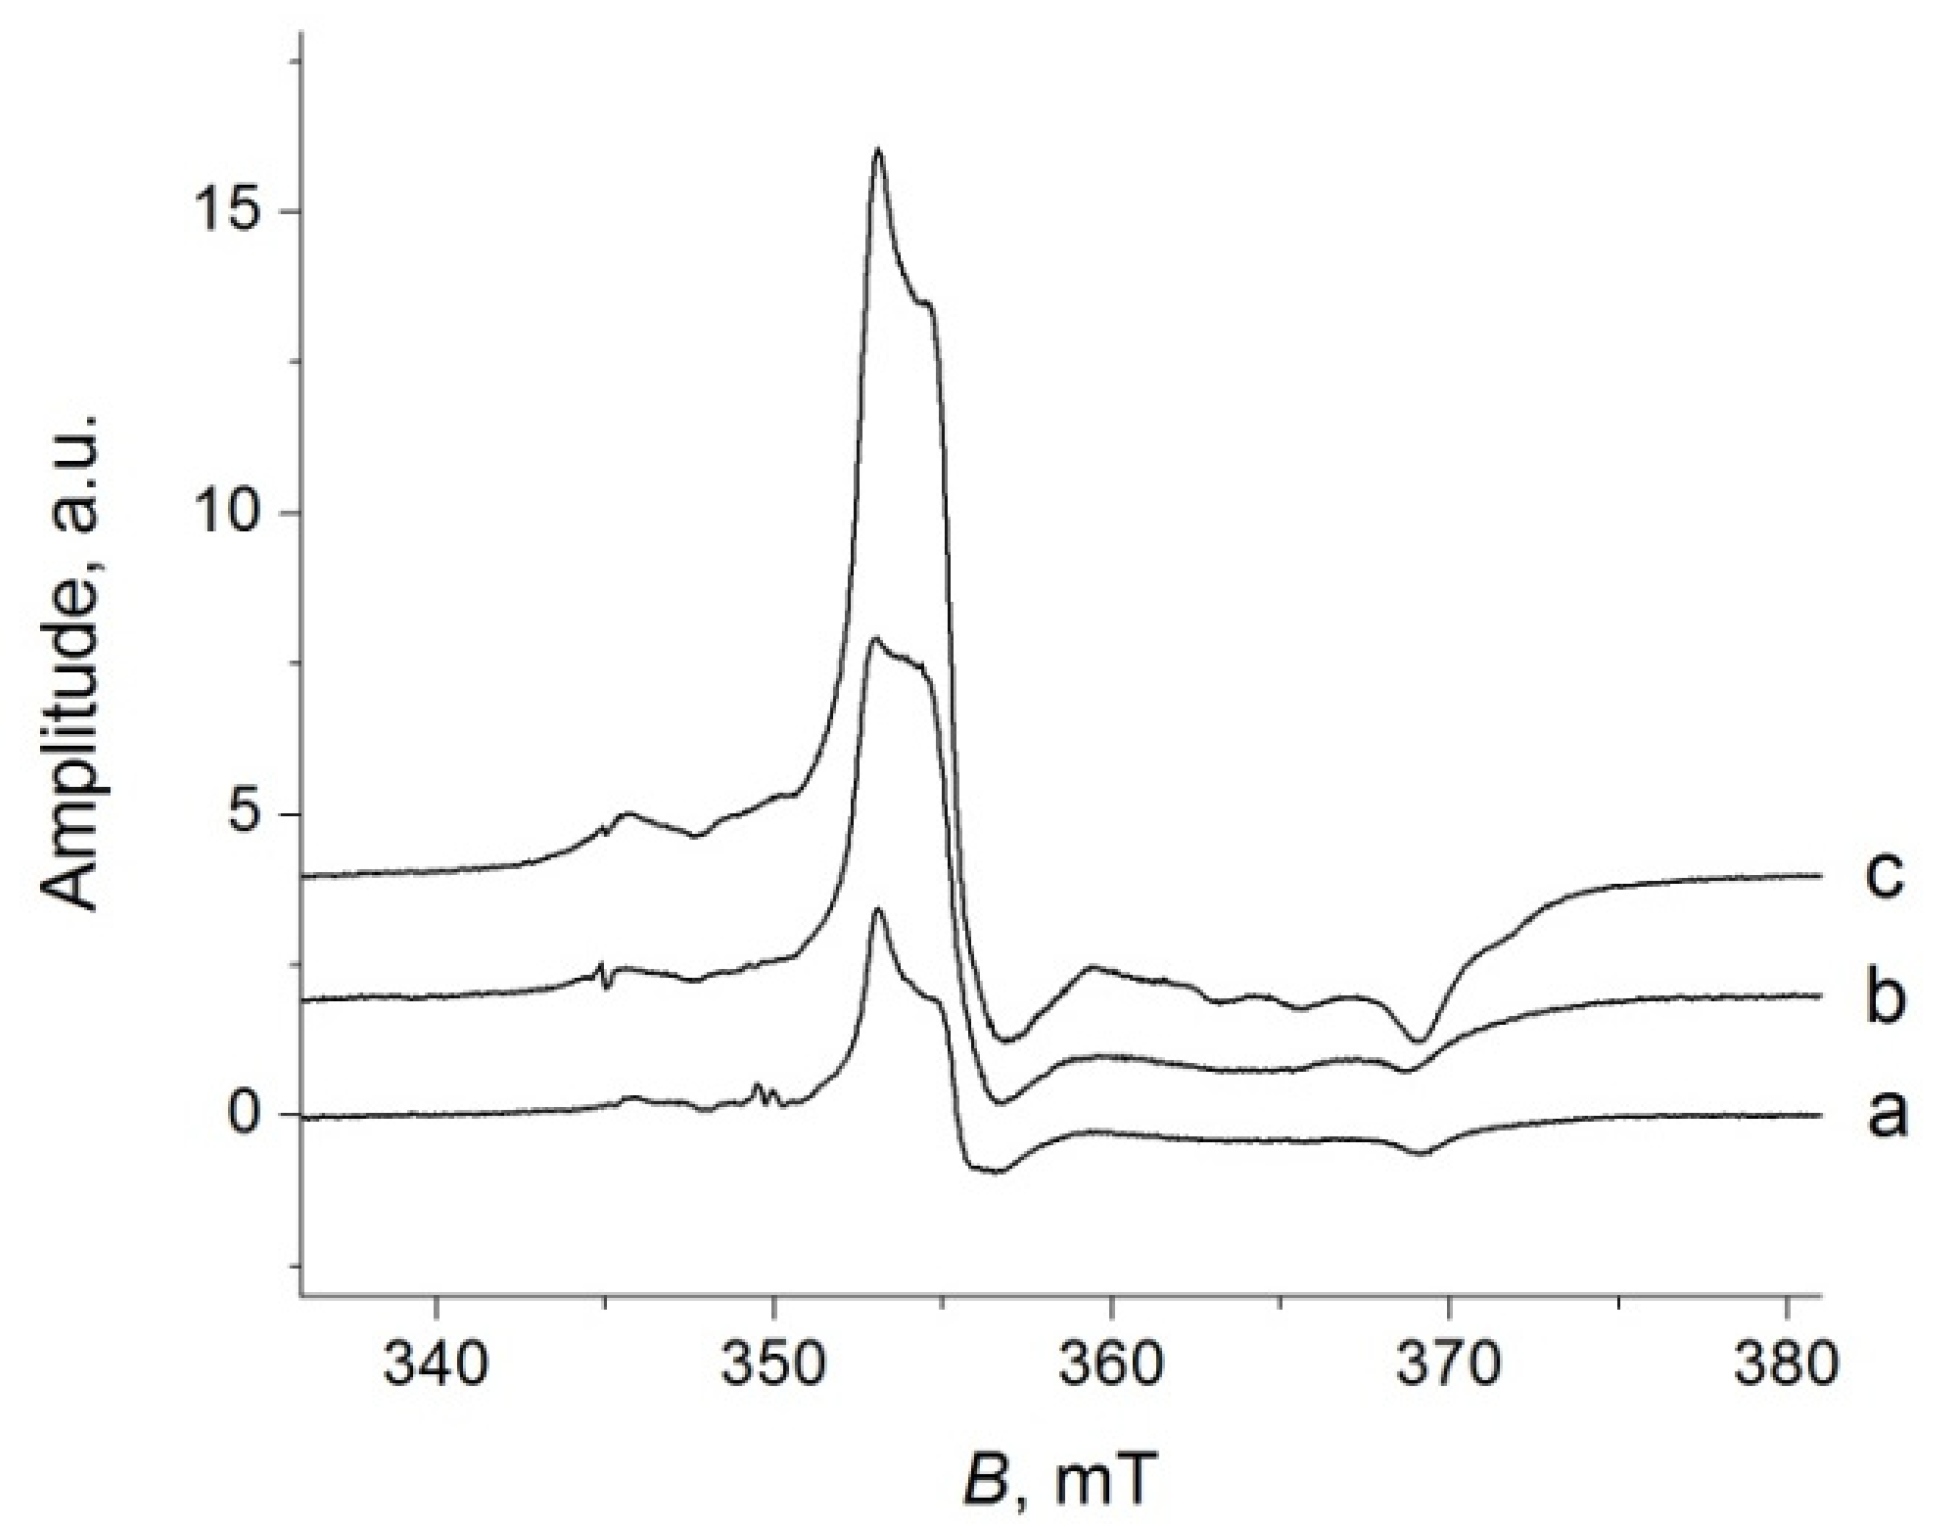
2.2. EPR Investigation

It is known that in the case of molybdenum compounds, especially in molybdenum oxide, MoO3, during its preparation, purification, chemical processes, etc., structural defects such as oxygen vacancies and corresponding reduced Mo5+ centers are formed [62,63,64,65,66]. Therefore, electron paramagnetic resonance (EPR) spectroscopy is one of the most informative methods for the detection of such species, characterization, and monitoring of their structural behavior [67,68,69]. According to the works mentioned above, the observed spectra of MoO3 compounds, both with axial symmetry and three-axes/three-axial anisotropy parameters of the g-tensor (Table 2), reflect the state of Mo5+ ion in paramagnetic centers (PCs). Such PCs may be formed as a result of breaking the Mo–O bridge bond in the O–Mo–O chain of the MoO3 matrix. In some cases, the hyperfine splitting (hfs) is observed and hfs constants for 95Mo and 97Mo (nuclear spin IMo = 5/2) can be measured [63,68,70].
We expected that in the process of obtaining MgO-MoO3 materials and doping them with nano-TiO2, some structural defects in the matrix would be created and, thus, some part of the diamagnetic Mo6+ ions would be reduced to paramagnetic Mo5+ ones. Electron paramagnetic resonance spectroscopy has been used to detect and characterize centers with the electronic configuration 4d1 in the samples. Typical EPR spectra of MgO powders modified with MoO3 are shown in Figure 4. The signals observed, obviously, refer to the Mo5+ cations in the state 4d1, which are characterized by the calculated g-tensor values g = 1.925 ± 0.003 and g|| = 1.840 ± 0.005 (Table 2). As shown in Figure 4, participation in the catalytic process leads to a sufficient, more than five-fold, increase in the content of paramagnetic Mo5+ centers in the samples (Table 3).
The concentration values listed in Table 3 were computed by double integration of experimental data of EPR spectra according to the recommendations published in Ref. [74]. For these three samples, the change in Mo5+ content reaches almost an order of magnitude. To verify the accuracy of our measurements, the control samples of molybdenum oxide MoO3 containing the known amount of Mo5+ cations were prepared. As an example, their EPR spectra are shown in Figure 5. It can be seen from the figure that the amplitude of the spectrum really increases in proportion to the increase in Mo5+ content within the EPR measurement error. Comparing these results with those obtained for the MgO-MoO3 system, the data listed in Table 2 and Table 3 can be confirmed.

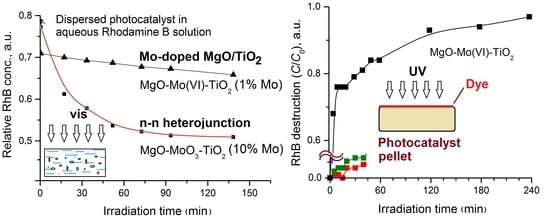
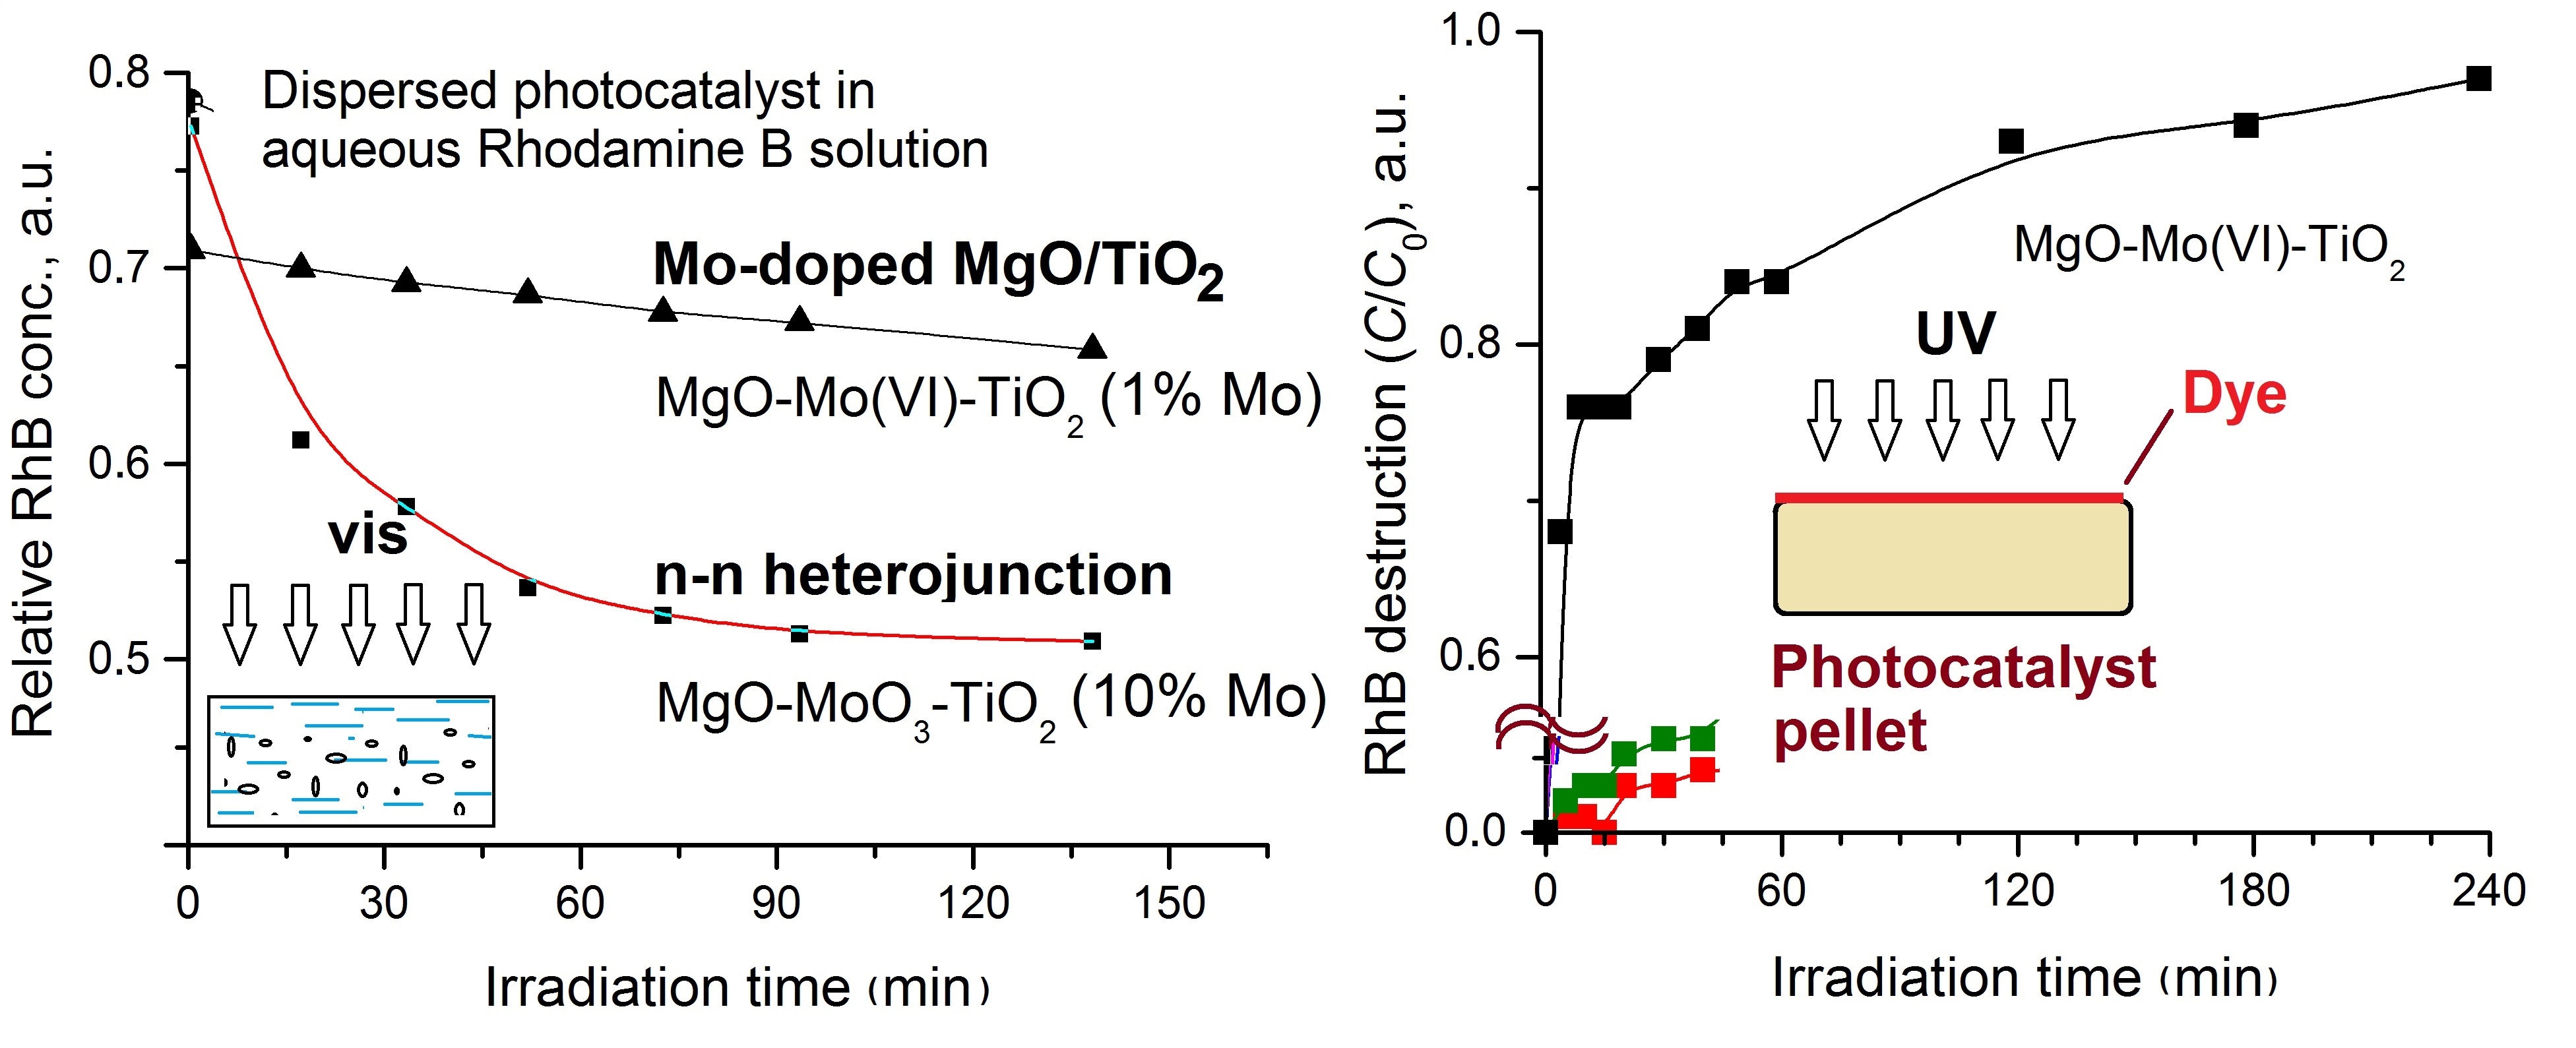
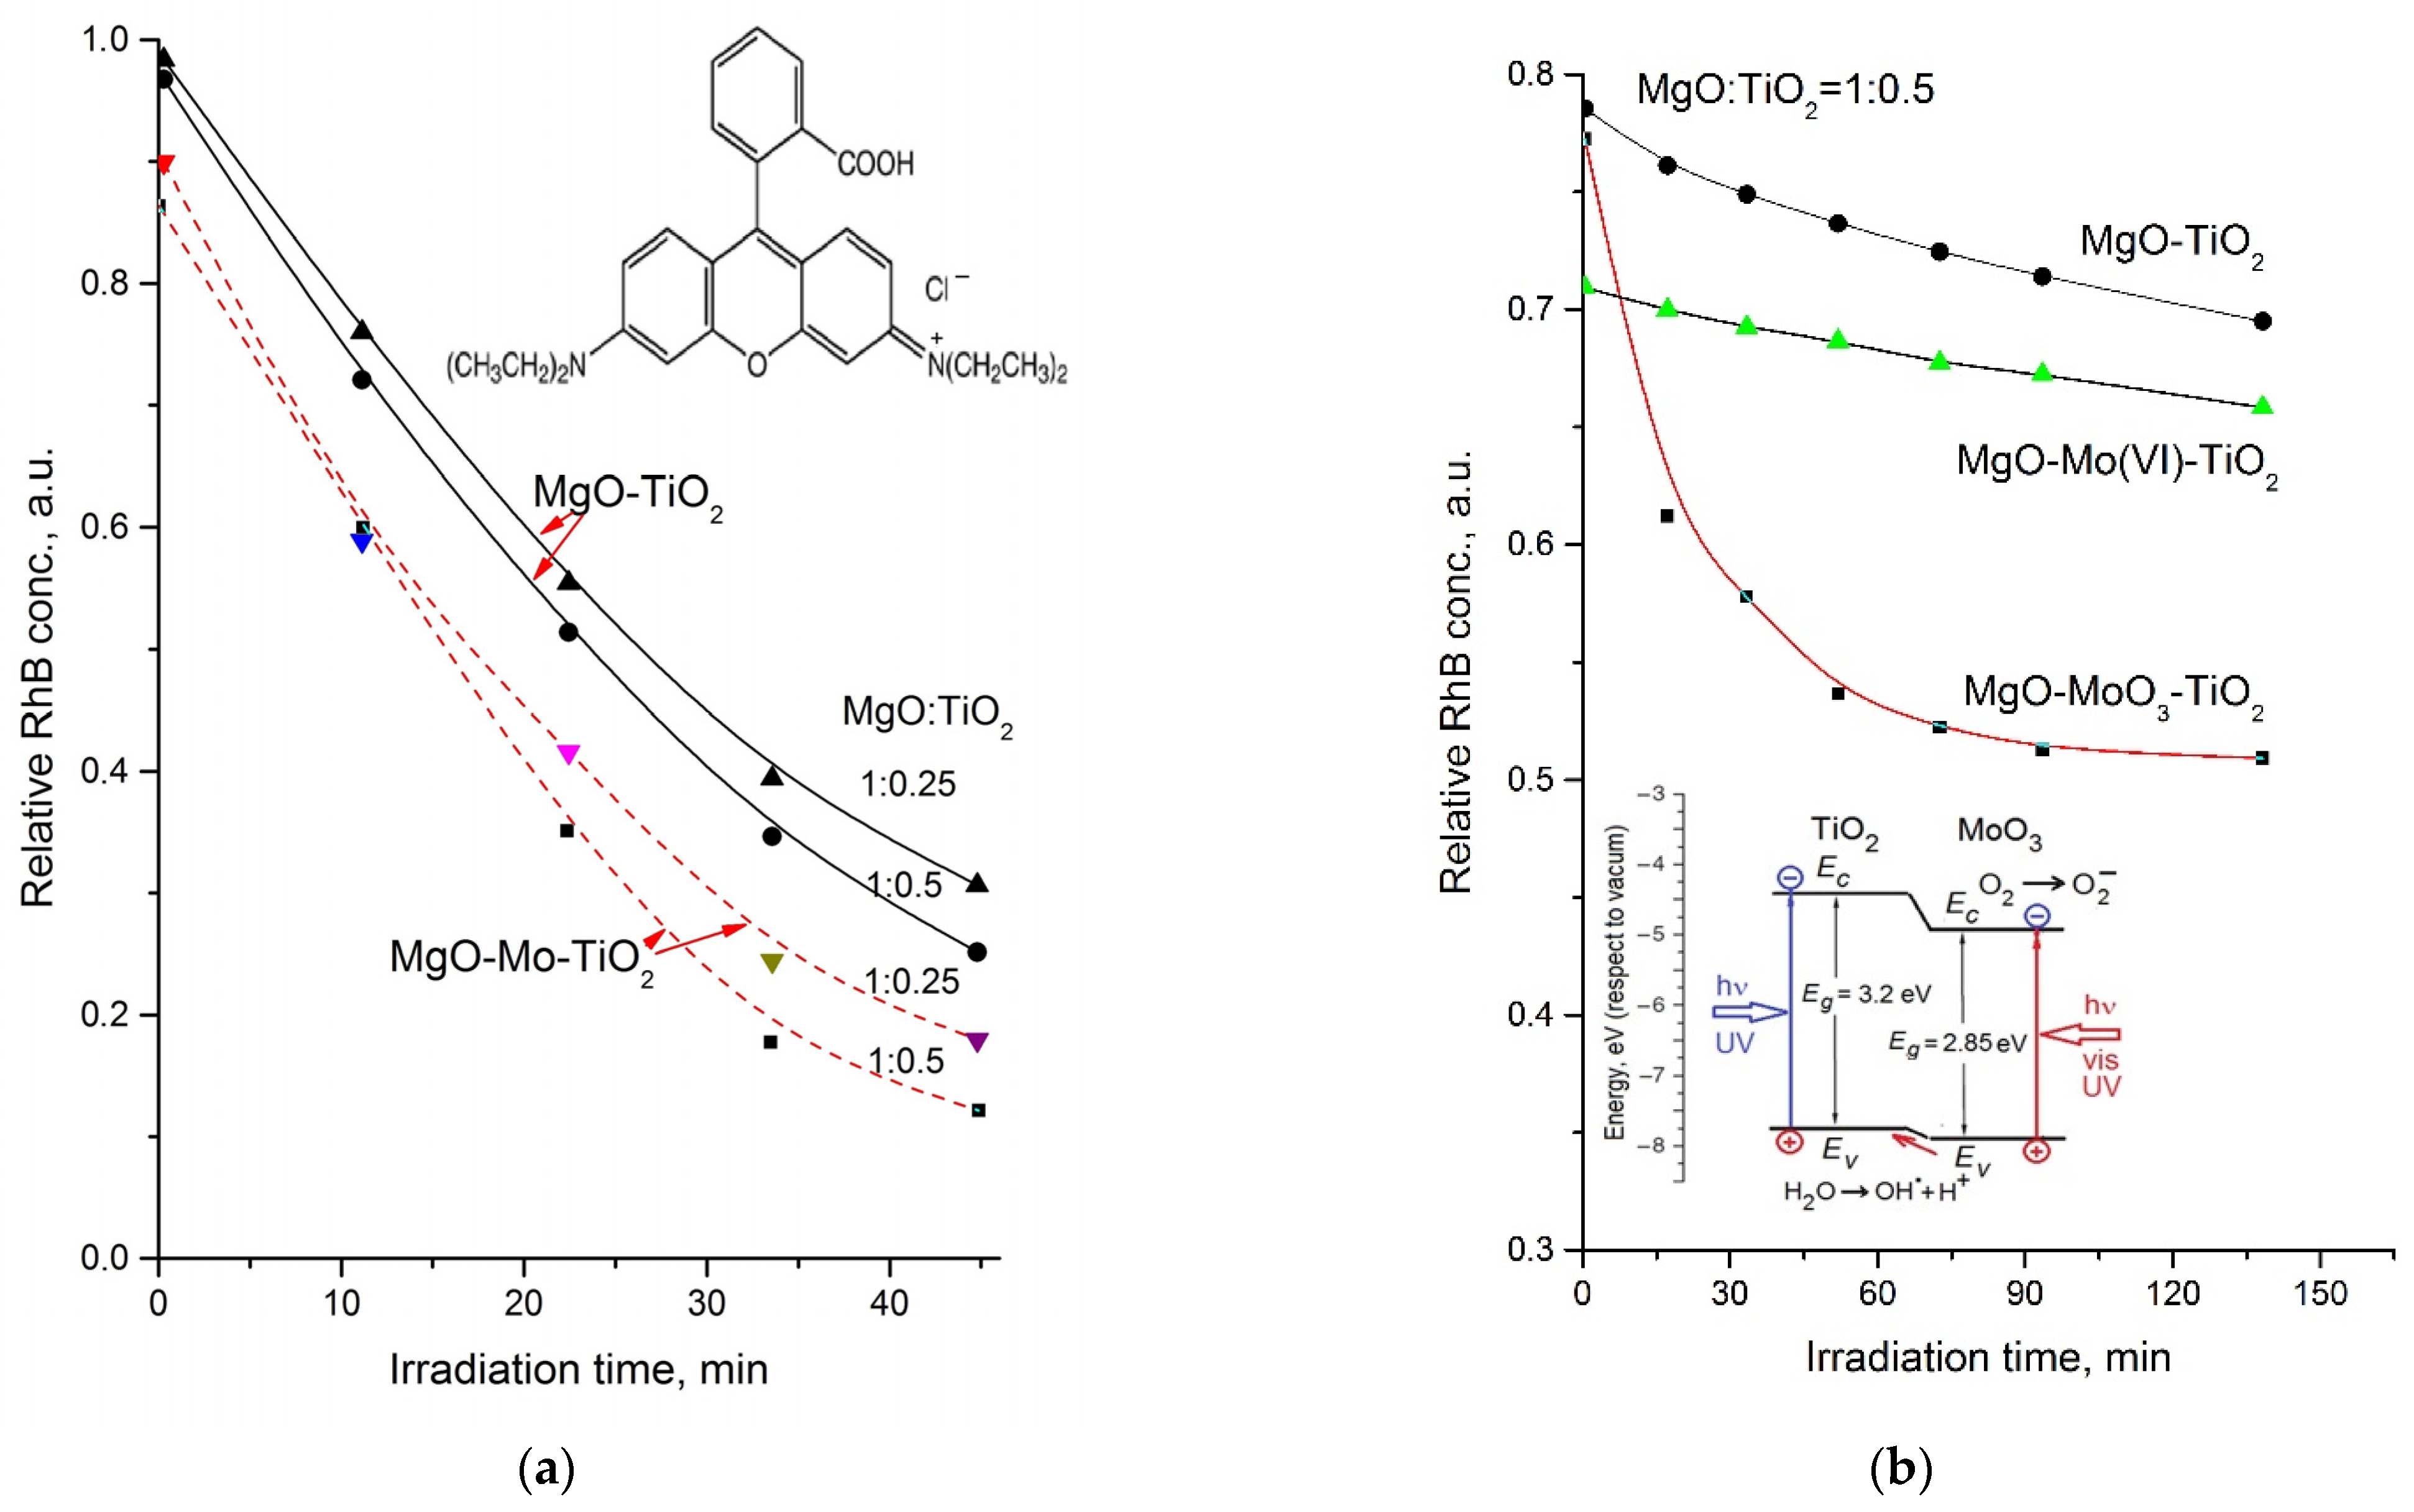
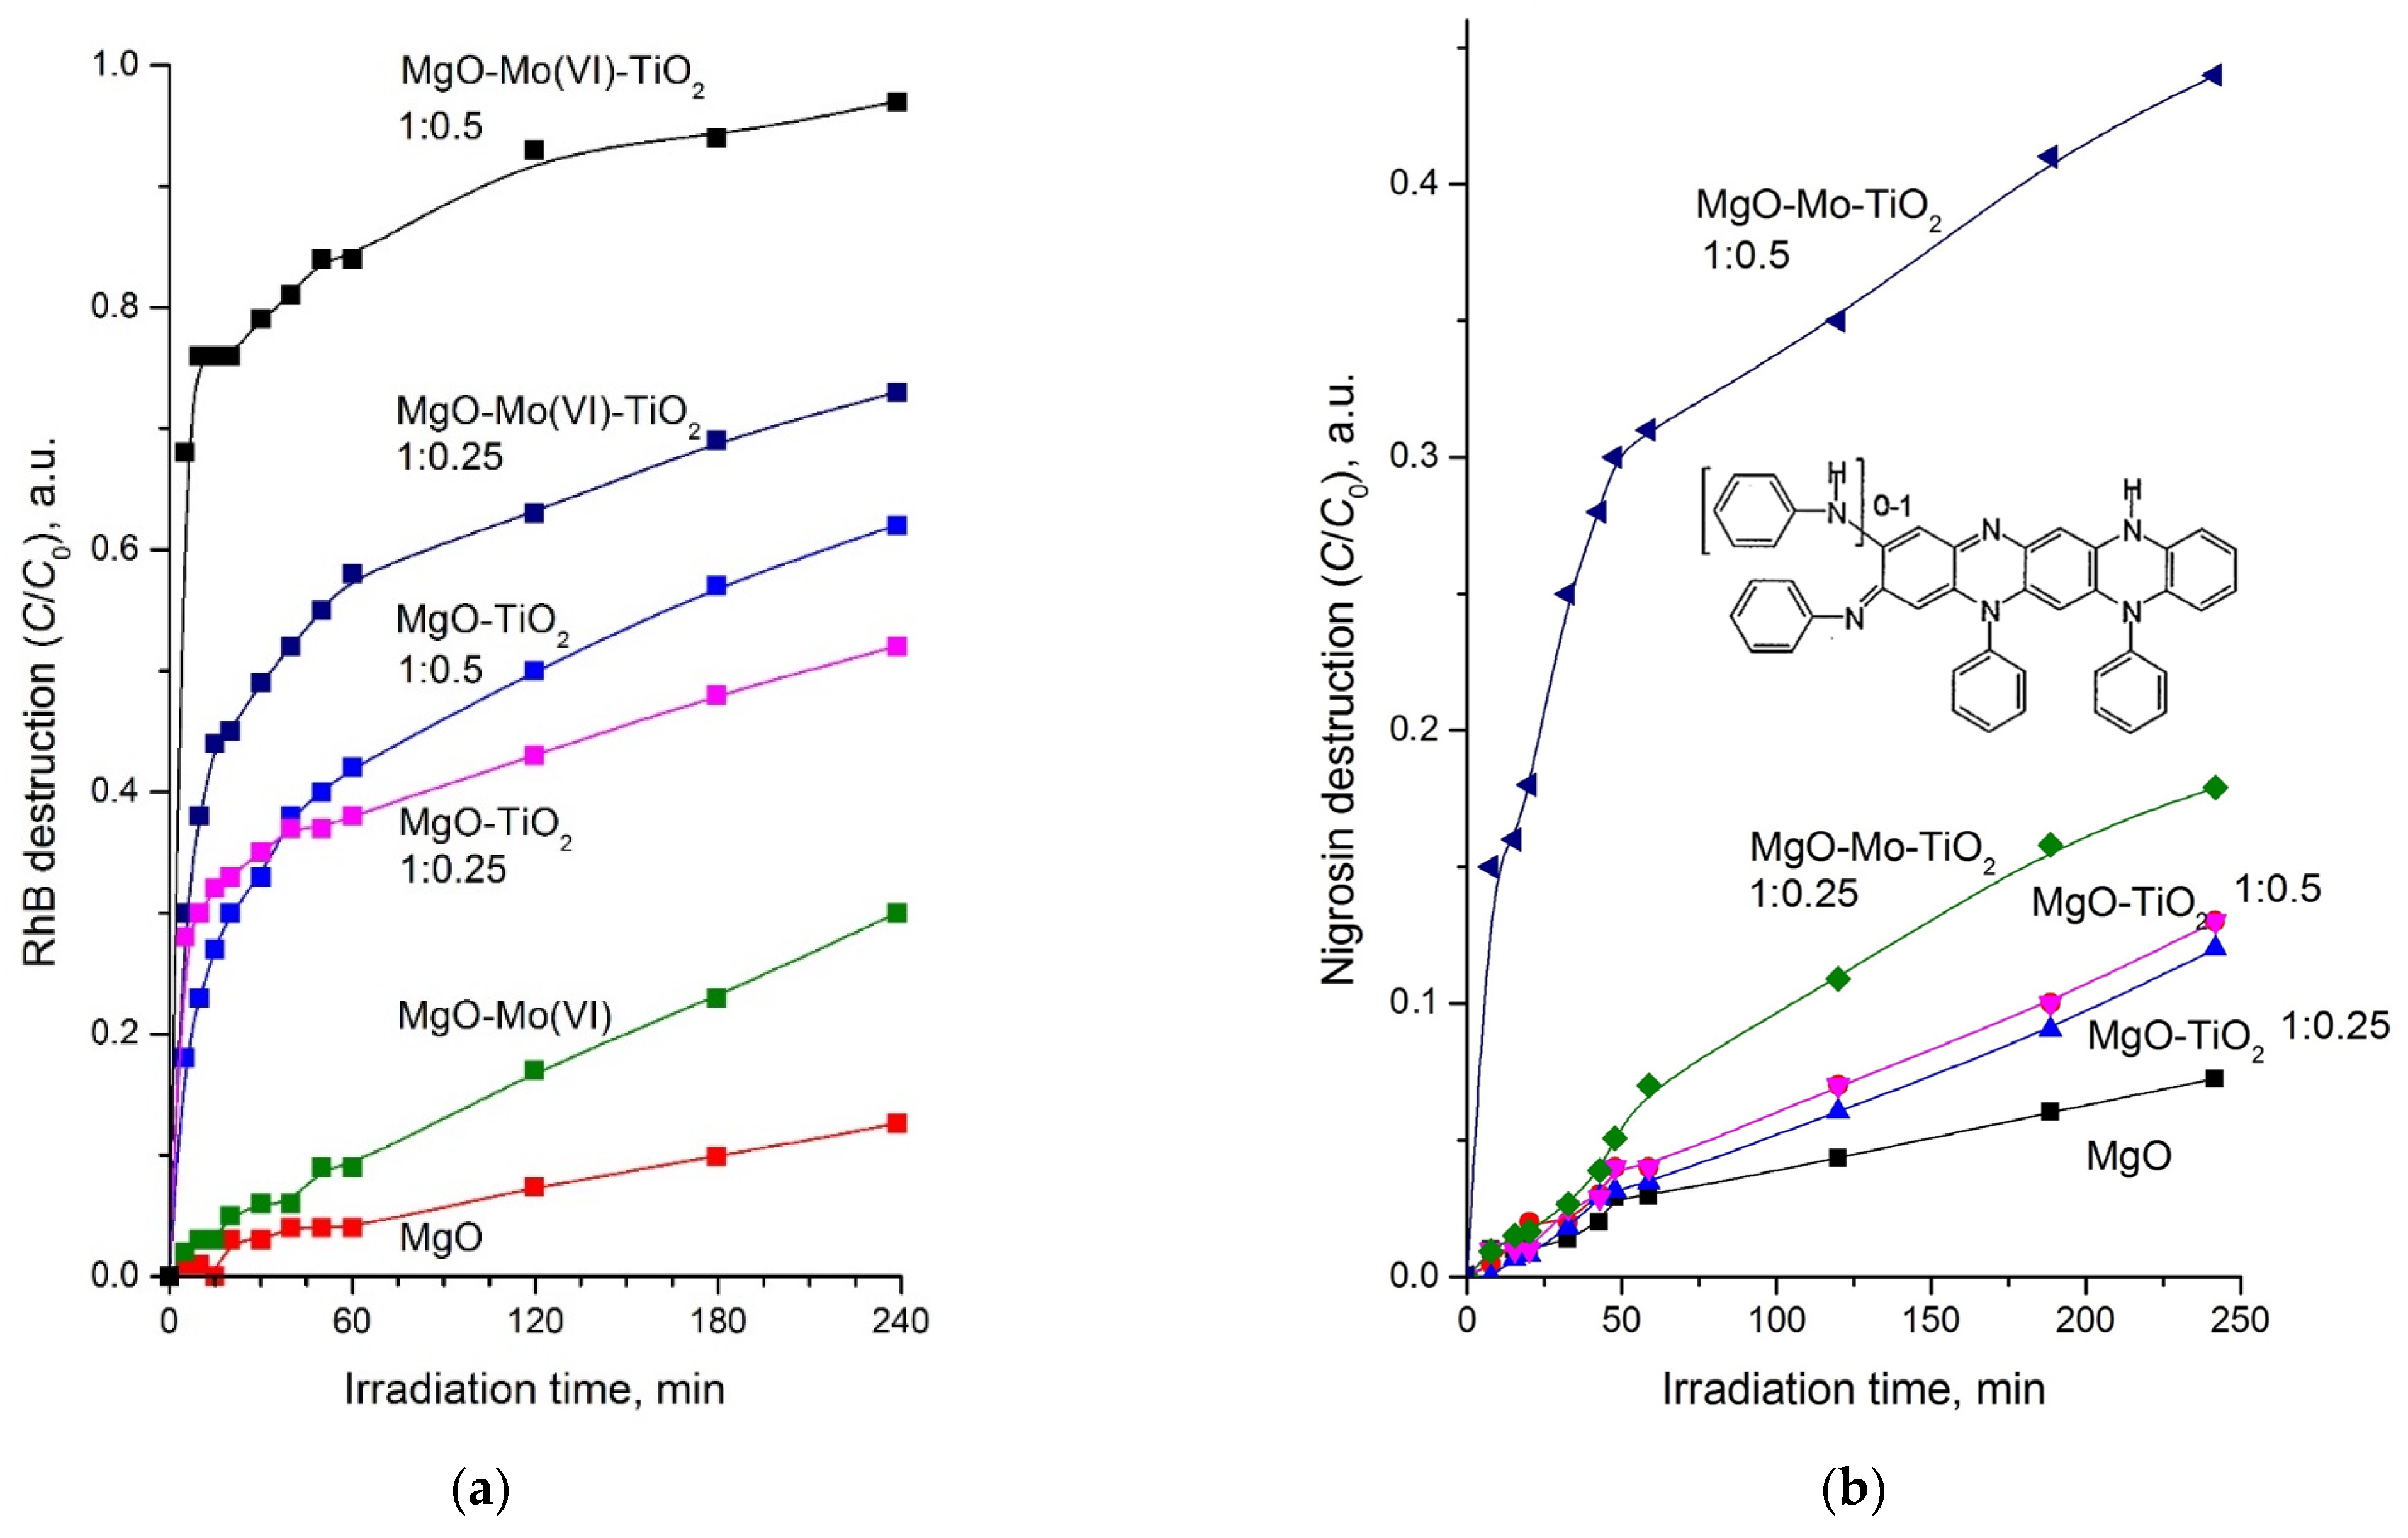
2.3. Photocatalytic Properties

The photocatalytic activity of the prepared composites suspended in an aqueous RhB solution irradiated with the full spectrum of UV lamp is the highest for the MgO–Mo(VI)–TiO2 photocatalyst with the ratio of MgO:TiO2 = 1:0.5. A similar composite with MgO:TiO2 = 1:0.25 ratio has slightly less activity (Figure 6a) due to reduced titania content. Although a twofold decrease in TiO2 content in MgO-Mo(VI)-TiO2 photocatalyst leads to some decrease in photocatalytic activity, this activity exceeds that of MgO–TiO2 composite with a ratio of 1:1 based on undoped MgO. Thus, doping of the MgO carrier with Mo(VI) ions makes it possible to reduce the content of the active component (titanium dioxide) in the supported photocatalyst, while maintaining a rather high level of its activity.
The pseudo-first-order rate constant k1 calculated from the slope of the initial section of the dye photodestruction kinetic curves according to the equation ln(C0/C) = k1t (C and C0—dye concentration and its initial value, t—time) [75] for the MgO-Mo(VI)-TiO2 sample is 0.037 min−1, that is 1.3 times higher than for undoped one with the same ratio MgO:TiO2 = 1:0.5 (Table 1). A noticeable decrease in the initial concentration of RhB dye in the solution immediately after immersing MgO–Mo(VI)–TiO2 composites is probably due to the adsorption of dye molecules on the high specific surface area mesoporous MgO-Mo(VI) carrier.
Under the action of visible light (λ > 420 nm), the photocatalytic activity of the suspended MgO-TiO2 composite is very low (Figure 6b), and a slight drop in the dye concentration on kinetic curves is due to its direct photochemical destruction. Doping of MgO carrier with Mo(VI) ions does not lead to the manifestation of photocatalytic activity, and the difference in the kinetic curves for this photocatalyst and the undoped one may be due to some differences in the porous structures of the doped and undoped MgO carrier (Table 1).
After the introduction of molybdenum into the photocatalyst in larger quantities providing the MoO3 phase formation, a noticeable activity of the photocatalyst under visible light is observed (Figure 6b). According to the schematic energy band diagram (inset in Figure 6b) constructed using the known energy parameters of the band edges (valence band Ev and conduction band Ec) [47], the optical transparency of the TiO2 outer layer ensures the access of photons to MoO3 inclusions with a smaller band gap than that of TiO2.
The photocatalytic activity of the MgO-MoO3-TiO2 composite under UV light can be related to the photogeneration of electron–hole pairs both in the MoO3 and TiO2 components of the isotype nn heterojunction [10]. In this case, the implementation of the S-scheme is also possible, in which photogenerated holes from TiO2 recombine with electrons from the conduction band of MoO3 [45] thus facilitating the involvement of electrons from the conduction band of TiO2 and holes from the valence band of MoO3 into surface reactions with the highest energy difference.
Testing the photocatalytic activity of obtained composites in the “dry” experiment, i.e., in the form of photocatalyst pellets with RhB sprayed on the surfaces, showed the highest photocatalytic activity of the catalyst based on Mo-doped MgO at the ratio of components [MgO-Mo(VI)]:TiO2 = 1:0.5 (Figure 7a, Table 1).
When nigrosin is used as a model dye instead of rhodamine B, the photocatalytic activity of the studied composites turns out to be significantly lower (Figure 7b), which is probably due to the high absorption capacity of nigrosin in the spectral region actinic for TiO2, as well as the higher chemical and photochemical stability of this dye.
Thus, the MgO-Mo(VI)-TiO2 (1 wt.% Mo) photocatalyst dispersed in an aqueous dye solution (Figure 6) as well as in a dry tablet form (Figure 7) possesses higher photocatalytic activity under UV irradiation in comparison with photocatalyst based on pristine MgO carrier. The appearance of photosensitivity to visible light (Table 1, Figure 6b) is also associated with the introduction of molybdenum into the MgO carrier, with the difference that the 10–20 wt.% amount of molybdenum is sufficient for the formation of MoO3 nanophase.
Following from the absorbance (A) spectra, Mo(VI) doping of MgO carrier at 1 wt.% concentration has practically no effect on the position of the longwave absorbance edge, while the introduction of 10 wt.% of Mo leads to its shift to lower energies (Figure 8a).
Due to the high light scattering, it is difficult to precisely determine the band gap energy Eg using the conventional procedure of extrapolating the linear part of the (Ahν)1/2, E dependence to zero absorbance. Figure 8b shows, at the qualitative level, the absence of a noticeable difference in the Eg values of the photocatalyst, the MgO carrier of which is undoped and doped with 1 wt.% Mo(VI). A slight decrease in the band gap energy occurs for the MgO substrate doped with 10 wt.% molybdenum. In our opinion, this effect can be considered as a photon absorbance in MoO3 phase inclusions with lower band gap energy than that of TiO2. Accordingly, the sensitivity of the photocatalyst to visible light can be associated with the intrinsic photocatalytic activity of MoO3 inclusions [75,76].
An increase in the photocatalytic activity of TiO2 photocatalyst on MgO carrier due to its Mo(VI)-doping without the formation of MoO3 nanophase (0.5–2 wt.% Mo) can presumably be associated with the predominant adsorption of RhB molecules by binding the positively charged diethylamine group with the acid sites associated with Mo(VI) ions (Figure 9A). In this case, photogenerated holes can directly attack the chromophore system of the dye. This process seems to be less efficient if the RhB molecules are adsorbed through their carboxyl group, in particular, when they are bound to the MgO surface (Figure 9B). On the other hand, if the adsorption of RhB molecules occurs on a microheterogeneous surface containing both MgO and TiO2 sites (Figure 9C), the photocatalytic destruction of the dye can be somewhat enhanced due to the orientation of the chromophore system to TiO2 sites and the binding of the carboxyl group with hydroxyl groups-enriched MgO surface.

3. Conclusions

Depending on the amount of introduced MoO3, two fundamentally different photocatalysts can be obtained: (a) MgO-Mo(VI)-TiO2 based on MgO carrier doped with (0.5–2) wt.% Mo(VI) ions and (b) MgO-MoO3-TiO2 heterostructure with a molybdenum content ≥10 wt.%, at which not only doping of TiO2 with Mo(VI) ions takes place but also the formation of MoO3 phase inclusions. The photocatalytic behavior of Mo(VI)-MgO-TiO2 catalyst is determined by two factors: (a) the peptizing effect of highly charged Mo(VI) ions on the colloidal particles during the deposition of Mg(OH)2 with subsequent formation of the mesoporous MgO carrier and (b) doping of titania through the diffusion of Mo(VI) ions from Mo(VI)-doped MgO carrier towards TiO2 surface contacting the reaction medium. Such doping results in a noticeable increase in the photocatalytic activity of TiO2 under the action of UV radiation but we failed to detect either a change in the band gap energy or the appearance of photoactivity in the visible region of the spectrum. At the same time, the presence of MoO3 phase inclusions in MgO–MoO3–TiO2 heterostructure and the formation of the isotype nn heterojunction makes it possible to generate electron–hole pairs under UV exposure both in the TiO2 layer and MoO3 inclusions. Such MgO–MoO3–TiO2 photocatalyst exhibits activity not only in the UV but also in the visible region of the spectrum, mainly due to the photon absorption by MoO3 inclusions with a band gap smaller than that of titanium dioxide.

4. Materials and Methods

Magnesium oxide powder with a high specific surface area was prepared by thermal decomposition of magnesium hydroxide synthesized in the presence of gelatin additive acting as a template [77]. Precipitation of Mg(OH)2 was carried out from an aqueous 20% MgCl2 (Merck, Darmstadt, Germany; CAS No. 7791-18-6; 99%) solution containing 1% gelatin (Merck, Darmstadt, Germany; CAS No. 9000-70-8, from bovine skin) by adding an aqueous 10% ammonia solution to pH 10.6, followed by maturation of the precipitate for 45 min, separation from the mother liquor and thorough washing with distilled water. Mg(OH)2 samples were dried at room temperature, then heated at 110 °C for 3 h and calcined at 400 °C for 3 h in air. Doping of MgO with Mo(VI) ions was carried out by treating the aqueous dispersion of MgO powder with (NH4)6Mo7O24 (Merck, Darmstadt, Germany; ACS reagent, CAS No. 12054-85-2; 81.0–83.0% MoO3 basis) solution in the amount of 1 wt.% Mo vs. MgO. At the end of two hours after keeping the colloidal MgO dispersion in the reaction medium, complete peptization of the precipitate took place, so, an additional amount of ammonia was added for complete precipitation of solid MgO particles.
Titania layer was deposited on the surface of MgO powder using 1%-solution of isopropanol tetrabutoxytitanium [CH3(CH2)3O]4Ti (Merck, Darmstadt, Germany; CAS No. 5593-70-4; reagent grade, 97%) with a variable molar ratio of components: MgO:TiO2 = 1:0.5; 1:0.25; 1:0.1. Determined amounts of tetrabutoxytitanium, isopropanol, and MgO carrier were mixed, and then, the calculated amount of distilled water was introduced into the colloidal system for the hydrolytic decomposition of tetrabutoxytitanium. After completing the hydrolysis, the precipitate was separated by centrifugation, dried at room temperature in air, then in an oven at 110 °C for 3 h, and calcined at 500 °C for 2.5 h in air.
X-ray diffraction (XRD) patterns of the samples were recorded on the ADVANCE D8 diffractometer (Bruker, Karlsruhe, Germany) with CuKα radiation (λ = 1.5405981 Å) in the 2Θ range from 10 to 70°, speed of 1°/min. The average microcrystallite sizes were computed from the half-width of the (200) line by Debye–Scherrer’s equation:
D = K λ β 0.5 cos ϑ ;   β 0.5 = B 0.5 2 b 0.5 2
where β0.5 is the physical broadening, K—coefficient close to 1; λ—wavelength (CuKα radiation); B0.5—half-width of the line for the sample; b0.5—half-width of the instrumental line. For the reference sample, the value is found to be as b0.5 = 3.96 × 10⁻³ rad.
The specific surface area (Sa) was determined using the Brunauer–Emmett–Teller (BET) method from a linear part of the plot. Adsorption isotherms were obtained with N2 at 77 K using ASAP 2020 analyzer (Micromeritics, Norcross, GA, USA). The distribution of the desorption pore diameter (DBJH) dV/dlogD was estimated using the Barret–Joyner–Halenda (BJH) model with the Horvath–Kawazoe method for mesopores. Before analysis, the samples were evacuated for 1 h at temperature 423 K and residual pressure of 133.3 × 10⁻³ Pa. FT-IR spectra of the samples were recorded on a Tensor-27 Fourier spectrophotometer (Bruker Optik GmbH, Ettlingen, Germany) in the range between 400 and 4000 cm–1 with a pressed KBr pellet (2 mg of substance per 800 mg of KBr) and processed using the GRAMS/32 program (Galactic Industrial Corporation, Salem, NH, USA). Reflectance UV–vis spectra were recorded in the diffuse reflectance mode and recalculated to absorption spectra through the Kubelka–Munk function. Lambda 35 (Perkin Elmer, Llantrisant, UK) spectrophotometer equipped with an integration sphere with BaSO4 powder as a standard was used.
The photocatalytic activity of the samples was evaluated in two ways: (a) by bleaching an aqueous dye solution in the presence of a dispersed photocatalyst and (b) by bleaching the surface of a solid tablet of photocatalyst powder pressed with a binder—microcrystalline cellulose (Merk, for column chromatography; Sa = 2.7 m2/g) containing 30% cellulose and 70% photocatalyst. Two dyes were used as model organic pollutants—rhodamine B (RhB) (Sigma Aldrich, Merck KGaA, Darmstadt, Germany; CAS No. 81-88-9, dye content 97%) and nigrosin (Merk, solvent black 5; CAS No. 11099-03-9), which were deposited on the surface of photocatalyst by spraying from an aqueous ethanol solution with 1 mg/mL concentration. The UV radiation source was a high-pressure mercury quartz 375 W lamp. An amount of 50 mL RhB solution containing 1 g/L of dispersed photocatalyst was irradiated with the full spectrum of the lamp through the open top of a 75 mL glass flask. In experiments with visible light exposure, the short-wave part of the full spectrum was cut off by an optical glass filter at the wavelength of 420 nm. The initial concentration of the dye was 4 × 10⁻⁵ mol/L. Changes in dye concentration in periodically sampled aliquots were determined by the absorption coefficient on an Agilent 8453 spectrophotometer (Agilent Technologies, Waldbronn, Germany). at the wavelength corresponding to the maximum dye absorption. The optical density of the surface of pelletized photocatalysts was determined by means of a SpectroDens densitometer (Techkon, Königstein, Germany) and unstained tablets of the same composition as an optical background.
EPR spectra were registered by means of E-3 X-band spectrometer (Varian, Palo Alto, CA, USA) using quartz ampules with an inner diameter of 3.0 mm (Bruker) at temperature 77 K in air; microwave field frequency—9.5 GHz, modulation frequency—100 kHz, and microwave field power—0.5 mW. The spin Hamiltonian parameters of Mo5+ species were determined in accordance with the recommendations given in [78]. The content of paramagnetic centers (PCs) of molybdenum ions (Mo5+) in the samples was determined by double integration of the spectra and comparison of the results with the reference data (spectrum of CuCl2·2H2O crystal with a known number of spins). The analysis of experimental EPR spectra was carried out using the computation software package/complex developed by Prof. A. Kh. Vorobyev (Faculty of Chemistry, M. V. Lomonosov Moscow State University) [79].

Author Contributions

Conceptualization, A.K. (Anatoly Kulak) and A.K. (Alexander Kokorin); methodology, A.K. (Anatoly Kulak); investigation, A.K. (Anatoly Kulak) and A.K. (Alexander Kokorin); data curation, A.K. (Anatoly Kulak); writing—original draft preparation, A.K. (Anatoly Kulak); writing—review and editing, A.K. (Alexander Kokorin). All authors have read and agreed to the published version of the manuscript.

Funding

This research was funded in the framework of the Program of Fundamental Research of the Russian Federation (Reg. No. 122040500068-0).

Data Availability Statement

Data will be made available upon request from corresponding author.

Acknowledgments

We are thankful to A. Kh. Vorobyev (Faculty of Chemistry, M. V. Lomonosov Moscow State University) kindly provided us with his software package/complex for EPR spectra processing. We also thank T. Galkova for her assistance in preparing photocatalyst samples and testing their photocatalytic activity.

Conflicts of Interest

The authors declare no conflict of interest. The funders had no role in the design of the study; in the collection, analyses, or interpretation of data; in the writing of the manuscript, or in the decision to publish the results.

References

  1. Nakata, K.; Fujishima, A. TiO2 photocatalysis: Design and applications. J. Photochem. Photobiol. C Photochem. Rev. 2012, 13, 169–189. [Google Scholar] [CrossRef]
  2. Schneider, J.; Matsuoka, M.; Takeuchi, M.; Zhang, J.; Horiuchi, Y.; Anpo, M.; Bahnemann, D.W. Understanding TiO2 photocatalysis: Mechanisms and materials. Chem. Rev. 2014, 114, 9919–9986. [Google Scholar] [CrossRef]
  3. Krut’ko, E.N.; Kulak, A.I. Heterogeneous composite titanium dioxide photocatalysts on phosphate supports. Theor. Exp. Chem. 2009, 45, 44–49. [Google Scholar] [CrossRef]
  4. Giannakopoulou, T.; Todorova, N.; Romanos, G.; Vaimakis, T.; Dillert, R.; Bahnemann, D.; Trapalis, C. Composite hydroxyapatite/TiO2 materials for photocatalytic oxidation of NOx. Mater. Sci. Eng. B 2012, 177, 1046–1052. [Google Scholar] [CrossRef]
  5. Anderson, C.; Bard, A.J. An improved photocatalyst of TiO2/SiO2 prepared by a sol-gel synthesis. J. Phys. Chem. 1995, 99, 9882–9885. [Google Scholar] [CrossRef]
  6. Anandan, S.; Yoon, M. Photocatalytic activities of the nano-sized TiO2-supported Y-zeolites. J. Photochem. Photobiol. C Photochem. Rev. 2003, 4, 5–18. [Google Scholar] [CrossRef]
  7. Fukahori, S.; Ichiura, H.; Kitaoka, T.; Tanaka, H. Capturing of bisphenol A photodecomposition intermediates by composite TiO2–zeolite sheets. Appl. Catal. B Environ. 2003, 46, 453–462. [Google Scholar] [CrossRef]
  8. Szczepanik, B. Photocatalytic degradation of organic contaminants over clay-TiO2 nanocomposites: A review. Appl. Clay Sci. 2017, 141, 227–239. [Google Scholar] [CrossRef]
  9. Ooka, C.; Yoshida, H.; Suzuki, K.; Hattori, T. Highly hydrophobic TiO2 pillared clay for photocatalytic degradation of organic compounds in water. Microporous Mesoporous Mater. 2004, 67, 143–150. [Google Scholar] [CrossRef]
  10. Kulak, A.I. Electrochemistry of Semiconductor Heterostructures; University Press: Minsk, Belarus, 1986; pp. 24–92. [Google Scholar]
  11. Papp, J.; Soled, S.; Dwight, K.; Wold, A. Surface acidity and photocatalytic activity of TiO2, WO3/TiO2, and MoO3/TiO2 photocatalysts. Chem. Mater. 1994, 6, 496–500. [Google Scholar] [CrossRef]
  12. Zhang, L.; Qin, M.; Yu, W.; Zhang, Q.; Xie, H.; Sun, Z.; Guo, Z. Heterostructured TiO2/WO3 nanocomposites for photocatalytic degradation of toluene under visible light. J. Electrochem. Soc. 2017, 164, H1086. [Google Scholar] [CrossRef]
  13. Liu, J.; Yang, S.; Wu, W.; Tian, Q.; Cui, S.; Dai, Z.; Jiang, C. 3D flowerlike α-Fe2O3@ TiO2 core–shell nanostructures: General synthesis and enhanced photocatalytic performance. ACS Sustain. Chem. Eng. 2015, 3, 2975–2984. [Google Scholar] [CrossRef]
  14. Li, Z.; Gao, B.; Chen, G.Z.; Mokaya, R.; Sotiropoulos, S.; Puma, G.L. Carbon nanotube/titanium dioxide (CNT/TiO2) core–shell nanocomposites with tailored shell thickness, CNT content and photocatalytic/photoelectrocatalytic properties. Appl. Catal. B Environ. 2011, 110, 50–57. [Google Scholar] [CrossRef]
  15. Dong, W.; Pan, F.; Xu, L.; Zheng, M.; Sow, C.H.; Wu, K.; Chen, W. Facile synthesis of CdS@TiO2 core–shell nanorods with controllable shell thickness and enhanced photocatalytic activity under visible light irradiation. Appl. Surf. Sci. 2015, 349, 279–286. [Google Scholar] [CrossRef]
  16. Xin, T.; Ma, M.; Zhang, H.; Gu, J.; Wang, S.; Liu, M.; Zhang, Q. A facile approach for the synthesis of magnetic separable Fe3O4@TiO2, core–shell nanocomposites as highly recyclable photocatalysts. Appl. Surf. Sci. 2014, 288, 51–59. [Google Scholar] [CrossRef]
  17. Kwiatkowski, M.; Chassagnon, R.; Heintz, O.; Geoffroy, N.; Skompska, M.; Bezverkhyy, I. Improvement of photocatalytic and photoelectrochemical activity of ZnO/TiO2 core/shell system through additional calcination: Insight into the mechanism. Appl. Catal. B Environ. 2017, 204, 200–208. [Google Scholar] [CrossRef]
  18. Pan, J.; Hühne, S.M.; Shen, H.; Xiao, L.; Born, P.; Mader, W.; Mathur, S. SnO2–TiO2 core–shell nanowire structures: Investigations on solid state reactivity and photocatalytic behavior. J. Phys. Chem. C 2011, 115, 17265–17269. [Google Scholar] [CrossRef]
  19. Szilagyi, I.M.; Santala, E.; Heikkilä, M.; Pore, V.; Kemell, M.; Nikitin, T.; Leskelä, M. Photocatalytic properties of WO3/TiO2 core/shell nanofibers prepared by electrospinning and atomic layer deposition. Chem. Vapor Deposit. 2013, 19, 149–155. [Google Scholar] [CrossRef]
  20. Li, L.; Liu, X.; Zhang, Y.; Salvador, P.A.; Rohrer, G.S. Heterostructured (Ba, Sr)TiO3/TiO2 core/shell photocatalysts: Influence of processing and structure on hydrogen production. Int. J. Hydrogen Energy 2013, 38, 6948–6959. [Google Scholar] [CrossRef]
  21. Hu, K.; Li, Y.; Zhao, X.; Zhao, D.; Zhao, W.; Rong, H. Photocatalytic degradation mechanism of the visible-light responsive BiVO4/TiO2 core–shell heterojunction photocatalyst. J. Inorg. Organomet. Polym. Mater. 2020, 30, 775–788. [Google Scholar] [CrossRef]
  22. Li, Y.; Ji, S.; Gao, Y.; Luo, H.; Kanehira, M. Core-shell VO2@TiO2 nanorods that combine thermochromic and photocatalytic properties for application as energy-saving smart coatings. Sci. Rep. 2013, 3, 1–13. [Google Scholar] [CrossRef] [PubMed] [Green Version]
  23. Liu, Y.; Ding, S.; Xu, J.; Zhang, H.; Yang, S.; Duan, X.; Wang, S. Preparation of a pn heterojunction BiFeO3@TiO2 photocatalyst with a core–shell structure for visible-light photocatalytic degradation. Chin. J. Catal. 2017, 38, 1052–1062. [Google Scholar] [CrossRef]
  24. Chu, S.; Zheng, X.; Kong, F.; Wu, G.; Luo, L.; Guo, Y.; Zou, Z. Architecture of Cu2O@TiO2 core–shell heterojunction and photodegradation for 4-nitrophenol under simulated sunlight irradiation. Mater. Chem. Phys. 2011, 129, 1184–1188. [Google Scholar] [CrossRef]
  25. Li, Y.; Wang, L.; Li, Z.; Liu, Y.; Peng, Z.; Zhou, M.; Jin, W. Synthesis and photocatalytic property of V2O5@TiO2 core-shell microspheres towards gaseous benzene. Catal. Today 2019, 321, 164–171. [Google Scholar] [CrossRef]
  26. Klosek, S.; Raftery, D. Visible light driven V-doped TiO2 photocatalyst and its photooxidation of ethanol. J. Phys. Chem. B 2001, 105, 2815–2819. [Google Scholar] [CrossRef]
  27. Kokorin, A.I.; Pergushov, V.I.; Kulak, A.I. EPR Evidence for Dynamic Rearrangements of Vanadium Paramagnetic Centers on the Surface of V-Doped Titanium Dioxide. Catal. Lett. 2020, 150, 263–272. [Google Scholar] [CrossRef]
  28. Wang, S.; Bai, L.N.; Sun, H.M.; Jiang, Q.; Lian, J.S. Structure and photocatalytic property of Mo-doped TiO2 nanoparticles. Powder Technol. 2013, 244, 9–15. [Google Scholar] [CrossRef]
  29. Yu, J.; Yu, H.; Ao, C.H.; Lee, S.C.; Jimmy, C.Y.; Ho, W. Preparation, characterization and photocatalytic activity of in situ Fe-doped TiO2 thin films. Thin Solid Films 2006, 496, 273–280. [Google Scholar] [CrossRef]
  30. Kokorin, A.I.; Amal, R.; Teoh, W.Y.; Kulak, A.I. Studies of nanosized iron-doped TiO2 photocatalysts by spectroscopic methods. Appl. Magn. Reson. 2017, 48, 447–459. [Google Scholar] [CrossRef]
  31. Wang, C.; Shi, H.; Li, Y. Synthesis and characterization of natural zeolite supported Cr-doped TiO2 photocatalysts. Appl. Surf. Sci. 2012, 258, 4328–4333. [Google Scholar] [CrossRef]
  32. Zaleska, A. Doped-TiO2: A review. Recent Pat. Eng. 2008, 2, 157–164. [Google Scholar] [CrossRef]
  33. Akpan, U.G.; Hameed, B.H. The advancements in sol–gel method of doped-TiO2 photocatalysts. Appl. Catal. A General 2010, 375, 1–11. [Google Scholar] [CrossRef]
  34. Basavarajappa, P.S.; Patil, S.B.; Ganganagappa, N.; Reddy, K.R.; Raghu, A.V.; Reddy, C.V. Recent progress in metal-doped TiO2, non-metal doped/codoped TiO2 and TiO2 nanostructured hybrids for enhanced photocatalysis. Int. J. Hydrogen Energy 2020, 45, 7764–7778. [Google Scholar] [CrossRef]
  35. Wang, Z.; Lin, Z.; Shen, S.; Zhong, W.; Cao, S. Advances in designing heterojunction photocatalytic materials. Chin. J. Catal. 2021, 42, 710–730. [Google Scholar] [CrossRef]
  36. Liao, G.; Li, C.; Liu, S.Y.; Fang, B.; Yang, H. Emerging frontiers of Z-scheme photocatalytic systems. Trends Chem. 2022, 4, 111–127. [Google Scholar] [CrossRef]
  37. Ren, G.; Han, H.; Wang, Y.; Liu, S.; Zhao, J.; Meng, X.; Li, Z. Recent advances of photocatalytic application in water treatment: A review. Nanomaterials 2021, 11, 1804. [Google Scholar] [CrossRef]
  38. Wang, H.; Li, X.; Zhao, X.; Li, C.; Song, X.; Zhang, P.; Huo, P. A review on heterogeneous photocatalysis for environmental remediation: From semiconductors to modification strategies. Chin. J. Catal. 2022, 43, 178–214. [Google Scholar] [CrossRef]
  39. Fang, M.; Tan, X.; Liu, Z.; Hu, B.; Wang, X. Recent progress on metal-enhanced photocatalysis: A review on the mechanism. Research 2021, 2021, 9794329. [Google Scholar] [CrossRef]
  40. Weng, B.; Qi, M.Y.; Han, C.; Tang, Z.R.; Xu, Y.J. Photocorrosion inhibition of semiconductor-based photocatalysts: Basic principle, current development, and future perspective. ACS Catal. 2019, 9, 4642–4687. [Google Scholar] [CrossRef]
  41. Karim, A.V.; Krishnan, S.; Shriwastav, A. An overview of heterogeneous photocatalysis for the degradation of organic compounds: A special emphasis on photocorrosion and reusability. J. Indian Chem. Soc. 2022, 99, 100480. [Google Scholar] [CrossRef]
  42. Khan, M.; Xu, J.; Cao, W.; Liu, Z.K. Mo-doped TiO2 with enhanced visible light photocatalytic activity: A combined experimental and theoretical study. J. Nanosci. Nanotechnol. 2014, 14, 6865–6871. [Google Scholar] [CrossRef] [PubMed]
  43. Stengl, V.; Bakardjieva, S. Molybdenum-doped anatase and its extraordinary photocatalytic activity in the degradation of orange II in the UV and vis regions. J. Phys. Chem. C 2010, 114, 19308–19317. [Google Scholar] [CrossRef]
  44. Fisher, L.; Ostovapour, S.; Kelly, P.; Whitehead, K.A.; Cooke, K.; Storgårds, E.; Verran, J. Molybdenum doped titanium dioxide photocatalytic coatings for use as hygienic surfaces: The effect of soiling on antimicrobial activity. Biofouling 2014, 30, 911–919. [Google Scholar] [CrossRef] [PubMed]
  45. Alnaggar, G.; Alkanad, K.; Chandrashekar, S.S.G.; Bajiri, M.A.; Drmosh, Q.A.; Krishnappagowda, L.N.; Ananda, S. Rational design of a 2D TiO2–MoO3 step-scheme heterostructure for boosted photocatalytic overall water splitting. New J. Chem. 2022, 46, 9629–9640. [Google Scholar] [CrossRef]
  46. Bai, S.; Liu, H.; Sun, J.; Tian, Y.; Chen, S.; Song, J.; Liu, C.C. Improvement of TiO2 photocatalytic properties under visible light by WO3/TiO2 and MoO3/TiO2 composites. Appl. Surf. Sci. 2015, 338, 61–68. [Google Scholar] [CrossRef]
  47. Kong, F.; Huang, L.; Luo, L.; Chu, S.; Wang, Y.; Zou, Z. Synthesis and characterization of visible light driven mesoporous nano-photocatalyst MoO3/TiO2. J. Nanosci. Nanotechnol. 2012, 12, 1931–1937. [Google Scholar] [CrossRef]
  48. Odhiambo, V.O.; Le Ba, T.; Kónya, Z.; Cserháti, C.; Erdélyi, Z.; Naomi, M.C.; Szilágyi, I.M. Preparation of TiO2–MoO3 composite nanofibers by water-based electrospinning process and their application in photocatalysis. Mater. Sci. Semicond. Process. 2022, 147, 106699. [Google Scholar] [CrossRef]
  49. Yang, Y.; Li, X.J.; Chen, J.T.; Wang, L.Y. Effect of doping mode on the photocatalytic activities of Mo/TiO2. J. Photochem. Photobiol. A Chem. 2004, 163, 517–522. [Google Scholar] [CrossRef]
  50. Natori, H.; Kobayashi, K.; Takahashi, M. Fabrication and photocatalytic activity of TiO2/MoO3 particulate films. J. Oleo Sci. 2009, 58, 203–211. [Google Scholar] [CrossRef] [Green Version]
  51. Takahashi, Y.; Ngaotrakanwiwat, P.; Tatsuma, T. Energy storage TiO2–MoO3 photocatalysts. Electrochim. Acta 2004, 49, 2025–2029. [Google Scholar] [CrossRef]
  52. Song, K.Y.; Park, M.K.; Kwon, Y.T.; Lee, H.W.; Chung, W.J.; Lee, W.I. Preparation of transparent particulate MoO3/TiO2 and WO3/TiO2 films and their photocatalytic properties. Chem. Mater. 2001, 13, 2349–2355. [Google Scholar] [CrossRef]
  53. Devi, L.G.; Murthy, B.N.; Kumar, S.G. Photocatalytic activity of V5+, Mo6+ and Th4+ doped polycrystalline TiO2 for the degradation of chlorpyrifos under UV/solar light. J. Mol. Catal. A Chem. 2009, 308, 174–181. [Google Scholar] [CrossRef]
  54. Elder, S.H.; Cot, F.M.; Su, Y.; Heald, S.M.; Tyryshkin, A.M.; Bowman, M.K.; Blake, D.M. The discovery and study of nanocrystalline TiO2-(MoO3) core-shell materials. JACS 2000, 122, 5138–5146. [Google Scholar] [CrossRef]
  55. Liu, L.; Zhao, C.; Zhao, H.; Pitts, D.; Li, Y. Porous microspheres of MgO-patched TiO2 for CO2 photoreduction with H2O vapor: Temperature-dependent activity and stability. Chem. Commun. 2013, 49, 3664–3666. [Google Scholar] [CrossRef] [PubMed]
  56. Bandara, J.; Hadapangoda, C.C.; Jayasekera, W.G. TiO2/MgO composite photocatalyst: The role of MgO in photoinduced charge carrier separation. Appl. Catal. B Environ. 2004, 50, 83–88. [Google Scholar] [CrossRef]
  57. Shrestha, K.M.; Sorensen, C.M.; Klabunde, K.J. MgO–TiO2 mixed oxide nanoparticles: Comparison of flame synthesis versus aerogel method; characterization, and photocatalytic activities. J. Mater. Res. 2013, 28, 431–439. [Google Scholar] [CrossRef]
  58. Wu, S.; Han, H.; Tai, Q.; Zhang, J.; Xu, S.; Zhou, C.; Zhao, X.Z. Enhancement in dye-sensitized solar cells based on MgO-coated TiO2 electrodes by reactive DC magnetron sputtering. Nanotechnology 2008, 19, 215704. [Google Scholar] [CrossRef]
  59. Raman, C.V. The vibrations of the MgO crystal structure and its infra-red absorption spectrum. Proc. Indian Acad. Sci. 1961, A54, 205–222. [Google Scholar] [CrossRef]
  60. Nakamoto, K. Infrared and Raman Spectra of Inorganic and Coordination Compounds, Part B: Applications in Coordination, Organometallic, and Bioinorganic Chemistry; John Wiley & Sons: Hoboken, NJ, USA, 2009; 400 p. [Google Scholar]
  61. Benesi, H.A. Infrared spectrum of Mg(OH)2. J. Chem. Phys. 1959, 30, 852. [Google Scholar] [CrossRef]
  62. Mestl, G.; Verbruggen, N.F.D.; Knozinger, H. Mechanically activated MoO3. 2 Characterization of defect structures. Langmuir 1995, 11, 3035–3041. [Google Scholar] [CrossRef]
  63. Mestl, G.; Verbruggen, N.F.D.; Bosch, E.; Knozinger, H. Mechanically Activated MoO3. 5. Redox behavior. Langmuir 1996, 12, 2961–2968. [Google Scholar] [CrossRef]
  64. Streletskii, A.N.; Sivak, M.V.; Dolgoborodov, A.Y. Nature of high reactivity of metal/solid oxidizer nanocomposites prepared by mechanoactivation: A review. J. Mater. Sci. 2017, 52, 11810–11825. [Google Scholar] [CrossRef]
  65. Konstantinova, E.A.; Kokorin, A.I.; Minnekhanov, A.A.; Sviridova, T.V.; Sviridov, D.V. EPR Study of Photoexcited Charge Carrier Behavior in TiO2/MoO3 and TiO2/MoO3:V2O5 Photocatalysts. Catal. Lett. 2019, 149, 2256–2267. [Google Scholar] [CrossRef]
  66. Logvinovich, A.S.; Sviridova, T.V.; Konstantinova, E.A.; Kokorin, A.I.; Sviridov, D.V. Solvothermally-derived MoO3-benzotriazole hybrid structures for nanocontainer depot systems. New J. Chem. 2020, 44, 11131–11136. [Google Scholar] [CrossRef]
  67. Al’tshuler, S.A.; Kozyrev, B.M. Elektron Paramagnetic Resonance in Compounds of Transition Elements; J. Wiley & Sons: New York, NY, USA, 1974. [Google Scholar]
  68. Kokorin, A.I. Electron spin resonance of nanostructured oxide semiconductors. In Chemical Physics of Nanostructured Semiconductors; Kokorin, A., Bahnemann, D., Eds.; VSP-Brill Academic Publishers: Boston, MA, USA, 2003; p. 203. [Google Scholar]
  69. Weil, J.A.; Bolton, J.R. Relaxation Times, Linewidths and Spin Kinetic Phenomena. In Electron Paramagnetic Resonance; John Wiley & Sons: New York, NY, USA, 2006; pp. 301–356. [Google Scholar]
  70. Labanowska, M. Paramagnetic defects in MoO3—revisited. Phys. Chem. Chem. Phys. 1999, 1, 5385–5392. [Google Scholar] [CrossRef]
  71. Nova, I.; Lietti, L.; Casagrande, L.; Dall’Acqua, L.; Giamello, E.; Forzatti, P. Characterization and Reactivity of TiO2-Supported MoO3 de-NOx SCR Catalysts. Appl. Catal. B 1998, 17, 245–258. [Google Scholar] [CrossRef]
  72. Dall’Acqua, L.; Nova, I.; Lietti, L.; Ramis, G.; Busca, G.; Giamello, E. Spectroscopic Characterisation of MoO3/TiO2 de-NOx SCR Catalysts: Redox and Coordination Properties. Phys. Chem. Chem. Phys. 2000, 2, 4991–4998. [Google Scholar] [CrossRef]
  73. Dyrek, K.; Labanowska, M. Electron paramagnetic resonance investigation of the paramagnetic centres in polycrystalline MoO3. J. Chem. Soc. Faraday Trans. 1991, 87, 1003–1009. [Google Scholar] [CrossRef]
  74. Eaton, G.R.; Eaton, S.S.; Barr, D.P.; Weber, R.T. Quantitative EPR; Springer: Vienna, Austria, 2010. [Google Scholar]
  75. Liu, Y.; Feng, P.; Wang, Z.; Jiao, X.; Akhtar, F. Novel fabrication and enhanced photocatalytic MB degradation of hierarchical porous monoliths of MoO3 nanoplates. Sci. Rep. 2017, 7, 1–12. [Google Scholar]
  76. Hu, H.; Deng, C.; Xu, J.; Zhang, K.; Sun, M. Metastable h-MoO3 and stable α-MoO3 microstructures: Controllable synthesis, growth mechanism and their enhanced photocatalytic activity. J. Exp. Nanosci. 2015, 10, 1336–1346. [Google Scholar] [CrossRef]
  77. Nagpal, M.; Kakkar, R. Facile synthesis of mesoporous magnesium oxide–graphene oxide composite for efficient and highly selective adsorption of hazardous anionic dyes. Res. Chem. Intermed. 2020, 46, 2497–2521. [Google Scholar] [CrossRef]
  78. Kuska, H.A.; Rogers, M.T. ESR of First Row Transition Metal Complex Ions; Interscience: New York, NY, USA, 1968; Mir: Moscow, Russia, 1970. [Google Scholar]
  79. Vorobiev, A.K.; Chumakova, N.A. Simulation of rigidlimit and slow-motion EPR spectra for extraction of quantitative dynamic and orientational information. In Nitroxides—Theory, Experiment and Applications; Kokorin, A.I., Ed.; InTech Publ: Riecka, Slovakia, 2012; pp. 57–112. [Google Scholar]
Figure 1. XRD patterns of MgO-TiO2 composites based on pristine magnesium oxide (a) and MgO-Mo(VI)-TiO2 composites based on Mo-doped MgO (b) at a molar ratio of components MgO:TiO2 = 1:0 (curves 4, 5), 1:0.1 (curve 3), 1:0.25 (curve 2) and 1:0.5 (curve 1). Molybdenum content [Mo(VI)] in MgO substrate is 1 wt.% (“b”, curves 1–4), 10 wt.% (“b”, curve 5). MgO substrate was heat-treated in air at 400 °C; MgO-TiO2 composite—at 500 °C. o—MgO, x—TiO2 (anatase), *—MgTi2O5, +—Mg1.5Ti1.5O4, #—MoO3, Δ—MgMoO4.
Catalysts 13 00454 g001
Figure 2. Adsorption isotherms (a) and desorption pore volume distribution (b) of Mo(VI)-doped MgO (1), MgO-TiO2 (2), and MgO-Mo(VI)-TiO2 (3) composites with MgO:TiO2 ratio = 1:0.5.
Catalysts 13 00454 g002
Figure 3. FTIR spectra of pristine MgO (1), 1 wt.% Mo-doped MgO (2), and MgO-Mo(VI)-TiO2 (3).
Catalysts 13 00454 g003
Figure 4. Typical EPR spectra recorded at 77 K of MoO3 applied to MgO surface: 1—before the reaction, 2—after the reaction at 300 °C, 3—after the reaction at 400 °C. Narrow lines marked as * belong to the external standard, Mn2+ ions in MgO matrix.
Catalysts 13 00454 g004
Figure 5. EPR spectra at 77 K of MoO3 samples containing (a) 8.5 × 10¹⁷, (b) 2.1 × 10¹⁸, and (c) 4.4 × 10¹⁸ spin/g Mo5+ ions.
Catalysts 13 00454 g005
Figure 6. Kinetic curves of the photocatalytic destruction of rhodamine B in an aqueous suspension of the MgO-TiO2, MgO-Mo(VI)-TiO2 (1 wt.% Mo), and MgO-MoO3-TiO2 (10 wt.% Mo) composite under the action of UV radiation (a) and visible light (b). Inset (b): schematic energy band diagram of nn MoO3-TiO2 heterojunction. The concentration of RhB is 40 µmol/L.
Catalysts 13 00454 g006
Figure 7. Kinetic curves of the photocatalytic degradation of rhodamine B (a) and nigrosin (b) on the surface of a pelletized MgO-Mo(VI)-TiO2 (1 wt.% Mo) photocatalyst under the action of the full spectrum of a mercury quartz lamp.
Catalysts 13 00454 g007
Figure 8. Absorbance spectra (a) and (Ahν)1/2 vs. photon energy curves for MgO-TiO2 (curve 1), MgO-Mo(VI)-TiO2 (curve 2), and MgO-MoO3-TiO2 (curve 3) photocatalysts. Dotted lines in (b) correspond to zero absorption minus the scattering effect; dashed lines mean the linear extrapolation of (Ahν)1/2, E curves. The content of molybdenum in the MgO carrier is 1 wt.% (curve 2) and 10 wt.% (curve 3). MgO:TiO2 = 1:0.5.
Catalysts 13 00454 g008
Figure 9. Schematic representation of adsorption interaction of rhodamine B molecules with Mo(VI)-doped MgO (A), MgO (B), and MgO-TiO2 (C) sites.
Catalysts 13 00454 g009
Table 1. Average microcrystallite sizes * (r), specific surface area ** (Sa), cumulative pore volume *** (Vp), average pore diameter *** (Dp), and pseudo-first-order rate constant k1 for Rhodamine B photodegradation under UV irradiation (high-pressure mercury quartz UV lamp) and visible light (λ > 420 nm) for pristine MgO, MgO-Mo(VI)-TiO2, MgO-MoO3-TiO2 composites **** dispersed (1 g/L) in an aqueous solution containing 4 × 10⁻⁵ mol/L RhB.
Composite[Mo], wt.%r, nmSa m2/gVp, cm3/gDp, nmk1, min−1 (UV)k1, min−1 (vis)
Pristine MgO043.6420.116.14N/AN/A
MgO-TiO2010.1500.1810.90.028<0.001
MgO-Mo(VI)1.09.42080.455.46N/AN/A
MgO-Mo(VI)-TiO20.512.51910.335.050.035<0.001
MgO-Mo(VI)-TiO21.09.4630.197.750.037<0.001
MgO-Mo(VI)-TiO22.09.32100.375.120.0310.002
MgO-Mo(VI)-TiO2;
MgO-MoO3-TiO2
5.09.71930.294.010.0200.003
MgO-MoO3-TiO210.010.91100.223.770.0190.012
MgO-MoO3-TiO220.010.4760.213.150.0140.013
* Calculated from the half-width of the (200) XRD line by Debye–Scherrer method; ** measured by Brunauer–Emmett–Teller method using N2 desorption isotherm; *** estimated using the Barret–Joyner–Halenda model with the Horvath–Kawazoe method for mesopores desorption; **** MgO:TiO2 = 1:0.5.
Table 2. EPR g-tensor parameters of Mo5+ species at 77 K.
Sampleg (g1)g|| (g2)g|| (g3)g3Ref.
MgO-MoO3 1.925-1.840This work
MoO3 1.9231.9121.839This work
MoO3/TiO2 1.9237-1.8755[71]
MoO3/TiO2 1.9441.8441.839[72]
MoO3/TiO2 1.916-1.819[65]
MoO3 1.961.941.87[62,63]
MoO3 1.9541.9411.865[73]
MoO3 1.936-1.899[73]
MoO3 1.9571.9431.864[70]
MoO3 1.933-1.910[70]
Table 3. Concentrations of paramagnetic Mo5+ centers in MgO samples doped by molybdenum.
SampleMo/InitialMo/300°Mo/400°
[M5+], spin/g2.6 × 10172.1 × 10181.6 × 1018
Disclaimer/Publisher’s Note: The statements, opinions and data contained in all publications are solely those of the individual author(s) and contributor(s) and not of MDPI and/or the editor(s). MDPI and/or the editor(s) disclaim responsibility for any injury to people or property resulting from any ideas, methods, instructions or products referred to in the content.

