
Template-Assisted SnO2: Synthesis, Composition, and Photoelectrocatalytical Properties

Abstract
:
1. Introduction
2. Results
2.1. Flat-Band Potentials Determination
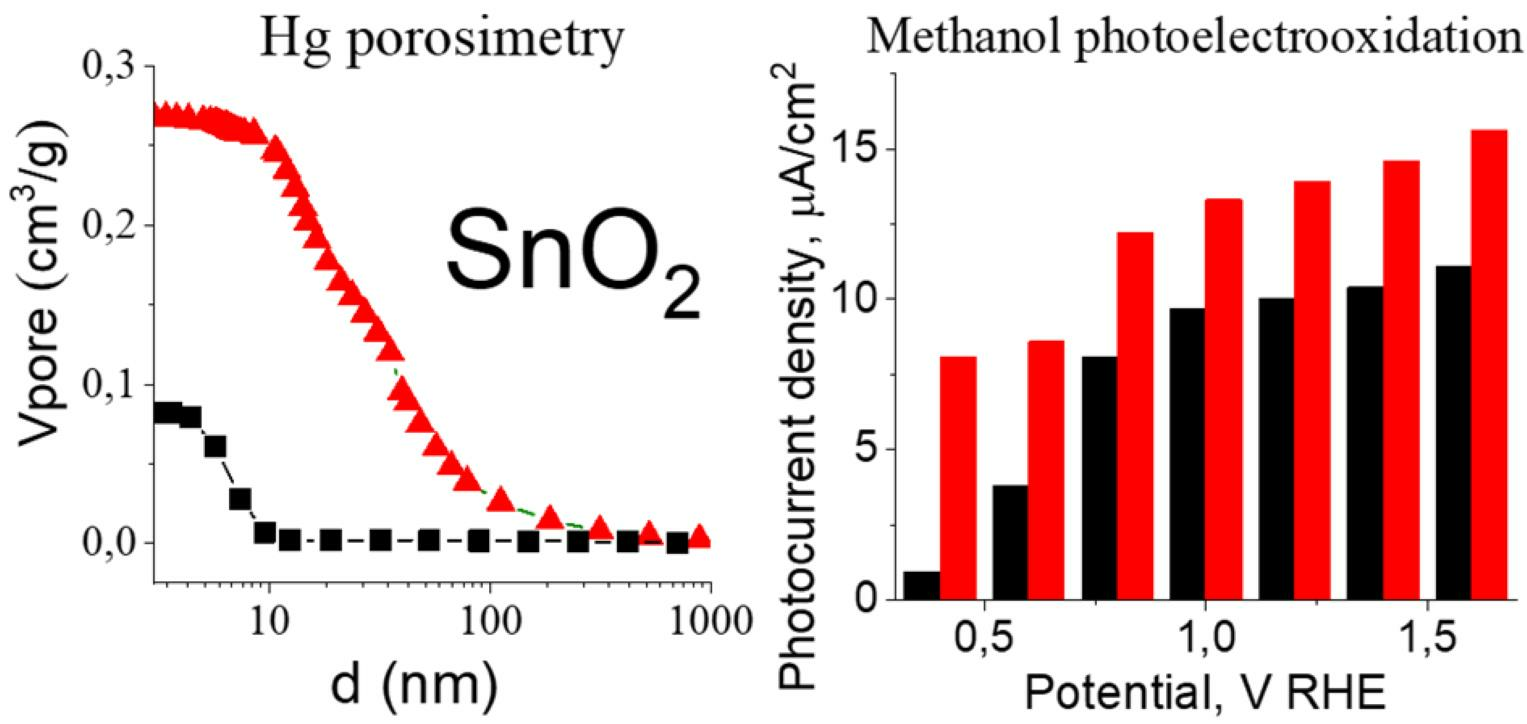
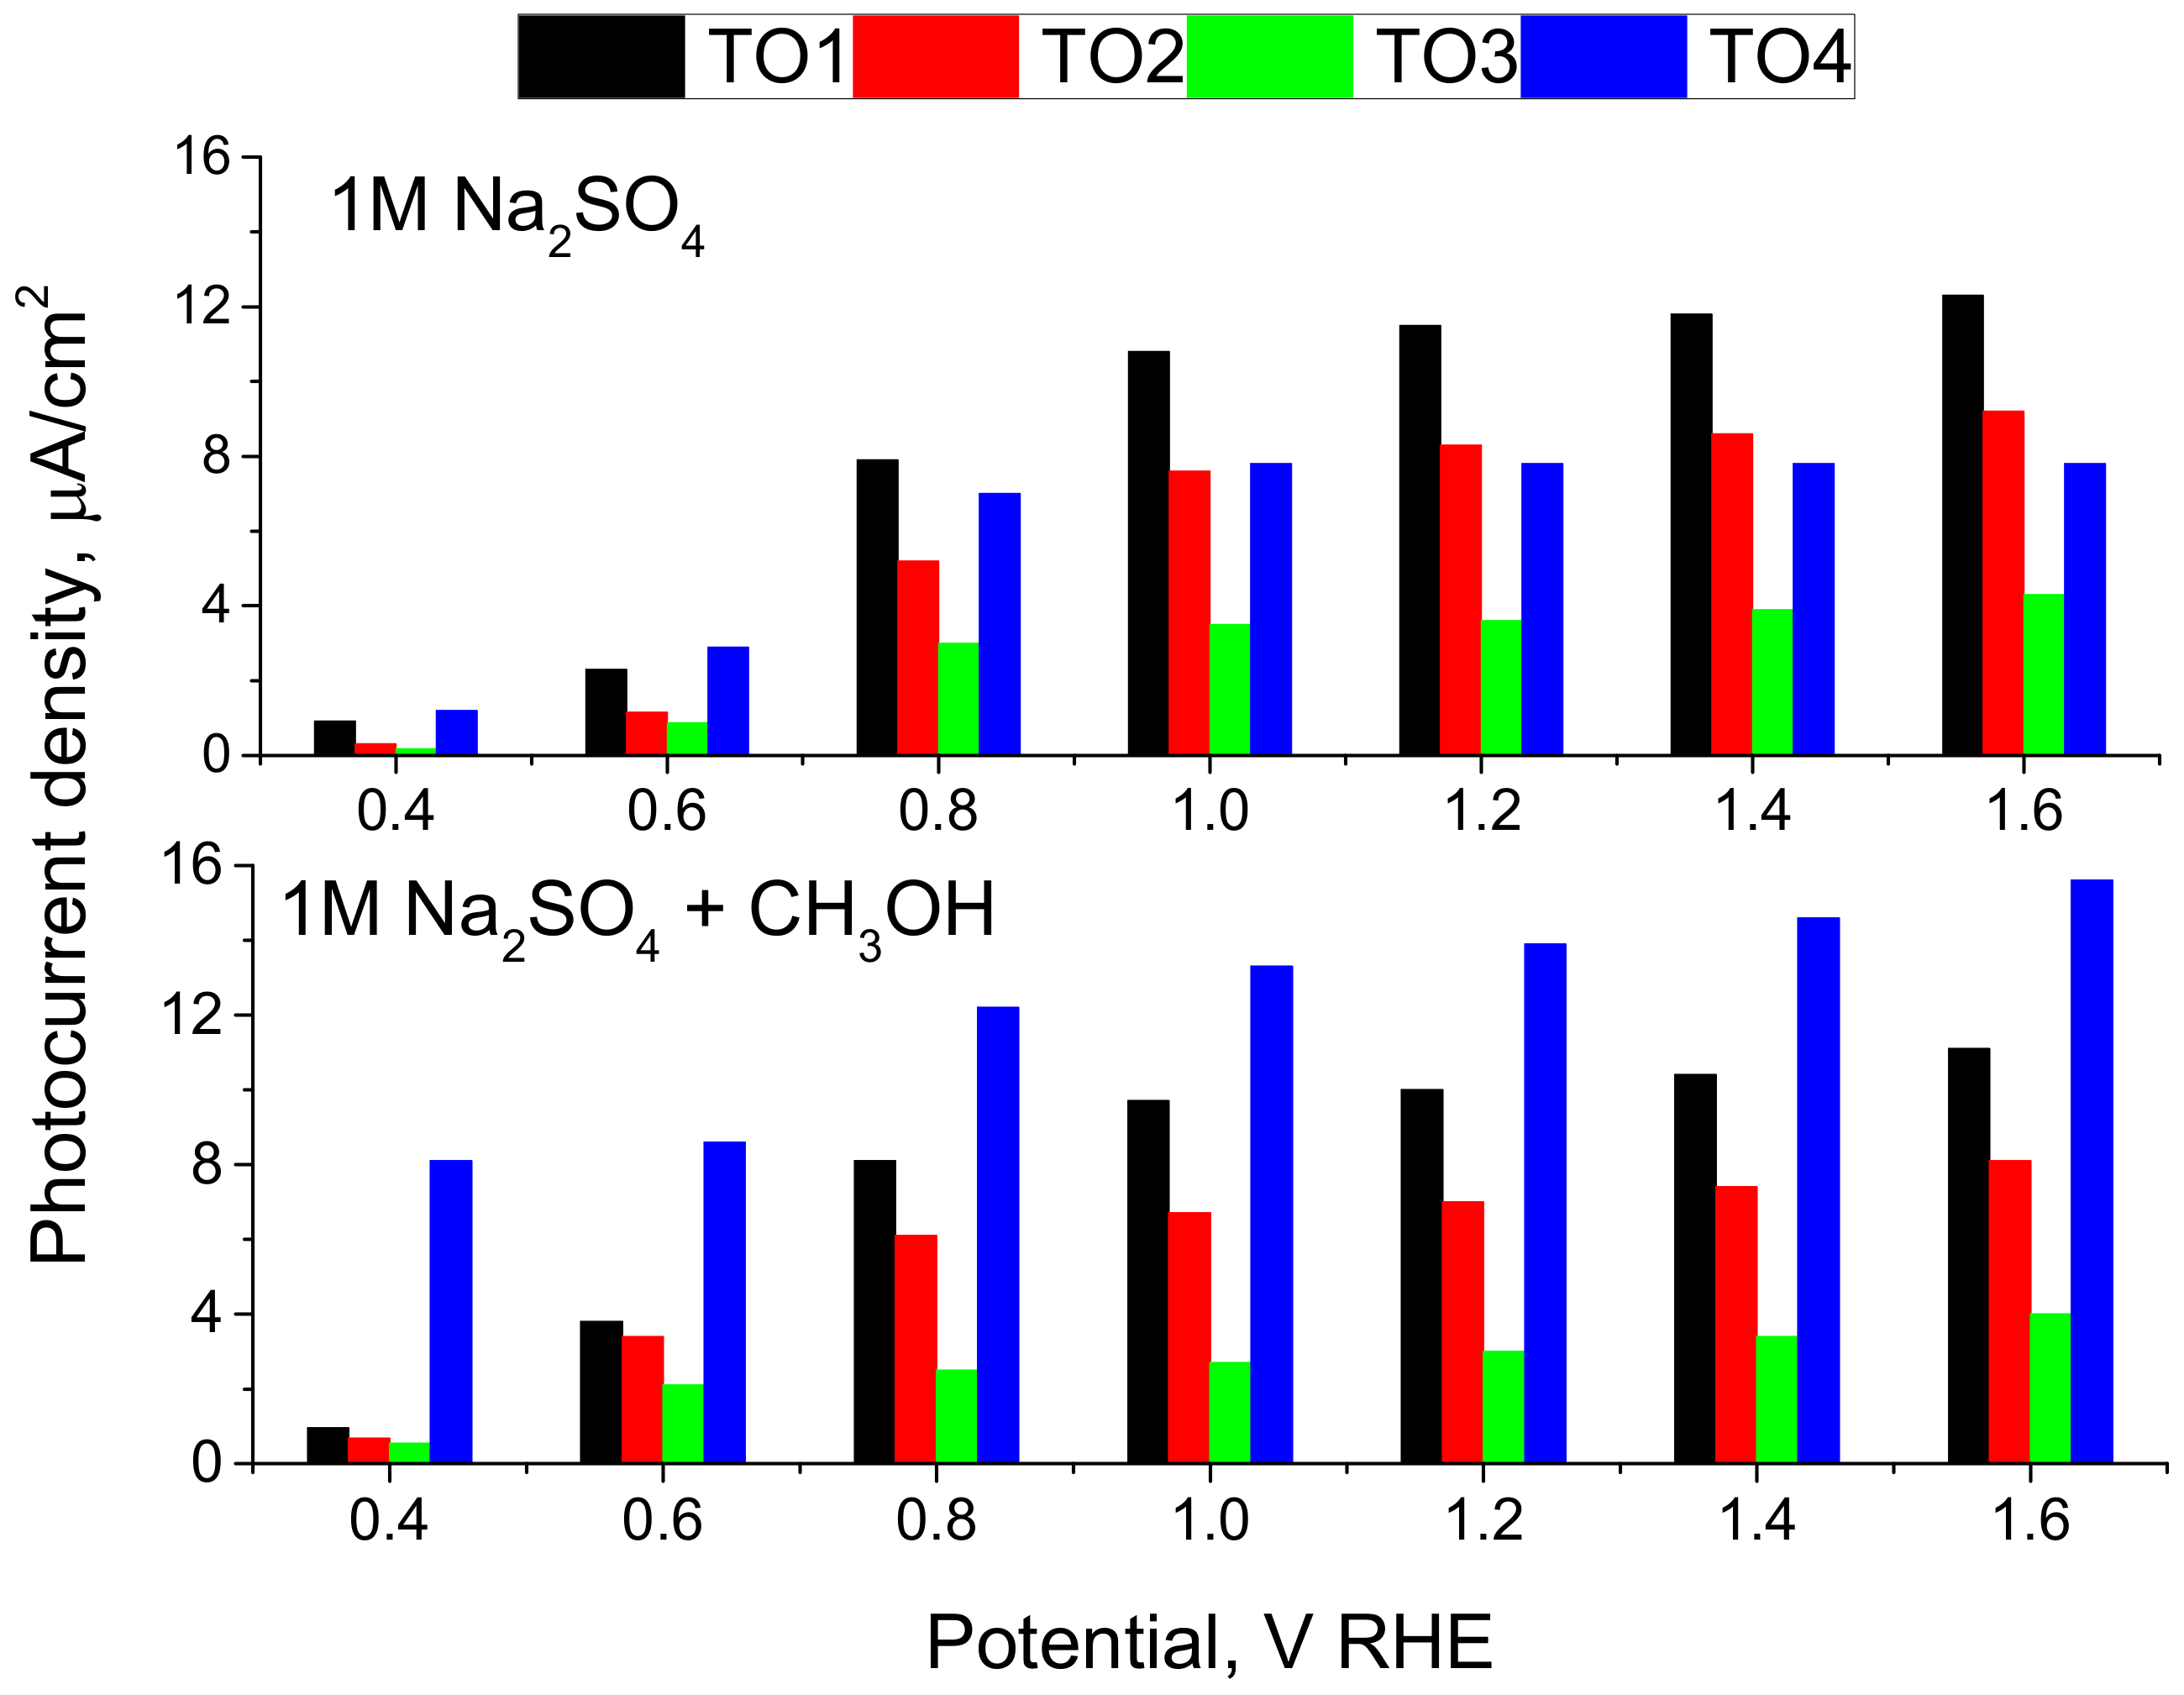
2.2. Photoelectrocatalytic Properties
3. Experimental
3.1. Materials
3.2. Synthesis of Tin Oxides
3.3. Physicochemical Characterization
3.4. Electrochemical Characterization
3.5. Photoelectrocatalytic Tests
3.6. Flat-Band Potential Determination
4. Conclusions
Supplementary Materials
Author Contributions
Funding
Data Availability Statement
Acknowledgments
Conflicts of Interest
References
- Sharma, A.; Ahmed, A.; Singh, A.; Oruganti, S.K.; Khosla, A.; Arya, S. Review—Recent Advances in Tin Oxide Nanomaterials as Electrochemical/Chemiresistive Sensors. J. Electrochem. Soc. 2021, 168, 027505. [Google Scholar] [CrossRef]
- Reddy, M.V.; Linh, T.T.; Hien, D.T.; Chowdari, B.V.R. SnO2 Based Materials and Their Energy Storage Studies. ACS Sustain. Chem. Eng. 2016, 4, 6268–6276. [Google Scholar] [CrossRef]
- Dalapati, G.K.; Sharma, H.; Guchhait, A.; Chakrabarty, N.; Bamola, P.; Liu, Q.; Saianand, G.; Sai Krishna, A.M.; Mukhopadhyay, S.; Dey, A.; et al. Tin oxide for optoelectronic, photovoltaic and energy storage devices: A review. J. Mater. Chem. A 2021, 9, 16621–16684. [Google Scholar] [CrossRef]
- Sun, C.; Yang, J.; Xu, M.; Cui, Y.; Ren, W.; Zhang, J.; Zhao, H.; Liang, B. Recent intensification strategies of SnO2-based photocatalysts: A review. Chem. Eng. J. 2022, 427, 131564. [Google Scholar] [CrossRef]
- Mishra, S.R.; Ahmaruzzaman, M. Tin oxide based nanostructured materials: Synthesis and potential applications. Nanoscale. 2022, 14, 1566–1605. [Google Scholar] [CrossRef]
- Dhanalakshmi, M.; Saravanakumar, K.; Lakshmi Prabavathi, S.; Abinaya, M.; Muthuraj, V. Fabrication of novel surface plasmon resonance induced visible light driven iridium decorated SnO2 nanorods for degradation of organic contaminants. J. Alloys Compd. 2018, 763, 512–524. [Google Scholar] [CrossRef]
- Tang, J.J.; Zhao, T.P.; Li, Z.H.; Xiao, Q.Z.; Lei, G.T.; Gao, D.S. Preparation and electrochemical study of three-dimensional ordered macroporous SnO2 material for lithium ion batteries. Nanosci. Nanotechnol. Lett. 2012, 4, 185–190. [Google Scholar] [CrossRef]
- Yim, C.H.; Baranova, E.A.; Courtel, F.M.; Abu-Lebdeh, Y.; Davidson, I.J. Synthesis and characterization of macroporous tin oxide composite as an anode material for Li-ion batteries. J. Power Sources 2011, 196, 9731–9736. [Google Scholar] [CrossRef]
- Li, Z.; Tan, Y.; Huang, X.; Zhang, W.; Gao, Y.; Tang, B. Three-dimensionally ordered macroporous SnO2 as anode materials for lithium ion batteries. Ceram. Int. 2016, 42, 18887–18893. [Google Scholar] [CrossRef]
- Hashimoto, M.; Inoue, H.; Hyodo, T.; Shimizu, Y.; Egashira, M. Preparation and gas sensor application of ceramic particles with submicron-size spherical macropores. Sens. Lett. 2008, 6, 887–890. [Google Scholar] [CrossRef]
- Park, N.K.; Lee, T.H.; Kim, M.J.; Lee, T.J. Preparation of macroporous semiconductive materials for the sensing of sulfur compounds. Sens. Mater. 2015, 27, 61–68. [Google Scholar]
- Nonaka, S.; Hyodo, T.; Shimizu, Y.; Egashira, M. Preparation of macroporous semiconductor gas sensors and their odor sensing properties. IEEJ Trans. Sens. Micromach. 2008, 128, 141–144. [Google Scholar] [CrossRef]
- Hyodo, T.; Sasahara, K.; Shimizu, Y.; Egashira, M. Preparation of macroporous SnO2 films using PMMA microspheres and their sensing properties to NOx and H2. Sens. Actuators B Chem. 2005, 106, 580–590. [Google Scholar]
- Yuan, L.; Hyodo, T.; Shimizu, Y.; Egashira, M. Preparation of Mesoporous and meso-macroporous SnO2 powders and application to H2 gas sensors. Sens. Mater. 2009, 21, 241–250. [Google Scholar]
- Wang, J.; Xu, Y.; Xu, W.; Zhang, M.; Chen, X. Simplified preparation of SnO2 inverse opal for Methanol gas sensing performance. Microporous Mesoporous Mater. 2015, 208, 93–97. [Google Scholar] [CrossRef]
- Zhang, B.; Fu, W.; Li, H.; Fu, X.; Wang, Y.; Bala, H.; Wang, X.; Sun, G.; Cao, J.; Zhang, Z. Synthesis and characterization of hierarchical porous SnO2 for enhancing ethanol sensing properties. Appl. Surf. Sci. 2016, 363, 560–565. [Google Scholar] [CrossRef]
- Khalameida, S.; Samsonenko, M.; Skubiszewska-Zięba, J.; Zakutevskyy, O. Dyes catalytic degradation using modified tin(IV) oxide and hydroxide powders. Adsorpt. Sci. Technol. 2017, 35, 853–865. [Google Scholar] [CrossRef]
- Fan, J.; Shi, H.; Xiao, H.; Zhao, G. Double-Layer 3D Macro-Mesoporous Metal Oxide Modified Boron-Doped Diamond with Enhanced Photoelectrochemical Performance. ACS Appl. Mater. Interfaces 2016, 8, 28306–28315. [Google Scholar] [CrossRef]
- Li, K.N.; Wang, Y.F.; Xu, Y.F.; Chen, H.Y.; Su, C.Y.; Kuang, D.B. Macroporous SnO2 synthesized via a template-assisted reflux process for efficient dye-sensitized solar cells. ACS Appl. Mater. Interfaces 2013, 5, 5105–5111. [Google Scholar] [CrossRef]
- Chen, H.; Guo, A.; Huang, S.; Zhu, J.; Cheng, L. Enhanced removal of organic dyes from porous channel-like SnO2 nanostructures. Mater. Res. Express 2017, 4, 055019. [Google Scholar] [CrossRef]
- Zaraska, L.; Gawlak, K.; Gurgul, M.; Chlebda, D.K.; Socha, R.P.; Sulka, G.D. Controlled synthesis of nanoporous tin oxide layers with various pore diameters and their photoelectrochemical properties. Electrochim. Acta 2017, 254, 238–245. [Google Scholar] [CrossRef]
- Zhu, Y.; Wang, L.; Huang, G.; Chai, Y.; Zhai, X.; Huang, W. Luminescent and photocatalytic properties of hollow SnO2 nanospheres. Mater. Sci. Eng. B Solid State Adv. Technol. 2013, 178, 725–729. [Google Scholar] [CrossRef]
- Xu, S.; Sun, F.; Gu, F.; Zuo, Y.; Zhang, L.; Fan, C.; Yang, S.; Li, W. Photochemistry-based method for the fabrication of SnO2 monolayer ordered porous films with size-tunable surface pores for direct application in resistive-type gas sensor. ACS Appl. Mater. Interfaces 2014, 6, 1251–1257. [Google Scholar] [CrossRef] [PubMed]
- Wang, D.-H.; Jia, L.; Wu, X.-L.; Lua, L.-Q.; Xu, A.-W. One-step hydrothermal synthesis of N-doped TiO2/C nanocomposites with high visible light photocatalytic activity. Nanoscale 2012, 4, 576–584. [Google Scholar] [CrossRef] [PubMed]
- Liang, B. Mechanical-induced spontaneous formation of SnO2/Sn6O4(OH)4 photocatalysts at room temperature. Mater Lett. 2019, 252, 155–157. [Google Scholar] [CrossRef]
- Karunakaran, C.; Sakthi Raadha, S.; Gomathisankar, P. Microstructures and optical, electrical and photocatalytic properties of sonochemically and hydrothermally synthesized SnO2 nanoparticles. J. Alloys Compd. 2013, 549, 269–275. [Google Scholar] [CrossRef]
- Park, J.T.; Lee, C.S.; Kim, J.H. One-pot synthesis of hierarchical mesoporous SnO2 spheres using a graft copolymer: Enhanced photovoltaic and photocatalytic performance. RSC Adv. 2014, 4, 31452–31461. [Google Scholar] [CrossRef]
- Luque, P.A.; Nava, O.; Soto-Robles, C.A.; Chinchillas-Chinchillas, M.J.; Garrafa-Galvez, H.E.; Baez-Lopez, Y.A.; Valdez-Núñez, K.P.; Vilchis-Nestor, A.R.; Castro-Beltrán, A. Improved photocatalytic efficiency of SnO2 nanoparticles through green synthesis. Optik 2020, 206, 164299. [Google Scholar] [CrossRef]
- Babu, B.; Neelakanta Reddy, I.; Yoo, K.; Kim, D.; Shim, J. Bandgap tuning and XPS study of SnO2 quantum dots. Mater Lett. 2018, 221, 211–215. [Google Scholar] [CrossRef]
- Chuvenkova, O.A.; Domashevskaya, E.P.; Ryabtsev, S.V.; Yurakov, Y.A.; Popov, A.E.; Koyuda, D.A.; Nesterov, D.N.; Spirin, D.E.; Ovsyannikov, R.Y.; Turishchev, S.Y. XANES and XPS investigations of surface defects in wire-like SnO2 crystals. Phys. Solid State 2015, 57, 153–161. [Google Scholar] [CrossRef]
- Kövér, L.; Kovács, Z.; Sanjinés, R.; Moretti, G.; Cserny, I.; Margaritondo, G.; Pálinkás, J.; Adachi, H. Electronic structure of tin oxides: High resolution study of XPS and Auger spectra. Surf. Interface Anal. 1995, 23, 461–466. [Google Scholar] [CrossRef]
- Jiménez, V.M.; Mejías, J.A.; Espinós, J.P.; González-Elipe, A.R. Interface effects for metal oxide thin films deposited on another metal oxide II. SnO2 deposited on SiO2. Surf. Sci. 1996, 366, 545–555. [Google Scholar] [CrossRef]
- Chang, S.; Vijayan, S.; Aindow, M.; Jursich, G.; Takoudis, C.G. Hydrogen annealing effects on local structures and oxidation states of atomic layer deposited SnOx. J. Vac. Sci. Technol. A Vac. Surf. Films. 2018, 36, 031519. [Google Scholar] [CrossRef]
- Sun, M.; Su, Y.; Du, C.; Zhao, Q.; Liu, Z. Self-doping for visible light photocatalytic purposes: Construction of SiO2/SnO2/SnO2:Sn2+ nanostructures with tunable optical and photocatalytic performance. RSC Adv. 2014, 4, 30820–30827. [Google Scholar] [CrossRef]
- Davar, F.; Salavati-Niasari, M.; Fereshteh, Z. Synthesis and characterization of SnO2 nanoparticles by thermal decomposition of new inorganic precursor. J. Alloys Compd. 2010, 496, 638–643. [Google Scholar] [CrossRef]
- Nagasawa, Y.; Choso, T.; Karasuda, T.; Shimomura, S.; Ouyang, F.; Tabata, K.; Yamaguchi, Y. Photoemission study of the interaction of a reduced thin film SnO2 with oxygen. Surf. Sci. 1999, 433, 226–229. [Google Scholar] [CrossRef]
- Spencer, J.A.; Mock, A.L.; Jacobs, A.G.; Schubert, M.; Zhang, Y.; Tadjer, M.J. A review of band structure and material properties of transparent conducting and semiconducting oxides: Ga2O3, Al2O3, In2O3,ZnO, SnO2, CdO, NiO, CuO, and Sc2O3. Appl. Phys. Rev. 2022, 9, 011315. [Google Scholar] [CrossRef]
- Summit, R.; Marley, J.A.; Borrelli, N.F. The ultraviolet absorption edge of stannic oxide (SnO2). J. Phys. Chem. Solids. 1964, 25, 1465–1469. [Google Scholar] [CrossRef]
- Gaur, L.K.; Chandra Mathpal, M.; Kumar, P.; Gairola, S.P.; Agrahari, V.; Martinez, M.A.R.; Aragon, F.F.H.; Soler, M.A.G.; Swart, H.C.; Agarwal, A. Observations of phonon anharmonicity and microstructure changes by the laser power dependent Raman spectra in Co doped SnO2 nanoparticles. J. Alloys Compd. 2020, 831, 154836. [Google Scholar] [CrossRef]
- Babu, B.; Talluri, B.; Gurugubelli, T.R.; Kim, J.; Yoo, K. Effect of annealing environment on the photoelectrochemical water oxidation and electrochemical supercapacitor performance of SnO2 quantum dots. Chemosphere 2022, 286, 131577. [Google Scholar] [CrossRef]
- Zaraska, L.; Gawlak, K.; Wiercigroch, E.; Malek, K.; Kozieł, M.; Andrzejczuk, M.; Marzec, M.M.; Jarosz, M.; Brzózka, A.; Sulka, G.D. The effect of anodizing potential and annealing conditions on the morphology, composition and photoelectrochemical activity of porous anodic tin oxide films. Electrochim. Acta 2019, 319, 18–30. [Google Scholar] [CrossRef]
- Ilka, M.; Bera, S.; Kwon, S.H. Influence of surface defects and size on photochemical properties of SnO2 nanoparticles. Materials 2018, 11, 904. [Google Scholar] [CrossRef] [PubMed]
- Kar, A.; Olszówka, J.; Sain, S.; Sloman, S.R.I.; Montes, O.; Fernández, A.; Pradhan, S.K.; Wheatley, A.E.H. Morphological effects on the photocatalytic properties of SnO2 nanostructures. J. Alloys Compd. 2019, 810, 151718. [Google Scholar] [CrossRef]
- Liu, L.Z.; Wu, X.L.; Gao, F.; Shen, J.C.; Li, T.H.; Chu, P.K. Determination of surface oxygen vacancy position in SnO2 nanocrystals by Raman spectroscopy. Solid State Commun. 2011, 151, 811–814. [Google Scholar] [CrossRef]
- Patel, M.Y.; Mortelliti, M.J.; Dempsey, J.L. A compendium and meta-analysis of flatband potentials for TiO2, ZnO, and SnO2 semiconductors in aqueous media. Chem. Phys. Rev. 2022, 3, 011303. [Google Scholar] [CrossRef]
- Beranek, R. (Photo)electrochemical methods for the determination of the band edge positions of TiO2-based nanomaterials. Adv. Phys. Chem. 2011, 2011, 786759. [Google Scholar] [CrossRef]
- Hankin, A.; Bedoya-Lora, F.E.; Alexander, J.C.; Regoutz, A.; Kelsall, G.H. Flat band potential determination: Avoiding the pitfalls. J. Mater. Chem. A 2019, 7, 26162–26176. [Google Scholar] [CrossRef]
- Armstrong, N.R.; Lin, A.W.C.; Fujihira, M.; Kuwana, T. Electrochemical and Surface Characteristics of Tin Oxide and Indium Oxide Electrodes. Anal. Chem. 1976, 48, 741–750. [Google Scholar] [CrossRef]
- Bressel, B.; Gerischer, H. Effect of surface hydrolysis at tin dioxide polycrystalline thin film electrodes on dye sensitization quantum fficiency. Ber. Bunsenges. Phys. Chem. Chem. Phys. 1983, 87, 398–403. [Google Scholar] [CrossRef]
- Knapik, A.; Syrek, K.; Kozieł, M.; Zaraska, L. Cathodic deposition of SnO2 layers on transparent conductive substrates and their photoelectrochemical activity. J. Ind. Eng. Chem. 2022, 111, 380–388. [Google Scholar] [CrossRef]
- Sun, M.; Gong, Z.; Zhang, Z.; Li, Y.; Xie, D.; Wu, F.; Li, R. Dependence of photoelectrochemical water splitting for oriented-SnO2 on Carrier behaviors: Concentration, depletion and transportation. Thin Solid Film. 2021, 732, 138794. [Google Scholar] [CrossRef]
- Menshikov, V.S.; Novomlinsky, I.N.; Belenov, S.V.; Alekseenko, A.A.; Safronenko, O.I.; Guterman, V.E. Methanol, ethanol, and formic acid oxidation on new platinum-containing catalysts. Catalysts 2021, 11, 158. [Google Scholar] [CrossRef]
- Anjos, R.P.R.; Santos, A.O.; Antoniassi, R.M.; Alves, O.C.; Ponzio, E.A.; Silva, J.C.M. The Effect of Tin Addition to Platinum Catalysts with Different Morphologies towards Methanol Electrooxidation in Alkaline Media. ACS Appl. Energy Mater. 2021, 4, 6253–6260. [Google Scholar] [CrossRef]
- Gu, Y.; Gao, P.; Yu, Z.; Hu, Y.; Xu, Z.; Zhang, C.; Li, J.; An, Y. Honeycomb-like mesoporous NiO-SnO2/SO42− solid superacid for the efficient reaction of methanol oxidation. Int. J. Electrochem. Sci. 2020, 15, 2481–2498. [Google Scholar] [CrossRef]
- Kawabe, T.; Tabata, K.; Suzuki, E.; Nagasawa, Y. Methanol adsorption on an oxidized and a reduced SnO2 thin film. Surf. Sci. 2000, 454, 374–378. [Google Scholar] [CrossRef]
- Pablos, C.; Marugán, J.; van Grieken, R.; Adán, C.; Riquelme, A.; Palma, J. Correlation between photoelectrochemical behaviour and photoelectrocatalytic activity and scaling-up of P25-TiO2 electrodes. Electrochim. Acta 2014, 130, 261–270. [Google Scholar] [CrossRef]
- Parkhomchuk, E.V.; Semeykina, V.S.; Sashkina, K.A.; Okunev, A.G.; Lysikov, A.I.; Parmon, V.N. Synthesis of polystyrene beads for hard-templating of three-dimensionally ordered macroporosity and hierarchical texture of adsorbents and catalysts. Top. Catal. 2017, 60, 178–189. [Google Scholar] [CrossRef]
- Lan, T.; Li, C.W.; Fultz, B. Phonon anharmonicity of rutile SnO2 studied by Raman spectrometry and first principles calculations of the kinematics of phonon-phonon interactions. Phys. Rev. B Condens. Matter Mater. Phys. 2012, 86, 134302. [Google Scholar] [CrossRef]
- Xiong, C.; Xiong, Y.; Zhu, H.; Zhang, Y.; Liu, Y. Investigation of Raman spectrum for nano-SnO2. Sci. China Ser. A Math. Phys. Astron. 1997, 40, 1222–1227. [Google Scholar] [CrossRef]
- Batzill, M.; Diebold, U. The surface and materials science of tin oxide. Prog. Surf. Sci. 2005, 79, 47–154. [Google Scholar] [CrossRef]


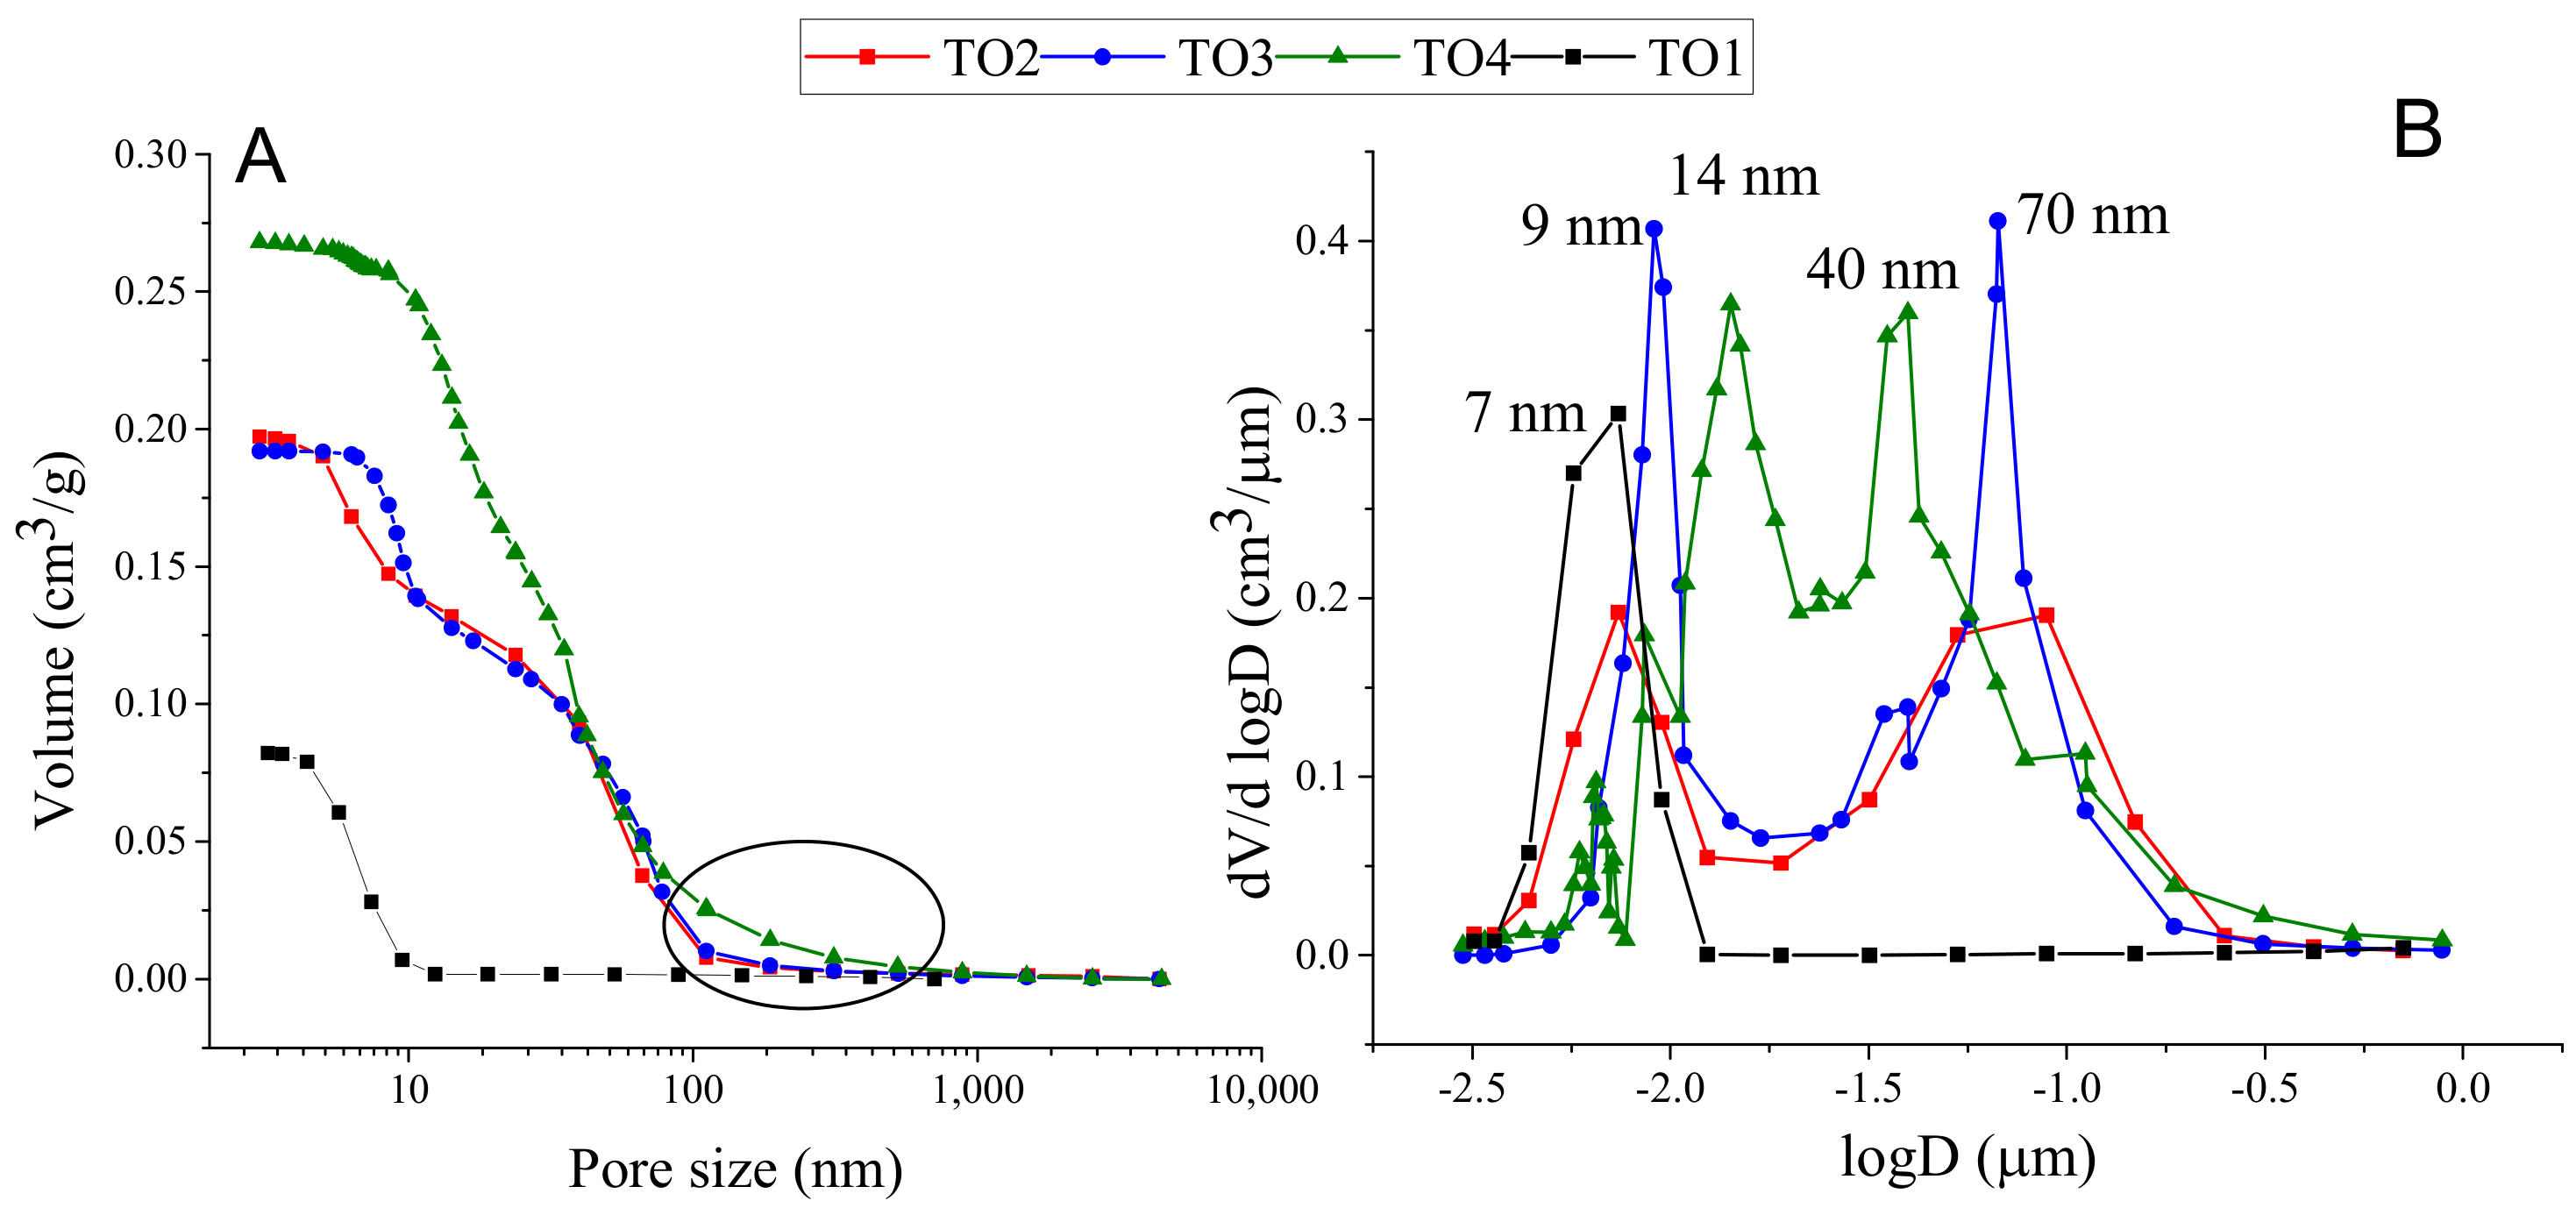
| Sample | SBET, m2/g | Vpore, cm3/g | Dpore, nm | σ, mS/cm |
|---|---|---|---|---|
| TO1 | 47.7 | 0.093 | 12 | 0.27 ± 0.02 |
| TO2 | 44.7 | 0.123 | 17 | 1.8 ± 0.4 |
| TO3 | 30.6 | 0.099 | 19 | 0.8 ± 0.1 |
| TO4 | 38.4 | 0.156 | 111 | 1.3 ± 0.2 |
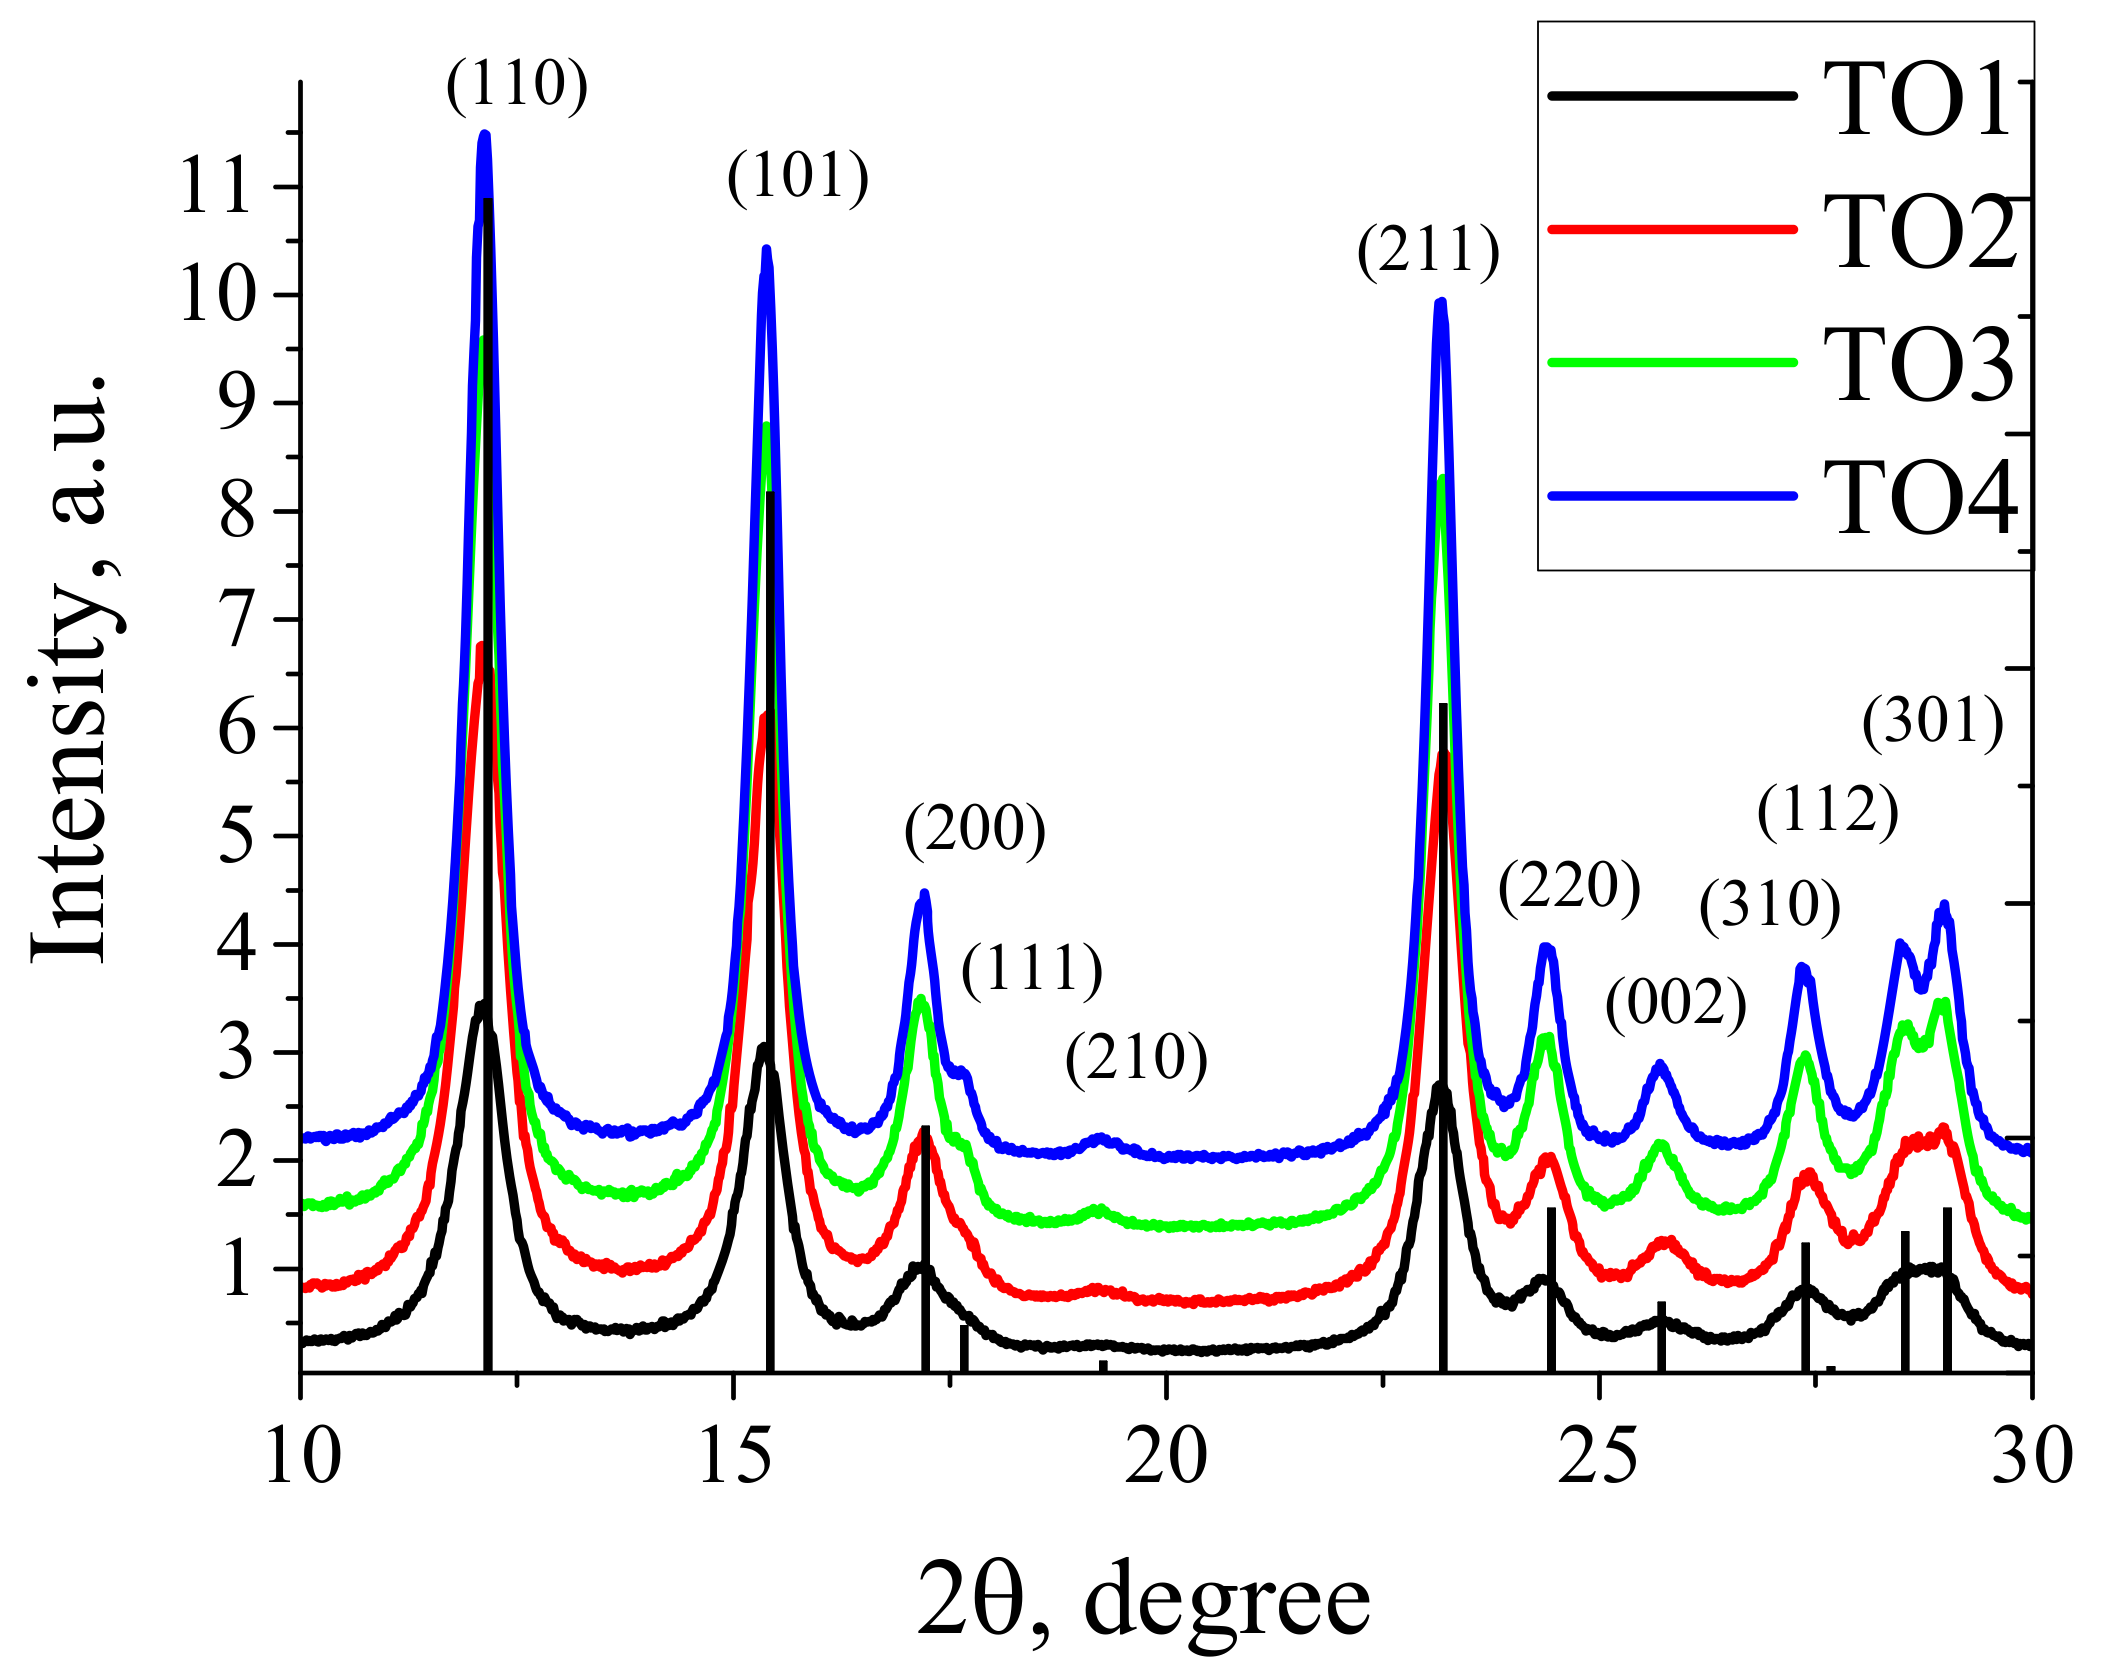
| Sample | Cell Parameters, Å | Cell Volume, Å3 | CSR Size, nm | Microstrains, ε | Rwp, % | χ2 | |
|---|---|---|---|---|---|---|---|
| a | c | ||||||
| TO1 | 4.742 (1) | 3.191 (1) | 71.75 (5) | 5.9 (3) | 0.14 (3) | 5.3 | 1.4 |
| TO2 | 4.735 (1) | 3.185 (1) | 71.40 (5) | 6.5 (3) | 0.12 (2) | 4.9 | 1.8 |
| TO3 | 4.743 (1) | 3.191 (1) | 71.78 (5) | 8.6 (1) | 0.11 (1) | 4.7 | 1.8 |
| TO4 | 4.743 (1) | 3.190 (1) | 71.76 (5) | 10.8 (3) | 0.09 (1) | 5.0 | 1.9 |
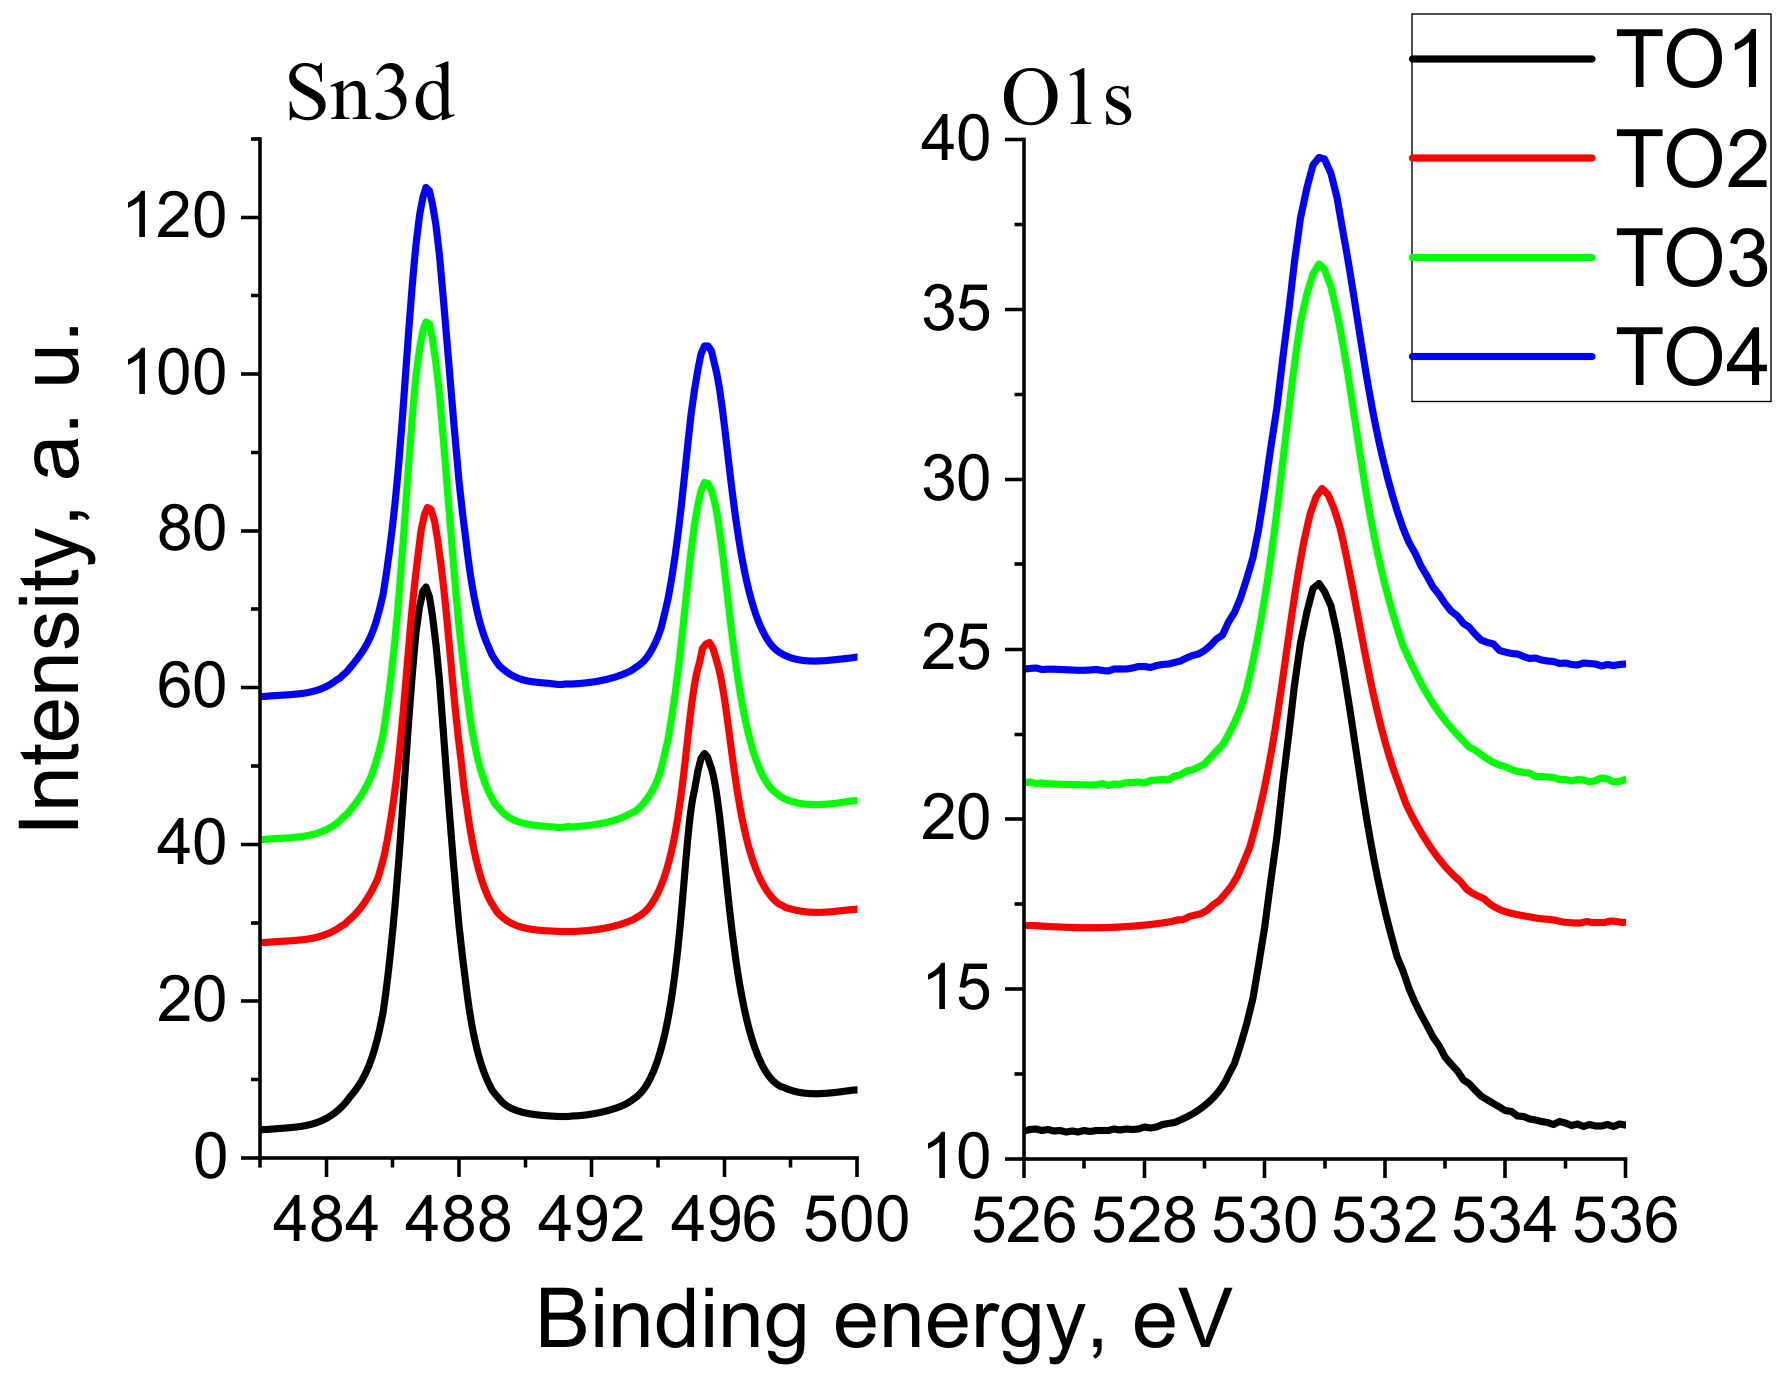
| Sample | Components Sn3d,% | Components O1s, % | OΣ/SnΣ Ratio | ||
|---|---|---|---|---|---|
| Sn0 (485.1 эB) | Sn4+ (487.1 эB) | =O (531.0 эB) | -OH (532.4 эB) | ||
| TO1 | 1.4 | 98.6 | 84.9 | 15.1 | 1.19 |
| TO2 | 2.4 | 97.6 | 83.1 | 16.9 | 1.20 |
| TO3 | 2.4 | 97.6 | 83.9 | 16.1 | 1.20 |
| TO4 | 2.1 | 97.9 | 82.3 | 17.7 | 1.19 |
| № | Sample | Photocurrent | Mott–Schottky | OCP | Photocurrent Onset | Average | ||
|---|---|---|---|---|---|---|---|---|
| C | A | C | A | |||||
| 1 | TO1 | 0.18 | 0.43 1 | 0.37 | 0.35 | 0.27 | 0.25 | 0.28 ± 0.08 |
| 2 | TO1 + MeOH | 0.48 1 | 0.19 | 0.31 | 0.12 | 0.09 | 0.09 | 0.16 ± 0.09 |
| 3 | TO2 | 0.19 | 0.32 | 0.41 1 | 0.35 | 0.2 | 0.21 | 0.25 ± 0.08 |
| 4 | TO2 + MeOH | 0.18 | 0.30 | 0.3 | 0.24 | 0.14 | 0.15 | 0.22 ± 0.07 |
| 5 | TO3 | 0.4 1 | 0.19 | 0.21 | 0.39 | 0.24 | 0.23 | 0.25 ± 0.08 |
| 6 | TO3 + MeOH | 0.17 | 0.35 1 | 0.06 | 0.27 | 0.13 | 0.13 | 0.15 ± 0.08 |
| 7 | TO4 | 0.13 | 0.17 | −0.01 | 0.21 1 | 0.09 | 0.09 | 0.09 ± 0.07 |
| 8 | TO4 + MeOH | 0.13 | 0.12 | 0.02 | −0.05 | 0.06 ± 0.09 | ||
Disclaimer/Publisher’s Note: The statements, opinions and data contained in all publications are solely those of the individual author(s) and contributor(s) and not of MDPI and/or the editor(s). MDPI and/or the editor(s) disclaim responsibility for any injury to people or property resulting from any ideas, methods, instructions or products referred to in the content. |
© 2023 by the authors. Licensee MDPI, Basel, Switzerland. This article is an open access article distributed under the terms and conditions of the Creative Commons Attribution (CC BY) license (https://creativecommons.org/licenses/by/4.0/).
Share and Cite
Gribov, E.; Koshevoy, E.; Chikunova, I.; Parmon, V. Template-Assisted SnO2: Synthesis, Composition, and Photoelectrocatalytical Properties. Catalysts 2023, 13, 168. https://doi.org/10.3390/catal13010168
Gribov E, Koshevoy E, Chikunova I, Parmon V. Template-Assisted SnO2: Synthesis, Composition, and Photoelectrocatalytical Properties. Catalysts. 2023; 13(1):168. https://doi.org/10.3390/catal13010168
Chicago/Turabian StyleGribov, Evgenii, Evgeny Koshevoy, Iuliia Chikunova, and Valentin Parmon. 2023. "Template-Assisted SnO2: Synthesis, Composition, and Photoelectrocatalytical Properties" Catalysts 13, no. 1: 168. https://doi.org/10.3390/catal13010168