Article

Impact of Geometric and Electronic Factors on Selective Hydro-Deoxygenation of Guaiacol by Surface-Rich Metal/Silica Catalysts

Faculty of Chemistry and Food Chemistry, Technische Universität Dresden, 01062 Dresden, Germany
*
Author to whom correspondence should be addressed.
Catalysts 2023, 13(2), 425; https://doi.org/10.3390/catal13020425
Submission received: 20 December 2022 / Revised: 11 February 2023 / Accepted: 13 February 2023 / Published: 16 February 2023
(This article belongs to the Special Issue Catalysis on Zeolites and Zeolite-Like Materials II)

Abstract

:
The selective production of hydrocarbons for the chemical industry from biogenic feedstock is a significant challenge when ensuring hydrocarbon and fuel supply, despite the heterogeneity of this feed. In this study, guaiacol, as a surrogate for complex lignin-based biomass resources, is converted by an inert silica carrier material with different d-metal impregnation (Mo, W, Re, Fe, Co, Ni, Cu, Pd, Ag) to reveal the reasons for different product selectivity to hydrogenated and deoxygenated hydrocarbon products. Hydrogen at 15 bar (gauge) and guaiacol are converted on metal/silica catalysts between 250 °C and 400 °C, while the physicochemical catalyst properties are characterized before and after catalytic tests. Volcano plots for the conversion, hydrogenation and deoxygenation products versus the d-band energy, surface atom distance and fouling properties reveal three groups of metals: (i) those that are less active and show high coking (Ag, α-Fe); (ii) those that show high activity for hydrogenation (β-Co, Ni, Pd) and, therefore, preferably yielded cyclohexane, cyclohexanol and 2-methoxycyclohexanol; (iii) those that preferably promote deoxygenation (Mo, W, Re, Cu) and, therefore, promoted the formation of phenol, benzene, anisole and catechol. The results are summarized in a pseudo van Krevelen diagram and interpreted as a complex interdependency from Sabatier’s principle of geometric correspondence of hexagonal metal surface for hydrogenation, electronic correspondence for the activation of hydrogen and electronic correspondence by oxophilicity for deoxygenation from the d-band center model.

1. Introduction

For almost one century, there has been steady development to reveal and apply the mechanisms during the hydrogenation of hydrocarbon feedstock from fossil oil, coal and gas. Based on the industrial hydrotreating catalysts, with components such as palladium [1,2,3], nickel [4,5,6], platinum [7,8,9], cobalt [10,11,12], iron [13,14,15,16] or molybdenum [17,18,19], as well as the bifunctional catalysts for hydrocracking made of metals and acidic support material, which benefit from synergistic strong metal support interaction (SMSI) [20,21,22], there is a discernible trend that some transition metals are particularly active or selective and are therefore used with striking frequency. The complexity rises considering the exothermic nature and strong pressure dependency of hydrogenation reaction and some materials, such as platinum, which promote hydrogenation reactions at a lower temperature (250–400 °C) and higher pressure (10–50 bar) and dehydrogenation at higher temperature (450–700 °C) and lower pressure [23,24]. In the literature, electronic and geometric factors are discussed, which determine the strength of the hydrogen- and reactant-metal surface interactions to guide the hydrogen and reactant to each other [25]. In the process, both the reactants must form a reactive complex with different metal surfaces, react, and ultimately desorb the products again. Those reactant-metal complexes are particularly successful here, which on the one hand, have a sufficient formation probability and bond strength, but on the other hand, are labile enough to rerelease the reactive metal surface after product formation, according to the Sabatier principle [26,27].
Over the past two decades, there has also been a shift in thinking in the industrial sector. The toxicity and recyclability of transition metal-containing catalysts have become the focus in the context of sustainability. Additionally, increasing pandemics, local and global conflicts, and the climate crisis have led to a call for increased regional supply security for the chemical industry to provide fuels, as well as base and specialty chemicals. Here, the co-utilization of secondary and tertiary biogenic raw materials, such as bio-oils from paper industry waste, for material use offers an option. Due to the associated challenge of using oxygenated hydrocarbons, new concepts for deoxygenation are needed to expand the existing refinery landscape through drop-in biotechnologies [23,28,29,30,31,32]. From a scientific point of view, the concepts of the oxophilicity of a metal/support and metal-oxide support catalyst from the d-band center model by Hammer and Norskov and the driving force of deoxygenation by the formation of leaving groups such as water play an additional role to the energetic and geometric factors of the hydrogenation processes on different metal surfaces and edges (Figure 1) [33,34]. Based on the technical utilization of lignin surpluses, a variety of products can be made selectively accessible in the hydrodeoxygenation processes by a skillful choice of metal-carrier combinations, which can ensure the security of supply in the chemical industry even beyond the age of fossil carbon carriers.
For this reason, the characteristics of the conversion behavior of a typical lignin hydrolysate, called guaiacol, is investigated in this study, which is continuously converted at 15 bar (g) hydrogen pressure and 250 °C to 400 °C reaction temperature with supported transition metal catalysts, partly selectively to highly relevant basic chemicals, such as phenol, benzene, cyclohexanol or cyclohexane. Deeper scientific analysis of the characteristics of different metal species has been ensured by using inert carrier material and neglectable acidity after impregnation and final reduction to avoid the interactions known from more complex bi-functional catalyst systems (e.g., SMSI). The physicochemical characterization of the catalyst materials before and after the catalytic tests in a fixed-bed test reactor unit is used to determine the differences in the conversion and selectivity behavior of different transition metals. Summarized by volcano plots and van Krevelen diagrams, it is possible to estimate which activity and selectivity of the supported metal(oxide) catalysts differ, and why, with respect to a potential application for bio-based drop-in technologies at different points of the existing refinery landscape.

2. Results and Discussion

The choice of a suitable, chemically inert support material was followed by the physicochemical and catalytic characterization of different metal loadings, which then led to Volcano plots and van Krevelen diagrams in the third section in orders, which ultimately serve as the basis for the mechanistic discussions of the conversion pathways of guaiacol.

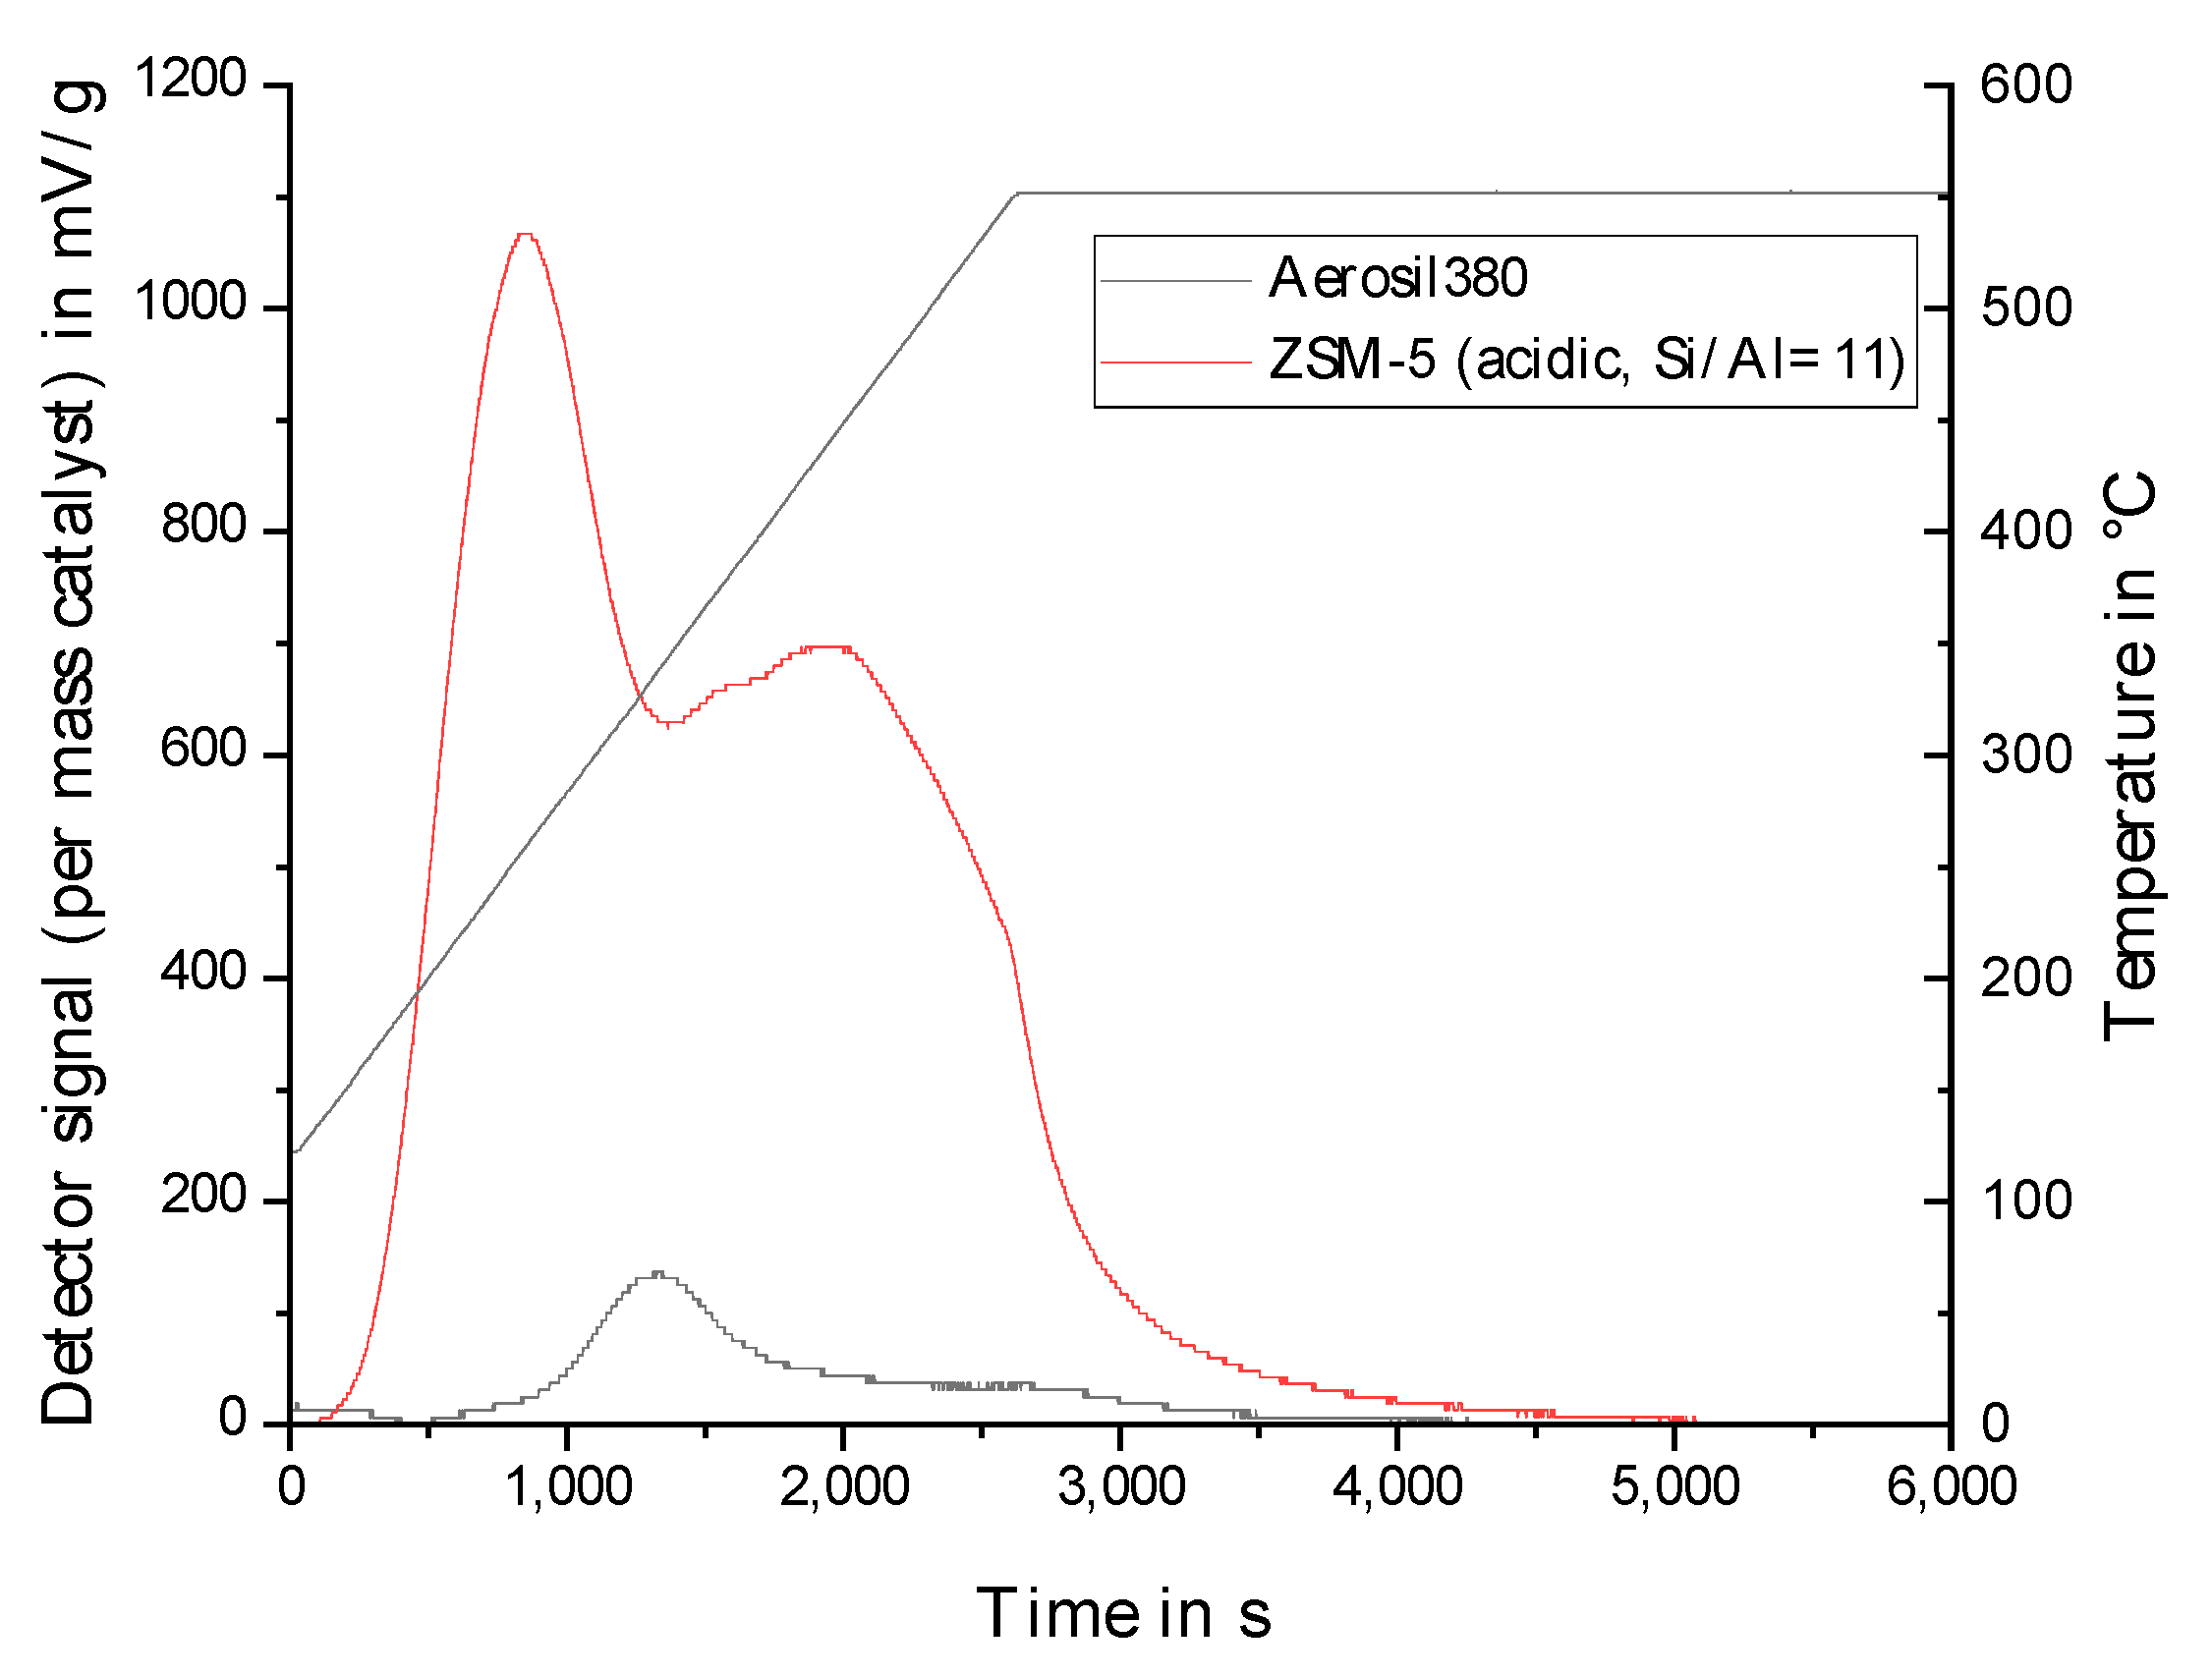
2.1. Choice of the Inert Silica Carrier Material

To study the properties of the metals with minimal influence on the support material, a support material that is as inert as possible is necessary. The zeolite materials frequently used in catalysis, such as HZSM-5 or HY, have acidic properties, thus catalyzing deoxygenation and transalkylation reactions, and are therefore unsuitable for the investigations [24]. Similarly, basic centers, known for alkaline earth metal oxides such as CaO or MgO, should be avoided for the hydrogenation processes because they contribute to proton abstraction and isomerization [25]. In addition, interference due to the pore geometry of the support material should be avoided, as has been demonstrated for zeolite-based materials such as HY, HBeta, and HZSM-5 [40,41,42]. For these reasons, the commercially available fumed silica Aerosil380 was chosen, which has a high surface area, of approximately 380 m2/g, and was made available for research purposes by Evonik AG [43].
The adsorption and desorption curves of the nitrogen physisorption measurement of the support material used, Aerosil380, are shown in Figure 2.
According to IUPAC, the hysteresis can be classified as type IV(a), indicating a mesoporous material with multilayer adsorption [44]. This property can be attributed to the agglomeration of the spherical silica particles, as confirmed by the scanning electron microscope (SEM) images in Figure 3, and not to an ordered pore structure as known for other mesoporous silicates, e.g., SBA-15 [45]. The substrate has a B.E.T. surface area (p/p0 = 0.001 to 0.23) of 330 m2/g and a B.J.H. surface area (p/p0 = 0.3 to 0.95) of 300 m2/g [46,47].
The powder X-ray diffraction pattern (P-XRD) shows a strongly spread reflection hill in the range between 15° 2Θ and 30° 2Θ (Figure 4). This does not correspond to a Bragg reflection, which is typically caused by crystalline materials with a long-range order. Instead, it is caused by the Gaussian distribution of the most frequent distances to the nearest neighbor atom, i.e., the near order within the silica [48,49].
No signals were detected in the temperature-programmed reduction and oxidation; consequently, the substrate is neither oxidized nor reduced in the range below 600 °C (see Figure A1 in the Appendix). Similarly, no adsorption was observed during the subsequent hydrogen chemisorption. Temperature-programmed ammonia desorption (TPAD) was subsequently performed to determine the acidic properties. In Figure 5, the support material is compared with a commercial acidic material, such as an HZSM-5 zeolite from Clariant (HCZP 27). Based on the plot, the selected support material exhibits no significant acidic properties. Accordingly, Aerosil380 meets the physicochemical requirements placed on the support material for investigating the catalytic properties of different impregnated metal species after reduction.
Analogous to the empty reactor measurements, the formation of a product gas phase and an aqueous liquid product phase is not observed in the investigated temperature interval, from 250 °C to 400 °C, in the catalytic test measurements of the Aerosil380 support material. For low temperatures, from 250 °C to 340 °C, no conversion can be detected in the condensable liquid phase. Higher temperatures of 370 °C and 400 °C led to a negligible conversion of less than 10%. Demethoxylation and methyl transfer reactions are predominantly observed, leading to phenol and 2-methylphenol. However, the proportion of these compounds in the liquid phase is less than 3%. With a coke content of 11.9 ± 0.1%, severe coking occurs above 370 °C. This is due to the thermal polymerization of guaiacol at the surface, which is favored by higher temperatures, particularly above the ignition temperature of 385 °C [23,50]. As expected from the physicochemical characterization, the Aerosil380 material is a catalytically nearly inert material, which makes it ideal as a support for the following studies on the catalytic properties of different metals.

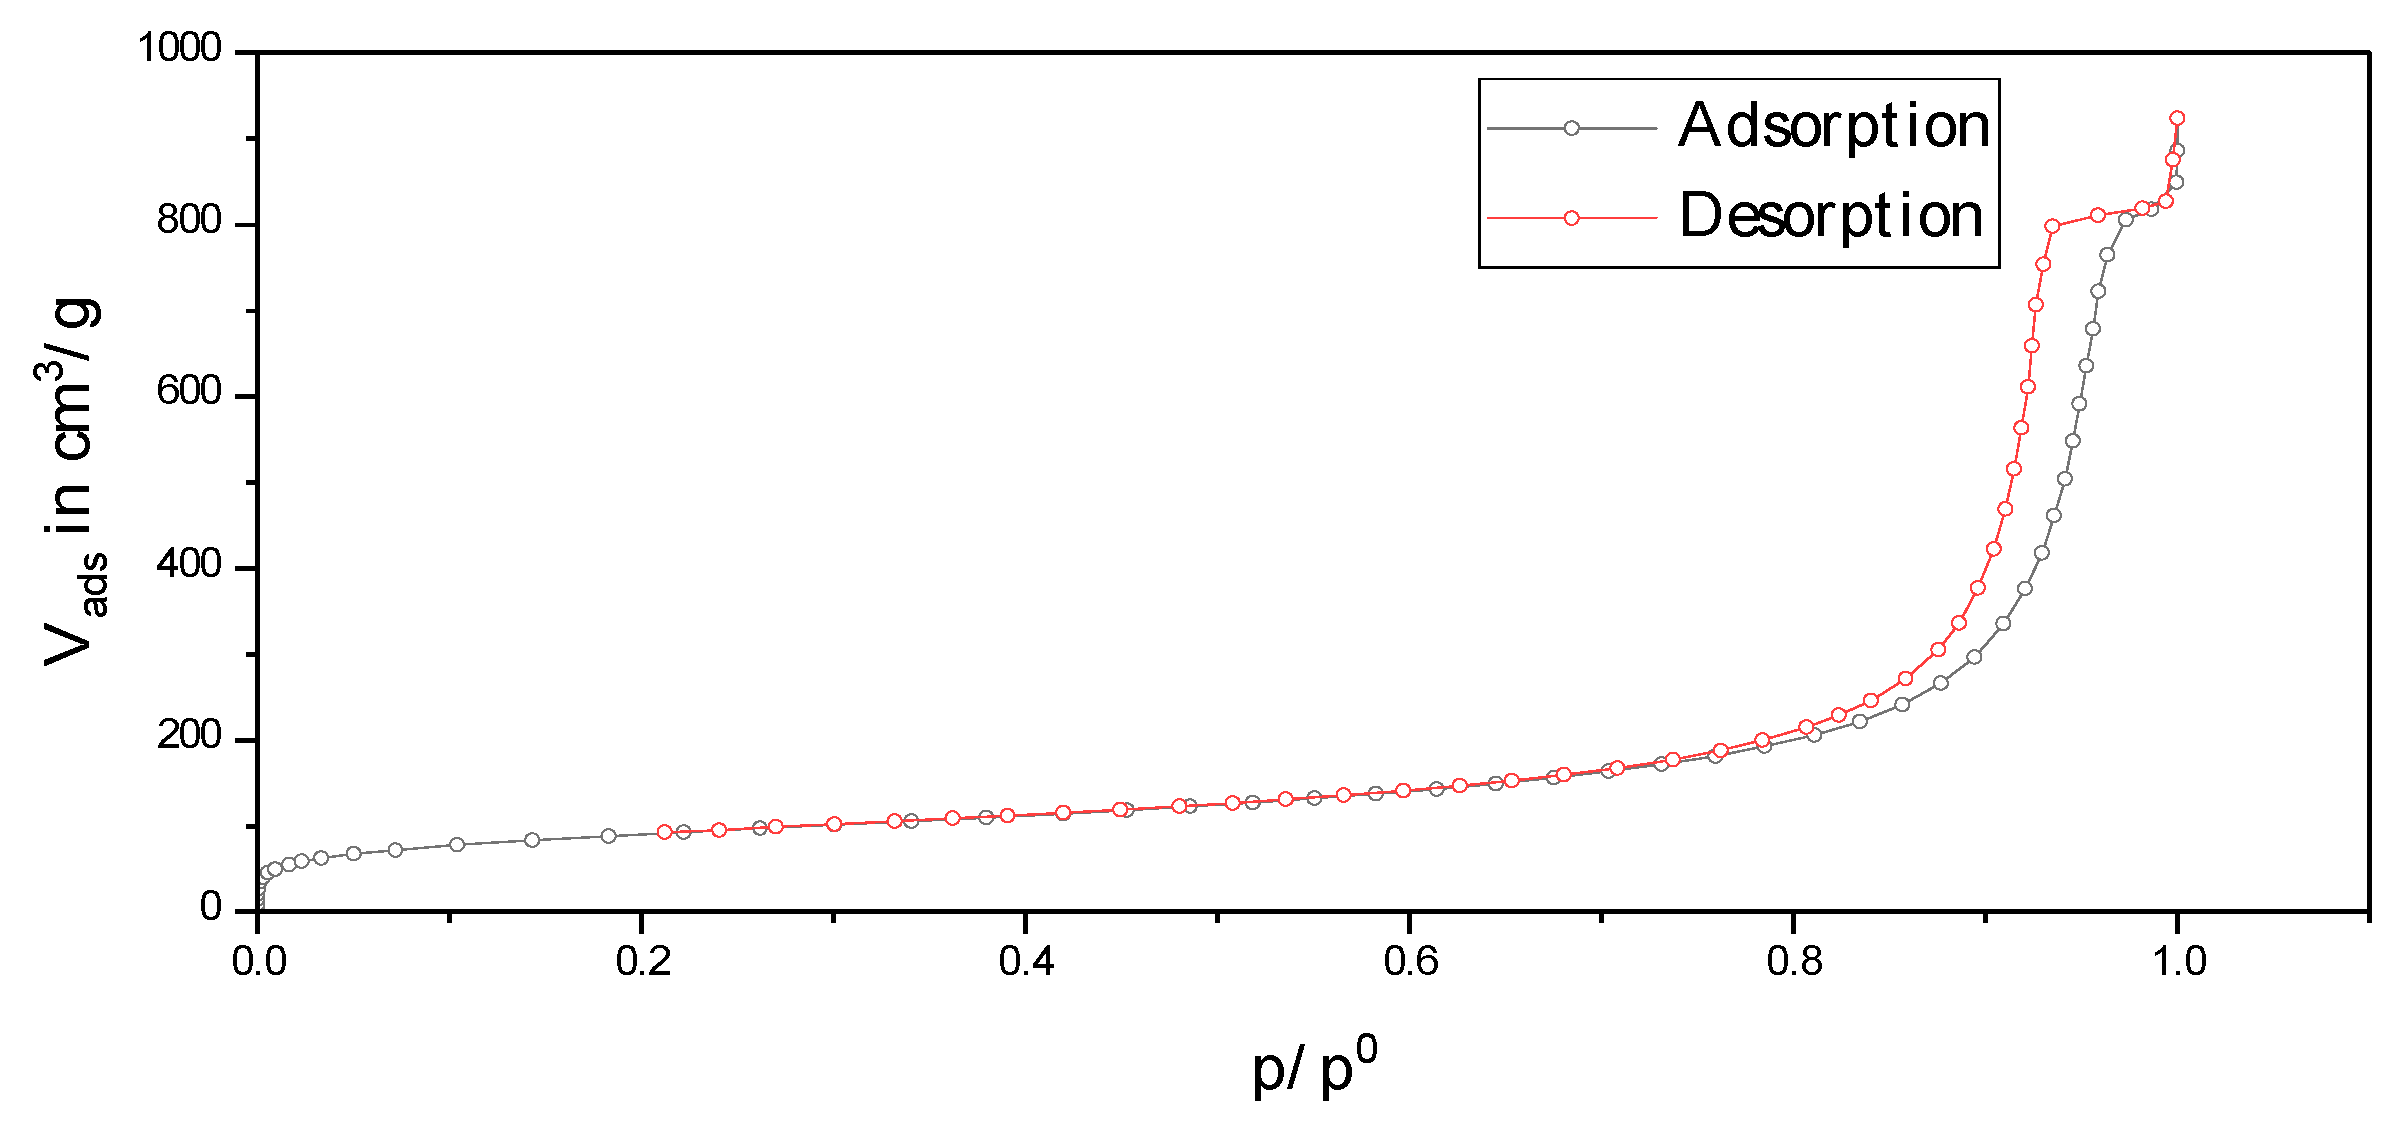
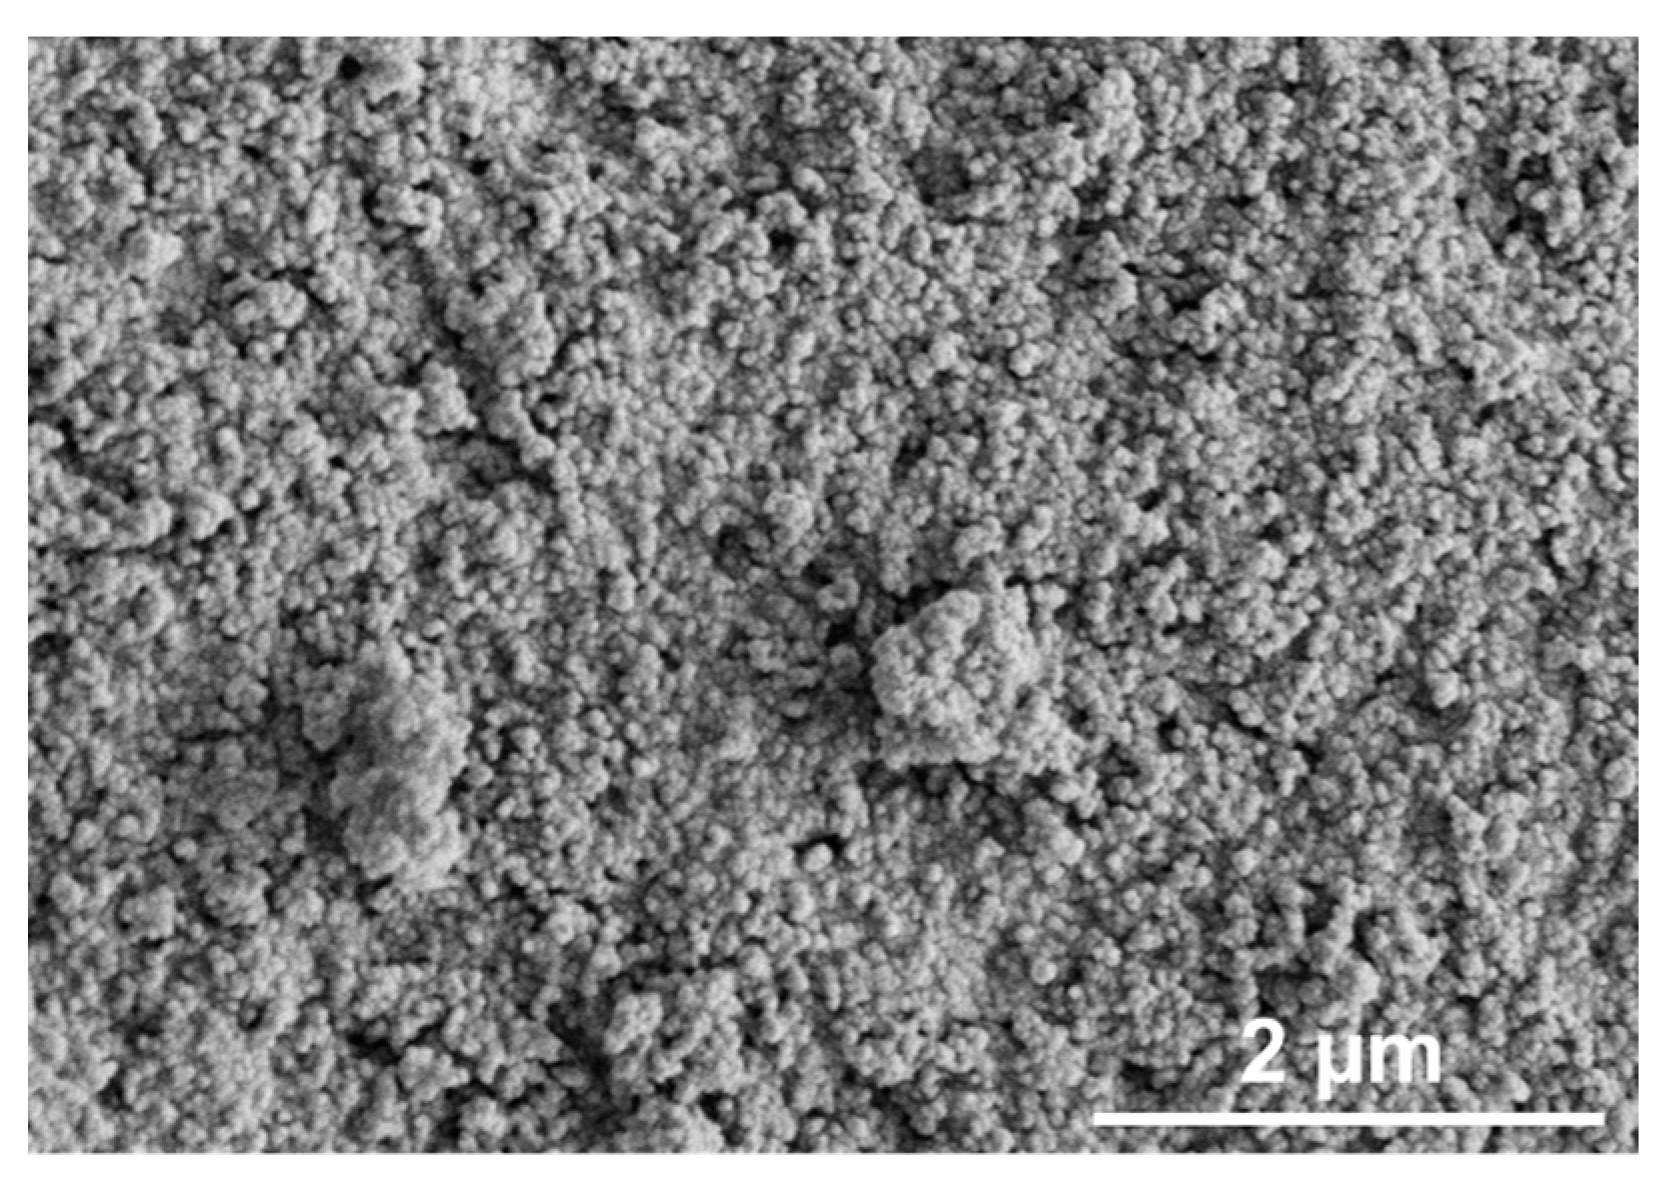
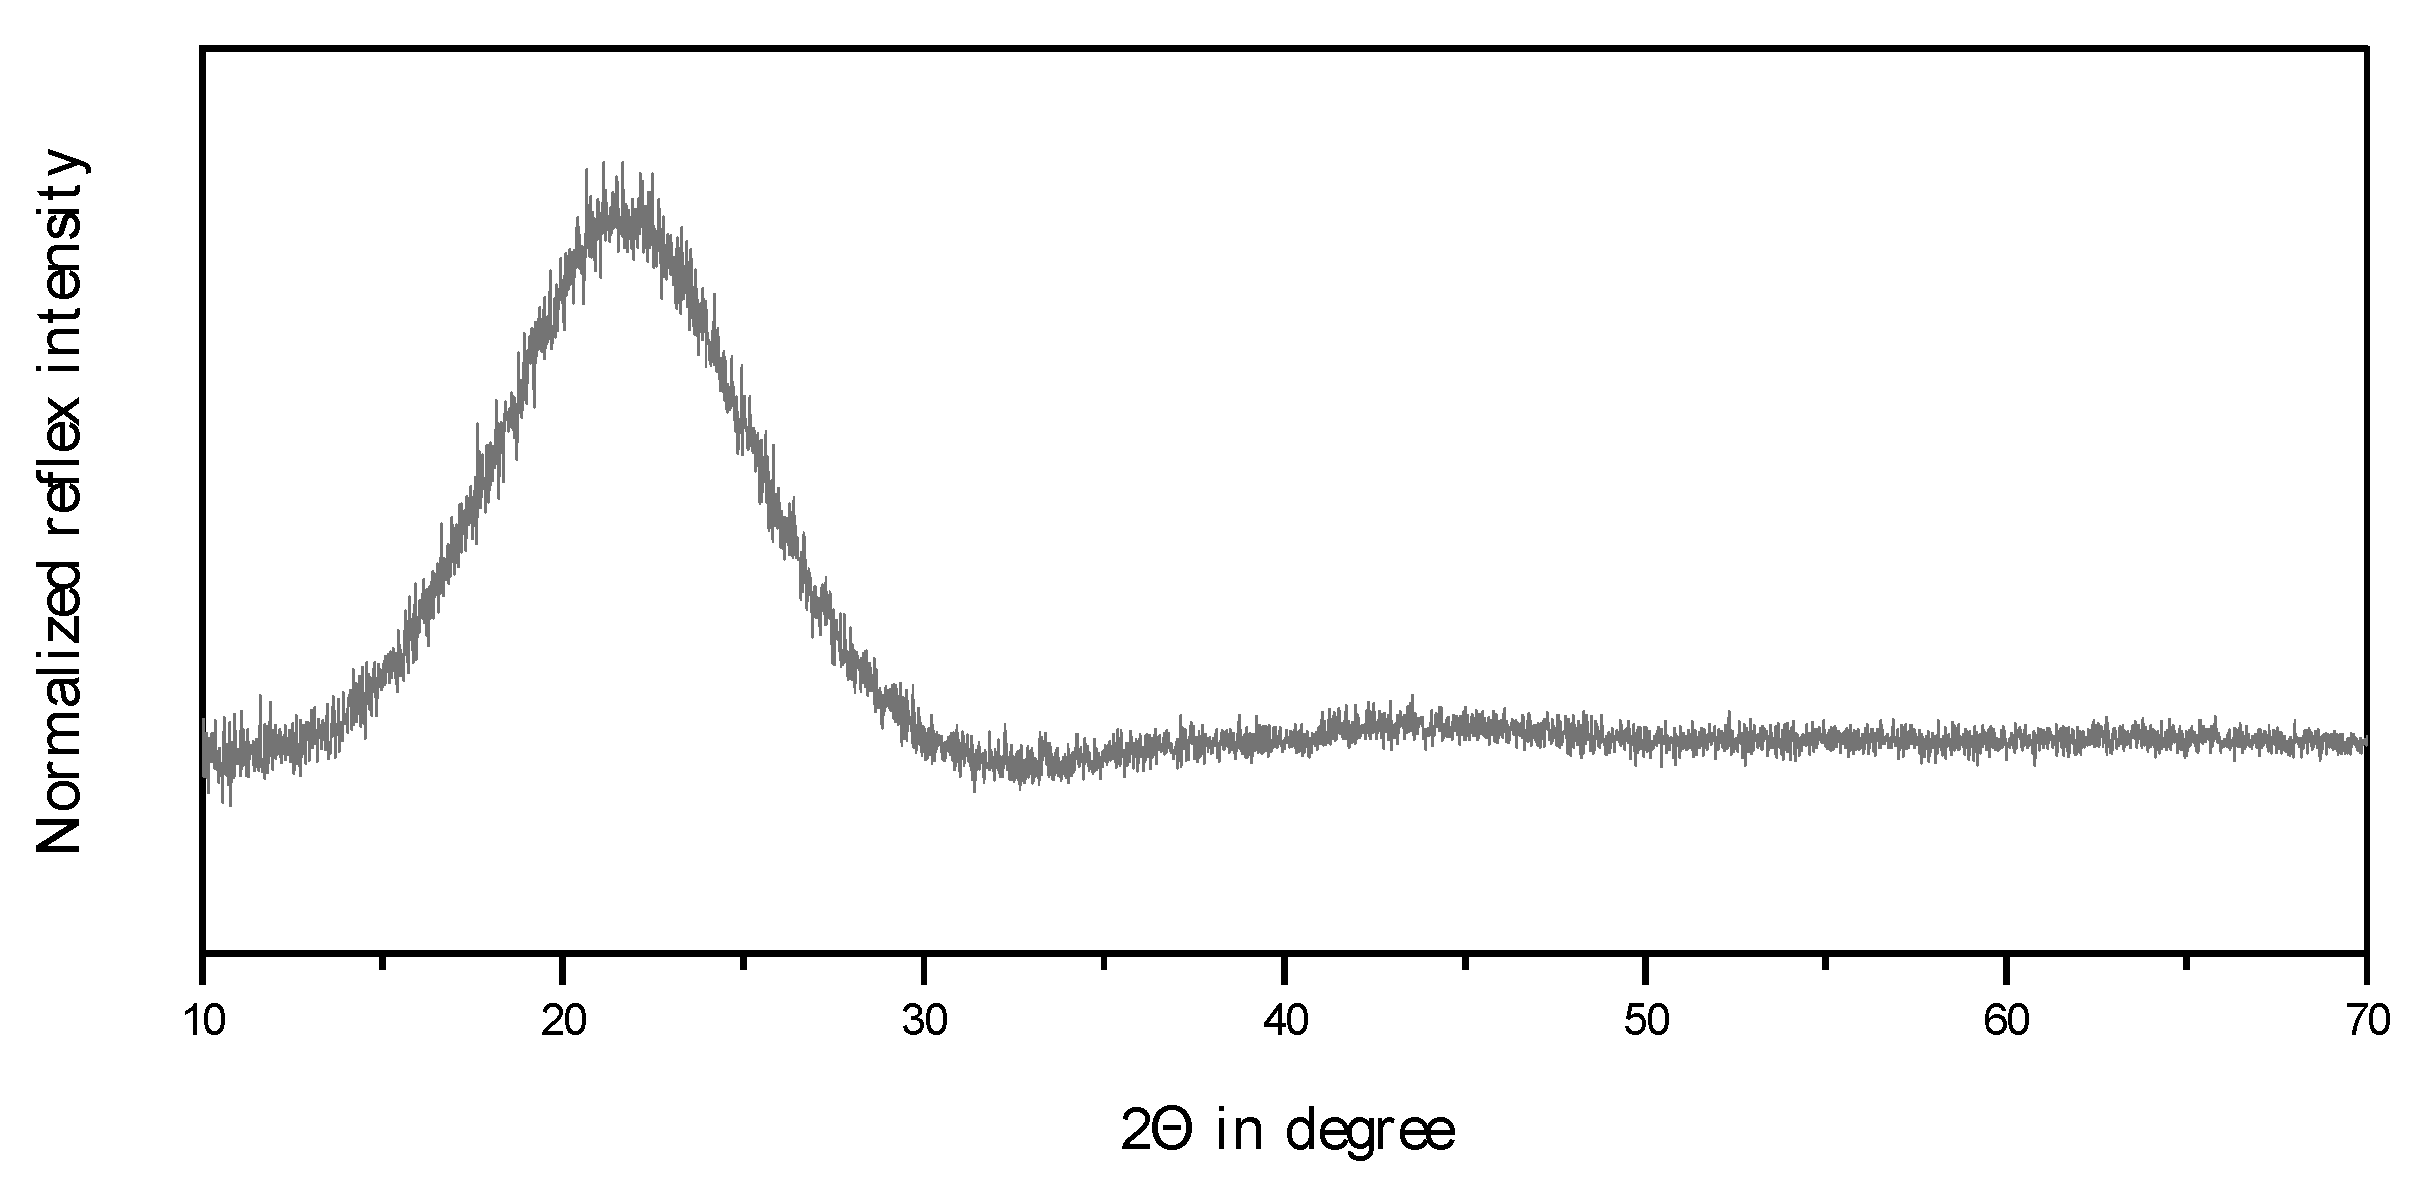
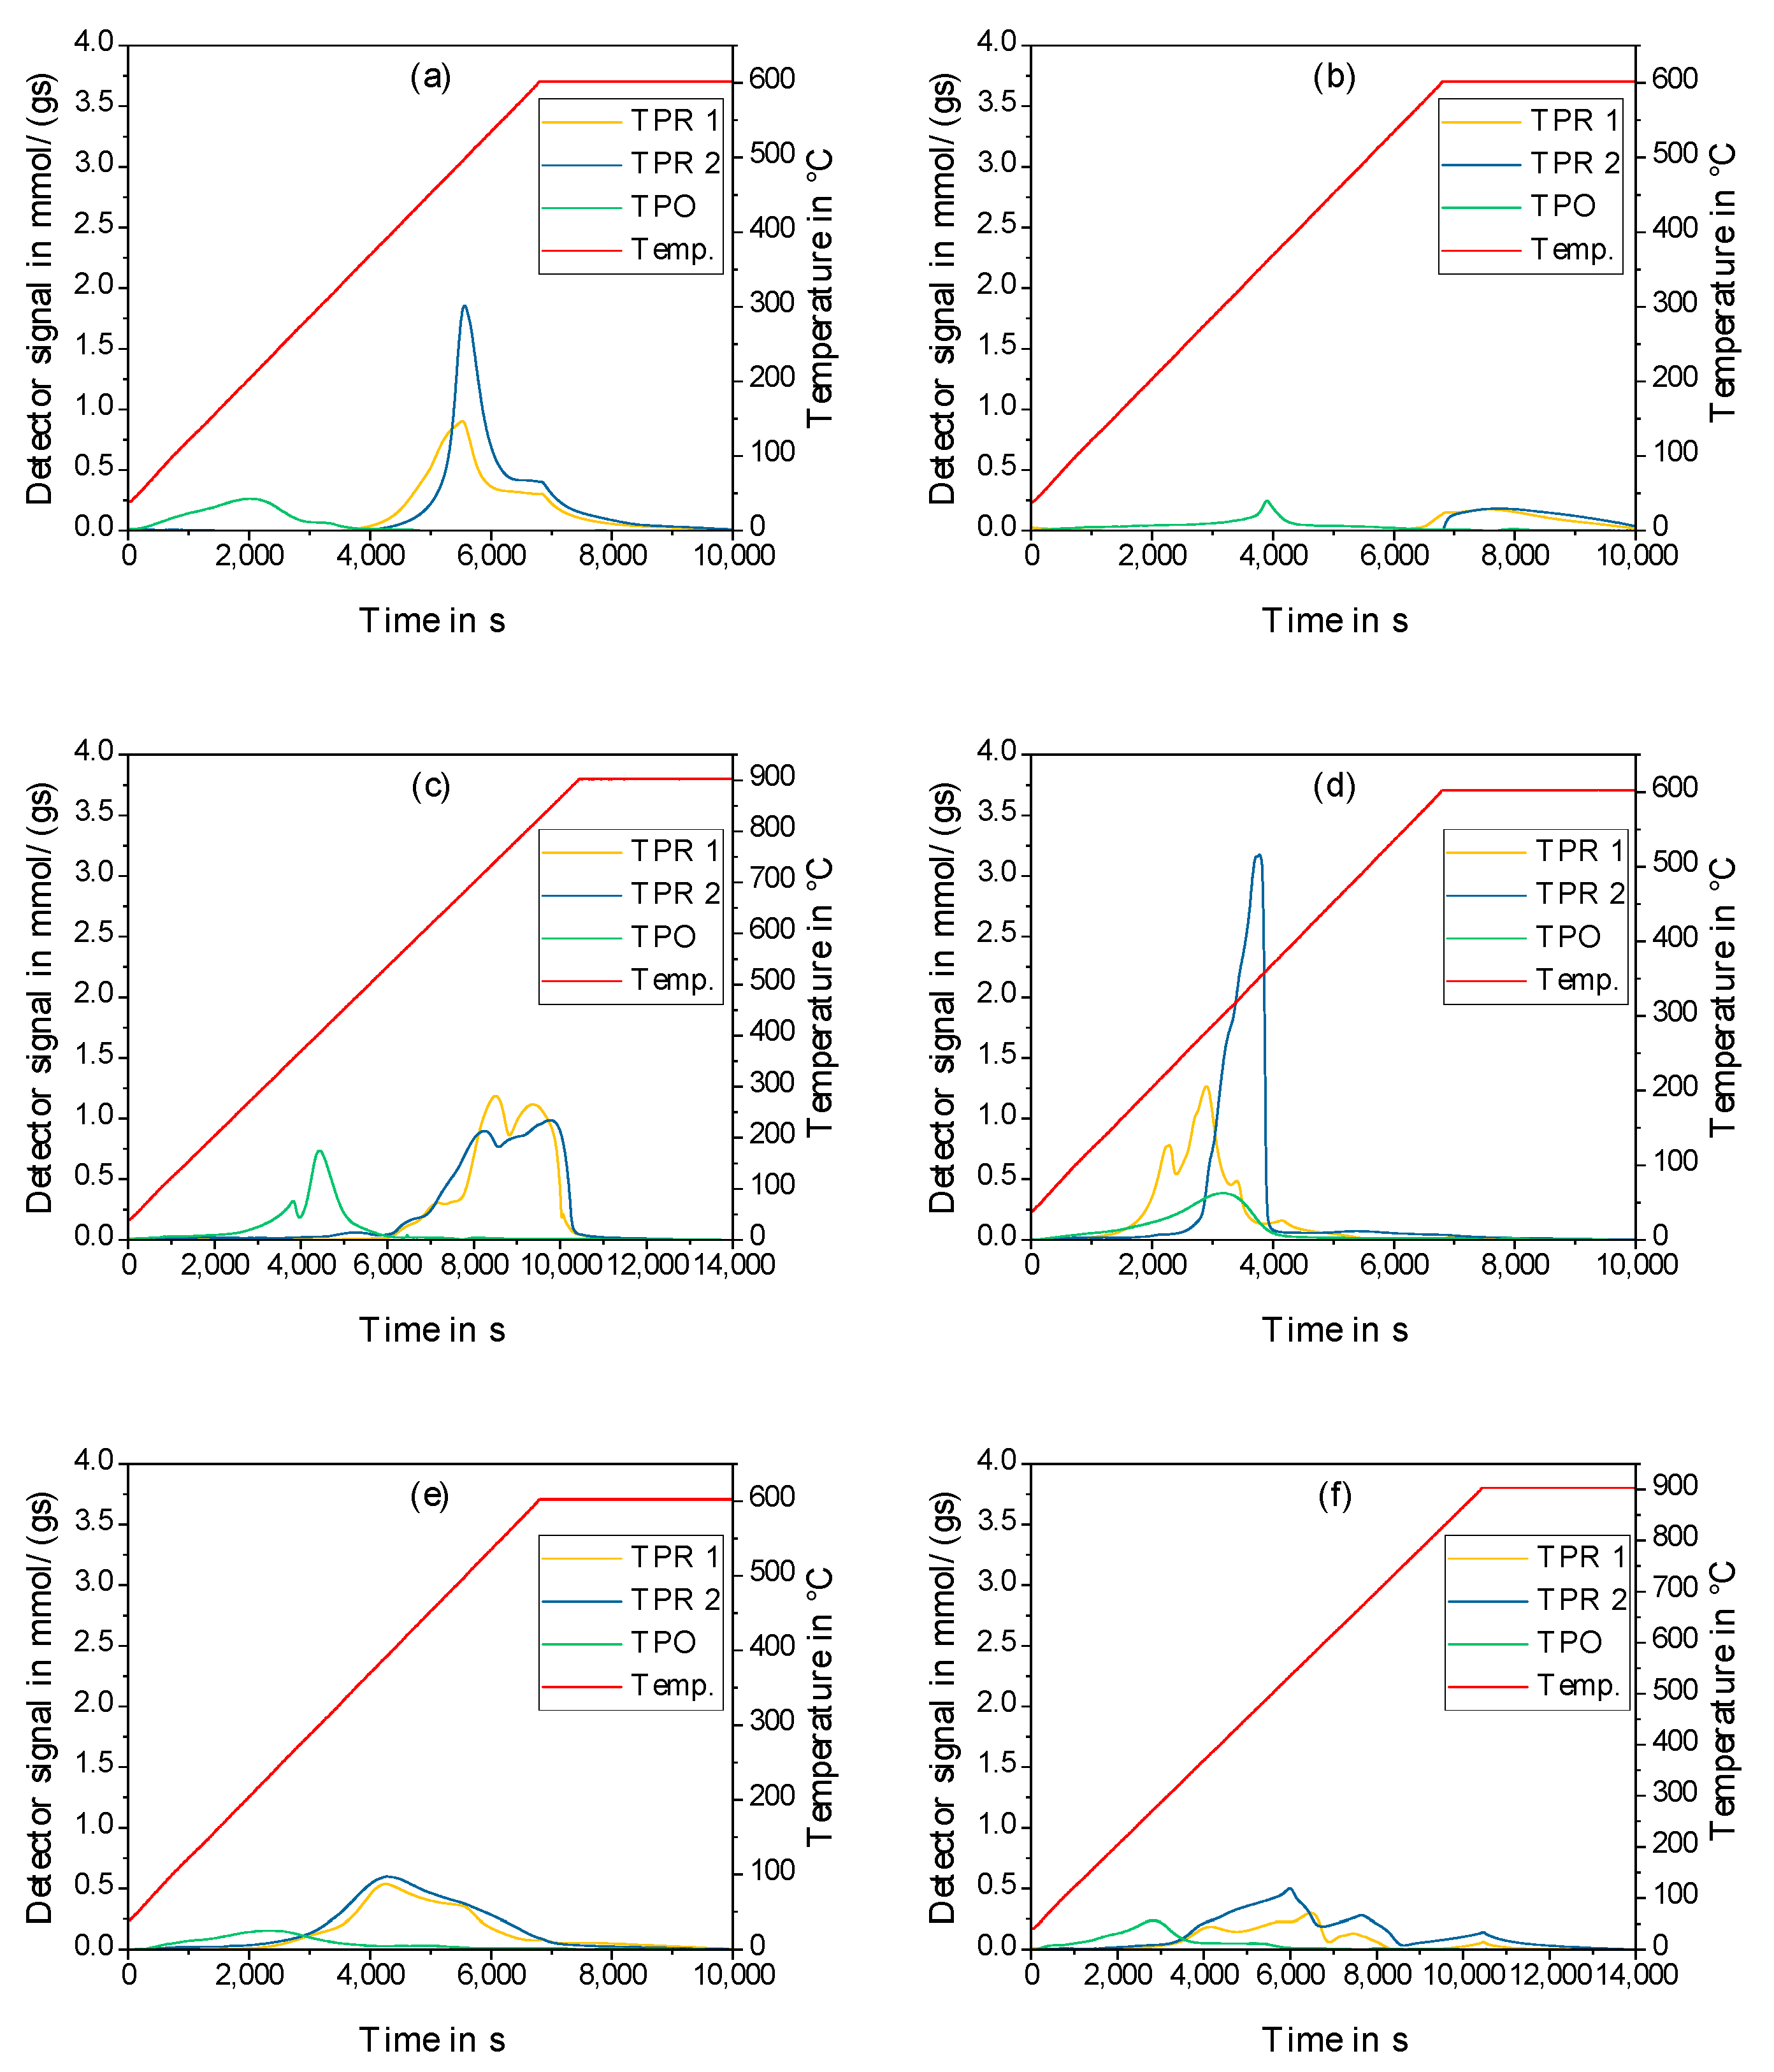
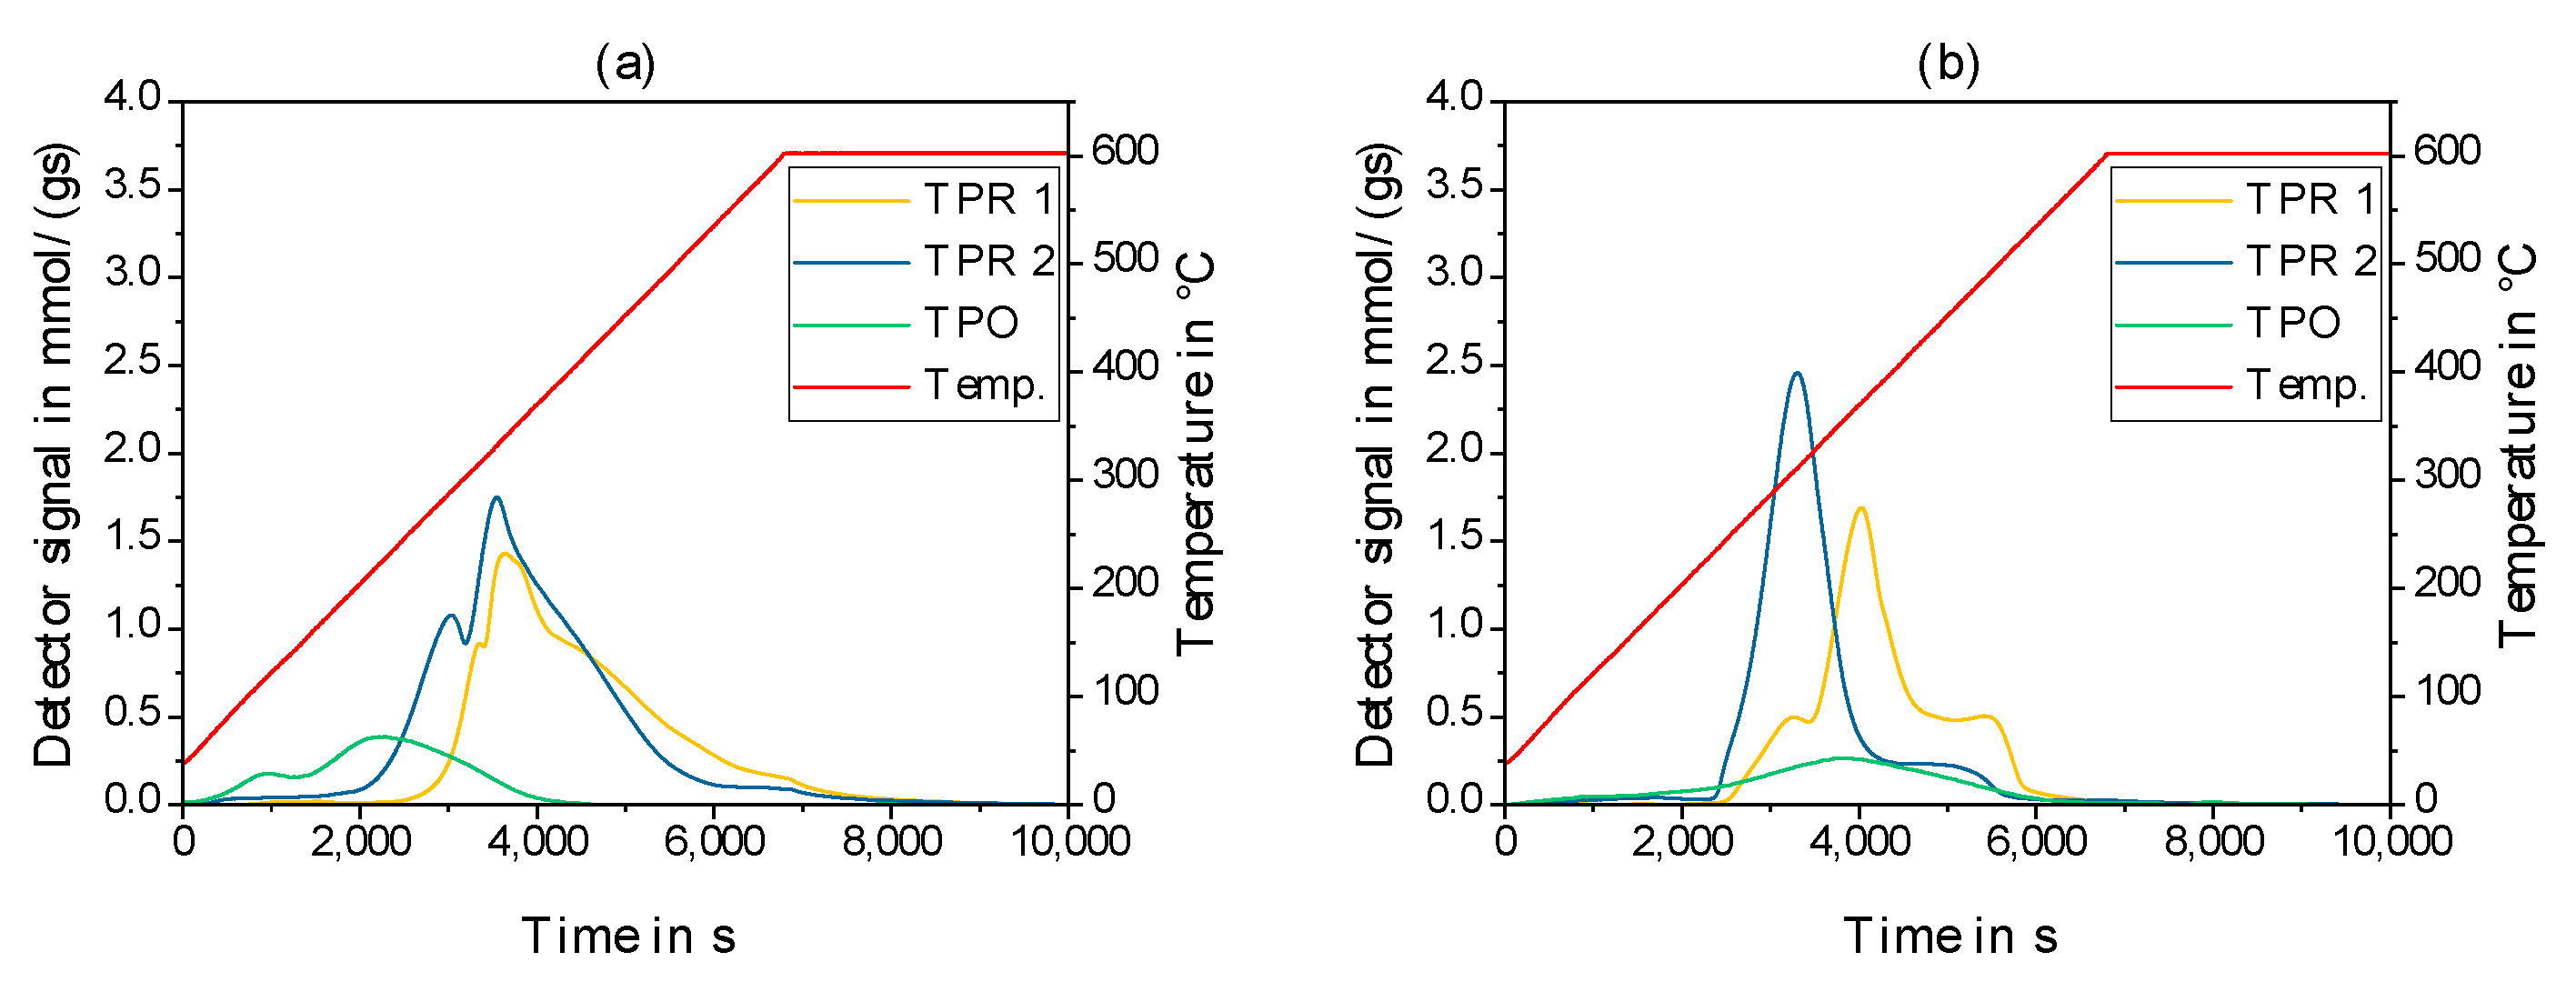
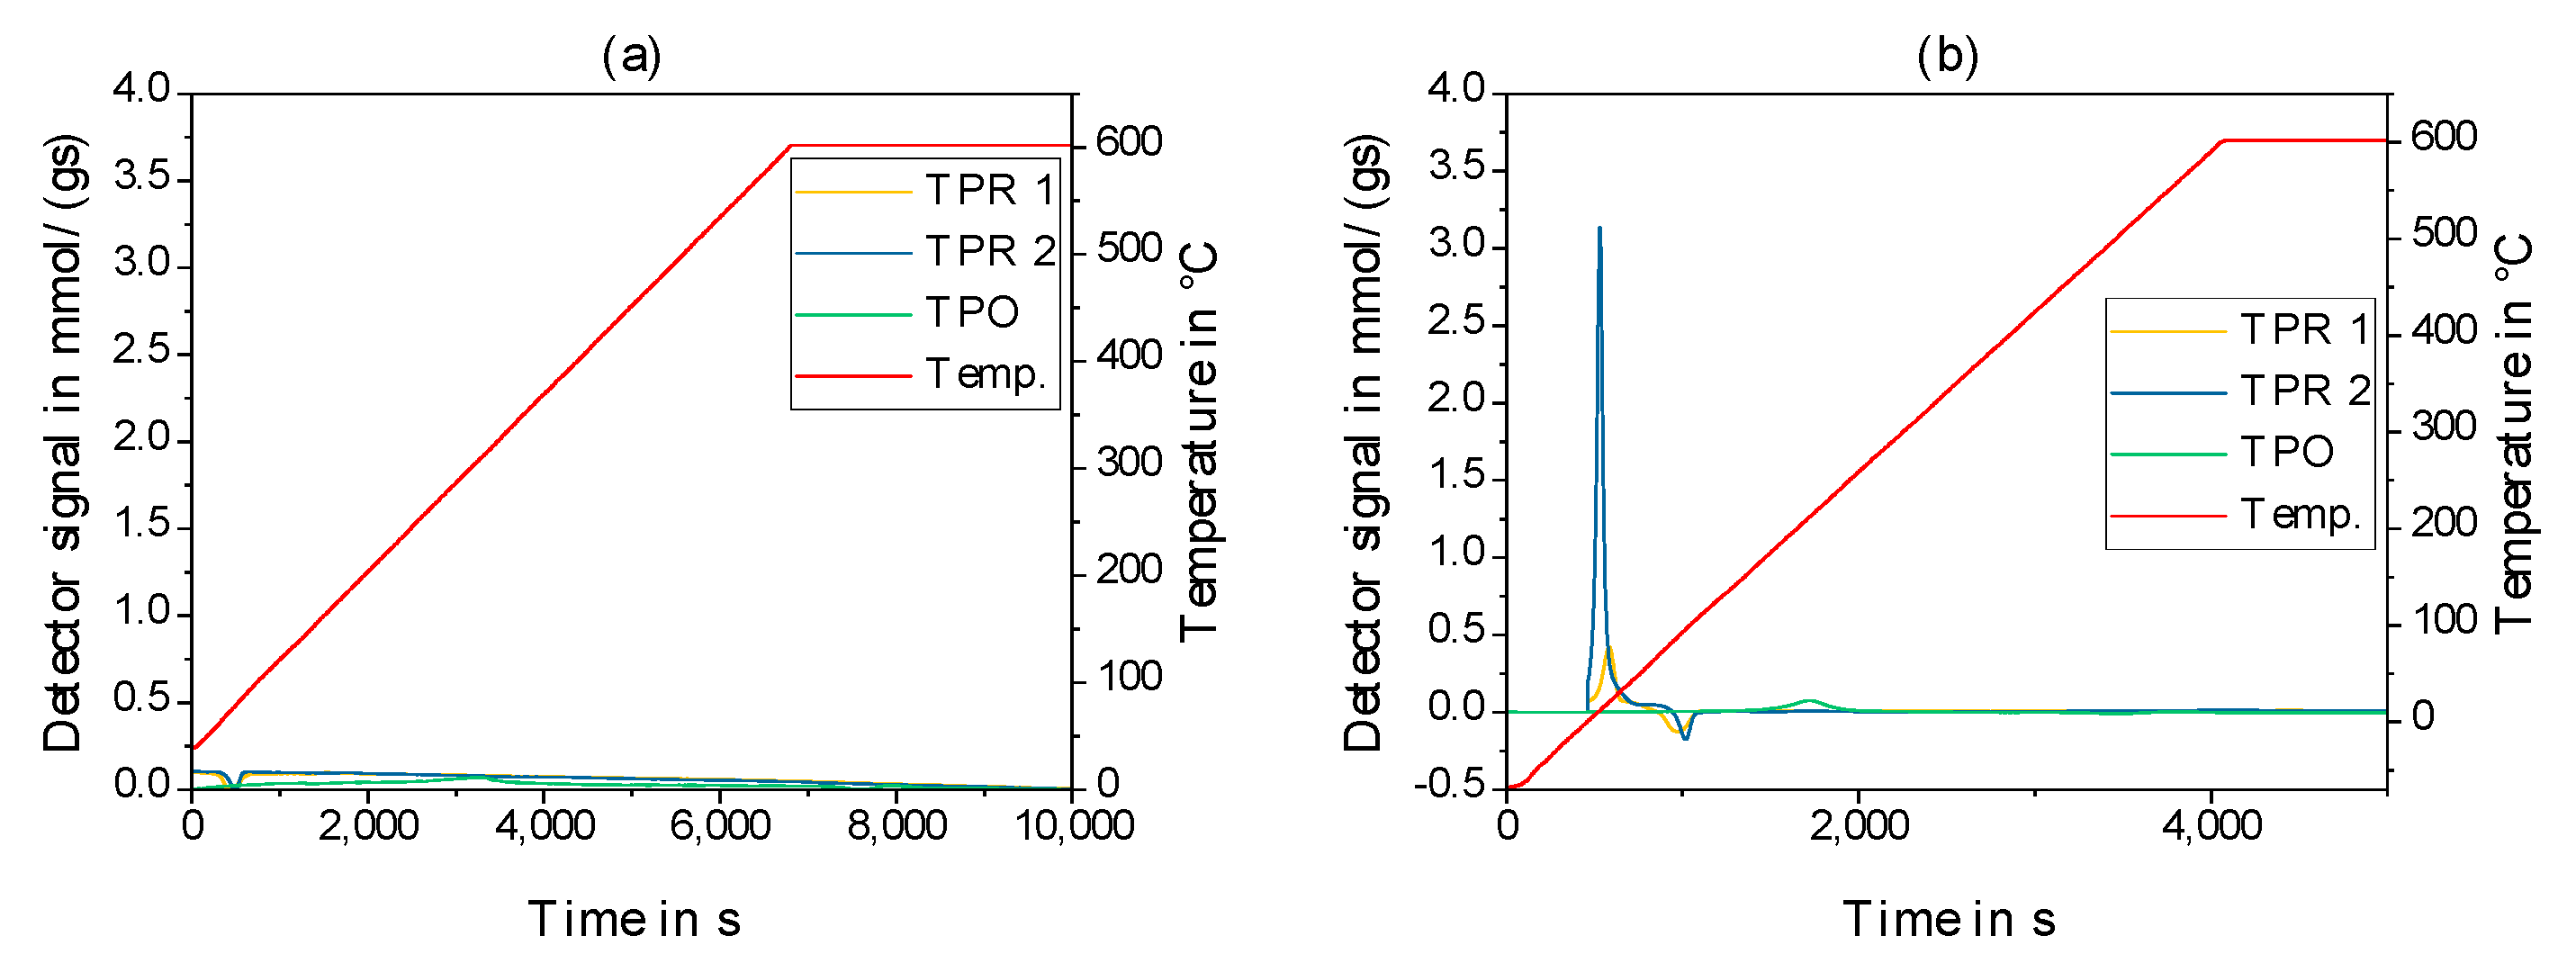
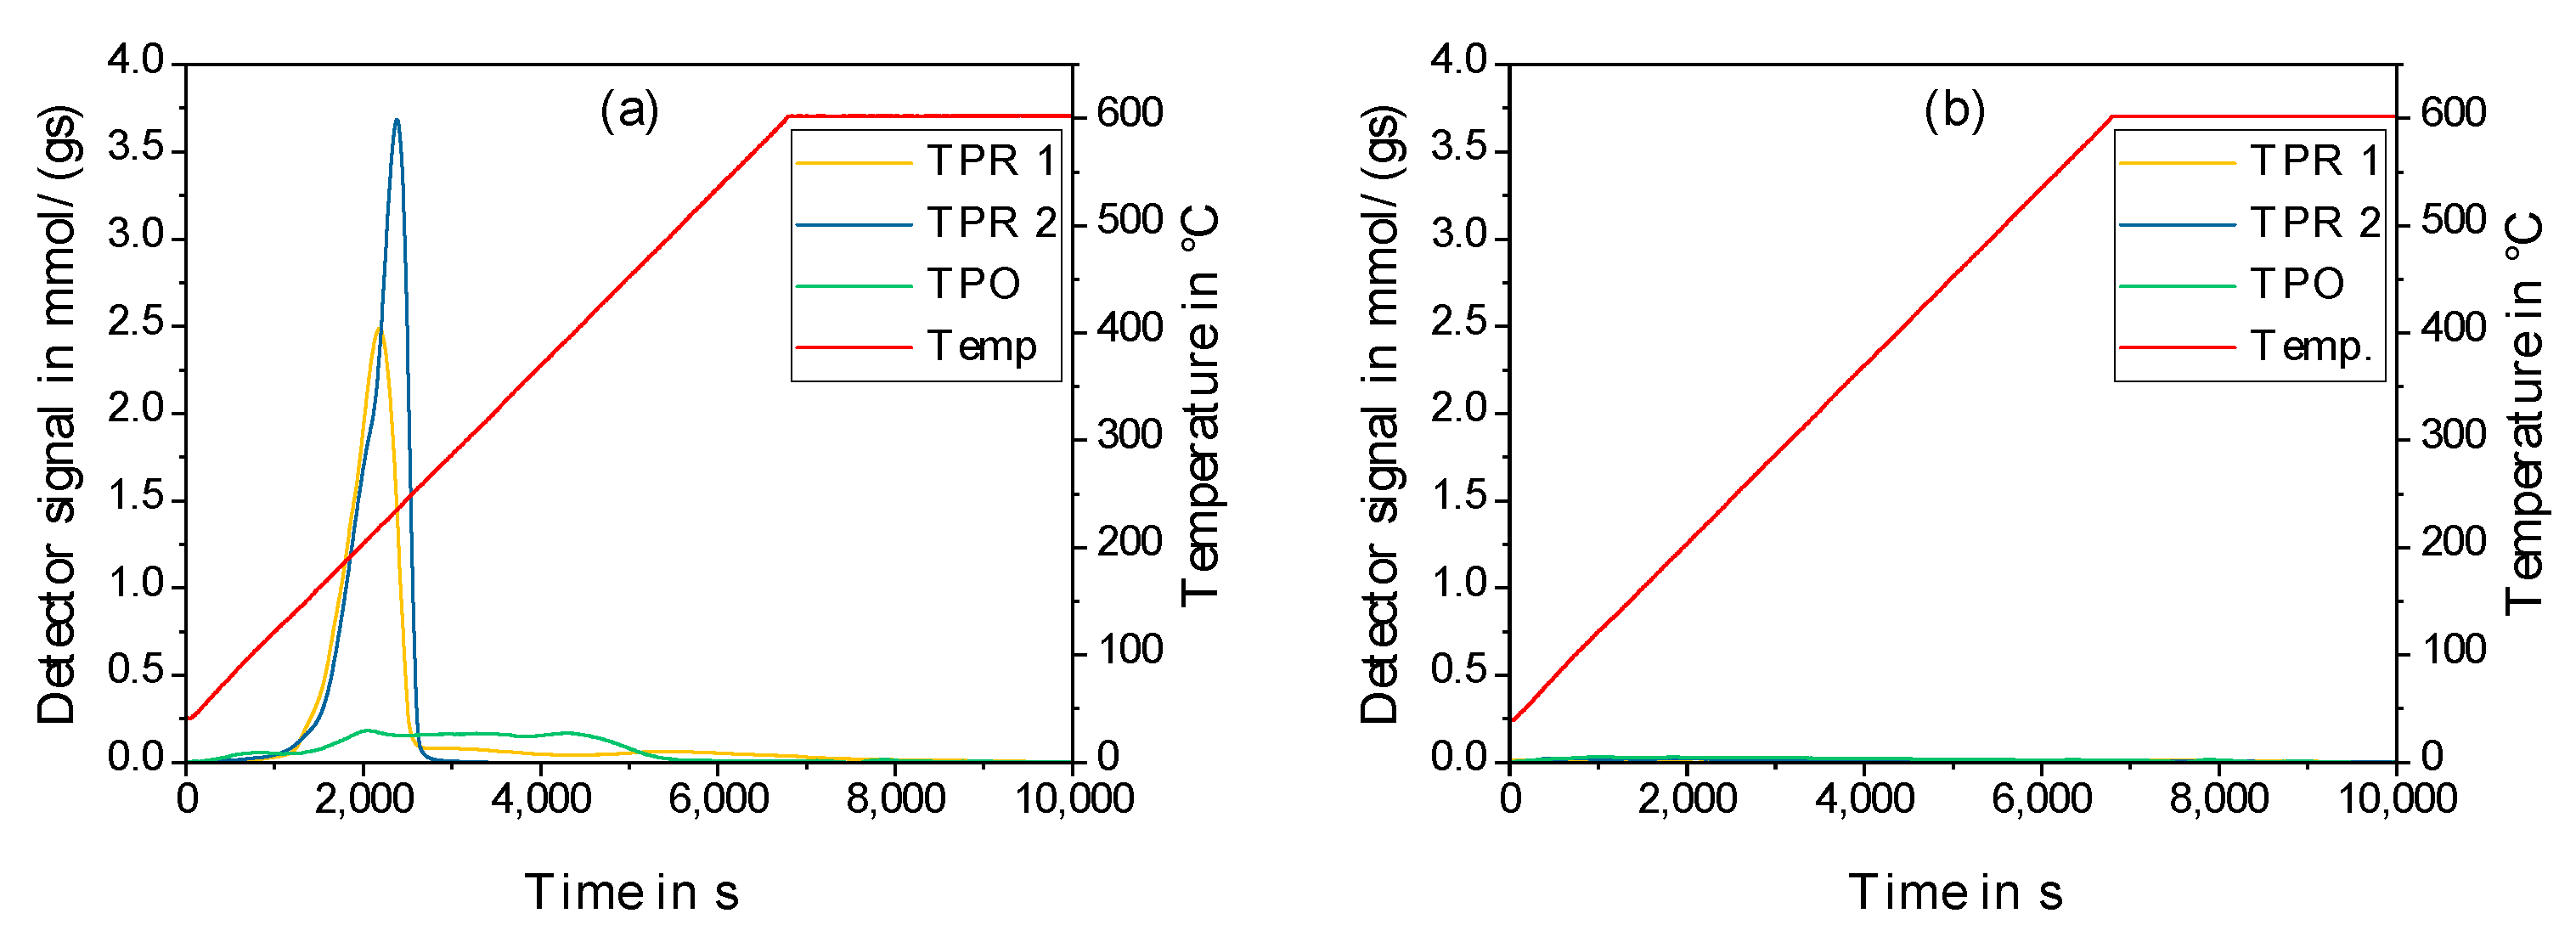
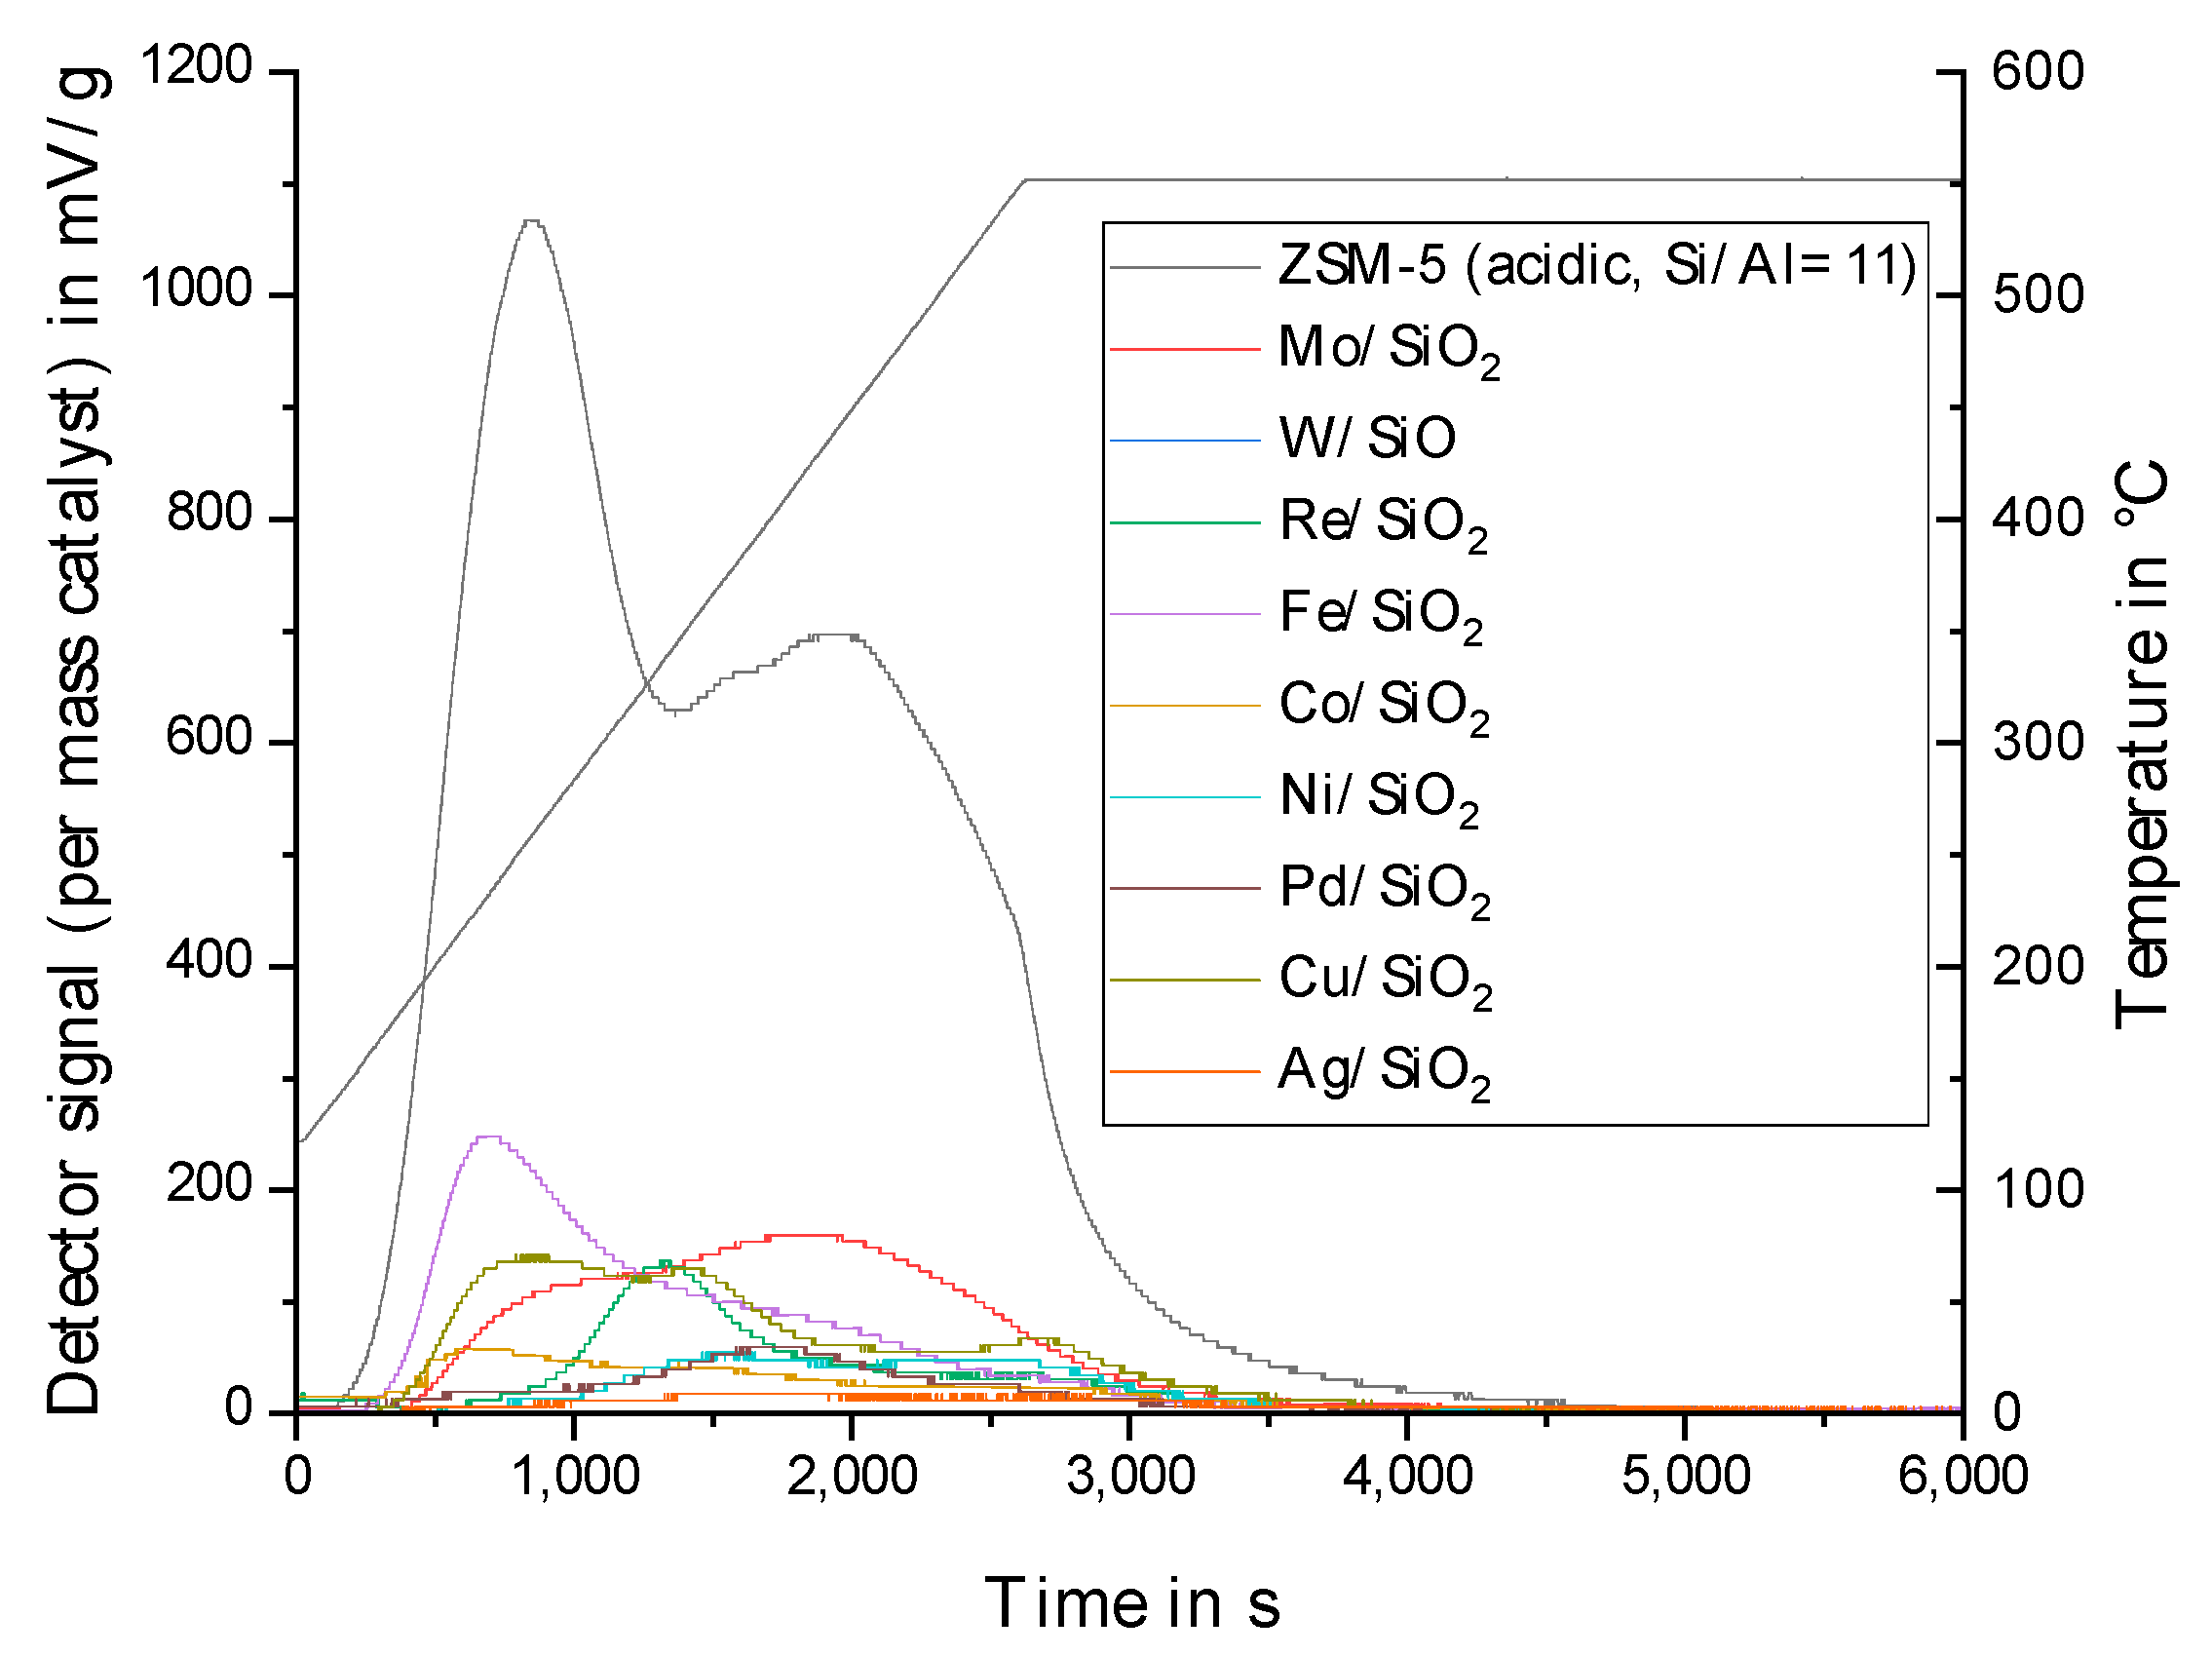
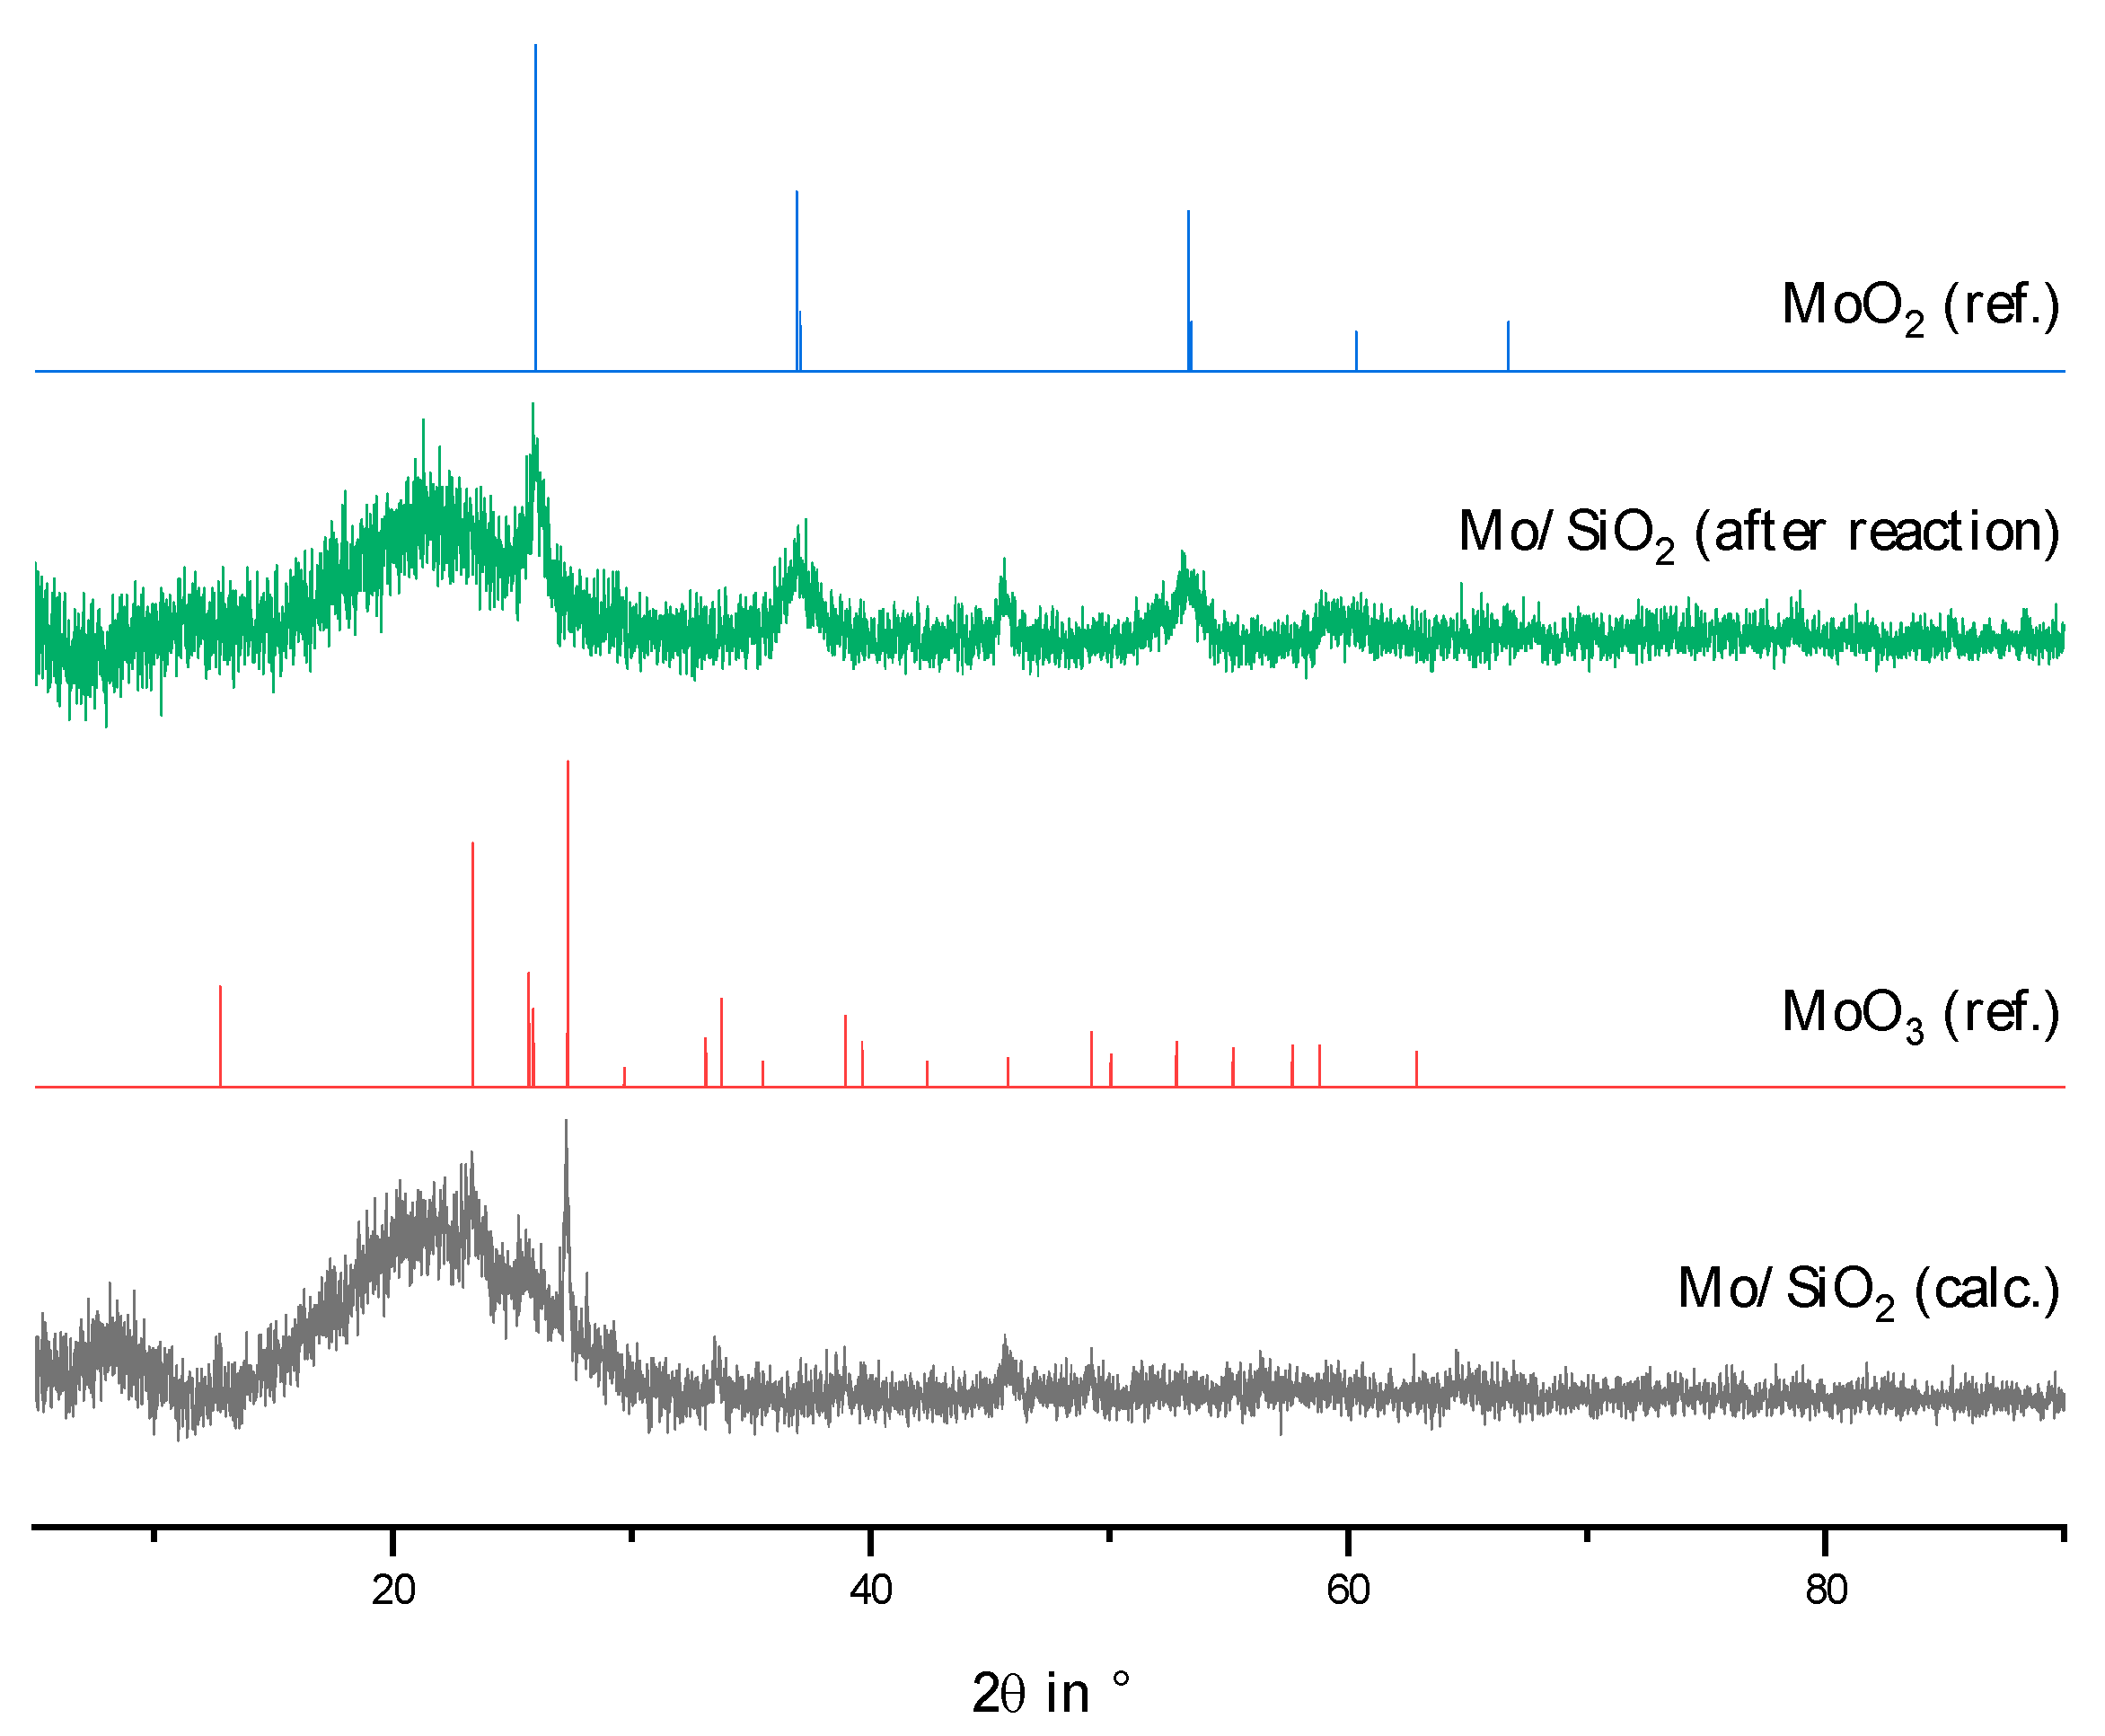
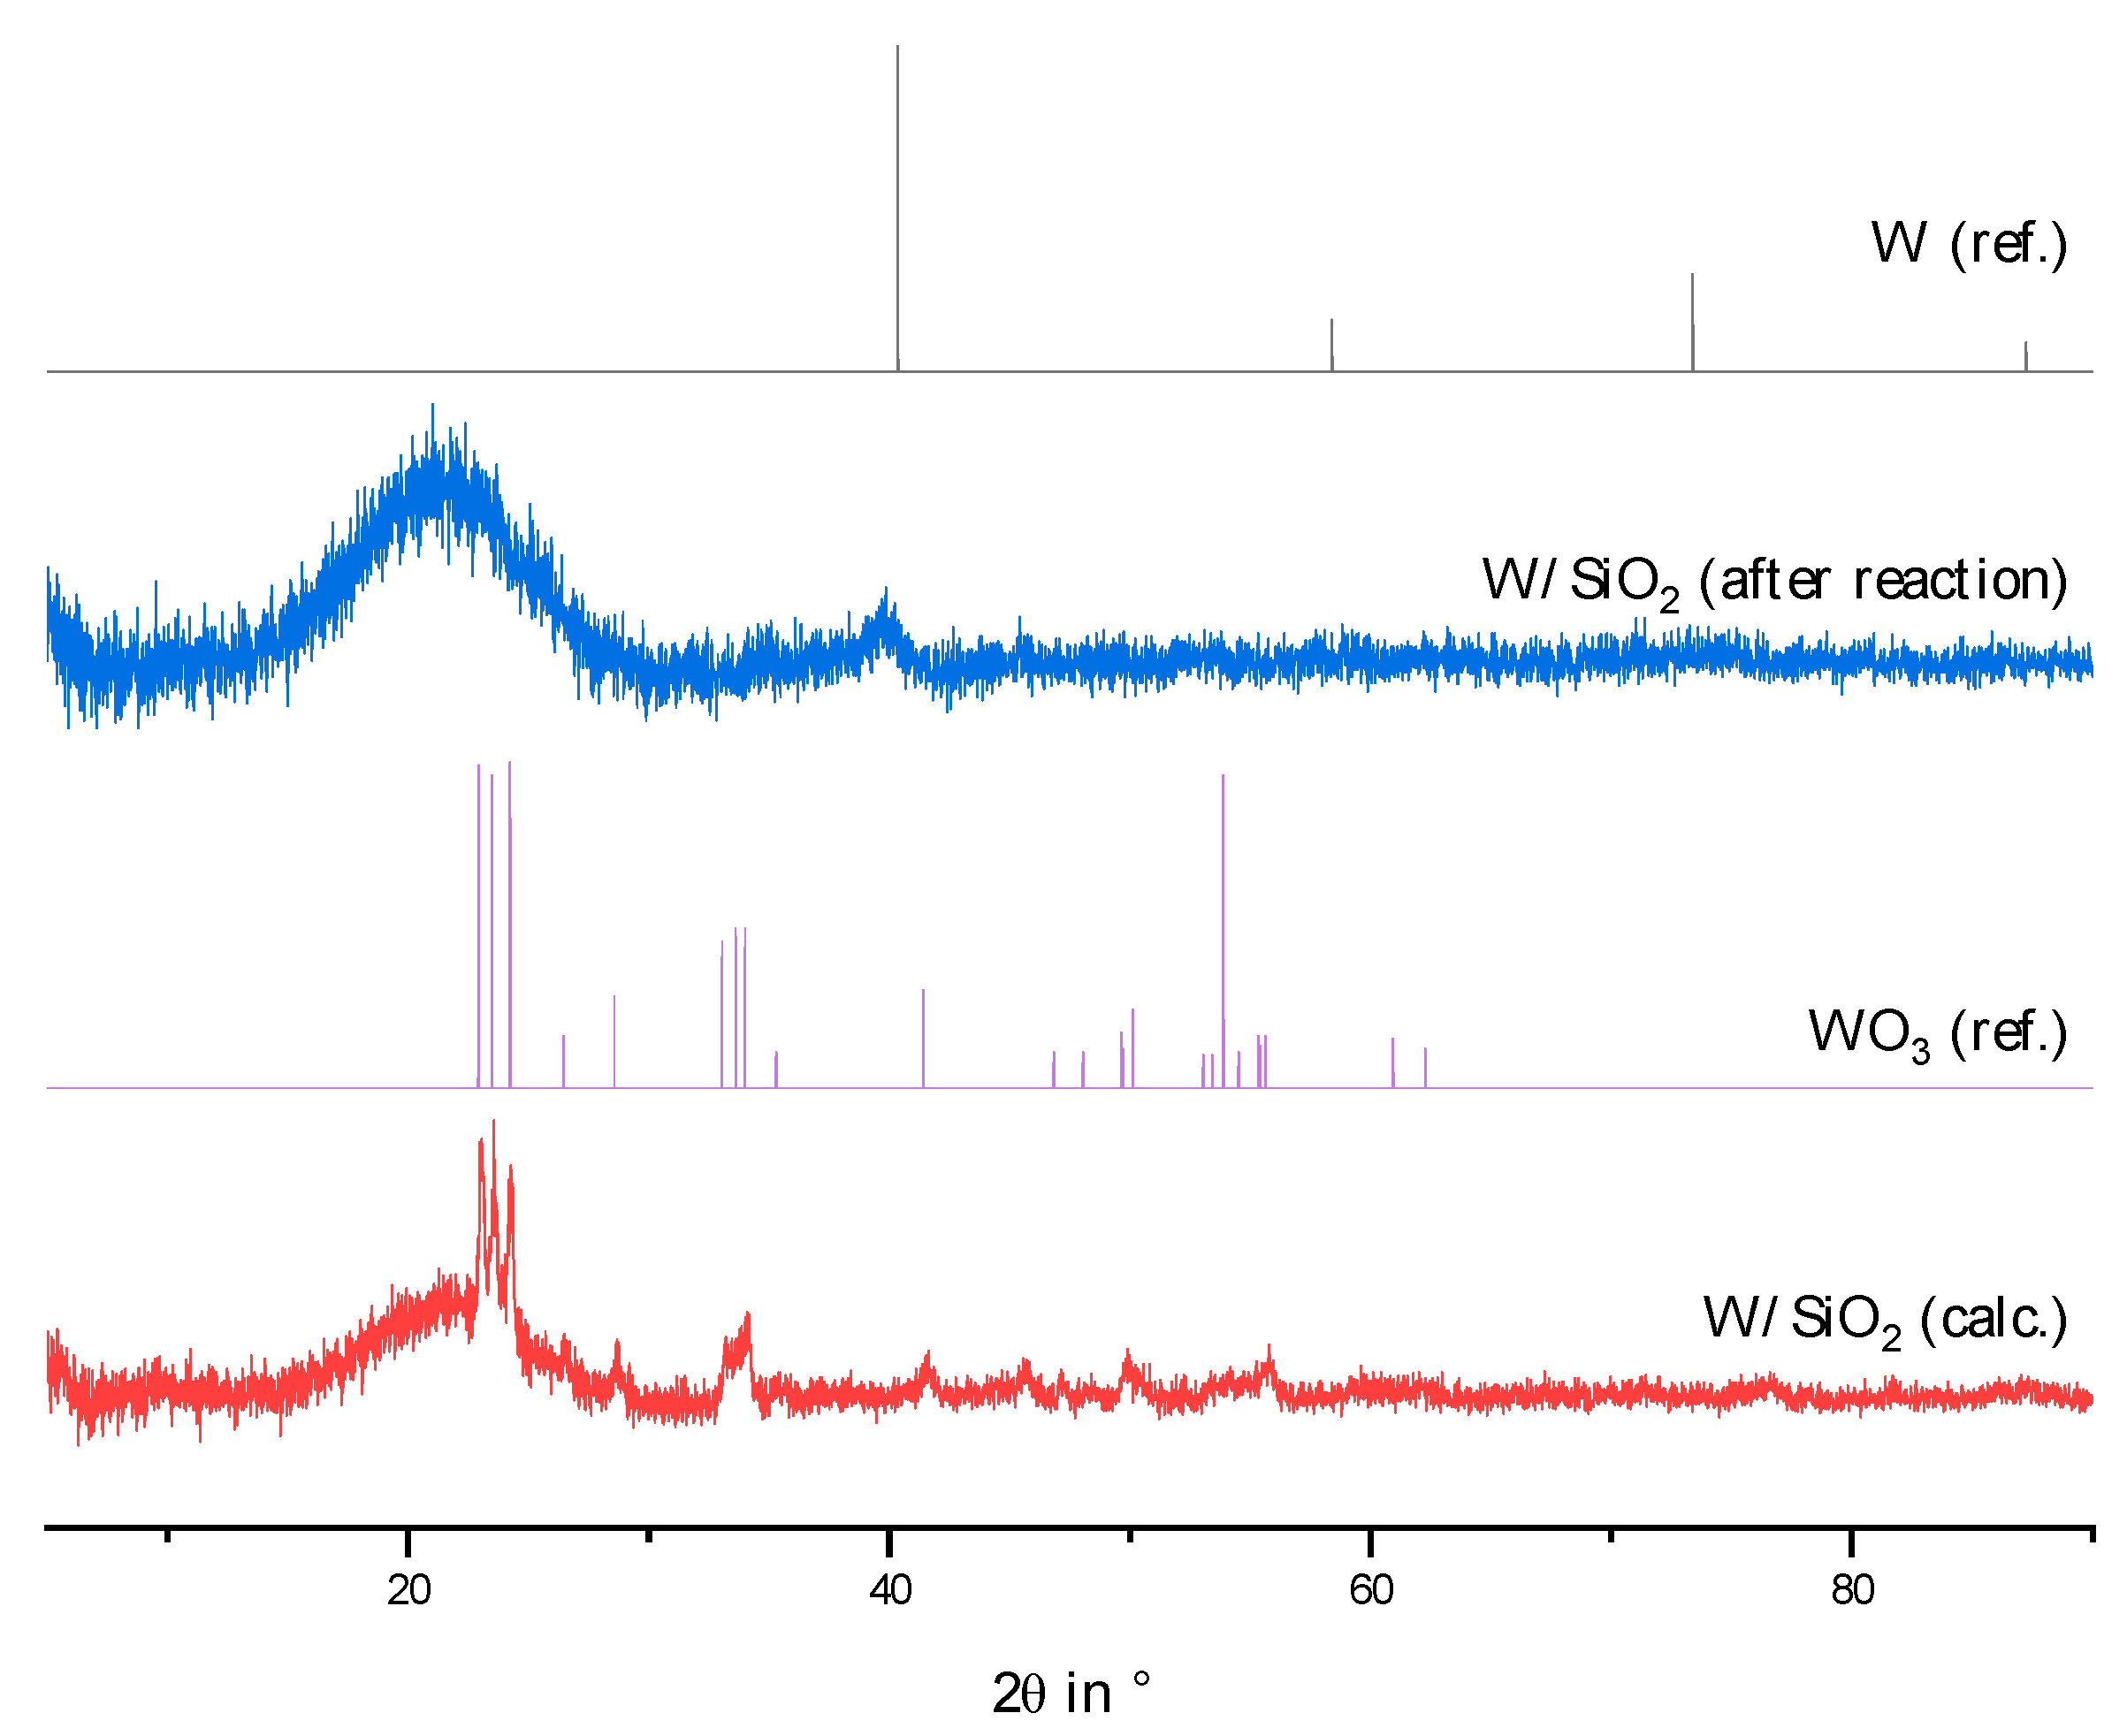
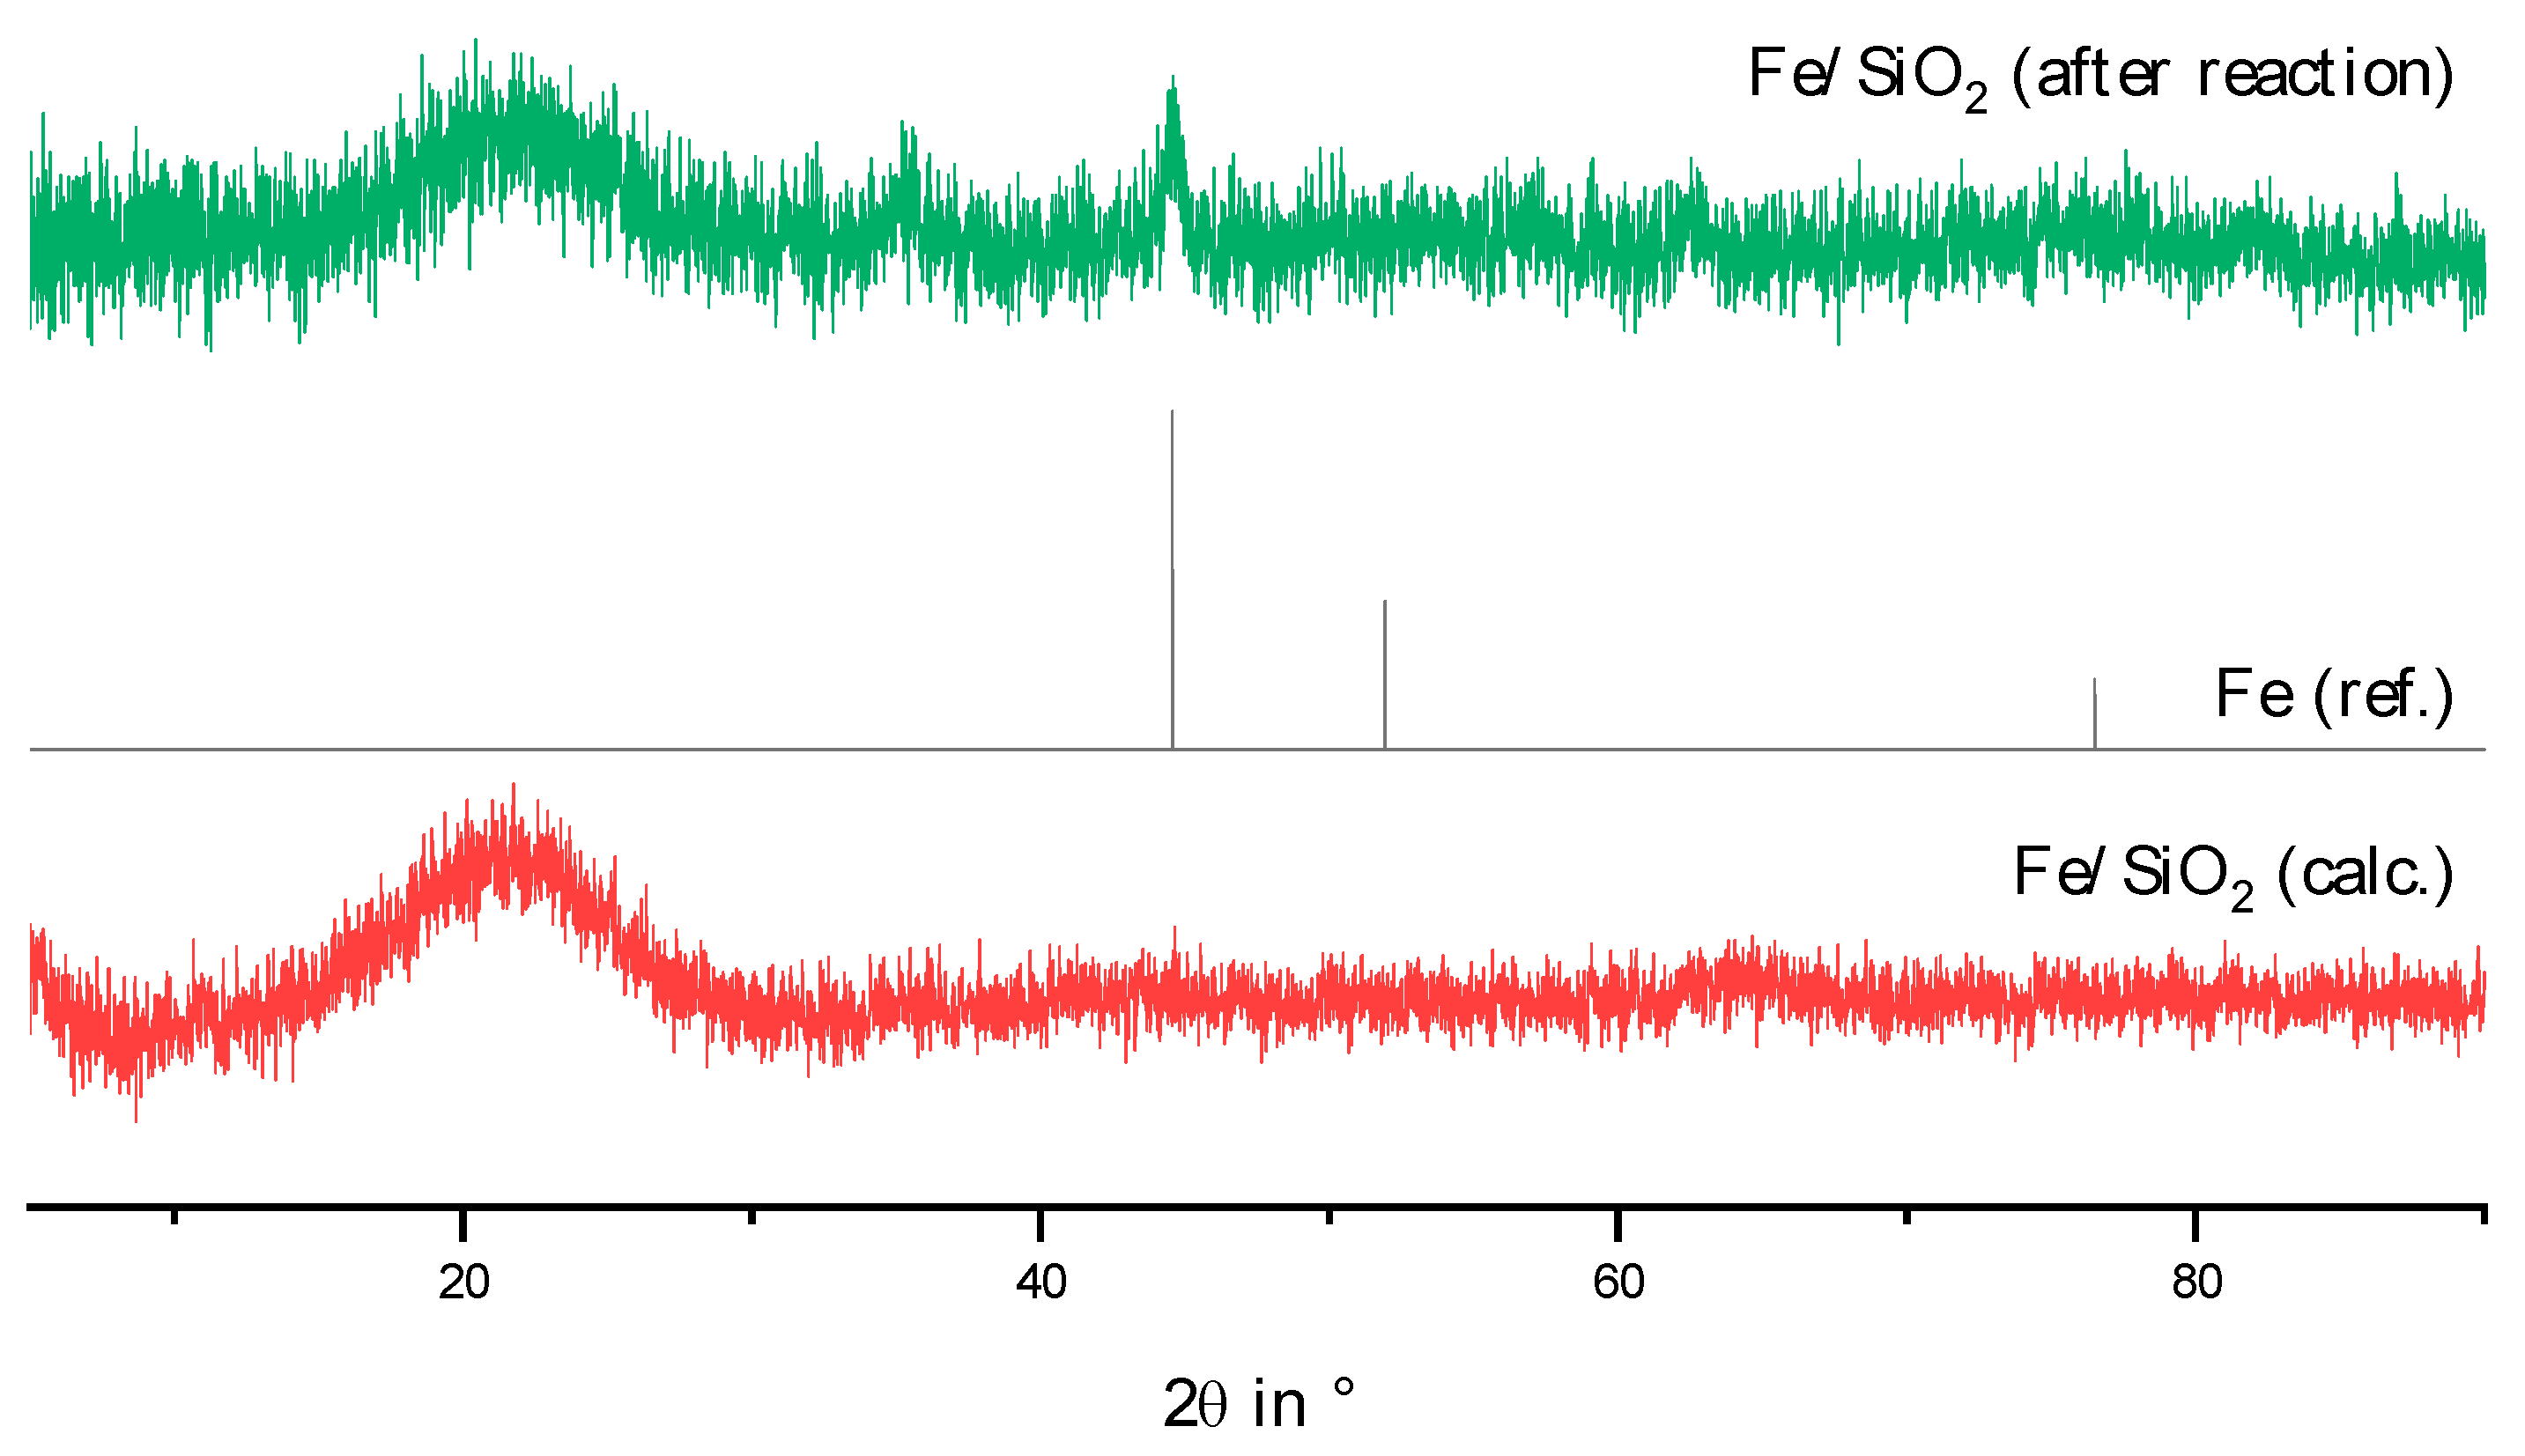
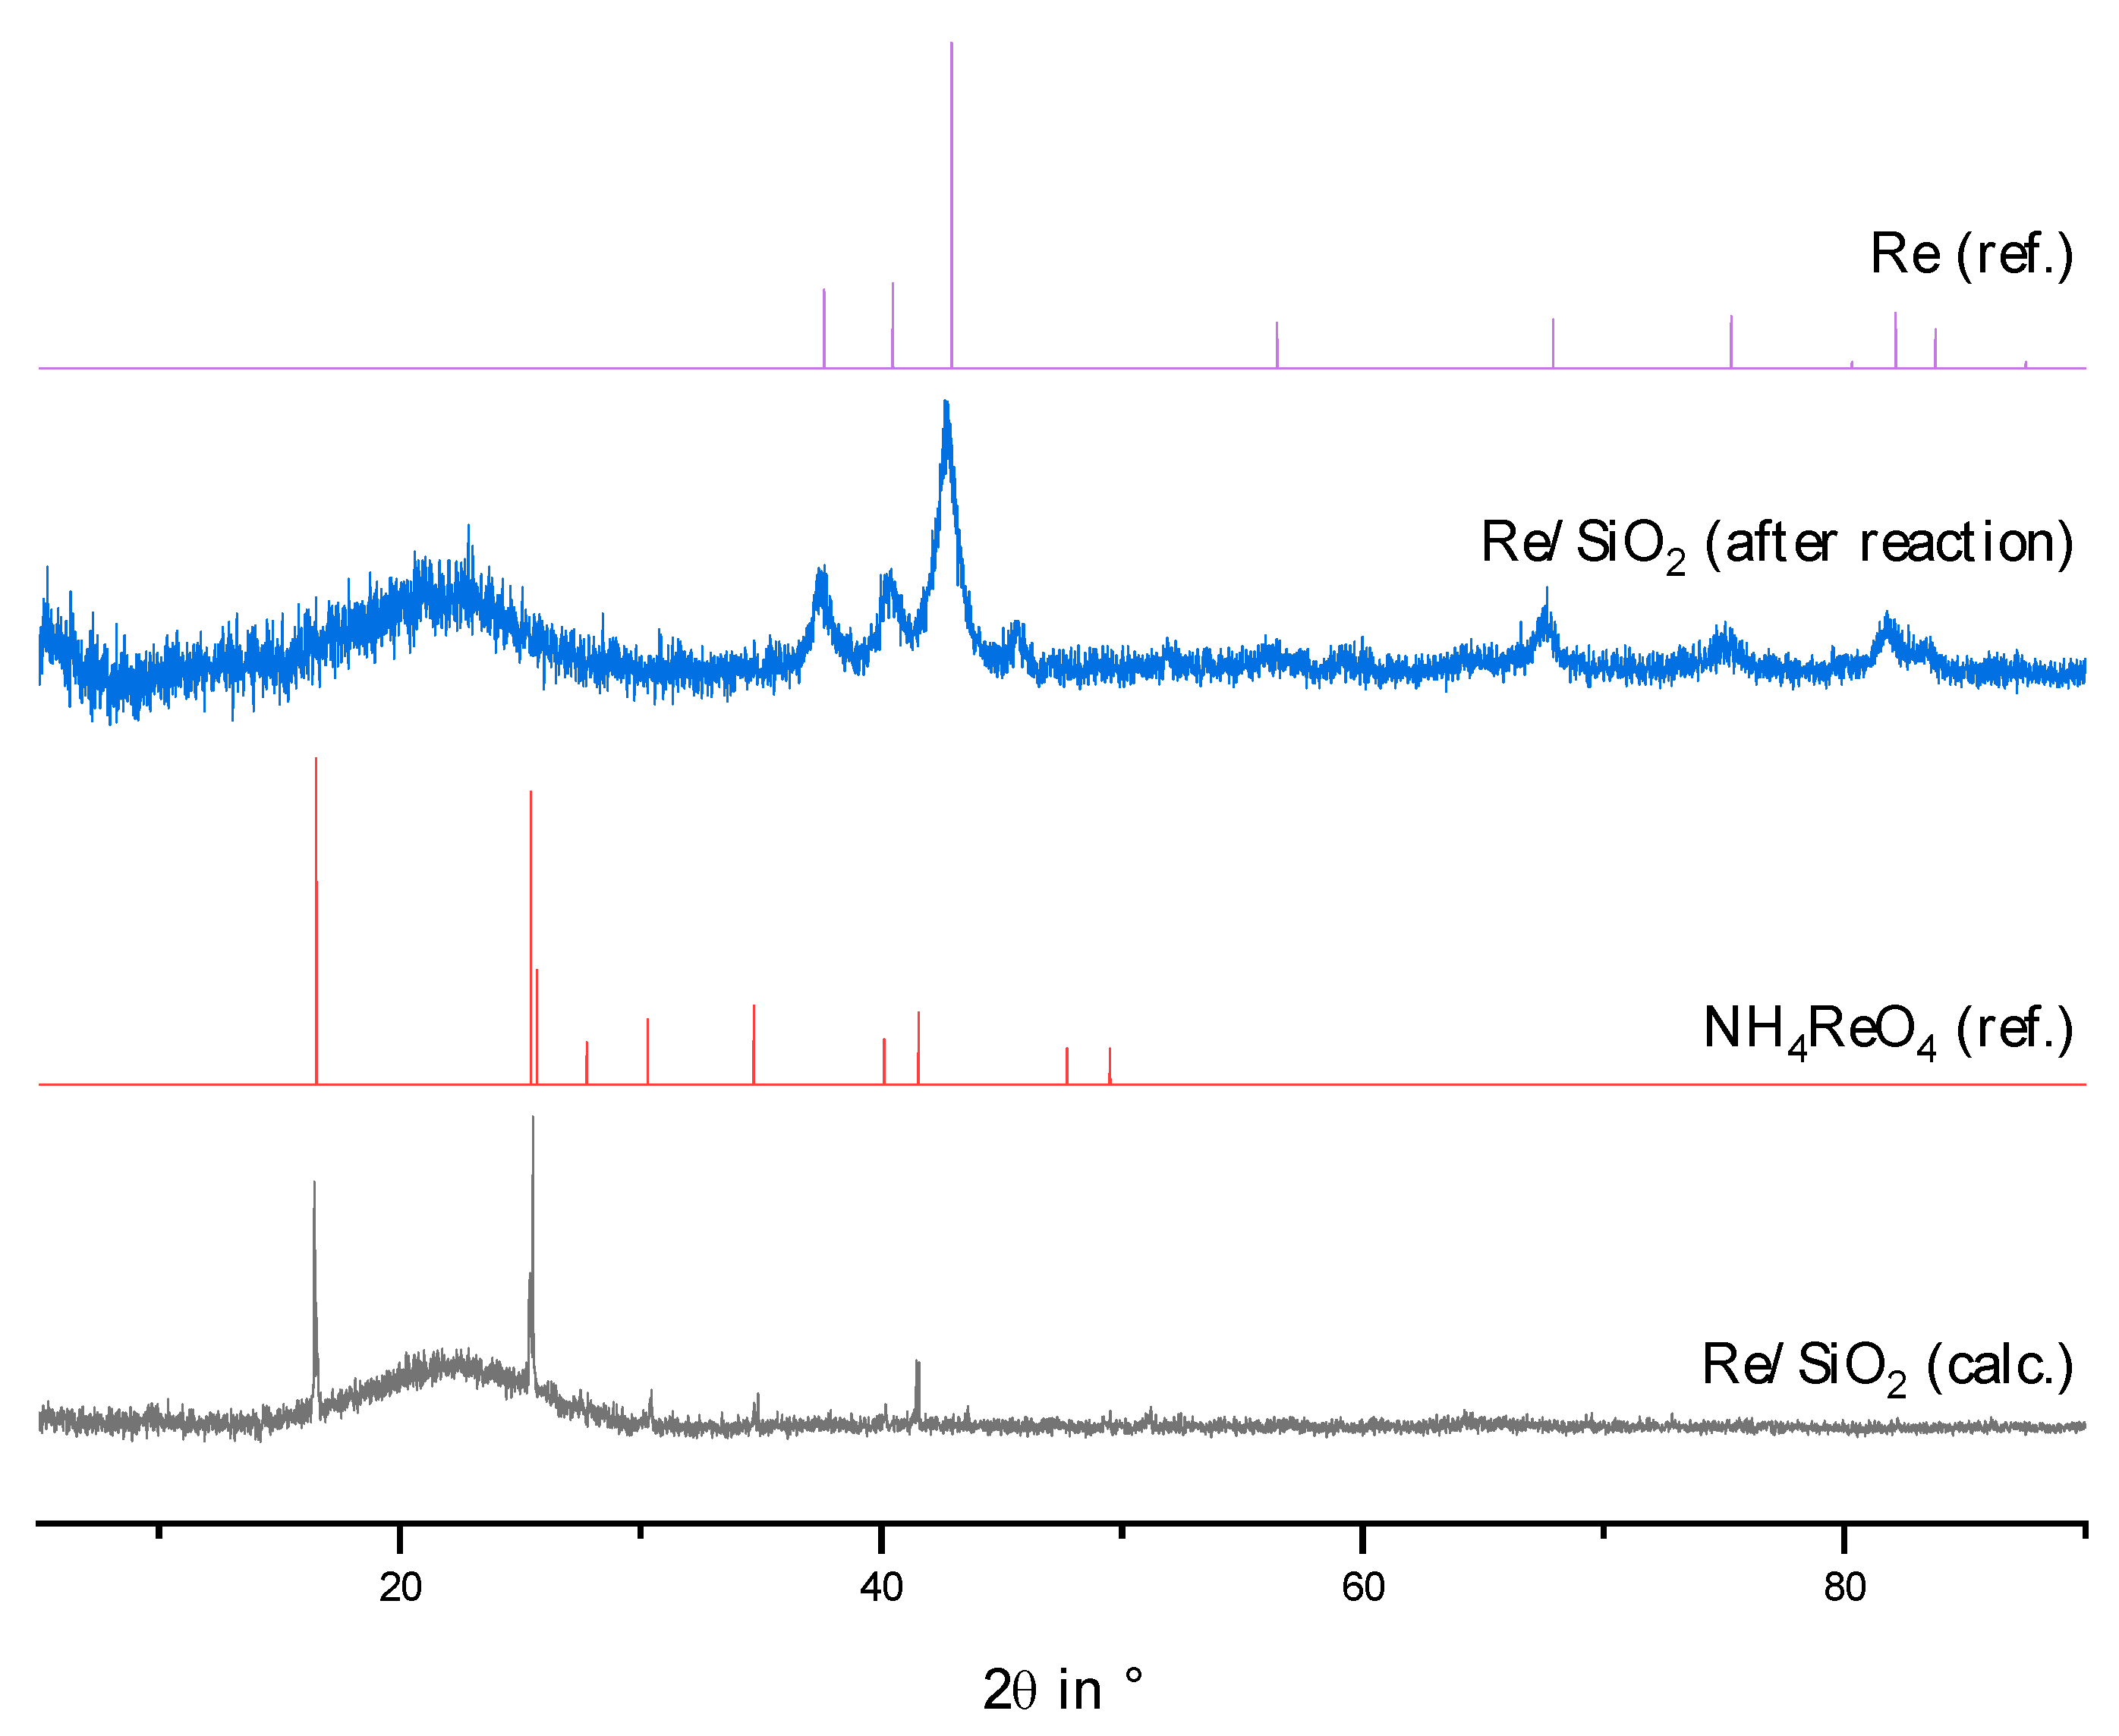
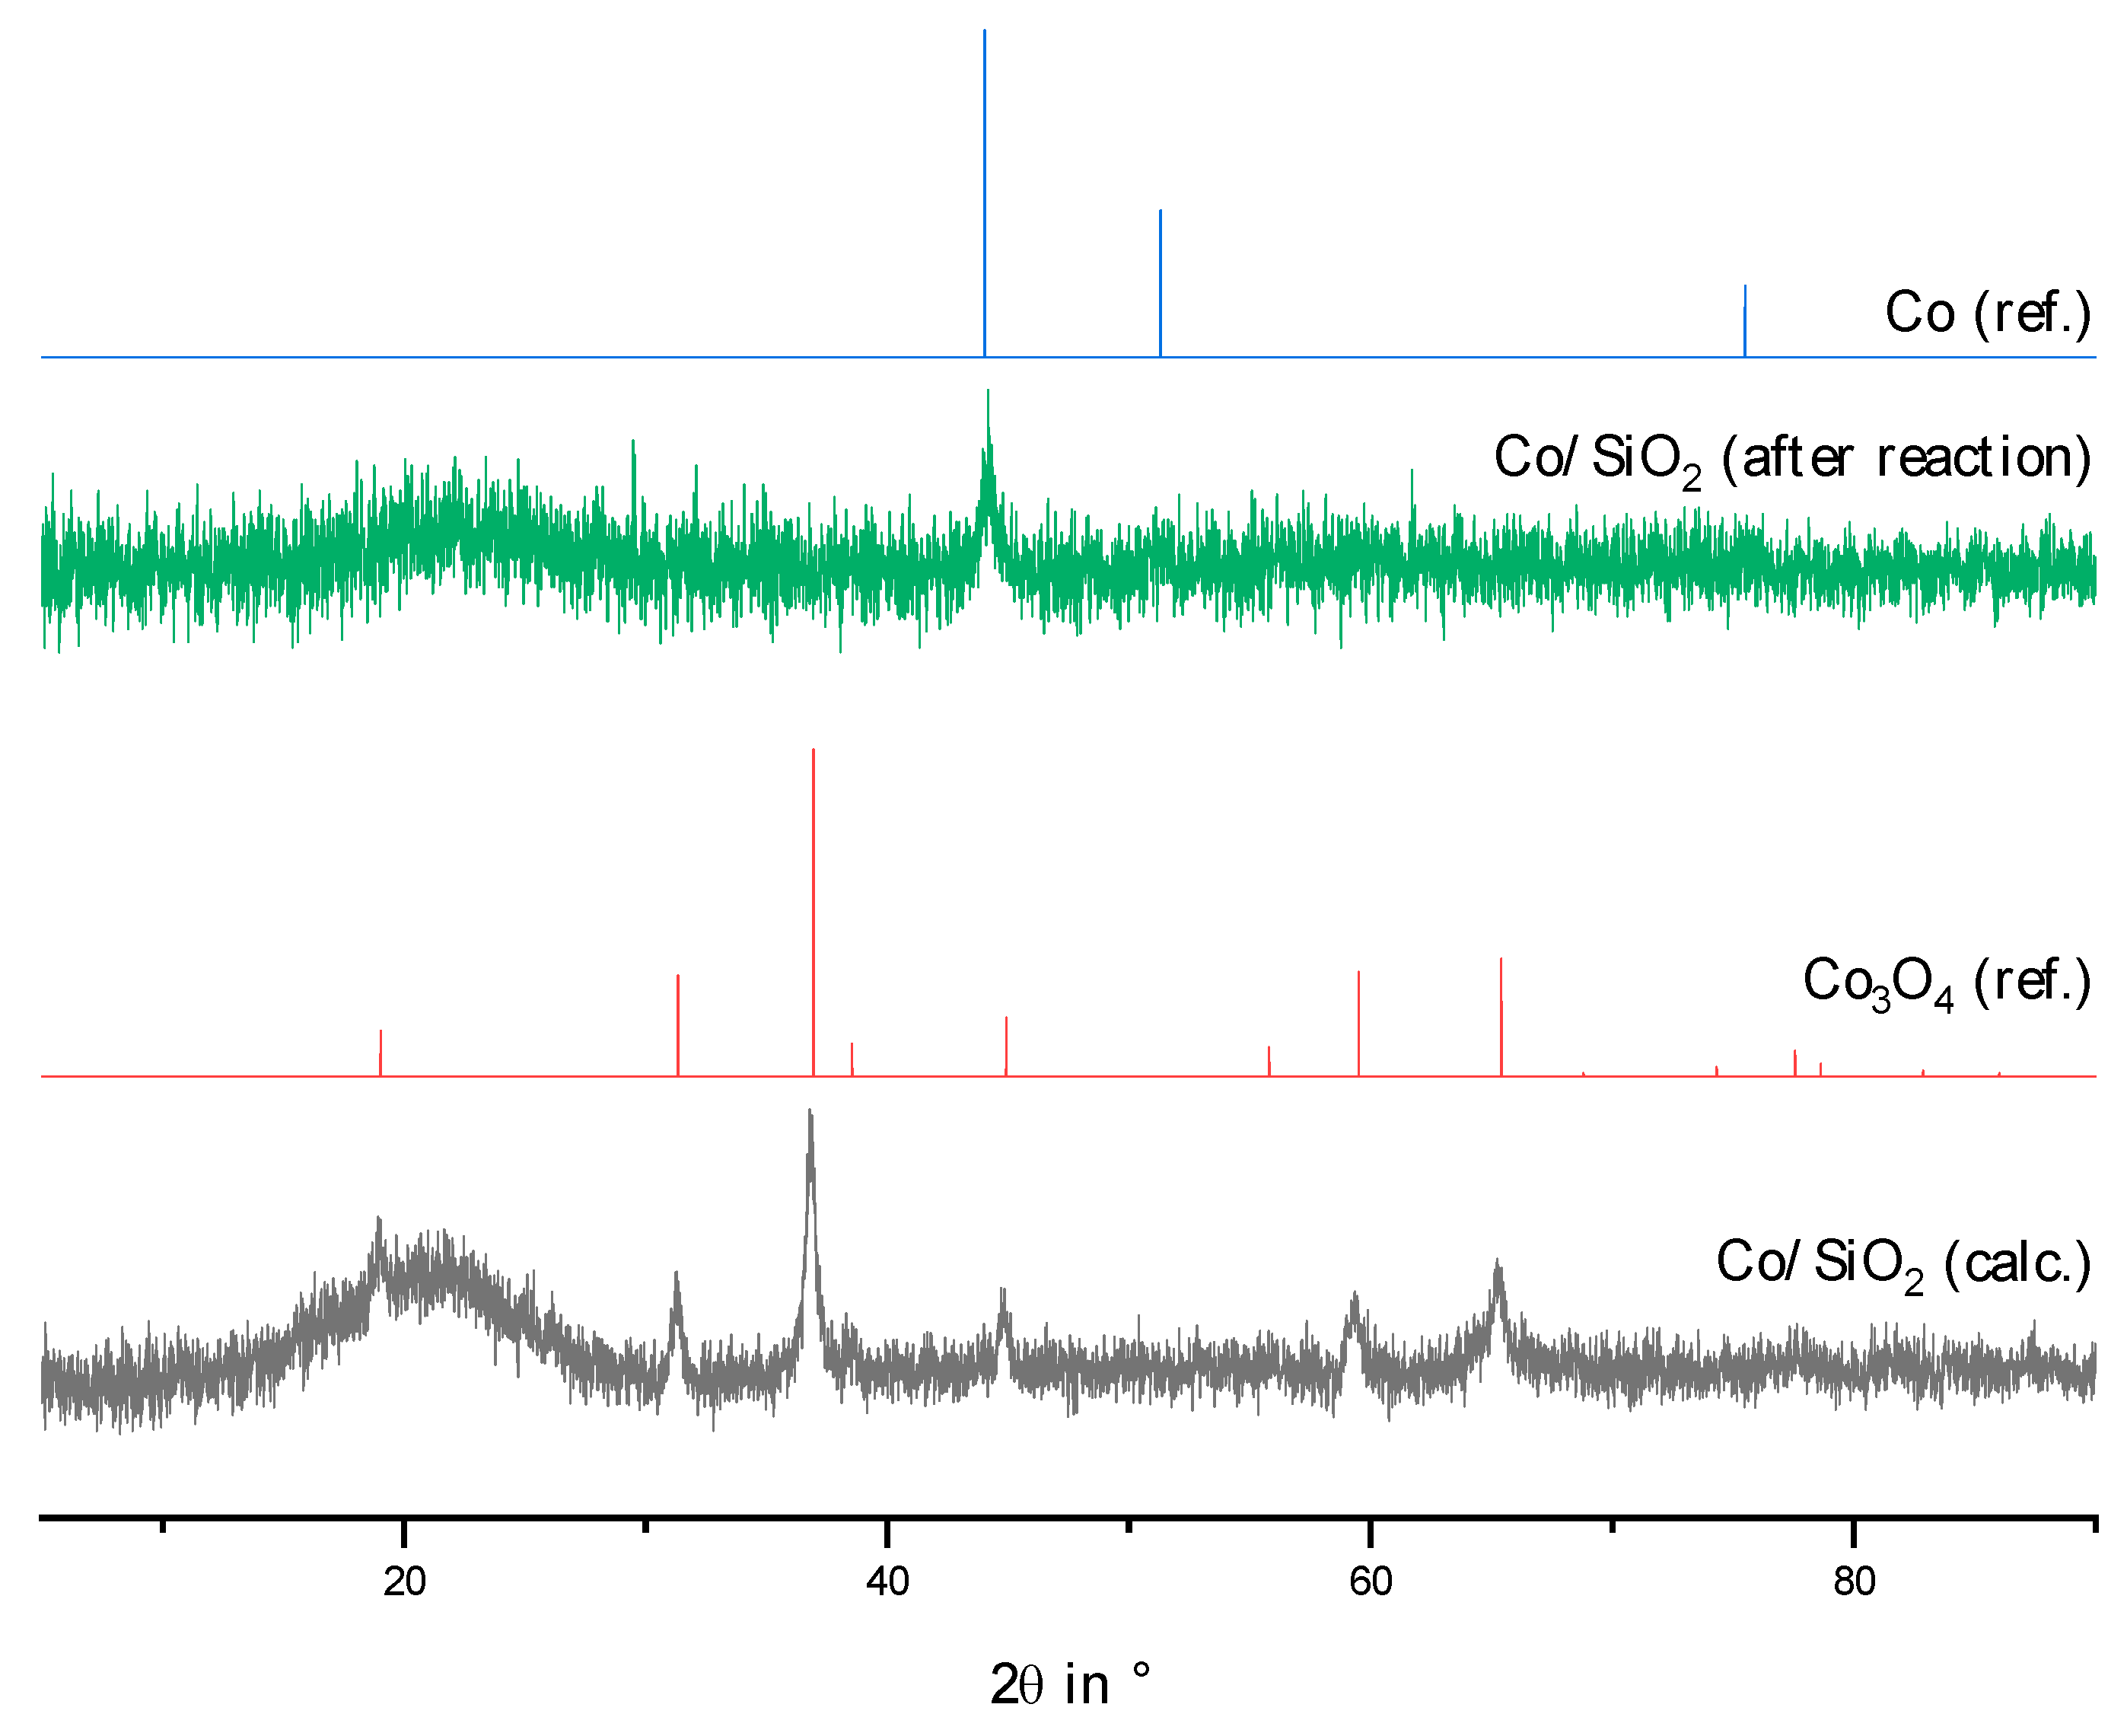
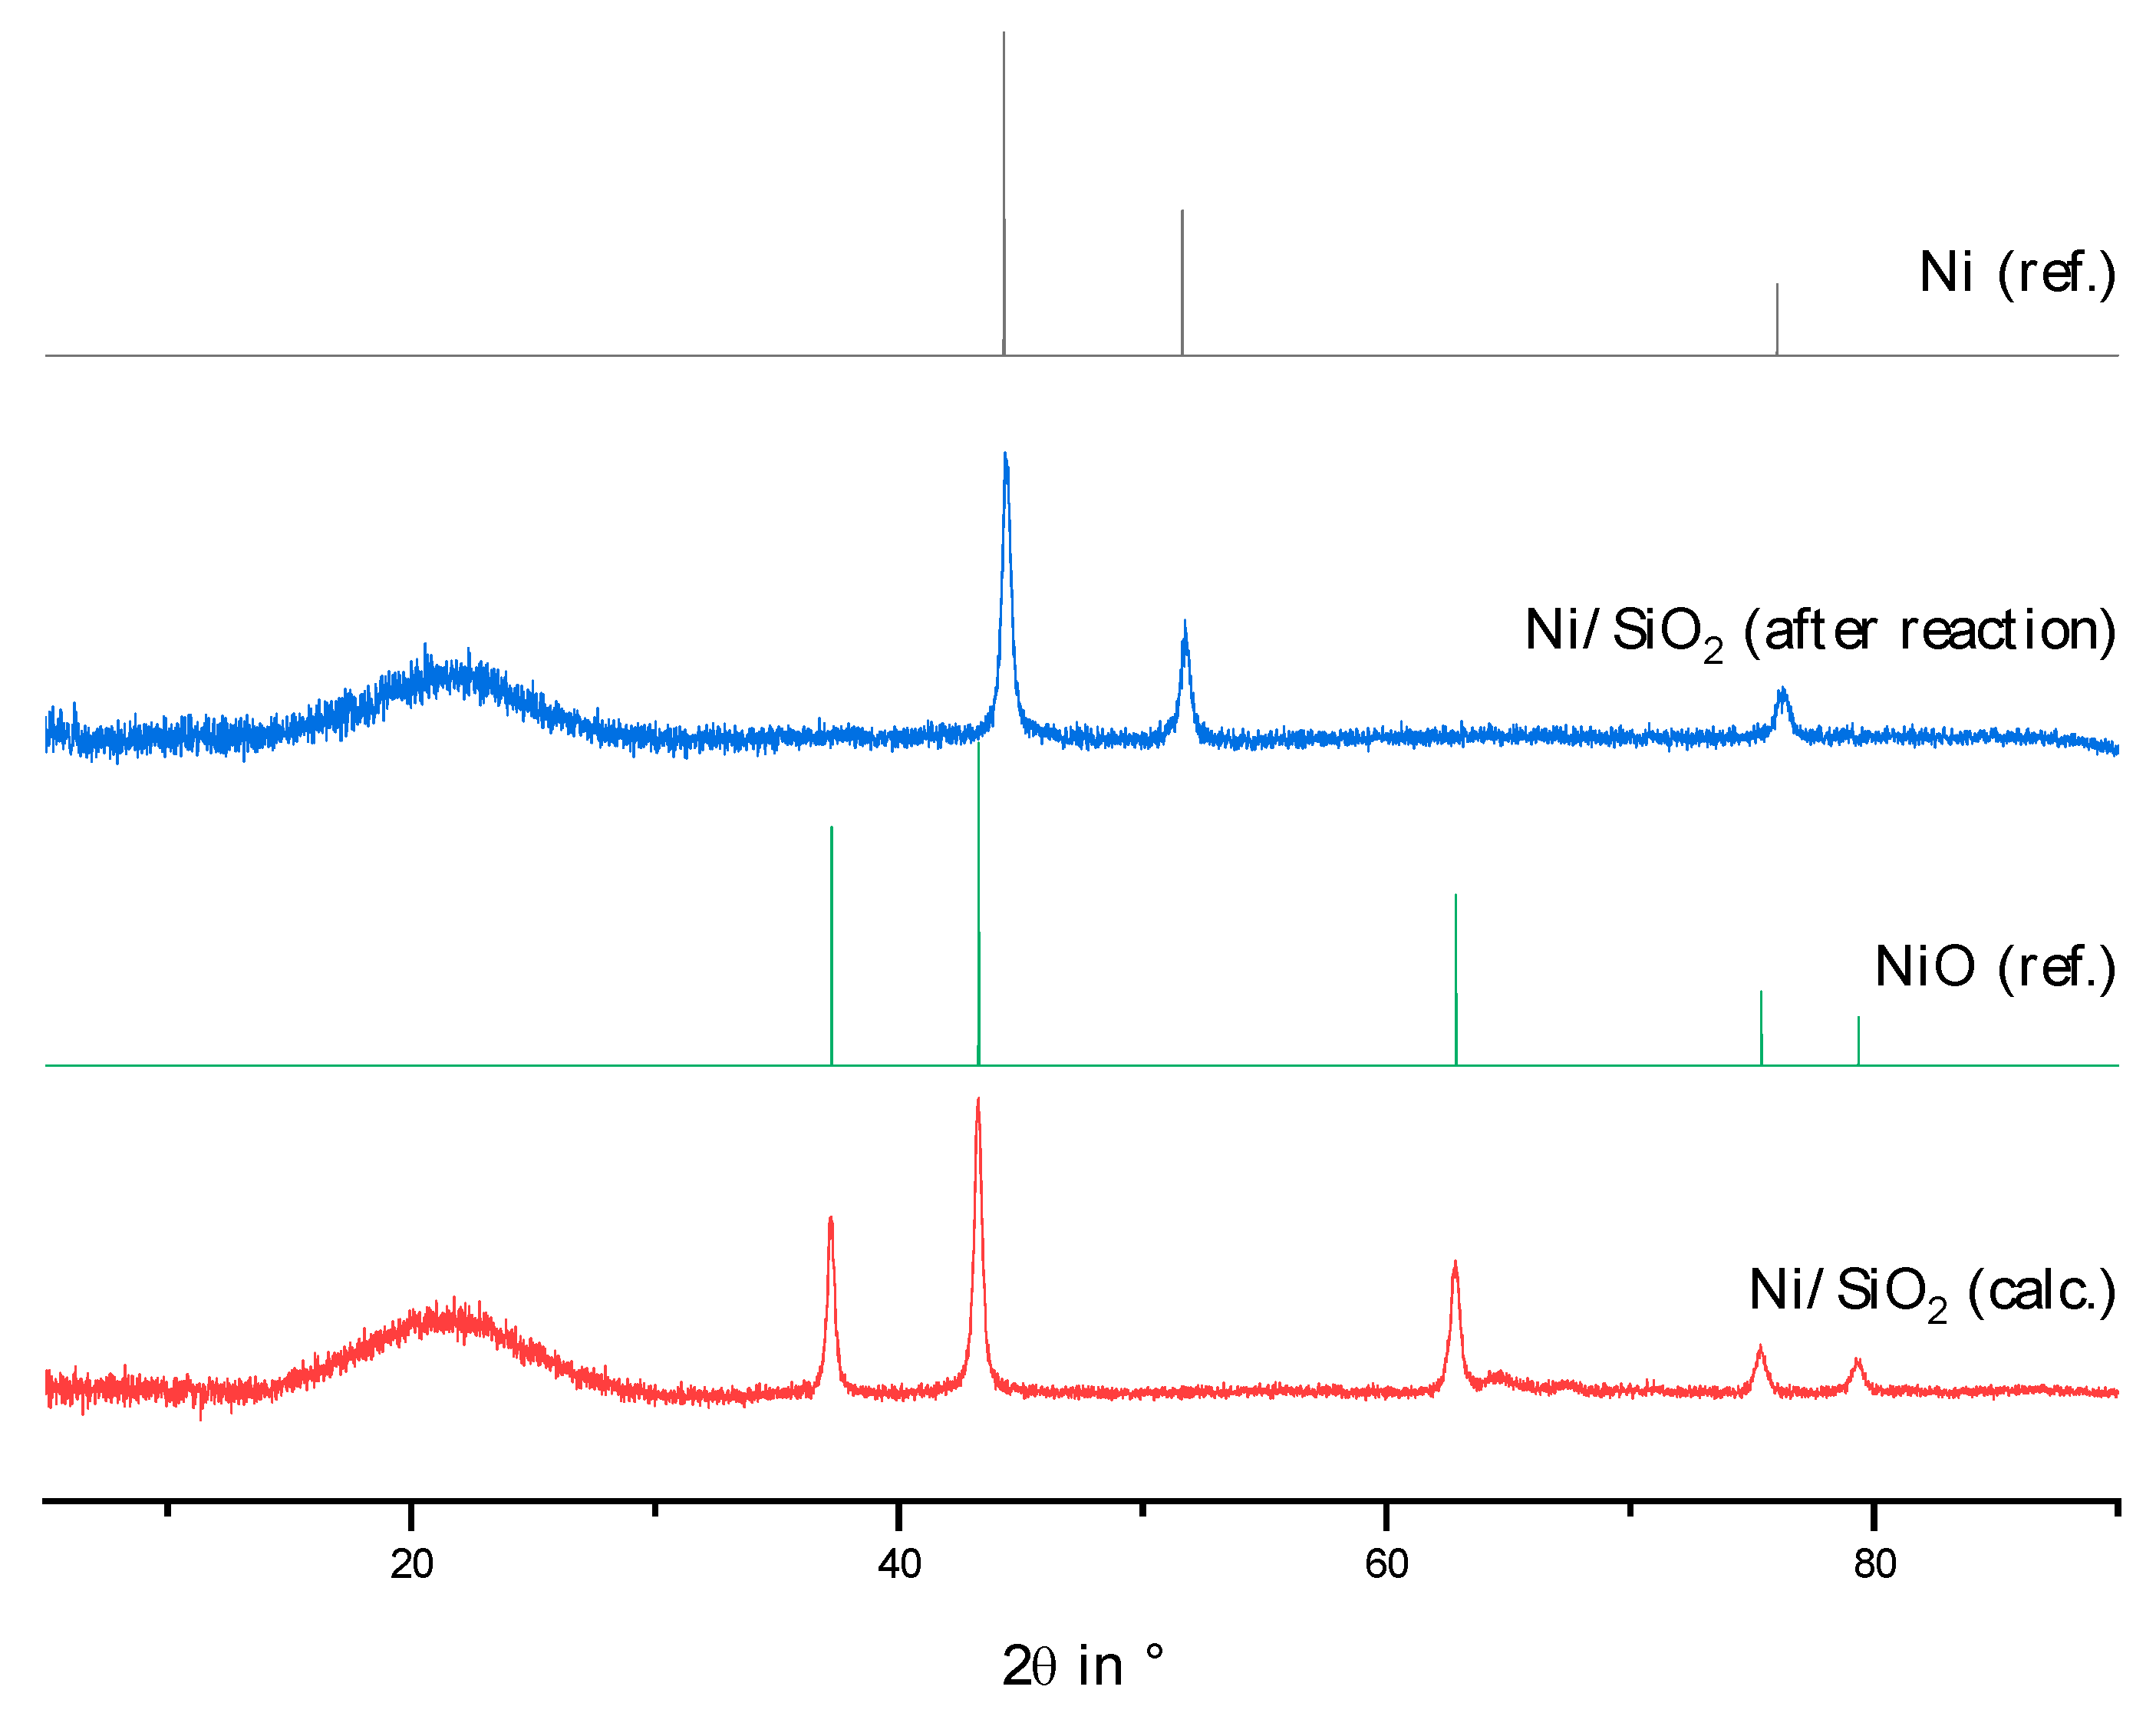
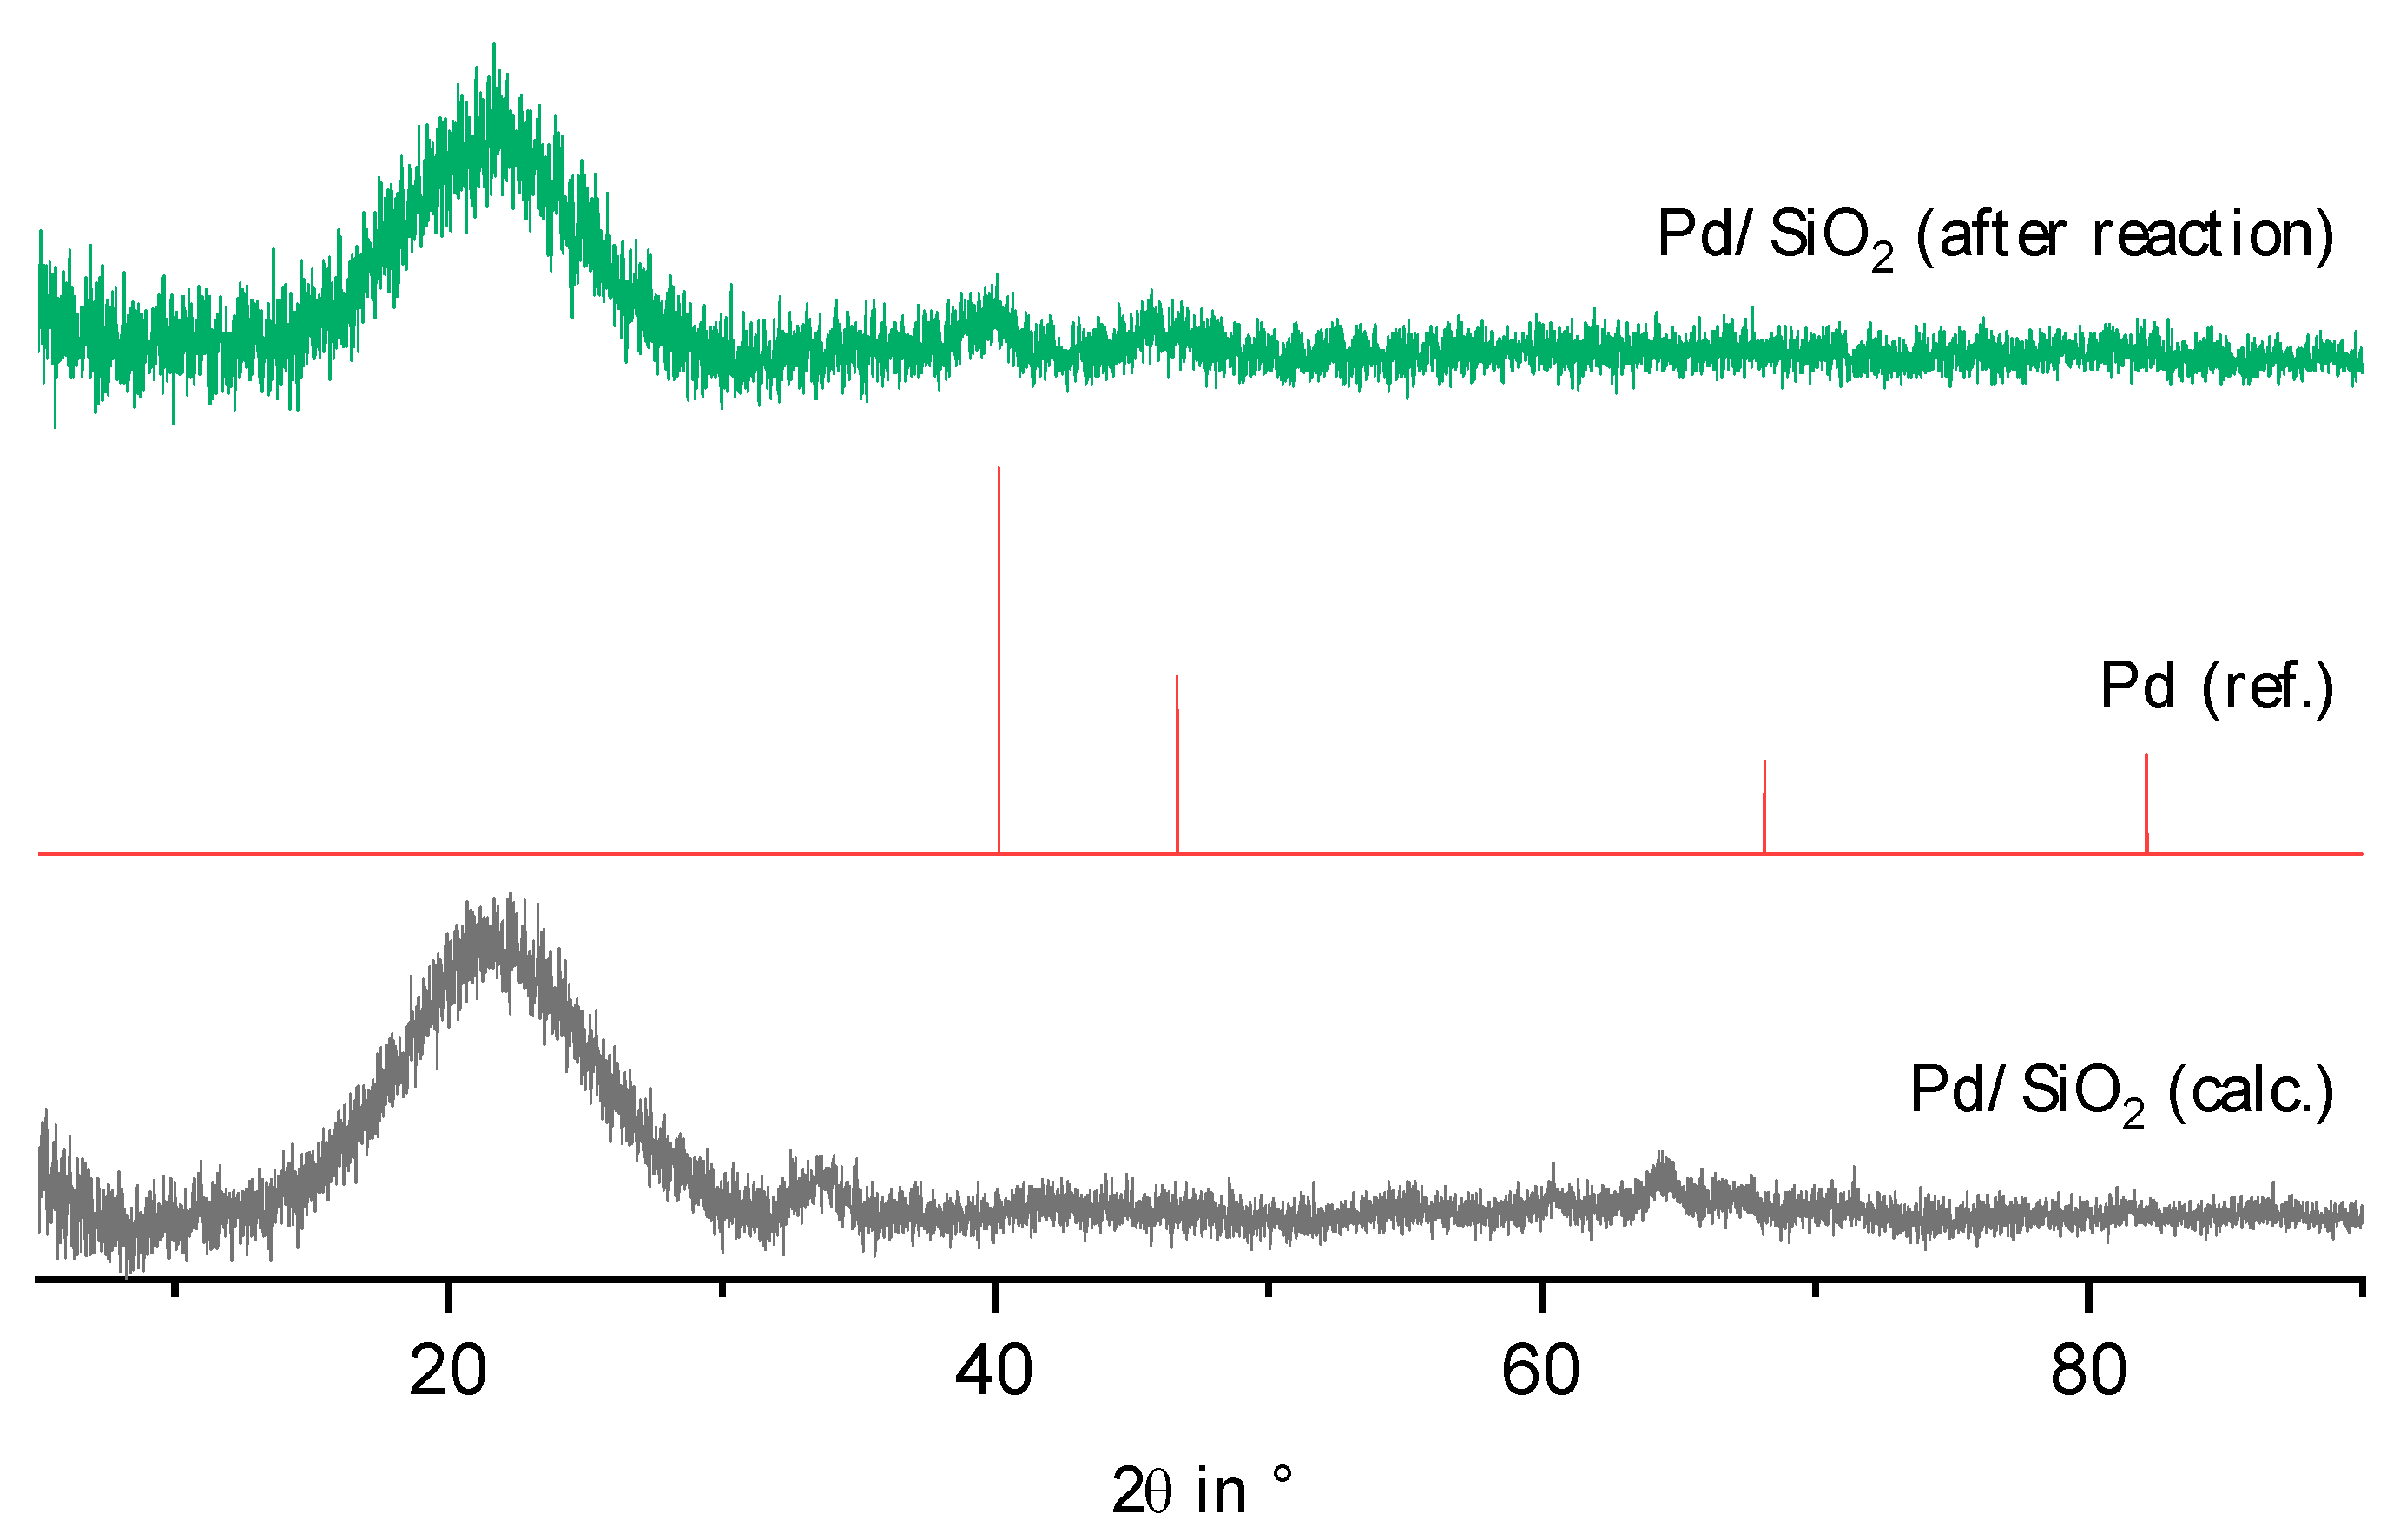
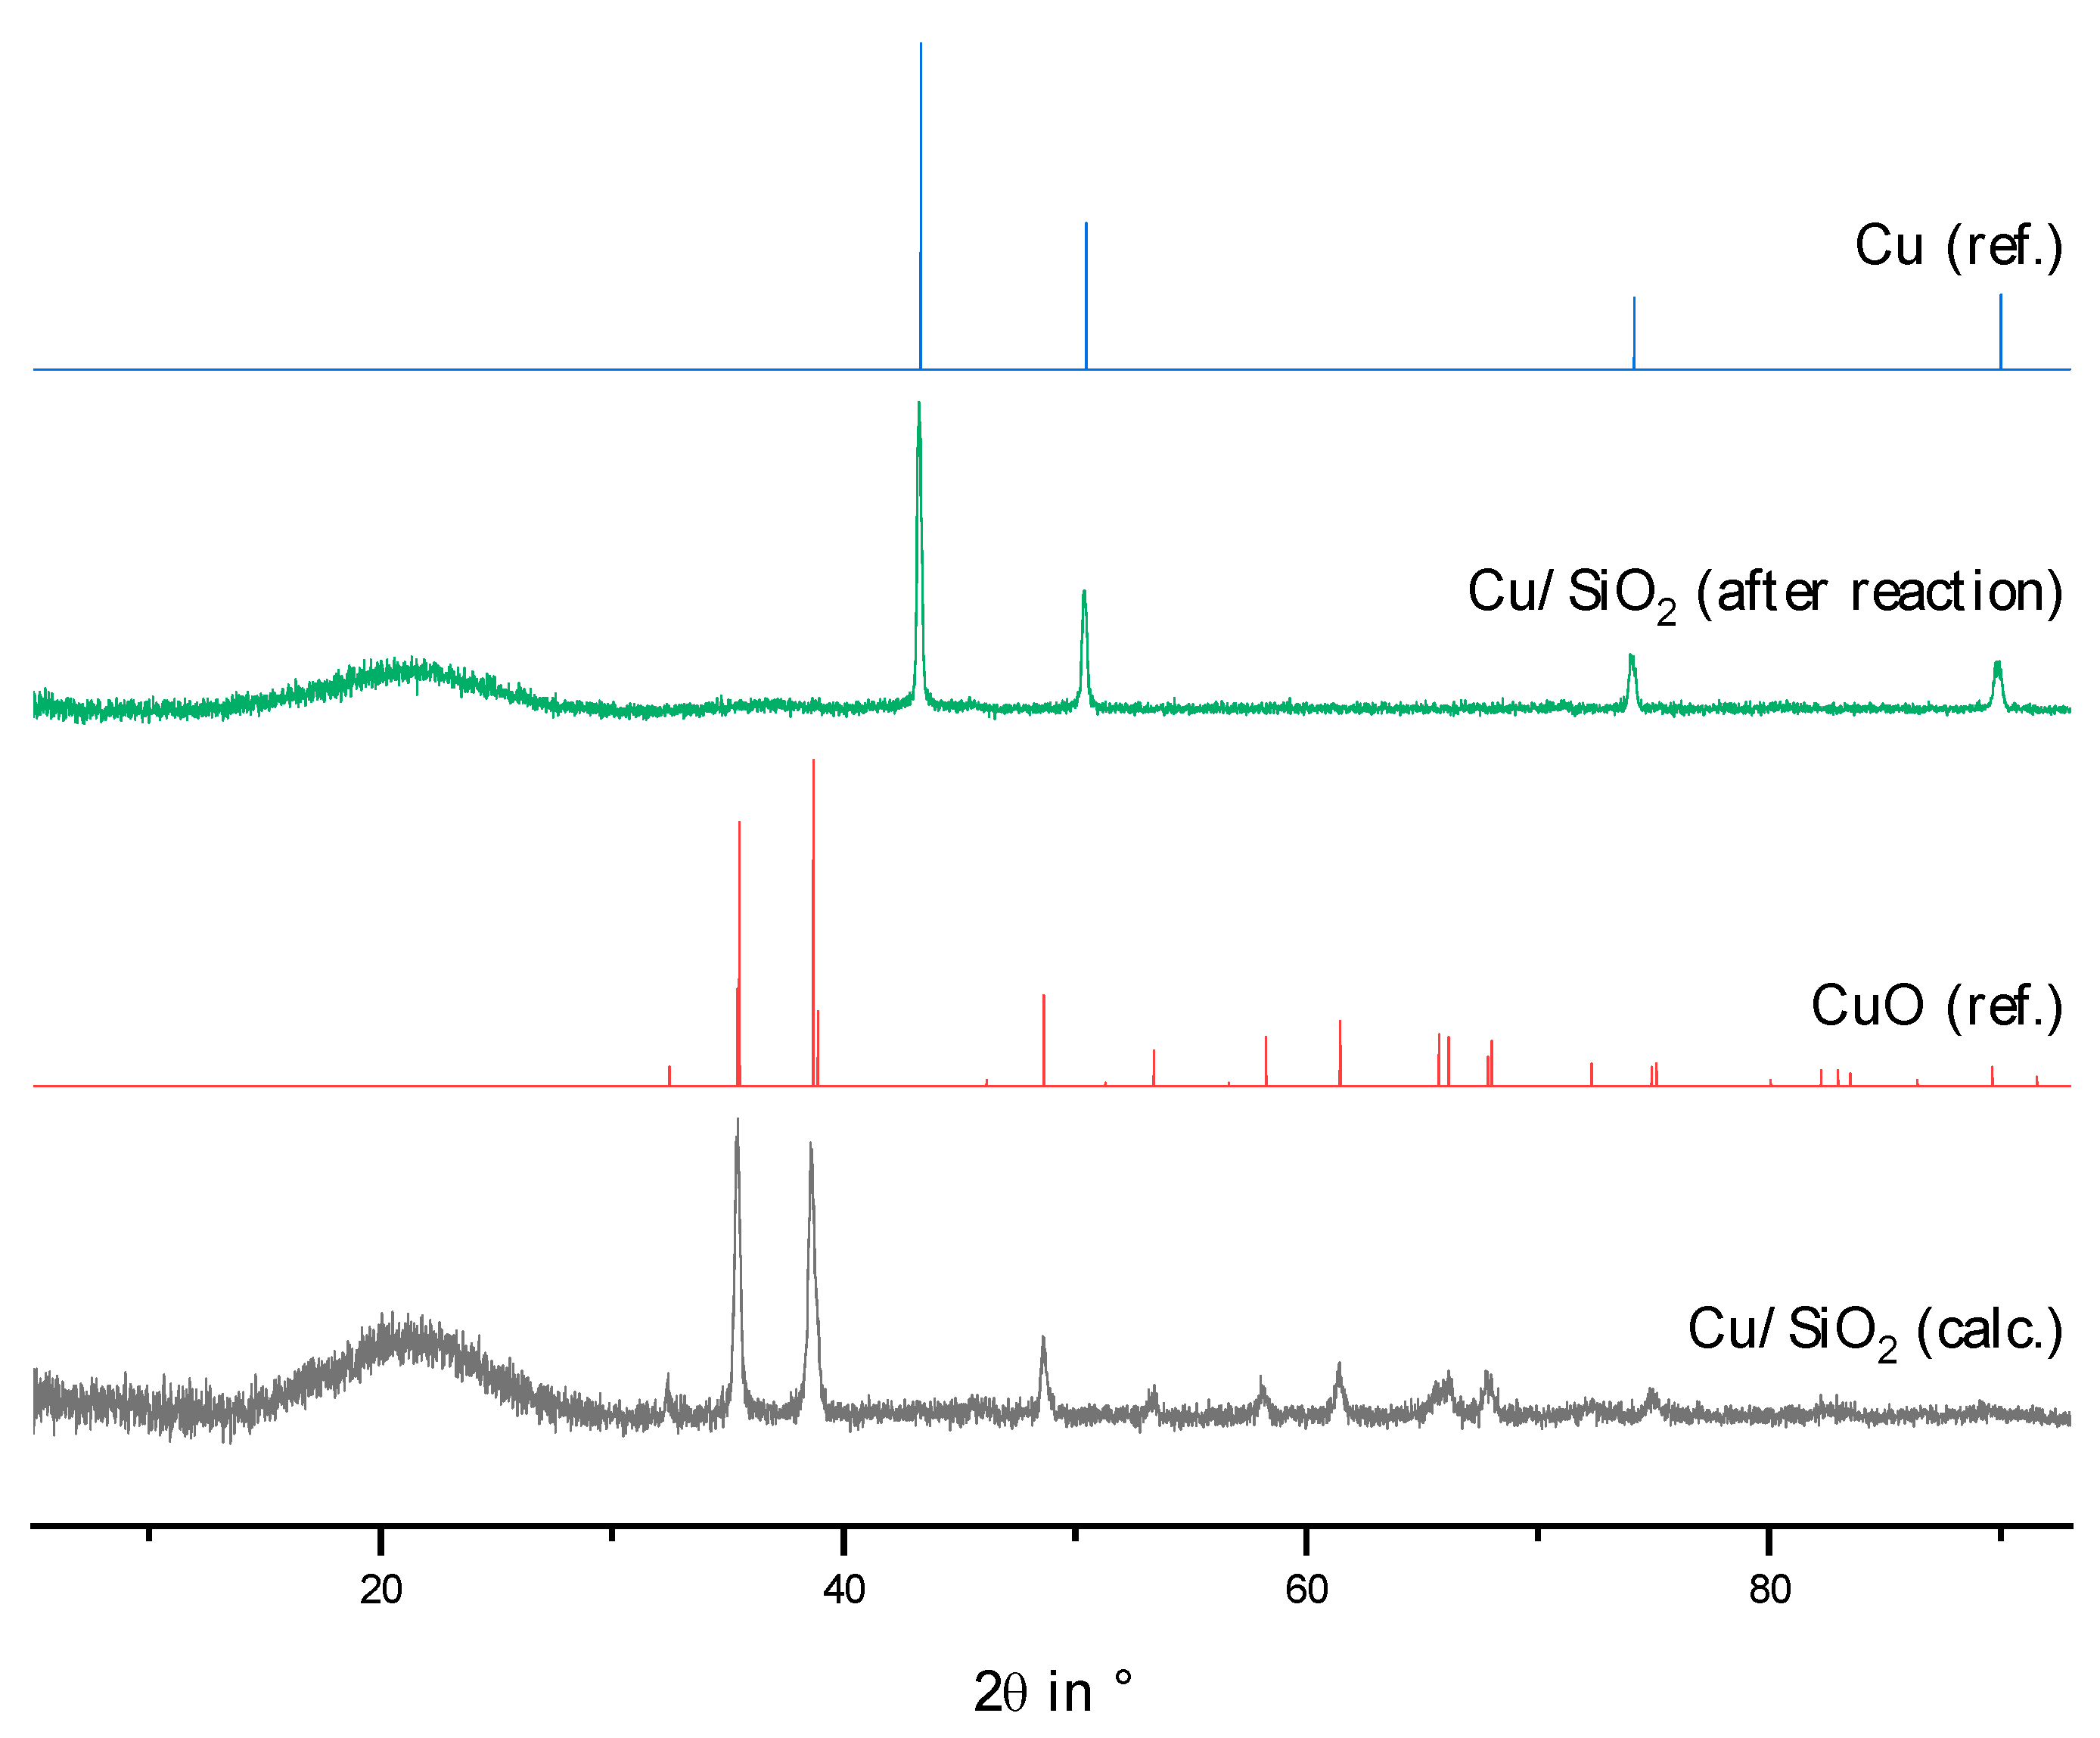
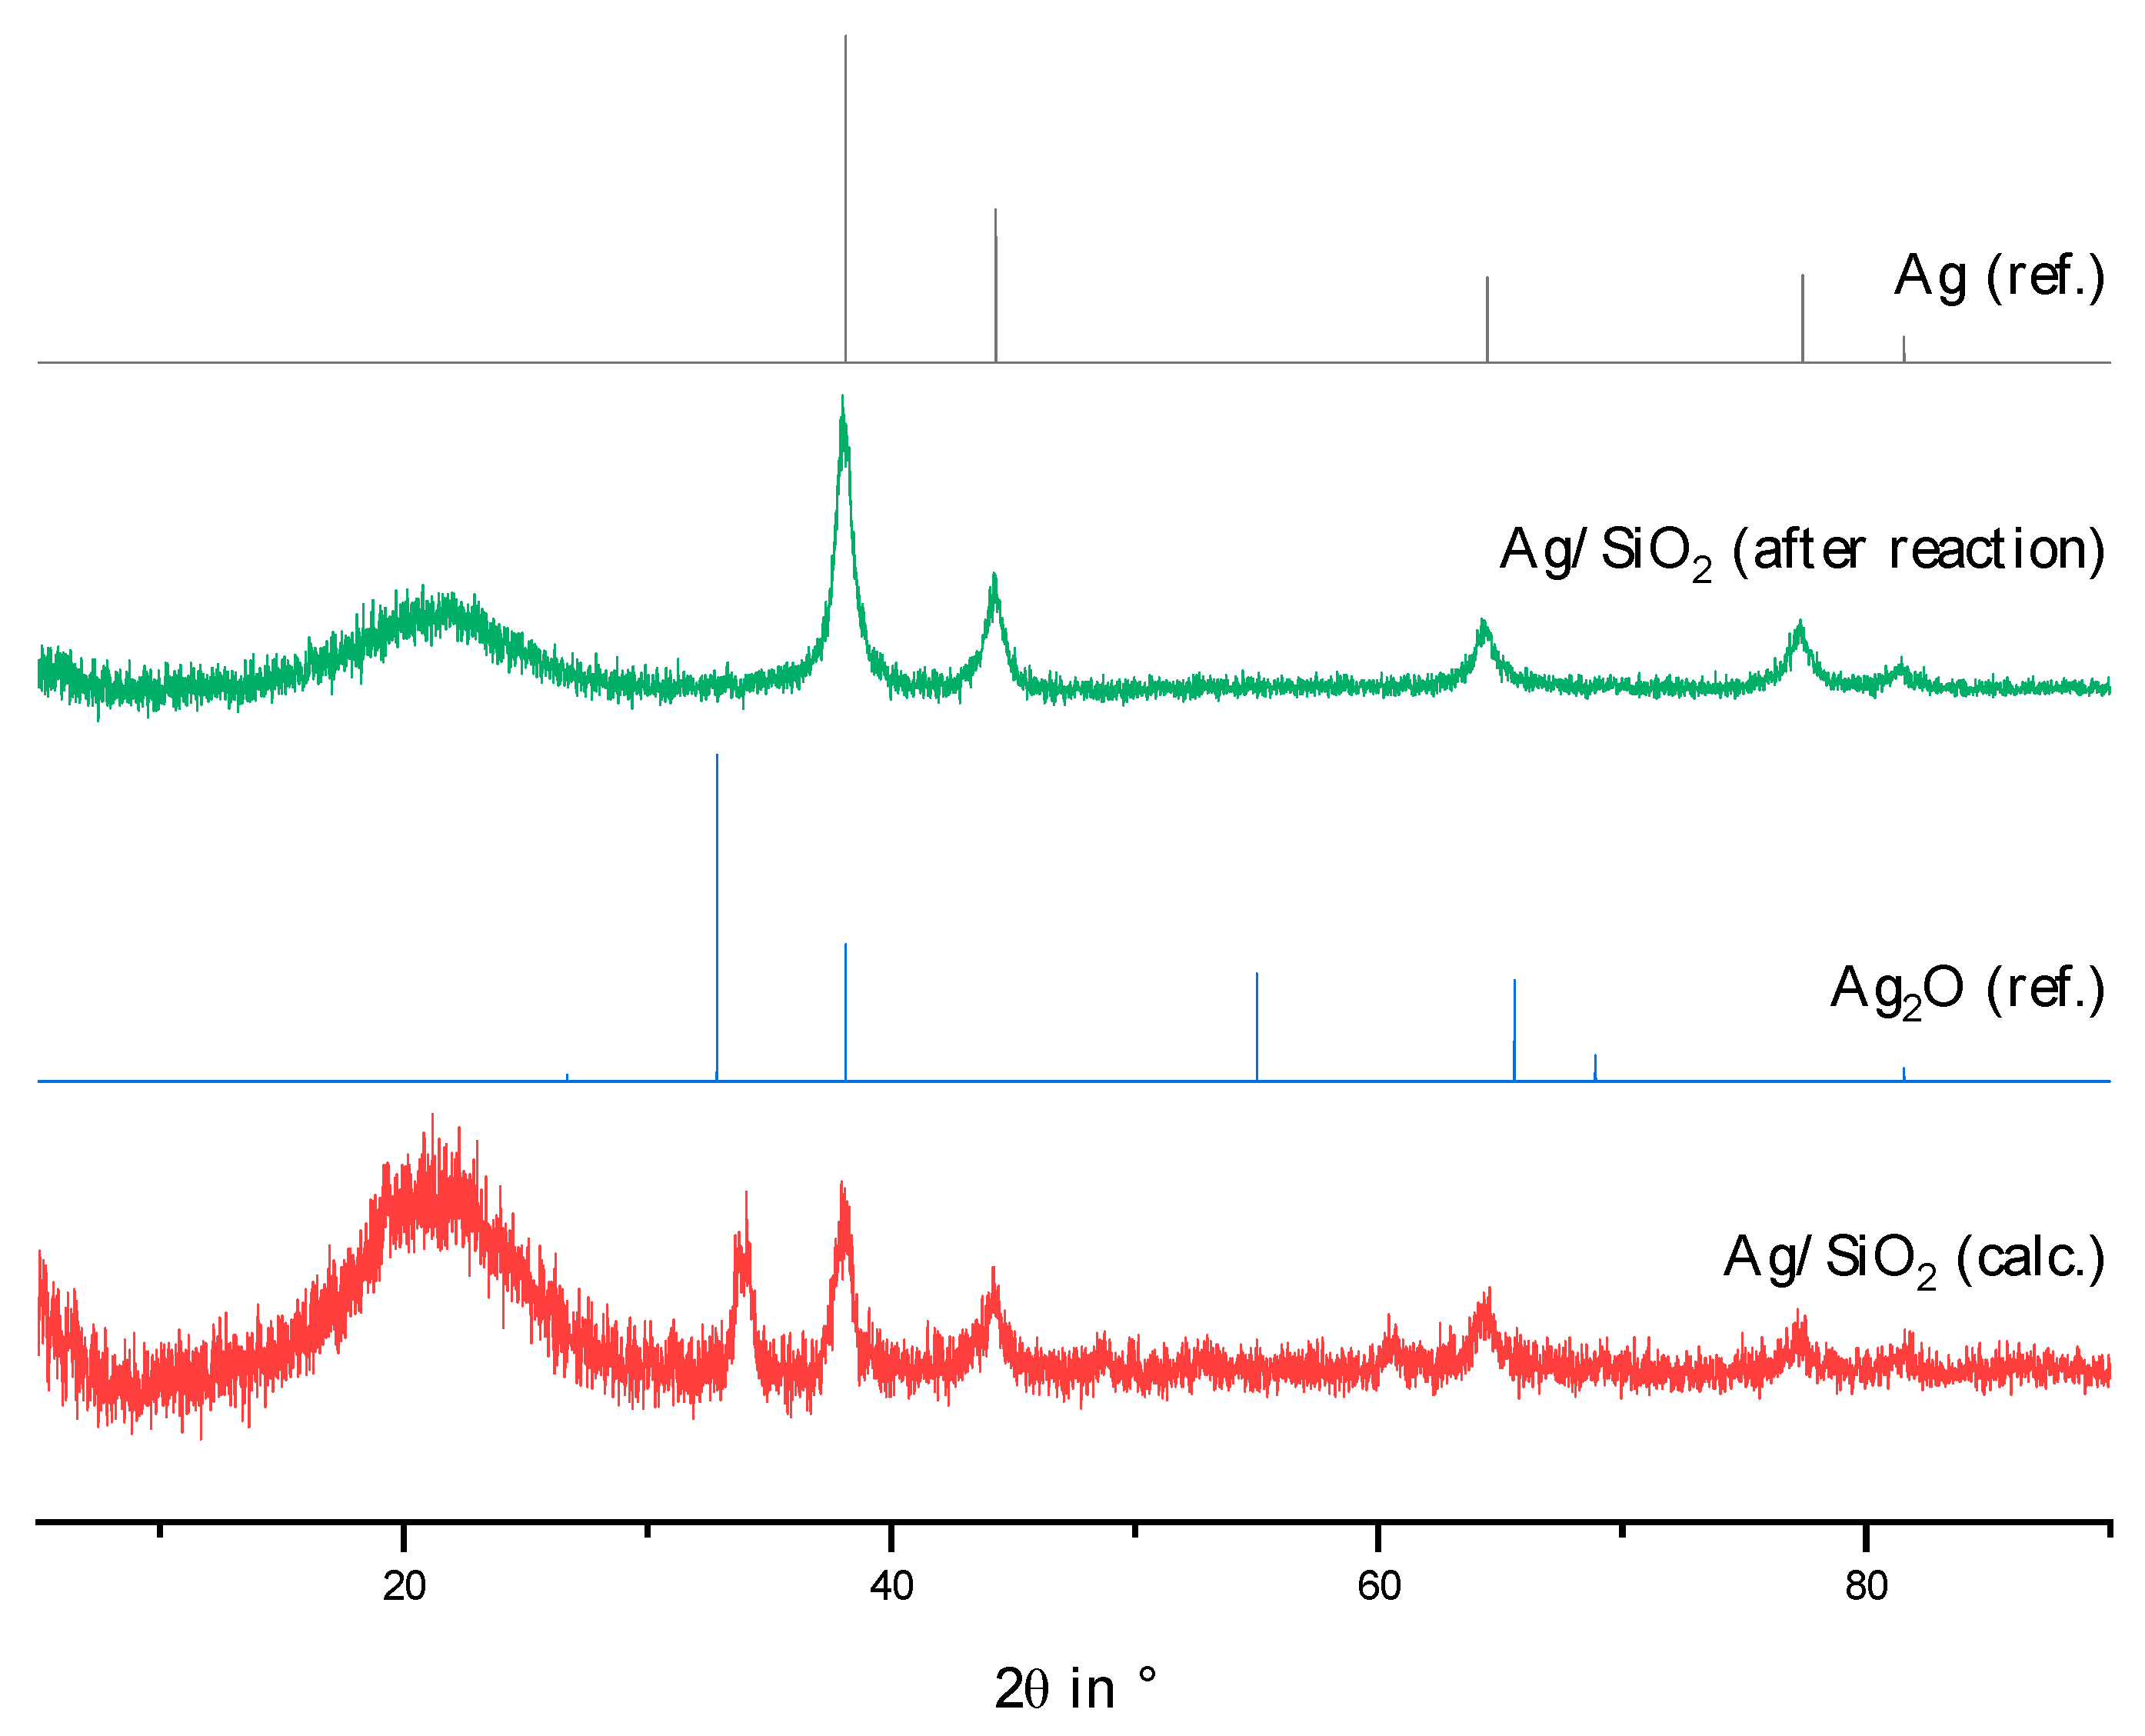
2.2. Physico-Chemical Characteristics of Different Transition Metal/Silica Catalyst Materials

With the exception of the palladium- and rhenium-silica material, all of the catalyst materials are prepared with a mass fraction of 10% of the metal, based on their reduced form, by impregnating Aerosil380. For the palladium and rhenium catalyst, a mass fraction of 1% was deviated from for economic reasons and the known high activity [29,51,52,53,54]. The physicochemical properties of all the materials are summarized in Table 1.
The adsorption and desorption curves of the nitrogen physisorption measurements of the loaded metal-supported catalysts are similar to those of the Aerosil380 support material (Figure 2). Therefore, they can be classified as Type IV(a) isotherms. The determined B.E.T. and B.J.H. surfaces are summarized in Table 1. Due to the metal content of 10% and 1% (Re, Pd), the specific surfaces of the metal catalysts are lower than those of the pure support material, Aerosil380, due to the dilution effect.
For the analysis of the metal phases, powder X-Ray diffractograms (P-XRD) of the calcined metal-silica systems were recorded before, i.e., in oxidized form, and after the reaction, i.e., in reduced form (see Appendix Figure A2, Figure A3, Figure A4, Figure A5, Figure A6, Figure A7, Figure A8, Figure A9 and Figure A10). Before reduction (calcination), the metals of the catalysts are present in the oxidized form, except for rhenium, which was further identified as ammonium perrhenate. During the pretreatment prior to the reaction, as well as during the reaction with guaiacol, the metals are reduced, as demonstrated by the P-XRD. For all the catalysts except the molybdenum and tungsten-silica material, a complete reduction is assumed after the catalytic test measurement based on the P-XRD measurements. Consistent with studies by Regalbuto et al. on molybdenum-silica systems (also Aerosil380), only partial reduction to molybdenum(IV) oxide (MoO2) was detected for the molybdenum-silica system using P-XRD (see Appendix Figure A2) [55,56]. For a complete reduction, 1100 °C would be required, which cannot be achieved due to the stainless steel reactor and the furnace inside the catalyst test unit. The same applies to the tungsten catalyst, for which a temperature of at least 800 °C is required for a complete reduction (see Appendix Figure A3) [57].
Due to the fluorescence by Cu-Kα radiation during the P-XRD measurements, which usually occurs in iron-containing samples, and the associated high background noise, the identification of iron in the reduced state is possible, but not of the metal oxide phase before reduction [58]. Based on the P-XRD and Mößbauer spectrometry measurements of the iron-silica materials known from the literature, it can be assumed that γ-Fe2O3 (maghemite) can be present, in addition to the most abundant naturally occurring modification, α-Fe2O3 (hematite) [59,60]. However, due to the maximum temperature of 550 °C used, it can be assumed that predominantly the body-centered cubic α-Fe2O3 is present and not the face-centered cubic γ-Fe2O3 formed above 910 °C [61].
Cobalt, in addition to the more stable α-cobalt modification (hexagonally densest sphere packing), can also exist as the β-cobalt modification (face-centered cubic) formed from 400 °C–450 °C [62]. Due to the reduction temperature of 550 °C during pretreatment, the β-modification is assumed for cobalt. Nickel can be considered to be in a face-centered cubic crystal structure [63]. Similarly, palladium, copper and silver crystallize are considered to be in a face-centered cubic crystal structure because they do not have any other stable modifications under the selected reaction conditions [62,63].
In addition to identifying the metal phase, it is possible to estimate the metal particle size using the Scherrer equation [64]. The calculations are based on the samples’ P-XRD results, according to TPROR up to 600 °C, and are summarized in Table 1. The palladium-silica system has the smallest metal crystallite size, which was also confirmed by hydrogen pulse chemisorption (DPd = 38.6%; i.e., particle diameter = 2 nm). The nickel crystallite size was also checked and approved by hydrogen pulse chemisorption (DNi = 1.7%; i.e., particle diameter = 47 nm). Due to the strong background signal from the fluorescence of the iron-silica material and the incomplete reduction in the tungsten-silica system, no metal crystallite size was calculated.
To imitate the conditions during pretreatment in the catalyst test unit, a temperature-programmed reduction, oxidation and renewed reduction up to a temperature of 600 °C was recorded for all the catalyst materials used. Table 1 illustrates the amounts of hydrogen consumed per gram of catalyst and the amounts of material theoretically required for complete reduction. This showed a signal for the molybdenum-silica catalyst material with a maximum at 500 °C, which can be attributed to the formation of molybdenum(VI) oxide (MoO2) [56]. A second reduction stage to fully reduced molybdenum could not be observed (see Figure 6a). For the tungsten catalyst, no complete reduction is observed up to 600 °C (see Figure 6b). For this reason, another TPROR measurement was performed up to 900 °C (see Figure 6c), which, starting at 550 °C, shows two broad signal maxima at 725 °C and 840 °C. These results confirm the hypothesis made in the P-XRD phase analysis that only partial reduction in the tungsten-silica material occurs under the pretreatment or reaction conditions.
Based on the TPROR measurement of the rhenium system, it can be shown, consistent with the literature, that the ammonium perrhenate (NH4ReO4) used is reduced to rhenium in one reduction step at about 350 °C (see Figure 6d) [65]. For the iron-silica material, a broad signal with a maximum at about 400 °C can be observed (see Figure 6e). This is probably a superposition of several reduction steps leading to a broad signal with Fe2+ as an intermediate [66]. However, based on comparing the consumed hydrogen with the theoretically required amount, it can be assumed that the reduction did not occur completely (see Table 1). However, in an additional TPROR up to 900 °C, the same amount of hydrogen per g of catalyst was consumed (see Figure 6f).
The cobalt-silica catalyst’s temperature-programmed reduction (TPR) shows two reduction maxima that merge into each other (see Figure 7a). The first maximum is at about 290 °C and is attributable to the reduction of cobalt(II, III) oxide (Co3O4) to cobalt(II) oxide (CoO) [67]. The complete reduction causes the second signal to cobalt(0), with a maximum at about 330 °C [67]. Temperature-programmed oxidation (TPO) also shows two signals, which can be analogously assigned to oxidation to cobalt(II) oxide (CoO, first signal) and the subsequent oxidation to cobalt(II, III) oxide (Co3O4, second signal) [68].
Due to palladium’s high standard potential, the palladium oxide reduction to palladium already occurs at low temperatures. For this reason, in addition to the TPROR measurement with a temperature profile between 40 °C and 600 °C (see Figure 8a), a low-temperature TPR measurement starting at −70 °C was performed for palladium (see Figure 8b), in which a positive signal for the reduction becomes visible at about 10 °C. Furthermore, a negative signal is observed at about 90 °C, which originates from the desorption of hydrogen adsorbed on the catalyst. Due to the low palladium content of 1% of the palladium-silica material and the lower sensitivity of the TPO compared to the TPR due to the smaller difference in thermal conductivities of helium and oxygen (ΔT=300K = 129.2 mWm−1K−1) compared to argon and hydrogen (ΔT=300K = 168.9 mWm−1K−1), only a shallow signal at about 300 °C can be detected in the TPO with the usual temperature profile between 40 °C and 600 °C [69]. This is attributable to the oxidation of palladium to palladium(II) oxide (PdO) [62].
The TPR of the copper-silica catalyst system shows two superimposed signals, which can be assigned to the reduction of copper(II) oxide (CuO) to copper(I) oxide (Cu2O) and the subsequent reduction to elemental copper (Cu). The signals can also be seen in the TPO (see Figure 9a). For the thermally induced back reaction of copper(II) oxide (CuO) to copper(I) oxide (Cu2O) with oxygen splitting, higher temperatures from 800 °C are necessary [63]. A similar thermal decomposition of silver(I) oxide (Ag2O) to elemental silver (Ag) and oxygen (O2) already takes place from 230 °C. Therefore, no signal could be detected in the TPR as the silver oxide formed in the TPO already decomposes again during the TPO measurement. (see Figure 9b) [63].
A deeper look into the ammonia desorption results (TPD, see Figure 10) reveals low to no acidity after reduction by TPROR experiments compared to conventional acidic solid catalyst materials, such as zeolite ZSM-5 (by Clariant, HCZP27, Si/Al = 11). Only the iron, molybdenum and nickel catalysts show small ammonia desorption signals, which are more in the range of weakly bound ammonia.

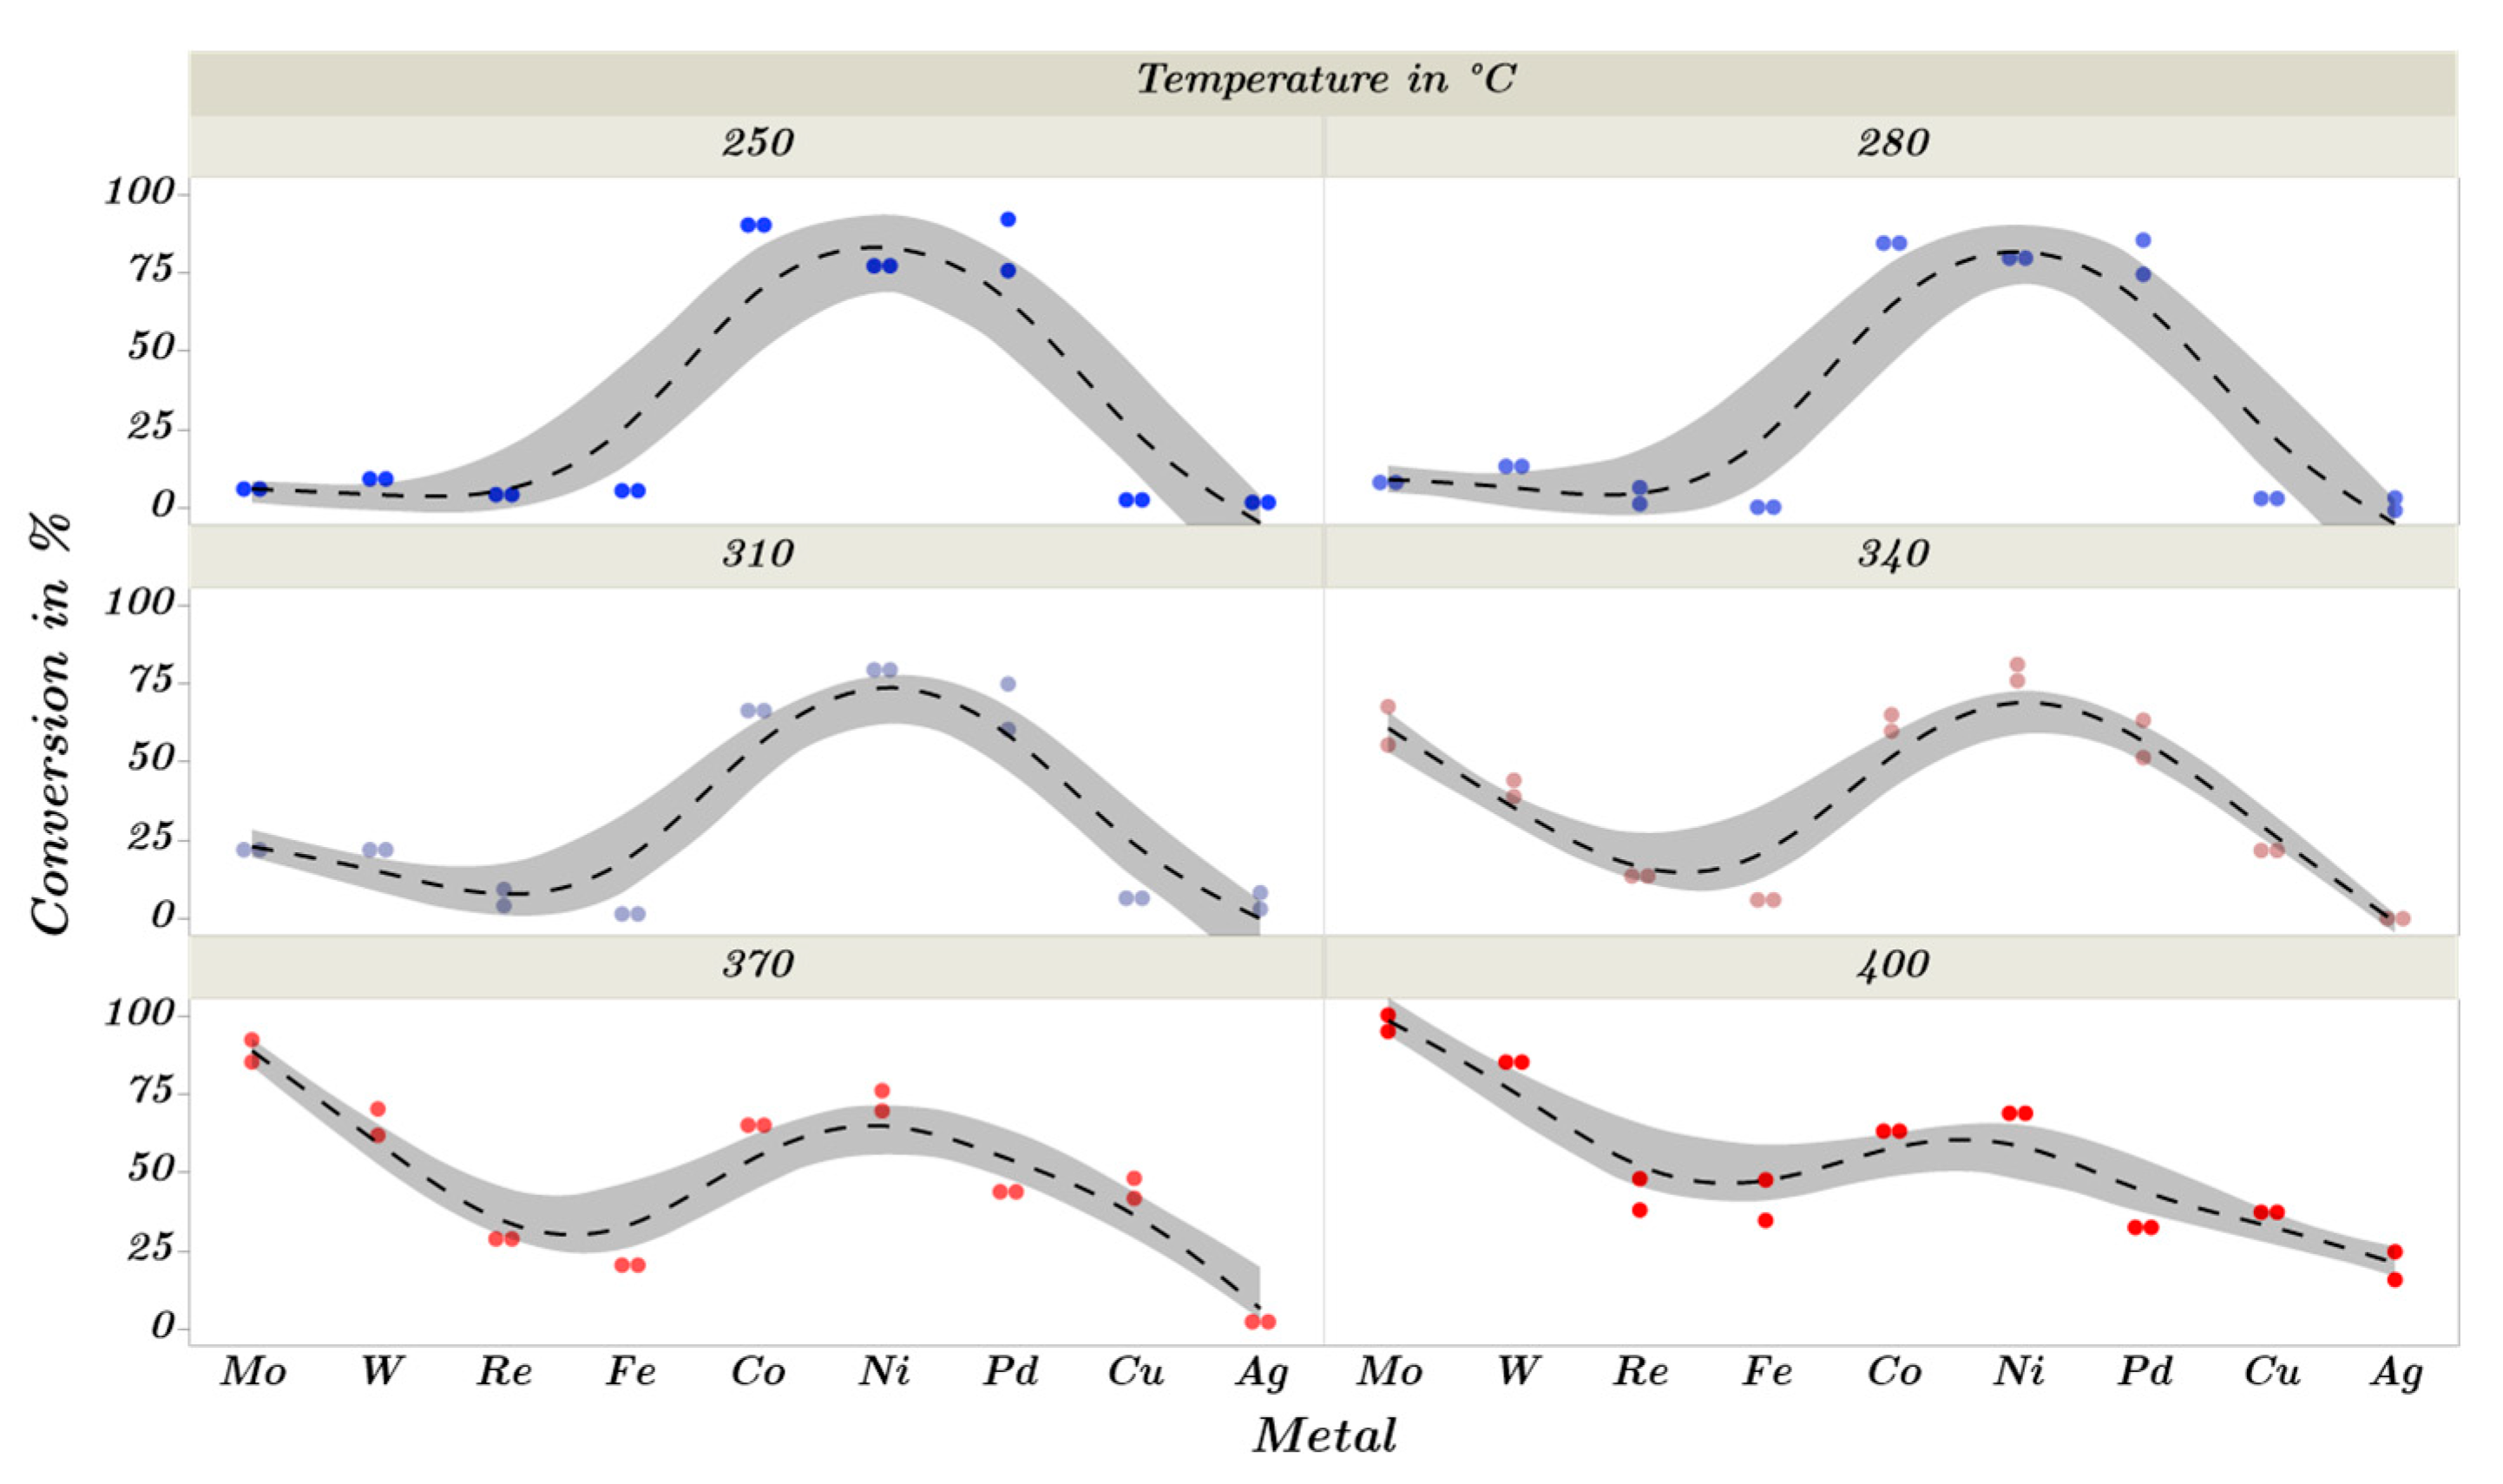
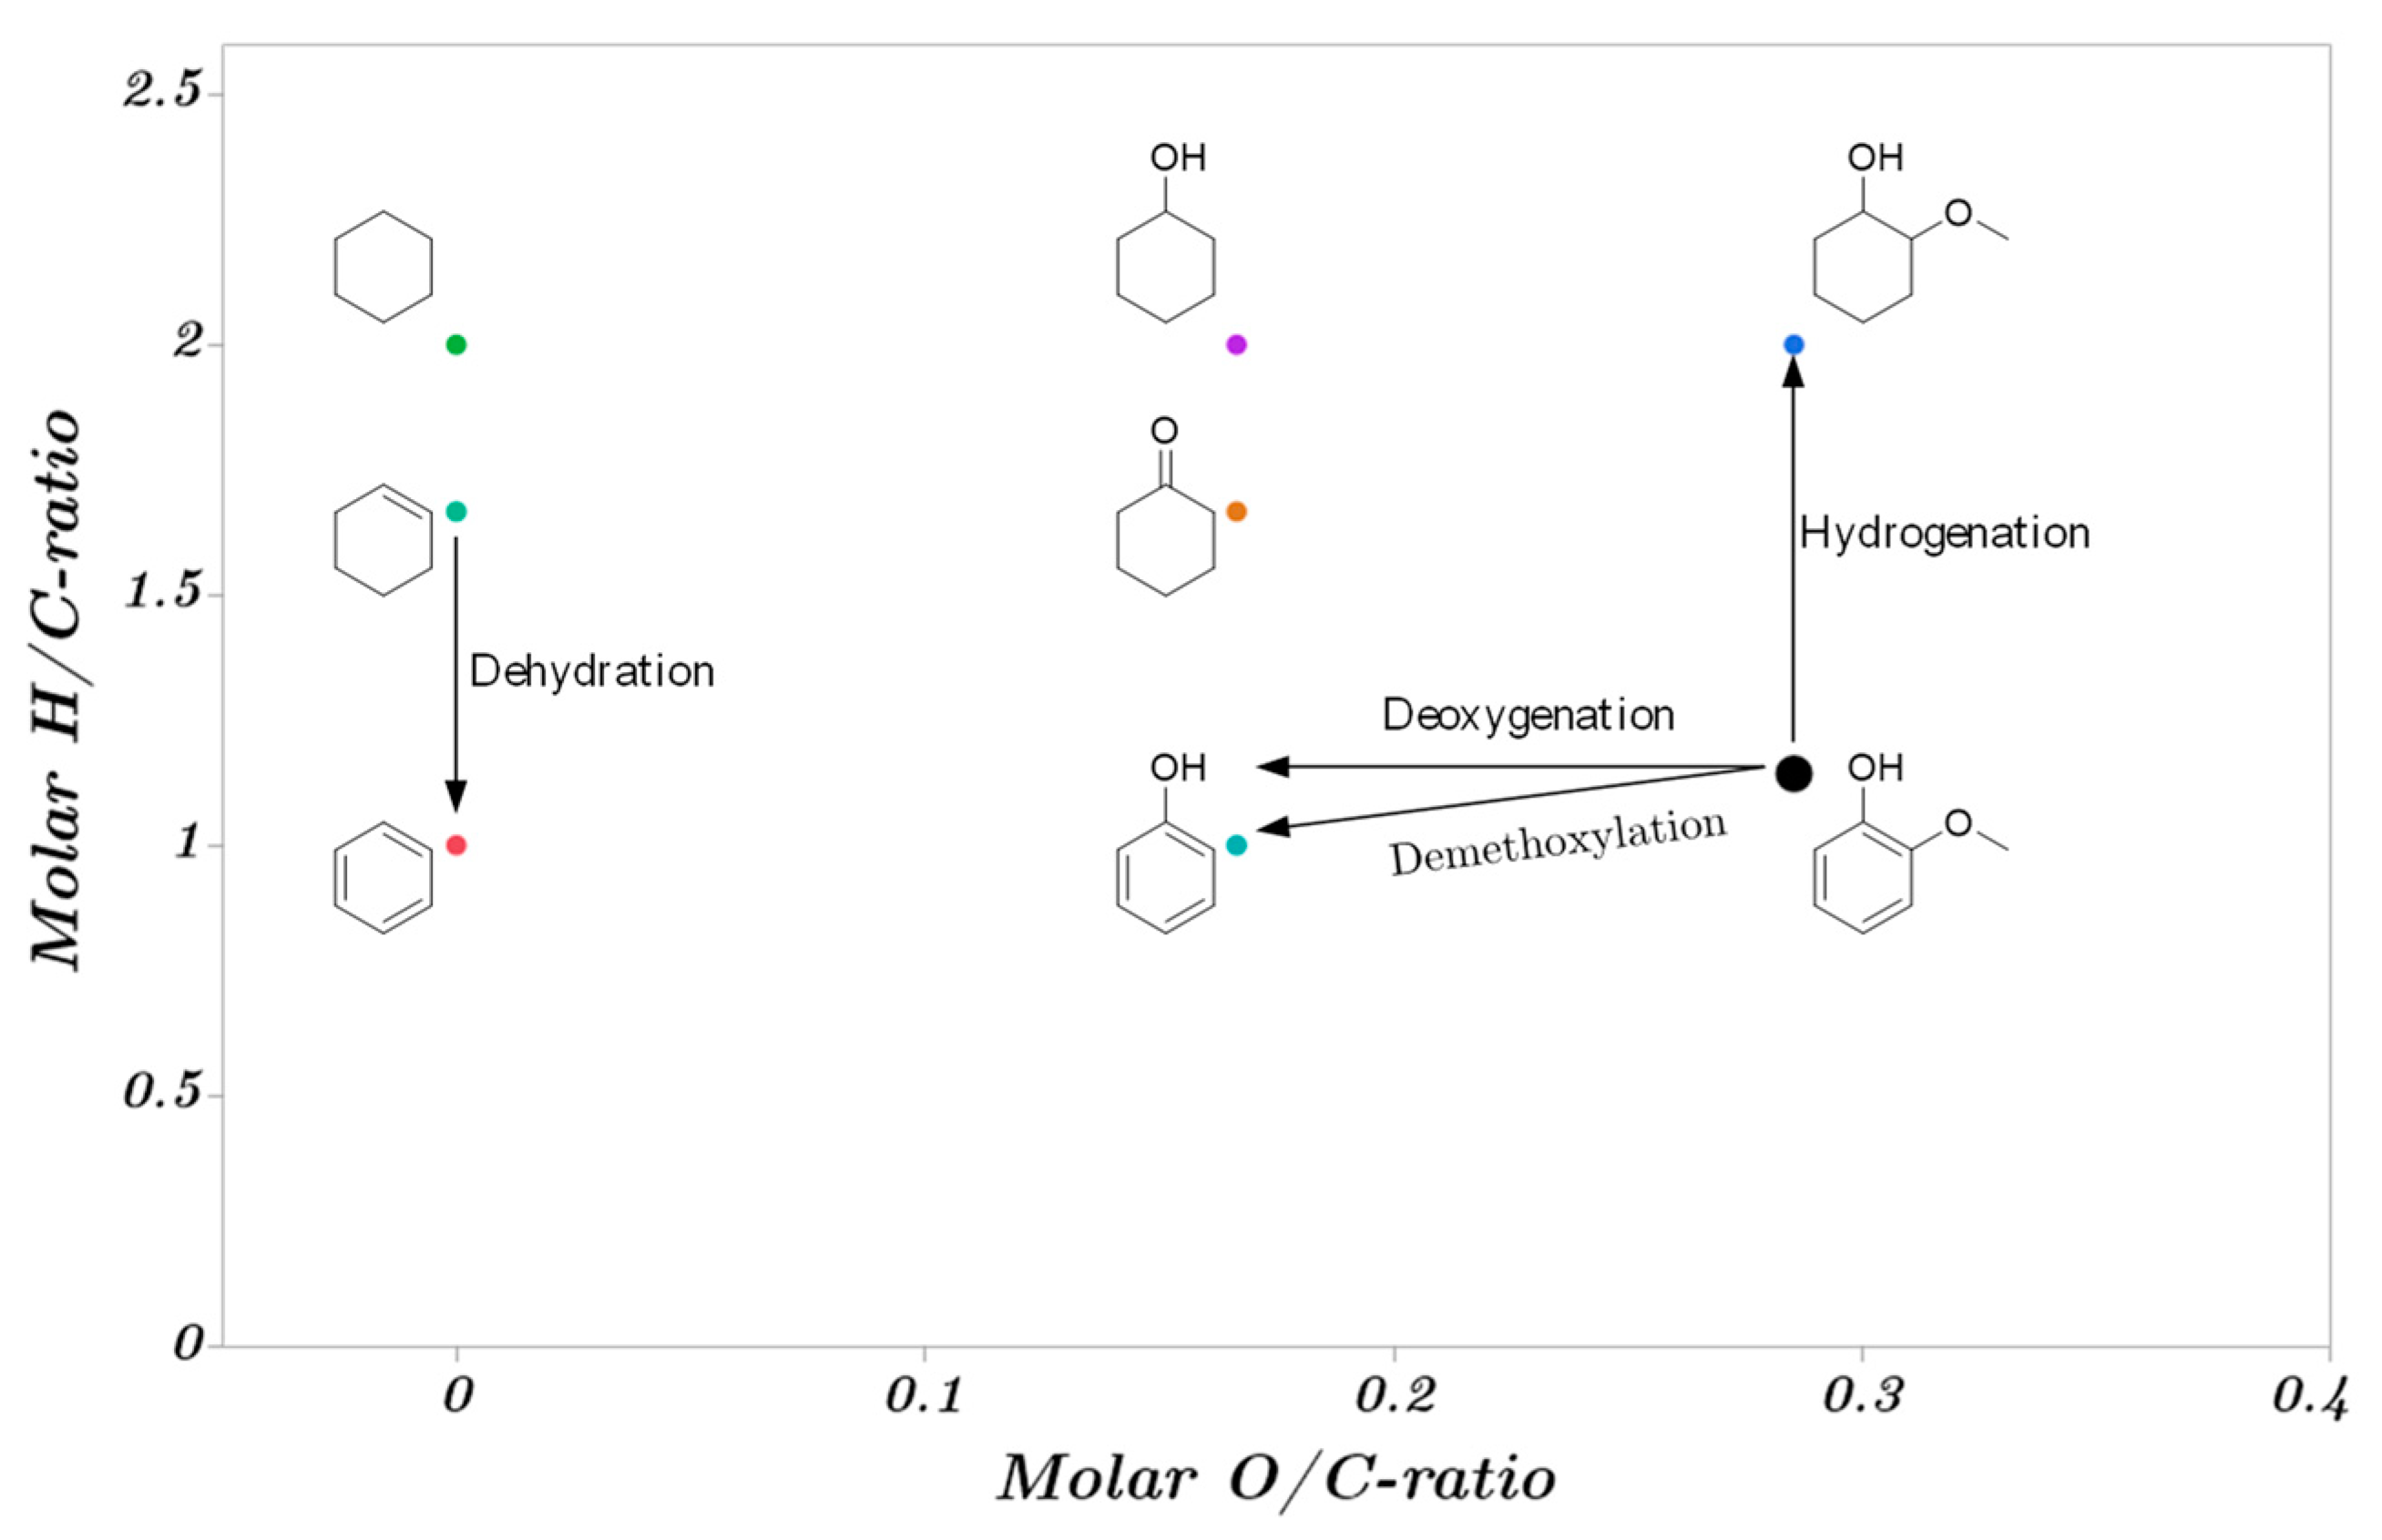
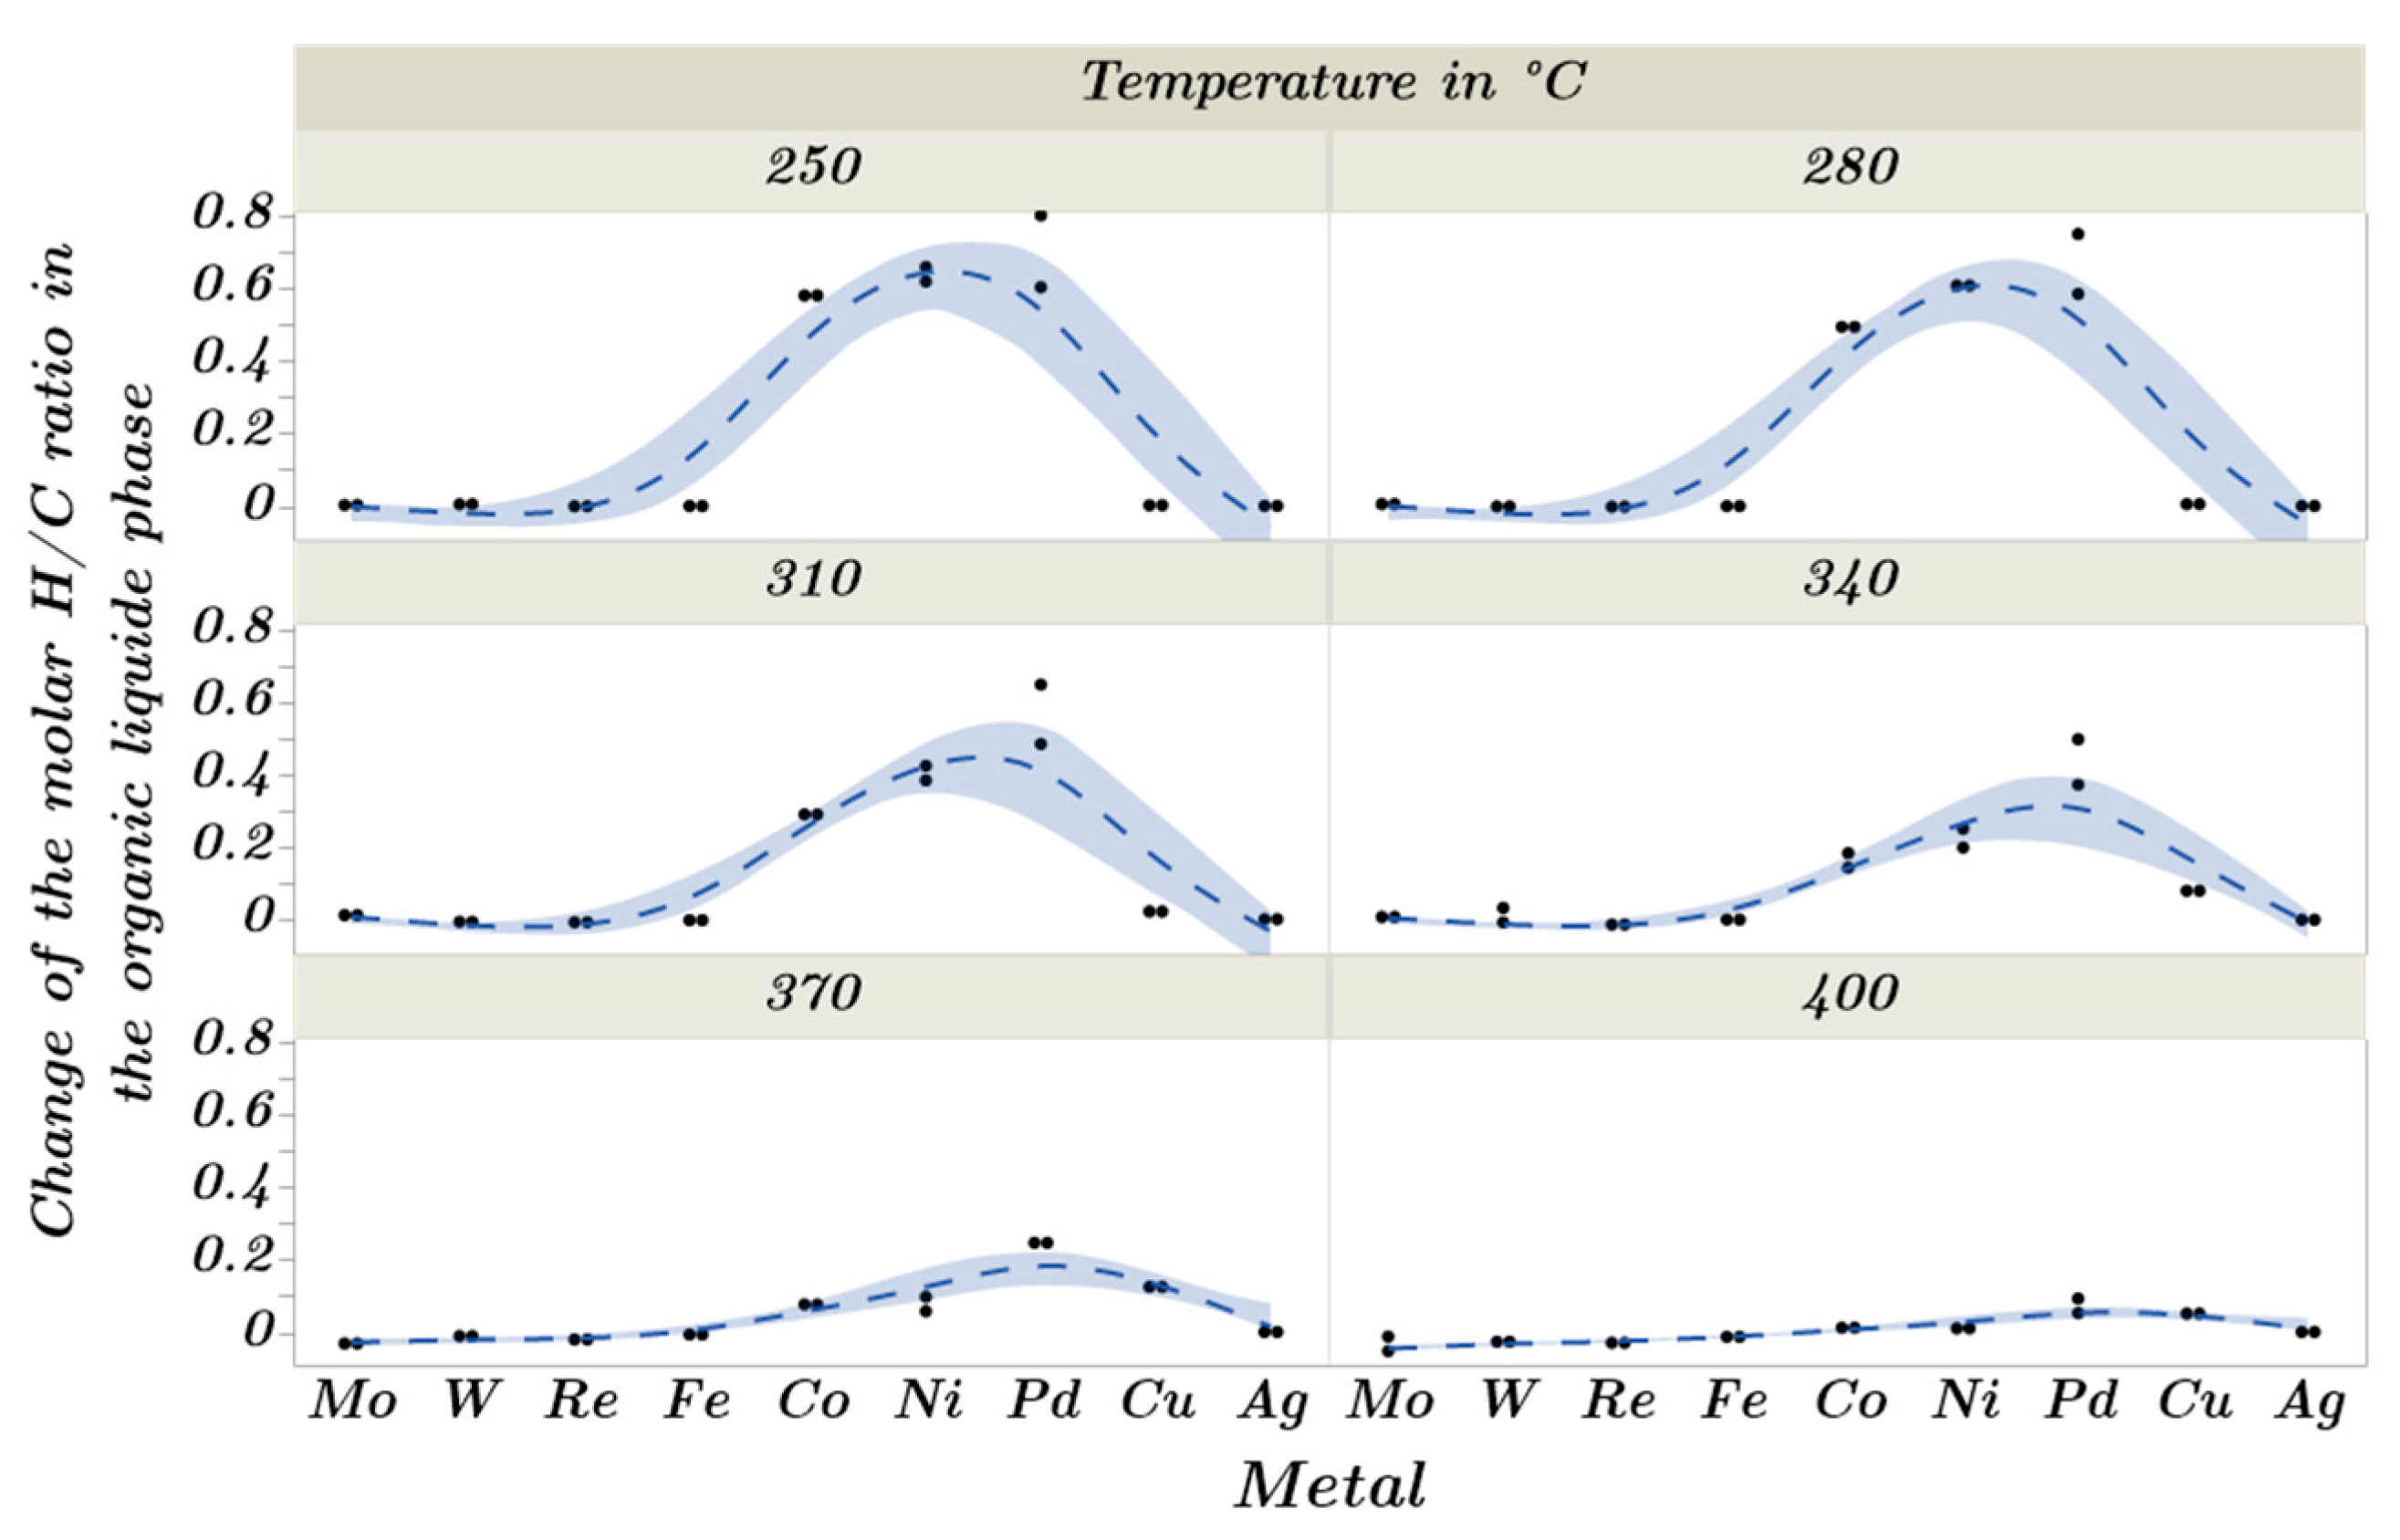
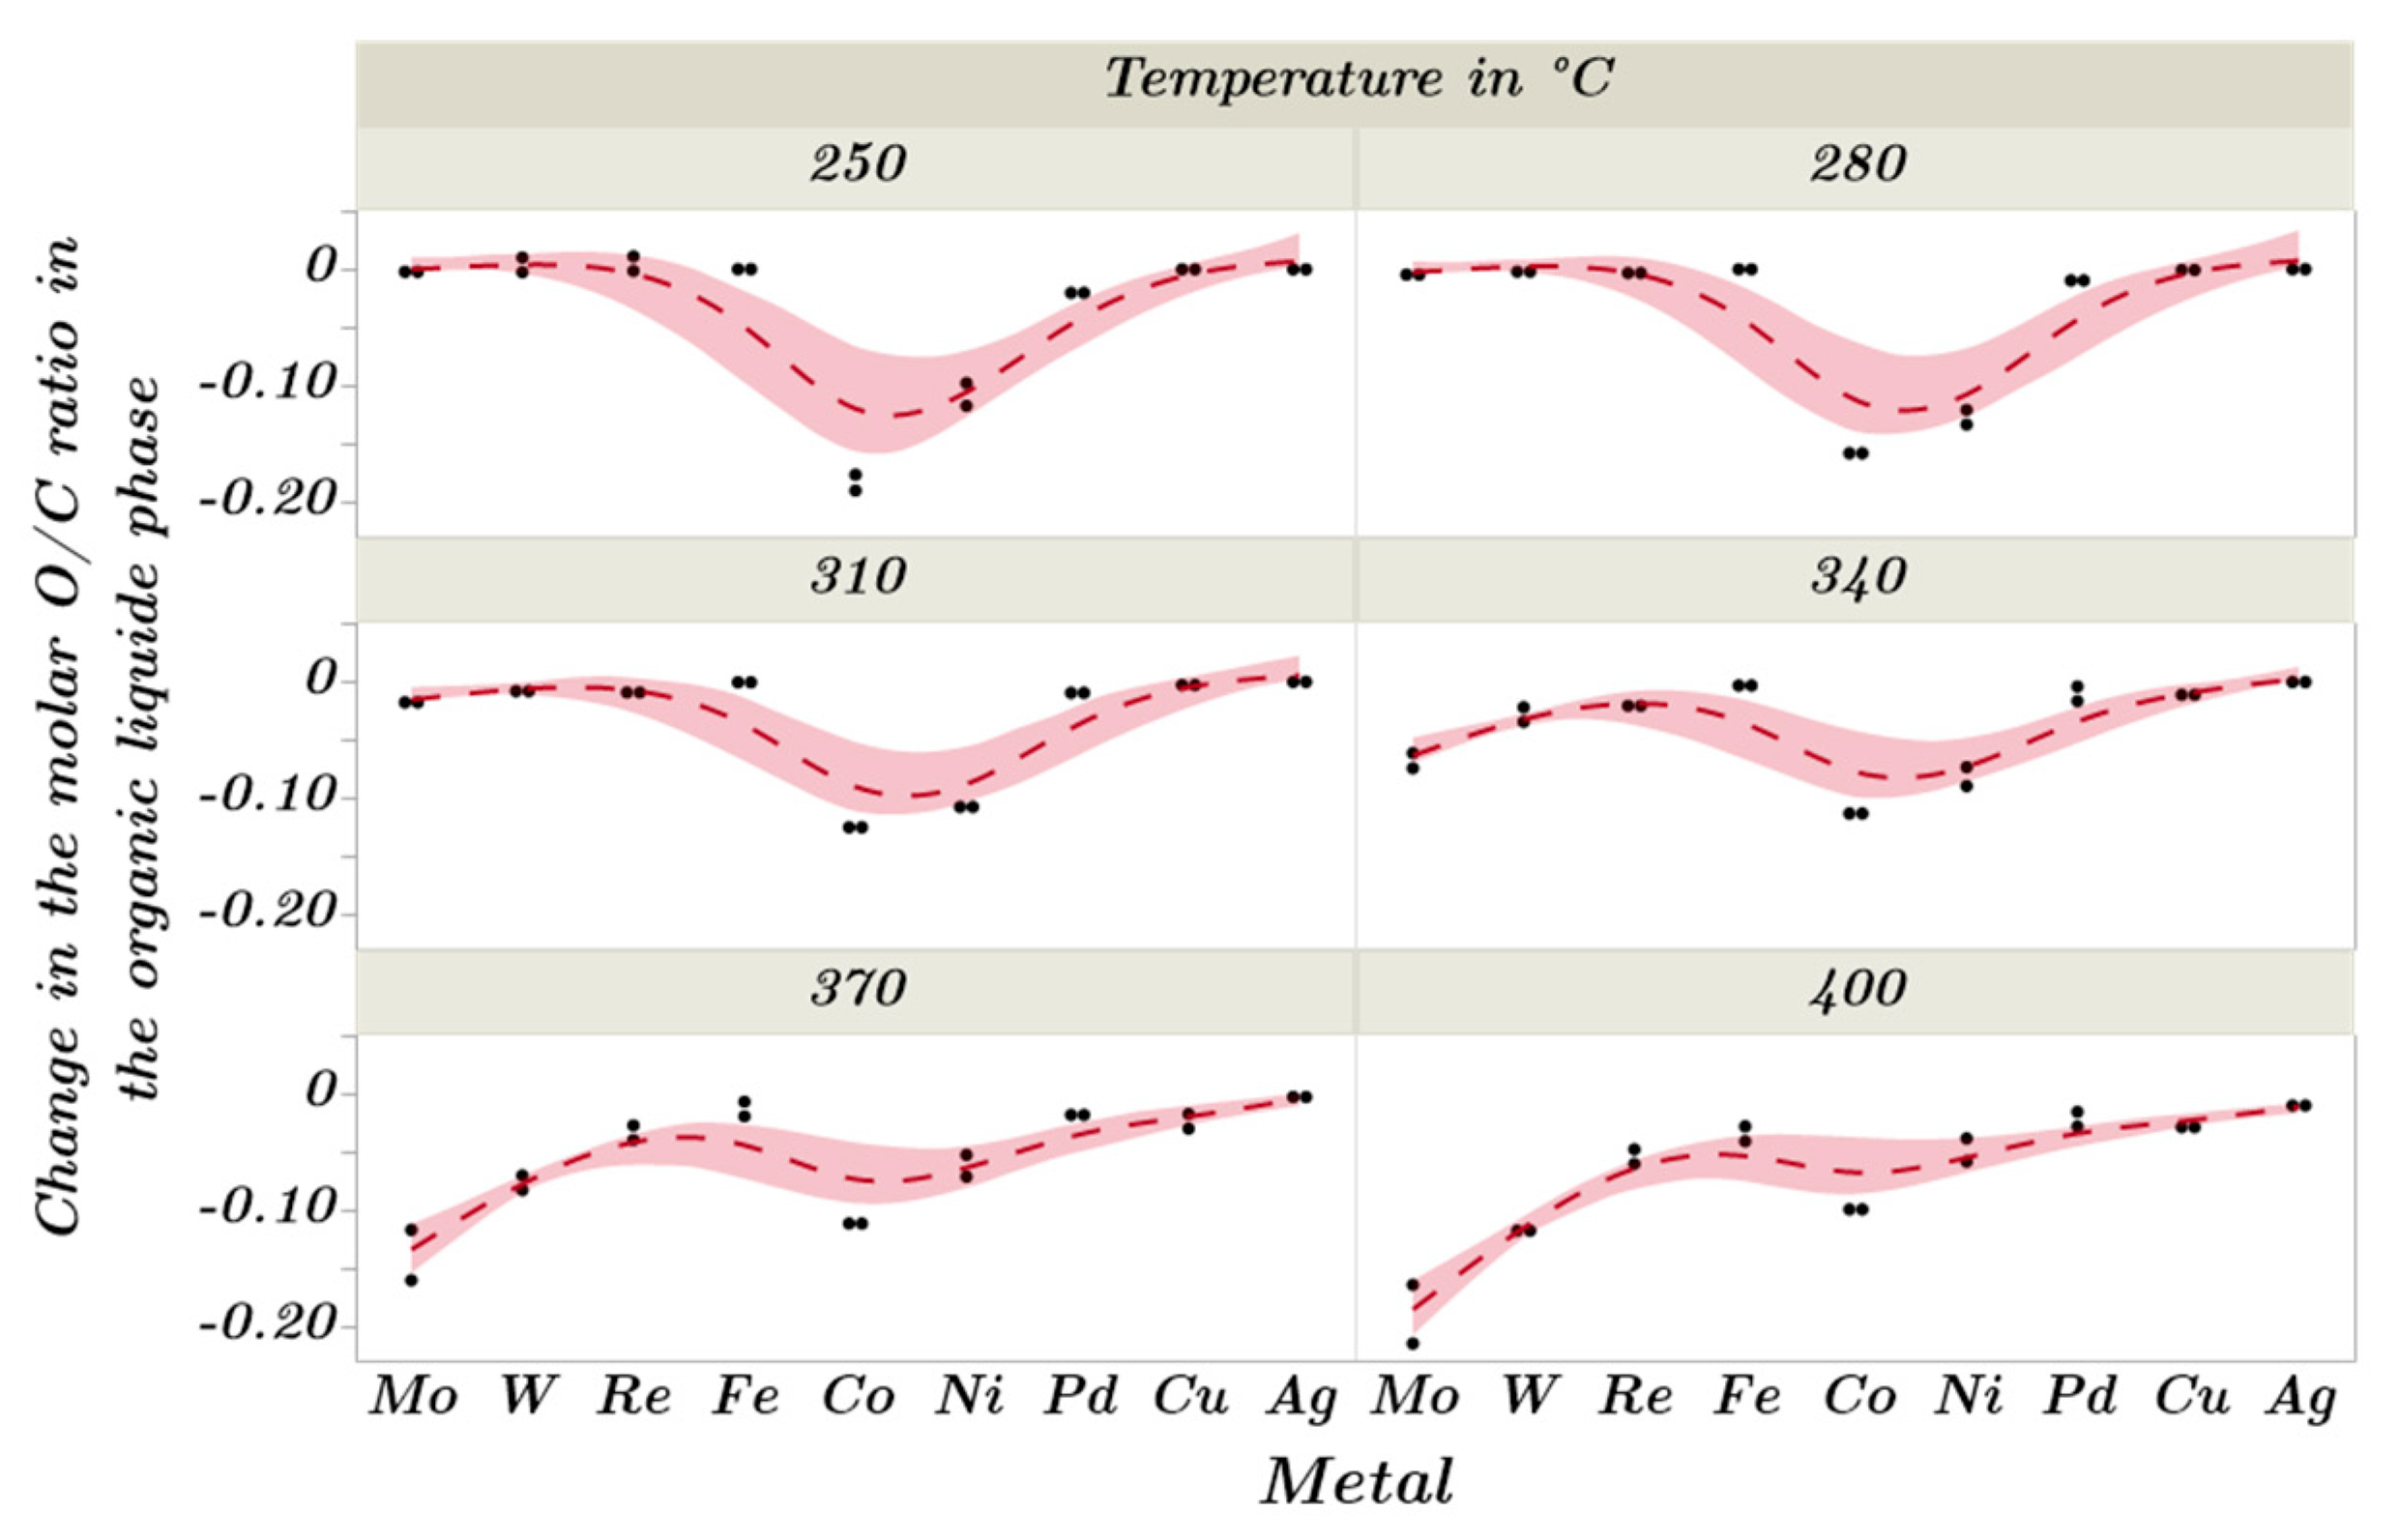
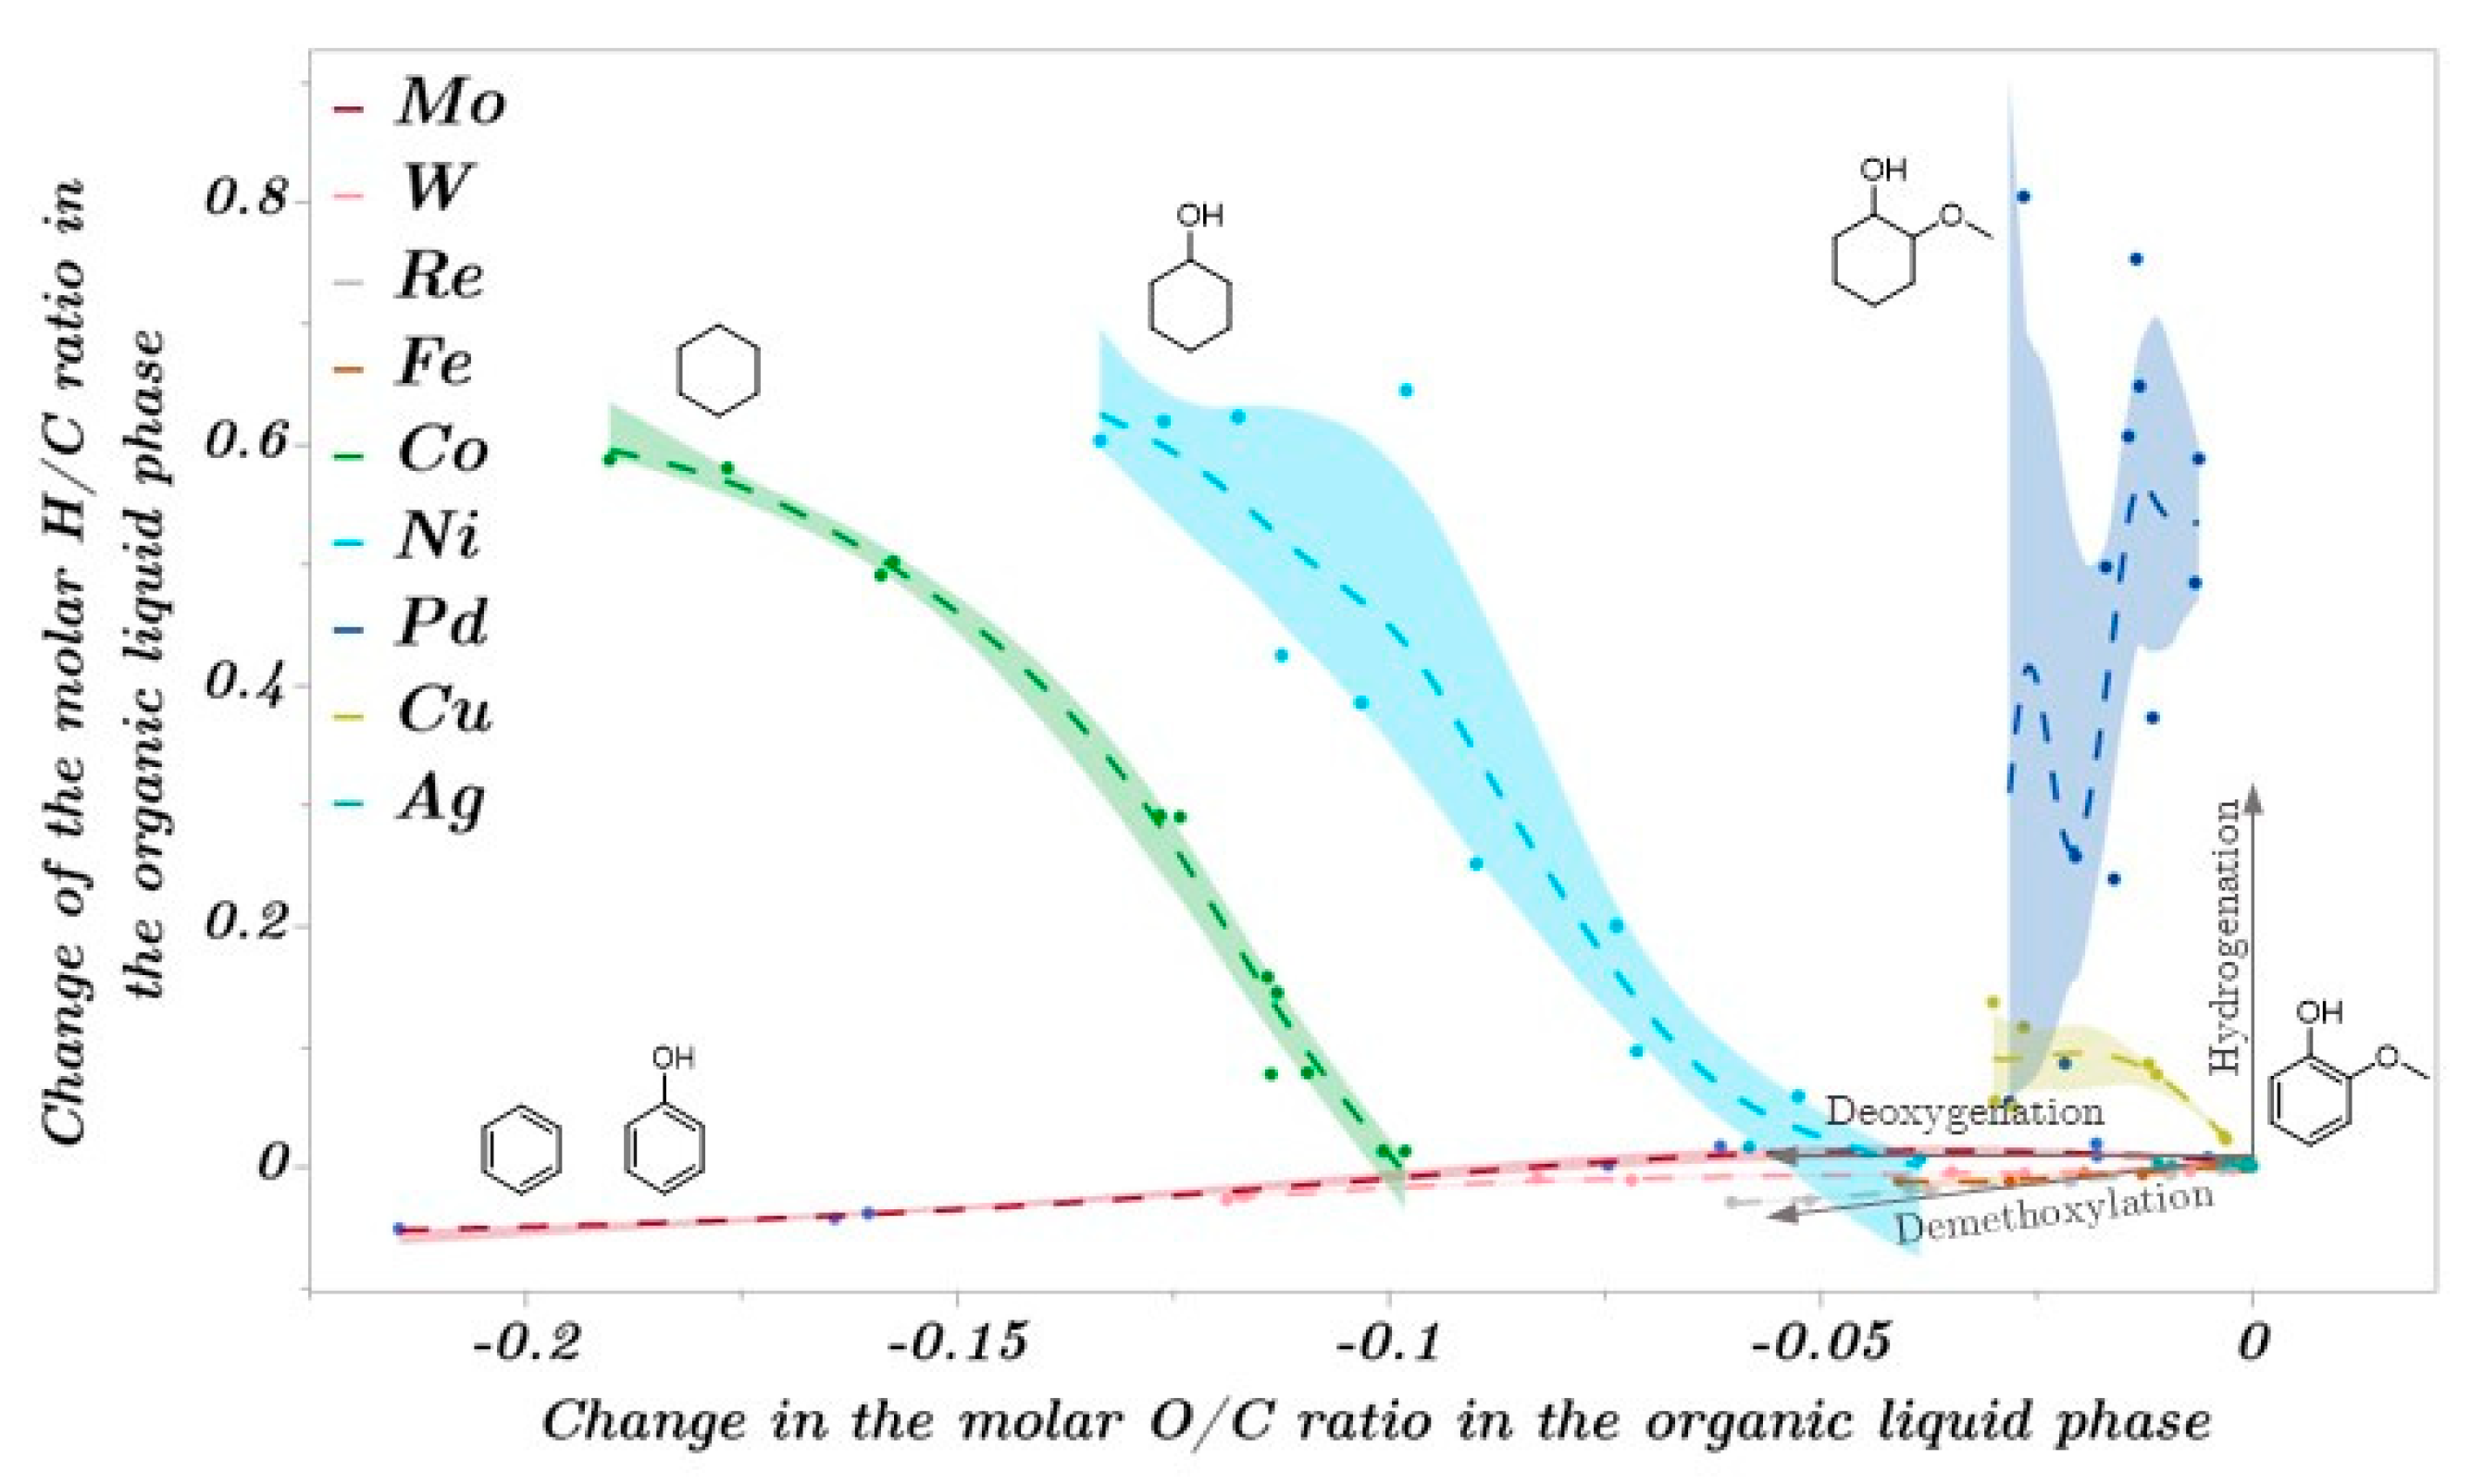
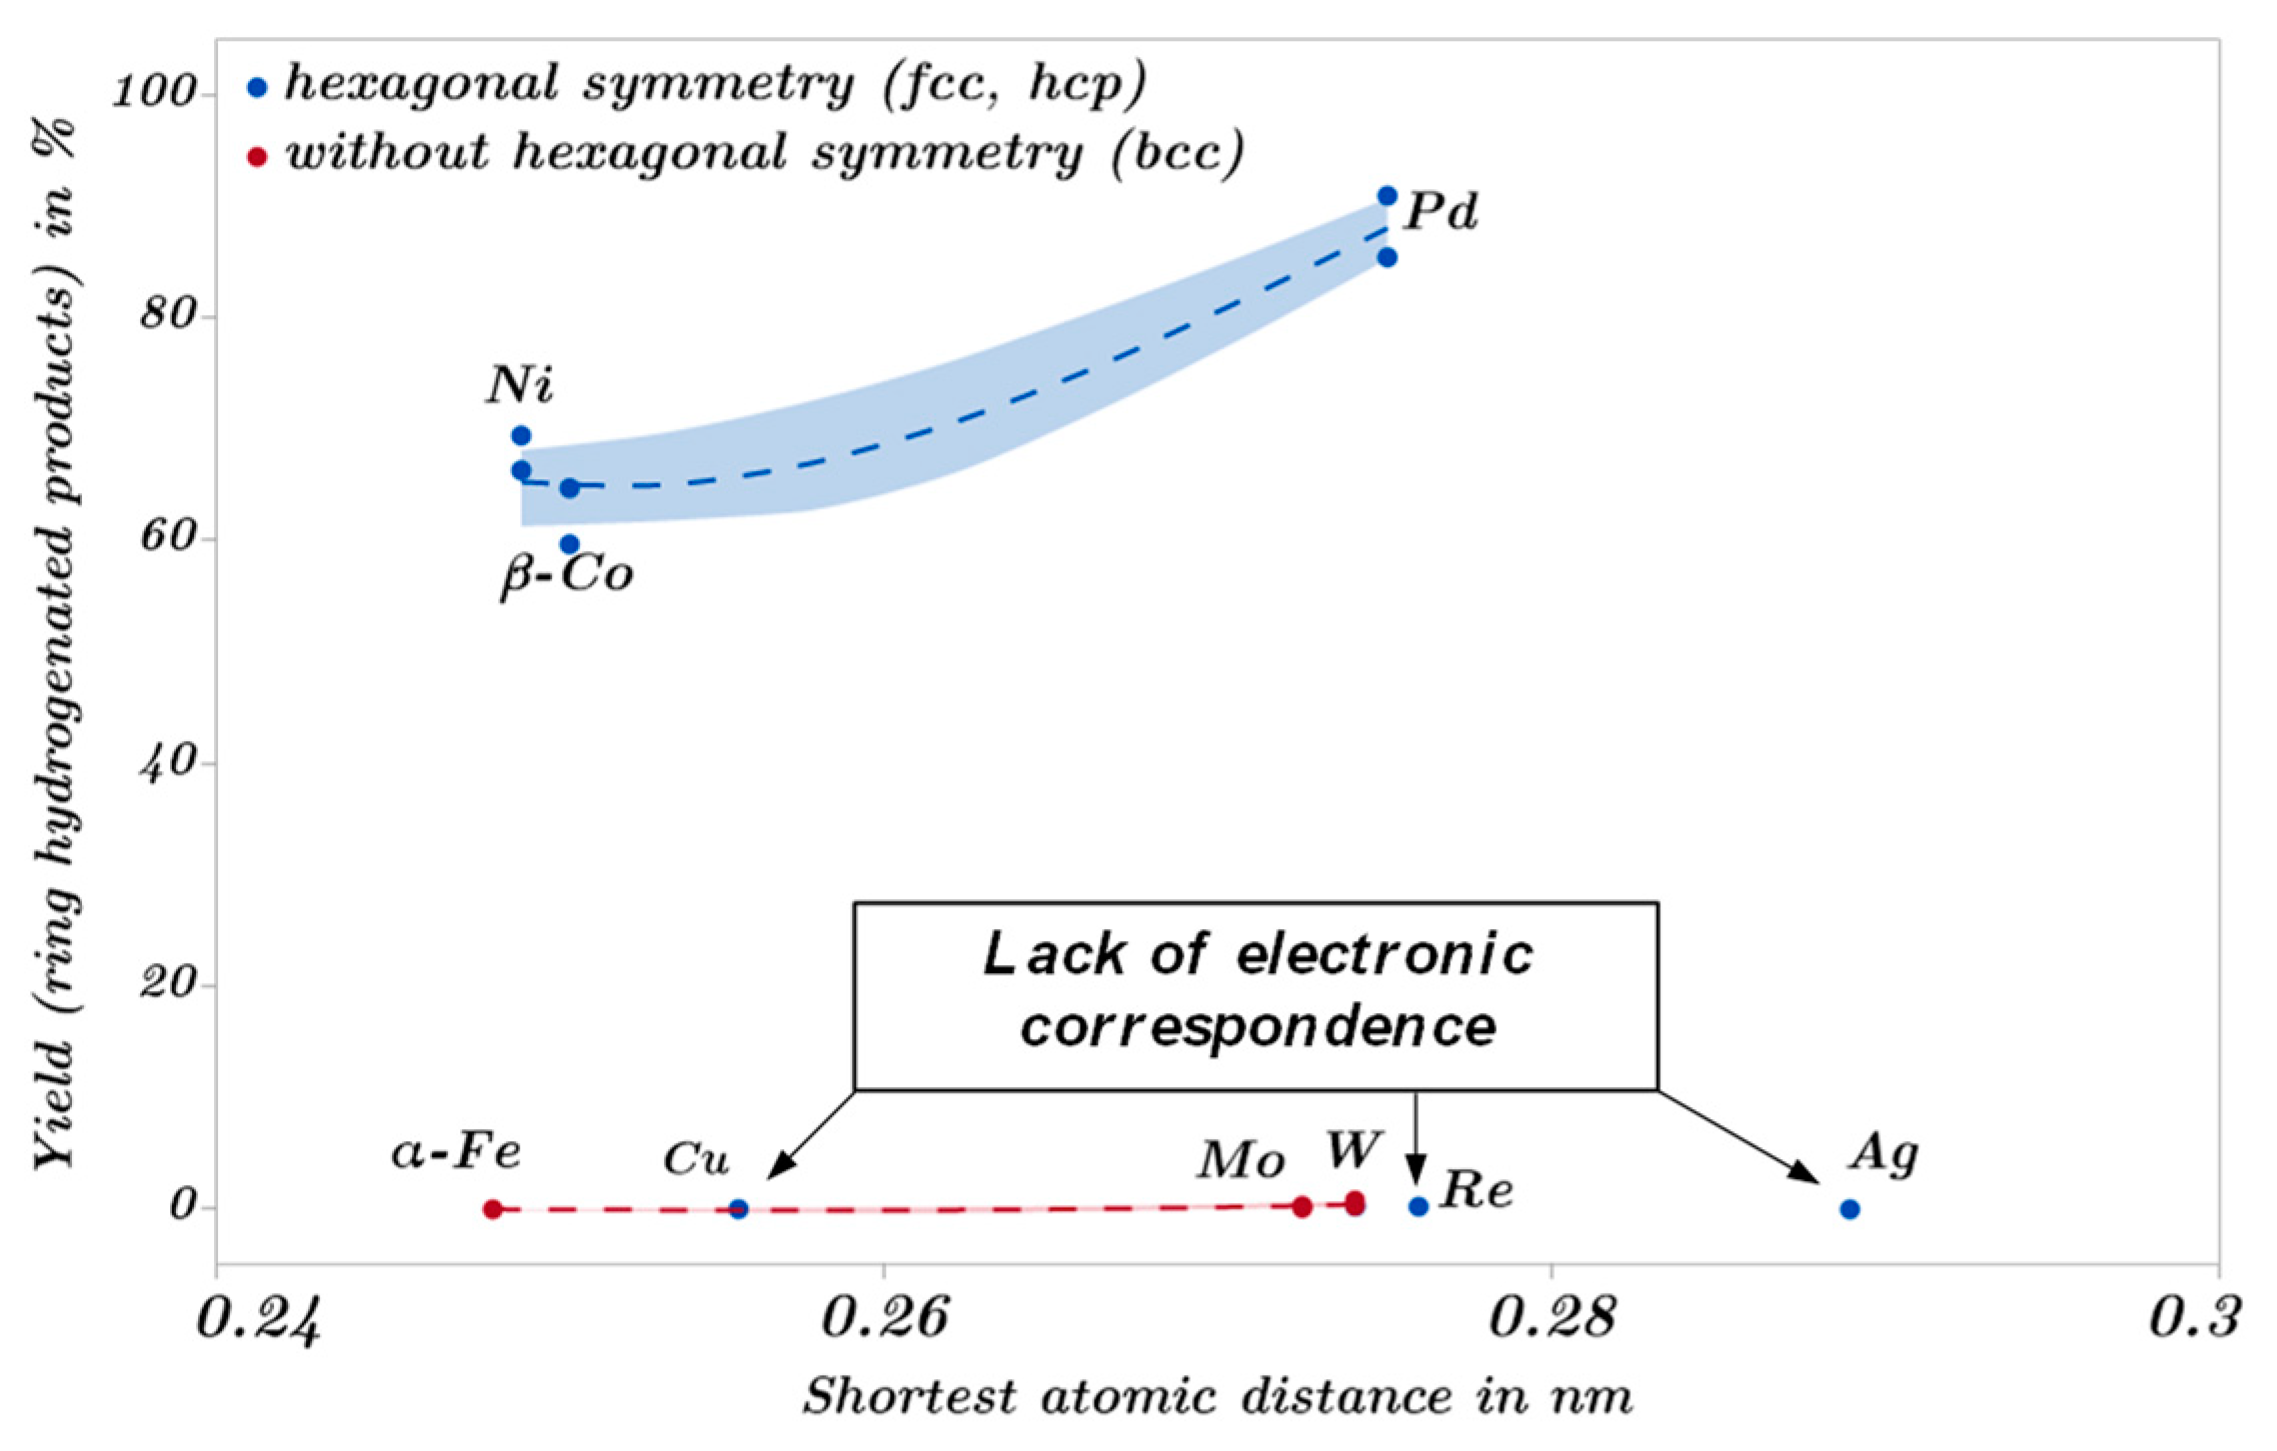
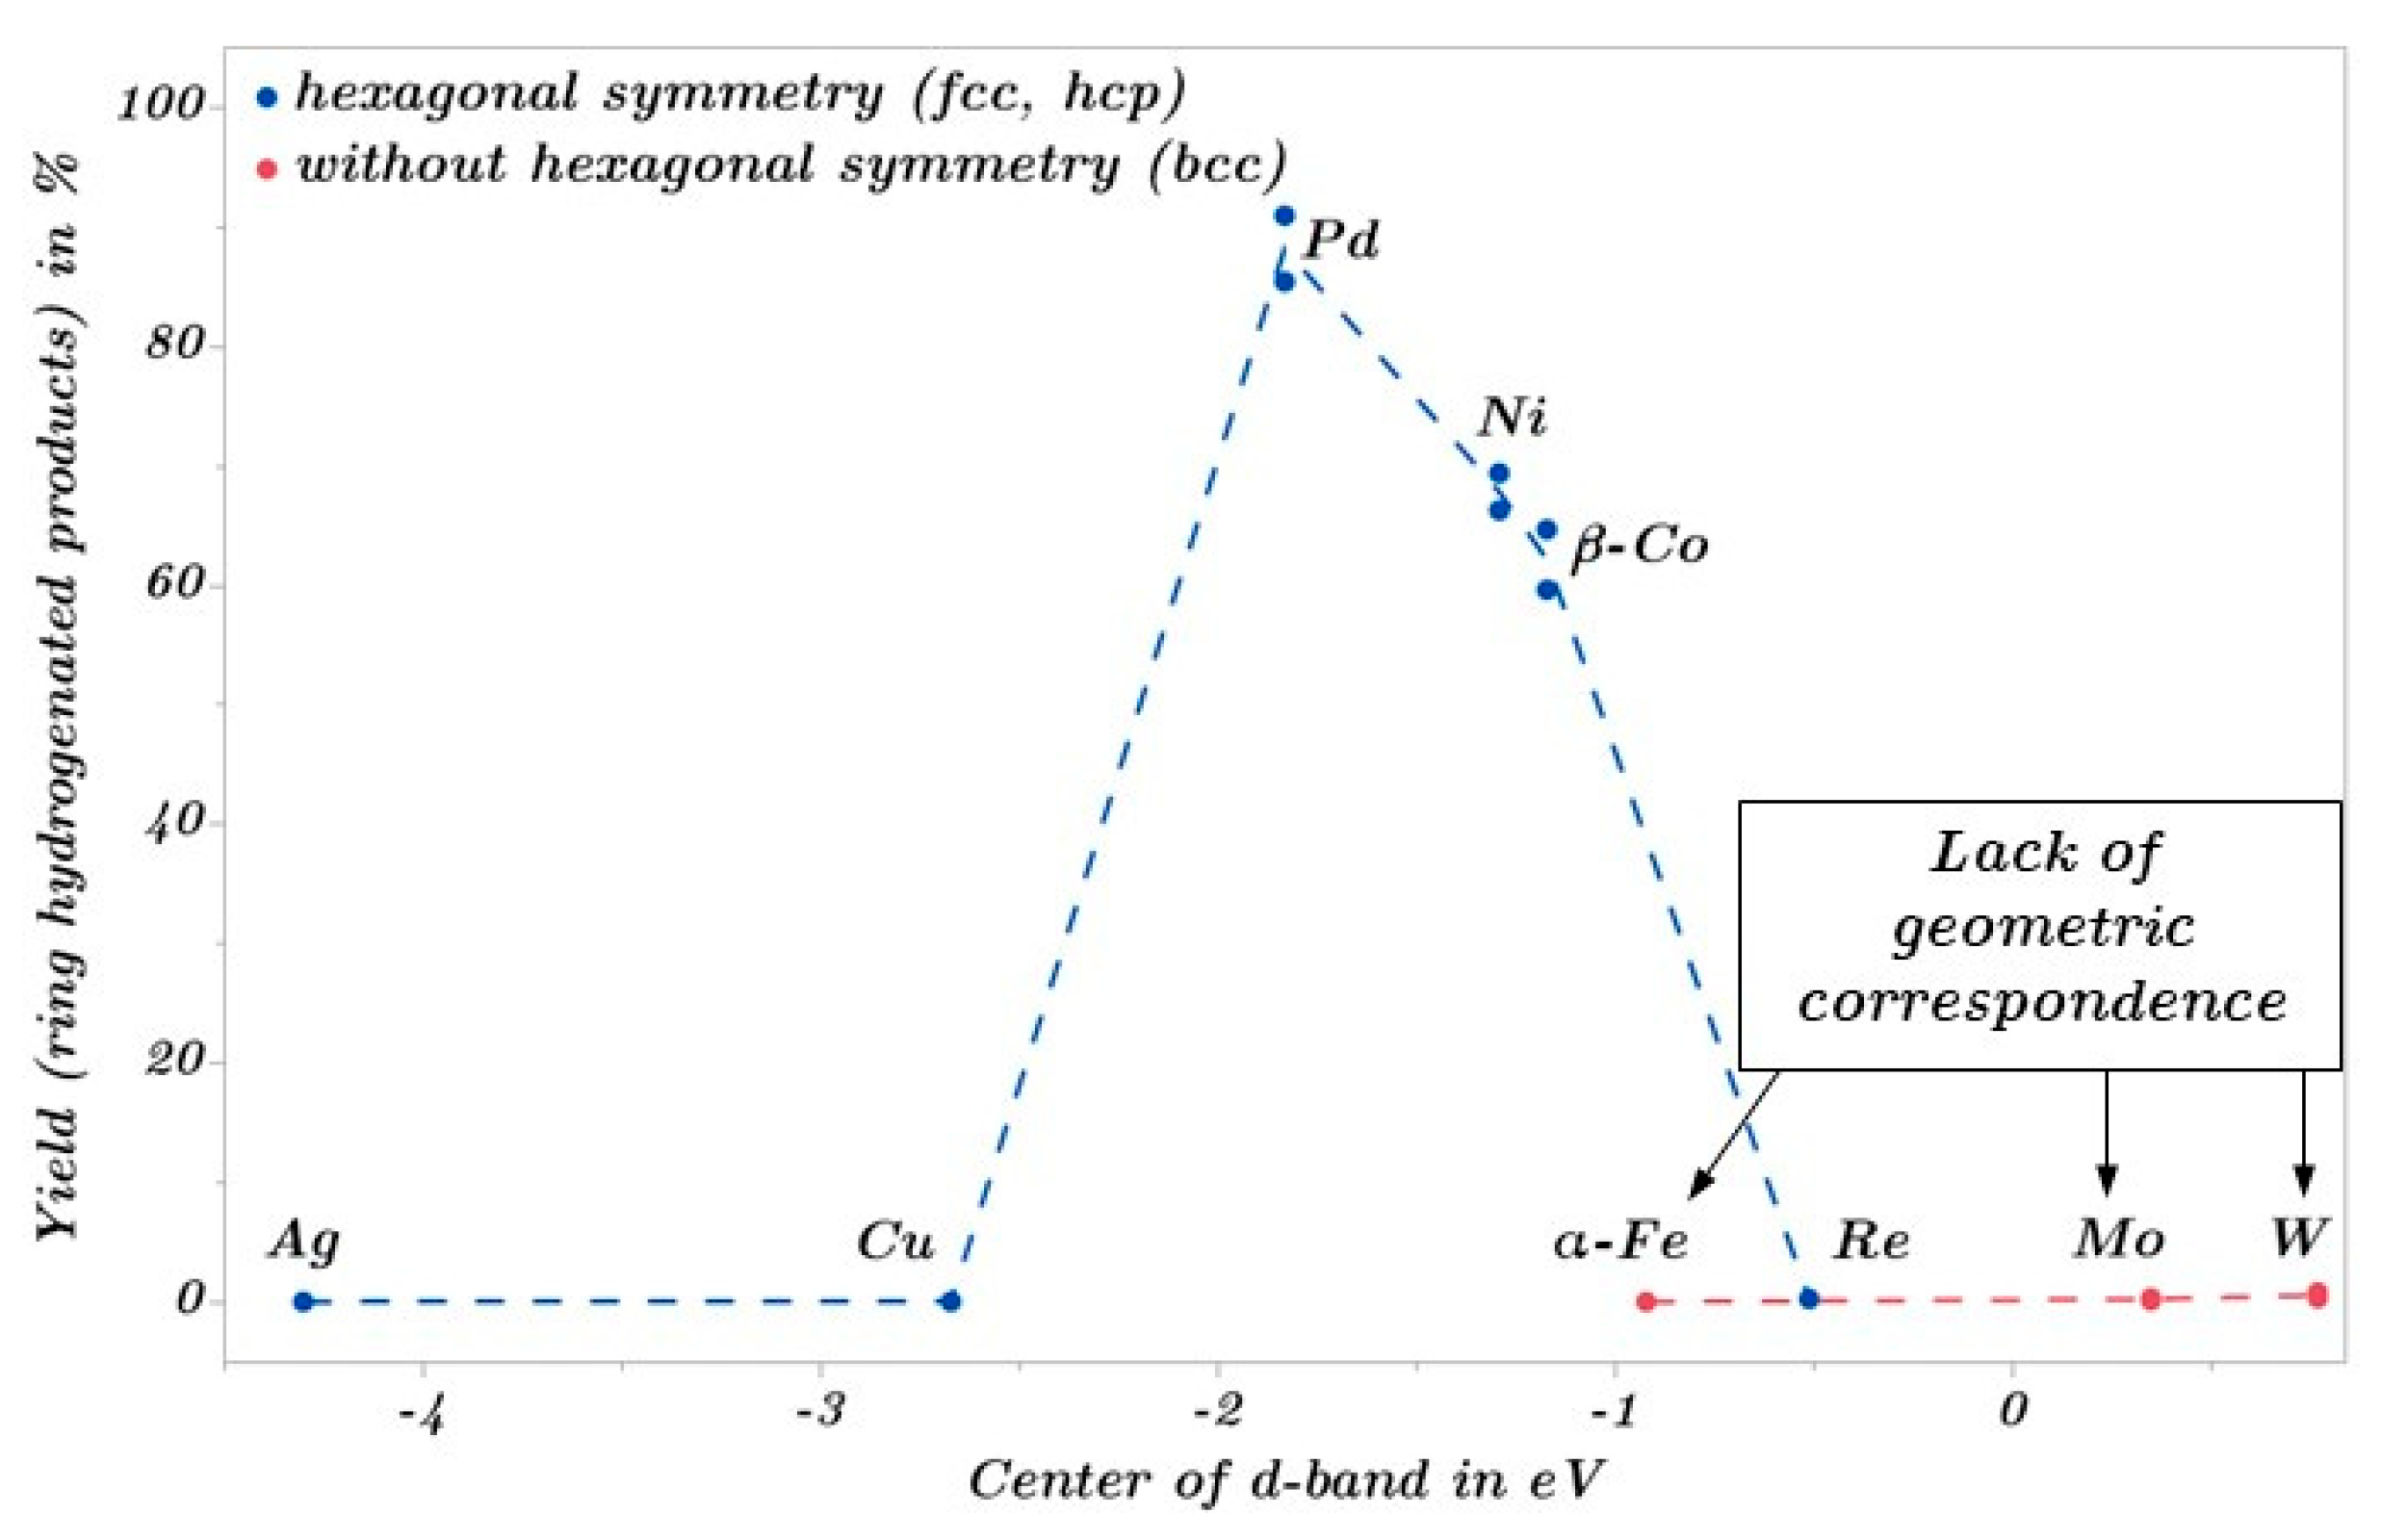
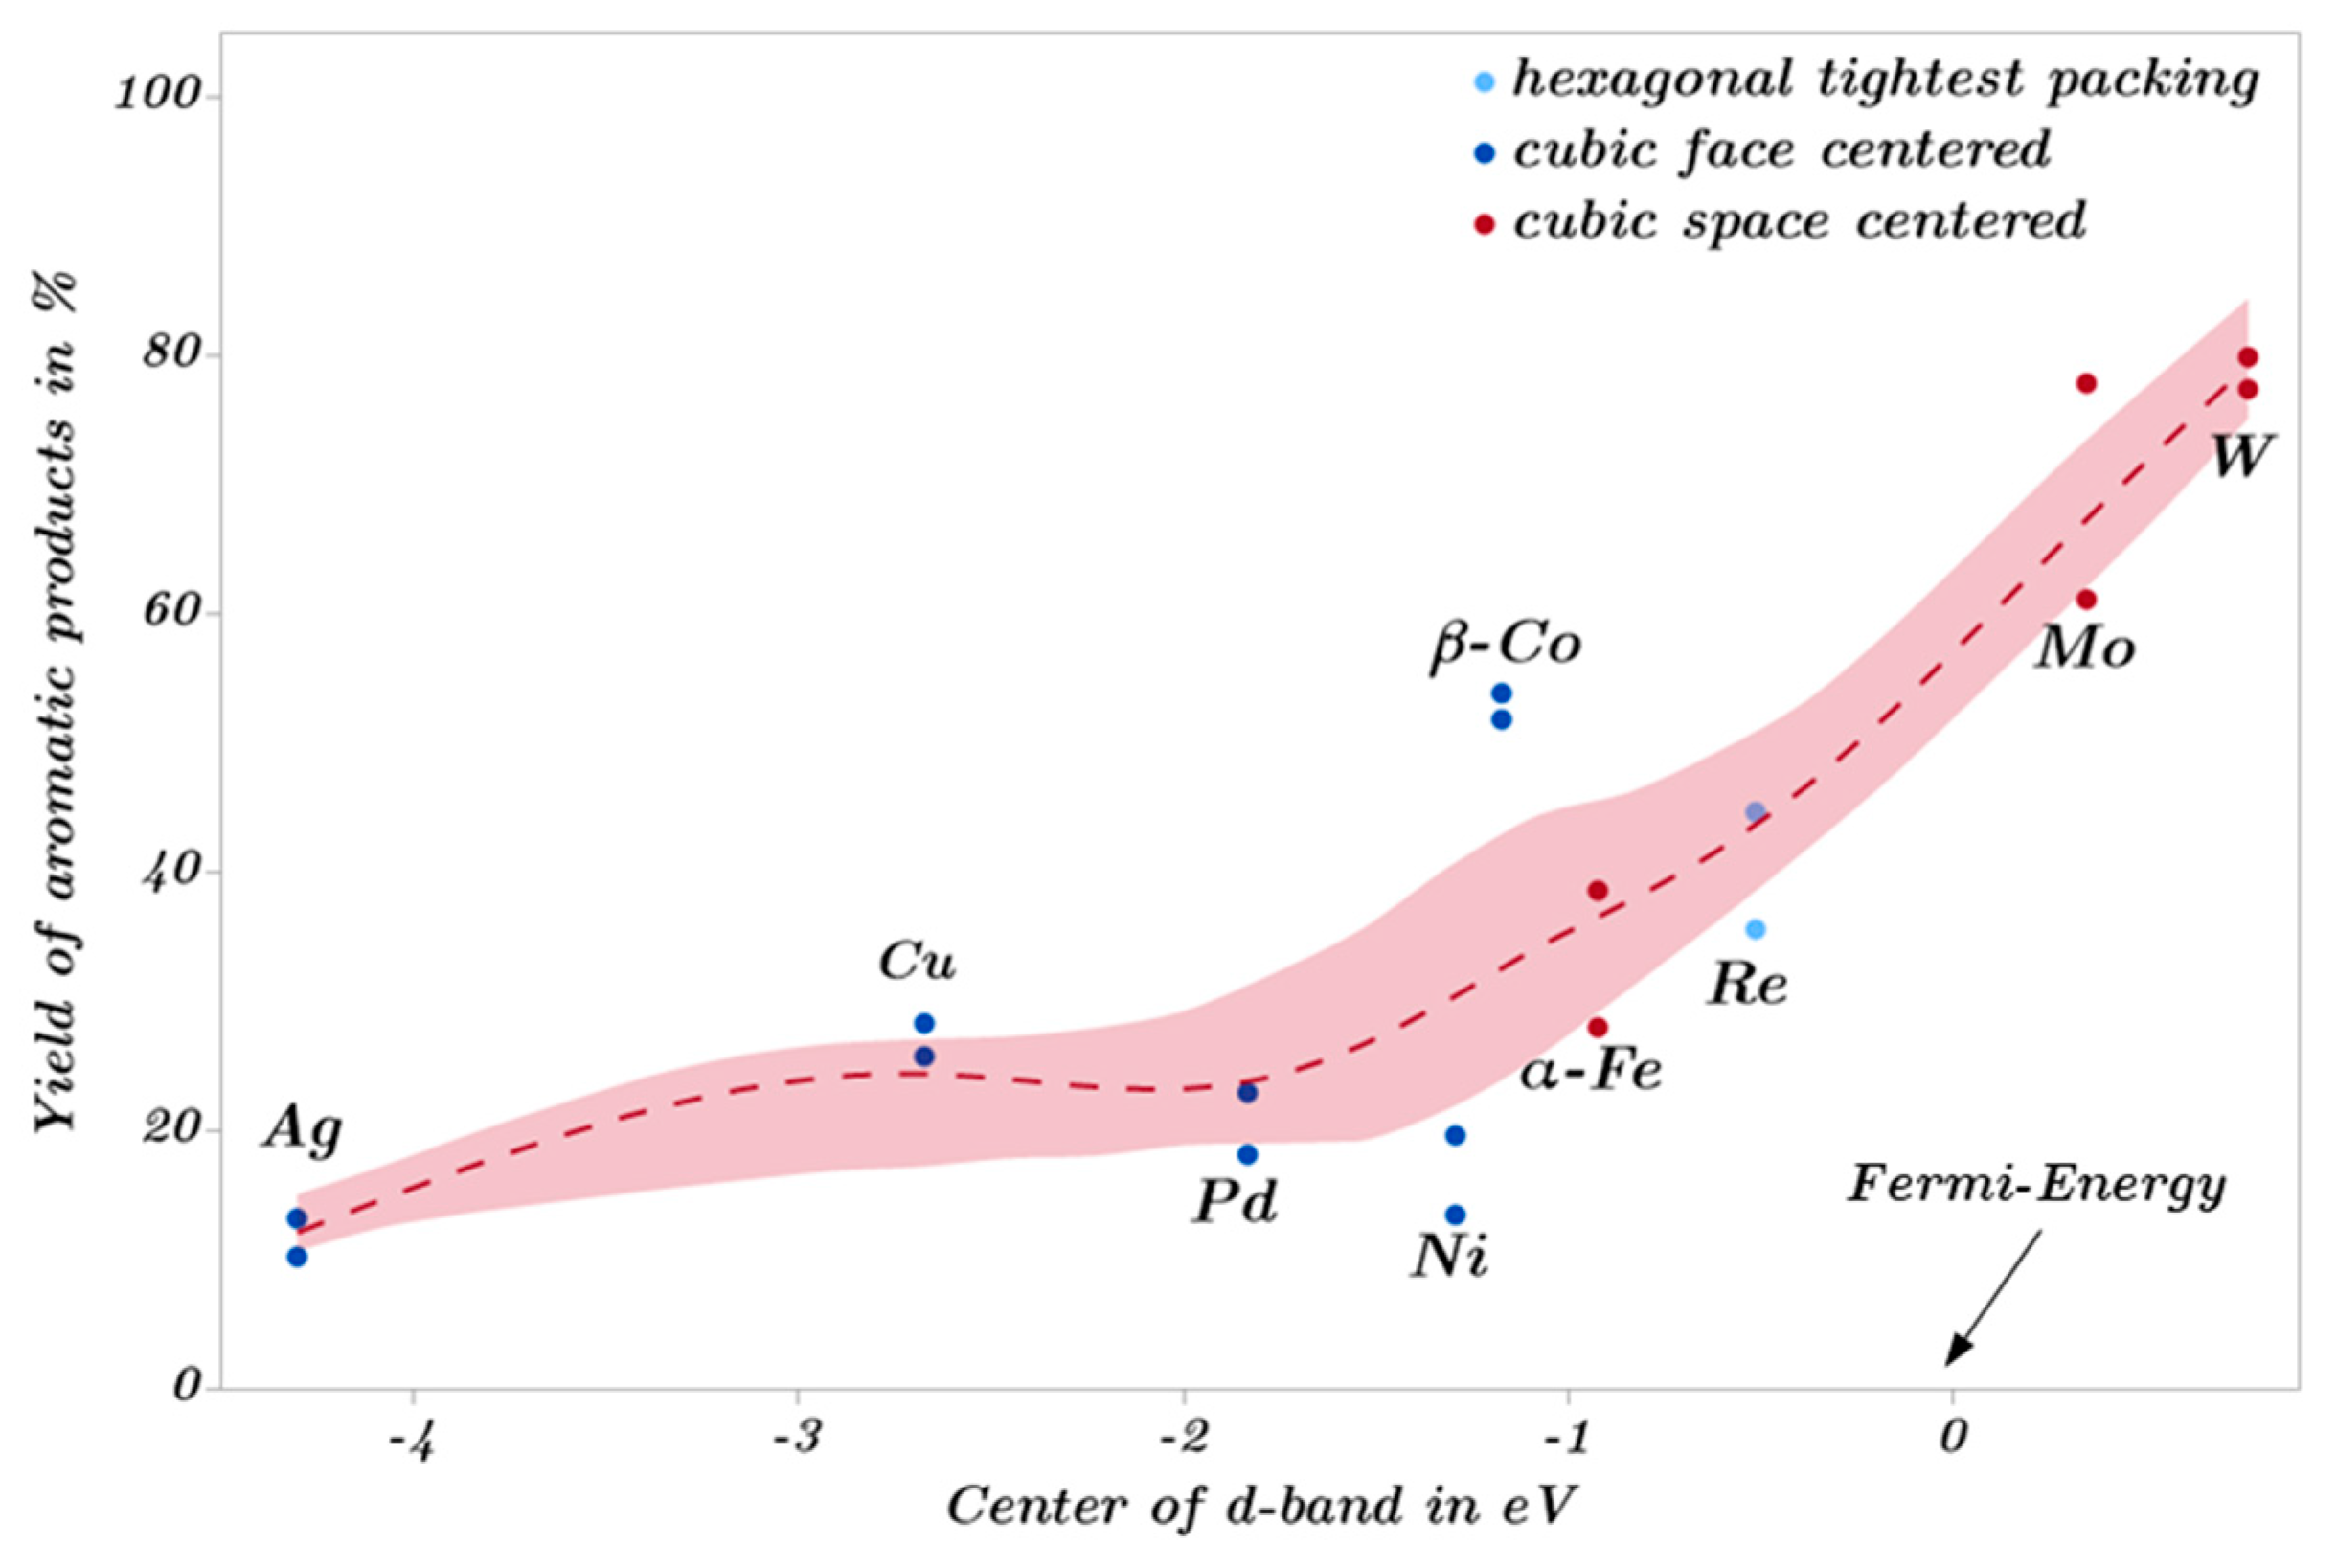
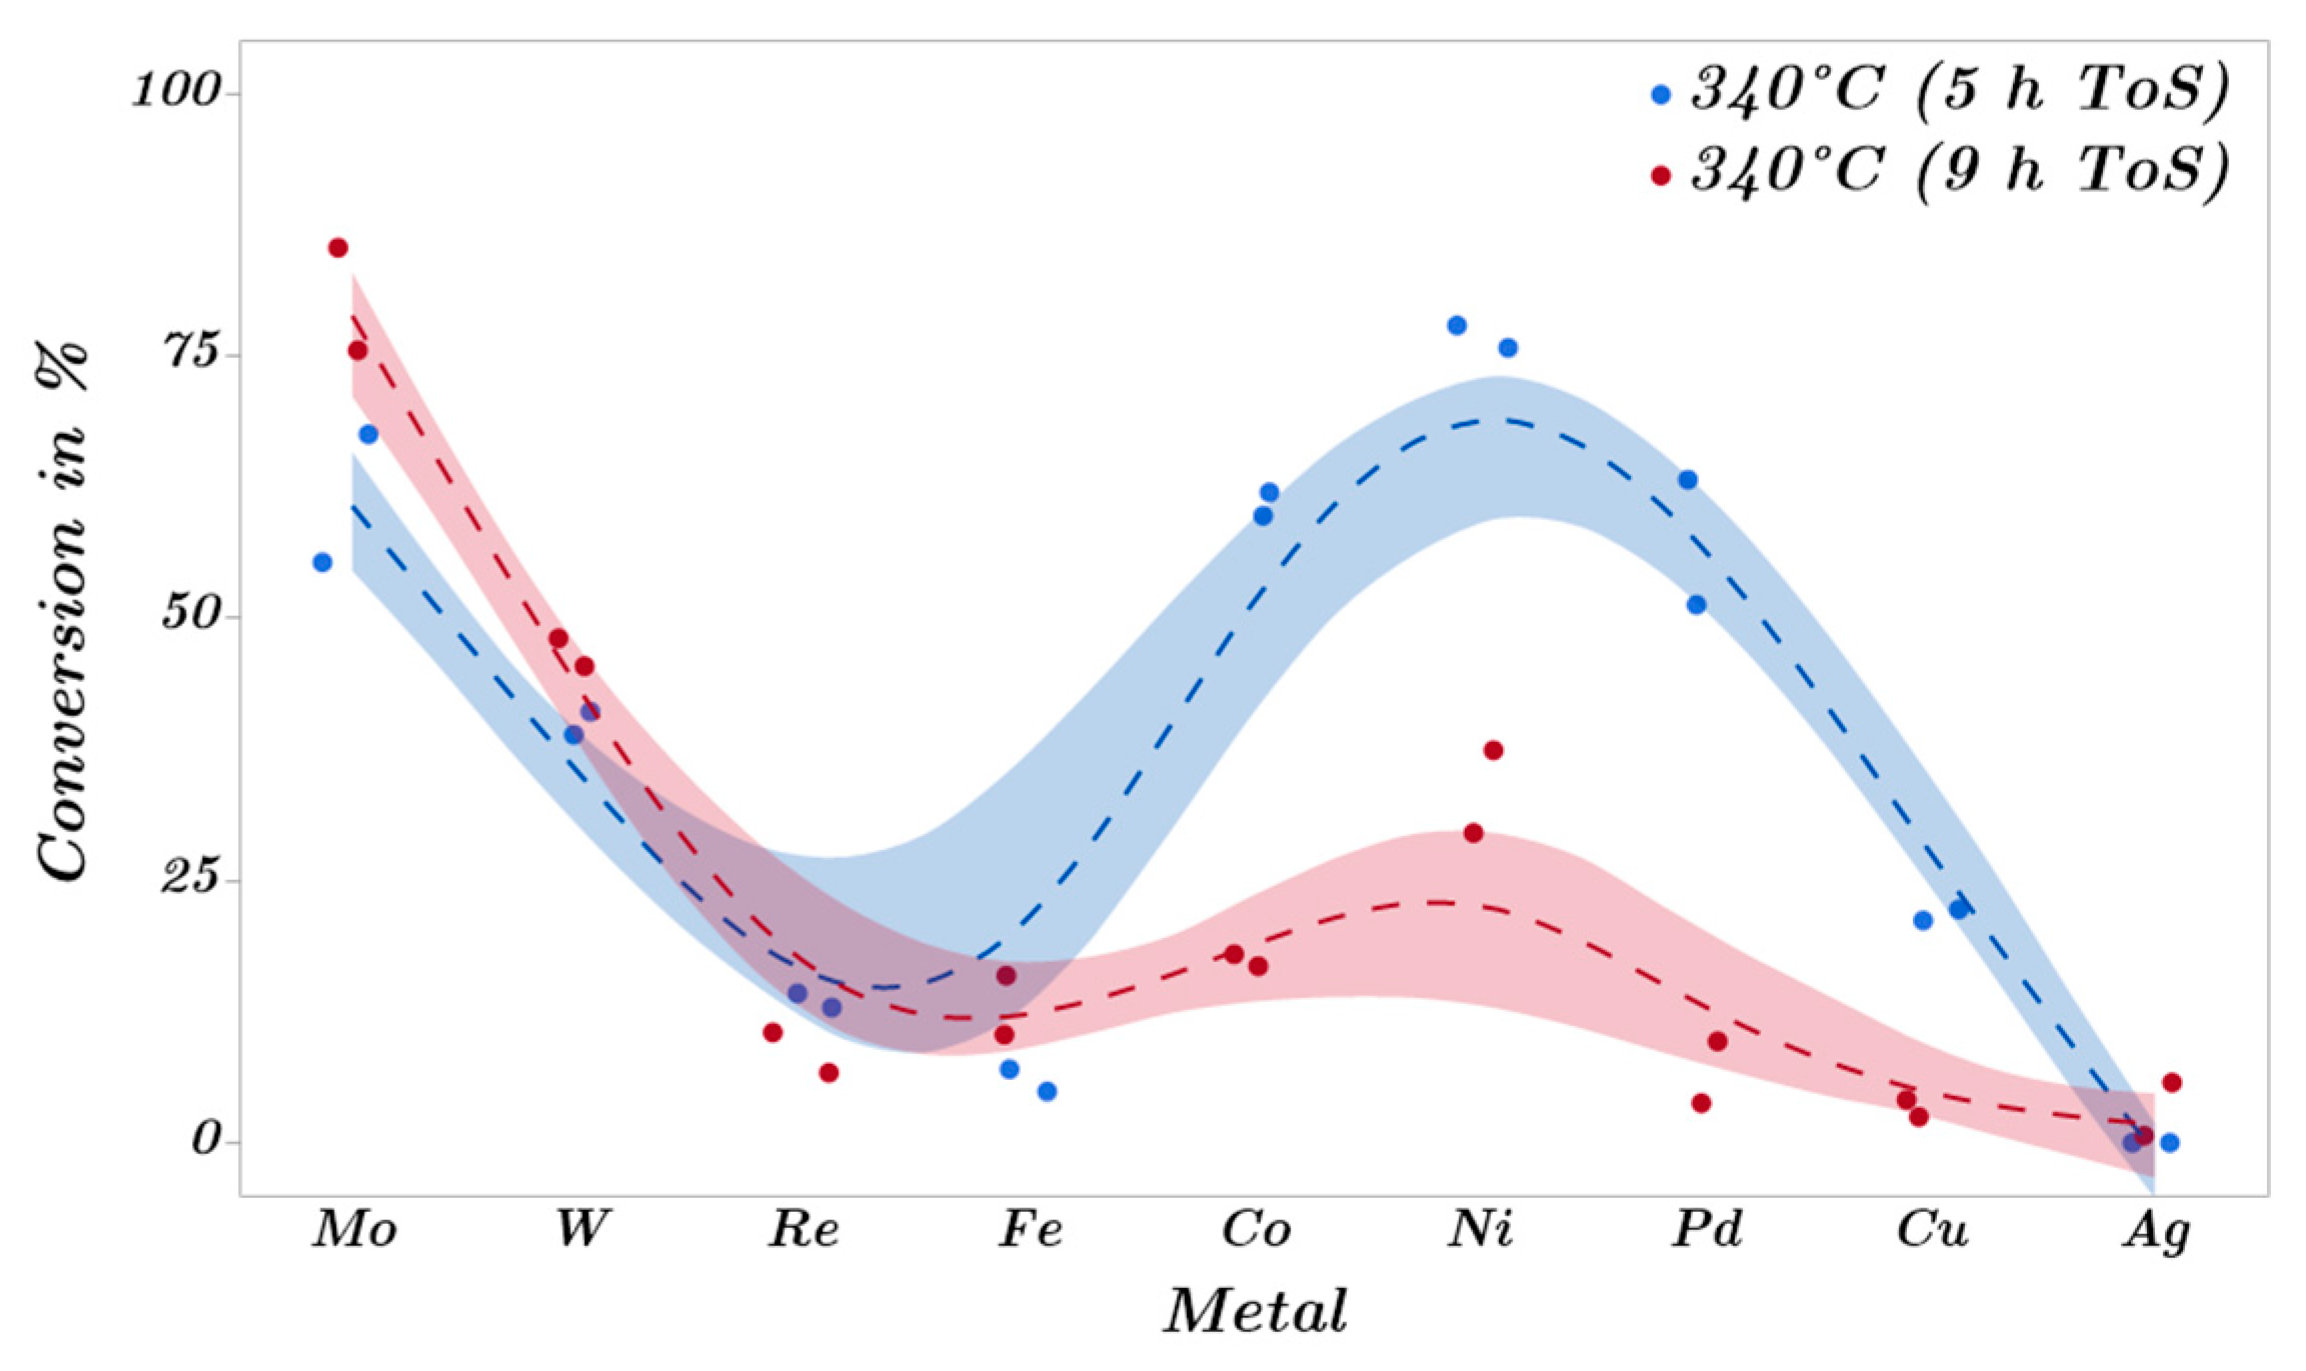
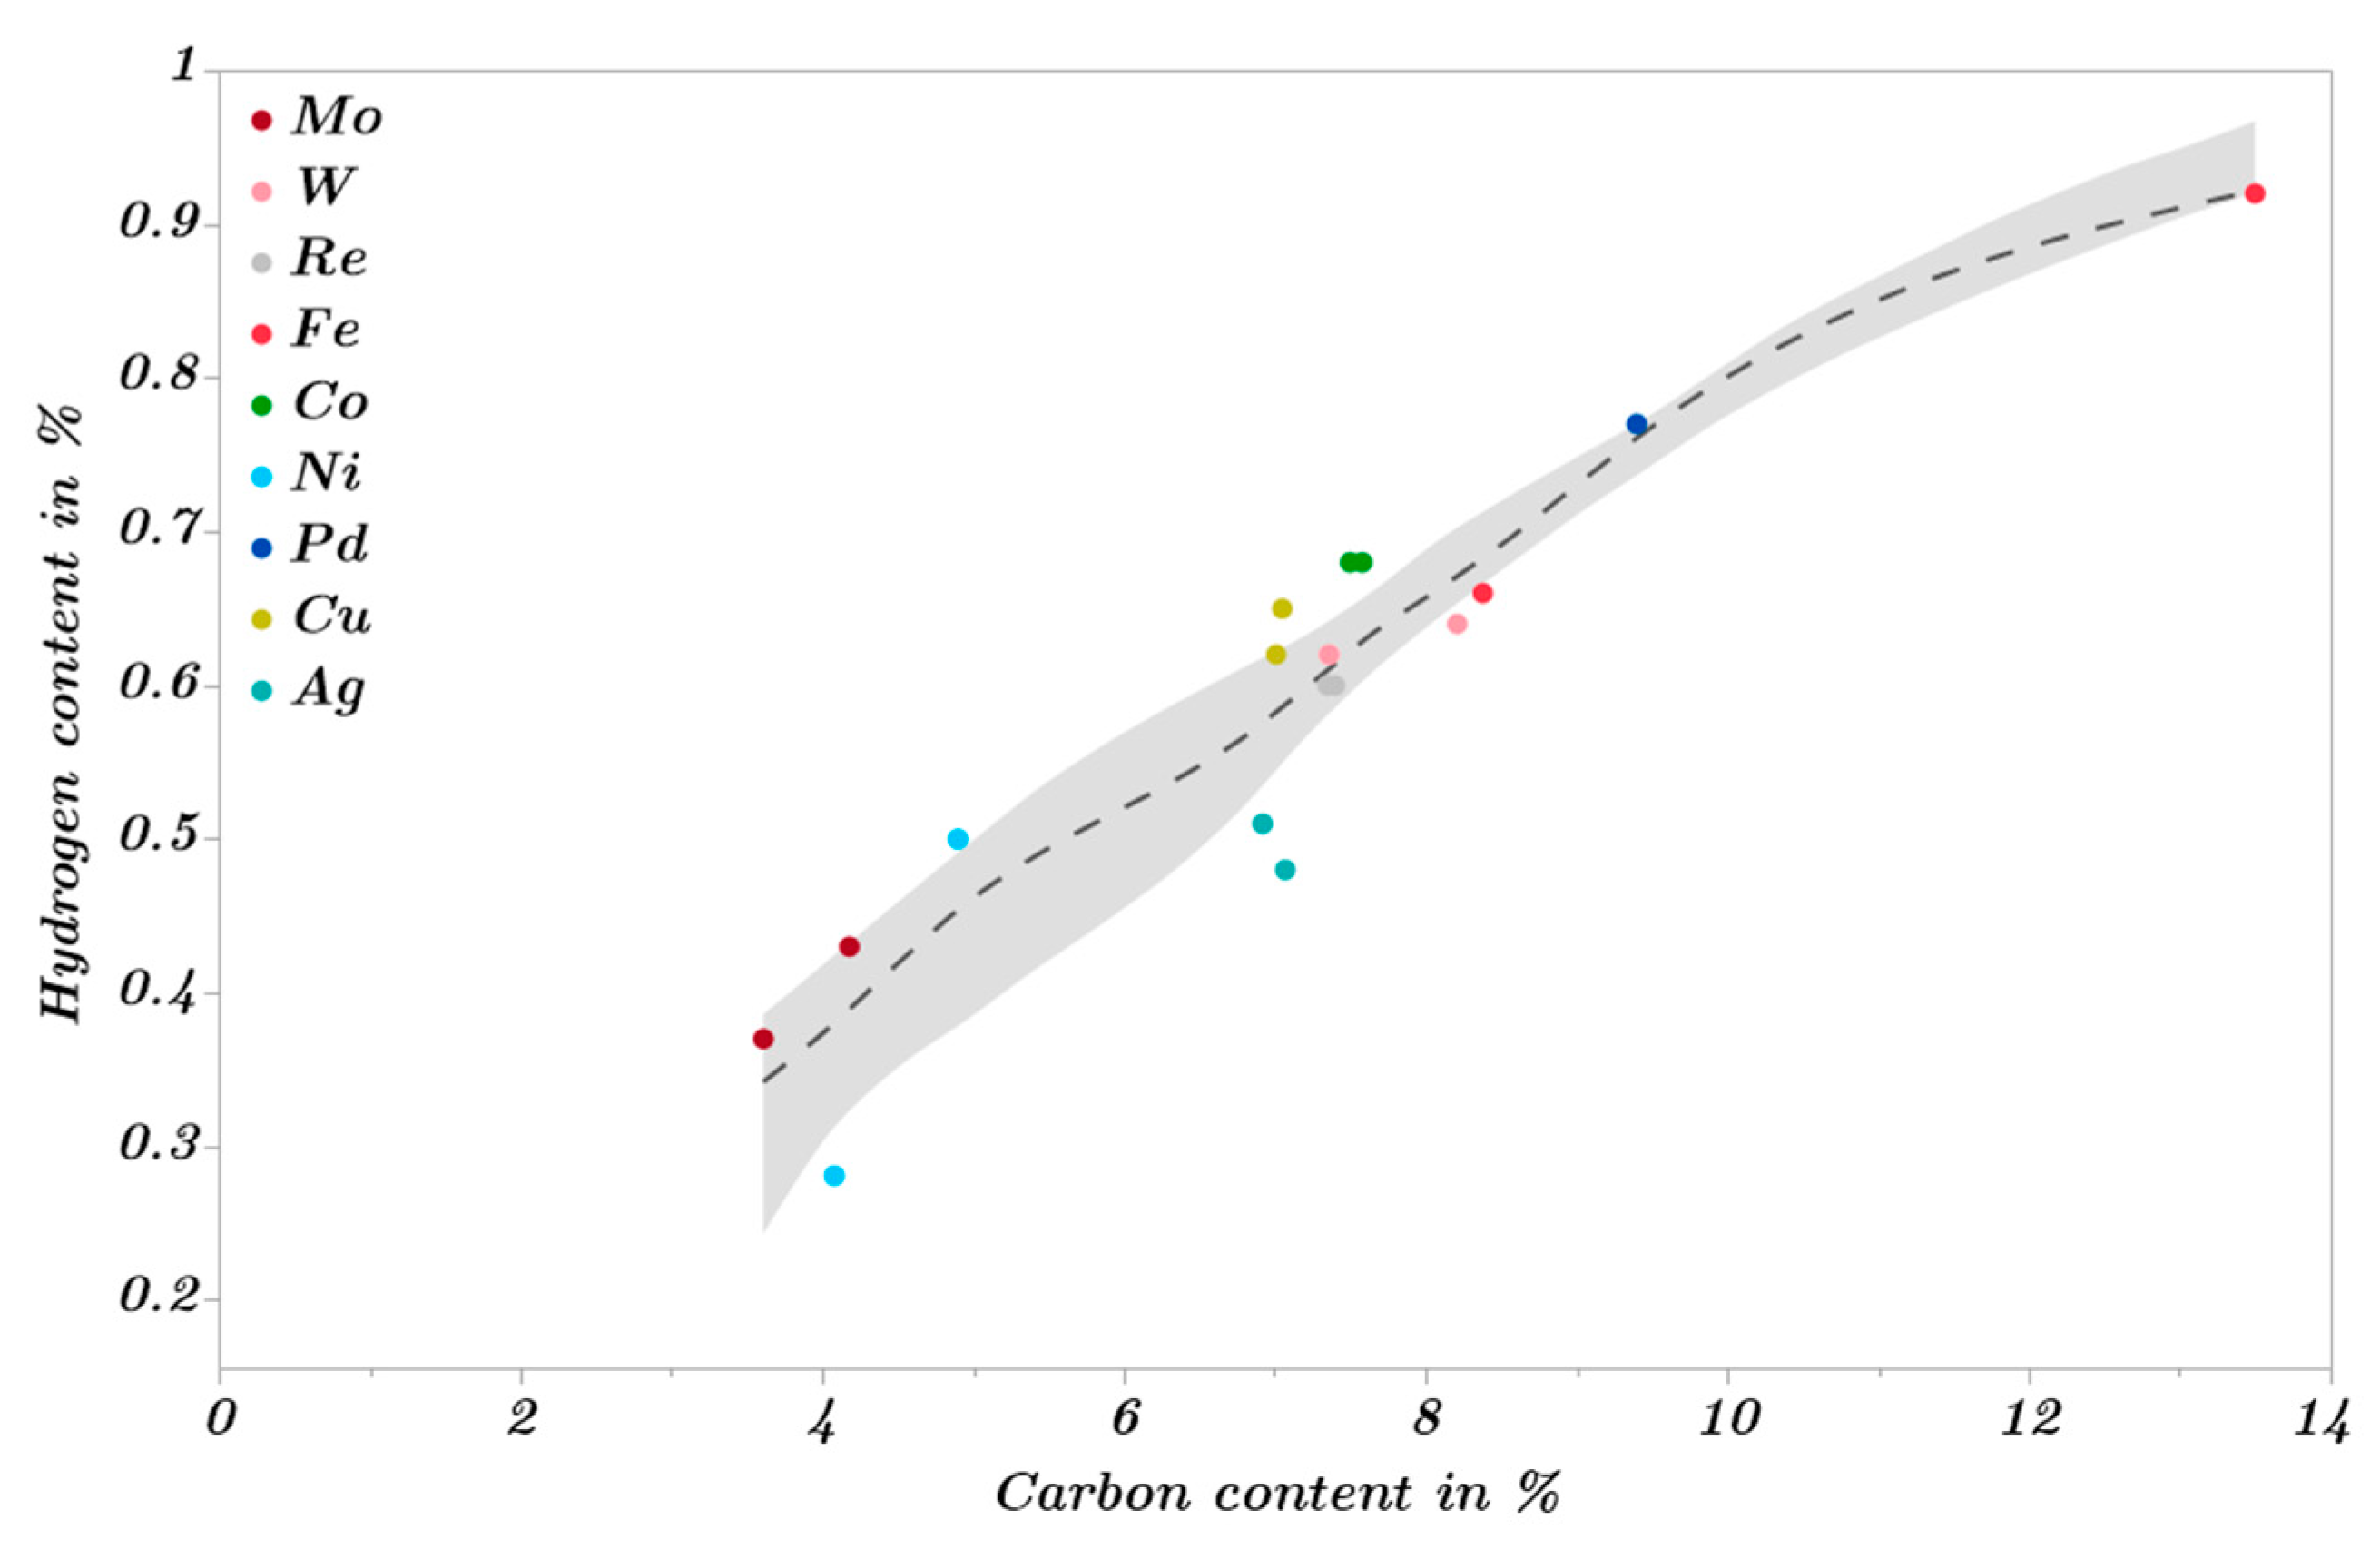
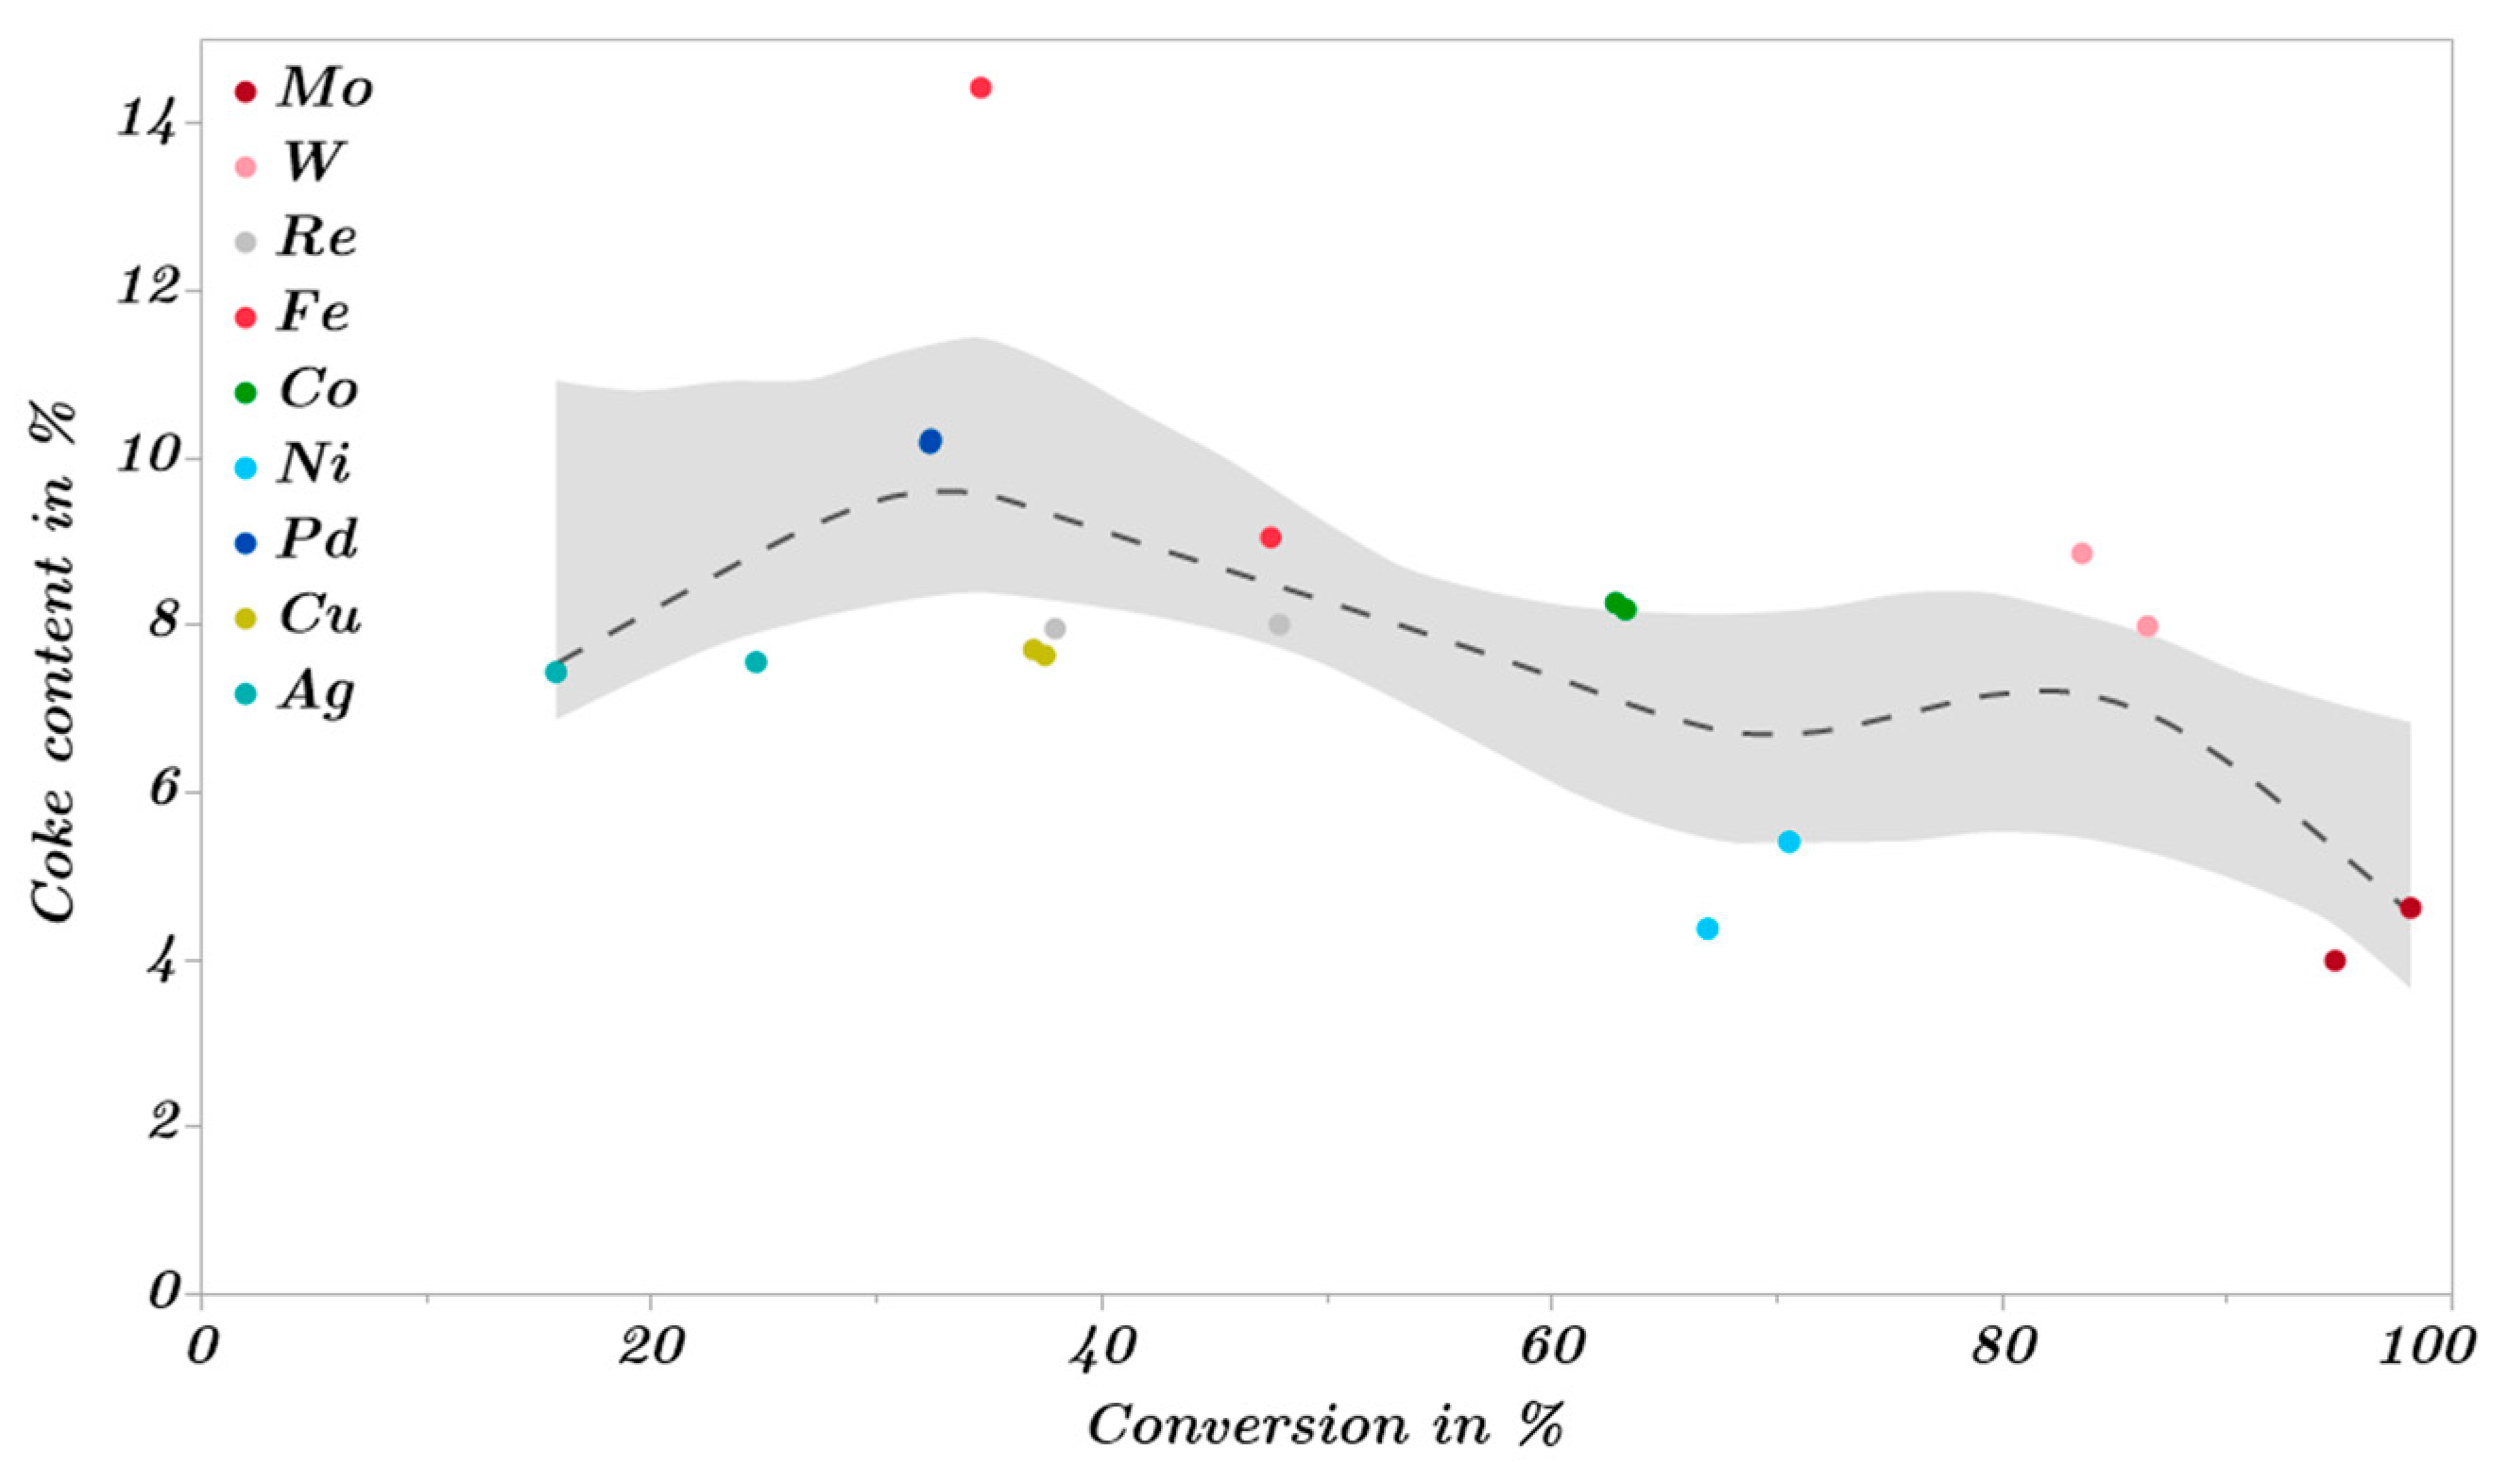
2.3. Catalytic Trends during the Metal Screening by Volcano Plots and Pseudo van Krevelen Diagram

The following results of the catalytic test measurements are described according to the element group and period. The observation of the selectivities of low conversions is highly susceptible to fluctuations and can therefore lead to misinterpretations, particularly by overestimating the gas phase. To avoid this, only selectivities from a minimum conversion of 15% are considered in the presentation of the results.
The aim of the investigations is to compare the catalytic properties of different metals on silica supports in an initial screening. The focus here is on the different d-band occupancy of the selected metals of subgroups 6 (d4) to 11 (d9). For the investigation of the observed effects, a literature search summarized different substance data, as illustrated in Appendix B in Table A1 and Table A2. These include the electron configuration in the isolated atom, the band occupancy in the metal crystal, the minimum energy configuration, the center of the d-band, the percent d-character, the one-electron orbital energies and the bonding energies metal-carbon, metal-oxygen, and metal-hydrogen, as well as the crystallographic data, such as the lattice type, the covalent radius, and the shortest atomic distance. The conversion of the investigated metal-silica catalyst systems is shown in simplified form in Figure 11.
The conversion shows a clear dependence on the temperature and the metal loading (see Figure 11). For temperatures below 340 °C, there is an optimum for the metals cobalt (d7) to palladium (d8). For higher temperatures, the activity and, thus, the guaiacol conversion, decreases when these metals are used. In contrast, the activity of the other metals, particularly molybdenum and tungsten, increases with the increasing temperature. In Figure 12, a pseudo van Krevelen diagram exemplifies the possible changes in the molar H/C- and O/C-ratios in the conversion of guaiacol [70,71]. Referring to the organic liquid phase, Figure 13 shows the observed changes in the molar H/C-ratio and Figure 14 shows the change in the molar O/C-ratio due to the catalyzed conversion of guaiacol on the different metal-silica catalysts. The observation of these ratios is used for the general investigation of the processes taking place. For example, as shown in Figure 12, ring hydrogenation increases the H/C-ratio while the O/C-ratio remains constant. In contrast, the dehydroxylation of phenol with the elimination of water leads to a reduction in the O/C-ratio, with the H/C-ratio remaining constant.
Analogous to the conversion, the change in the H/C ratio (see Figure 13) shows a maximum for low temperatures for the metals cobalt to palladium. The decreasing change in the H/C ratio with the increasing temperature can be explained by the exothermic nature of hydrogenation and the decreasing availability of hydrogen due to exothermic adsorption. However, due to its characteristic tendency to hydrogenolysis with the increasing temperature, nickel shows a deviating behavior when considering the overall change in the H/C-ratio, i.e., taking the gas phase into account. Therefore, cobalt, nickel and palladium can be summarily classified as hydrogenation metals.
Analogous to the observation of the H/C-ratio, the metals cobalt to palladium show a maximum change in the O/C-ratio for low temperatures (see Figure 14). The deoxygenation activity and, consequently, the change in the O/C-ratio also decreases with the increasing temperature. This can be justified by the preferential formation of phenol and benzene observed for high temperatures. In contrast to the change in the H/C-ratio, but analogous to the conversion, the change in the O/C-ratio increases for the other metals, particularly molybdenum and tungsten. For higher temperatures above 370 °C, the change in the O/C-ratio of these metals exceeds that of the hydrogenation metals. This is due to the high oxophilicity of the metals molybdenum, tungsten, and rhenium, which leads to preferential deoxygenation, particularly for high temperatures. Based on the changes in the H/C- and O/C-ratios shown in the pseudo van Krevelen diagram (see Figure 15), it can be assumed that two different processes take place: hydrogenation and deoxygenation. The hydrogenation process is predominantly a ring hydrogenation, which is why the selectivities and yields of the ring hydrogenated products are also considered as a sum in the following.
The pseudo van Krevelen diagram shows the different catalytic trends for the individual metal-silica catalysts, as depicted in Figure 15.
For the molybdenum and tungsten system, a strong deoxygenation to aromatic products is observed, which only slightly changes the H/C-ratio. In contrast, strong hydrogenation is observed for the metals cobalt, nickel and palladium. However, these vary in their activity for deoxygenation reactions, whereby cobalt tends to form cyclohexane, nickel forms cyclohexanol and palladium forms 2-methoxycyclohexanol. The sharp drop in the H/C-ratio for the palladium-silica catalyst can be explained by the strong deactivation during the time on stream. The mechanistic reasons for these trends, shown by the pseudo van Krevelen diagram (Figure 15), are discussed in detail in the following section.

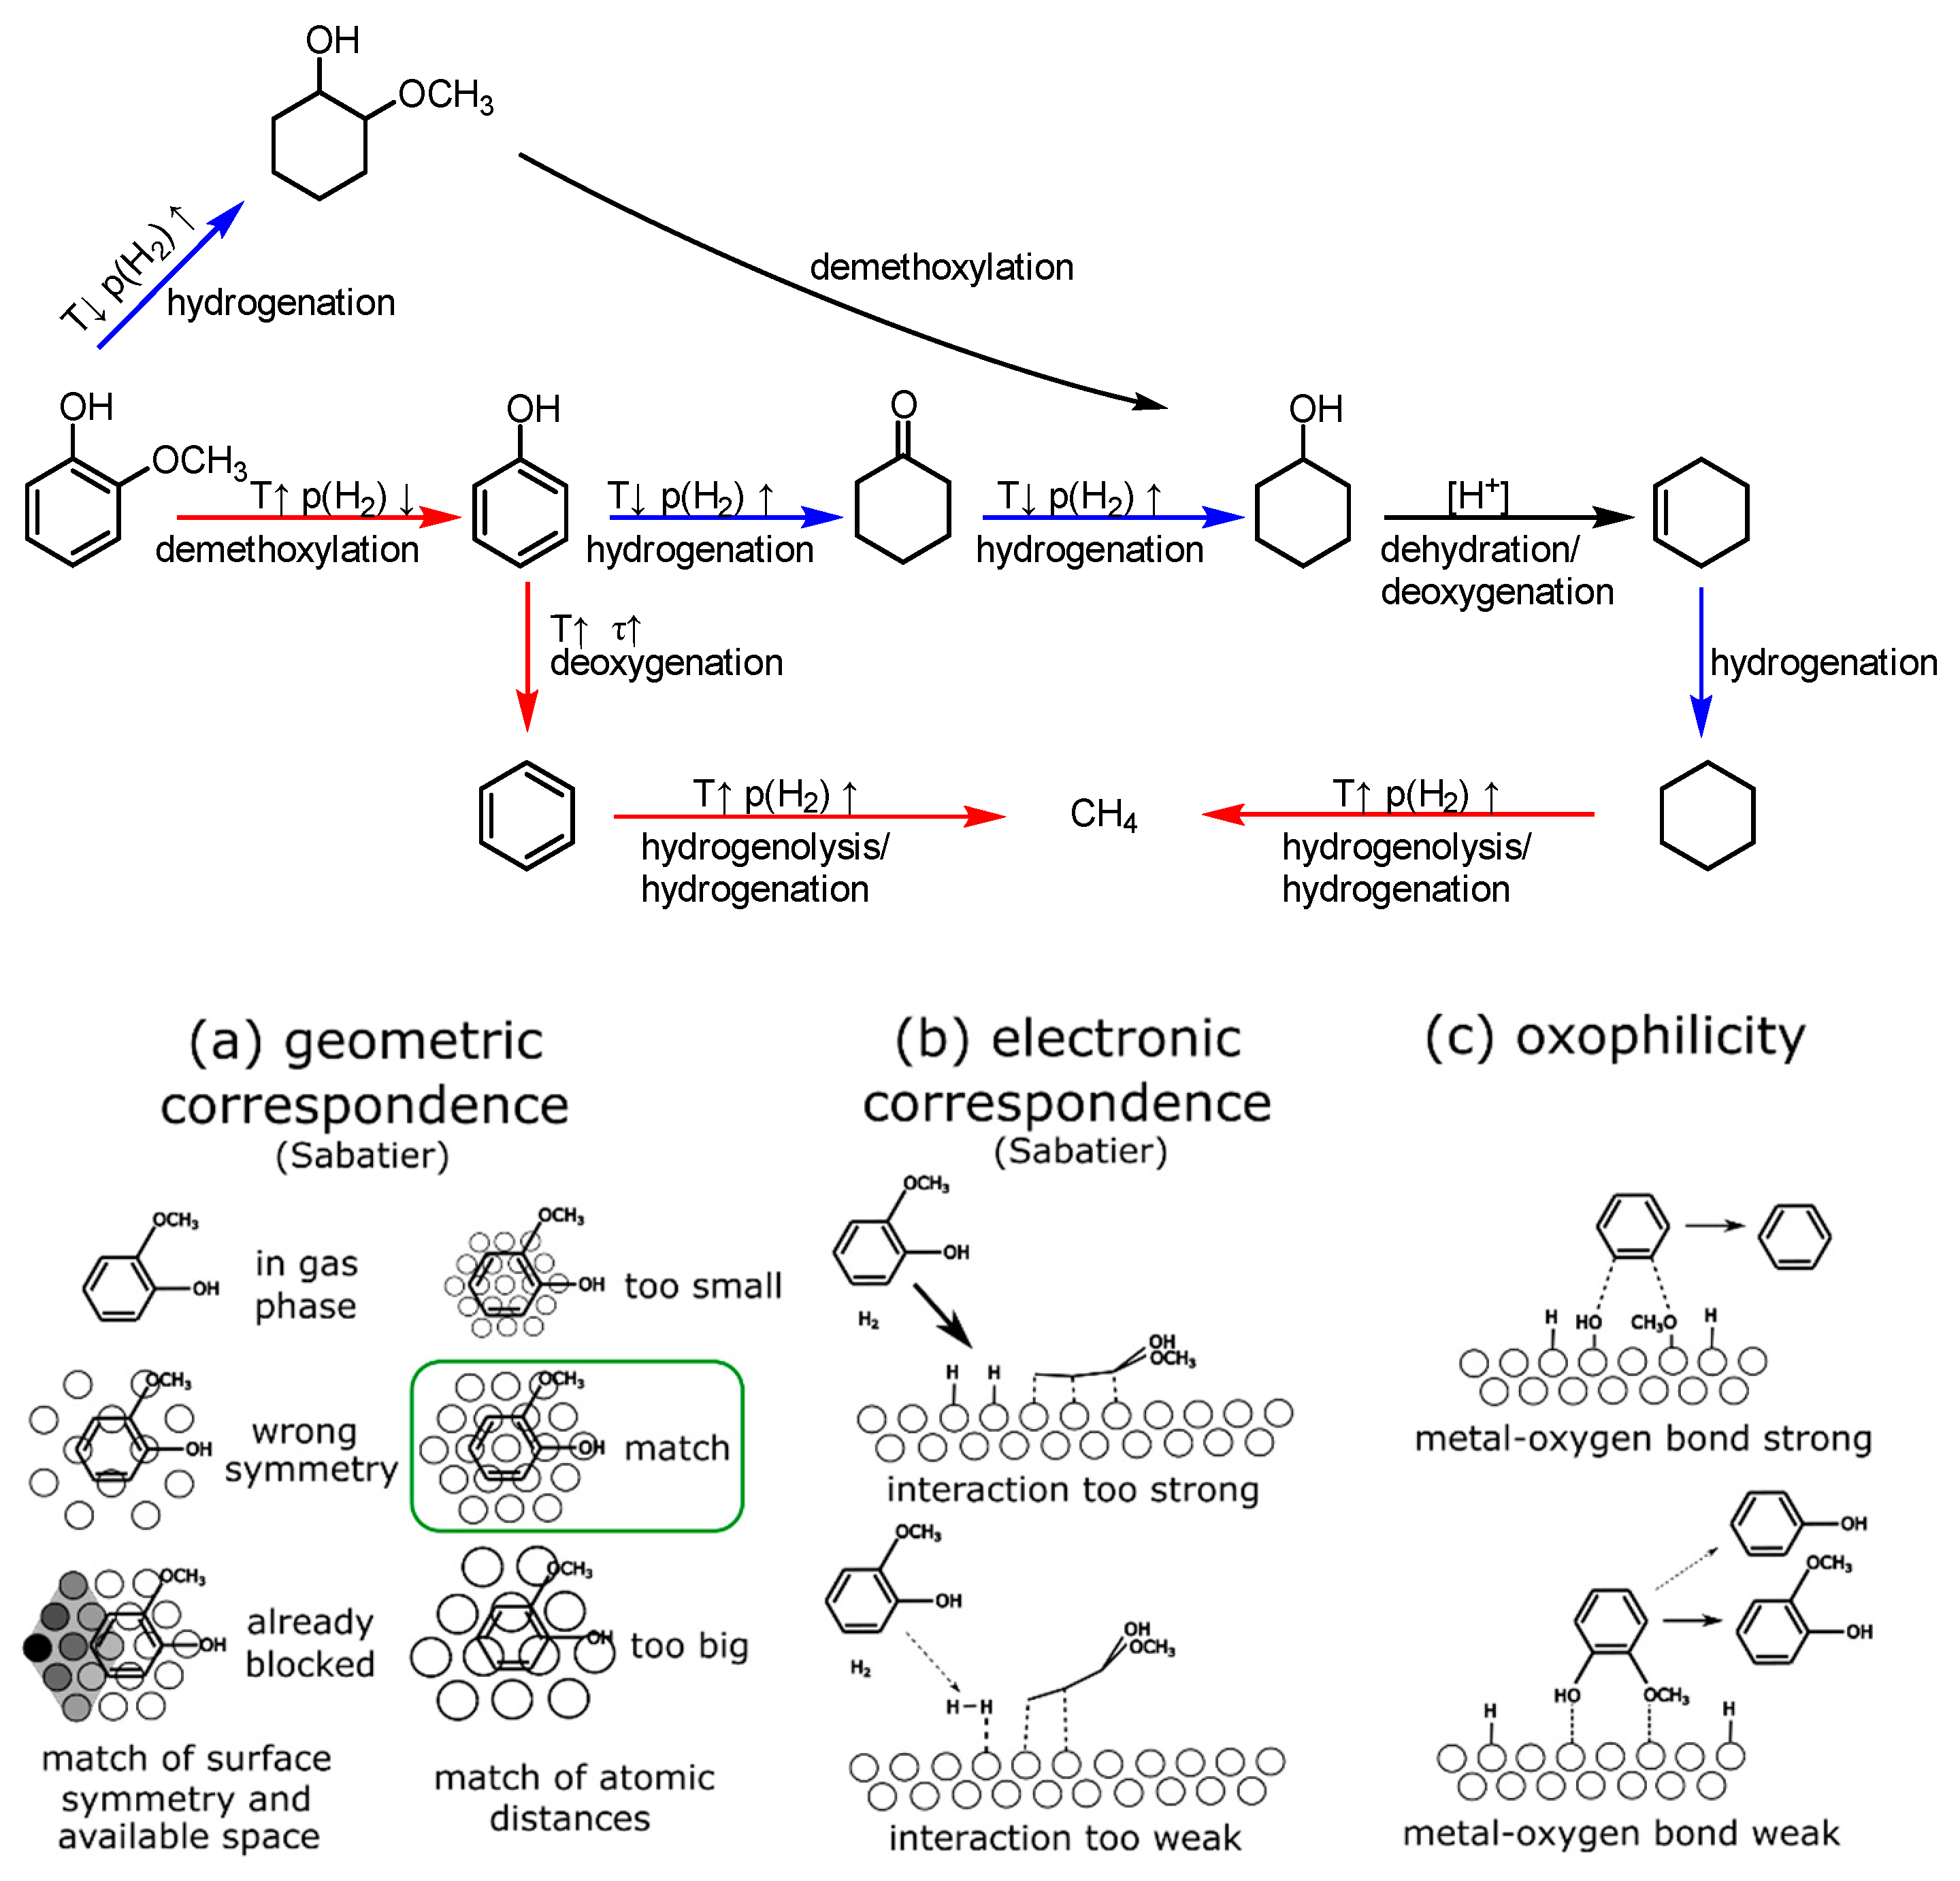
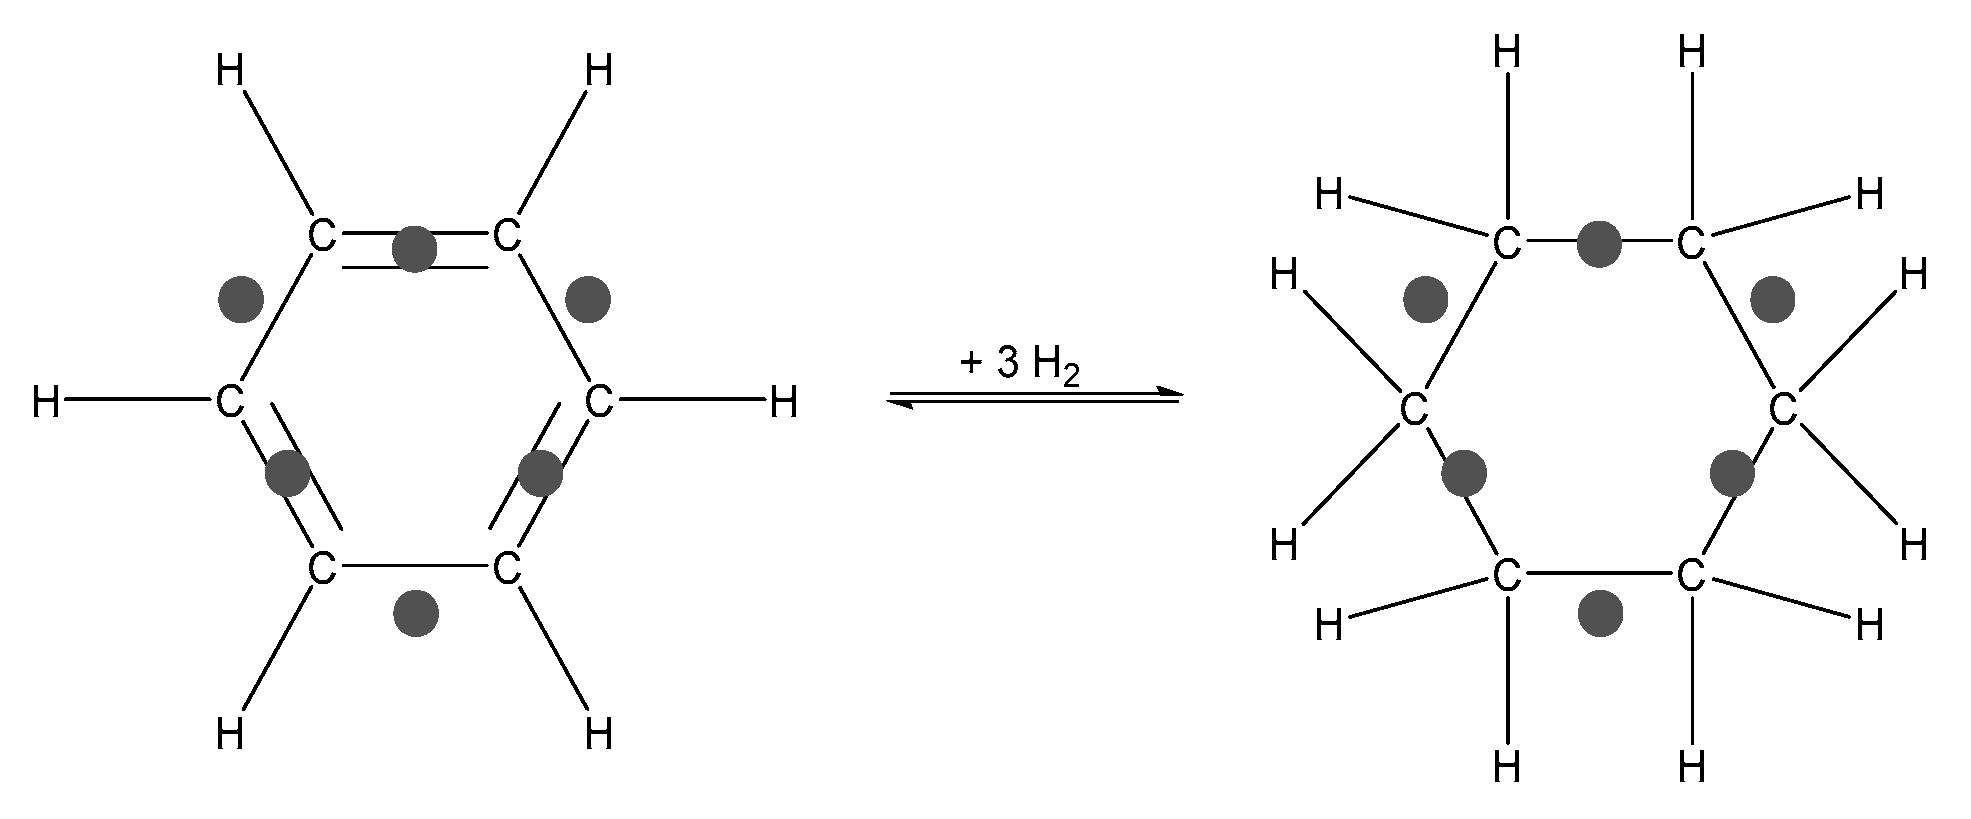
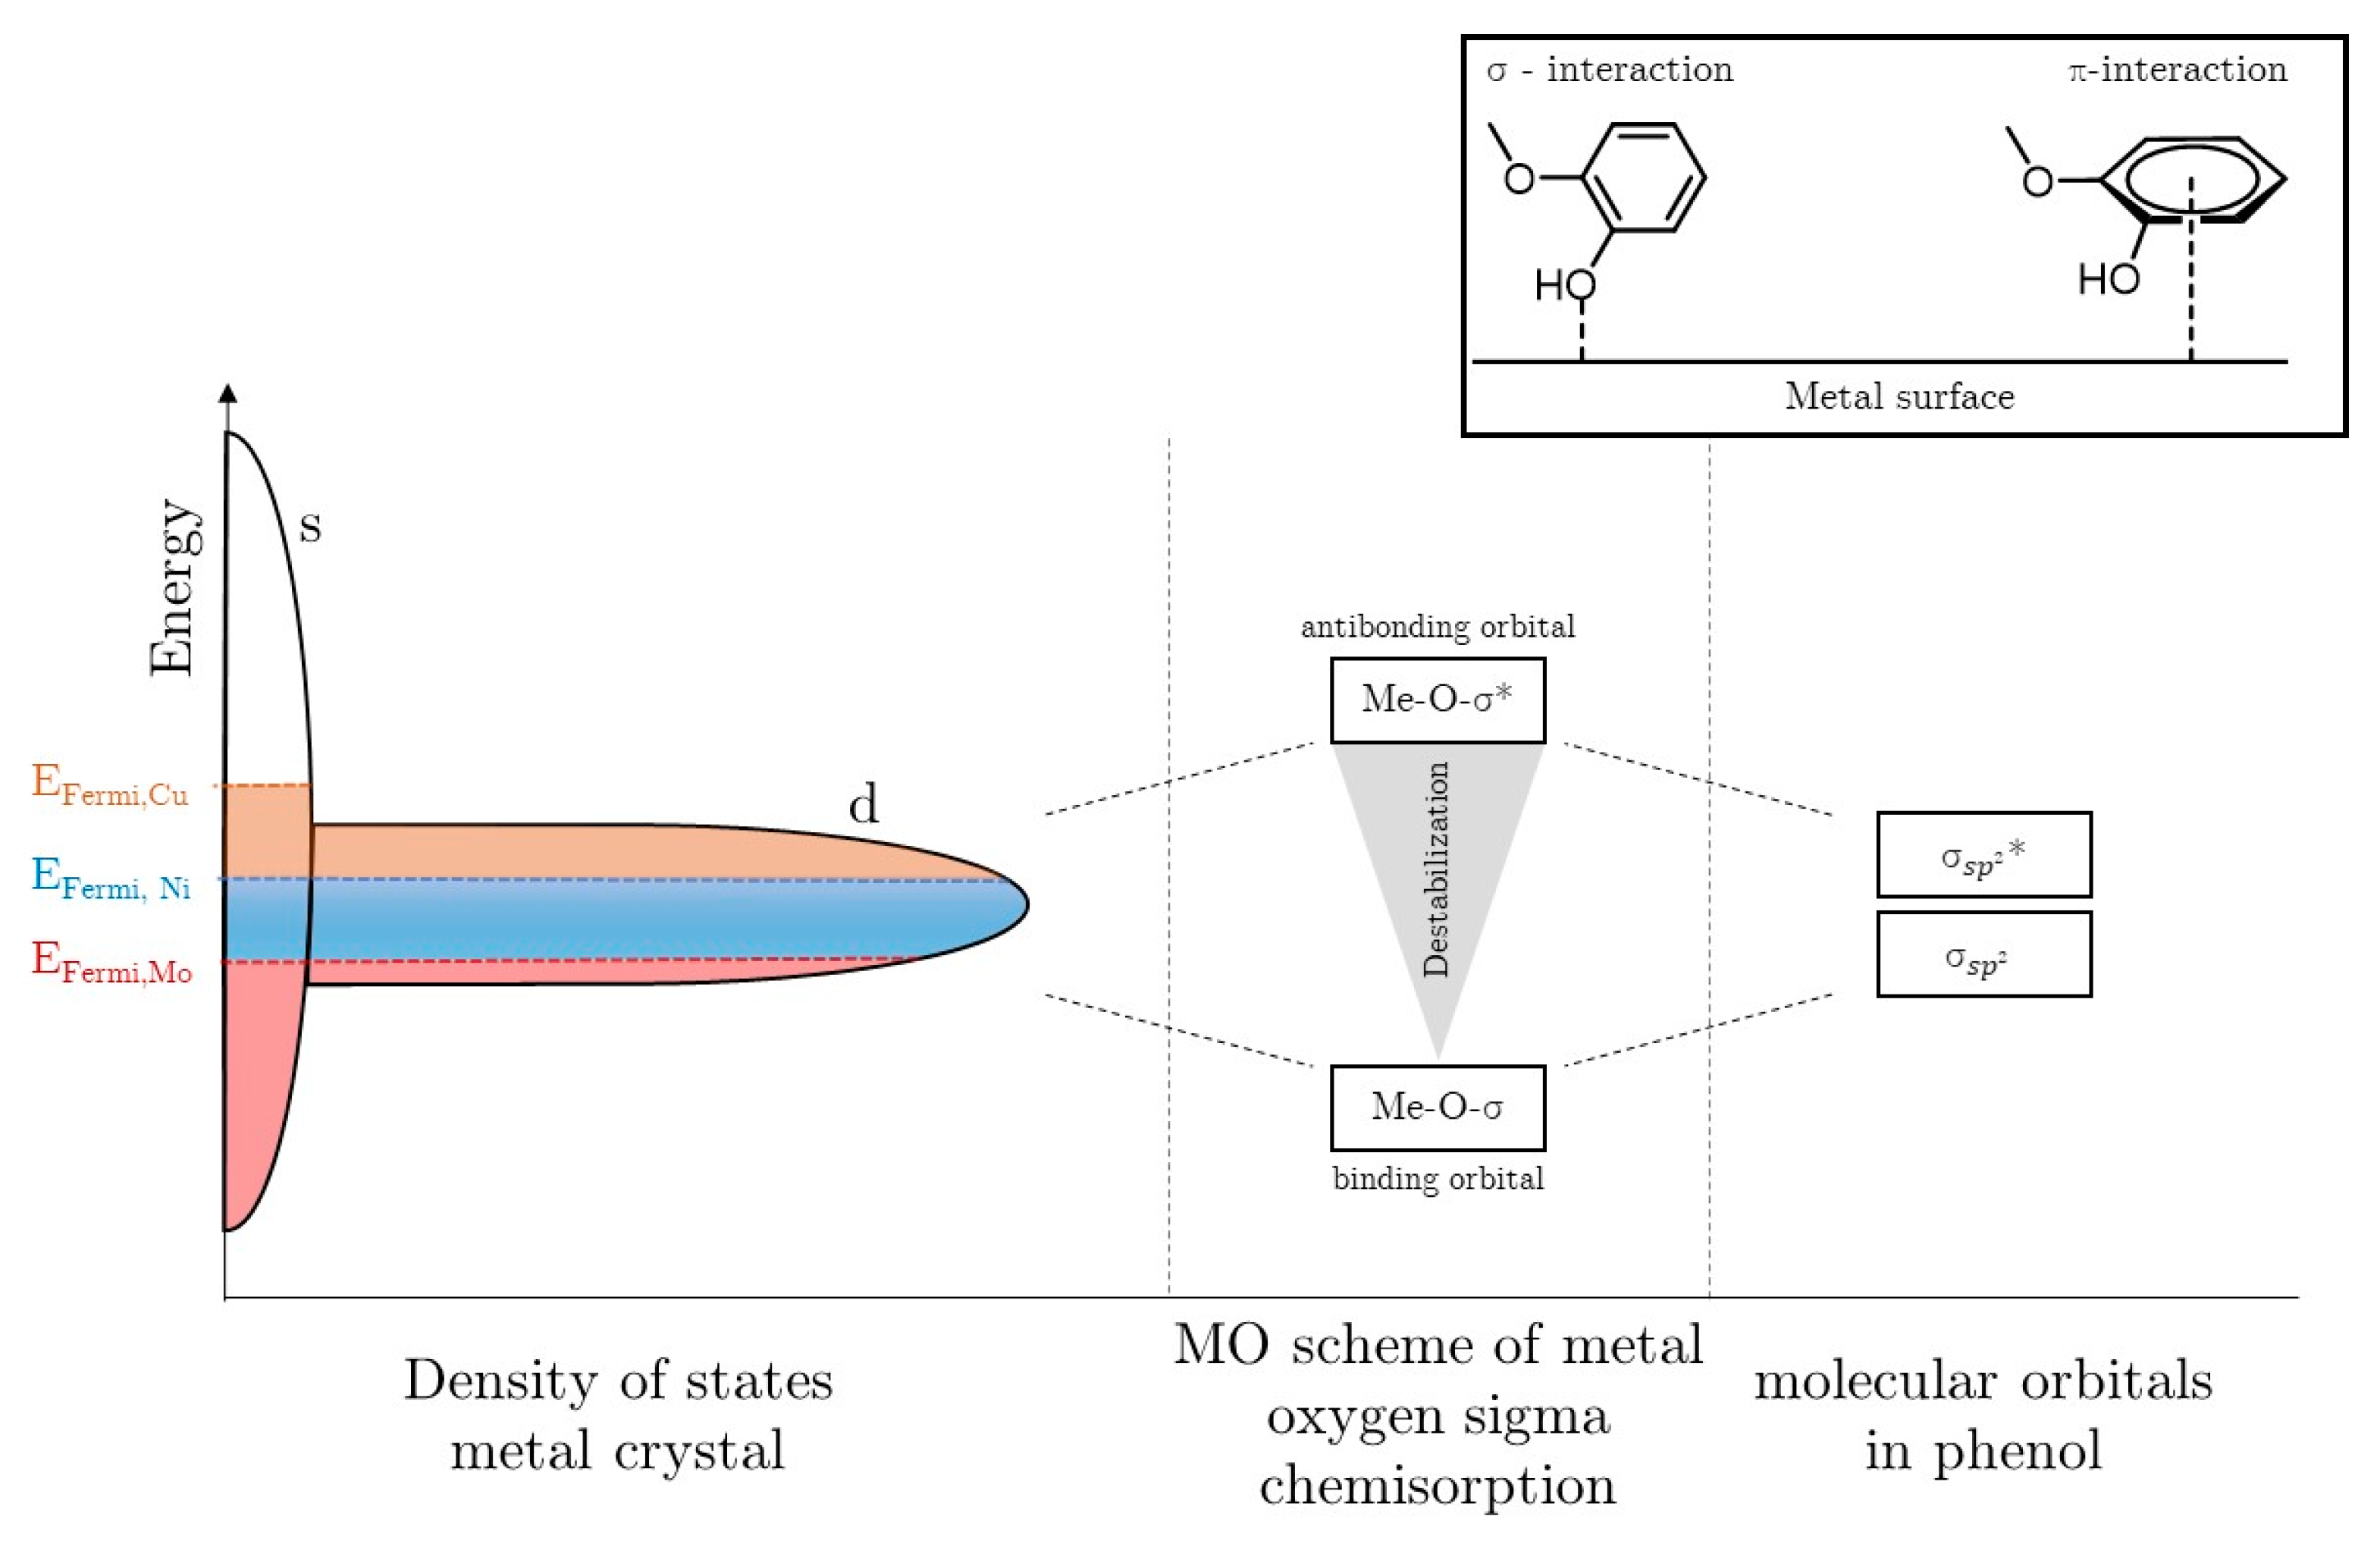
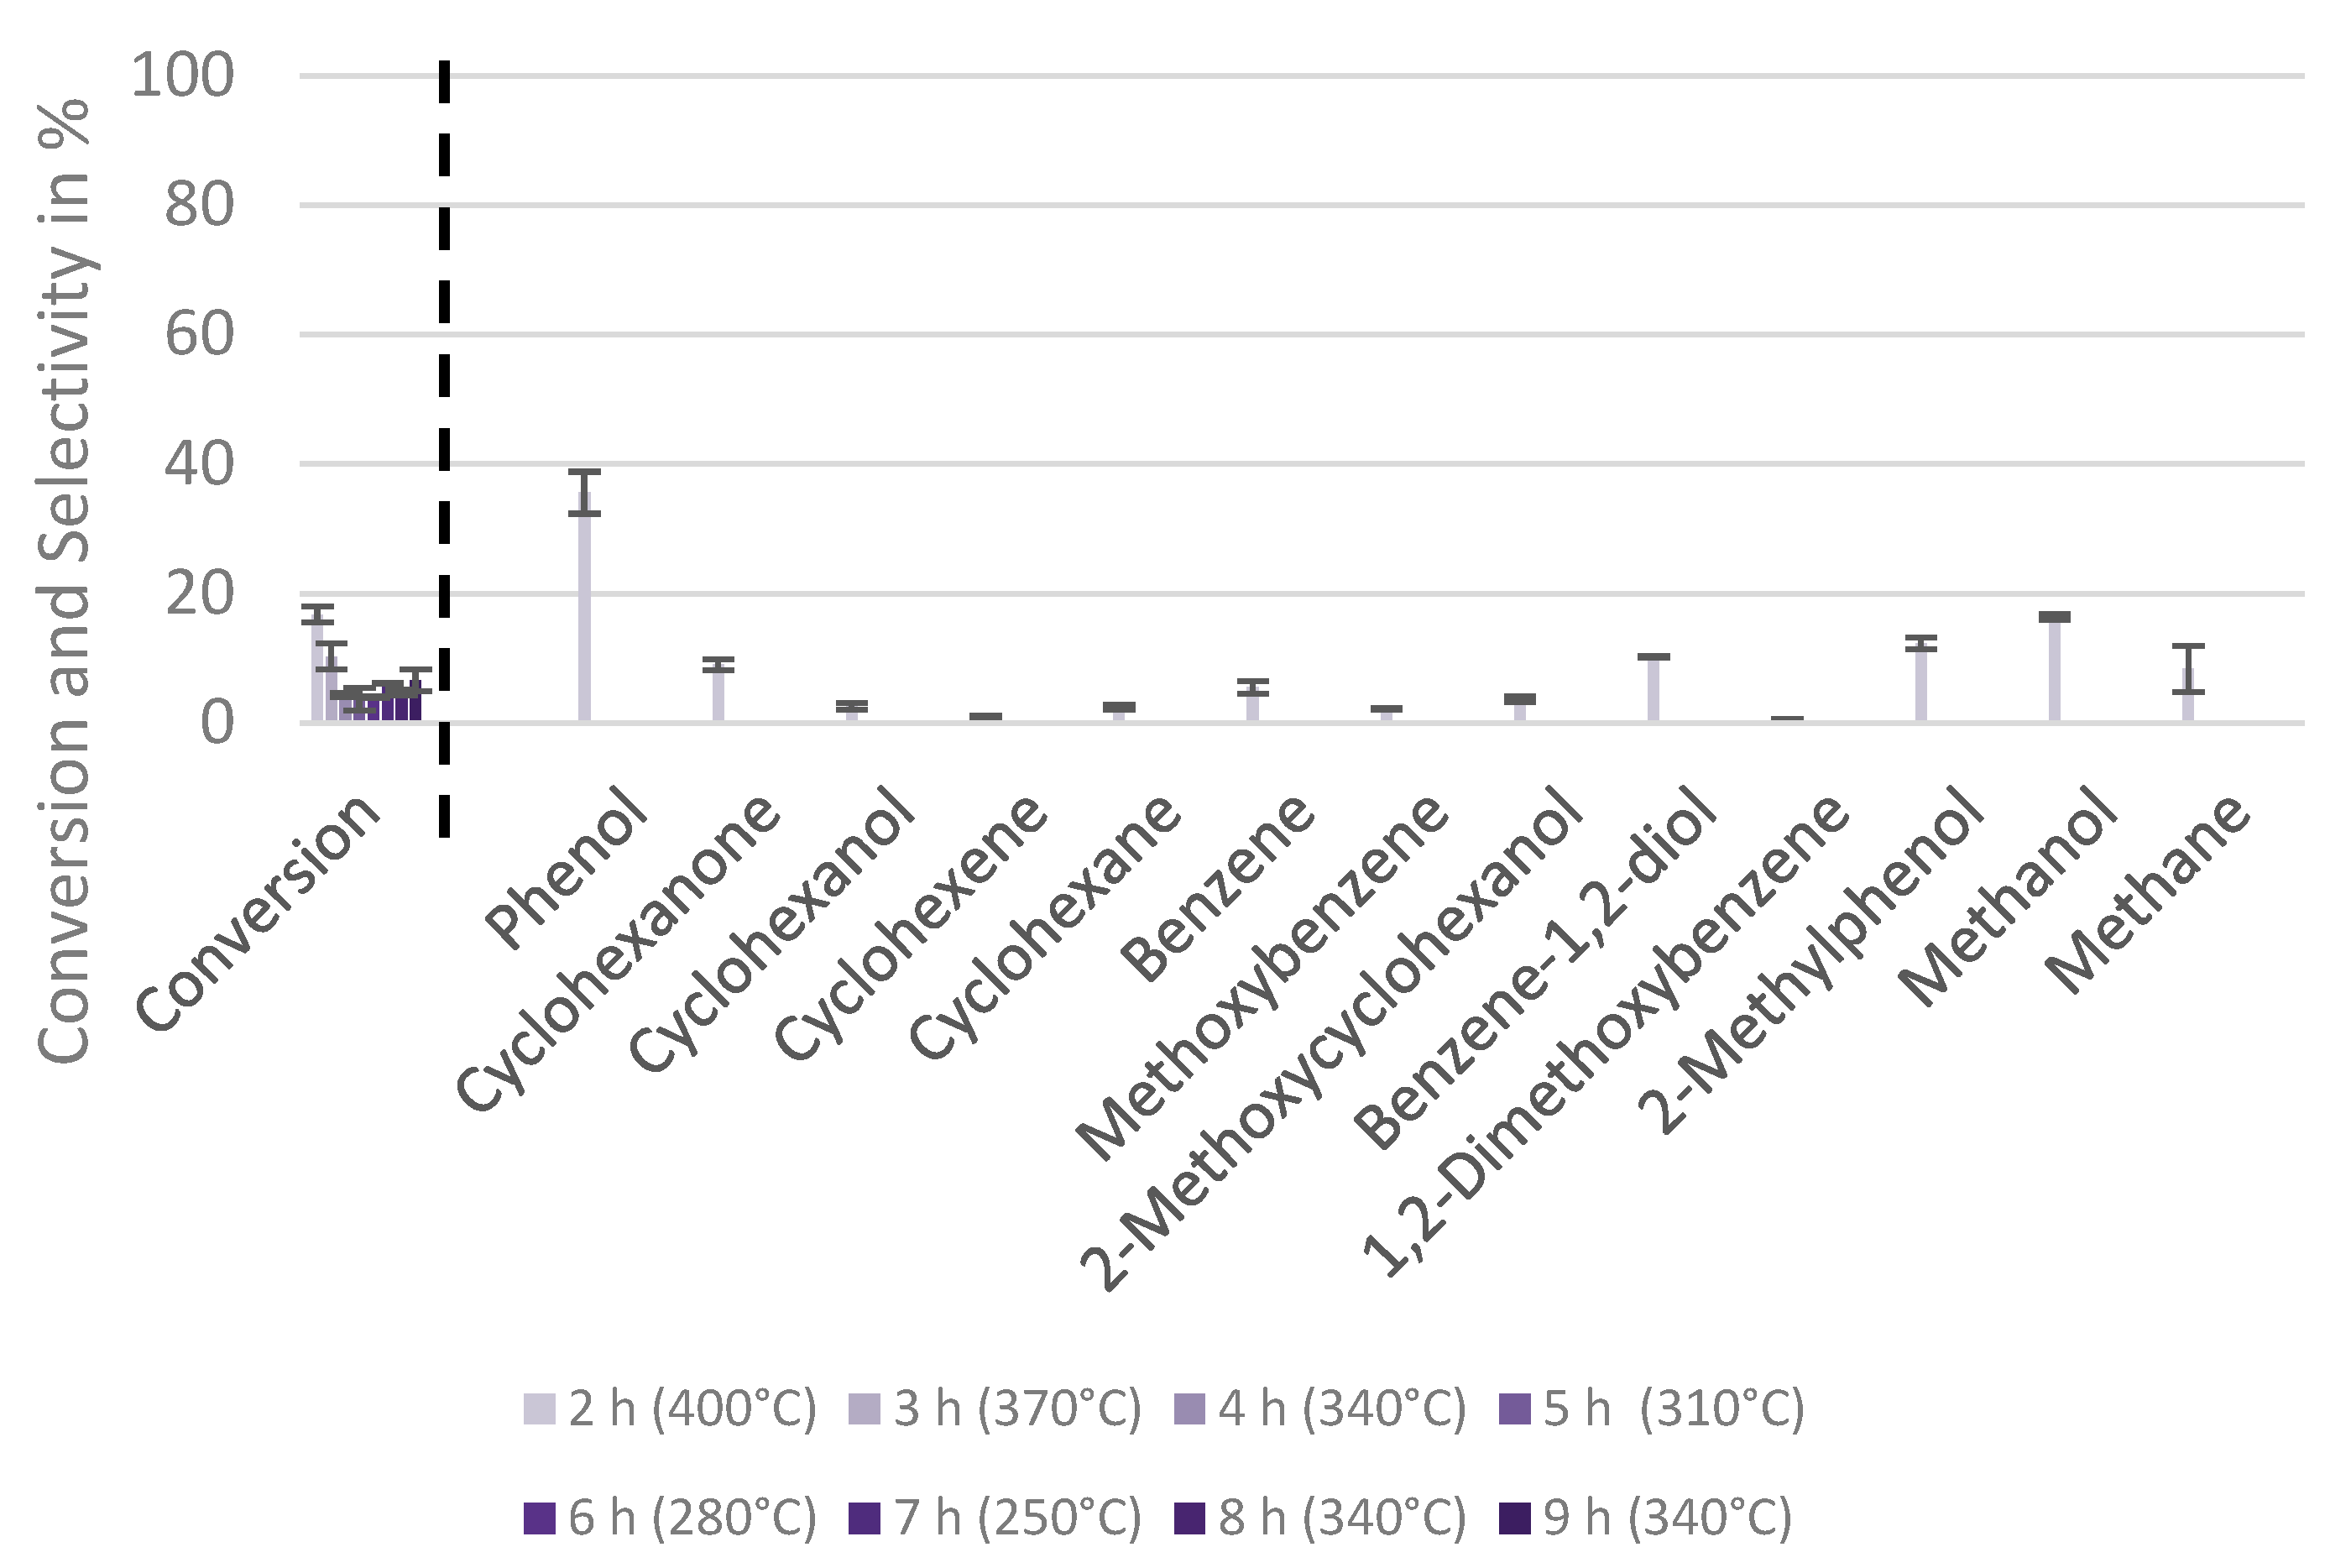
2.4. Mechanistic Conclusions for Hydrogenation, Deoxygenation and Deactivation Processes

The initial investigations now lead to the conclusions for the special conditions which must be given for process sequences of ring hydrogenation, deoxygenation and different types of catalyst deactivation.
Hydrogenation of aromatic rings: Following the multiplet theory developed by Balandin, the high or low tendency for the ring hydrogenation of the elements described can be justified in part based on the presence or absence of a “geometric correspondence” [27]. The multiplet theory assumes that the formation of a reactant-surface complex occurs between the adsorbed reactant and the catalytically active multiplet center [25,27]. The reaction is favored if the arrangement and interatomic distances at the multiplet center (catalyst) match those of the reactant and is therefore referred to as “geometric correspondence”. In the case of the hydrogenation and dehydrogenation of benzene and cyclohexane, respectively, we call this a sextet mechanism due to the number of adsorption centers involved (see Figure 1a and Figure 16).
Figure 17 shows the yield of the ring hydrogenated products at an operating temperature of 250 °C as a function of the shortest interatomic distance and the lattice type of the respective metal loading. Cubic face-centered crystal systems, such as β-Co, Ni, Pt, Pd, Cu, γ-Fe and Ag, and hexagonal crystal systems, such as α-Co, Mg, Re and Zn, have crystal centers with hexagonal symmetry and therefore favor a sextet mechanism. However, hexagonal symmetry is not found in cubic space-centered crystal systems, such as Mo, W, and α-Fe. In addition to the symmetry, the interatomic distance at the multiplet center also affects the interaction of the hydrogen with the sextet complex. Studies for cyclohexane dehydrogenation show that interatomic distances between 0.2492 nm (Ni) and 0.2775 nm (Pt) are suitable. In contrast, larger distances, such as 0.2889 nm (Ag), are not, despite their symmetric correspondence, because the interaction of the hydrogen with the sextet complex is insufficient [25,27].
This explains the high yield of ring hydrogenated products starting from guaiacol when using the hydrogenation metals under consideration, Ni, Co and Pd, but not the low product yield for copper systems (see Figure 17).
Copper has an interatomic distance of 0.2556 nm between Ni and Pt and a face-centered cubic crystal system (hexagonal symmetry). This example shows that geometric correspondence is a necessary, but not a sufficient, criterion for high catalytic ring hydrogenation activity. An associated high selectivity for the products 2-methoxycyclohexanol, cyclohexanol, cyclohexanone and cyclohexane are not observed for the copper-silica system. The reason for this is the low carbon affinity of copper, which was attributed by Vollmer et al., based on DFT calculations of the adsorption of CO on different copper surfaces to the fully occupied d-band and the associated low 2π*-d coupling, which makes the reactant adsorption too weak according to Sabatier’s principle [25,72].
Figure 18 shows the dependence of the yield of the ring hydrogenated products for an operating temperature of 250 °C on the center of the d-band and the lattice type of the metal used. The atomic orbital occupation behaves inversely to the center of the d-band in the metal crystal. A low occupation of the atomic orbitals leads to an energetically higher center of the d-band in the metal crystal. This results in a volcano curve with a maximum for palladium.
The lack of geometric correspondence can explain the low ring hydrogenation activity of α-Fe due to the lack of hexagonal symmetry in the crystal structure. However, the γ-Fe modification, also known as austenite, has a face-centered cubic crystal structure and, therefore, a geometric correspondence for ring hydrogenation. However, this modification only forms above 910 °C and transforms again at lower temperatures [61]. However, the austenite phase can be stabilized by the addition of nickel, carbon, cobalt, manganese, and nitrogen. For example, by adding 50 wt% nickel, it is possible to stabilize the γ-iron modification to temperatures below 400 °C [73]. This also explains the high activity of Fe-Ni catalyst systems in HDO described by Shafaghat et al. [37]. In addition to geometrical correspondence, electronic correspondence is also necessary for ring hydrogenation, which is given for the metals cobalt, nickel, and palladium.
Deoxygenation of functional groups: The tendency towards deoxygenation processes can be justified based on the oxophilicity of the metals used. A high oxygen affinity, i.e., a high oxophilicity, is necessary for these reactions. Based on the “hard and soft acids and bases” (HSAB) concept, oxophilic elements are hard acids and bases. These possess a high charge density and high electronegativity. It has also been shown that oxophilicity is a function of the center of the d-band [74,75]. The correlation of the oxophilicity from the center of the d-band, according to the d-band model of Hammer and Nørskov, can be justified by the lower electron density in the antibonding metal-oxygen orbital [33,34,76]. The higher the center of the d-band is energetically and, thus, the closer it approaches the Fermi energy (0 eV), the higher the distance to the antibonding metal-oxygen orbital, resulting in a lower electron density in the latter and a concomitant increase in the metal-oxygen bond strength (see Figure 19) [74,77].
Based on the change in the O/C ratios (see Figure 14), deoxygenation processes are promoted by higher temperatures. The formation of oxygen-deficient/aromatic products predominates. For this reason, Figure 20 shows the yield of the low-oxygen/free-aromatic products at a reaction temperature of 400 °C as a function of the center of the d-band. The trend expected based on oxophilicity is shown, according to which the yields of the deoxygenated aromatic products decrease as the center of the d-band decreases, i.e., as the d-band becomes increasingly filled.
Coke formation as the cause of catalyst deactivation: Figure 21 compares the conversion curves at 340 °C after 5 h ToS and 9 h ToS. A clear deactivation, i.e., decreased activity, is observed for the cobalt, nickel and palladium silica catalyst systems. In contrast, the activity of the molybdenum- and tungsten-silica systems increases after 9 h of ToS. This can be attributed, for example, to a non-selective aging, i.e., a slow formation of the reactive hydrocarbon intermediates or the further reduction in the MOx species (in particular, M = Mo, W). In the case of incompletely reduced molybdenum oxide species, the slight acidic functionality can also support coke formation at a higher temperature (compare Figure 10).
The deactivation and associated lower activity observed for the cobalt, nickel, and palladium-silica systems may be due to the coking, sintering, poisoning, and leaching of the active species [23,78,79,80,81]. Sintering can be ruled out as the main cause of deactivation based on the comparison of the PXRD measurements of the catalyst materials before and after catalysis. For example, the estimation based on the Scherrer equation indicates a constant metal particle size for the nickel-silica catalyst system, of about 20 nm [64]. Therefore, consistent with the literature, the most likely cause of deactivation is thermal polymerization at the catalyst’s surface, which is characteristic of bio-oils and particularly occurs above the guaiacol ignition temperature of 385 °C [23,50]. To test this hypothesis, a test measurement was performed for the most deactivating system, the palladium-silica catalyst material, using a reversed temperature profile, i.e., starting at 400 °C and decreasing to 250 °C (see Appendix A Figure A11).
For the reverse, when decreasing the temperature profile, a lower activity (conversion 17%) was observed already after 2 h ToS (T = 400 °C) than for the standard temperature profile after 7 h ToS (T = 400 °C; conversion 32%). This is due to the strong deactivation already occurring during the run-in phase (ToS 1 h). The hypothesis that the deactivation of the catalyst is due to the coking and, thus, the blocking of the active sites is also supported by the comparable coke content with respect to the catalyst mass after the reversed temperature profile (10.64 ± 0.02%) compared to the standard temperature profile (10.19 ± 0.02%).
The coke deposits after the test measurements were therefore examined by CHNS analysis. Figure 22 shows the hydrogen and carbon mass fractions of the different metal-silica systems. With the increasing carbon content, the hydrogen content also increases, whereby it can be assumed that although the amount of coke deposition differs depending on the catalyst system used, its composition in terms of carbon and hydrogen remains almost constant. The molar H/C ratios also indicate that the coke deposits are aromatic.
As the composition of the coke deposits on different catalyst samples does not differ significantly, the sum of the carbon and hydrogen mass fractions is summarized below as the coke fraction. Compared to the unloaded supporting material (11.9%), the coke formation for metal-loaded-materials is reduced by hydrogenating- (Ni 4.9%) or deoxygenating- (Mo 4.3%) catalyst systems (see Figure 23).

3. Conclusions

This study aimed to investigate the catalytic properties of different metals on commercially available inert silica support in a screening survey. The focus was on the different d-band occupation and the crystal structure of the selected metals of subgroups 6 (d4) to 11 (d9). It was shown for ring hydrogenation that a geometrical correspondence, i.e., a hexagonal symmetry with an optimal atomic spacing, in combination with an energetic correspondence, i.e., a not fully occupied d-shell, are necessary. For the deoxygenation prevailing at high temperatures, there is a dependence of the product selectivity of the aromatic products on the center of the d-band, which correlates with the oxophilicity. The catalyst deactivation processes are mainly attributed to coke formation, which occurs for low-active hydrogenation catalysts at temperatures above 385 °C, the flash point of guaiacol.
Everything considered, there are three groups of metals: (i) those which are less active (Ag, α-Fe); (ii) those which show high activity for hydrogenation (β-Co, Ni, Pd); (iii) those which preferably promote deoxygenation (Mo, W, Re, Cu). With respect to group (ii), due to its higher oxophilicity than nickel, cobalt tends to undergo complete deoxygenation with the formation of cyclohexene and cyclohexane. In contrast, due to the high ring hydrogenation activity and the simultaneously low oxophilicity of palladium, almost no deoxygenation occurs, resulting in the preferential formation of 2-methoxycyclohexanol. Due to the geometric and energetic correspondence for selective ring hydrogenation and the moderate oxophilicity, nickel is, therefore, a good choice for converting guaiacol to incompletely deoxygenated products, such as cyclohexanol and cyclohexanone.
In consideration of the arrangement of the surface, atoms (geometric or steric factor) and the interaction strength, reactant-surface (energetic factor), are of particular importance in catalysis. Although some correlations of catalytic activity with the center of the d-band are already presented in the literature, to the best of our knowledge, systematic studies of the combined electronic and geometric influence of a large variety of different metals on the HDO of bio-oils are missing. There is also a lack of continuous operation studies in the literature, which are the first step toward a scalable economic application. The fundamental insights presented in this paper enable the systematic development of new efficient catalyst systems and allow a precise prediction of the expected product selectivity.

4. Materials and Methods

Thermogravimetric analysis (TGA): TGA was performed on a Mettler Toledo system consisting of a TC15-TA controller, an MT5 precision balance and a TG50 oven and balance (Columbus, OH, USA). TGA was used to determine the water content (35 °C to 300 °C, 10 K/min, nitrogen), which is defined as the weight loss from 35 °C to 250 °C. The mass used is corrected for this water content in all of the quantitative analysis methods. Further heating was used to determine the amount of coke (35 °C to 850 °C, 10 K/min, compressed air).
Powder X-Ray diffraction (P-XRD): The crystallographic investigations were carried out on STOE’s STADI-P powder diffractometer with Dectris Mythen 1K detector (Darmstadt, Germany). All measurements are made with Cu-Kα1 X-Rays (λ = 0.154060 nm), an accelerating voltage of 40 kV, a working current of 40 mA in the measurement interval from 3.00 to 96.45° 2θ with a step size of 1.005° 2θ resulting in a resolution of 0.015° 2θ and an exposure time of 30 seconds per step. For the background correction of the diffractograms, the software WinXPow (Version 3.06) from STOE was used. Comparison with the reference diffractograms is performed in MATCH! using the COD-Inorg REV189751 (Version 2017.01.03) database [82]. The crystallite size (L) calculation is based on the Scherrer equation.
Temperature-programmed reduction and oxidation (TPROR): The reductive and oxidative properties of the catalyst samples are investigated on the “TPDRO 1100 Series” from Thermo Scientific (Waltham, MA, USA). For this purpose, approximately 150 mg of the sample is weighed between two balls of quartz absorbent cotton in a quartz glass reactor and installed in the reactor. Before the measurement at the analysis port, the sample is calcined at the preparation port under argon up to the maximum temperature used in the subsequent TPR and TPO measurement (600 °C). The measurement of a TPR, a TPO and a second TPR, from now on referred to as TPROR, is performed until 600 °C each with 10% H2 in Ar for TPR and 5% O2 in He for TPO. The water produced during the TPR measurement is removed with a molecular sieve before TCD.
Hydrogen pulse chemisorption: Hydrogen pulse chemisorption is performed following the TPROR measurements up to 600 °C for the nickel and palladium silica catalyst to mimic the conditions after pretreatment in the catalyst testing unit. The remaining hydrogen is desorbed first with argon at 600 °C for 1 h before. Subsequently, pulse chemisorption is performed at 40 °C with 10% hydrogen in argon as pulse gas. The dispersity is calculated based on the hydrogen consumed.
Temperature-programmed ammonia desorption (TPAD): The amount and strength of acid sites is also determined on the TPDRO 1100 from Mettler Toledo (Waltham, MA, USA). Approximately 150 mg of catalyst were used for all measurements. After a calcination step up to 250 °C under argon for 1 h, pure ammonia (ammonia 3.8) is adsorbed at 120 °C for 10 min. After flushing with pure helium (helium 5.0) for 5 h, the measurement is carried out at 10 K/min up to 550 °C with a dwell of 1 h. The desorbed gas is measured at a TCD. The calibration of the signal is conducted by repeated direct injection over a sample loop of a defined volume, whereby the calibration factor 7.353 × 10⁻⁷ mmol(NH3)/(mV∙s) was determined.
Physisorption of nitrogen: The measurements were carried out on the Thermo Scientific “Surfer” (Waltham, MA, USA) to determine the isotherms, the specific surface area according to B.E.T., the BJH pore volume and the mesopore surface area using the t-plot (Lippens and de Boer) [46,47,83]. For this purpose, approximately 150 mg of the sample is degassed under high vacuum at 250 °C. The measurement is performed under isothermal conditions. The measurement is carried out under isothermal conditions at −196 °C by cooling with liquid nitrogen. The nitrogen partial pressure is varied to record the adsorption and desorption isotherms. The evaluation is performed using the software “Advanced Data Processing 6.24—12/10/2016”.
Elementary analysis (CHNS): The elementary analysis is routinely used for the coke determination of the catalysts after the catalytic test measurements. The measurement is carried out on the “Vario MICRO CUBE” from Elementar (Langenselbold, Germany). For this purpose, approx. 5 to 10 mg of the sample is weighed into a tin boat in triple determination and burned at 1150 °C for 70 s under oxygen. Through the chromatographic separation and quantification of the gases produced, the carbon and hydrogen content of the catalyst is determined before and after the catalytic test.
Scanning electron microscopy (SEM): The SEM measurements to investigate the morphology of the samples were carried out on the scanning electron microscope SU8020 (Hitachi High-Tech Europe GmbH, Krefeld, Germany). For this purpose, the samples are dried at 200 °C and fixed on a carbon support after cooling. Subsequently, the gold-coated sample is measured in high vacuum at an accelerating voltage of 2 kV with a maximum magnification of 8000.
Catalyst preparation: The impregnation of the carrier materials was carried out with various water-soluble metal precursors (see Table A3 in the Appendix B). As standard, 20 g of catalyst are produced per batch. The amount of metal salt is calculated considering the target metal content. The mass of the support material used is corrected for the water content determined by TGA. For the calcination, the standard temperature profile according to Table 2 is used. Impregnation according to the incipient wetness method is carried out through the dropwise addition of metal salt solution to the carrier material under mortar. According to the desired loading, the required amount of metal salt is dissolved in 10 mL ultrapure water per 20 g catalyst. The solution is tempered to 60 °C for 30 min. Finally, the water is removed step by step on the rotary evaporator. The chemicals used are listed in the Appendix B Table A3.
Catalytic tests: All measurements were performed on a continuously operating fixed bed reactor designed by TU Dresden (Inorganic Molecular Chemistry, Dresden, Germany) with automation support by Amtech GmbH (Chemnitz, Germany). For each catalytic test measurement, the reactor is loaded with 0.5 g (dry mass) of catalyst (315–400 µm) between two spheres of 0.1 g quartz wool each. Empty reactor measurements without catalyst loading are performed with quartz wool. Before each catalytic test, a pressure test is performed at 5 bar(g) above the planned reaction pressure. The criterion for a successful pressure test is that the pressure drop must be below the detectable limit of 0.05 bar over a test period of at least 60 min. After a successful pressure test, a defined pretreatment program is used for all catalytic test measurements (see Table 3).
The following measurement parameters are defined as the standard conditions for all measurements. Deviations from these standard conditions are declared accordingly. The isothermal catalytic test measurements are performed over 5 h and 24 h ToS, respectively. For the preliminary investigations on the influence of the catalytic properties of different metals, a temperature profile from 250 °C to 400 °C is used (see Table 4).
The gaseous products are analyzed online by gas chromatography (Clarus 590 from PerkinElmer, column DB-1, 100 m, ID: 0.25 mm, DF: 0.5 µm, Waltham, MA, USA). The liquid products are collected hourly, weighed and analyzed by gas chromatography. The determination of the response factors and retention indices has recently been published by us [84]. The coke content is determined by CHNS analysis.

Author Contributions

Conceptualization, N.K. and M.S.; methodology, N.K.; validation, N.K., M.S. and O.B.; formal analysis, N.K.; investigation, N.K.; resources, M.S. and N.K.; data curation, N.K.; writing—original draft preparation, N.K. and M.S.; writing—review and editing, O.B.; visualization, N.K. and M.S.; supervision, M.S. and O.B.; project administration, M.S.; funding acquisition, N.K. and M.S. All authors have read and agreed to the published version of the manuscript.

Funding

This research was supported by Chair of Inorganic Molecular Chemistry (TU Dresden) by Jan J. Weigand. The first author’s work was further funded by the Federal State of Saxony (Germany) through the Saxon State Scholarship Program. The corresponding author thanks German Research Foundation (DFG) for funding of project SE2450/2-1 (Nbr. 507997100).

Institutional Review Board Statement

Not applicable.

Data Availability Statement

The raw data of the analytics and catalytic tests can be provided by the author upon reasonable request.

Acknowledgments

The authors thank DI Nicole Herold, Mathias Hauck, Liane Andrea Haufe and Clemens Jonscher for support with materials characterization. The authors thank Thomas Doert and Michael Ruck for access to X-ray related infrastructure. Moreover, the authors gratefully thank Jan J. Weigand.

Conflicts of Interest

The authors declare no conflict of interest.

Appendix A

Additional diagrams for materials characterization and catalytic tests are illustrated in the Figures below.
Figure A1. Results of TPROR measurements of the silica carrier material Aerosil380, 40 °C to 600 °C; total hydrogen consumption of 0.08 mmol(H2)/g.
Catalysts 13 00425 g0a1
Figure A2. P-XRD of calcined molybdenum catalyst before reaction (calc.) and after reaction.
Catalysts 13 00425 g0a2
Figure A3. P-XRD of calcined tungsten catalyst before reaction (calc.) and after reaction.
Catalysts 13 00425 g0a3
Figure A4. P-XRD of calcined iron catalyst before reaction (calc.) and after reaction.
Catalysts 13 00425 g0a4
Figure A5. P-XRD of calcined rhenium catalyst before reaction (calc.) and after reaction.
Catalysts 13 00425 g0a5
Figure A6. P-XRD of calcined cobalt catalyst before reaction (calc.) and after reaction.
Catalysts 13 00425 g0a6
Figure A7. P-XRD of calcined nickel catalyst before reaction (calc.) and after reaction.
Catalysts 13 00425 g0a7
Figure A8. P-XRD of calcined palladium catalyst before reaction (calc.) and after reaction.
Catalysts 13 00425 g0a8
Figure A9. P-XRD of calcined copper catalyst before reaction (calc.) and after reaction.
Catalysts 13 00425 g0a9
Figure A10. P-XRD of calcined silver catalyst before reaction (calc.) and after reaction.
Catalysts 13 00425 g0a10
Figure A11. Conversion and selectivities of the test measurement with reversed temperature profile of the palladium-silica catalyst material. Selectivities for conversions < 15% (Tos 3h to 9h) are not shown for accuracy. Coke fraction = 10.64 ± 0.02%.
Catalysts 13 00425 g0a11

Appendix B

The literature research revealed different geometric and electronic properties of the metals used in this survey. Please find below a summary in Table A1 and Table A2.
Table A1. Summary of substance data of the d-metals used—Part 1.
MetalElectron Configuration of Isolated AtomMetal Crystal Band Lineup [25]Minimum Energy Configuration [85]Center of the d-Band [76] in eVD-Character [25]
in % [a]
One-Electron Orbital Energy [85]
CalculationsSpectroscopy
sdsd
Mo4d55s1-4d4,6185s1,7350.35430.44210.67000.5320.672
W4f145d46s2-5d46s20.77430.53080.57760.6210.557
Re4f145d56s2-5d5,1276s1,873−0.51460.54850.66910.6260.644
Fe3d64s23d7,054s0,953d6,3704s1,630−0.9239.70.49831.02420.58120.8567
Co3d74s23d8,254s0,753d7,4254s1,575−1.1739.50.51041.07810.5950.891
Ni3d84s23d9,454s0,553d8,4694s1,531−1.29400.52251.13320.60450.9503
Pd4d104d9,645s0,364d9,6675s0,333−1.83460.41290.74780.54660.7041
Cu3d104s13d104s13d9,5114s1,1489−2.67-0.53401.18490.61920.9897
Ag4d105s14d105s14d105s1−4.30-0.47371.02280.55690.9394
[a]: corresponds to the d-orbital portion that contributes to the formation of the conduction band in the metal crystal.
Table A2. Summary of substance data of the d-metals used—Part 2.
MetalCovalent Radius [25,63,68] in nmLattice Type [25,60,68]Shortest Atomic Distances [25]
in nm
Bond Energy [86,87,88]
M-O
in eV
M-C
in eV
M-H
in eV
Mo0.1363cubic space centered0.27251−4.73-−2.30
W0.1370cubic space centered0.27409−5.64−8.59−3.30
Re0.1371hexagonal tightest packing0.2741; 0.2760 [a]−4.94-−2.91
α-Fe0.1241cubic space centered [b]0.24823−5.55−8.02−2.91
γ-Fe-cubic face centered [b]-−5.55−8.02−2.91
α-Co0.1253hexagonal tightest packing [c]0.25061−5.58−6.73−2.43
β-Co-cubic face centered [c]-−5.58−6.73−2.43
Ni0.1246cubic face centered0.24916−5.46−6.46−2.52
Pd0.1376cubic face centered0.27511−3.60−5.07−1.73
Cu0.132cubic face centered0.25560−4.73-−2.43
Ag0.145cubic face centered0.28894−3.64-−2.04
[a]: hexagonal tightest sphere packings have two sphere layers A and B, for which the shortest atomic distance need not be identical; [b]: under the selected pretreatment and reaction conditions, iron is present in the α-modification; [c]: under the selected pretreatment and reaction conditions, cobalt is present in the β-modification.
Table A3. Overview of the chemicals used for syntheses with their purity and manufacturer.
ChemicalsFormulaPurityManufacturer
Nickel(II)-nitrate-hexahydrateNi(NO3)2 · 6 H2O99%Acros Organics (Geel, Belgium)
Iron (III)-nitrate-nonahydrateFe(NO3)3·9 H2O>99%Acros Organics (Geel, Belgium)
Cobalt(II)-nitrate-hexahydrateCo(NO3)2·6 H2O99%Acros Organics (Geel, Belgium)
Ammoniumheptamolybdate-tetrahydrate(NH4)6Mo7O24·4 H2O99%Merck (Darmstadt, Germany)
SilvernitrateAg(NO3)>99.9Thermo Fisher Scientific (Waltham, MA, USA)
AmmoniumperrhenateNH4ReO4>99.9%Thermo Fisher Scientific (Waltham, MA, USA)
Palladiumnitrate-dihydratePd(NO3)2·2 H2O>99%Thermo Fisher Scientific (Waltham, MA, USA)
Ammoniumparawolframate-tetrahydrate(NH4)10(H2W12O42)
·4H2O
>99%Merck (Darmstadt, Germany)
Copper(II)-nitrate-trihydrateCu(NO3)2·3 H2O>99%Fluka (St. Gallen, Switzerland)
Aerosil380SiO2>99.8%Evonik (Essen, Germany)
HZSM-5 (HCZP 27)H+x[(AlO2)x(SiO2)y]-Clariant (Gendorf, Germany)

References

  1. Tran, N.; Uemura, Y.; Trinh, T.; Ramli, A. Hydrodeoxygenation of Guaiacol over Pd–Co and Pd–Fe Catalysts: Deactivation and Regeneration. Processes 2021, 9, 430. [Google Scholar] [CrossRef]
  2. Zhou, H.; Wang, H.; Perras, F.A.; Naik, P.; Pruski, M.; Sadow, A.D.; Slowing, I.I. Two-step conversion of Kraft lignin to nylon precursors under mild conditions. Green Chem. 2020, 22, 4676–4682. [Google Scholar] [CrossRef]
  3. Güvenatam, B.; Kurşun, O.; Heeres, E.H.; Pidko, E.A.; Hensen, E.J. Hydrodeoxygenation of mono- and dimeric lignin model compounds on noble metal catalysts. Catal. Today 2014, 233, 83–91. [Google Scholar] [CrossRef]
  4. Li, W.; Wang, H.; Wu, X.; Betancourt, L.E.; Tu, C.; Liao, M.; Cui, X.; Li, F.; Zheng, J.; Li, R. Ni/hierarchical ZSM-5 zeolites as promising systems for phenolic bio-oil upgrading: Guaiacol hydrodeoxygenation. Fuel 2020, 274, 117859. [Google Scholar] [CrossRef]
  5. Wang, Q.; Chen, Y.; Yang, G.; Deng, P.; Lu, X.; Ma, R.; Fu, Y.; Zhu, W. Low-Temperature Catalytic Hydrogenolysis of Guaiacol to Phenol over Al-Doped SBA-15 Supported Ni Catalysts. ChemCatChem 2020, 12, 4930–4938. [Google Scholar] [CrossRef]
  6. López, M.; Palacio, R.; Mamede, A.-S.; Fernández, J.J.; Royer, S. Hydrodeoxygenation of guaiacol into cyclohexane over mesoporous silica supported Ni–ZrO2 catalyst. Microporous Mesoporous Mater. 2020, 309, 110452. [Google Scholar] [CrossRef]
  7. Liu, W.; You, W.; Sun, W.; Yang, W.; Korde, A.; Gong, Y.; Deng, Y. Ambient-pressure and low-temperature upgrading of lignin bio-oil to hydrocarbons using a hydrogen buffer catalytic system. Nat. Energy 2020, 5, 759–767. [Google Scholar] [CrossRef]
  8. Roldugina, E.A.; Naranov, E.R.; Maximov, A.L.; Karakhanov, E.A. Hydrodeoxygenation of guaiacol as a model compound of bio-oil in methanol over mesoporous noble metal catalysts. Appl. Catal. A Gen. 2018, 553, 24–35. [Google Scholar] [CrossRef]
  9. Chen, C.; Chen, G.; Yang, F.; Wang, H.; Han, J.; Ge, Q.; Zhu, X. Vapor phase hydrodeoxygenation and hydrogenation of m-cresol on silica supported Ni, Pd and Pt catalysts. Chem. Eng. Sci. 2015, 135, 145–154. [Google Scholar] [CrossRef]
  10. Han, G.-H.; Lee, M.W.; Park, S.; Kim, H.J.; Ahn, J.-P.; Seo, M.; Lee, K.-Y. Revealing the factors determining the selectivity of guaiacol HDO reaction pathways using ZrP-supported Co and Ni catalysts. J. Catal. 2019, 377, 343–357. [Google Scholar] [CrossRef]
  11. Chen, C.; Zhou, M.; Liu, P.; Sharma, B.K.; Jiang, J. Flexible NiCo-based catalyst for direct hydrodeoxygenation of guaiacol to cyclohexanol. New J. Chem. 2020, 44, 18906–18916. [Google Scholar] [CrossRef]
  12. Liu, X.; Jia, W.; Xu, G.; Zhang, Y.; Fu, Y. Selective Hydrodeoxygenation of Lignin-Derived Phenols to Cyclohexanols over Co-Based Catalysts. ACS Sustain. Chem. Eng. 2017, 5, 8594–8601. [Google Scholar] [CrossRef]
  13. Wang, S.; Xu, D.; Chen, Y.; Zhou, S.; Zhu, D.; Wen, X.; Yang, Y.; Li, Y. Hydrodeoxygenation of anisole to benzene over an Fe2P catalyst by a direct deoxygenation pathway. Catal. Sci. Technol. 2020, 10, 3015–3023. [Google Scholar] [CrossRef]
  14. Sirous-Rezaei, P.; Jae, J.; Ha, J.-M.; Ko, C.H.; Kim, J.M.; Jeon, J.-K.; Park, Y.-K. Mild hydrodeoxygenation of phenolic lignin model compounds over a FeReO x/ZrO2 catalyst: Zirconia and rhenium oxide as efficient dehydration promoters. Green Chem. 2018, 20, 1472–1483. [Google Scholar] [CrossRef]
  15. Olcese, R.; Bettahar, M.M.; Malaman, B.; Ghanbaja, J.; Tibavizco, L.; Petitjean, D.; Dufour, A. Gas-phase hydrodeoxygenation of guaiacol over iron-based catalysts. Effect of gases composition, iron load and supports (silica and activated carbon). Appl. Catal. B Environ. 2013, 129, 528–538. [Google Scholar] [CrossRef]
  16. Olcese, R.N.; Bettahar, M.; Petitjean, D.; Malaman, B.; Giovanella, F.; Dufour, A. Gas-phase hydrodeoxygenation of guaiacol over Fe/SiO2 catalyst. Appl. Catal. B Environ. 2012, 115–116, 63–73. [Google Scholar] [CrossRef]
  17. Remón, J.; Ochoa, E.; Foguet, C.; Pinilla, J.L.; Suelves, I. Towards a sustainable bio-fuels production from lignocellulosic bio-oils: Influence of operating conditions on the hydrodeoxygenation of guaiacol over a Mo2C/CNF catalyst. Fuel Process. Technol. 2019, 191, 111–120. [Google Scholar] [CrossRef]
  18. Shetty, M.; Anderson, E.M.; Green, W.H.; Román-Leshkov, Y. Kinetic analysis and reaction mechanism for anisole conversion over zirconia-supported molybdenum oxide. J. Catal. 2019, 376, 248–257. [Google Scholar] [CrossRef]
  19. Zhang, X.; Tang, J.; Zhang, Q.; Liu, Q.; Li, Y.; Chen, L.; Wang, C.; Ma, L. Hydrodeoxygenation of lignin-derived phenolic compounds into aromatic hydrocarbons under low hydrogen pressure using molybdenum oxide as catalyst. Catal. Today 2019, 319, 41–47. [Google Scholar] [CrossRef]
  20. Shi, Y.; Cao, Y.; Duan, Y.; Chen, H.; Chen, Y.; Yang, M.; Wu, Y. Upgrading of palmitic acid to iso-alkanes over bi-functional Mo/ZSM-22 catalysts. Green Chem. 2016, 18, 4633–4648. [Google Scholar] [CrossRef]
  21. Cheng, J.; Li, T.; Huang, R.; Zhou, J.; Cen, K. Optimizing catalysis conditions to decrease aromatic hydrocarbons and increase alkanes for improving jet biofuel quality. Bioresour. Technol. 2014, 158, 378–382. [Google Scholar] [CrossRef] [PubMed]
  22. Kumar, A.; Thallada, B. Hydrodeoxygenation of lignin derived phenolics over a hydrous ruthenium oxide based catalyst(s): Role of surface water molecules and acidity of the support. Sustain. Energy Fuels 2021, 5, 3802–3817. [Google Scholar] [CrossRef]
  23. Prabhudesai, V.S.; Gurrala, L.; Vinu, R. Catalytic Hydrodeoxygenation of Lignin-Derived Oxygenates: Catalysis, Mechanism, and Effect of Process Conditions. Energy Fuels 2022, 36, 1155–1188. [Google Scholar] [CrossRef]
  24. Wu, X.; Ge, Q.; Zhu, X. Vapor phase hydrodeoxygenation of phenolic compounds on group 10 metal-based catalysts: Reaction mechanism and product selectivity control. Catal. Today 2021, 365, 143–161. [Google Scholar] [CrossRef]
  25. Reschetilowski, W. Einführung in Die Heterogene Katalyse; Springer: Berlin/Heidelberg, Germany, 2015; ISBN 978-3-662-46983-5. [Google Scholar]
  26. Fechete, I. Paul Sabatier—The father of the chemical theory of catalysis. Comptes Rendus Chim. 2016, 19, 1374–1381. [Google Scholar] [CrossRef] [Green Version]
  27. Balandin, A.A. Modern State of the Multiplet Theor of Heterogeneous Catalysis; Elsevier: Amsterdam, The Netherlands, 1969; pp. 1–210. ISBN 9780120078196. [Google Scholar]
  28. Nguyen, L.T.; Phan, D.-P.; Sarwar, A.; Tran, M.H.; Lee, O.K.; Lee, E.Y. Valorization of industrial lignin to value-added chemicals by chemical depolymerization and biological conversion. Ind. Crops Prod. 2021, 161, 113219. [Google Scholar] [CrossRef]
  29. Qu, L.; Jiang, X.; Zhang, Z.; Zhang, X.; Song, G.; Wang, H.; Yuan, Y.; Chang, Y. A review of hydrodeoxygenation of bio-oil: Model compounds, catalysts, and equipment. Green Chem. 2021, 23, 9348–9376. [Google Scholar] [CrossRef]
  30. Jing, Y.; Dong, L.; Guo, Y.; Liu, X.; Wang, Y. Chemicals from Lignin: A Review of Catalytic Conversion Involving Hydrogen. ChemSusChem 2020, 13, 4181–4198. [Google Scholar] [CrossRef] [PubMed]
  31. Shu, R.; Li, R.; Lin, B.; Wang, C.; Cheng, Z.; Chen, Y. A review on the catalytic hydrodeoxygenation of lignin-derived phenolic compounds and the conversion of raw lignin to hydrocarbon liquid fuels. Biomass Bioenergy 2020, 132, 105432. [Google Scholar] [CrossRef]
  32. Tomishige, K.; Nakagawa, Y.; Tamura, M. Design of supported metal catalysts modified with metal oxides for hydrodeoxygenation of biomass-related molecules. Curr. Opin. Green Sustain. Chem. 2020, 22, 13–21. [Google Scholar] [CrossRef]
  33. Hammer, B.; Norskov, J.K. Why gold is the noblest of all the metals. Nature 1995, 376, 238–240. [Google Scholar] [CrossRef]
  34. Hammer, B.; Nørskov, J.K. Electronic factors determining the reactivity of metal surfaces. Surf. Sci. 1995, 343, 211–220. [Google Scholar] [CrossRef]
  35. Wang, X.; Zhu, S.; Wang, S.; Wang, J.; Fan, W.; Lv, Y. Ni nanoparticles entrapped in nickel phyllosilicate for selective hydrogenation of guaiacol to 2-methoxycyclohexanol. Appl. Catal. A Gen. 2018, 568, 231–241. [Google Scholar] [CrossRef]
  36. Zhou, H.; Wang, H.; Sadow, A.D.; Slowing, I.I. Toward hydrogen economy: Selective guaiacol hydrogenolysis under ambient hydrogen pressure. Appl. Catal. B Environ. 2020, 270, 118890. [Google Scholar] [CrossRef]
  37. Shafaghat, H.; Rezaei, P.S.; Daud, W.M.A.W. Catalytic hydrodeoxygenation of simulated phenolic bio-oil to cycloalkanes and aromatic hydrocarbons over bifunctional metal/acid catalysts of Ni/HBeta, Fe/HBeta and NiFe/HBeta. J. Ind. Eng. Chem. 2016, 35, 268–276. [Google Scholar] [CrossRef]
  38. Xiang, M.; Wu, D. Highly selective catalytic conversion of lignin-derived phenolic compounds to cycloalkanes over a hierarchically structured zeolite catalyst. J. Mater. Sci. 2019, 54, 2940–2959. [Google Scholar] [CrossRef]
  39. Teles, C.A.; Rabelo-Neto, R.C.; de Lima, J.R.; Mattos, L.V.; Resasco, D.E.; Noronha, F.B. The Effect of Metal Type on Hydrodeoxygenation of Phenol Over Silica Supported Catalysts. Catal. Lett. 2016, 146, 1848–1857. [Google Scholar] [CrossRef]
  40. Hong, D.-Y.; Miller, S.J.; Agrawal, P.K.; Jones, C.W. Hydrodeoxygenation and coupling of aqueous phenolics over bifunctional zeolite-supported metal catalysts. Chem. Commun. 2010, 46, 1038–1040. [Google Scholar] [CrossRef]
  41. Yan, P.; Bryant, G.; Li, M.M.J.; Mensah, J.; Kennedy, E.; Stockenhuber, M. Shape selectivity of zeolite catalysts for the hydrodeoxygenation of biocrude oil and its model compounds. Microporous Mesoporous Mater. 2020, 309, 110561. [Google Scholar] [CrossRef]
  42. Wang, L.; Zhang, J.; Yi, X.; Zheng, A.; Deng, F.; Chen, C.; Ji, Y.; Liu, F.; Meng, X.; Xiao, F.-S. Mesoporous ZSM-5 Zeolite-Supported Ru Nanoparticles as Highly Efficient Catalysts for Upgrading Phenolic Biomolecules. ACS Catal. 2015, 5, 2727–2734. [Google Scholar] [CrossRef]
  43. Evonik. Analysenzertifikat-Aerosil380; Evonik: Essen, Germany, 2020. [Google Scholar]
  44. Thommes, M.; Kaneko, K.; Neimark, A.V.; Olivier, J.P.; Rodriguez-Reinoso, F.; Rouquerol, J.; Sing, K.S. Physisorption of gases, with special reference to the evaluation of surface area and pore size distribution (IUPAC Technical Report). Pure Appl. Chem. 2015, 87, 1051–1069. [Google Scholar] [CrossRef] [Green Version]
  45. Zhao, D.; Feng, J.; Huo, Q.; Melosh, N.; Fredrickson, G.H.; Chmelka, B.F.; Stucky, G.D. Triblock copolymer syntheses of mesoporous silica with periodic 50 to 300 angstrom pores. Science 1998, 279, 548–552. [Google Scholar] [CrossRef] [PubMed] [Green Version]
  46. Brunauer, S.; Emmett, P.H.; Teller, E. Adsorption of Gases in Multimolecular Layers. J. Am. Chem. Soc. 1938, 60, 309–319. [Google Scholar] [CrossRef]
  47. Barrett, E.P.; Joyner, L.G.; Halenda, P.P. The Determination of Pore Volume and Area Distributions in Porous Substances. I. Computations from Nitrogen Isotherms. J. Am. Chem. Soc. 1951, 73, 373–380. [Google Scholar] [CrossRef]
  48. Evonik Industries. Aerosil: Pyrogene Kieselsäuren; Evonik: Essen, Germany, Technical Overview-Auflage 8.
  49. Hadley, P. Molekül- und Festkörperphysik: Vorlesungsskriptum; Technische Universität Graz: Graz, Austria, 2013. [Google Scholar]
  50. Institut für Arbeitsschutz der Deutschen Gesetzlichen Unfallversicherung. Eintrag zu Guajacol. Available online: https://gestis.dguv.de/data?name=492497 (accessed on 5 August 2022).
  51. Ambursa, M.M.; Juan, J.C.; Yahaya, Y.; Taufiq-Yap, Y.H.; Lin, Y.-C.; Lee, H.V. A Review on Catalytic Hydrodeoxygenation of Lignin to Transportation Fuels by Using Nickel-Based Catalysts. In Renewable and Sustainable Energy Reviews; Elsevier Ltd.: Amsterdam, The Netherlands, 2021. [Google Scholar]
  52. Ouedraogo, A.S.; Bhoi, P.R. Recent progress of metals supported catalysts for hydrodeoxygenation of biomass derived pyrolysis oil. J. Clean. Prod. 2020, 253, 119957. [Google Scholar] [CrossRef]
  53. Kim, S.; Kwon, E.E.; Kim, Y.T.; Jung, S.; Kim, H.J.; Huber, G.W.; Lee, J. Recent advances in hydrodeoxygenation of biomass-derived oxygenates over heterogeneous catalysts. Green Chem. 2019, 21, 3715–3743. [Google Scholar] [CrossRef]
  54. Shi, Y.; Xing, E.; Wu, K.; Wang, J.; Yang, M.; Wu, Y. Recent progress on upgrading of bio-oil to hydrocarbons over metal/zeolite bifunctional catalysts. Catal. Sci. Technol. 2017, 7, 2385–2415. [Google Scholar] [CrossRef]
  55. Raikwar, D.; Munagala, M.; Majumdar, S.; Shee, D. Hydrodeoxygenation of guaiacol over Mo, W and Ta modified supported nickel catalysts. Catal. Today 2019, 325, 117–130. [Google Scholar] [CrossRef]
  56. Regalbuto, J.R.; Ha, J.-W. A corrected procedure and consistent interpretation for temperature programmed reduction of supported MoO3. Catal. Lett. 1994, 29, 189–207. [Google Scholar] [CrossRef]
  57. Sicius, H. Chromgruppe: Elemente der Sechsten Nebengruppe: Eine Reise Durch das Periodensystem; Springer Spektrum: Wiesbaden, Germany, 2016; ISBN 9783658135430. [Google Scholar]
  58. Mos, Y.M.; Vermeulen, A.C.; Buisman, C.J.; Weijma, J. X-Ray Diffraction of Iron Containing Samples: The Importance of a Suitable Configuration. Geomicrobiol. J. 2018, 35, 511–517. [Google Scholar] [CrossRef] [Green Version]
  59. Zhang, C.-H.; Wan, H.-J.; Yang, Y.; Xiang, H.-W.; Li, Y.-W. Study on the iron–silica interaction of a co-precipitated Fe/SiO2 Fischer–Tropsch synthesis catalyst. Catal. Commun. 2006, 7, 733–738. [Google Scholar] [CrossRef]
  60. Sicius, H. Eisengruppe: Eine Reise Durch das Periodensystem; Springer Fachmedien Wiesbaden GmbH: Wiesbaden, Germany, 2017; ISBN 9783658155612. [Google Scholar]
  61. Cardarelli, F. Materials Handbook: A Concise Desktop Reference, 2nd ed.; Springer: London, UK, 2008; ISBN 978-1-84628-668-1. [Google Scholar]
  62. Sicius, H. Nickelgruppe: Elemente der Zehnten Nebengruppe: Eine Reise Durch das Periodensystem; Springer Spektrum: Wiesbaden/Heidelberg, Germany, 2017; ISBN 9783658168070. [Google Scholar]
  63. Sicius, H. Kupfergruppe: Elemente der Ersten Nebengruppe: Eine Reise Durch das Periodensystem; Springer Spektrum: Wiesbaden, Germany, 2017; ISBN 9783658172053. [Google Scholar]
  64. Scherrer, P. Bestimmung der Größe und der inneren Struktur von Kolloidteilchen mittels Röntgenstrahlen. In Nachrichten von der Gesellschaft der Wissenschaften zu Göttingen, Mathematisch-Physikalische Klasse; Springer Spektrum: Wiesbaden/Heidelberg, Germany, 1918; pp. 98–100. [Google Scholar]
  65. Mile, B.; Stirling, D.; Zammitt, M.A.; Lovell, A.; Webb, M. The location of nickel oxide and nickel in silica-supported catalysts: Two forms of “NiO” and the assignment of temperature-programmed reduction profiles. J. Catal. 1988, 114, 217–229. [Google Scholar] [CrossRef]
  66. Zhang, X.; Wang, K.; Chen, J.; Zhu, L.; Wang, S. Mild hydrogenation of bio-oil and its derived phenolic monomers over Pt–Ni bimetal-based catalysts. Appl. Energy 2020, 275, 115154. [Google Scholar] [CrossRef]
  67. Li, X.; Nisa, M.; Chen, Y.; Li, Z. Co-Based Catalysts Supported on Silica and Carbon Materials: Effect of Support Property on Cobalt Species and FischerTropsch Synthesis Performance. Ind. Eng. Chem. Res. 2019, 58, 3459–3467. [Google Scholar] [CrossRef]
  68. Sicius, H. Cobaltgruppe: Eine Reise durch das Periodensystem; Springer Fachmedien Wiesbaden: Wiesbaden, Germany, 2016; ISBN 9783658163464. [Google Scholar]
  69. Haynes, W.M. CRC Handbook of Chemistry and Physics; CRC: Boca Raton, FL, USA, 2016. [Google Scholar]
  70. van Krevelen, D.W. Organic geochemistry—Old and new. Org. Geochem. 1984, 6, 1–10. [Google Scholar] [CrossRef]
  71. Krevelen, V. Graphical-statistical method for the study of structure and reaction processes of coal. Fuel 1950, 29, 269–284. [Google Scholar]
  72. Vollmer, S.; Witte, G.; Wöll, C. Copper supported on porous activated carbon obtained by wetness impregnation: Effect of preparation conditions on the ozonation catalyst’s characteristics. Catal Lett 2001, 77, 97–101. [Google Scholar] [CrossRef]
  73. Domke, W. Werkstoffkunde und Werkstoffprüfung, 10th ed.; Cornelsen-Velhagen u. Klasing: Düsseldorf/Bielefeld, Germany, 1986; ISBN 3-590-81220-6. [Google Scholar]
  74. Duong, N.; Tan, Q.; Resasco, D.E. Controlling phenolic hydrodeoxygenation by tailoring metal–O bond strength via specific catalyst metal type and particle size selection. Comptes Rendus Chim. 2018, 21, 155–163. [Google Scholar] [CrossRef]
  75. Greeley, J.; Nørskov, J.K. A general scheme for the estimation of oxygen binding energies on binary transition metal surface alloys. Surf. Sci. 2005, 592, 104–111. [Google Scholar] [CrossRef]
  76. Gates, B.C.; Knozinger, H. Impact of Surface Science on Catalysis; Academic Press: San Diego, CA, USA, 2000; ISBN 9780120078455. [Google Scholar]
  77. Bhattacharjee, S.; Waghmare, U.V.; Lee, S.-C. An improved d-band model of the catalytic activity of magnetic transition metal surfaces. Sci. Rep. 2016, 6, 35916. [Google Scholar] [CrossRef] [Green Version]
  78. Ranaware, V.; Verma, D.; Insyani, R.; Riaz, A.; Kim, S.M.; Kim, J. Highly-efficient and magnetically-separable ZnO/Co@N-CNTs catalyst for hydrodeoxygenation of lignin and its derived species under mild conditions. Green Chem. 2019, 21, 1021–1042. [Google Scholar] [CrossRef]
  79. Popov, A.; Kondratieva, E.; Goupil, J.M.; Mariey, L.; Bazin, P.; Gilson, J.P.; Travert, A.; Maugé, F. Bio-oils hydrodeoxygenation: Adsorption of phenolic molecules on oxidic catalyst supports. J. Phys. Chem. C 2010, 114, 15661–15670. [Google Scholar] [CrossRef]
  80. Zhao, J.; He, Y.; Wang, F.; Zheng, W.; Huo, C.; Liu, X.; Jiao, H.; Yang, Y.; Li, Y.; Wen, X. Suppressing Metal Leaching in a Supported Co/SiO2 Catalyst with Effective Protectants in the Hydroformylation Reaction. ACS Catal. 2020, 10, 914–920. [Google Scholar] [CrossRef]
  81. Blanco, E.; Dongil, A.B.; Escalona, N. Synergy between Ni and Co Nanoparticles Supported on Carbon in Guaiacol Conversion. Nanomaterials 2020, 10, 2199. [Google Scholar] [CrossRef]
  82. Putz, H.; Brandenburg, K. Match!—Phase Analysis Using Powder Diffraction; Crystal Impact: Bonn, Germany.
  83. De Boer, J.H.; Lippens, B.C.; Linsen, B.G.; Broekhoff, J.; van den Heuvel, A.; Osinga, T.J. Thet-curve of multimolecular N2-adsorption. J. Colloid Interface Sci. 1966, 21, 405–414. [Google Scholar] [CrossRef]
  84. Kretzschmar, N.; Seifert, M.; Busse, O.; Weigand, J.J. Prediction of Retention Indices and Response Factors of Oxygenates for GC-FID by Multilinear Regression. Data 2022, 7, 133. [Google Scholar] [CrossRef]
  85. Mann, J.B.; Meek, T.L.; Knight, E.T.; Capitani, J.F.; Allen, L.C. Configuration Energies of the d-Block Elements. J. Am. Chem. Soc. 2000, 122, 5132–5137. [Google Scholar] [CrossRef]
  86. Frese, K.W. Calculation of surface binding energy for hydrogen, oxygen, and carbon atoms on metallic surfaces. Surf. Sci. 1987, 182, 85–97. [Google Scholar] [CrossRef]
  87. Lee, J.; Xu, Y.; Huber, G.W. High-throughput screening of monometallic catalysts for aqueous-phase hydrogenation of biomass-derived oxygenates. Appl. Catal. B Environ. 2013, 140–141, 98–107. [Google Scholar] [CrossRef]
  88. Petrova, N.V.; Yakovkin, I.N. Binding energies for oxygen on transition metal surfaces. Surf. Rev. Lett. 2009, 16, 291–296. [Google Scholar] [CrossRef]
Figure 1. Schemes of (top) the reaction routes and individual reaction steps for the hydrodeoxygenation of guaiacol and (below) the mechanistic backgrounds of (a) geometric correspondence for reactant and metal surface, (b) electronic correspondence for hydrogen activation and transfer to the reactant according to the Sabatier principle, and (c) oxophilicity of the metal surface affecting its reactivity [23,26,33,35,36,37,38,39].
Catalysts 13 00425 g001
Figure 2. Nitrogen physisorption isotherm of the carrier material Aerosil380. B.E.T. = 330 m2/g (p/p0 = 0.001 to 0.23), B.J.H. = 300 m2/g (p/p0 = 0.3 to 0.95).
Catalysts 13 00425 g002
Figure 3. Scanning electron microscopy (SEM): an image of the support material Aerosil380 with a magnification of ×20,000.
Catalysts 13 00425 g003
Figure 4. P-XRD of the carrier Aerosil380 normalized to the highest reflex.
Catalysts 13 00425 g004
Figure 5. Comparison of the TPAD of Aerosil380 with a commercially available HZSM-5 (Clariant). ZSM-5 = 1260 µmol/g, Aerosil380 = 90 µmol/g.
Catalysts 13 00425 g005
Figure 6. Results of TPROR measurements up to 600 °C (a,b,d,e) and 900 °C (c,f): (a) Molybdenum-silica system with a signal maximum of the second TPR at about 500 °C. (b) Tungsten-silica system without significant signals for reduction up to 600 °C. (c) Tungsten-silica system with two signal maxima of the second TPR at about 725 °C and about 840 °C. (d) Rhenium-silica system with one signal maximum of the second TPR at about 350 °C. (e) Iron-silica system with a maximum of the second TPR at about 400 °C, and (f) Iron-silica system with a maximum of the second TPR at about 400 °C and another at about 660 °C.
Catalysts 13 00425 g006
Figure 7. Results of TPROR measurements up to 600 °C: (a) Cobalt-silica system with two signal maxima of the second TPR at about 290 °C and 330 °C. (b) Nickel-silica system with one signal maximum of the second TPR at approx. 310 °C.
Catalysts 13 00425 g007
Figure 8. Results of TPROR measurements of the palladium-silica system: (a) 40 °C to 600 °C (b) −68 °C to 600 °C with a maximum of reduction (TPR 2) at about 10 °C and a negative signal due to desorption of hydrogen at about 90 °C.
Catalysts 13 00425 g008
Figure 9. Results of TPROR measurements up to 600 °C: (a) Copper-silica system with a maximum of the second TPR at about 235 °C. (b) Silver-silica system without detectable signals due to thermal decay of Ag2O from approx. 230 °C.
Catalysts 13 00425 g009
Figure 10. Comparison of TPAD of the investigated catalyst systems with a commercially available HZSM-5 (Clariant). ZSM-5 = 1260 µmol/g, Mo/SiO2 = 210 µmol/g, W/SiO2 = 135 µmol/g, Re/SiO2 = 80 µmol/g, Fe/SiO2 = 220 µmol/g, Co/SiO2 = 185 µmol/g, Ni/SiO2 = 105 µmol/g, Pd/SiO2 = 75 µmol/g, Cu/SiO2 = 180 µmol/g, Ag/SiO2 = 35 µmol/g.
Catalysts 13 00425 g010
Figure 11. Summary of the conversion curves in the test measurements of the metal-silica catalyst systems. The dashed smoothing is based on a spline with λ = 0.05 and the confidence interval.
Catalysts 13 00425 g011
Figure 12. Pseudo van Krevelen diagram of the conversion of guaiacol (black dot) to various products observed during the hydrodeoxygenation of guaiacol (colored dots).
Catalysts 13 00425 g012
Figure 13. Change in the molar H/C ratio in the liquid phase compared to the starting material guaiacol (H/C = 1.14). A positive change results from an increase in the H/C ratio, i.e., hydrogenation. The dashed smoothing is based on a spline with λ = 0.05 and the confidence interval.
Catalysts 13 00425 g013
Figure 14. Change in the molar O/C ratio in the liquid phase compared to the starting material guaiacol (O/C = 0.29). A negative change results from a decrease in the O/C ratio, i.e., deoxygenation. The dashed smoothing is based on a spline with λ = 0.05 and the confidence interval is shown as an envelope curve.
Catalysts 13 00425 g014
Figure 15. Pseudo van Krevelen diagram: Change in the molar O/C and H/C ratio in the liquid phase compared to the starting material guaiacol (O/C = 0.29, H/C = 1.14). A negative change in the O/C ratio results from deoxygenation, and a positive change in the H/C ratio results from hydrogenation. The dashed smoothing is based on a spline with λ = 0.05 and the confidence interval is shown as an envelope curve.
Catalysts 13 00425 g015
Figure 16. Schematic representation of the sextet mechanism of benzene hydrogenation and cyclohexane dehydrogenation at metal centers (gray dots) with hexagonal symmetry, such as found in platinum, palladium, and nickel following Balandin [25,27].
Catalysts 13 00425 g016
Figure 17. Dependence of the sum of the yields of the ring hydrogenated products at a reaction temperature of 250 °C as a function of the shortest atomic distance and lattice type. Hexagonal symmetry is present within the hexagonal closest packing (hcp) and the face-centered cubic lattice type (fcc), but not for the space-centered cubic (bcc).
Catalysts 13 00425 g017
Figure 18. Dependence of the yield of ring hydrogenated products at 250 °C on the center of the d-band (Hammer and Norskov) and the lattice type of the metal used [33,34]. The dashed smoothing is based on a spline with λ = 0.05.
Catalysts 13 00425 g018
Figure 19. Schematic representation of the electron transfer from the metal into the binding (δ) and antibonding (δ*) metal-oxygen orbital. The higher the center of the d-band, the stronger the transfer into the antibonding metal-oxygen orbital, which decreases the bond strength assuming a δ-bond. Visualization according to d-band model of Hammer and Nørskov [34,74,76].
Catalysts 13 00425 g019
Figure 20. Dependence of the yield of aromatic products at 400 °C on the center of the d-band and the lattice type of the metal used.
Catalysts 13 00425 g020
Figure 21. Comparison of the conversion curves in the test measurements of the metal-silica catalyst systems at 340 °C after 5 h ToS (blue) and 9 h ToS (red) as a check of the deactivation of the material. The dashed smoothing is based on a spline with λ = 0 and the confidence interval.
Catalysts 13 00425 g021
Figure 22. Dependence of the hydrogen and carbon mass fractions determined by CHNS analysis. The dashed smoothing is based on a spline with λ = 0.05.
Catalysts 13 00425 g022
Figure 23. Dependence of the coke content on the conversion at 400 °C. The dashed smoothing is based on a spline with λ = 0.05.
Catalysts 13 00425 g023
Table 1. Summary of the results of the nitrogen physisorption measurements and the P-XRD measurements of the different metal catalysts. The crystallite size was calculated based on the powder diffractograms of the catalysts after TPROR measurement from TPR 1, TPO and TPR 2.
Results of P-XRDPhysisorption of NitrogenResults of TPR 2 c
Phase AnalysisCrystal Size after TPROR
in nm
Specific Surface AreaExp.
in µmol (H2)/g
Theor.
in µmol (H2)/g
After Calcination
(Oxidized)
After Catalytic Test (Reduced)B.E.T.
in m2/g
B.J.H.
in m2/g
MoO3MoO220725019017102980
WO3(W) an.d. a305260970 c1590
NH4ReO4Re2629026020152060
n.d. bFen.d. b30527014302575
Co3O4Co14931020039902183
NiONi27 d31028523451660
n.d.Pd6 e325275090
CuOCu4228525519501535
Ag2O + AgAg332401900460
a: shallow signal—incomplete reduction is assumed; b: no evaluation possible due to strong fluorescence; c: temperature profile and parameters, see chapter 3 “Materials and Methods”; d: Confirmed by hydrogen pulse chemisorption DNi = 1.7%; i.e., particle diameter = 47 nm; e: Confirmed by hydrogen pulse chemisorption DPd = 38.6%; i.e., particle diameter = 2 nm.
Table 2. Standard calcination procedure in air of catalysts after impregnation.
StepRamp
in K/min
TTarget
in °C
Dwell Time
in h
11.11201
21.154012
Table 3. Standard pretreatment for the catalytic test measurements.
PhaseDuration
in min
TStart
in °C
TZiel
in °C
Ramp
in K/h
Dwell Time
in min
Gas
Drying120RT12018080N2
Heating18012055018037N2
Oxidation1205505500120Syn. Air
Flushing N215550550015N2
Reduction1205505500120H2
Cooling180550RT--H2
RT = room temperature.
Table 4. Temperature profile for catalytic tests in the conversion of guaiacol. The temperature was increased at the beginning of each hour time on stream (ToS) at 3 K/min. The test were conducted at 15 bar (gauge), 10 L/h hydrogen flow, 3 mL/h (liquid) guaiacol, and 0.5 g catalyst.
ToS in h23456789
Temperatur in °C250280310340370400340340
Disclaimer/Publisher’s Note: The statements, opinions and data contained in all publications are solely those of the individual author(s) and contributor(s) and not of MDPI and/or the editor(s). MDPI and/or the editor(s) disclaim responsibility for any injury to people or property resulting from any ideas, methods, instructions or products referred to in the content.

